
Submitted:
05 May 2025
Posted:
07 May 2025
You are already at the latest version
Abstract
Background/Objectives: Body Mass Index (BMI) is widely used to assess nutritional status in children and serves as a key indicator for identifying risks of overweight and underweight during development. Understanding how BMI classifications evolve over time is crucial for early intervention and public health planning. This study aimed to determine the scope and direction of changes in BMI classification among children between the ages of 6 and 10. Methods: This longitudinal study included 1,026 chil-dren (497 boys and 529 girls) from Gdansk, Poland. Standardized anthropometric measurements were collected at ages 6 and 10. BMI was calculated and classified using international reference systems (IOTF and OLAF). Changes in BMI classification were analyzed using rank transformations and Pearson correlation coefficients to assess linear relationships between somatic features. Results: Most children (76.51%) re-tained their BMI classification over the four-year period. However, 23.49% experi-enced changes, with boys more often moving to a higher BMI category (15.29%) and girls more frequently shifting to a lower category (14.03%). The prevalence of obesity declined between ages 6 and 10, while both overweight and underweight classifica-tions slightly increased. Strong correlations were observed between somatic features and BMI at both ages. Conclusions: The stability of BMI classification over time un-derscores the importance of early identification and sustained monitoring of nutri-tional status. Gender-specific patterns suggest the need for tailored health promotion strategies. In this context, incorporating dietary interventions—such as promoting balanced meals and reducing unhealthy food intake—could play a significant role in maintaining healthy BMI trajectories and preventing both obesity and undernutrition during childhood.
Keywords:
longitudinal study
; anthropometry
; BMI classification
1. Introduction
Height and body mass in the period of growth and development indicate health and nutrition of an individual, as well as reflect the overall welfare of a population [1]. Quetelet II Height-Weight Index – known internationally as BMI (Body Mass Index) is the index most commonly mentioned in literature and used in practice for the assessment of biological development [2]. The Body Mass Index is considered to be a good indicator of underweight, overweight or obesity in children and adolescents provided that reference systems appropriate to the developmental period of the child are applied [2]. A child’s body weight in relation to the square of its’ height is a useful tool that accurately reflects its’ nutrition [3,4], which can be one of the indicators of the child’s health potential. The relationship between BMI and precise methods of measuring body fat in children appears to be well documented [5]. Among various methods of indirect assessment of body fatness, especially in epidemiological studies, both in adults and children, BMI is the most frequently used one [6,7,8]. The usefulness of BMI in predicting the risk of obesity in adulthood has been confirmed [9]. This index is recommended as a tool to asses body mass by the WHO, the CDC, the IOTF, as well as the European Childhood Obesity Group (ECOG) [6]. It is important to keep in mind, however, that BMI is more of an indication of the heightened body mass rather than excess adipose tissue relative to height [10]. Systematic observation of changes in BMI in children and appropriate behavioral interventions are the basis for prevention of eating disorders [11].
Data on somatic features enabling the observation of secular trends and taking into account risk factors for the development of lifestyle diseases. Such factors include excess body weight, the global incidence of which has been increasing rapidly in recent years [12,13,14]. Research shows that one in four children in Europe is overweight [15]. The report from the International Obesity Task Force (IOTF), published in 2004, containing data from 22 European countries, indicates that in some countries the percentage of overweight children aged 7-10 years accounts for over 30% of the population [16]. The problem of overweight and obesity in childhood, which is strongly related to lifestyle (e.g., eating habits), is a serious challenge for public health. Numerous studies confirm that children with excess body mass are at a higher risk of many negative health outcomes in the future [7,17,18]. Monitoring somatic features (height and body mass) allows for not only early diagnosis of disorders related to excess body mass, but also pathological conditions related to its deficiency. The reasons for body mass deficiency in children are usually multifaceted. They are most often connected to malabsorption, endocrine diseases, incorrect eating behaviours, poverty and disorders related to emotional tension [19]. It is worth stressing that the studies showing the prevalence of overweight and obesity in children and adolescents are greater in number than similar publications on body mass deficiency.
In addition to its role as a marker of somatic development, BMI reflects cumulative effects of nutrition, physical activity, and metabolism. Nutritional factors—such as energy intake, dietary quality, and eating behaviors—can significantly influence BMI trajectories in children. Therefore, including discussion of diet-related determinants is essential for a comprehensive understanding of BMI changes during childhood[20].
Aim of the Study
Determining the scope and direction of changes in the Body Mass Index (BMI) classification in children the examined at the age of 6 and 10.
2. Materials and Methods
1,026 children from Gdansk (Poland) – the same 497 boys and 529 girls were examined at the age of 6 and 10 (longitudinal study). The calendar age of children was calculated from the difference between the date of examination and the date of birth and expressed in the decimal system [21]. The group of children studied included those whose age, expressed in the decimal system with an accuracy of 0.01 years, was in the range of 6.00-6.99 for the age of 6 and 10.00-10.99 for age 10.
The research material consists of studies conducted in the years 1999-2005 and 2003-2008 as part of health programs implemented by the Center for the Promotion of Children’s Health and Fitness in Gdansk. The size of the study group divided by gender is shown in Table 1.
All people for whom anthropometric measurements were difficult to perform were excluded from the study (e.g., children with limbs immobilized with plaster casts or with disorders of the musculoskeletal system). In the diagnostic procedure, body height was measured using a stadiometer with an accuracy of 1 mm, in a standing upright (Frankfurt plane) position, without shoes. The body mass was measured with an accuracy of 50g with the child wearing underwear or exercise clothes for PE classes. Body mass and height measurements were performed using a Polish made TYP WB 150 medical scale with a stadiometer or an also Polish made Mensor TYP WE 150 digital scale with a stadiometer. The devices were tared daily.
Anthropometric measurements were used to calculate the Body Mass Index (BMI) using the following formula:
BMI = body weight (kg) / (height (m))2
International developmental norms for excess body mass [2] and body mass deficiency for children and adolescents aged 2-18 years [22] were used as a frame of reference for the Body Mass Index (BMI).
Percentile values for height, weight and BMI for the examined persons were determined based on current percentile grids for the population of children and adolescents in Poland – the OLAF program [23].
Due to the lack of percentile values for the age range between 6.00-6.49 in the OLAF percentile grids (OLAF percentile grids apply to people aged 6.5-18.5), the data from 6-year-old children in the range 6.00-6.49 were not used for statistical analysis using percentile values.
The basic analysis of somatic characteristics data was carried out separately for boys and girls taking into account groups distinguished based on the Body Mass Index (BMI) classification. The following basic characteristics of the distributions of measurable features were calculated: arithmetic mean, median, standard deviation and minimum and maximum values.
Two transformations were used to analyze the dynamics of change: ranking – scale change transformation to a weaker one which enables the presentation of selected regularities of the phenomenon, and differentiation – the transformation which quantitatively expresses changes between the group of the same children at the age of 6 and 10, so that on the basis of arithmetic sequence differences, it was possible to perform numerical calculations, including distribution characteristics and correlation analysis.
The relationship between somatic features and the Body Mass Index (BMI) was examined based on the Pearson Correlation Coefficient. It was assumed that the correlation coefficients were statistically significant at the level of p < 0.05. Basic statistical analyses were performed for the percentile values of anthropometric measurements and the BMI index for individual BMI classification groups and their mutual linear correlation.
In order to observe the number, percentage and direction of changes in BMI classification in the same children examined at two life stages, ranks for BMI categories (body mass classification) were determined. The rank assignment is shown in Table 2.
Observing the rank difference results for BMI enables the analysis of the scope of changes in body mass classification and its direction. The observed changes towards positive values indicate a category change connected to relative (in reference to the IOTF reference system) body mass increase for age and gender. Changes towards negative values indicate a change in body mass classification (BMI category) associated with a relative decrease in body mass for gender, age and height.
Example:
BMI of a child examined at the age of 6 was classified as ‘normal body mass’ (BMI1 = rank 4) but BMI of the same child at the age of 10 was classified as ‘obese’ (BMI2 = rank 6). BMI2 – BMI1 (6 – 4 = 2) – that means a change of body mass classification by two ranks in the direction of relative body mass increase.
3. Results
A lower percentage of people with normal body weight was observed in children aged 10 (69.88%) compared to studies conducted in the same population at the age of 6 (71.23%).
At 10 years of age, the percentage of children with excess (17.45% at the age of 6 vs. 18.51% at the age of 10) and deficient (8.97% at the age of 6 vs. 11.59% at the age of 10) body mass has increased compared to the results achieved at the age of 6.
The change in the percentage of individual body weight classifications varied in direction and scope depending on gender.
At the age of 10, a lower percentage of boys and girls with obesity was observed, while the percentage of overweight children increased. The highest percentage (4.73%) of obese children was found in the group of girls aged 6, however the percentage of obesity in the same group of girls at the age of 10 was only 1.70%. A lower incidence of obesity at the age of 10 was also observed in boys. Compared to the percentage of boys with this body weight classification at the age of 6, when the percentage of obese boys was 3.62%, at the age of 10 it dropped to 2.62%.
In boys, the number and percentage of people with the underweight classification decreased slightly (from 9.25% at the age of 6 to 8.25% at the age of 10). However, in girls, the percentage of people with body weight deficiency increased from 8.97% at the age of 6 to 11.59% at the age of 10. The number and percentage of children in each body mass classification rank is presented in Table 3.
The majority of 10-year-old children (76.51%) maintained the body mass classification from when they were 6. This observation concerned almost equally boys (75.45%) and girls (76.51%). One fourth of the children participating in the study changed their body mass classification, and its direction turned out to be different in the groups of boys and girls. The main direction of changes in body mass classification in boys was achieving a higher level of BMI classification (i.e., relative weight gain). It concerned 15.29% of the participants. In girls (14.03%), the main direction of changes turned out to be the opposite and concerned achieving a lower level of BMI classification. Changes in body mass classification were primarily associated with a change by one level. Only 14 children, i.e., 1.36%, changed their body mass classification by two levels. Change in body mass classification by three levels concerned only two girls. The detailed data on changes in body mass classification can be found in Table 4.
In order to expand on the observations of changes in somatic features and BMI, a statistical analysis of percentile values was performed. The results of the analysis are presented in Table 5 and Table 6. The mean value of the body height percentile for boys aged 6 (6.50 - 6.99) was 44.2. After 3 years, the same group of boys had a higher mean body height percentile value of 52.1. A higher mean percentile value in boys at the age of 10 can also be observed in body mass. The mean BMI percentile, however, was lower in boys at the age of 10 than at the age of 6, which resulted from the difference in the increase proportion between the mean percentile values of the body mass and height. In the group of girls, similarly to the population of boys, the mean BMI percentile was lower at the age of 10, decreasing from 55.8 at the age of 6 to 51.0. Similarly, a lower mean body mass percentile was observed in girls at the age of 10 compared to the age of 6. Of the somatic features examined in this group, only the mean value of the body height percentile was higher at the age of 10. The mean percentile values of the BMI in boys with obesity, overweight or normal weight at the age of 6 were lower at the age of 10, while in boys who were slim or significantly underweight, the mean percentile values were higher after 3 years of observation. Similarly to the group of boys, the mean BMI percentile values in girls with obesity, overweight and normal body weight at the age of 6 turned out to be lower after 3 years of observation. It has also been observed that children (boys and girls) with excess body mass (overweight, obesity) had the highest mean body height values at both 6 and 10 years of age.
4. Discussion
The presented research shows that most children (over 75%) aged 10 maintain the BMI classification category assigned at the age of 6. Only a quarter of them changed their BMI classification. For most boys, this change was associated with a relative (to age and body height) weight gain, while for girls the direction of change turned out to be the opposite. For both sexes, it was found that the percentage of obese children was lower in 10 year-olds. This observation (although made only for the prepubescent period) is not entirely consistent with some studies stating that obesity tends to increase with age [24]. This may be related to the so-called growth spurt that starts around the age of 10. A rapid increase in body height may result in temporarily lower values of the BMI and a change in the BMI classification from obesity to excess body mass, although existing reference systems created on the basis of population studies (including the one used in this work) largely take into account the existence of this phenomenon. Observation of the same children over a longer period of time will enable verification of this hypothesis. According to many authors, obesity is very common in adults who were overweight in childhood [7,18,25,26]. It is worth noting that only 6% of children with obesity or overweight at the age of 5 had a normal body weight at the age of 14 [27], but there was a tendency for girls after puberty to obtain lower categories for BMI values long term (from 7 to 18 years of age) [28].
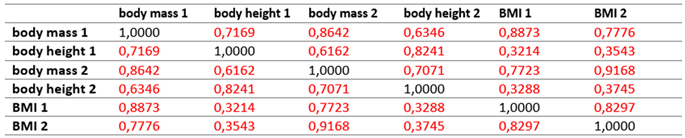
Previous research shows that somatic features are genetically determined, but the strength of this conditioning is different for height and body mass. Strong conditioning is found in case of bone dimensions, while weak conditioning is found in the case of body mass [29]. The biological development of children in terms of a significantly determined “developmental pathway” for height and body mass is confirmed by the research results presented in this work: there is a high linear correlation of measurement values and percentile values for height, body mass and BMI at the ages of 6 and 10.
It is important to recognize the potential impact of dietary interventions on BMI development in children. Numerous studies have shown that improvements in diet quality—including increased consumption of fruits and vegetables, reduction in sugar-sweetened beverages, and promotion of regular meal patterns—can positively affect weight status [30]. Furthermore, school-based nutrition programs and family-centered dietary guidance have demonstrated effectiveness in slowing BMI gain or promoting weight normalization in children [31,32]. Considering that almost one-quarter of the children in our study experienced a shift in BMI classification, early nutritional interventions could play a critical role in stabilizing or reversing unhealthy trends, particularly in children with upward or downward shifts in BMI categories.
5. Conclusions
The observed maintenance of the same body mass classification in a significant number of children at the age of 6 and 10 should oblige us to identify the problem of excess and deficient body mass in the youngest age groups possible and to undertake health-promoting interventions for them aimed at developing their ability to maintain appropriate body weight.
The change of the classification of body mass in some children with obesity at the age of 6 to overweight at the age of 10 (even if it is associated with a periodic, significant increase in body height at this age) is a good opportunity to conduct health interventions preventing obesity.
Integrating nutritional strategies into public health interventions—including education on healthy eating habits and access to balanced meals—may further enhance efforts to prevent or reduce childhood overweight and obesity, especially during key developmental windows such as early and middle childhood.
Author Contributions
For research articles with several authors, a short paragraph specifying their individual contributions must be provided. The following statements should be used “Conceptualization, M.J. and J.S.-A.; methodology, M.J., A.N.; formal analysis, M.J..; investigation, M.J., A.N., B.W., P.M; data curation, M.J., A.N., P.M.; writing—original draft preparation, M.J., A.N., B.W., P.M.; writing—review and editing, J.S.-A.. All authors have read and agreed to the published version of the manuscript.”.
Funding
This research received no external funding.
Institutional Review Board Statement
Not applicable.
Informed Consent Statement
Informed consent was obtained from all subjects involved in the study.
Data Availability Statement
Data collected and stored at the Gdańsk Center for Health Promotion and Addiction Prevention. Data not made public due to patient confidentiality.
Acknowledgments
The authors have reviewed and edited the output and take full responsibility for the content of this publication.
Conflicts of Interest
The authors declare no conflicts of interest.
References
- Tanner, J. M. Growth as a Mirror of the Condition of Society: Secular Trends and Class Distinctions. Acta Paediatr. Jpn. Overseas Ed. 1987, 29 (1), 96–103. [CrossRef]
- Cole, T. J.; Bellizzi, M. C.; Flegal, K. M.; Dietz, W. H. Establishing a Standard Definition for Child Overweight and Obesity Worldwide: International Survey. BMJ 2000, 320 (7244), 1240–1243. [CrossRef]
- Zemel, B. S.; Riley, E. M.; Stallings, V. A. Evaluation of Methodology for Nutritional Assessment in Children: Anthropometry, Body Composition, and Energy Expenditure. Annu. Rev. Nutr. 1997, 17, 211–235. [CrossRef]
- Ellis, K. J. Human Body Composition: In Vivo Methods. Physiol. Rev. 2000, 80 (2), 649–680. [CrossRef]
- Cole, T. J.; Faith, M. S.; Pietrobelli, A.; Heo, M. What Is the Best Measure of Adiposity Change in Growing Children: BMI, BMI %, BMI z-Score or BMI Centile? Eur. J. Clin. Nutr. 2005, 59 (3), 419–425. [CrossRef]
- Defining childhood obesity: the relative body mass index (BMI) - Poskitt - 1995 - Acta Paediatrica - Wiley Online Library. https://onlinelibrary.wiley.com/doi/abs/10.1111/j.1651-2227.1995.tb13806.x (accessed 2025-04-11).
- Dietz, W. H. Health Consequences of Obesity in Youth: Childhood Predictors of Adult Disease. Pediatrics 1998, 101 (3 Pt 2), 518–525.
- Januszewski, J.; Mleczko, E. Wskaźnik wagowo-wzrostowy Queteleta II – BMI a sprawność fizyczna badana w konwencji zdrowia u chłopców z Małopolski<br />. https://jkes.eu/article/22130/pl (accessed 2025-04-11).
- Whitlock, E. P.; Williams, S. B.; Gold, R.; Smith, P. R.; Shipman, S. A. Screening and Interventions for Childhood Overweight: A Summary of Evidence for the US Preventive Services Task Force. Pediatrics 2005, 116 (1), e125-144. [CrossRef]
- Freedman, D. S.; Khan, L. K.; Serdula, M. K.; Dietz, W. H.; Srinivasan, S. R.; Berenson, G. S. Inter-Relationships among Childhood BMI, Childhood Height, and Adult Obesity: The Bogalusa Heart Study. Int. J. Obes. Relat. Metab. Disord. J. Int. Assoc. Study Obes. 2004, 28 (1), 10–16. [CrossRef]
- Tyler, J. M.; Fruh, S. M.; Mulekar, M. S. Pediatric Obesity Screening and Prevention Strategies. J. Contin. Educ. Nurs. 2014, 45 (5), 199–200. [CrossRef]
- Field, A. E.; Coakley, E. H.; Must, A.; Spadano, J. L.; Laird, N.; Dietz, W. H.; Rimm, E.; Colditz, G. A. Impact of Overweight on the Risk of Developing Common Chronic Diseases during a 10-Year Period. Arch. Intern. Med. 2001, 161 (13), 1581–1586. [CrossRef]
- Summerbell, C. D.; Waters, E.; Edmunds, L. D.; Kelly, S.; Brown, T.; Campbell, K. J. Interventions for Preventing Obesity in Children. Cochrane Database Syst. Rev. 2005, No. 3, CD001871. [CrossRef]
- Kruger, J.; Blanck, H. M.; Gillespie, C. Dietary Practices, Dining out Behavior, and Physical Activity Correlates of Weight Loss Maintenance. Prev. Chronic. Dis. 2008, 5 (1), A11.
- Wang, Y.; Lobstein, T. Worldwide Trends in Childhood Overweight and Obesity. Int. J. Pediatr. Obes. IJPO Off. J. Int. Assoc. Study Obes. 2006, 1 (1), 11–25. [CrossRef]
- Lobstein, T.; Baur, L.; Uauy, R.; IASO International Obesity TaskForce. Obesity in Children and Young People: A Crisis in Public Health. Obes. Rev. Off. J. Int. Assoc. Study Obes. 2004, 5 Suppl 1, 4–104. [CrossRef]
- Pi-Sunyer, F. X. Health Implications of Obesity. Am. J. Clin. Nutr. 1991, 53 (6 Suppl), 1595S-1603S. [CrossRef]
- Reilly, J. J.; Methven, E.; McDowell, Z. C.; Hacking, B.; Alexander, D.; Stewart, L.; Kelnar, C. J. H. Health Consequences of Obesity. Arch. Dis. Child. 2003, 88 (9), 748–752. [CrossRef]
- Rozwój dziecka T. I/II | Elizabeth B. Hurlock. Lubimyczytać.pl. https://lubimyczytac.pl/ksiazka/92619/rozwoj-dziecka-t-i-ii (accessed 2025-04-11).
- Birch, L. L.; Ventura, A. K. Preventing Childhood Obesity: What Works? Int. J. Obes. 2005 2009, 33 Suppl 1, S74-81. [CrossRef]
- Beall, C. Growth, Maturation and Physical Activity. By Robert M. Malina and Claude Bouchard. Champaign, IL: Human Kinetics Publihsers, Inc. 1991. 501 Pp. $49.00 (Cloth). Am. J. Phys. Anthropol. 1993.
- Cole, T. J.; Flegal, K. M.; Nicholls, D.; Jackson, A. A. Body Mass Index Cut Offs to Define Thinness in Children and Adolescents: International Survey. BMJ 2007, 335 (7612), 194. [CrossRef]
- Kułaga, Z. Siatki centylowe wysokości, masy ciała i wskaźnika masy ciała dzieci i młodzieży w Polsce – wyniki badania OLAF - Standardy Medyczne. Siatki centylowe wysokości, masy ciała i wskaźnika masy ciała dzieci i młodzieży w Polsce – wyniki badania OLAF - Standardy medyczne. https://www.standardy.pl/artykuly/id/122%20file (accessed 2025-04-11).
- Rywik, S.; Pająk, A.; Broda, G.; Scześniewska, D.; Rywik, T. Częstość występowania nadwagi i otyłości w wybranych populacjach Polski: Pol-Monica Bis Projekt - OpacWWW - Prolib Integro. https://prolib.pwsz-ns.edu.pl/ici/recorddetail?id=oai%3Apolona.pl%3A34236968 (accessed 2025-04-11).
- Serdula, M. K.; Ivery, D.; Coates, R. J.; Freedman, D. S.; Williamson, D. F.; Byers, T. Do Obese Children Become Obese Adults? A Review of the Literature. Prev. Med. 1993, 22 (2), 167–177. [CrossRef]
- Whitaker, R. C.; Wright, J. A.; Pepe, M. S.; Seidel, K. D.; Dietz, W. H. Predicting Obesity in Young Adulthood from Childhood and Parental Obesity. N. Engl. J. Med. 1997, 337 (13), 869–873. [CrossRef]
- Mamun, A. A.; Lawlor, D. A.; O’Callaghan, M. J.; Williams, G. M.; Najman, J. M. Family and Early Life Factors Associated with Changes in Overweight Status between Ages 5 and 14 Years: Findings from the Mater University Study of Pregnancy and Its Outcomes. Int. J. Obes. 2005 2005, 29 (5), 475–482. [CrossRef]
- Wronka, I. Growth and Development of Overweight and Obese Girls. Pediatr. Endocrinol. Diabetes Metab. 2011, 17 (3), 125–128.
- Wolańska, N. Rozwój biologiczny człowieka od poczęcia do śmierci. Księgarnia Internetowa PWN. https://ksiegarnia.pwn.pl/Rozwoj-biologiczny-czlowieka-od-poczecia-do-smierci,757526768,p.html (accessed 2025-04-11).
- Perez-Escamilla, R.; Bermudez, O.; Buccini, G. S.; Kumanyika, S.; Lutter, C. K.; Monsivais, P.; Victora, C. Nutrition Disparities and the Global Burden of Malnutrition. BMJ 2018, 361, k2252. [CrossRef]
- Waters, E.; de Silva-Sanigorski, A.; Hall, B. J.; Brown, T.; Campbell, K. J.; Gao, Y.; Armstrong, R.; Prosser, L.; Summerbell, C. D. Interventions for Preventing Obesity in Children. Cochrane Database Syst. Rev. 2011, No. 12, CD001871. [CrossRef]
- Grieken, A. van; Veldhuis, L.; Renders, C. M.; Borsboom, G. J.; Wouden, J. C. van der; Hirasing, R. A.; Raat, H. Population-Based Childhood Overweight Prevention: Outcomes of the ‘Be Active, Eat Right’ Study. PLOS ONE 2013, 8 (5), e65376. [CrossRef]

Table 1.
Numeral characteristic of the study group.
| (n) | (%) | sum | ||
| Boys | Girls | Boys | Girls | |
| 497 | 529 | 48,44 | 51,56 | 1026 |
Table 2.
Rank assignment for individual BMI categories (body mass classification).
| BMI categories | rank |
| significantly underweight | 1 |
| underweight | 2 |
| thinness | 3 |
| Normal weight | 4 |
| Overweight | 5 |
| Obesity | 6 |
Table 3.
Number and percentage of children ranked according to body mass classification performed at the age of 6 and 10.
Table 3.
Number and percentage of children ranked according to body mass classification performed at the age of 6 and 10.
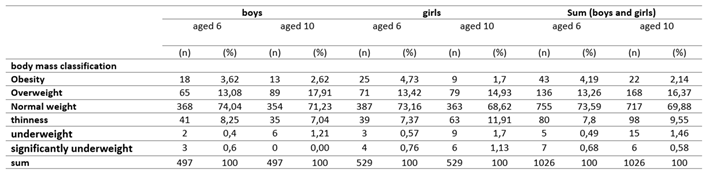 |
Table 4.
Numerical characteristics of the scope and direction of changes in the classification of the BMI in children examined at 6 and 10 years of age.
Table 4.
Numerical characteristics of the scope and direction of changes in the classification of the BMI in children examined at 6 and 10 years of age.
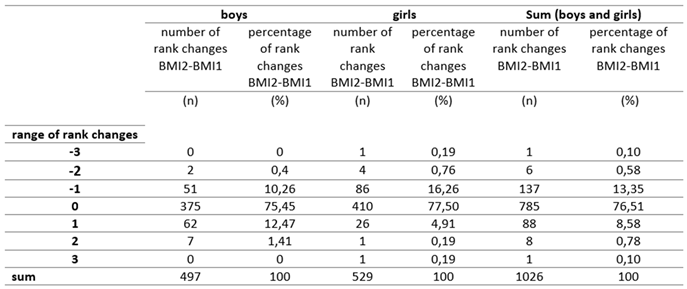 |
Table 5.
Mean percentile values of body mass, body height and BMI.
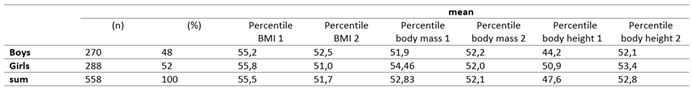 |
Table 6.
Mean percentile values of body mass, body height and BMI depending on the BMI classification at the age of 6.
Table 6.
Mean percentile values of body mass, body height and BMI depending on the BMI classification at the age of 6.
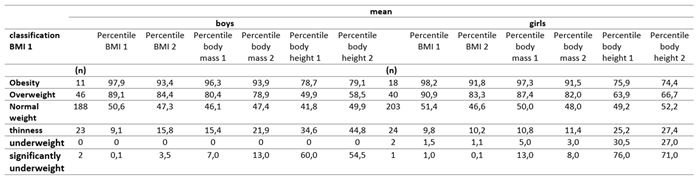 |
Table 7.
Linear correlation coefficients (rxy) of the studied variables in boys (the determined correlation coefficients are significant with p < 0.05).
Table 7.
Linear correlation coefficients (rxy) of the studied variables in boys (the determined correlation coefficients are significant with p < 0.05).
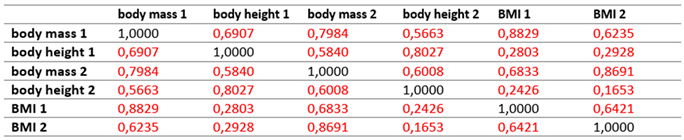 |
Table 8.
Linear correlation coefficients (rxy) of the studied variables in girls (the determined correlation coefficients are significant with p < 0.05).
Table 8.
Linear correlation coefficients (rxy) of the studied variables in girls (the determined correlation coefficients are significant with p < 0.05).
 |
Disclaimer/Publisher’s Note: The statements, opinions and data contained in all publications are solely those of the individual author(s) and contributor(s) and not of MDPI and/or the editor(s). MDPI and/or the editor(s) disclaim responsibility for any injury to people or property resulting from any ideas, methods, instructions or products referred to in the content. |
© 2025 by the authors. Licensee MDPI, Basel, Switzerland. This article is an open access article distributed under the terms and conditions of the Creative Commons Attribution (CC BY) license (https://creativecommons.org/licenses/by/4.0/).
Copyright: This open access article is published under a Creative Commons CC BY 4.0 license, which permit the free download, distribution, and reuse, provided that the author and preprint are cited in any reuse.


