Submitted:
06 May 2025
Posted:
08 May 2025
You are already at the latest version
Abstract
Electromyography-based assistive and rehabilitation devices have shown potential for restoring mobility, especially for post-stroke patients. However, the variability of biological signals and the processing delays caused by signal acquisition and feature extraction influence myoelectric control systems’ real-time functionality and robustness. This study evaluates the classification performance of electromyographic (EMG) signals for six distinct hand gestures in healthy individuals and post-stroke patients. Different feature extraction methods and machine learning algorithms are employed to analyze the impact of acquisition time (0.5–4 s) and the number of channels (1–4) on model accuracy, robustness, and generalization. The best results are obtained using power spectral density and dimensionality reduction, reaching a classification accuracy of 94.79% with a 2 s signal and 95.31% for 4 s. Acquisition time has a greater effect on accuracy than the number of channels used, with accuracy stabilizing at 2 s. We test for generalization using post-stroke patient data, revealing a substantial accuracy drop from 90% (intra-patient validation) to 35–40% (cross-patient validation). This study paves the way for developing effective real-time myoelectric control systems for neurorehabilitation.
Keywords:
electromyography
; classification algorithms
; feature extraction
; myoelectric control
; assistive technology
; stroke
; dimensionality reduction
; machine learning
1. Introduction
Stroke is the leading cause of disability and mortality worldwide, often resulting in motor impairments, movement disorders, and muscle spasms that significantly affect an individual’s ability to perform daily activities. Rehabilitation therapy is essential for restoring motor functions and promoting independence. In this context, assistive technologies, such as exoskeletons, are vital in supporting and aiding patients during rehabilitation [1].
The development of adaptive control systems for assistive and rehabilitation devices has increasingly relied on electromyographic (EMG) signals due to their ability to translate muscle activity into actionable commands. EMG-based myoelectric control systems have shown significant potential in controlling motorized devices requiring the coordination of multiple degrees of freedom, as in the case of hand articulations [2]. Their application in assistive devices, including prosthetics and orthotics, holds significant potential for enhancing mobility and independence in individuals with motor impairments. A study by Díaz-Grefa et al. [3] highlights that integrating motorized exoskeletons into rehabilitation programs can significantly improve mobility, muscular strength, and overall quality of life. However, there are considerable variations in effectiveness among different users, which underscores the necessity for personalized systems to optimize the performance of these devices.
Over the past decade, pattern recognition methods have become the standard for EMG-based control systems, enabling the classification of muscle activation patterns to facilitate intuitive device control. However, the variability of EMG signals, influenced by external and physiological factors, remains a major challenge, as no universal standard exists for optimizing feature extraction, dimensionality reduction, and classification steps [4]. Despite advancements in signal processing and machine learning algorithms, improving these methods to enhance robustness and real-time performance continues to be a key research focus [5]. A review by Parajuli et al. [6] identifies processing delays as a critical limitation, as they compromise the responsiveness of myoelectric control systems in real-time applications.
One key strategy to mitigate the challenges associated with variability in EMG signals is to use dimensionality reduction techniques. These techniques reduce computational costs and enhance class separability, improving classification accuracy. Research has shown that dimensionality reduction methods, particularly Principal Component Analysis (PCA), positively influence classification rates and system response times [7]. Feature extraction is crucial for gesture recognition systems, aiming to isolate relevant information from raw EMG signals. Features are typically extracted from different domains, including the time (TD), frequency (FD), and time-frequency (TFD). However, due to the non-stationary nature of EMG signals, TD features can be prone to inaccuracies [8]. Power Spectral Density (PSD) is particularly advantageous for feature extraction in EMG signals, as it helps identify frequency bands associated with muscle activity. Studies have shown that PSD effectively captures key frequency characteristics, making it a valuable method for EMG signal classification and noise reduction [9,10]. On the other hand, Gokgoz and Subasi et al. [11] used discrete wavelet transform (DWT) to decompose sEMG signals into distinct time-frequency components, each corresponding to different frequency bands. Their findings demonstrated that alterations in sEMG signals could be effectively captured through the features extracted from the components of the DWT.
Among commonly used classification algorithms for EMG signals are Linear Discriminant Analysis (LDA), Support Vector Machine (SVM), k-nearest Neighbor (kNN), and Random Forest (RF), while advanced methods like Artificial Neural Networks (ANN) are gaining traction [4]. RF has proven effective in classifying hand and wrist movements, leveraging its ensemble learning to enhance robustness against signal variability. Zhao et al. [12] showed RF achieving 92.3% accuracy in finger movement classification based on EMG signals. Similarly, SVM has demonstrated superior performance over classifiers like kNN in detecting movement patterns, with Dhanjal and Amhia [13] reporting SVM’s higher accuracy and recall, particularly in distinguishing complex movement patterns and generalizing effectively to unseen data. Neural networks (NN) have also been explored for EMG-based gesture recognition due to their ability to model nonlinear relationships in EMG signals. Zhang et al. [14] showed NN achieving high classification accuracy, outperforming traditional algorithms like kNN for specific movements. Lee et al. [15] mention that several machine learning methods, including SVM, kNN, and ANN, have achieved over 90% accuracy across multiple studies [16,17,18,19,20,21,22].
Despite these achievements, improving accuracy and response time simultaneously remains a challenge in EMG-based systems [15]. An analysis of studies published between 2012 and 2025 [23,24,25,26,27,28,29,30,31,32,33,34] reveals that most approaches rely on large-scale multi-channel EMG datasets. Most of these studies utilize configurations that include 7 to 24 channels, although some exceptional cases feature high-density electromyography (HD-sEMG) using 64, 96, or even 128 channels ([23,26,32]). These approaches adopt a fixed temporal window for signal acquisition, typically set at 5 seconds per gesture. This long duration and the high dimensionality of multi-channel data increase computational load and latency, making them less suitable for applications that require quick feedback. While this standardization enhances reproducibility and enables comparative analysis, it also introduces delays that can hinder real-time classification systems.
Building on these considerations, this research aims to advance the understanding and development of adaptive control systems for real-time EMG-based assistive and rehabilitation technologies. We investigates the optimal acquisition time and channel configurations needed to achieve high classification accuracy while minimizing the required temporal and spatial information. The study explores different feature extraction methods, employing PSD and DWT, along with dimensionality reduction techniques such as PCA and Singular Value Decomposition (SVD) to improve computational efficiency. Three machine learning algorithms (RF, SVM and ANN) are compared across two datasets: healthy individuals and stroke patients, focusing on the classification of six hand/finger gestures: rest, wrist flexion/extension, grip, finger abduction, and supination.
2. Materials and Methods
This study utilizes two datasets to analyze electromyographic signal classification. The first dataset, described by Ozdemir et al. [33], is employed to investigate various feature extraction methods and classification algorithms. The objective is to assess how EMG classification accuracy is affected by variations in acquisition time (ranging from 0.5 to 4 seconds) and the number of measurement channels used.
Subsequently, the optimal acquisition time and number of measurement channels are applied to study method generalization using EMG data from stroke patients. The same methodology is used to evaluate performance metrics such as accuracy, recall, and precision.
The optimal acquisition time and the number of measurement channels are subsequently applied to study method generalization using EMG data collected from stroke patients as part of a research study. The same methodology evaluates performance metrics such as accuracy, recall, and precision.
2.1. Dataset
2.1.1. Data from Healthy Individuals
The dataset described by Ozdemir et al. [33], was collected from 40 healthy participants, with an equal distribution of genders, all aged between 18 and 29 years. Information on handedness was also recorded, including 3 left-handed participants, 1 ambidextrous participant, and the remainder being right-handed .
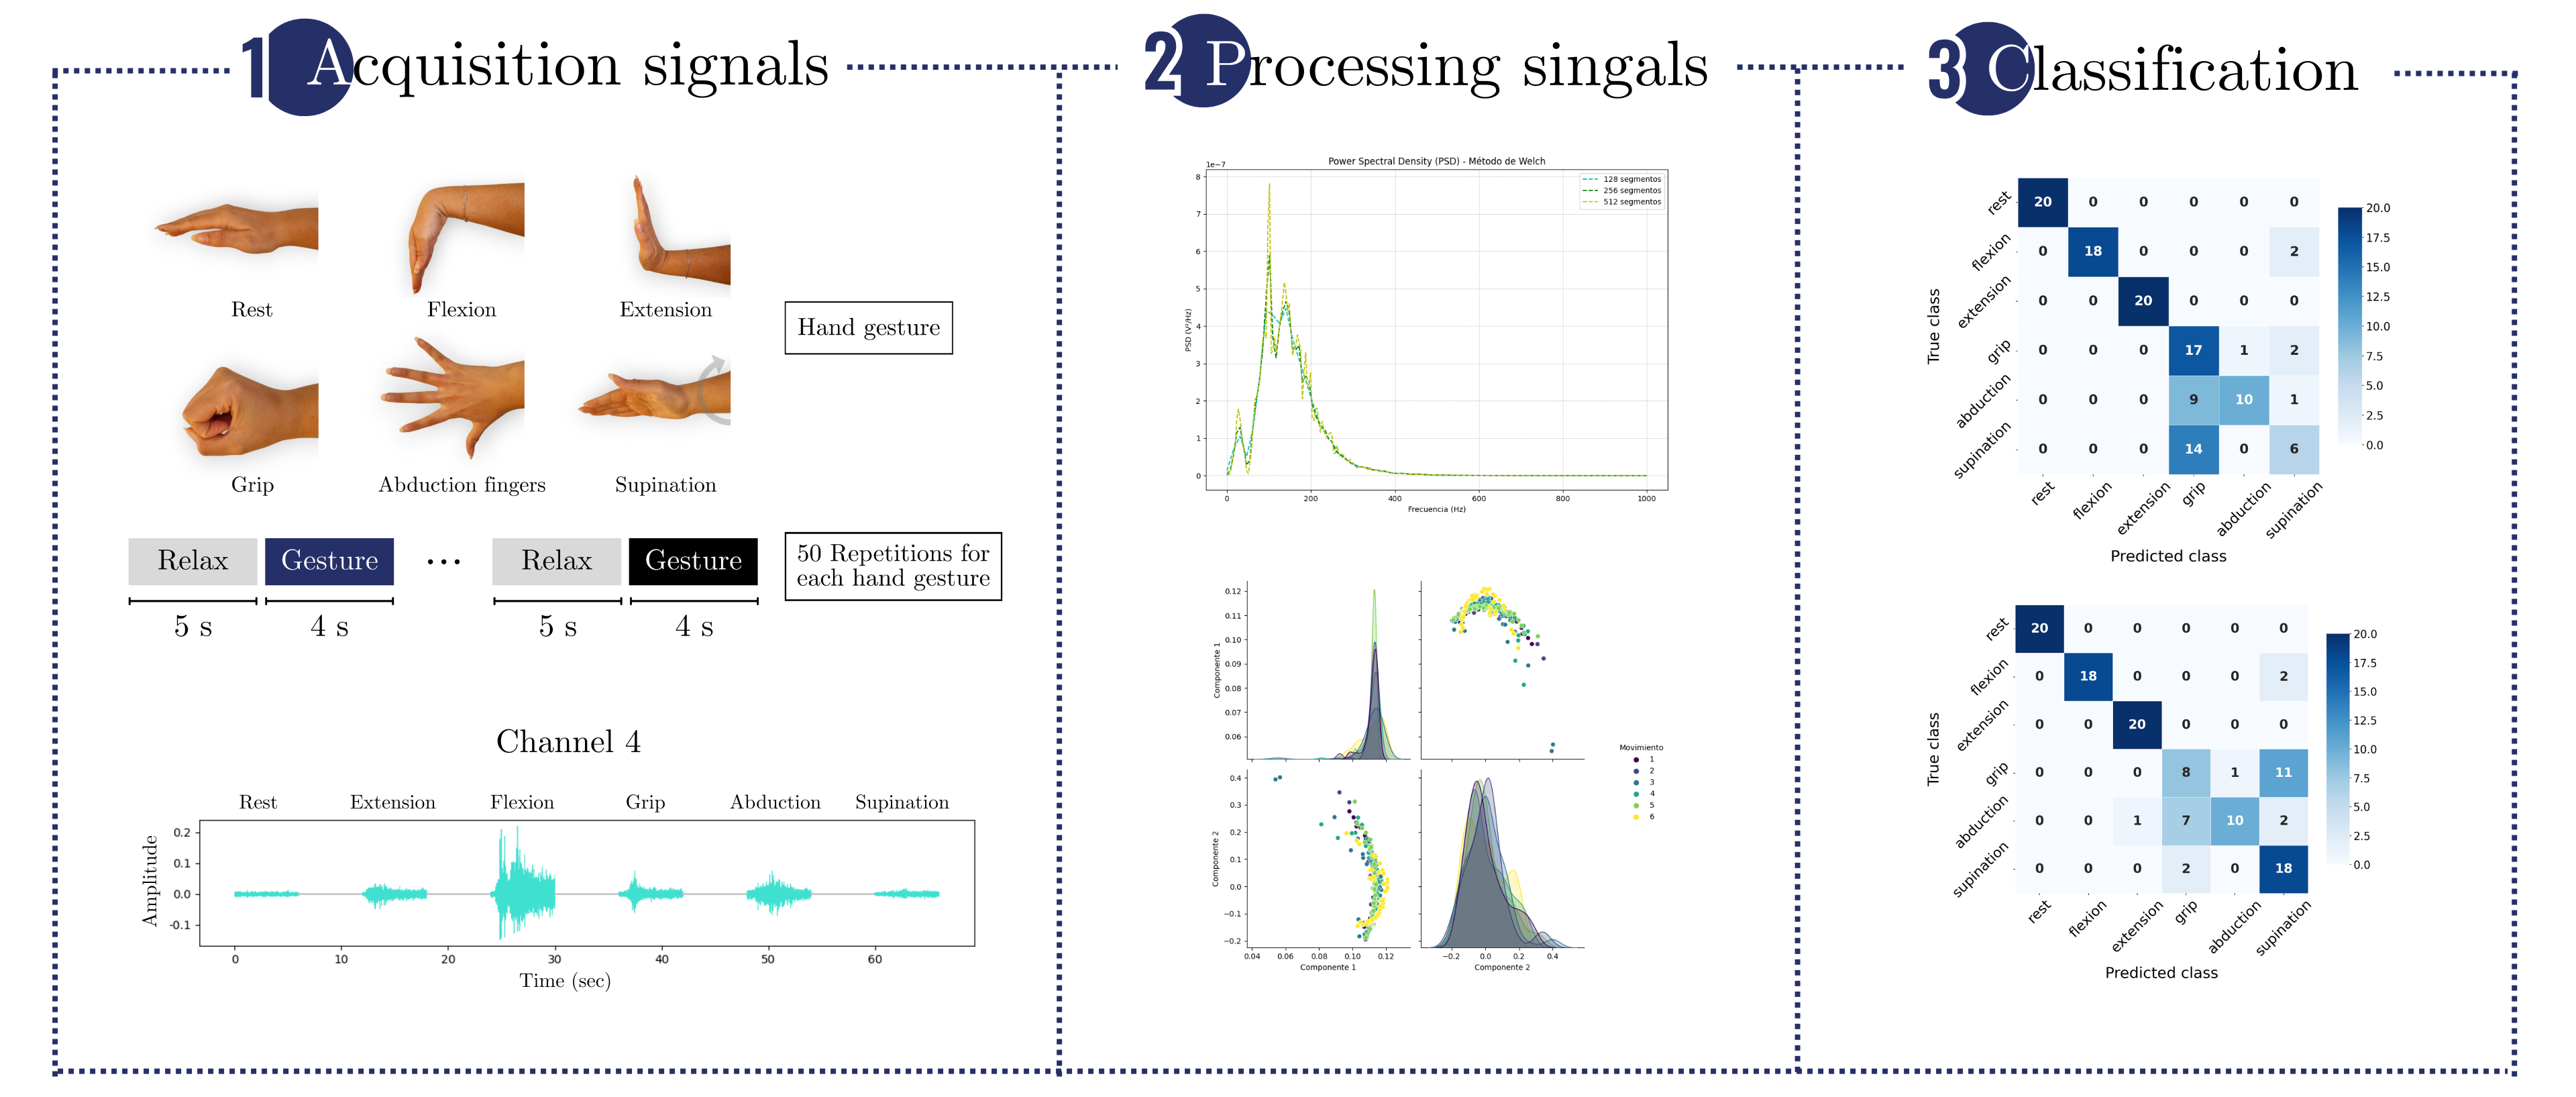
Data acquisition was performed using a BIOPAC MP36 device, capturing information from four channels for each participant’s dominant hand. For classification, six hand gestures were used: rest, wrist extension, wrist flexion, grip, abduction of all fingers, and supination. Data were collected from four distinct surface muscles located near the skin’s surface: extensor carpi ulnaris (channel 1), flexor carpi ulnaris (channel 2), extensor carpi radialis (channel 3) and flexor carpi radialis (channel 4).
EMG data were recorded at a sampling frequency of 2 kHz. The recorded signals had amplitudes ranging from -10 to 10 mV, were processed using a bandpass filter (5–500 Hz) and a notch filter (50 Hz) to eliminate noise, including motion artifacts, high-frequency interference, and power line noise.
2.1.2. Data Acquisition of EMG Signals from Stroke Patients
The clinical protocol for EMG signal acquisition in stroke patients was reviewed and approved by the Ethics Committee of the Servicio de Salud Metropolitano Oriente (SSMO), following national legislation (Laws No. 20.120, 19.628, and 20.584) and international ethical standards, including the Declaration of Helsinki (2013), the Belmont Report, the CIOMS guidelines, the Good Clinical Practice (GCP) guidelines, and the Universal Declaration on Bioethics and Human Rights by UNESCO. EMG data were collected at Clínica Los Coihues from two patients diagnosed with chronic ischemic stroke presenting mild to moderate spasticity, after obtaining written informed consent from all participants.
The data acquisition process consisted of recording EMG signals during six distinct hand gestures: rest, wrist extension, wrist flexion, grip, abduction of all fingers, and supination (Figure 1). Surface electrodes were placed on the extensor carpi radialis and flexor carpi radialis muscles to capture muscle activity associated with these movements.
Data collection followed a structured sequence, as detailed below:

Table 1.
EMG data acquisition protocol detailing the sequence of data collection.
| Phase | Duration | Description |
|---|---|---|
| Preparation | ∼ 3 minutes | Electrode placement, signal calibration, and subject familiarization. |
| Gesture task | 4 seconds per trial | The subject maintains the specified gesture while EMG data is recorded. |
| Rest period | 5 seconds | The subject relaxes before the next trial to prevent fatigue. |
| Repetitions | 50 per gesture | Each gesture is repeated 50 times for consistency. |
| Total session time | ∼ 1 hour per patient | Including preparation, trials, and rest periods. |
To ensure high-quality EMG signal acquisition, the skin was thoroughly cleaned with alcohol prior to electrode placement to minimize impedance. Disposable surface electrodes (Kendall Meditrace), teardrop-shaped and coated with Ag/AgCl, were used to ensure reliable conductivity and strong adhesion. Additionally, a conductive gel was applied between the skin and electrodes to further optimize electrical contact. A bipolar electrode configuration was implemented to enhance signal clarity and reduce external noise interference. EMG signals were recorded using a two-channel Human SpikerBox device developed by Backyard Brains, with a sampling frequency of 2 kHz. The raw signals were processed with a bandpass filter between 5 and 500 Hz to isolate the relevant EMG components and suppress motion artifacts and ambient noise. Data acquisition and visualization were carried out using the SpikeRecorder software.
2.2. Features Extraction
Feature extraction and dimensionality reduction techniques are used to preprocess the data, reducing complexity while retaining the most relevant information. These methods optimize the training of machine learning models and enable the evaluation of their performance.
2.2.1. Power Spectral Density
PSD analysis is a commonly used technique for examining the frequency content of signals. It helps identify dominant frequency components and underlying characteristics. We employ the Welch method for PSD estimation, this approach reduces the variance of the spectral density estimate by averaging successive periodograms. A window size of 256 samples with an overlap of 128 samples is used, offering a balanced trade-off between frequency resolution and variance reduction. The Hanning window is applied to minimize spectral leakage and improve frequency resolution.
2.2.2. Discrete Wavelet Transform
DWT decomposes a signal into sets of coefficients representing its time evolution across specific frequency bands, enabling time and frequency-domain analysis. Among the available wavelet functions, the Daubechies wavelet (db2) demonstrated strong performance for electromyographic signal classification. Various wavelet functions were tested for feature extraction, with db2 emerging as one of the most effective in capturing the essential characteristics of EMG signals [35].
The choice of decomposition level in the DWT for EMG signals depends on the sampling frequency and the frequency characteristics of the signal. To determine the optimal decomposition level, the relationship: can be applied, where is the Nyquist frequency, represents the dominant frequency and n is the decomposition level.
EMG signals typically contain frequency components between 10 and 500 Hz, with a dominant energy concentration in the range of 50 to 150 Hz. Chowdhury et al. [36] analyzed different wavelet functions and concluded that decomposition level 4 provides better performance compared to other levels. This finding aligns with calculations based on the dominant frequency range and the Nyquist frequency, which typically results in an optimal level of 3 to 4 for EMG signals.
2.2.3. Principal Component Analysis
PCA is a dimensionality reduction technique that transforms a dataset into a set of orthogonal components called principal components. These components capture the maximum variance within the data. By simplifying the dataset while preserving its most important features, PCA is beneficial for preprocessing high-dimensional data. In this study, the threshold for the cumulative explained variance was set at 98%, ensuring that the selected principal components retained nearly all the variability in the original dataset.
2.2.4. Singular Vector Descomposition
SVD is a mathematical technique that decomposes a matrix into three components: left singular vectors, singular values, and right singular vectors. This method is used for dimensionality reduction and feature extraction, as it identifies the directions in the data that capture the most variance. Similar to PCA, SVD applies a threshold of 98% cumulative explained variance to retain the most relevant features while discarding less significant information.
2.3. Classification Algorithms
Three machine learning models are utilized for EMG signal classification: Random Forest, Support Vector Machine, and Neural Networks. The dataset is split into 20% for testing and 80% for training and validation. A 5-fold cross-validation strategy is employed during training to ensure robust evaluation and reduce the risk of overfitting.
Hyperparameters for each algorithm are optimized using grid search, with classification accuracy as the selection metric for identifying the best model configuration. To ensure reproducibility, the random seed (random state) is set to 42 during the grid search process.
2.3.1. Random Forest
RF is an ensemble learning algorithm that builds multiple decision trees using random subsets of data and features to reduce overfitting and variance. For classification, predictions are made by majority vote, and for regression, by averaging the outputs of all trees. To optimize the RF model, a grid search is conducted to tune hyperparameters such as the splitting criterion (e.g., gini or entropy) and the number of trees (n estimators). In a study by Tallapragada and Sagare [37], key hyperparameters, particularly the number of estimators and the splitting criterion, were shown to be critical for improving model performance. Although parameters like maximum tree depth and the number of features considered for each split were also explored, the number of trees and the splitting criterion had the most significant impact on classification accuracy. The hyperparameter ranges used in the grid search for optimizing the RF model include the number of estimators, varying from 1 to 400, and the criterion selection, which can be either Gini or Entropy.
2.3.2. Support Vector Machine
SVM is a supervised learning algorithm that constructs a hyperplane in a high-dimensional space to separate data points of different classes. It is particularly effective for classification tasks, especially in high-dimensional datasets. Key hyperparameters, such as the kernel type and regularization parameter (C), play a critical role in improving SVM performance, as shown in the study by Subasi et al. [38]. Of all the parameters explored, including the polynomial kernel degree and the gamma parameter, the kernel type and C had the most significant impact on classification accuracy. The degree of the polynomial kernel influences the complexity of the decision boundary; in EMG pattern recognition, lower-degree polynomials (e.g., degrees 3 and 5) are often preferred to balance model complexity and generalization, as demonstrated by Kehri and Awale [39]. Table 2.2 defines the range of hyperparameters used in this study.
2.3.3. Neural Network
NN are machine learning models inspired by biological neural networks, consisting of interconnected layers of neurons. This study uses a Multi-Layer Perceptron (MLP), a type of ANN with an input layer, hidden layers, and an output layer. The MLP is trained using backpropagation to minimize prediction errors.
To further enhance neural network performance, grid search optimization is often employed to tune key hyperparameters, such as the number of hidden layers, the number of neurons per layer, and the learning rate. The ranges for these hyperparameters are determined through prior research and experimentation. Liu and Zhang [40] emphasized that the number of neurons and the learning rate are crucial for improving a model’s generalization ability. While other factors, such as the choice of activation function and regularization parameters, also contribute to performance, the network architecture and learning rate are particularly influential in achieving optimal classification results. The range of hyperparameters used for the regularization parameter alpha spans logarithmically from , while the initial learning rate is explored on a logarithmic scale between and . Additional hyperparameters and their respective ranges are detailed in Table 2.3.
2.4. Metrics
The performance of the classification models is evaluated using four metrics: accuracy, recall, and precision. These metrics give insight into the model’s classification accuracy and handling of imbalanced classes.
- -
- Accuracy: The proportion of correctly classified instances among all instances, calculated globally across all classes.
- -
- Precision: The proportion of true positive predictions among all positive predictions.
- -
- Recall: The proportion of true positive instances correctly identified
- -
- F1-score: The harmonic mean of precision and recall.
Where:
- TP: True positives
- TN: True negatives
- FP: False positives
- FN: False negatives
2.5. Case Study Scenarios
Two principal variables are examined to thoroughly assess the classification of EMG signals: temporal window selection and channel configurations. These variables exert a direct influence on the performance of the classification algorithms. We aim to identify the optimal acquisition settings for robust classification performance through a systematic variation of these parameters.
The first variable analyzed was the temporal window duration, which defines the length of the EMG signal segment used for feature extraction and classification. Nine different window lengths were considered: 0.5, 0.6, 0.7, 0.8, 0.9, 1, 2, 3, and 4 seconds.
The second variable studied was the channel configuration, referring to the number and combination of EMG channels used, which influences the spatial resolution and the information content of the recorded signals. Seven different configurations were analyzed:
- -
- Single-channel configurations: Channel 1, Channel 2, Channel 3, Channel 4.
- -
- Dual-channel configurations: Channels 1 & 2, Channels 3 & 4.
- -
- Multi-channel configuration: Channels 1, 2, 3 & 4.
2.5.1. Global Performance Evaluation
To thoroughly evaluate classification performance, we examines all 63 combinations of temporal windows and channel configurations using a dataset of healthy individuals. Each configuration is tested with five feature extraction methods—PSD, PSD+PCA, PSD+SVD, DWT+PCA, and DWT+SVD—along with three classification algorithms: RF, SVM, and NN. This results in a total of 315 classification experiments. Accuracy is the primary metric for quantifying overall prediction correctness across the configurations.
2.5.2. Robustness Analysis
- (a)
- Single configuration robustness test: A single temporal window and a specific channel configuration are selected based on the performing combination from the global performance analysis. The dataset is split into 40 train-test partitions for this configuration using previously optimized hyperparameters. The accuracy metric is evaluated across all feature extraction methods (PSD, PSD+PCA, PSD+SVD, DWT+PCA, DWT+SVD) and classification algorithms (RF, SVM, NN).
- (b)
- Multiple configurations robustness test: Three different temporal windows (0.5, 2, and 4 seconds) and three channel configurations (1, 2, and 4 channels) are evaluated to assess model stability under varying acquisition conditions. For each configuration, only the feature extraction methods that achieved the highest performance in the global evaluation are considered. The three classification algorithms (RF, SVM, NN) are tested, with 100 train-test partitions generated per setting. Performance is evaluated based on accuracy, recall, and precision.
2.5.3. Global Performance Evaluation for Stroke Patients Data
For the second dataset, consisting of EMG signals from stroke patients, the temporal parameter is fixed based on the analysis conducted on the dataset of healthy individuals. Specifically, the temporal window that yielded the best results in the global performance evaluation for healthy individuals is selected. Additionally, only one channel of measurement is used for this configuration.
In this scenario, the number of measurements per gesture is varied (20, 30, 40, 50). The feature extraction method that showed the best performance in the previous analysis is applied. Subsequently, the three classification algorithms (RF, SVM, NN) are implemented, and the performance is assessed using the accuracy metric.
2.5.4. Model Generalization Capacity
- (a)
- Intra-patient validation: The temporal and spatial configuration selected from the Global Performance Evaluation on stroke patients’ data is used, but datasets are constructed with 20 and 30 measurements per gesture. The same feature extraction method is applied, and the performance of the three classification algorithms (RF, SVM, NN) is evaluated using accuracy, recall, and precision metrics. This evaluation measures the model’s intra-subject generalization capacity.
- (b)
- Inter-patient validation: The same temporal and spatial configuration, along with the previously selected feature extraction method, is used with datasets containing 50 measurements per gesture. The three classification algorithms are evaluated based on the accuracy metric. This scenario assesses the model’s ability to generalize across different individuals.
3. Results
3.1. Global Performance Evaluation
We implemented different feature extraction methods and classification algorithms to evaluate the accuracy of EMG signal classification as a function of acquisition times and combinations of measurement channels. Figure 2 displays the accuracy results obtained from the dataset described by Ozdemir et al. [33], utilizing the 315 configurations outlined in Section 2.5.1. The results shown correspond to the optimal hyperparameters (Appendix A.1) for each model, which were determined through a grid search during the training process.
Figure 2 shows that PSD effectively captures essential frequency-domain information from EMG signals, including energy bands associated with muscle activation. When combined with dimensionality reduction techniques like PCA or SVD, classification accuracy improves consistently across all evaluated algorithms. In contrast, using PSD without dimensionality reduction results in more pronounced differences between algorithms, especially when only one information channel is available, leading to decreased accuracy in SVM and NN. This decline can be attributed to PCA and SVD’s ability to reduce noise and redundancy. Meanwhile, RF demonstrates greater robustness to noise due to its bagging mechanism, which aggregates predictions from multiple trees, reducing variance and improving overall performance.
In the case of DWT+PCA or DWT+SVD, a notable decrease in accuracy is observed compared to PSD-based methods, likely due to the level of decomposition, which can introduce high dimensionality and redundancy in the wavelet coefficients. Interestingly, for shorter temporal windows, DWT performs comparably to other feature extraction methods, regardless of the number of channels. However, as acquisition time increases, its performance does not significantly improve, particularly for SVM and NN, where it remains notably lower than PSD-based methods. In contrast, RF achieves better results with DWT, reinforcing its lower sensitivity to irrelevant signal features. This suggests that the selected wavelet coefficients may contain redundant information, which RF mitigates through its ensemble learning approach, enhancing model robustness.
Increasing the number of channels improved classification accuracy, with a more significant gain observed when increasing from one to two channels compared to the transition from two to four, particularly for PSD, PSD+PCA, and PSD+SVD. Likewise, extending the acquisition time beyond 2 seconds did not significantly enhance accuracy, as performance tended to stabilize. This plateau may result from the EMG signal stabilizing during sustained contraction, which limits the introduction of new discriminative features. In contrast, the initial phase of muscle contraction exhibits more significant dynamic variations in amplitude and dominant frequencies, which are more informative for class differentiation.
3.2. Robustness Analysis
- (a)
-
Single configuration robustness test: Table 3.1 shows the mean accuracy and standard deviation calculated to summarize performance. This metric was evaluated over 40 randomly partitioned datasets, with experiments conducted using two channels and a two-second window. All algorithms (RF, SVM, and NN) and feature extraction methods (PSD, PSD+PCA, PSD+SVD, DWT+PCA, and DWT+SVD) were tested.The coefficient of variation (CV) is used to evaluate the robustness of the models, comparing the standard deviation to the mean. Most methods show a low CV, typically below 5%, with PSD methods demonstrating consistent performance. However, methods like DWT+SVD and DWT+PCA exhibit higher variability, with CVs between 5 - 10% across all algorithms. Notably, the NN algorithm has the highest CV across all feature extraction methods, indicating greater sensitivity to data variability. Dimensionality reduction techniques like PCA improve robustness, as seen in the lower CVs for PSD+PCA (2.9%–3.5%), while DWT methods show higher CVs, especially DWT+SVD (6.1%–10.5%), indicating more variability in performance.
- (b)
-
Multiple configuration robustness test: Figure 3 and Figure 4 present boxplots of accuracy for three spatial configurations (single channel, 2 channels, and 4 channels) and three temporal window configurations (0.5, 2, and 4 seconds of acquisition time). For the single-channel setup, channel 3 (extensor carpi radialis) is used, as it demonstrates the best individual performance. In the two-channel configuration, channels 3 and 4 (extensor and flexor carpi radialis muscles, respectively) are employed. The four-channel setup combines channels 3 and 4 (extensor and flexor carpi radialis) with channels 1 and 2 (extensor and flexor carpi ulnaris muscles). The robustness of the models was evaluated using 100 randomly partitioned datasets. The analysis focuses on feature extraction methods that showed the best performance, namely PSD+PCA and PSD+SVD—across all algorithms (RF, SVM, and NN).Figure 3 more clearly demonstrates that accuracy does not improve beyond 2 seconds of acquisition time. Furthermore, the data dispersion—reflected in narrow interquartile ranges—and the standard deviation remain stable after this point, showing no significant variations. With four channels, all algorithms show robust performance (low variability - CV: 2–3%). RF marginally outperforms SVM/NN in two-channel configurations. Single-channel data further amplifies variability, underscoring the impact of spatiotemporal limitations on model stability.Figure 4 reveals a critical interplay between temporal and spatial information in EMG classification. For short acquisition windows (0.5 s), increasing the number of channels from 1 to 4 yields only marginal accuracy gains (∼10%), suggesting that additional data provided by more channels is insufficient to compensate for the lack of relevant temporal dynamics in the signal. Conversely, with longer windows (2–4 s), channel count becomes decisive, boosting accuracy by up to 22% as more dynamic signal features are captured. Notably, shorter windows also exhibit higher data dispersion (wider IQRs), while longer acquisitions coupled with more channels reduce variability, reflecting improved robustness.The comparative analysis reveals temporal acquisition as the dominant factor (Figure 3 and Figure 4). A single channel achieves ∼30% accuracy gain when the temporal window increases from 0.5s to 2s, surpassing any multi-channel advantage at shorter intervals. This underscores that dynamic temporal features are fundamental for discrimination, while channels primarily refine results once sufficient temporal information is attained.
- (c)
-
Classification performance by type of motion:Figure 5 presents each class’s average precision, recall, and F1-score values in bar plot format, with error bars indicating the standard deviation across 100 dataset splits. Results are shown for the PSD-PCA method (with PSD-SVD exhibiting similar patterns) under the previously defined temporal windows and channel configurations.Extending the analysis to class-specific performance, wrist extension consistently outperformed other classes across all channel configurations (highest precision/recall/F1), attributable to the distinctive EMG signatures from extensor carpi radialis (Channel 3). While multi-channel configurations improved overall metric consistency, three limitations became apparent: (1) supination exhibited marginally lower performance than other classes even with optimal conditions (≥ 2s windows and multi-channel spatial resolution), (2) finger abduction demonstrated degraded classification in short windows (0.5s) - likely from suboptimal electrode positioning relative to intrinsic hand muscles, and (3) the rest class showed biased performance in SVM/NN (high recall but low precision) due to systematic confusion between inactive states and low-intensity movements. These findings indicate that while proximal muscle movements benefit from channel redundancy, reliable distal movement classification requires both anatomical electrode optimization and appropriate temporal windows.Across most configurations, standard deviations remained relatively stable, indicating consistent performance throughout the evaluation iterations. However, higher deviations occurred in scenarios with unbalanced metrics, mainly when temporal information was limited. Supination demonstrated slightly more significant standard deviations than other classes, suggesting greater variability in movement execution patterns. Among the algorithms, NN showed the least robustness, with higher deviation values associated with individual class performance metrics.
3.3. Global Performance Evaluation for Stroke Patients Data
Figure 6 presents the classification performance of the algorithms as the number of measurements per class varies (20, 30, 40, and 50). The analysis uses stroke patient data to evaluate performance in a realistic application scenario. PSD-PCA is employed for feature extraction with a 2-second acquisition window, both chosen based on previous results that demonstrated the best performance. A single measurement channel (channel 4) is used.
In Figure 6, it can be observed that as the number of measurements per class increases (from 20 to 50), there is a consistent improvement in the accuracy of all three algorithms. This behavior indicates that a larger amount of data per class provides more representative information and reduces prediction variability. Between 40 and 50 measurements per class, the rate of improvement in accuracy diminishes, suggesting the models are approaching their asymptotic performance limits with the given feature space and architecture.
At 20 measurements per class, RF exhibits a pronounced accuracy decline compared to SVM and NN. This behavior aligns with RF’s ensemble nature, its majority-voting mechanism becomes unreliable when constituent trees are trained on insufficient, non-representative subsets. In contrast, SVM and NN maintain relatively stable performance through their inherent regularization mechanisms, which better accommodate limited training data by explicitly optimizing the bias-variance tradeoff.
3.4. Model Generalization Capacity
Table 3.2 and Table 3.3 present intra-patient validation results, comparing model training performance with validation on 20 unseen measurements from the same subject. Using the same spatiotemporal configuration and feature extraction methods, we evaluate generalization at 20/30 measurements per class through metric accuracy across all algorithms.
Table 3.2 and Table 3.3 reveal three key findings about algorithmic performance with increasing training data (20 to 30 measurements per class): First, all models show improved validation accuracy as expected, with RF demonstrating the largest absolute gains (though its significant training-validation gap suggests overfitting tendencies). Second, NN achieves perfect training-validation alignment at 30 measurements, indicating exceptional generalization when sufficient data captures class variability. Third, SVM maintains the most stable performance across both data regimes, with modest but consistent improvements and the smallest generalization gaps, reflecting its inherent regularization strengths.
On the other hand, to evaluate class-wise generalization capacity, we analyze precision and recall metrics derived from confusion matrices (Figure 7 and Figure 8). These matrices reveal distinct misclassification patterns across movement categories, providing crucial insights into which specific gesture confusions most impact overall performance and how sensitivity to particular movements varies between algorithms under different training conditions.
The confusion matrices (Figure 7 and Figure 8) reveal distinct class-specific patterns across algorithms. Rest, flexion, and extension consistently achieve high F1-scores due to their distinctive EMG signatures, particularly benefiting from flexor carpi radialis activation (Channel 4). In contrast, grip, abduction, and supination present greater challenges, with their performance varying significantly by algorithms, SVM over-predicts grip (85% recall but 42% precision at 20 measurements) while struggling with supination (F1=39%), though the latter improves substantially with more data (F1=68%). NN shows opposite tendencies - severely under-detecting grip (20% recall) but over-predicting supination (90% recall, 55% precision). RF exhibits unique rest-class behavior (100% precision but 40% recall), suggesting conservative prediction patterns. Crucially, all algorithms show measurable improvement in problematic classes when increasing from 20 to 30 measurements, confirming that additional training data helps resolve ambiguous EMG patterns, though fundamental feature limitations remain for certain movements.
3.5. Evaluation of Cross-Patient Generalization
When the models were validated using data from other patients, all three algorithms showed comparable accuracy scores, ranging from approximately 35% to 40%. This represents a significant decrease compared to validation with data from the same participants. One possible explanation is that the EMG signal characteristics vary substantially across individuals (e.g., due to differences in muscle anatomy or electrode placement), reducing the models’ generalization ability.
This underscores the crucial role of collecting more diverse datasets or applying transfer learning and domain adaptation strategies to mitigate inter-patient variability. However, the need for such approaches can depend heavily on the specific application. For instance, in the context of myoelectric control for assistive or rehabilitation devices, it may be sufficient—and even advantageous—to train and fine-tune the model using the target user’s signals. By doing so, the system can adapt more effectively to the unique EMG patterns of that individual, thereby enhancing generalization and performance under real conditions.
4. Discussion
This study provides a structured assessment of how acquisition configuration, temporal duration signals and number of channels influence the performance of EMG signal classification. The experiments conducted on healthy subjects offer a controlled scenario that helps to isolate the effects of spatial and temporal resolution on model performance. This approach enables the identification of optimal configurations that minimize data acquisition requirements without sacrificing accuracy, thus offering a foundation for designing more efficient and responsive myoelectric control systems.
In addition to the primary objective, a comparative analysis of feature extraction strategies revealed notable differences between FD and TFD approaches. DWT-based methods consistently underperformed compared to PSD-based configurations. This was particularly evident in the case of SVM and NN, which showed a substantial drop in accuracy, likely due to their sensitivity to redundant or irrelevant wavelet coefficients, especially when decomposition levels were not adjusted according to the acquisition window. In contrast, RF demonstrated greater robustness with DWT, benefiting from its ensemble structure and inherent feature selection, which helped mitigate the impact of non-informative features. Although DWT has the theoretical potential to capture rich temporal and spectral information, its effectiveness appears limited without adaptive decomposition strategies. Conversely, PSD-based approaches, particularly when combined with PCA or SVD, yielded strong and consistent performance, suggesting their suitability for real-time assistive applications. Future work may explore alternatives such as Maximal Overlap Discrete Wavelet Transform (MODWT) to improve the interpretability and efficiency of time-frequency representations.
The spatiotemporal analysis revealed two operational thresholds that critically influence classification performance. First, while increasing the number of measurement channels improves accuracy, the rate of improvement significantly diminishes beyond two channels. Second, the temporal window was identified as the dominant factor: expanding it from 0.5 to 2 seconds resulted in a substantial accuracy increase, whereas performance plateaued beyond 2 seconds. This suggests that the most discriminative EMG information resides in the early phase of muscle activation.
Based on these findings, a configuration using only two channels and a 2-second acquisition window, combined with PSD and PCA, was found to achieve high classification accuracy while substantially reducing both temporal and spatial data requirements. This setup effectively lowers the system’s input dimensionality, which is essential for minimizing latency in assistive technologies, especially in real-time applications such as prosthetic or exoskeleton control.
Applying the optimal temporal configuration (2s window), with a single-channel, and PSD+PCA to stroke patient data yielded promising intra-patient classification results, reaching approximately 80% accuracy with 30 repetitions per class and approaching 90% with larger training sets. RF showed the greatest performance gains as data increased, while NN and SVM maintained consistently high accuracy across dataset sizes.
These results suggest the feasibility of implementing patient-specific myoelectric control in assistive devices using EMG signals from the affected limb. Training models individually for each user helps mitigate the variability associated with differences in motor impairment and spasticity levels, a key limitation for general-purpose systems. As an alternative strategy, biomimetic control could be employed using data from the unaffected limb, leveraging greater data availability and symmetry to enhance usability and reduce calibration time in practical applications.
Finally, future research should explore the integration of deep learning architectures capable of learning robust representations from raw or minimally processed EMG data, potentially enhancing classification accuracy and adaptability. Real-time validation, particularly with stroke patients, is critical to evaluate the system’s responsiveness and stability under dynamic, non-controlled conditions. Additionally, incorporating user-centered metrics, such as comfort, perceived responsiveness, and ease of calibration, will be essential to transition from experimental prototypes to clinically viable assistive technologies tailored to users’ functional needs.
Author Contributions
Conceptualization, C.M. and M.Z.; methodology, C.M. and V.M.; software, C.M. and J.E.; validation, C.M., M.Z., V.M. and J.E.; formal analysis, C.M., V.M. and M.Z.; investigation, C.M. and J.E.; resources, R.F.; data curation, C.M. and J.E.; writing—original draft preparation, C.M.; writing—review and editing, C.M., M.Z., J.E., V.M. and R.F.; visualization, C.M. and M.Z.; supervision, V.M. and M.Z.; project administration, R.F. All authors have read and agreed to the published version of the manuscript.
Funding
This research was supported by an internal grant from OpenBeauchef, Universidad de Chile.
Institutional Review Board Statement
The study was conducted in accordance with the Declaration of Helsinki, and approved by the Ethics Committee of the Servicio de Salud Metropolitano Oriente (SSMO), Chile (approved on 09/01/2024)
Informed Consent Statement
Informed consent was obtained from all subjects involved in the study.
Data Availability Statement
The data for stroke patients are not publicly available due to ethical and privacy restrictions involving patient information. However, the dataset for healthy individuals, used in this study, is publicly available and can be accessed from the source [33]. The optimized hyperparameters for all 315 combinations, specific to this study, will be made available in the supplementary materials.
Acknowledgments
The authors would like to express their sincere gratitude to the healthcare professionals who contributed to the clinical aspects of this study. In particular, we thank Gonzalo Rivera, academic at the Department of Kinesiology, Universidad de Chile, for providing the two-channel surface electromyograph used for EMG signal acquisition, and for his valuable support during the data collection process. We also thank Violeta Romero for her technical assistance during data acquisition, and Dr. Claudio Soto, Medical Director at Clínica Los Coihues, for his institutional support in securing ethics committee approval for the clinical protocol. Additionally, we acknowledge the collaboration of the Clínica Los Coihues for providing access to facilities and institutional support throughout the study.
Conflicts of Interest
The authors declare no conflicts of interest.
Abbreviations
The following abbreviations are used in this manuscript:
| EMG | Electromyography |
| TD | Time Domain |
| FD | Frequency Domain |
| TFD | Time-Frequency Domain |
| DWT | Discrete Wavelet Transform |
| PCA | Principal Component Analysis |
| PSD | Power Spectral Density |
| SVD | Singular Value Decomposition |
| RF | Random Forest |
| SVM | Support Vector Machine |
| NN | Neural Network |
| LDA | Linear Discriminant Analysis |
| kNN | k-Nearest Neighbors |
| ANN | Artificial Neural Network |
| MLP | Multi-Layer Perceptron |
Appendix A Hyperparameters
Appendix A.1. Hyperparameters Healthy Individuals
The results of the best hyperparameters identified through grid search for the evaluated models are presented. This analysis examines whether clear trends can be observed across various feature extraction methods and model types, with an emphasis on the configurations that consistently yield optimal performance.
- -
-
RF model, across all feature extraction methods, demonstrates commonalities and distinctions in hyperparameter behavior. One significant observation is the absence of consistent trends in the selection of the partitioning criterion. Both ’gini’ and ’entropy’ are chosen interchangeably, with no evident preference, suggesting that the optimal criterion is largely influenced by the specific dataset and configuration rather than the feature extraction method employed.Regarding the number of estimators, no strong correlation was found with the window duration for any method. However, a recurring trend emerges when examining the influence of channel combinations. Configurations utilizing multiple channels often required a larger number of estimators, likely due to the increased variability and complexity of the feature space introduced by combining signals from different channels.In the vast majority of cases, regardless of the feature extraction method, the number of estimators typically ranged between 100 and 250. This medium-to-high range of trees indicates that RF models generally benefit from larger forests, which can better capture the variability and complexity of the EMG signals across different configurations.
- -
-
SVM models exhibit distinct trends in hyperparameter selection across the various feature extraction methods. For the kernel, rbf predominates across all methods, with occasional use of the poly kernel in PSD–PCA and PSD–SVD. When poly is selected, the degree is typically set to 3 or 5.For the regularization parameter C, values vary depending on the feature extraction method. In PSD–PCA and PSD–SVD, C ranges from approximately 100 to 8000, reflecting lower regularization and a stronger penalization of classification errors. WT–PCA and WT–SVD favor smaller values, typically between 1 and 400, indicating higher regularization and a greater tolerance for misclassifications to maintain simpler decision boundaries. PSD without dimensionality reduction shows a preference for values in the range of 1 to 100, suggesting that raw PSD features generally require higher regularization with lower penalization of errors.For the gamma parameter, PSD–PCA and PSD–SVD typically use values between and . Higher gamma values are observed for channel 4, likely due to its signals exhibiting lower variability or less distinguishable patterns. These higher values create tighter kernel focus, enabling more detailed decision boundaries but increasing the risk of overfitting. A notable trend is that as the number of channels increases, gamma tends to decrease. The additional information from multiple channels provides redundancy and complementarity, allowing the model to generalize better with broader, less localized decision boundaries. In WT–PCA and WT–SVD, gamma values are considerably smaller, often concentrated around . For PSD without dimensionality reduction, most gamma values cluster between and .
- -
-
ANN models exhibit consistent trends in hyperparameter selection across the various feature extraction methods, with notable differences influenced by the data complexity and feature extraction approach. For the regularization parameter alpha, values are concentrated in similar ranges for most methods, typically between and . These ranges reflect varying levels of constraint to balance model complexity and overfitting, with PSD methods favoring more constraint compared to wavelet-transformed features.The network architecture, configurations with 2 or 3 hidden layers dominate across all methods, with frequent patterns such as (128,64,32),(128,64), and (128,128). Networks with a single large layer, such as (256,), are also observed but less frequently, often appearing in cases with simpler data structures or fewer channels. Increasing the number of channels or extending the window duration generally coincides with deeper or more neuron-dense architectures, though simpler configurations (e.g., (128,64)) persist in some multi-channel setups.The activation function relu is consistently predominant across all methods due to its efficiency and robustness in classification tasks. However, logistic and tanh occasionally appear, particularly in PSD-only methods and configurations with shorter windows or fewer channels. These alternatives favor in specific cases where the variability of the signal requires smoother or more gradual activation.The learning rate is generally concentrated in the range of to for all feature extraction methods, striking a balance between convergence speed and stability during training. Solver selection is largely uniform, with adam dominating across all configurations due to its adaptive nature and effectiveness in optimizing complex networks. Occasional use of sgd is observed in specific setups.
Appendix A.2. Hyperparameters Stroke Patients
- -
- For RF models, the optimal number of estimators varies between 98 and 197 across the training datasets, with a trend of using larger forests as the number of measurements decreases. This suggests that with less data, the model compensates by relying on more trees to achieve stable decision boundaries. The criterion alternates between gini and entropy, with no clear preference.
- -
- For SVM models, the kernel rbf consistently dominates across all configurations, highlighting its ability to handle the non-linear relationships inherent in EMG data. The regularization parameter C varies from approximately 20 to 61, with a slight tendency to increase as the number of measurements decreases, indicating reduced regularization to better capture the variability in smaller datasets. The gamma parameter ranges from 0.001 to 0.008, with smaller values typically appearing in datasets with fewer measurements, allowing for broader decision boundaries in the higher-dimensional feature space.
- -
- For ANN models, the activation function relu is consistently selected, with alpha values concentrated between and . For the architecture, networks with 2 or 3 layers dominate, with configurations such as (128,128), (128,64), and (128,64,32). The networks tend to become slightly deeper or denser as the number of measurements increases, suggesting that larger datasets allow for more complex models. The learning rate falls within the range of 0.02 to 0.05, balancing convergence speed and stability.
References
- Su, D.; Hu, Z.; Wu, J.; Shang, P.; Luo, Z. Review of adaptive control for stroke lower limb exoskeleton rehabilitation robot based on motion intention recognition. Frontiers in Neurorobotics 2023, 17. [Google Scholar] [CrossRef] [PubMed]
- Young, A.J.; Smith, L.H.; Rouse, E.J.; Hargrove, L.J. A comparison of the real-time controllability of pattern recognition to conventional myoelectric control for discrete and simultaneous movements. Journal of NeuroEngineering and Rehabilitation 2014, 11, 5. [Google Scholar] [CrossRef] [PubMed]
- Díaz-Grefa, W.P.; Portilla-Paguay, G.V.; Ortiz-Cartagena, C.L.; Roman-Huera, C.K. Integration of exoskeletons in the recovery of patients with motor disabilities: towards a new era in physiotherapy. Journal of Economic and Social Science Research 2024, 4, 77–98. [Google Scholar] [CrossRef]
- Fang, C.; He, B.; Wang, Y.; Cao, J.; Gao, S. EMG-Centered Multisensory Based Technologies for Pattern Recognition in Rehabilitation: State of the Art and challenges. Biosensors 2020, 10, 85. [Google Scholar] [CrossRef]
- Phinyomark, A.; Quaine, F.; Charbonnier, S.; Serviere, C.; Tarpin-Bernard, F.; Laurillau, Y. EMG feature evaluation for improving myoelectric pattern recognition robustness. Expert Systems With Applications 2013, 40, 4832–4840. [Google Scholar] [CrossRef]
- Parajuli, N.; Sreenivasan, N.; Bifulco, P.; Cesarelli, M.; Savino, S.; Niola, V.; Esposito, D.; Hamilton, T.J.; Naik, G.R.; Gunawardana, U.; Gargiulo, G.D. Real-Time EMG based Pattern recognition control for hand prostheses: A review on existing methods, challenges and future implementation. Sensors 2019, 19, 4596. [Google Scholar] [CrossRef]
- Merzoug, B.; Ouslim, M.; Mostefai, L.; Benouis, M. Evaluation of Dimensionality Reduction Using PCA on EMG-Based Signal Pattern Classification. Engineering Proceedings 2022, 14, 23. [Google Scholar]
- Nazmi, N.; Rahman, M.A.; Yamamoto, S.; Ahmad, S.; Malarvili, M.; Mazlan, S.; Zamzuri, H. Assessment on Stationarity of EMG Signals with Different Windows Size During Isotonic Contractions. Applied Sciences 2017, 7, 1050. [Google Scholar] [CrossRef]
- Al-Faiz, M.Z.; Miry, A.H. Artificial human arm driven by EMG signal. International Journal of Computer Applications 2012, 47, 1–5. [Google Scholar]
- Phinyomark, A.; Phukpattaranont, P.; Limsakul, C. A review of classification techniques of EMG signals during fatigue conditions. Sensors 2018, 16. [Google Scholar]
- Gokgoz, E.; Subasi, A. Comparison of decision tree algorithms for EMG signal classification using DWT. Biomedical Signal Processing and Control 2015, 18, 138–144. [Google Scholar] [CrossRef]
- Zhao, X.; Lu, Z.; Liu, L. Classification of finger movements using EMG signals based on Random Forest. IEEE Transactions on Neural Systems and Rehabilitation Engineering 2020, 28, 1234–1242. [Google Scholar]
- Dhanjal, J.S.; Amhia, H. A review article of EMG signal classification and feature extraction using machine learning and DWT technique. International Journal of Scientific Research & Engineering Trends 2024, 10, 123–129. [Google Scholar]
- Zhang, H.; Li, J.; Wang, M. EMG-based gesture recognition using neural networks. Journal of Biomedical Signal Processing and Control 2023, 81, 104701. [Google Scholar]
- Lee, K. H.; Min, J. Y.; Byun, S. Electromyogram-Based classification of hand and finger gestures using artificial neural networks. Sensors 2021, 22, 225. [Google Scholar] [CrossRef]
- Palkowski, A.; Redlarski, G. Basic hand gestures classification based on surface electromyography. Computational and Mathematical Methods in Medicine 2016, 2016, 1–7. [Google Scholar] [CrossRef]
- Fu, J.; Xiong, L.; Song, X.; Yan, Z.; Xie, Y. Identification of finger movements from forearm surface EMG using an augmented probabilistic neural network. In Proceedings of the 2022 IEEE/SICE International Symposium on System Integration (SII); 547–552. [Google Scholar]
- Shi, W.; Lyu, Z.; Tang, S.; Chia, T.; Yang, C. A bionic hand controlled by hand gesture recognition based on surface EMG signals: A preliminary study. Journal of Applied Biomedicine 2017, 38, 126–135. [Google Scholar] [CrossRef]
- Sharma, S.; Gupta, R. On the Use of Temporal and Spectral Central Moments of Forearm Surface EMG for Finger Gesture Classification. In Proceedings of the 2018 2nd International Conference on Micro-Electronics and Telecommunication Engineering (ICMETE), Ghaziabad, India; 2018; pp. 234–239. [Google Scholar]
- Qi, J.; Jiang, G.; Li, G.; Sun, Y.; Tao, B. Surface EMG hand gesture recognition system based on PCA and GRNN. Neural Computing and Applications 2019, 32, 6343–6351. [Google Scholar] [CrossRef]
- Arteaga, M. V.; Castiblanco, J. C.; Mondragon, I. F.; Colorado, J. D.; Alvarado-Rojas, C. EMG-driven hand model based on the classification of individual finger movements. Biomedical Signal Processing and Control 2020, 58, 101834. [Google Scholar] [CrossRef]
- Fajardo, J. M.; Gomez, O.; Prieto, F. EMG hand gesture classification using handcrafted and deep features. Biomedical Signal Processing and Control 2020, 63, 102210. [Google Scholar] [CrossRef]
- Hahne, J. M.; Graimann, B.; Muller, K. Spatial filtering for robust myoelectric control. IEEE Transactions on Biomedical Engineering 2012, 59, 1436–1443. [Google Scholar] [CrossRef] [PubMed]
- Khushaba, R. N.; Takruri, M.; Miro, J. V.; Kodagoda, S. Towards limb position invariant myoelectric pattern recognition using time-dependent spectral features. Neural Networks 2014, 55, 42–58. [Google Scholar] [CrossRef] [PubMed]
- Palermo, F.; Cognolato, M.; Gijsberts, A.; Muller, H.; Caputo, B.; Atzori, M. Repeatability of grasp recognition for robotic hand prosthesis control based on sEMG data. In Proceedings of the 2017 IEEE International Conference on Rehabilitation Robotics (ICORR); 2017. [Google Scholar]
- Du, Y.; Jin, W.; Wei, W.; Hu, Y.; Geng, W. Surface EMG-Based Inter-Session gesture recognition enhanced by deep domain adaptation. Sensors 2017, 17, 458. [Google Scholar] [CrossRef] [PubMed]
- Fang, Y.; Zhou, D.; Li, K.; Liu, H. ISRMyo-I: A database for sEMG-based hand gesture recognition. IEEE Dataport 2018.
- Kaczmarek, P.; Mańkowski, T.; Tomczyński, J. PUTEMG—A surface Electromyography Hand Gesture Recognition Dataset. Sensors 2019, 19, 3548. [Google Scholar] [CrossRef]
- Cognolato, M.; Gijsberts, A.; Gregori, V.; Saetta, G.; Giacomino, K.; Hager, A. M.; Gigli, A.; Faccio, D.; Tiengo, C.; Bassetto, F.; Caputo, B.; Brugger, P.; Atzori, M.; Müller, H. Gaze, visual, myoelectric, and inertial data of grasps for intelligent prosthetics. Scientific Data 2020, 7, 1. [Google Scholar] [CrossRef]
- Cote-Allard, U.; Gagnon-Turcotte, G.; Phinyomark, A.; Glette, K.; Scheme, E.; Laviolette, F.; Gosselin, B. A transferable adaptive domain adversarial neural network for virtual reality augmented EMG-Based gesture recognition. IEEE Transactions on Neural Systems and Rehabilitation Engineering 2021, 29, 546–555. [Google Scholar] [CrossRef]
- Pradhan, A.; He, J.; Jiang, N. Gesture recognition and biometrics electromyography (GRABMyo) dataset. 2022.
- Chen, X.; Yang, H.; Zhang, D.; Hu, X.; Xie, P. Hand gesture recognition based on High-Density myoelectricity in forearm flexors in humans. Sensors 2024, 24, 3970. [Google Scholar] [CrossRef]
- Ozdemir, M. A.; Kisa, D. H.; Guren, O.; Akan, A. Dataset for multi-channel surface electromyography (sEMG) signals of hand gestures. Data in Brief 2022, 41, 107921. [Google Scholar] [CrossRef]
- Kyranou, I.; Szymaniak, K.; Nazarpour, K. EMG Dataset for Gesture Recognition with Arm Translation. Scientific Data 2025, 12, 1. [Google Scholar] [CrossRef]
- Jahromi, M.G.; Parsaei, H.; Zamani, A.; Dehbozorgi, M. Comparative Analysis of Wavelet-Based Feature Extraction for Intramuscular EMG Signal Decomposition. J. Med. Signals Sens. 2017, 7, 365–378. [Google Scholar]
- Chowdhury, R.H.; Reaz, M.B.I.; Ali, M.A.B.; Bakar, A.A.A.; Chellappan, K.; Chang, T.G. Surface Electromyography Signal Processing and Classification Techniques. Sensors 2013, 13, 12431–12466. [Google Scholar] [CrossRef] [PubMed]
- Tallapragada, N.D.; Sagare, N.V. Multichannel EMG-Based Gesture Recognition Utilizing Advanced Machine Learning Techniques: A Random Forest Classifier for High-Precision Signal Classification. World Journal of Advanced Research and Reviews 2024, 24, 323–332. [Google Scholar] [CrossRef]
- Subasi, A. Classification of EMG Signals Using PSO Optimized SVM for Diagnosis of Neuromuscular Disorders. Computers in Biology and Medicine 2013, 43, 576–586. [Google Scholar] [CrossRef] [PubMed]
- Kehri, V.; N, A. R. EMG Signal Analysis for Diagnosis of Muscular Dystrophy Using Wavelet Transform, SVM and ANN. Biomedical & Pharmacology Journal 2018, 11, 1583–1591. [Google Scholar]
- Liu, X.; Zhang, Y. Hyperparameter optimization of neural networks for EMG classification. Artificial Intelligence in Medicine 2024, 123, 101819. [Google Scholar]
Figure 1.
Representation of the six hand gestures used in the EMG data acquisition.
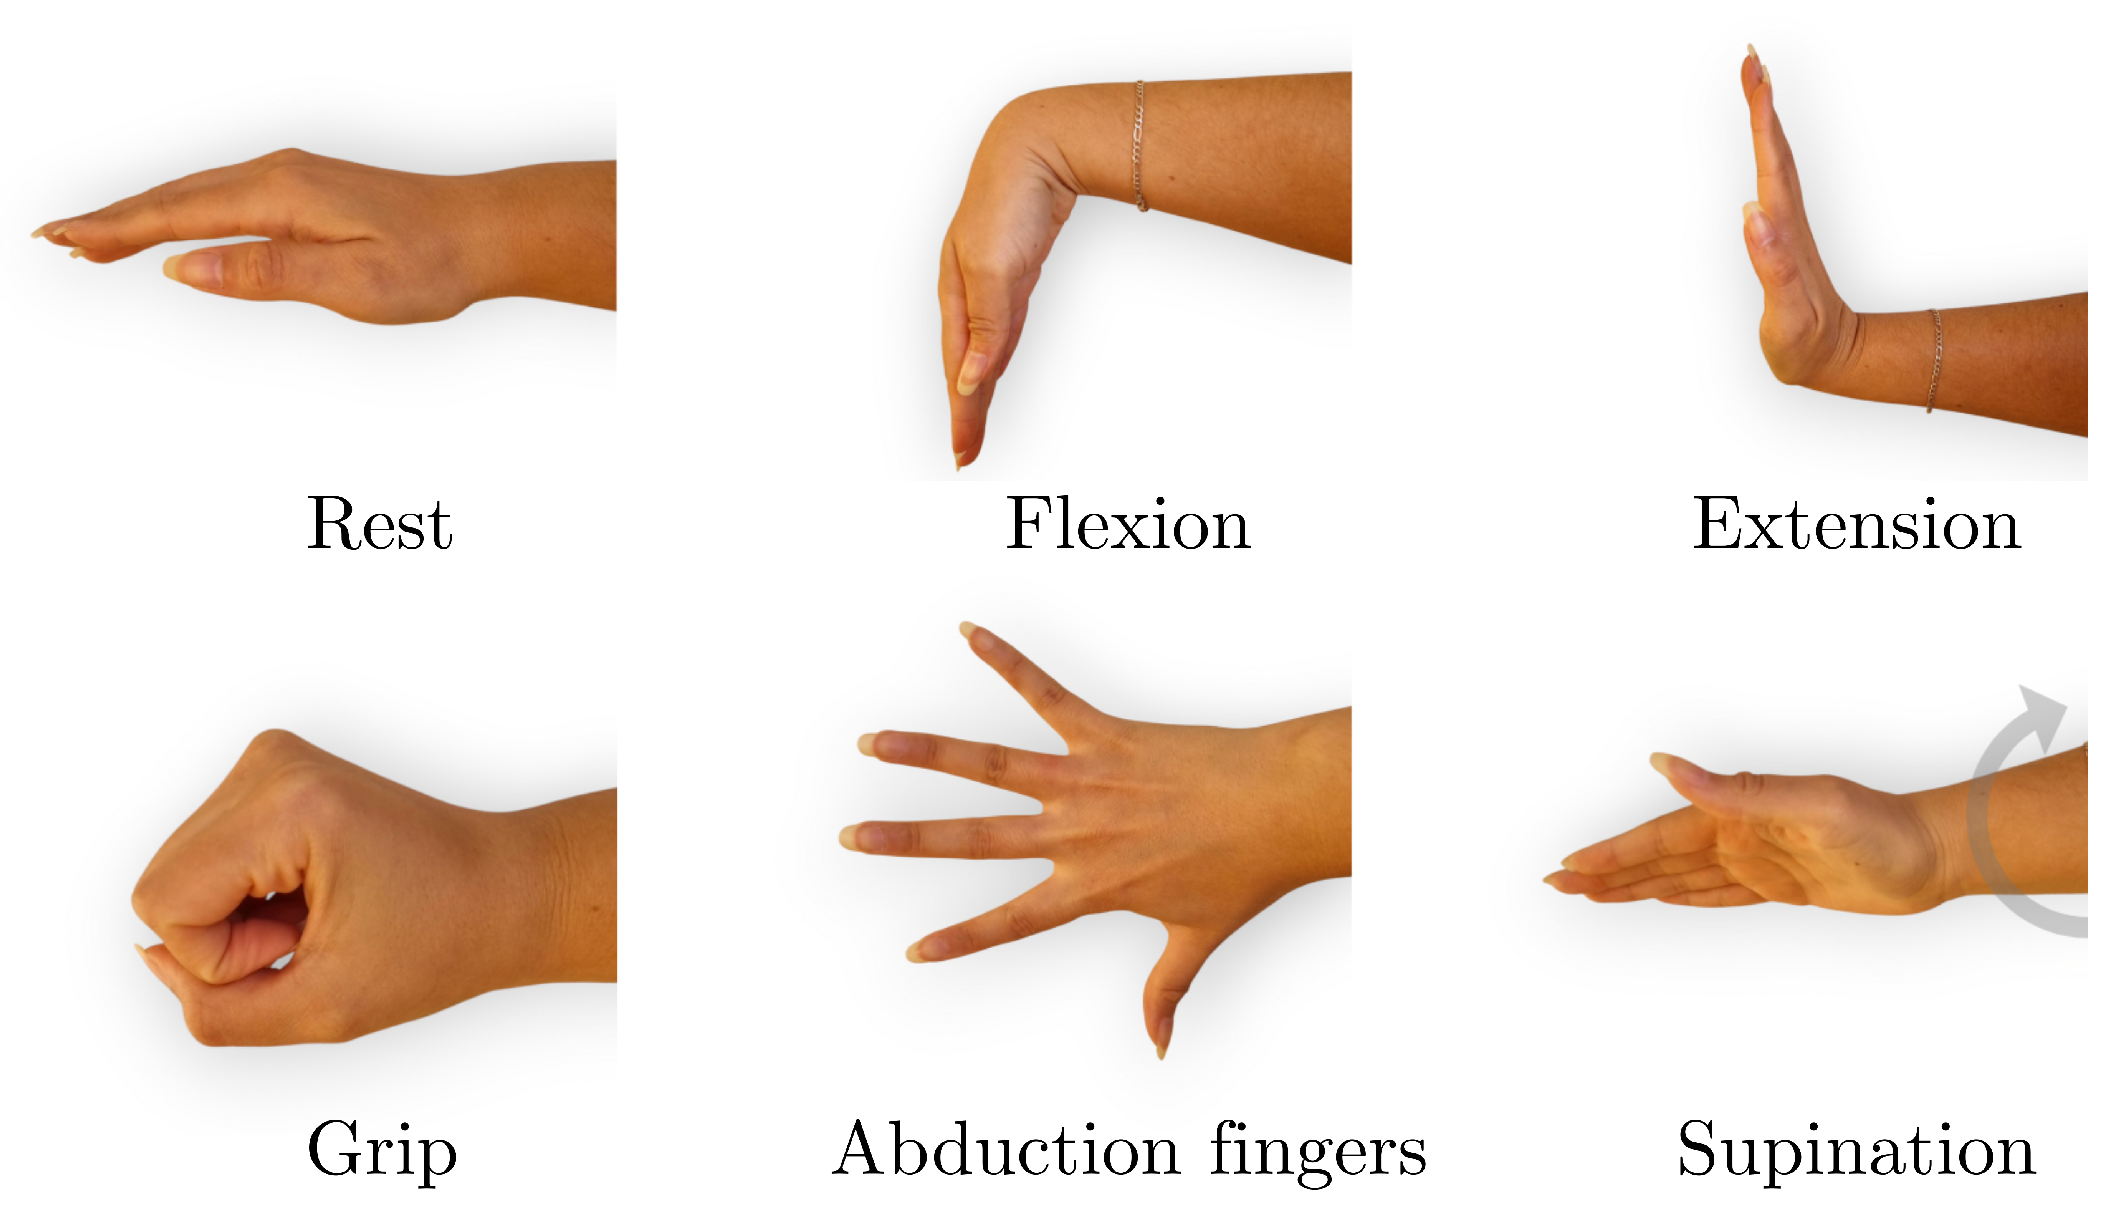
Figure 2.
Classification accuracy as a function of acquisition time, for different feature extraction methods, algorithms, and measurement channel configurations.
Figure 2.
Classification accuracy as a function of acquisition time, for different feature extraction methods, algorithms, and measurement channel configurations.
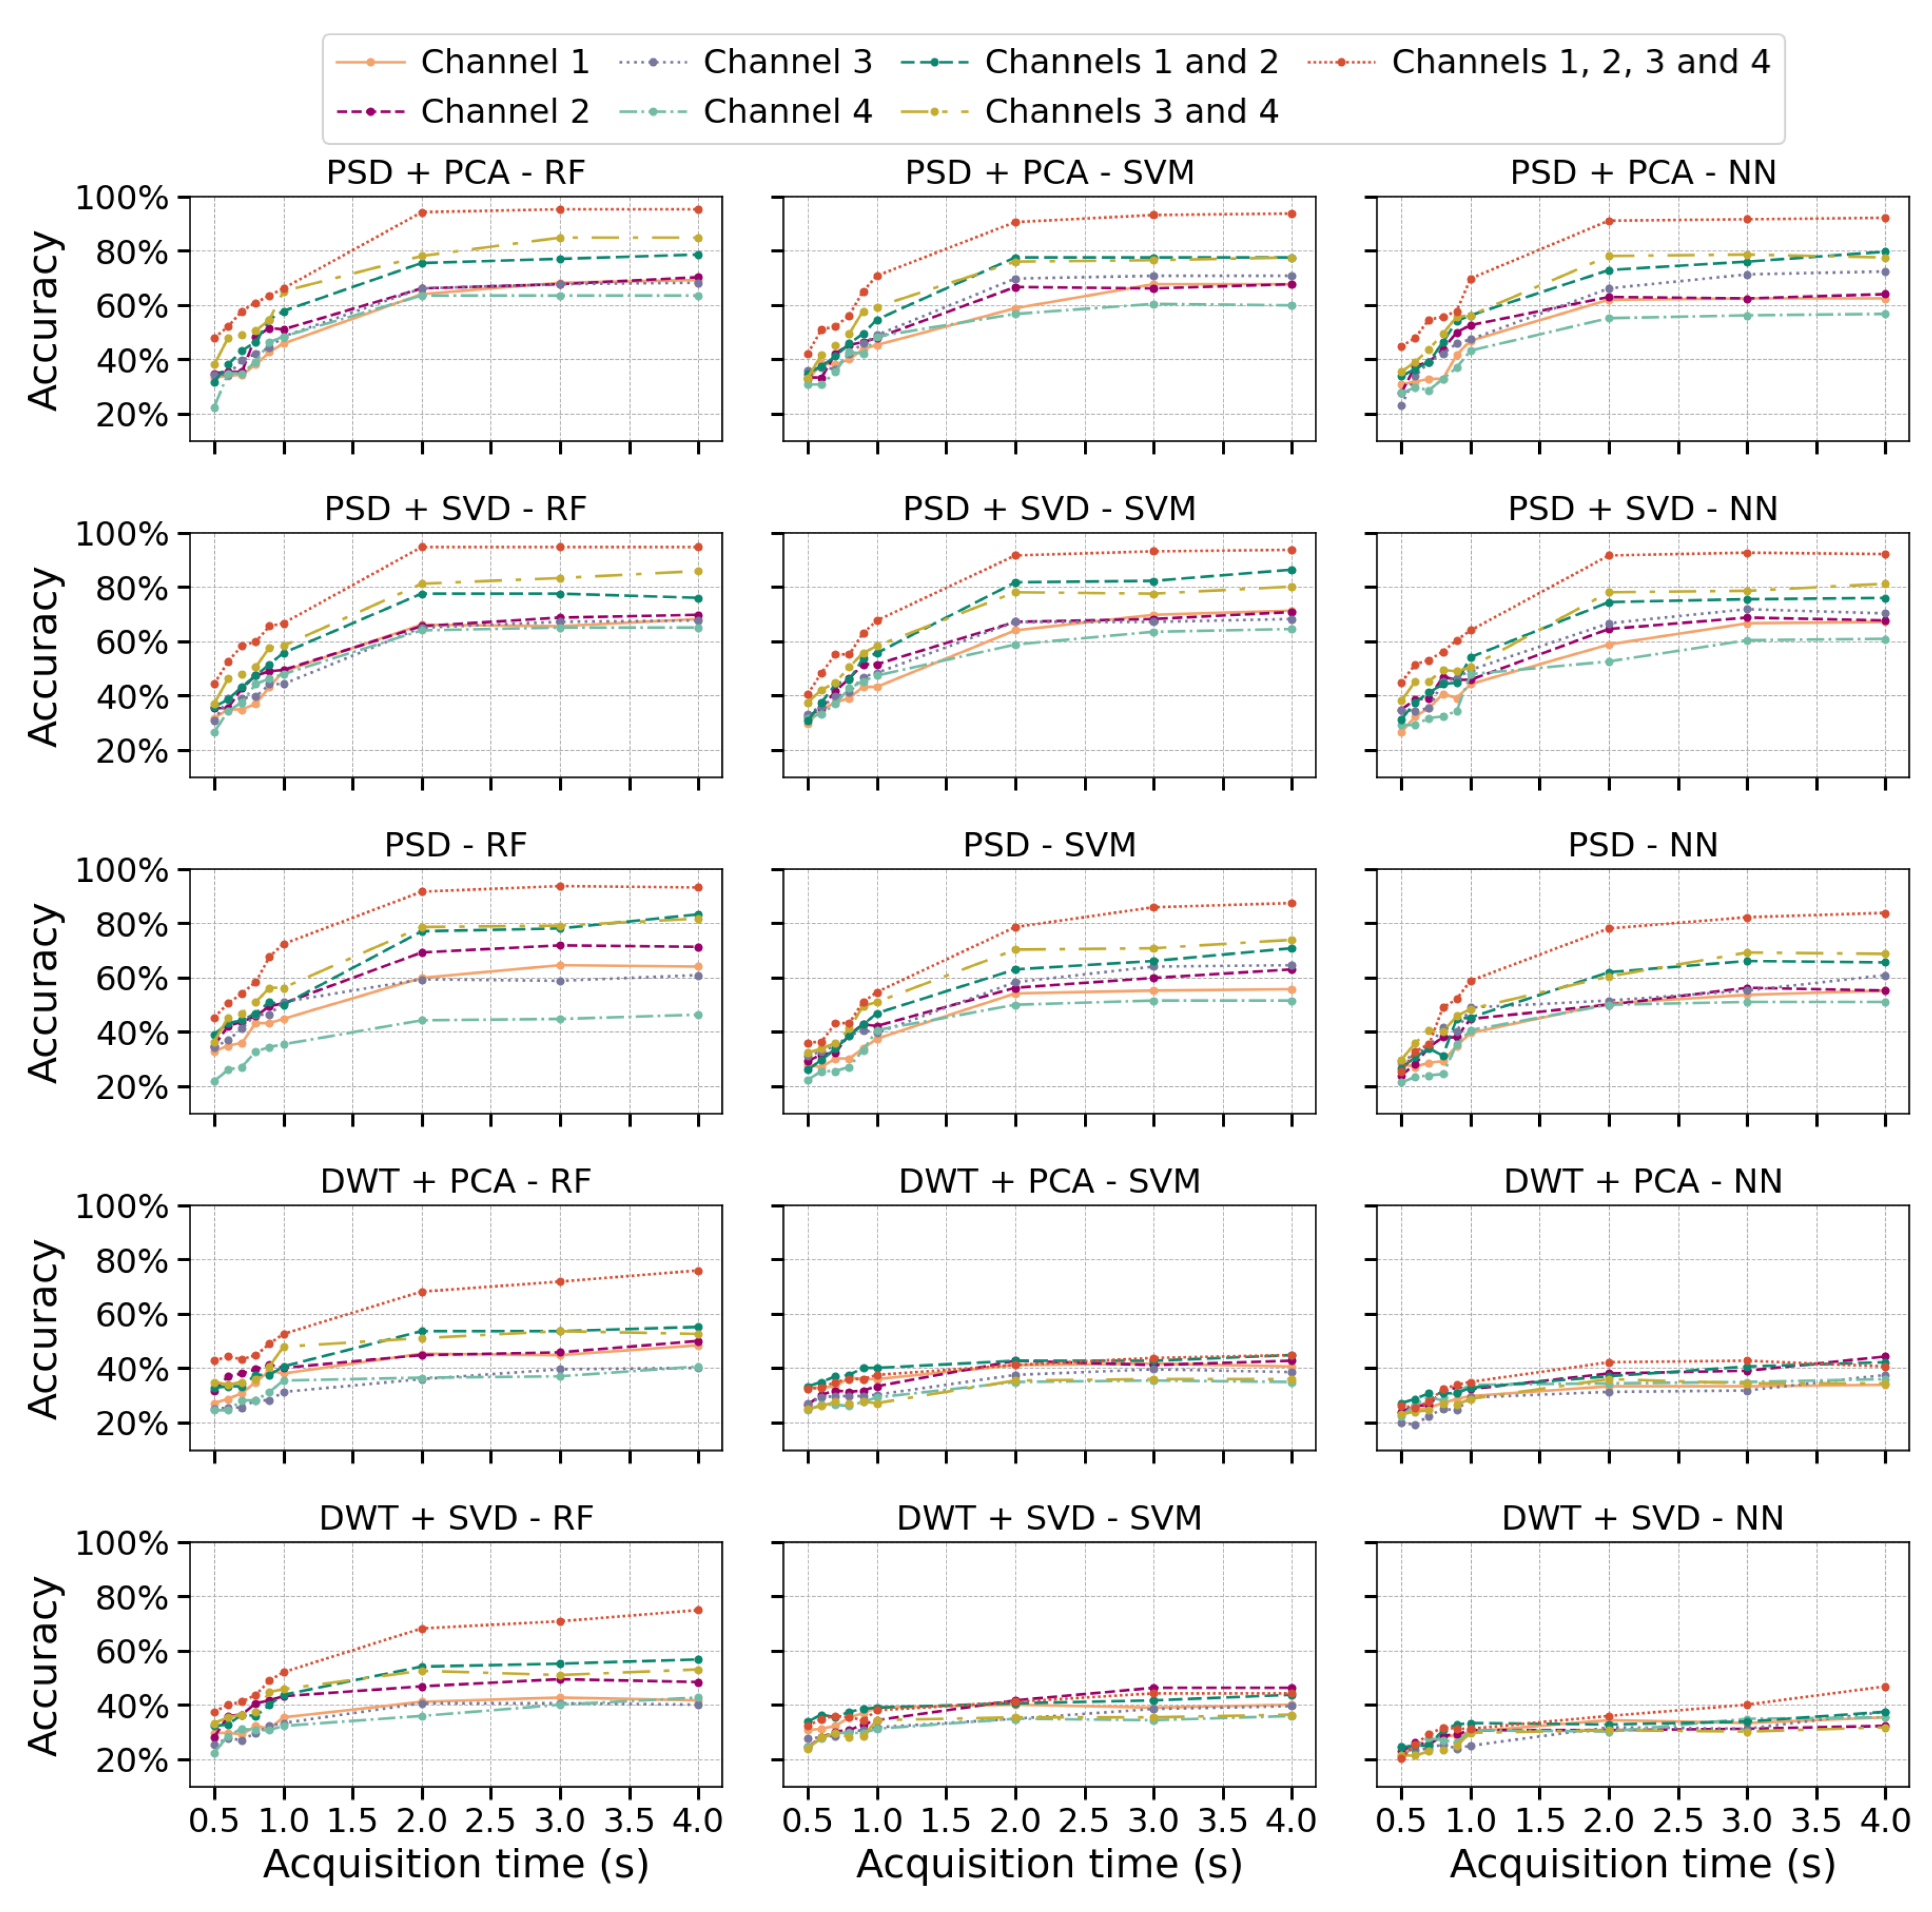
Figure 3.
Boxplots of average classification accuracy over 100 iterations, illustrating the impact of acquisition times (0.5s, 2s, and 4s) on the performance of RF, SVM, and NN algorithms across different numbers of channels. Standard deviation values are displayed next to each box. (a) PSD-PCA feature extraction methods (b) PSD-SVD feature extraction methods.
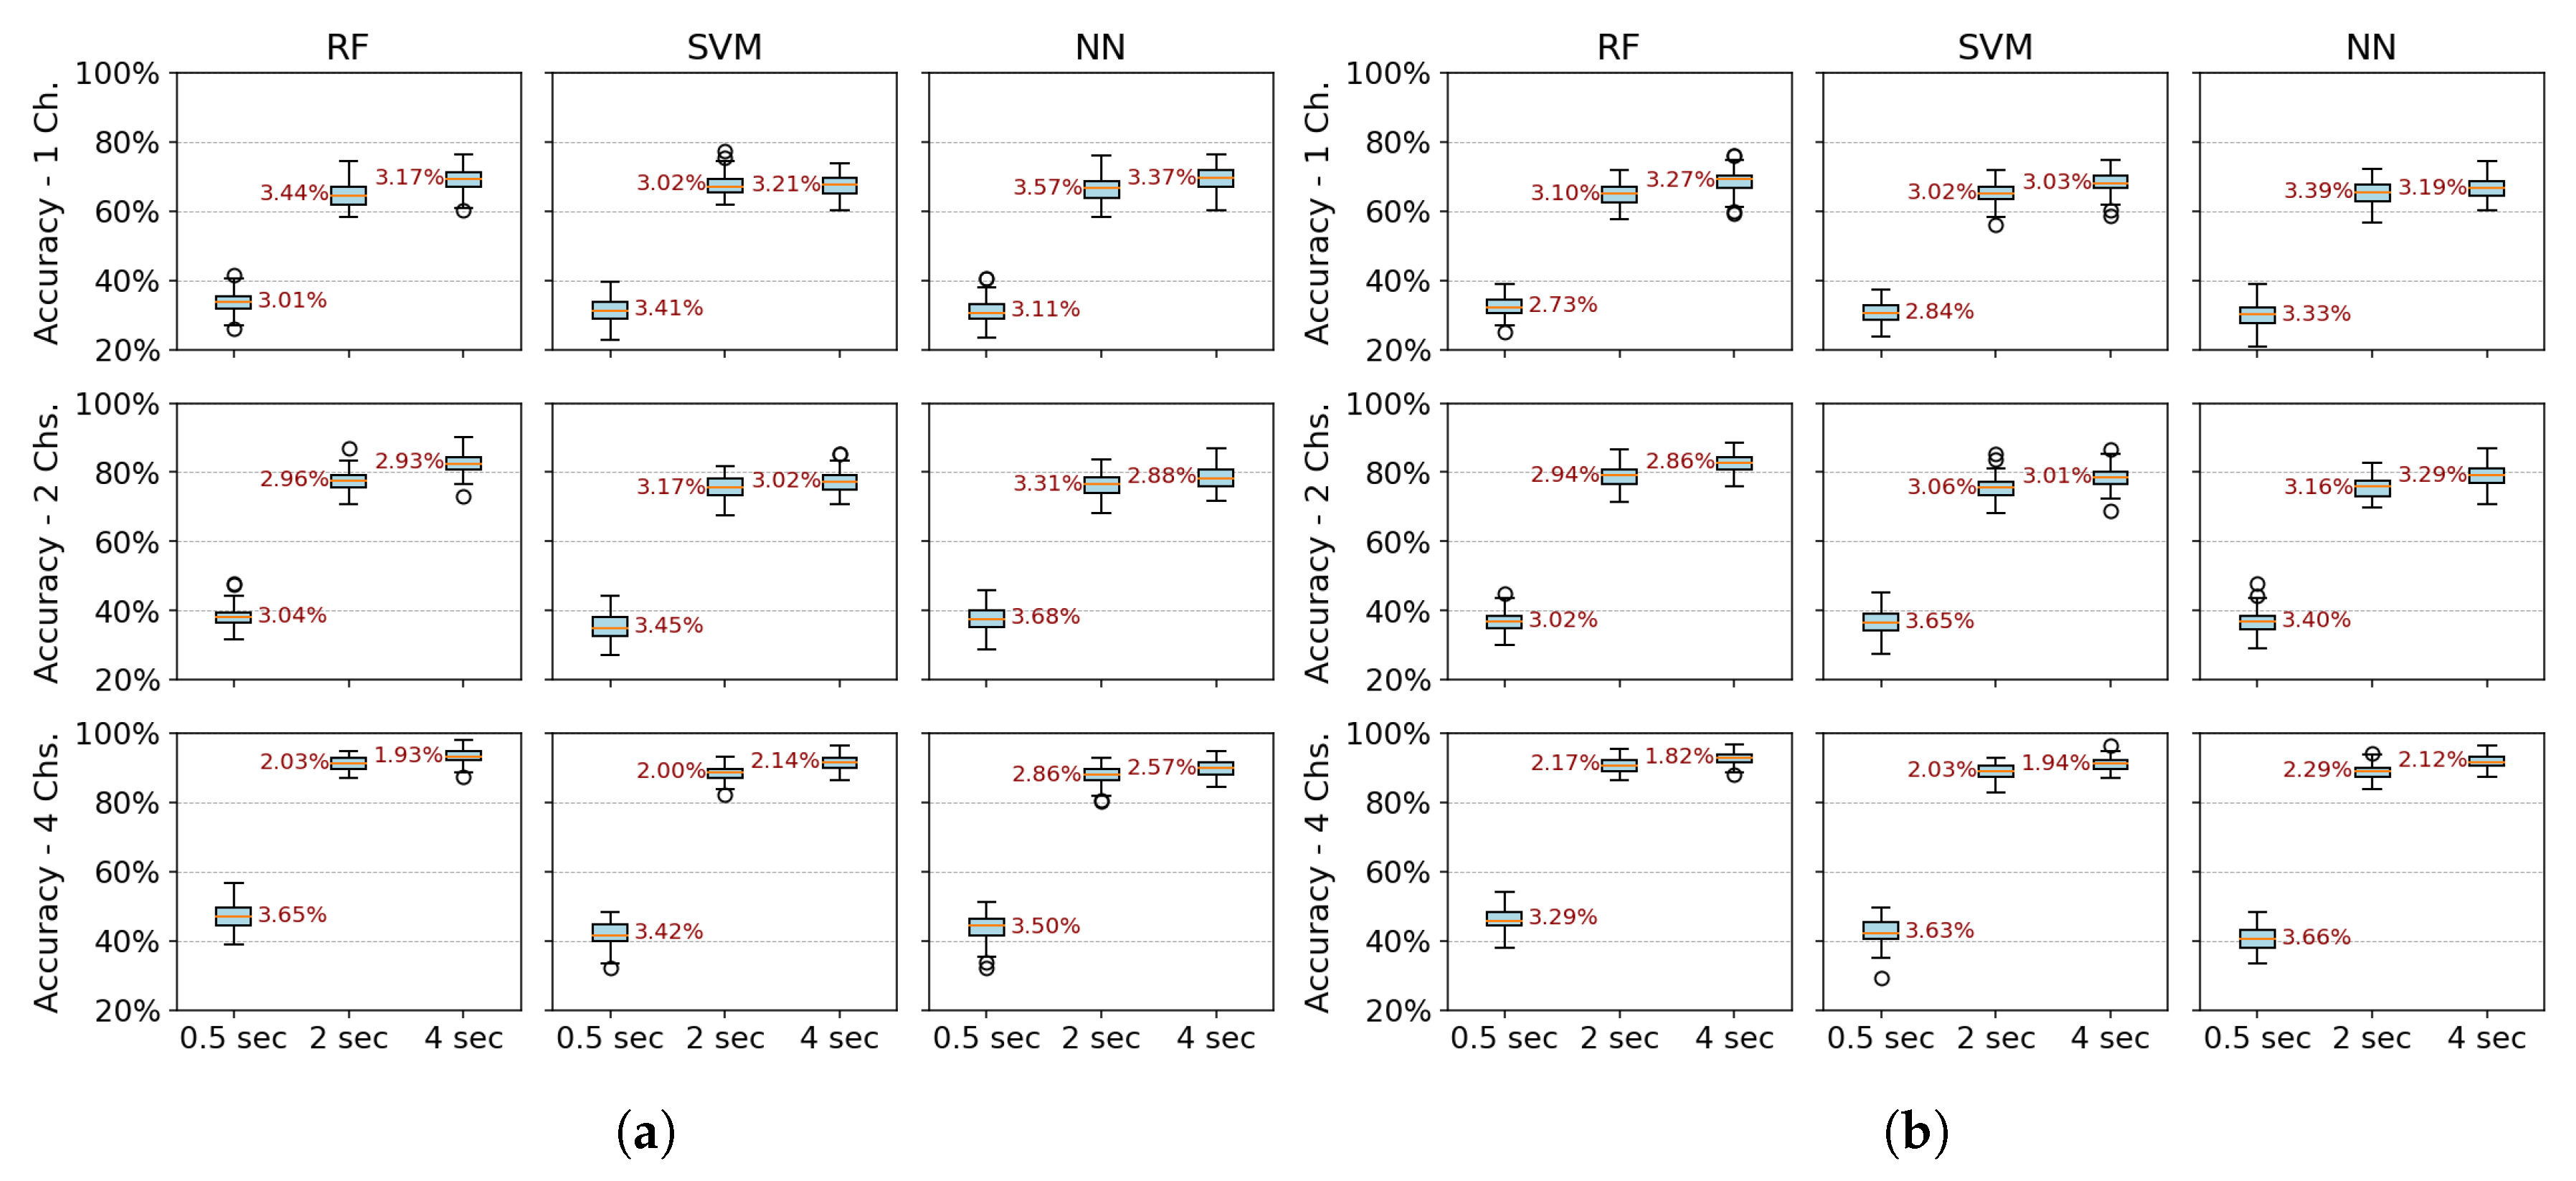
Figure 4.
Boxplots of average classification accuracy over 100 iterations, illustrating the impact of the number of channels (1, 2, and 4) on the performance of RF, SVM, and NN algorithms across different acquisition window lengths (0.5, 2, and 4 seconds). Standard deviation values are displayed next to each box. (a) PSD-PCA feature extraction methods (b) PSD-SVD feature extraction methods.
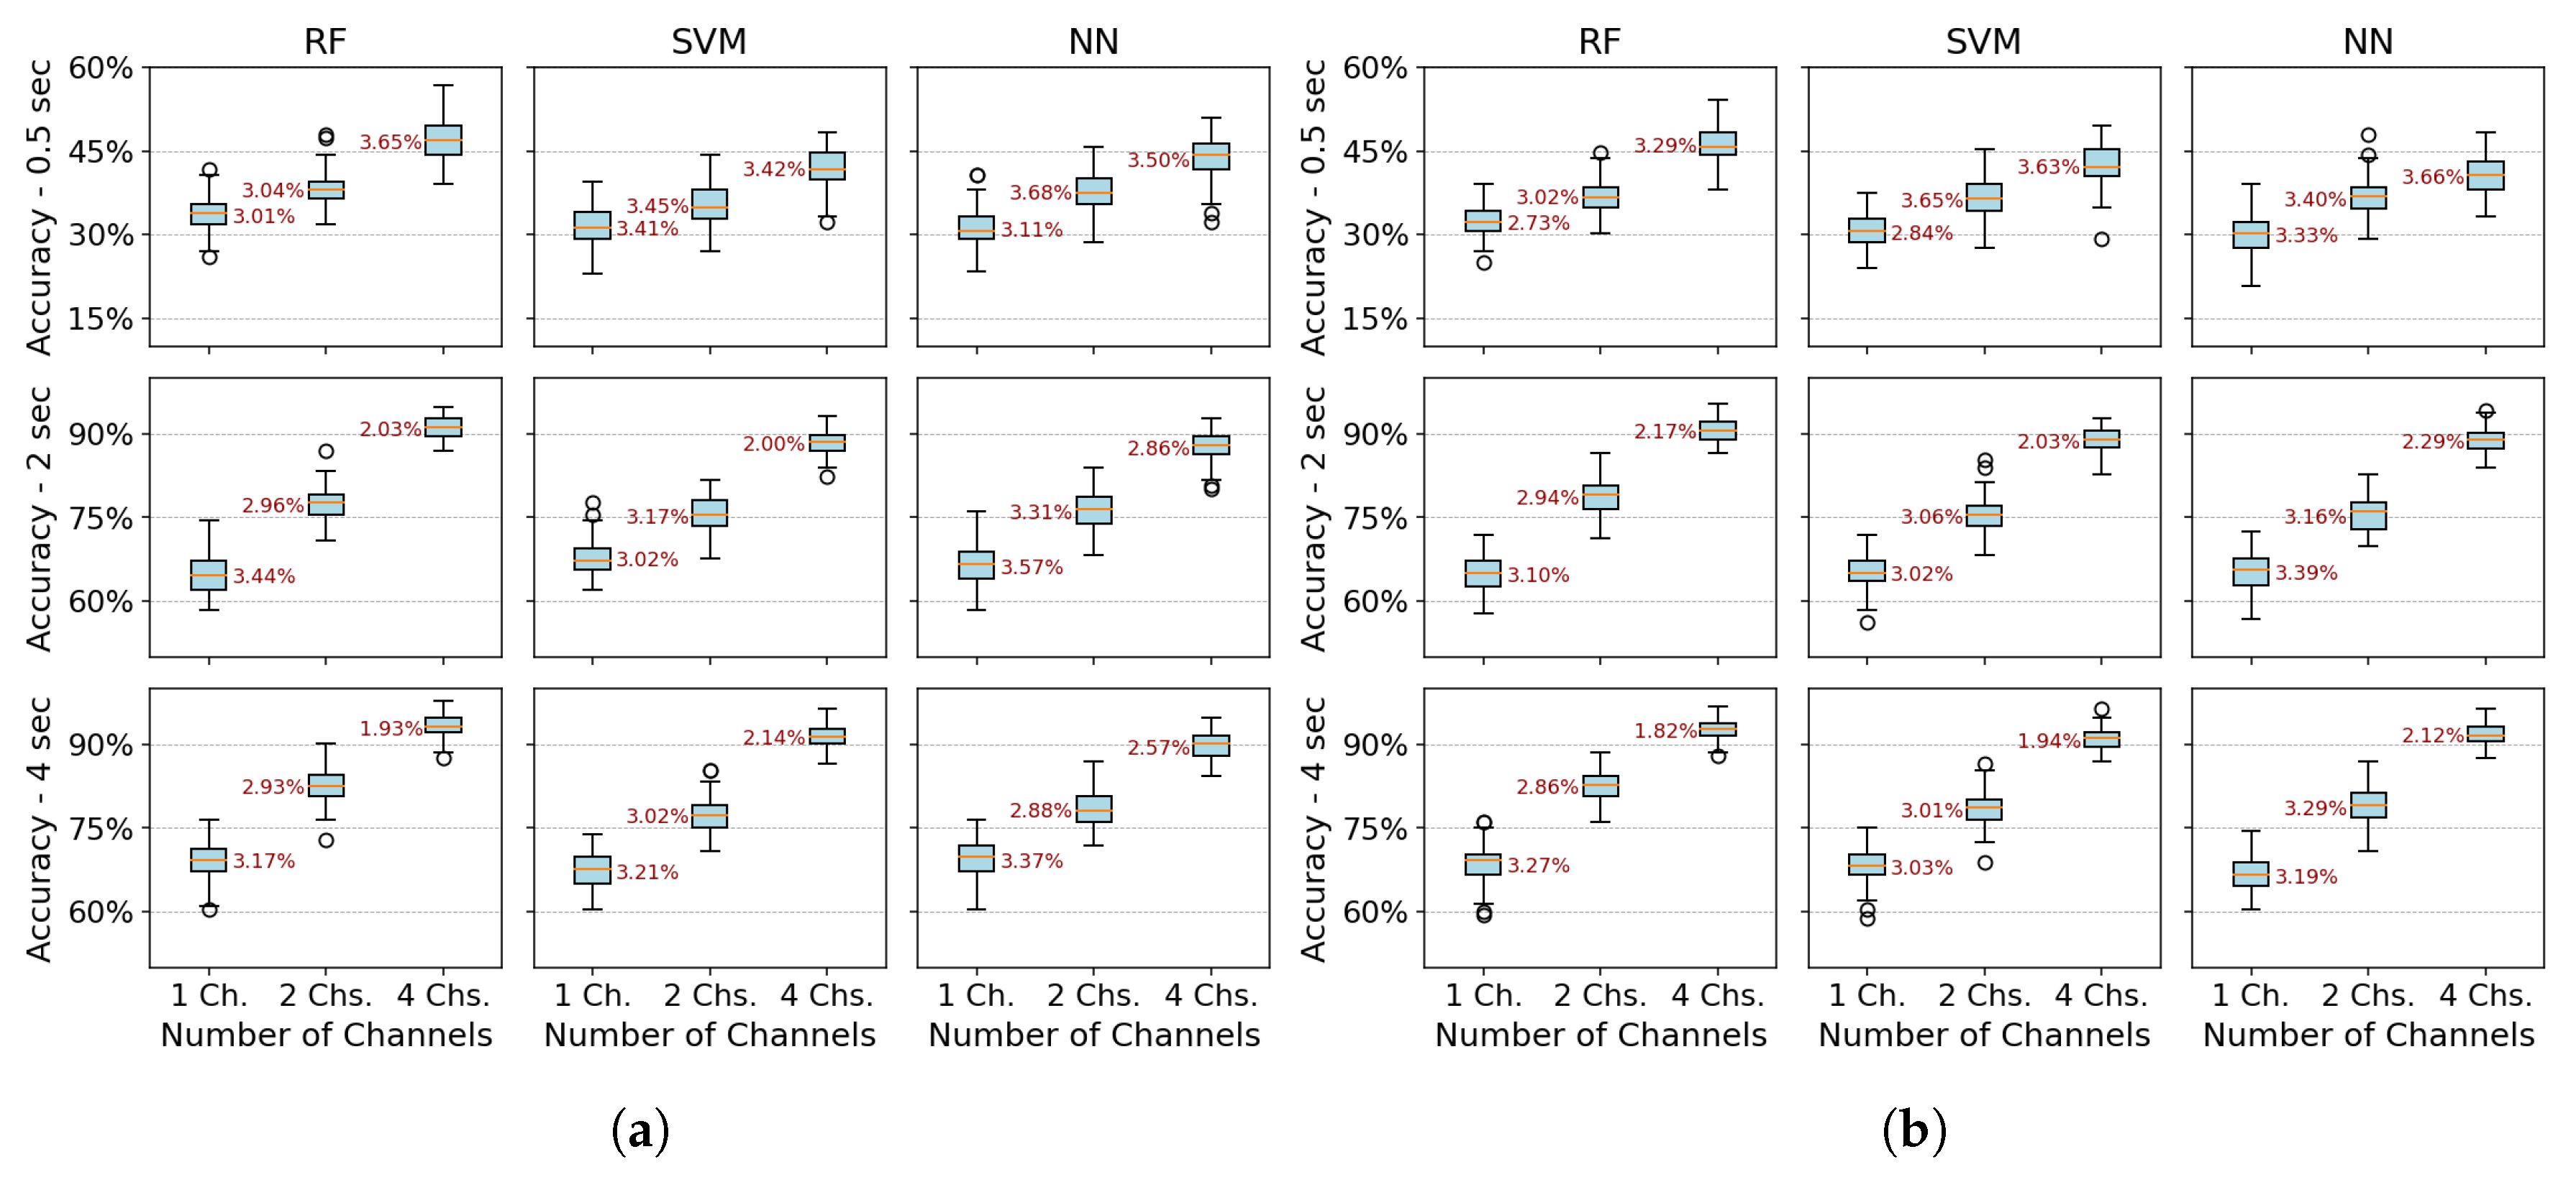
Figure 5.
Average precision, recall, and F1-score for PSD-PCA feature extraction across different numbers of measurement channels, evaluated over 100 iterations for RF, SVM, and NN algorithms at different acquisition times (0.5s, 2s, and 4s). Error bars represent the standard deviation of the metrics across iterations. (a) 1-Channel metrics (b) 2-Channels metrics (c) 4-Channels metrics.
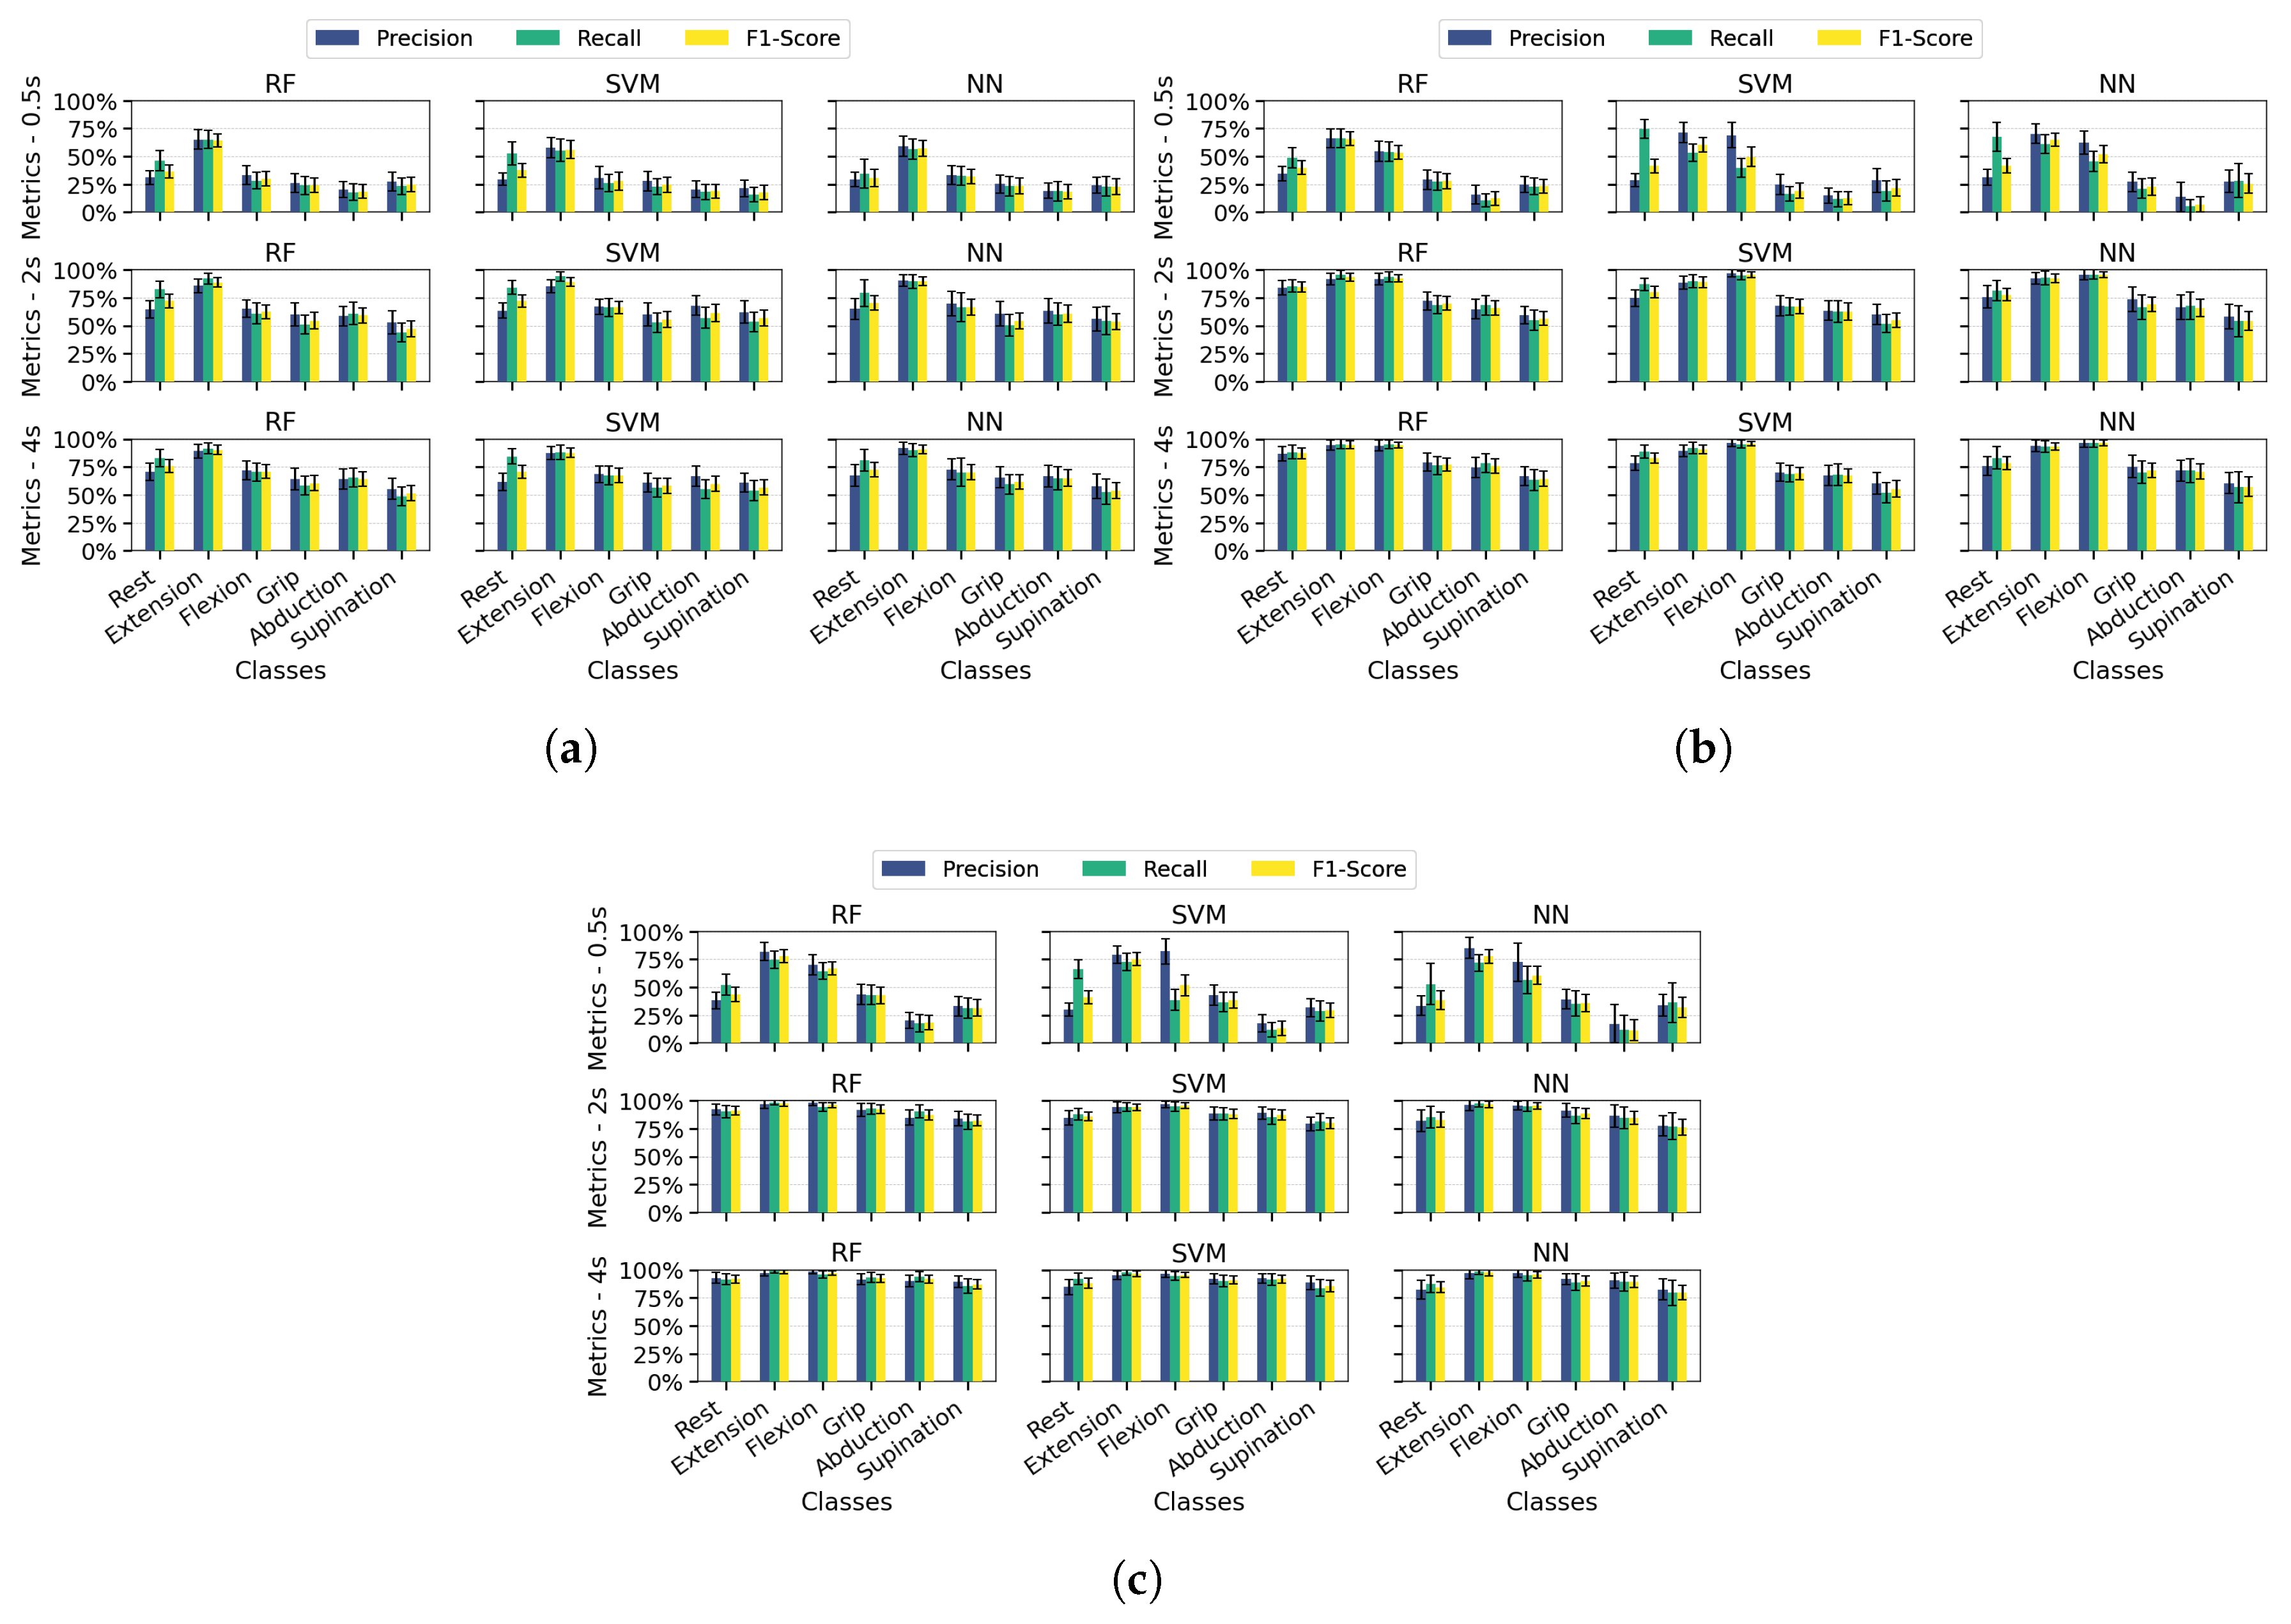
Figure 6.
Accuracy as a function of the number of samples per class for RF, SVM, and NN algorithms using PSD-PCA feature extraction with a single measurement channel (Channel 4) and a temporal window of 2 seconds.
Figure 6.
Accuracy as a function of the number of samples per class for RF, SVM, and NN algorithms using PSD-PCA feature extraction with a single measurement channel (Channel 4) and a temporal window of 2 seconds.
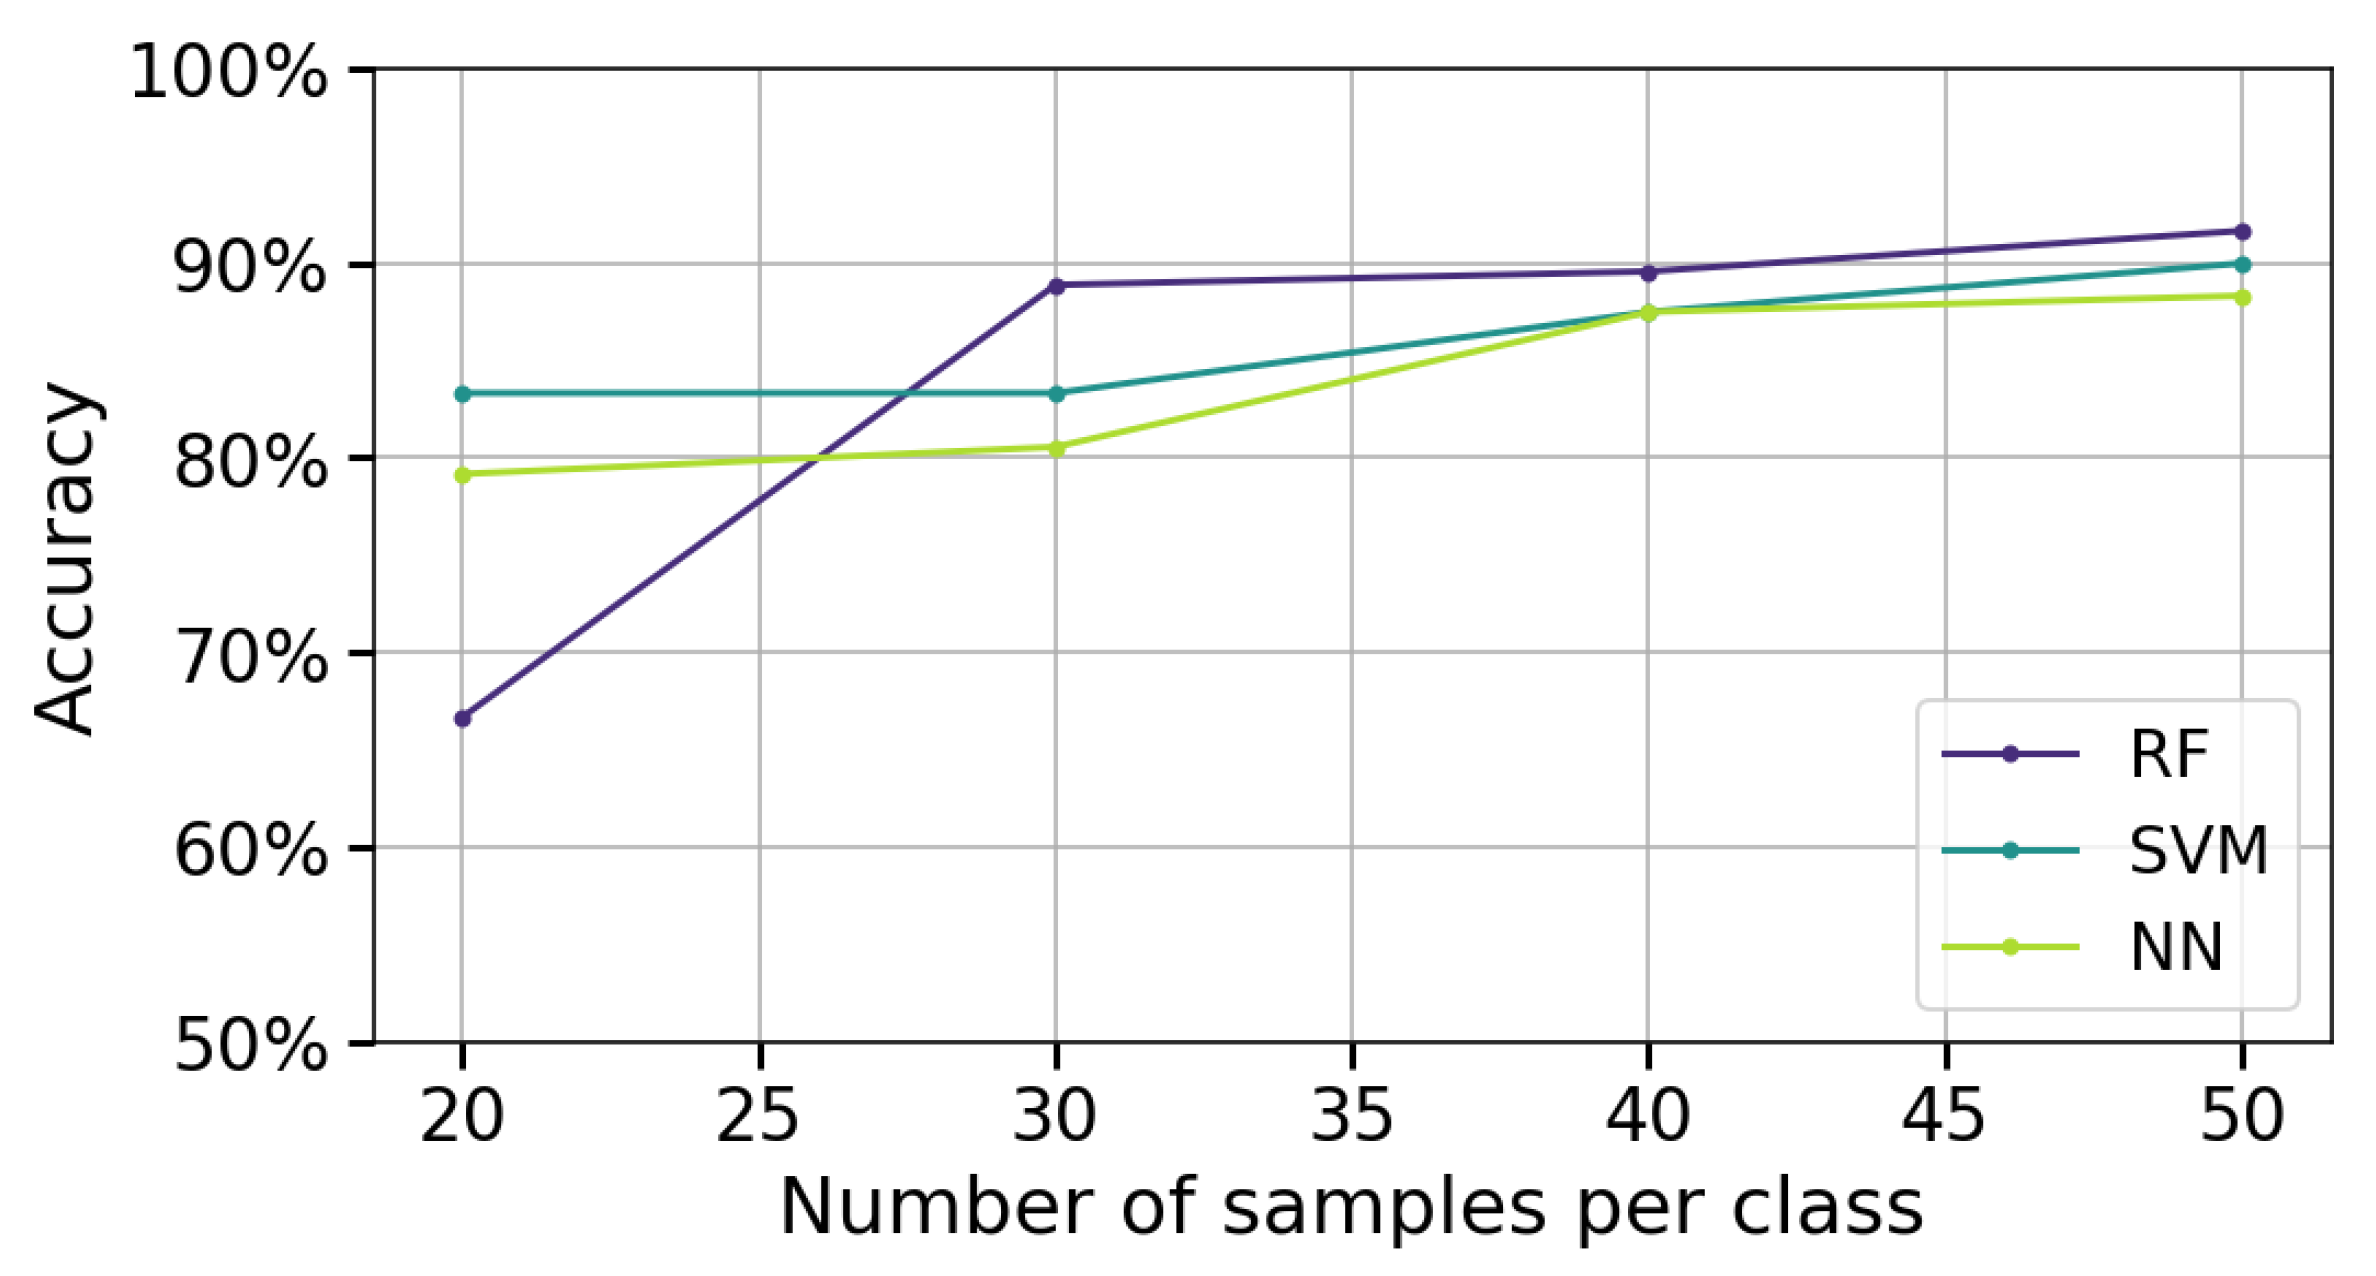
Figure 7.
Confusion matrix for validation with 20 measurements per class, evaluated across algorithms: (a) RF (b) SVM (c) NN.
Figure 7.
Confusion matrix for validation with 20 measurements per class, evaluated across algorithms: (a) RF (b) SVM (c) NN.
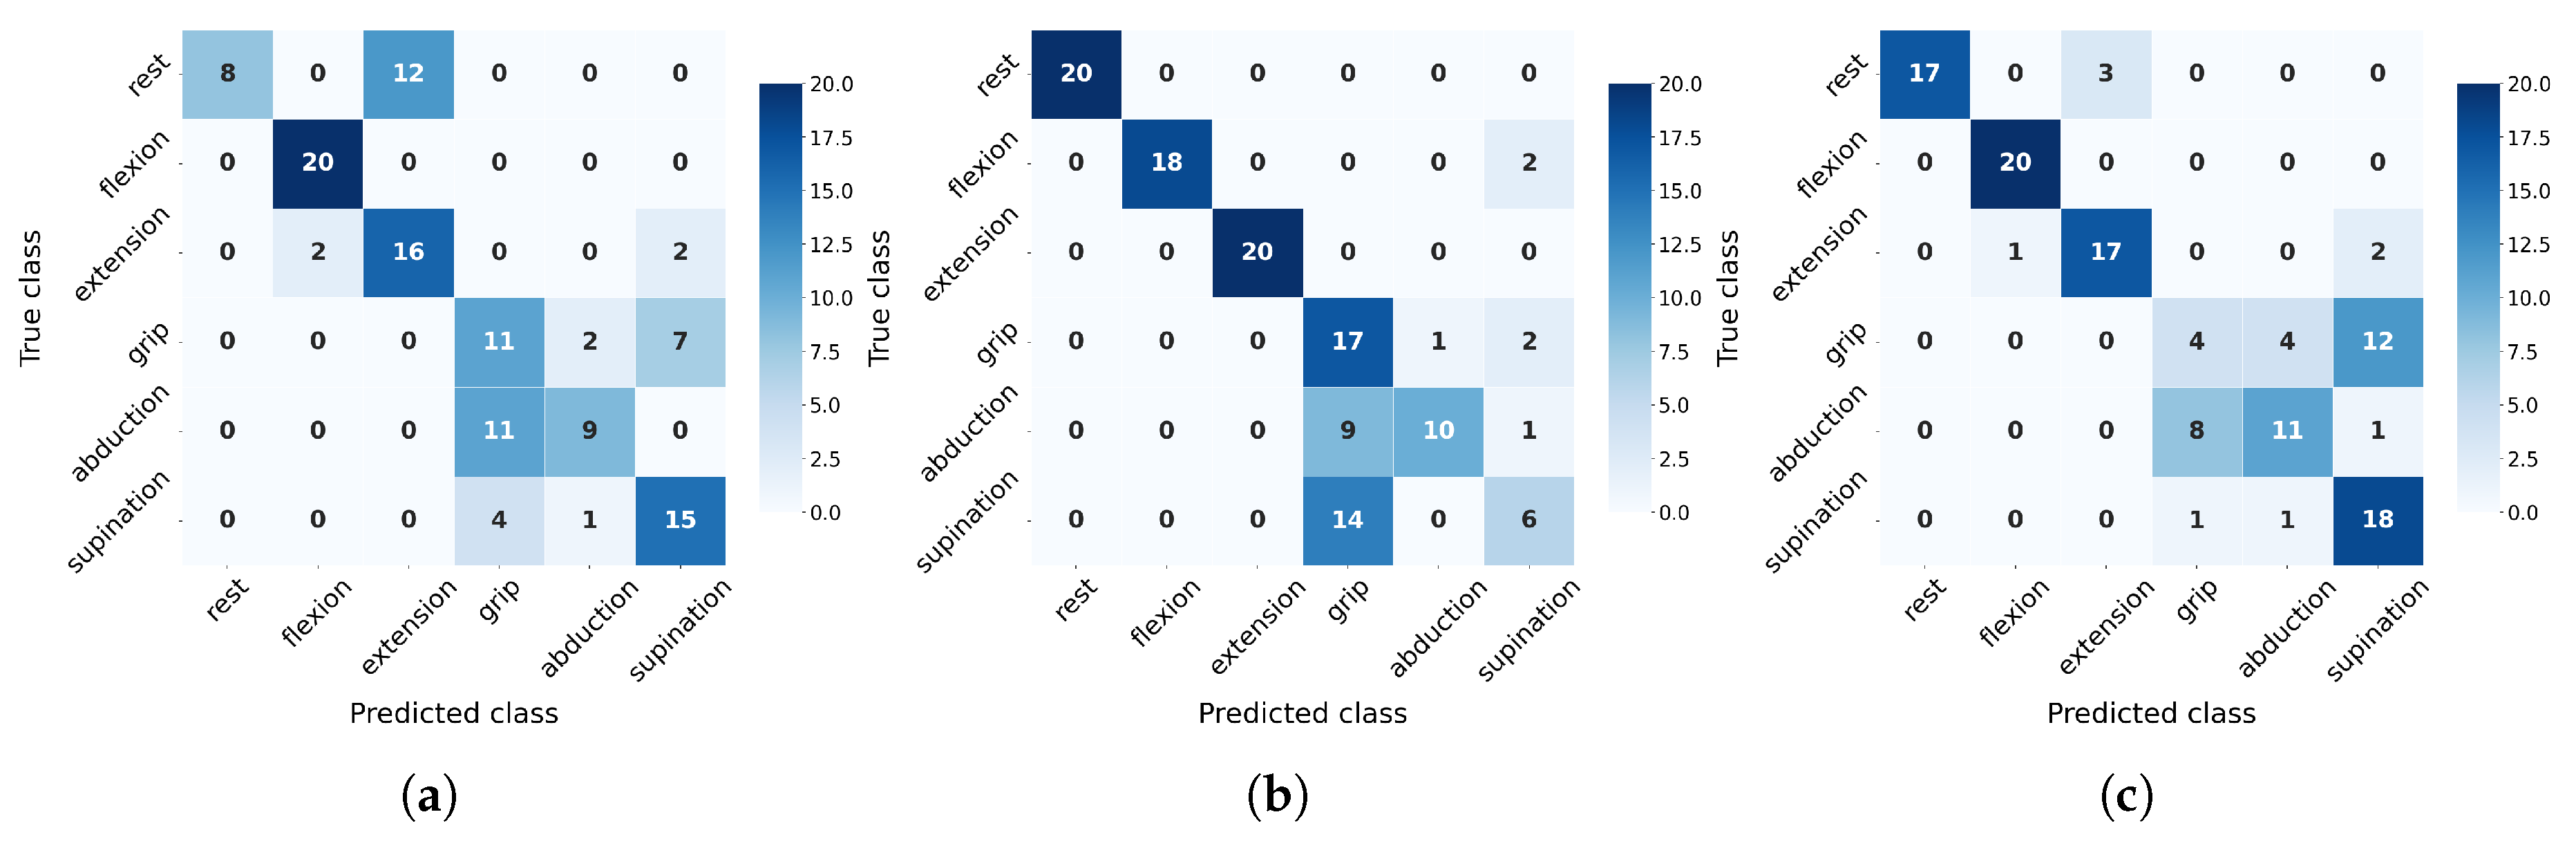
Figure 8.
Confusion matrix for validation with 30 measurements per class, evaluated across algorithms: (a) RF (b) SVM (c) NN.
Figure 8.
Confusion matrix for validation with 30 measurements per class, evaluated across algorithms: (a) RF (b) SVM (c) NN.

Table 2.2.
Hyperparameter ranges used in the grid search for SVM model optimization
| Kernel | {rbf, poly} |
| Gamma | logspace(-5,0,50) |
| C | logspace(-1,4,80) |
| Degree | {3, 4, 5} |
Table 2.3.
Hyperparameter and setup used in the grid search for NN model optimization
| Hidden layers | (64) , (128), (256), (64,64), (128,128), | |||
| (256,128), (128,64), (128,64,32) | ||||
| Function activation | {tanh, relu, logistic} | |||
| Solver | {adam, sgd} | |||
Table 3.1.
Mean accuracy and standard deviation for 40 dataset splits, using two channels and a two-second window length, for different feature extraction methods and all algorithms.
Table 3.1.
Mean accuracy and standard deviation for 40 dataset splits, using two channels and a two-second window length, for different feature extraction methods and all algorithms.
| PSD | PSD + PCA | PSD + SVD | WT + PCA | WT + SVD | ||
| Mean accuracy ± Std |
RF | 78.5% ± 2.9% | 78.4% ± 2.7% | 80.1% ± 2.9% | 47.7% ± 2.3% | 49.0% ± 3.0% |
| SVM | 64.1% ± 3.4% | 75.8% ± 2.9% | 78.8% ± 3.1% | 43.4% ± 2.5% | 38.1% ± 3.3% | |
| NN | 61.1% ± 3.7% | 76.2% ± 3.1% | 77.7% ± 3.1% | 32.3% ± 2.9% | 31.4% ± 3.3% |
Table 3.2.
Training and validation accuracy for 20 measurements per class across RF, SVM, and NN algorithms.
Table 3.2.
Training and validation accuracy for 20 measurements per class across RF, SVM, and NN algorithms.
| Accuracy training | Accuracy validation | |
| RF | 67% | 66% |
| SVM | 83% | 76% |
| NN | 79% | 73% |
Table 3.3.
Training and validation accuracy for 30 measurements per class across RF, SVM, and NN algorithms.
Table 3.3.
Training and validation accuracy for 30 measurements per class across RF, SVM, and NN algorithms.
| Accuracy training | Accuracy validation | |
| RF | 89% | 80% |
| SVM | 83% | 78% |
| NN | 81% | 81% |
Disclaimer/Publisher’s Note: The statements, opinions and data contained in all publications are solely those of the individual author(s) and contributor(s) and not of MDPI and/or the editor(s). MDPI and/or the editor(s) disclaim responsibility for any injury to people or property resulting from any ideas, methods, instructions or products referred to in the content. |
© 2025 by the authors. Licensee MDPI, Basel, Switzerland. This article is an open access article distributed under the terms and conditions of the Creative Commons Attribution (CC BY) license (http://creativecommons.org/licenses/by/4.0/).
Copyright: This open access article is published under a Creative Commons CC BY 4.0 license, which permit the free download, distribution, and reuse, provided that the author and preprint are cited in any reuse.


