Submitted:
04 May 2025
Posted:
07 May 2025
You are already at the latest version
Abstract
As complex and interconnected systems, water, food, and energy significantly influence each other, whereas quantitative and qualitative changes in one system can adversely impact the others. The Harirud River Basin, located at the border between Iran and Afghanistan, exemplifies this interconnectedness, serving as a crucial resource for supplying drinking water to the metropolitan city of Mashhad and supporting agricultural needs in the Sarakhs Plain in Iran. Similarly, in Afghanistan, this river is essential for agriculture in Herat and plays a vital role in hydropower energy generation. However, in recent years, water supply, a critical element for agricultural and energy development in the basin, has encountered significant challenges. Factors such as political, social, hydrological issues, and resource management inefficiencies have contributed to these challenges at the basin level. Using the metabolic concept and nexus indicators, this research provides an analytical framework to examine and compare the performance and processes of water, food, and energy systems at national and basin scales. The quantification within this approach is based on credible data and resources available at the basin level. The findings of this study indicate a strong interdependency between water, food, and energy systems within the basin and its riparian countries.
Keywords:
Water
; food
; and energy Nexus
; Metabolism
; Transboundary Basin
; Harirud
; Persian Gulf
1. Introduction
More than 45% of the Earth's landmass and 60% of the world's total freshwater, encompassing 286 river basins and 300 shared aquifers, cross political borders between two or more countries. The livelihoods of about two billion people depend on these shared water resources (Schelmm et al, 2016). Transboundary water resources make these communities mutually dependent not only hydrologically but also socially, economically, and geographically.
Factors such as the mismatch between political borders and watershed boundaries, water scarcity and competition over maximum resource utilization among stakeholders, uncooperative and power-seeking behavior of upstream countries in water allocation, and political tensions between treaty parties have led to increased disputes and conflicts over ensuring the security and sustainability of water resources and dependent systems in the agricultural and energy sectors (Shoghi Javan et al, 2018).
The Harirud River Basin, shared between Iran and Afghanistan, also faces such limiting factors. Additionally, the effects of climate change are clearly impacting the increase in temperature, decrease in precipitation, and the occurrence of hydrological and socio-economic droughts in the basin (Parsa et al., 2023). In this basin, a significant portion of employment, food security, energy, and drinking water for the large city of Herat in Afghanistan depends on the flow of the Harirud River. Furthermore, supplying the water needed for agriculture in the Sarakhs Plain in Iran and one-third of the drinking water for the metropolis of Mashhad in Iran and downstream of this river depends on Afghanistan's cooperation in delivering water to Iran.
According to the report by the regional authorities in Iran (Regional Water Company of Khorasan Razavi (2023)), based on the Falken mark water stress index, all counties located in the Iranian part face absolute water scarcity or water shortage. In such conditions, water has become a challenge and an influential factor in ensuring food and energy security; conversely, it is affected by human and natural factors. These indicate that there is a reciprocal and interconnected relationship between water, food supply, and energy, and these limitations intensify the effects of systems on each other and chain reactions.
Nevertheless, limited studies have been conducted in this basin that examine the current state of these resources and the level of demand dependently and alongside each other for both beneficiary countries, Iran and Afghanistan. However, in many technical studies and policy-making processes, sectoral thinking and a disconnected view of intertwined systems have led to inefficiency, increased trade-offs, and reduced synergy in managing existing resources.
Researchers seeking to reduce the consequences of such approaches introduced the Integrated Water Resources Management (IWRM) method. The main focus of this approach is water sector studies, diminishing the requirements and priorities of other sectors. Therefore, multi-sectoral approaches opened a new path for research communities and policy-making. The concept of the Nexus was first recognized in 2008 at the annual meeting of the World Economic Forum and introduced in 2011 at the Bonn Conference as an inter-sectoral approach to achieving security and sustainability of water, food, and energy resources (Rosell et al, 2023).
Early studies typically analyzed the link between two sectors, such as water and food (Antonelli and Tamea, 2015), water and energy (Sarvari et al, 2021), or food and energy (Abdelradi & Serra, 2015). Today, the focus of many studies using the water, food, and energy nexus approach includes correlation analysis, understanding dynamic interactions, and examining feedback loops between intertwined systems and environmental drivers (Conway et al., 2015; White et al., 2017; Li et al., 2020; An, 2022). Furthermore, the results of these studies have provided strategies for increasing efficiency and optimizing the use of water, food, and energy systems. Studies have also been conducted on the nexus approach at the transnational and transboundary basin levels, offering effective solutions to increase the potential for regional cooperation (Saidi et al., 2017; Almulla et al., 2017).
Implementing this approach requires qualitative and quantitative tools and methods. Purwanto et al. (2019) and Aslani et al. (2023) used qualitative methods such as feedback loop assessment to theoretically understand the link between water, food, and energy. Qualitative studies lay the groundwork for quantitative analysis of the nexus. On the other hand, quantitative studies analyzed the components of the interconnected water, food, and energy systems using tools and methods such as quantity matrices and vectors (Karnib., 2016; Ghosh et al., 2024), computational tools like the WEF Nexus Tool 2.0 in the study by Mohtar and Daher (2015), assessment and valuation of numerical indicators in studies (Willis et al., 2016; Li et al., 2020), and utilizing the input-output approach (Xia et al., 2019; Nasrollahi et al., 2021). Each of the mentioned analytical methods has limitations and advantages, applicable depending on the study area and data availability. Some limitations include the inability to examine trade within the nexus structure, lack of attention to social parameters like population change rates and labor force, and the interactions between human and natural processes (Rosell, 2023). The objective of this study is to evaluate the resources and consumption of the Harirud River Basin based on the water, food, and energy nexus approach, using an analytical framework based on the metabolic process in systems and presenting numerical indicators related to the nexus components. The assessment of the relationship between nexus components was performed by collecting available statistical data under the MUSIASEM (Multi-Scale Integrated Analysis of Societal and Ecosystem Metabolism) analytical framework, which is a multi-scale method based on input-output accounting. This approach is applicable at various spatial scales; from very small analyses at the farm level to extensive assessments at the transnational and international levels. These features make metabolic processors an adaptable tool for understanding and managing the complex dynamics of resources in a transboundary basin. The components of the analytical framework in this article were based on the study by Tovar et al. (2019) with modifications according to available information and the constraints of Afghanistan.
2. Materials and Methods
2.1. Study Area
The Harirud River Basin is a shared basin among three countries: Iran, Afghanistan, and Turkmenistan, located in South Asia. The basin covers an area of approximately 93,260 square kilometers, with about 42% located upstream within the political borders of Afghanistan, and 37.5% and 20.5% in the territories of Iran and Turkmenistan, respectively. This study focuses on the analysis of the Iranian and Afghan sections of the Harirud River Basin. On average, during the period 2000 to 2022, the estimated population in the Afghan part was 1,780,000 people, and in the Iranian part, it was 3,747,000 people (Thomas and Warner, 2015; King and Sturtewagen, 2010; Regional Water Company of Khorasan Razavi; Ministry of Jihad Agriculture Khorasan Razavi). In Iran, parts of the Qareh Qum watershed located in the counties of Sarakhs, Taybad, Torbat-e Jam, Fariman, Quchan, Salehabad, Chenaran, Mashhad, Bakharz, and Golbahar are included. In Afghanistan, it includes the provinces of Ghor and Herat in the west of the country. The Harirud River, one of the most important water resources of this basin, originates from the high mountains of Afghanistan. Near the county of Taybad, the river reaches the borders of Iran and Afghanistan and, by joining the Kashafrud River, forms the border line between Iran and Afghanistan for a length of 259 kilometers (Motaghi et al., 2018). To utilize this water resource, Afghanistan has constructed the Salma Dam upstream with an active capacity of 560 million cubic meters. In line with economic development, increasing job opportunities, and ensuring water and energy security, the implementation of development plans for water structures like the Pashdan earthen dam is also on its agenda (Nagheeby et al., 2019). Downstream of the Harirud River, Iran and Turkmenistan have constructed the Doosti (Friendship) Dam with a capacity of 1,250 million cubic meters, 180 km from the city of Mashhad, to control the inflow. Figure 1 displays the location of the river basin, the flow of the Harirud River, and the location of the dams.
2.2. Structure of the MUSIASEM Analytical Framework
The MUSIASEM (Multi-Scale Integrated Analysis of Societal and Ecosystem Metabolism) analytical framework is a type of accounting that uses the concept of metabolism to describe the performance of socio-ecological systems in terms of capital and flow components in a relatively simple manner. This framework was first proposed by Rosen (Rosen, 1958). One feature of this framework is that it creates less complexity at large and transnational scales compared to similar methods like PRIME³ and requires less data. This framework consists of processors that represent the structural and functional components of a system on multiple scales. Since the inherent characteristic of natural systems is their open boundaries, this framework allows for the definition and analysis of trade relationships and interactions of each system with others. With such capability, based on the relative share of a system in using its domestic production versus using imported flows, part of the metabolic security in supplying water, food, and energy can be examined (Giampietro, 2022). Figure 2 illustrates the components of a processor, generally consisting of four parts. The upper part relates to inputs entering from the technosphere (processes under human control). These inputs include flows and capital. Flows are materials and energy consumed during the process (like fuel, fertilizer, electricity), but capital elements are not consumed; rather, they are maintained over time (like turbine capacity, labor force, land) and convert inputs into outputs. The lower part of the processor pertains to the system's interaction with the biosphere (the natural environment outside human control), where the left side includes all flows entering from the environment outside the system during the process (like green water, soil, and wind), and the right side relates to loads returned to the surrounding environment during the metabolic process (like waste, greenhouse gases, and sewage). The processor's output indicates the amount of product(s) produced with a specific quantity of required flows and capital and a certain level of interaction with the biosphere.
2.3. The Water-Food-Energy Nexus System
The MUSIASEM framework allows analysis at different spatial and temporal levels. These spatial levels can include global, regional, national, local, and even subsystem scales. In this study, the water, food, and energy nexus will be examined at two spatial levels: national and transnational. At the national level, using processors within the borders of Iran and Afghanistan located in the Harirud River Basin, the functional and structural parameters of the local water, food, and energy supply processes have been quantified separately to identify priorities and constraints related to resource management in each country. The water processor includes the process of abstracting water from aquifers and surface flows. The food processor includes the process of producing agricultural products with dominant cultivated areas. Due to the small share of orchard cultivation area and lack of data, only a limited number of orchard products have been selected. Within the study area, the only energy source considered is electricity, as fuel for Iran is supplied from the national system (outside the basin) and for Afghanistan through imports. The local electricity supply in Afghanistan comes solely from the renewable Salma hydropower plant, while for Iran, it comes from non-renewable gas, steam, and combined cycle power plants within the area. The transnational level, at the border of the Harirud River Basin, will be depicted by quantifying the trade of food products, energy trade, and the inflow of the Harirud transboundary river from Afghanistan into Iran, to examine the connection and dependency between the two beneficiary countries. Figure 3 shows a local nexus system composed of processors and how it relates to its boundary.
2.4. Quantification of Processor Elements and the Nexus System
The quantification of the values of structural and functional components of the processors and the trade relations between the two countries is done by collecting data from reliable references and reports and, in cases of data scarcity, using mathematical relationships governing the processes. A brief description is provided in Table 1. Study assumptions and details of the relationships are described below.
As shown in Table 1, in the water processor, internal flows, including electricity and fuel consumed for pumping water from aquifers, are quantified using computational methods. Equations 1 and 2 were used to calculate the energy consumed:
P = (γ × Q × h) / (1000 × μ)
E = (P × T) × N
Where P is pump power (kW), γ is the specific weight of water (9810 N/m³), Q is pumping discharge (m³/s), h is pumping head (m), μ is electropump efficiency (66% for electric pumps (Firouzabadi et al, 2014)), E is the energy consumed (kWh), T is annual pump operating hours, and N is the number of wells. The pumping head was based on the average pumping lift, and the pumping discharge was based on the average yield of wells in the area.
The amount of fuel consumed for pumping water (agricultural sector) was calculated using Equation 3:
F = A × WCE × fp
Where F is fuel consumed (liters), WCE is irrigation efficiency (assumed 35% for the Iranian part based on the Qareh Qum Atlas report), and fp is the fuel consumption intensity (diesel) for types of deep and semi-deep wells.
In the basin assessment section based on nexus indicators, Equation 4 was used to calculate the amount of renewable water:
RW = (Q1ave - Q2ave) × S
Where RW is the total renewable water of the basin, Q1ave is the total annual precipitation of the basin (mm), Q2ave is the total annual evapotranspiration of the basin (mm), and S is the study area size (km²).
In the food processor, only the amount of inputs consumed (chemical fertilizers, seeds, human labor, machinery hours) in the agricultural production process was quantified using Equation 5 and computational methods:
R = Ai × Tci
Where R is the amount of input consumed in its common unit, A is the cultivated area, and Tc is the technical coefficient (input amount) per hectare for each crop. Cultivated area and technical coefficients of inputs were collected based on the references mentioned in Table 1.
Also, to enable comparison between the quantities of inputs consumed for different agricultural products, their energy equivalents, provided in Table 2, were used.
Furthermore, in the food processor, some values mentioned in Table 1 were estimated for years with missing data within the study period, based on years where data was available. This estimation was done by calculating the study area's share of the total national production and cultivated area from FAO data for years where study area data from Jihad-e-Agriculture and the Afghan Ministry of Livestock was available.
In these calculations, it was assumed that the share of each region in the total production and cultivated area of its country did not change significantly during the study period (2000-2021), and this ratio could be applied to national data for years where basin statistics were unavailable.
In the energy processor for both countries, the amount of carbon dioxide emissions from power plants is not directly measurable. Therefore, its long-term amount was calculated using Equation 6:
EMIi = φi × PEI
Where EMIi is the emission amount for each power plant (tons of carbon dioxide), φi is the emission factor (grams of carbon dioxide per megawatt-hour of power plant generation), and PEI is the operational capacity of the power plant (megawatts). Since the non-renewable power plants in the study area mainly consume natural gas, based on the study by Kargari and Mastouri (2009), the emission factor for gas power plants was considered as the average of the range 470-780 grams of carbon dioxide per kilowatt-hour of electricity generation, and for hydropower plants, the average of the range 1-34 grams was considered.
Also, the energy processor for Afghanistan, which includes electricity generation in the hydropower plant, involves an internal consumption flow, which is the water flow passing through the turbine during the electricity generation process. The amount of this flow was calculated using Equation 7:
Q = P / (η × ρ × g × h)
Where Q is water discharge (volume of water passing through the turbine per unit time, m³/s), P is the power generated by the plant (watts), η is turbine efficiency, ρ is water density (1000 kg/m³), g is the gravitational acceleration (9.81 m/s²), and h is the waterfall height (m). Turbine efficiency was assumed to be 80% based on the technical information of Francis turbines from BHEL India. Also, the waterfall height, due to a lack of information from the Salma hydropower plant, was calculated based on the normal reservoir level.
In the nexus system, agricultural product trade values were quantified by the difference between demand and production for each product in the region. Demand was calculated based on FAO national per capita consumption values applied to the region's population. In these calculations, it was assumed that the supply of agricultural products in the basin was not less than the demand, and if local resources were insufficient, the basin's demand was met through imports. The amount of energy exchange and the volume of Harirud water inflow from Afghanistan to Iran were included based on reports published by official authorities of both countries, mentioned in Table 1. Table 3 also presents the indicators used in evaluating the components of the water, food, and energy processors.
3. Results
In this section, the nexus concept was first examined in the processors for local water, food, and energy supply, demonstrating the dependency and interactions of natural and human systems within the borders of both countries. The values of their constituent components are the annual averages of parameters over the 2000-2021 period, based on the calculations and available data presented in the previous section. Additionally, using a graphical-numerical framework based on the nexus concept, the relationship of each processor with others within the border and the dependency on meeting demand from outside the border at the Harirud River Basin level will be examined. Finally, by calculating the numerical indicators introduced in Table 3 (referred to as Table 2 in the original Farsi text, corrected here based on content), the status of some components of the processors and their outputs in Iran and Afghanistan will be assessed.
3.1. Local Water Supply
3.1.1. Iran
The local water supply processor includes the process up to the point of water abstraction from surface and groundwater sources to ultimately withdraw a specific amount of water for various uses. The water processor has the most interaction with the biosphere. Figure 4 shows the implementation of the local water supply processor in Iran. As observed, during the studied period, the average annual inflow volume from precipitation was about 7,640 million cubic meters, of which 66% was consumed by evapotranspiration from natural lands. Due to data limitations, surface flow values were derived from the Qara-Qum Atlas, based on studies conducted in 2007; thus, these values may differ from the average values of the studied period. According to water balance reports, 92 million cubic meters of surface flows exited the study area and entered the upstream of the Doosti Dam in the Harirud River. Additionally, 10 million cubic meters flowed from the Janatabad area into the adjacent basin. The outflow values do not include water exchanges between areas within the basin, only considering surplus flows exiting the basin. Furthermore, the report estimates the environmental water rights share from surplus surface flows at 113.5 million cubic meters, which includes part of the outflows and, therefore, is not considered an independent parameter in Iran's water processor. The only surface inflow to the watershed is 106 million cubic meters from the Harirud transboundary river in Afghanistan, entering Iran near Sarakhs and stored in the Doosti Dam reservoir (Iran Ministry of Energy, 2011).
The structural components of the processor include dams and the exploitation capacity of aquifers in the area. To utilize surface waters, including the Kashafrud, Rosroud, Jamrud rivers, and the Harirud transboundary river , 15 dams have been constructed with a total reservoir capacity of 1,567 million cubic meters (Iran Ministry of Energy, 2011).
For extracting groundwater resources of the basin, 4,500 deep wells with a maximum yield of 19.5 liters per second and 3,000 semi-deep wells with a maximum yield of 5 liters per second have been drilled (Ministry of Energy, Iran Water Resources Management Company, 2000). Total water withdrawal from resources was estimated at 1.947 billion cubic meters. Nearly 68% was from groundwater sources, and the rest from surface waters. It is essential to note that this amount of water withdrawal in the area does not account for most orchard products in agricultural use or the livestock and poultry farming sector. The total water withdrawn from aquifers for agriculture is 1.314 billion cubic meters, supplying about 80% of this sector's needs.
The agricultural sector's share of water withdrawal from dams is 127.5 million cubic meters, with the remaining agricultural needs met from canals and rivers. Industrial water withdrawal volume is 35.6 million cubic meters, with the highest consumption by metallic mineral industries and food industries (Ministry of Industry, Mine and Trade, 2021). A negligible share (0.3%) of this amount comes from surface water sources, with the remainder supplied by groundwater. Water withdrawal volume for the services sector is 111 million cubic meters, with only 5% supplied from surface water sources in the basin (Regional Water Company of Khorasan Razavi, 2016-2022).
With about 98% of the region's population having access to drinking water, the total withdrawn water volume was estimated at 359 million cubic meters; except for the metropolis of Mashhad, all counties in the basin rely on groundwater for drinking water. According to the Qara-Qum Atlas, in 2008, only 6% of Mashhad’s drinking water was supplied from the basin’s surface water resources. However, based on the regional water per capita and profile report, this figure reached 30% in the five years leading up to 2022. According to statistics from the Razavi Khorasan Jihad-e-Agriculture Organization and Regional Water Authority, excluding the pilgrim population, the city’s population increased by over 15% during this period. It can be inferred that factors such as population growth and excessive groundwater extraction have increased Mashhad’s dependence on surface water for drinking, with the primary source being inflows from the Harirud River.
Consumptive flows in the water abstraction process include fuel and electricity required for pumping. Still, fuel consumption for industrial and drinking water purposes was disregarded due to a lack of data on consumption intensity. The total energy consumed for withdrawing water from the area's aquifers from a depth of 130 meters was calculated at 4.305 million megawatt-hours, with the agricultural sector being the largest electricity consumer at 3 million megawatt-hours. Figure 4 displays the process of water abstraction from surface and groundwater sources.
3.1.2. Afghanistan
In the Afghan section, the volume of inflow from precipitation into the water system was, on average over the 22-year study period, 12% higher than in Iran, of which 5,012 million cubic meters became unavailable through evapotranspiration from natural lands. This amount of evapotranspiration is 52% higher than in the Iranian section. There is no inflow in this area, but the Afghan section, as the upstream part of the Harirud River Basin, released 106 million cubic meters to downstream countries (Iran Ministry of Energy, 2011).
The only operational reservoir dam in the Afghan area is the Salma Dam with a capacity of 633 million cubic meters, built on the Harirud River (Nagheeby et al.,2019). There are no reliable reports on the number of drilled wells in this region; only 644 deep and manual wells were registered in the Zendeh Jan (Pashtun Zarghun in original, likely an error) and Karukh districts by 2004 (Ahmadi and Heravi, 2024). Therefore, values related to electricity and fuel consumed for water abstraction from aquifers are not calculable. Total water withdrawal from water resources in the Afghan section was 821.6 million cubic meters. The share of water withdrawn for the agricultural sector was 781.8 million cubic meters, with 85% of the agricultural water supply needs dependent on surface water sources and 15% share from groundwater (Uhl et al., 2003; Report of DACAAR, 2013). In the drinking water sector, only 45% of the residents of Herat and Ghor provinces have access to drinking water, annually requiring 34.5 million cubic meters withdrawn from groundwater sources to meet the needs of this population (Ahmadi and Heravi, 2024). Industries in this section include only 200 production units in the Herat Industrial Park, collectively withdrawing 5 million cubic meters from water resources, with the largest share attributed to food industries. No reliable information is available on the water sources used in the industrial sector. Figure 5 displays the processor related to the water abstraction process in the Afghan section.
3.2. Local Food Supply
3.2.1. Iran
Resources directly involved in producing food products from the region's agricultural sector include water for irrigation and consumed inputs. In total, 1,621.5 million cubic meters of water (49.2% cereals, 12.1% fodder, 11% selected orchard products, 11% melons/gourds, 7.4% industrial crops, 7.3% vegetables, and 2% pulses) were used to meet the needs of arable and orchard lands. Of this amount, 70% was irrigated using blue water sources, and 30% was green water supplied by precipitation. In total, 20,556 terajoules of energy, including fertilizer, seeds, fuel, and electricity, were consumed in the agricultural production process. Due to the significant share of groundwater resources in meeting irrigation needs, electricity and fuel for pumping motors accounted for the highest energy consumption. Irrigated cereal production and saffron consumed the most energy, while pulses consumed the least. Annually, an average of 311.6 thousand hectares of land (63% cereals, 10% melons/gourds, 8.4% orchard products, 7.6% fodder, 4.5% industrial crops, 4.4% vegetables, and 1.7% pulses) were under cultivation.
Due to the high dependency of the agricultural sector on groundwater resources, the highest density of irrigated cultivation area is located within the Mashhad, Sarakhs, and Fariman-Torbat-e Jam aquifers. Energy consumed by capital inputs like human labor in the system was estimated at 150.7 terajoules, and the share of machinery was 948 terajoules. The highest machinery operating hours were for cereals, and the lowest were for vegetable production. Saffron and melon accounted for 44% of the total energy consumed by labor. The local food supply system produced a total of about 2.1 million tons of selected agricultural products during this process, of which 271 thousand tons were removed from the supply and distribution chain as losses. The highest losses were related to the melon/gourd product group, with 81 thousand tons lost annually. Figure 6 summarizes the performance of the local food supply processor.
3.2.2. Afghanistan
In the Afghan section, a total of 680 million cubic meters of water (70% cereals, 14% industrial crops, 8.5% orchard products, and 11% other products) is supplied from surface and groundwater sources, which is 30% less than the blue water consumption for agriculture in the Iranian section. The total consumed green water supplied from rain is 378.7 million cubic meters. In this area, rainfed cultivation mainly pertains to wheat and barley, accounting for nearly 50% of the cereal cultivation area and 97% of the consumed green water. Only statistics related to consumed seeds and fertilizers were available among other flows (Ministry of Agriculture, Irrigation and Livestock.,Annual Report2021).
Due to the lack of access to statistics on withdrawal wells, the calculation of the two inputs, fuel, and electricity for pumping for agricultural irrigation, was omitted in this section. Irrigated and rainfed wheat and saffron consumed the most energy from these two inputs, while sesame and sugar beet consumed the least. Based on annual reports of Ministry of Agriculture, Irrigation and Livestock In total, 210 thousand hectares of land are under cultivation for agricultural products in the Afghan area within the Harirud River Basin. The region's cultivation area density is high along the Harirud in Herat province. The Afghan section has 32% less cultivated area than the Iranian section and has less diversity in cropping patterns. More than 80% of the cultivated area belongs to the cereal group (wheat, barley, and rice), 5% to orchard products (grapes, apricots, saffron, plums, peaches, apples), 2% to fodder, and about 5% to other products. Regarding other structural inputs, the lack of access to information on machinery operating hours limited the possibility of examining the level of mechanization in the Afghan section.
However, figures related to the labor force show that although Afghanistan has less cultivated area than Iran, an equal number of human resources are active in the production process, indicating less technology use in the agricultural sector compared to the Iranian section. During the local food supply process, the Afghan section produced 650,500 tons of products, 70% less than those produced in the Iranian section. Of the total agricultural production, 13% is lost during the supply and distribution process, with wheat and melon/gourd products, followed by grapes, having the highest share of losses. Figure 7 provides a summary of the food processor in the Afghan section (FAO.,2000-2022).
3.3. Local Energy Supply
3.3.1. Iran
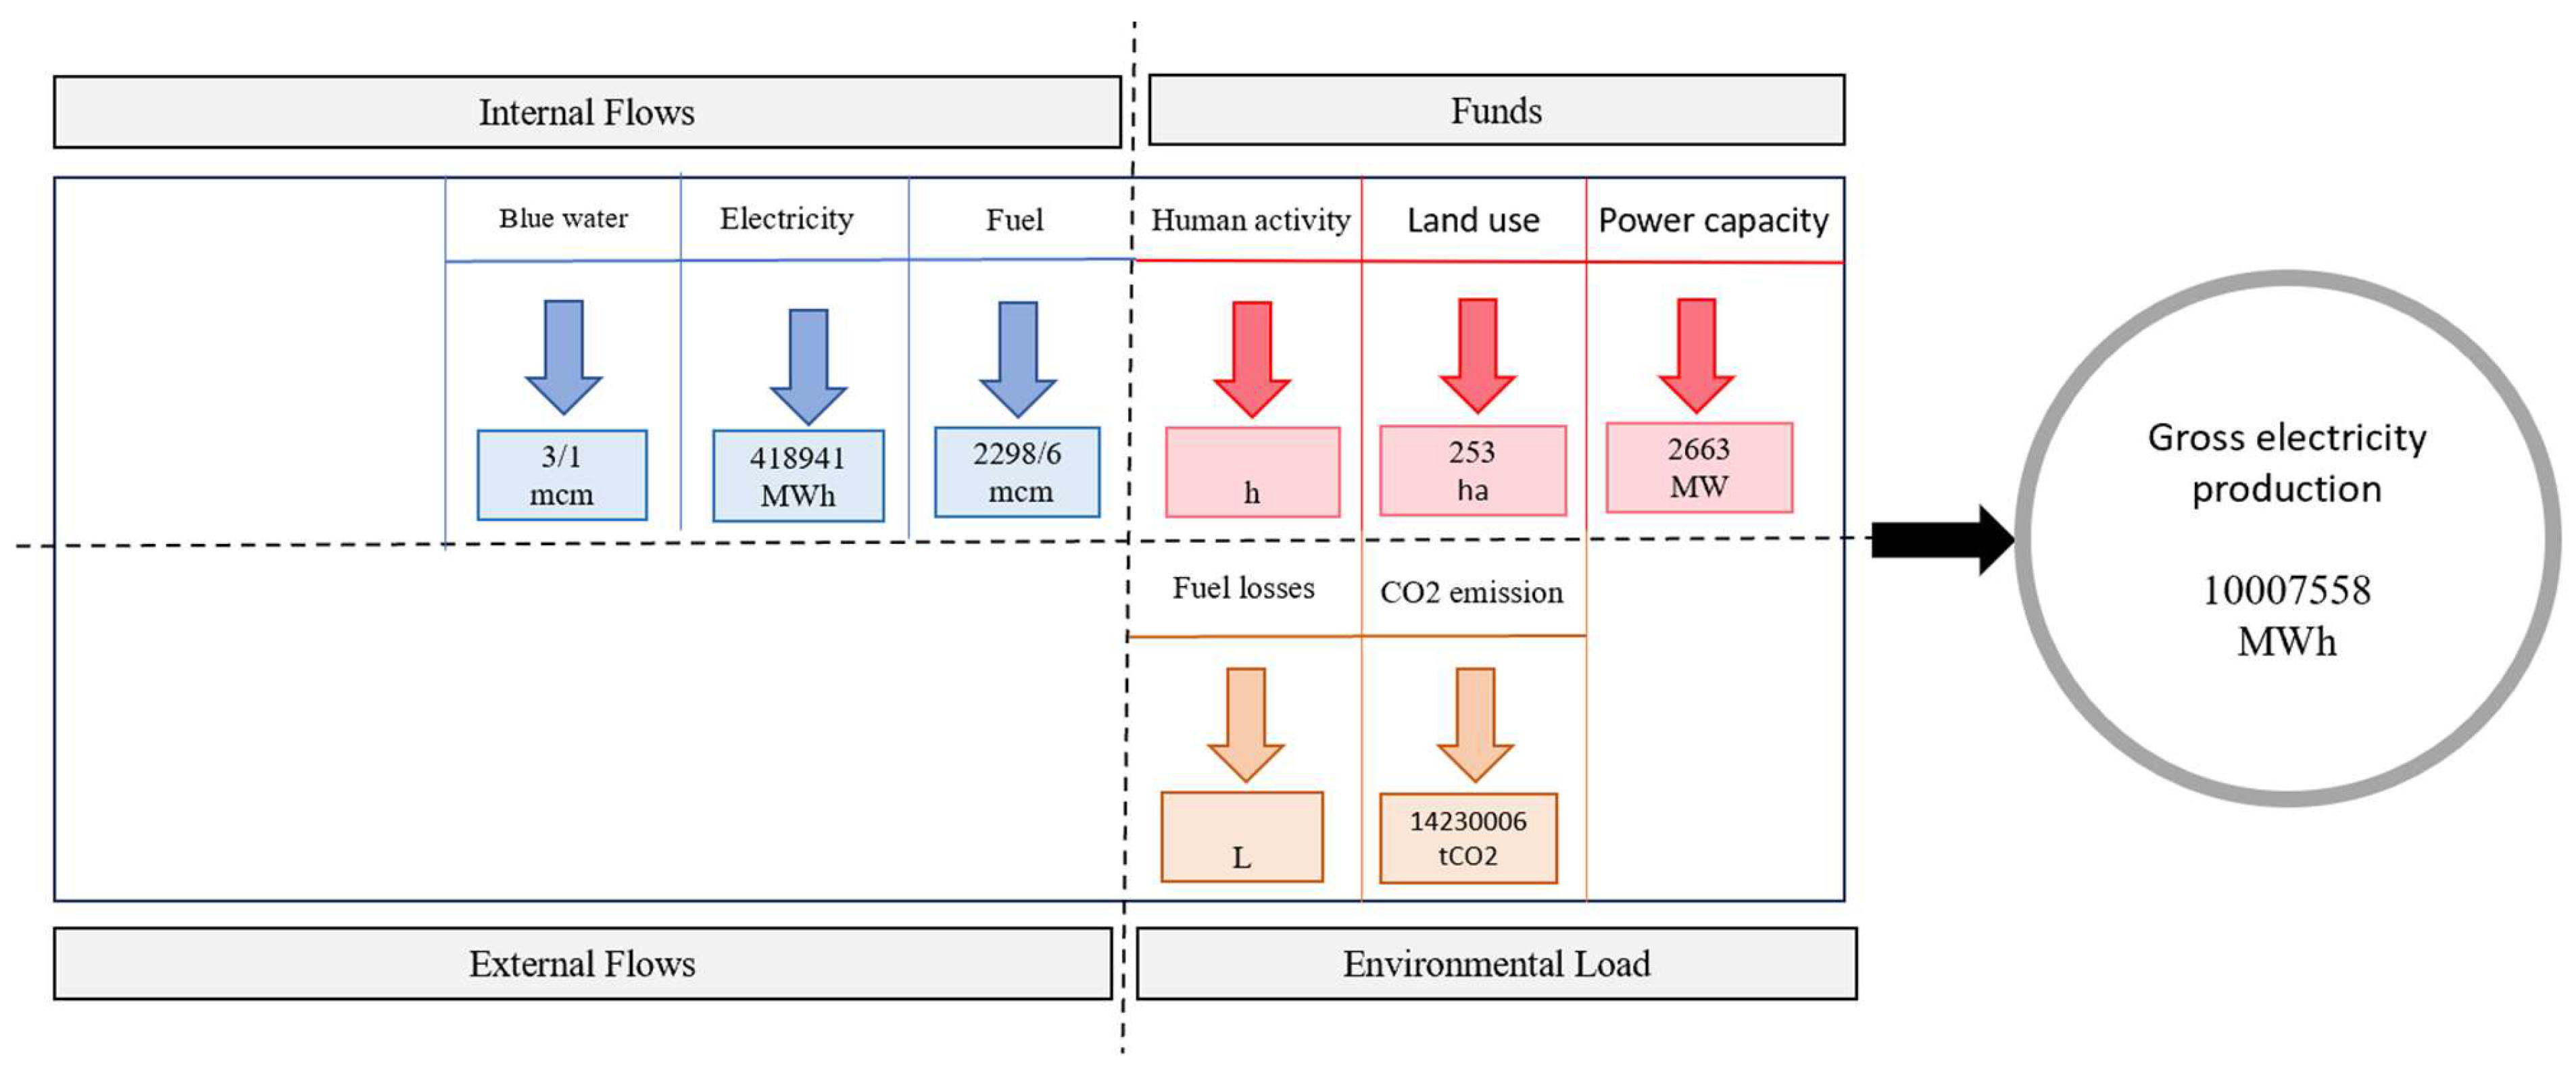
Five non-renewable power plants located in the Iranian section, including Mashhad and Toos thermal power plants, Shariati and Ferdowsi combined cycle power plants, and Shams gas power plant, were selected for the processor analysis. These power plants collectively, to produce 10 million megawatt-hours of electricity (Safai, 2018), annually used 3.11 million cubic meters of water from groundwater sources (Ministry of Industry, Mine and Trade, 2021), and 418,941 megawatt-hours of electricity directly for the consumption of machinery and equipment within the power plants (Safai, 2018). Also, the average fuel consumption of these power plants during the study period included 2,298 million cubic meters of natural gas and less than 0.5 million cubic meters of diesel and mazut from the national energy supply system. A maximum operational capacity of 2,663 megawatts and land use of 253 hectares were considered as capital parameters in the amount of electricity supply (Khorasan Regional Electric Company, 2021). This system effectively produces a high volume of electricity and utilizes significant operational capacity. However, this process requires substantial resource consumption, including fossil fuels, leading to potential environmental impacts with the annual production of 14 million tons of carbon dioxide. Figure 8 shows the performance of the energy supply processor components.
Figure 8.
Sized processor of the functional element local electricity supply (Iran).
3.3.2. Afghanistan
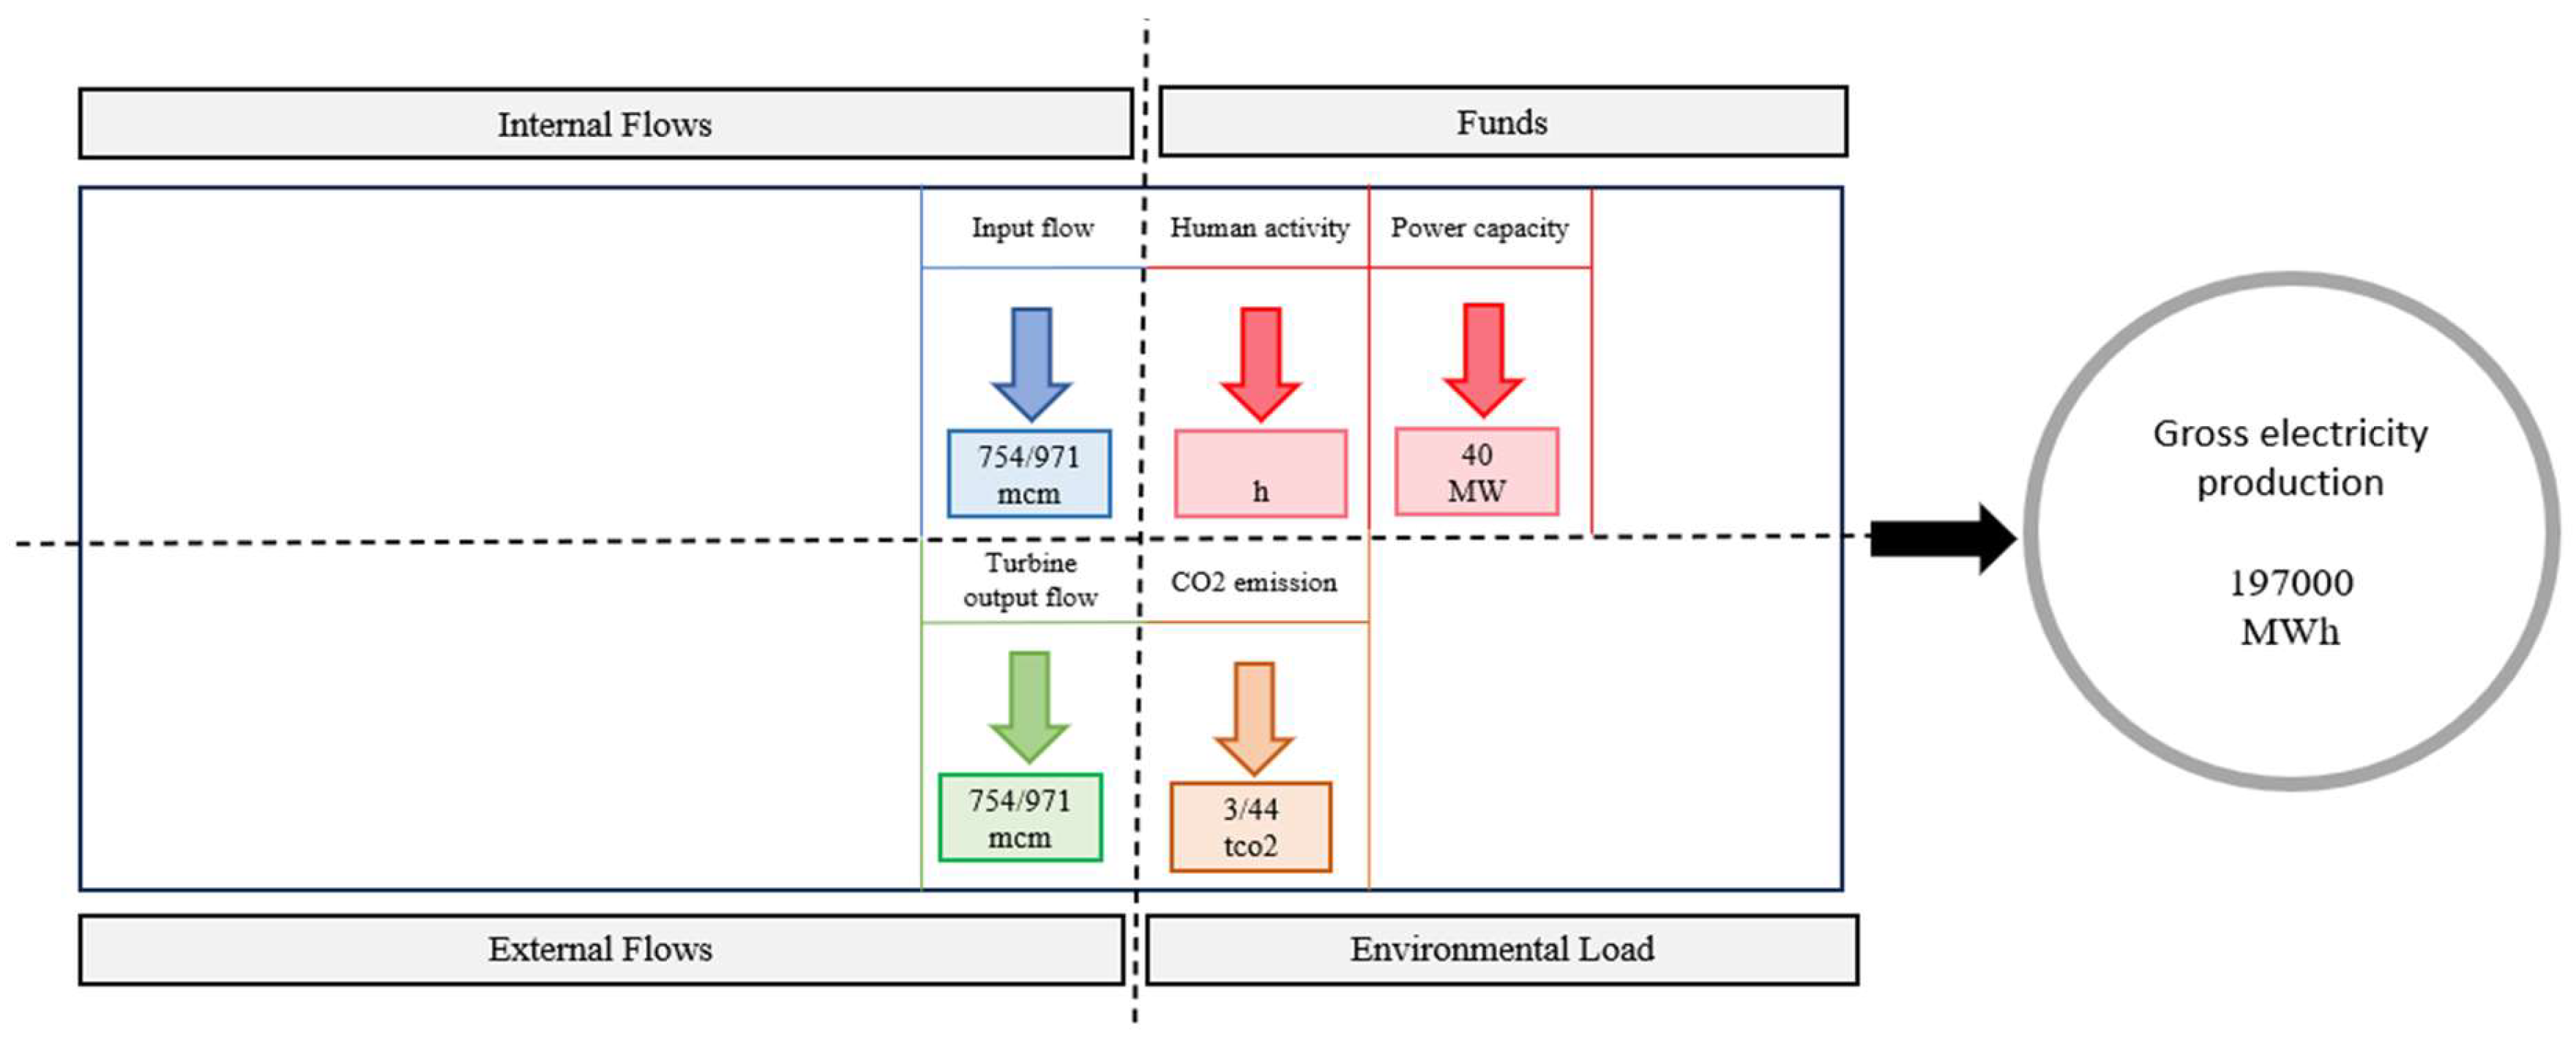
Given that 73% of Afghanistan's electricity is supplied by neighboring countries, the share of local electricity supply is very small. There are no non-renewable power generation plants in Herat province, and the only electricity producer in this region is the Salma Dam hydropower plant, which is also connected to Ghor province via the Chekhcheran substation. Although the Harirud River Basin in Afghanistan has the potential for renewable energy production like photovoltaic and wind, this study, due to lack of information and negligible production amounts (less than 5 and 8 megawatts for each source, respectively), only examined the Salma hydropower plant (Asian Development Bank, 2013).
As shown in the processor in Figure 8, the local electricity supply process is simpler compared to the Iranian section. This power plant has 3 turbines with a maximum capacity of 14 megawatts each, totaling an annual production capacity of 42 megawatts. The total gross energy production of this power plant is 197,000 megawatt-hours per year (GIZ Afghanistan, 2015). To supply this amount of electricity, a water flow through the turbine with a discharge of 23.94 cubic meters per second is required, which amounts to a volume of 755 million cubic meters of water annually. This flow volume, apart from a negligible amount of evaporation from the reservoir surface, is not consumed during the electricity generation process. Therefore, in the processor, the internal water flow does not mean consumption but its necessity in the electricity production process, ultimately serving downstream water needs after passing through the turbine. Although the electricity output of this power plant is negligible and not in balance with the region's needs, it has minimal environmental impacts, and the carbon dioxide produced is related to the production and construction phase of the power plant. Also, the role of land use in the construction of these power plants is minimal.
Figure 8.
Sized processor of the functional element local electricity supply (Afghanistan)
3.4. Water-Food-Energy Nexus System of the Harirud River Basin
The analysis of the water, food, and energy nexus in the Harirud River Basin, covering both Iran and Afghanistan, reveals complex interactions and significant trade relationships between the two countries regarding vital resources. Figure 9 depicts the WEF nexus system of the Harirud River Basin. In this system, the three main components – water, food, and energy – are dynamically interconnected within the two subsystems of Afghanistan and Iran.
In Iran, the energy system has a high production capacity and, in addition to meeting domestic needs, sends surplus energy to Afghanistan and to electricity distribution companies in various provinces (Khorasan Regional Electric Company). Specifically, 727,000 megawatt-hours of electricity produced in Iran are transferred to the Herat region through connection to the Herat power system, which can meet 87% of the gross electricity demand of Herat and Ghor (ADB, 2013). However, approximately 43% of the electricity energy is spent on extracting water from groundwater resources, primarily used for irrigating agricultural lands. Iran's water system depends on receiving flow from the Harirud River to meet part of Mashhad's drinking water needs and Sarakhs' agricultural needs, but during the study period, the inflow contributed a negligible share to Iran's water supply system.
The share of water withdrawn for the energy supply system is very small. Meanwhile, the food supply system accounts for 83% of the total water withdrawal and has a high dependency on water resources. The food system in Iran is the largest consumer of energy and water. Nevertheless, it has high food production levels and supplies 25% of its total production to domestic and foreign markets, including melons/gourds, pistachios, saffron, and, in some years, surplus fruit production. On the other hand, to meet the demand of 1.47 million tons for human consumption and 1.092 million tons for animal feed in the region, it faces shortages of strategic products like cereals, vegetables, pulses, and fodder, resulting in imports of 891 thousand tons of these products from outside the basin.
In Afghanistan, energy supply faces challenges. The Afghan energy supply system is not connected to the national grid and depends on imports; the country supplies electricity from import lines from Iran and Turkmenistan and also meets part of its needs from the Salma hydropower plant, which depends on the region's water resources. High losses in the country's transmission and distribution lines, close to 45%, pose problems for supplying the electricity needs of Ghor province and parts of Herat (ADB, 2013; Afghanistan Ministry of Energy and Water, 2011).
Analysis of water resources shows that Afghanistan, withdrawing 50% less water than Iran, has richer renewable resources, but the outflow from this region contributes only a negligible share. Regarding the food system, over 95% of the total water resource withdrawal in Afghanistan is allocated to the agricultural sector, which is 12% more than in Iran. Although information on energy dependency is unavailable, based on the share of water withdrawn from groundwater resources, it can be concluded that a very small amount of electricity is used for irrigation pumping compared to Iran.
Gross agricultural production in Afghanistan is significantly lower than in Iran, and only 10% of the country's production is exported to neighboring countries, while the region faces serious shortages in meeting local food needs, such as cereals and pulses. Annually, food demand in Afghanistan reaches 533 thousand tons, and food imports play a vital role in ensuring food security in the region. Food imports into the Afghan section include 30% of the main items in household food baskets, such as cereals, vegetables, and pulses, which face local supply shortages. Based on the analyses performed for efficient management of the Harirud River Basin resources, it is recommended that Iran and Afghanistan enhance regional cooperation in developing joint water and energy projects to optimize consumption and reduce losses in electricity infrastructure, especially in Afghanistan. Furthermore, investment in improving agricultural infrastructure and irrigation techniques in areas with poor access to water, particularly in Afghanistan, is essential.
Encouraging farmers to diversify agricultural products can reduce dependency on imports and ensure local food supply. To strengthen the economic situation, facilitating trade networks between the two countries should be promoted to increase Afghanistan's agricultural exports and reduce the food deficit. Finally, conducting training programs for local communities in both countries for better utilization of water, food, and energy resources will help improve resource management and increase food security.
3.5. Assessment of the Status of Some Processor Components Based on Numerical Indicators at the Country Level
Table 4 evaluates the values of key indicators related to the food processor, broken down by agricultural product categories, and for water for the Iranian and Afghan sections.
3.5.1. Food Sector Indicators
Land productivity values show that the average yield of crops and orchard products in Iran is significantly higher than in Afghanistan. Although the yield of cereals, as the most cultivated category in the region, is higher in Iran than in Afghanistan, according to FAO statistics, the yield in the Iranian section is lower than national values, while in the Afghan section, this value is higher. The agricultural water productivity index, indicating the crop yield per total water consumed, shows that lower values signify negligible product generated per unit of water consumed. According to the values of this index presented in Table 4, water productivity in the agricultural sector for all product categories is better in Iran than in Afghanistan. However, these values are significantly lower than the standards of countries with high technology in irrigation systems. Also, according to the results of the blue water use efficiency index, the agricultural sector in Iran has a greater dependency on surface and groundwater resources compared to Afghanistan. In Iran, melons/gourds and vegetables, due to their high irrigation needs and often being cultivated under irrigation, have a high dependency on the region's water resources.
3.5.2. Water Sector Indicators
Based on the calculations performed, the Falken mark indicator is estimated to be less than 500 cubic meters per capita, indicating that Iran is facing severe water stress in the region, and the renewable water resources are unable to meet the basic needs of the resident population. Furthermore, estimations of the water withdrawal index also point to severe water stress regarding withdrawal from water resources. Severe water stress in the region causes reduced agricultural production and pressure on groundwater resources, increasing the region's dependency on importing strategic products (virtual water import) from other areas. Regarding the groundwater withdrawal index, 66% of withdrawals in the Iranian region within the Harirud River Basin were from groundwater sources. Therefore, based on global standards, a value exceeding 50% indicates high and unsustainable dependency on groundwater resources. Given that the agricultural sector is the largest consumer of groundwater in Iran, continuing this trend could reduce agricultural productivity and cause a decrease in agricultural product output.
The water withdrawal index in the Afghan section is estimated at 45%. This index indicates that Afghanistan is under water stress. Also, the food water scarcity index, with a value of 45% (0.434 in table, discrepancy in text), indicates that over 40% of the population in the Afghan section faces food scarcity (indicator meaning interpreted differently in text vs. table description), and the region's needs must be compensated through imports from other areas. Meanwhile, Afghanistan's water stress level is still lower than Iran's. The groundwater withdrawal index for the region is calculated at 0.18. This value indicates Afghanistan's low dependency on groundwater resources. In fact, most agricultural needs in Afghanistan are met by surface water sources, thus exerting little pressure on the groundwater resources of this section. Also, the Falken mark indicator in the Afghan section is estimated at 1011 cubic meters per capita, indicating that the Afghan section is on the threshold of water scarcity.
4. Discussion
This investigation utilized the Multi-Scale Integrated Analysis of Societal and Ecosystem Metabolism (MUSIASEM) framework to conduct a quantitative assessment of the Water-Energy-Food (WEF) nexus within the distinct national sections of the transboundary Harirud River Basin, covering both Iranian and Afghan territories. The derived results clearly demonstrate significant interdependencies among the WEF sectors, while also highlighting specific vulnerabilities unique to each nation's system. These findings offer valuable quantitative support for and elaboration upon existing conceptual models addressing nexus complexities, particularly pertinent to managing water resources in arid and semi-arid transboundary contexts.
The quantitative analysis lends strong credence to the working hypothesis that the WEF systems operating within the Harirud basin exhibit not only pronounced interconnectedness but also face considerable sustainability pressures, which are further amplified by the basin's transboundary nature. Within the Iranian portion of the basin, our assessment identified a critical over-reliance on groundwater resources. This is particularly acute in the agricultural sector, which accounts for the predominant share (83%) of total water abstraction. This heavy groundwater dependence necessitates substantial energy expenditure for pumping operations, consuming approximately 43% of locally generated electricity. This establishes a resource-intensive feedback loop connecting water extraction, energy consumption, and agricultural production. Such dynamics resonate with observations from other water-limited regions where the energy requirements for water supply represent a significant operational and economic factor (e.g., Sarvari et al., 2021; Nasrollahi et al., 2022). Indicators of severe water stress, including a Falken mark Water Stress Index value below 500 m³/capita/year and a Water Withdrawal Index reaching 0.875, corroborate the precarious hydrological balance previously reported (Regional Water Company of Khorasan Razavi, 2023) and underscore the unsustainable nature of current groundwater abstraction regimes. Although Iran possesses considerable domestic energy generation capacity, its primary reliance on fossil fuels introduces significant environmental externalities, notably high CO2 emissions, presenting a stark contrast to Afghanistan's energy profile characterized by hydropower and substantial imports.
In the Afghan section of the basin, the MUSIASEM analysis revealed a different vulnerability profile. While current per capita water stress indicators (Falken mark ~1011 m³/capita/year; WWI ~0.456) suggest a less critical situation compared to Iran, Afghanistan confronts substantial deficits in food and energy security. Agricultural productivity lags significantly behind Iran, leading to a high dependency on food imports—a circumstance frequently observed in developing nations navigating post-conflict reconstruction amidst significant hydro-climatic variability (Antonelli and Tamea, 2015). The lower energy intensity observed in Afghanistan's agricultural sector points towards less mechanization but may also signify inherent constraints limiting potential productivity enhancements. A significant vulnerability stems from the nation's heavy reliance on imported energy (estimated at 73% nationally, with similar dependency reflected in the basin). Furthermore, the dependence of existing domestic generation capacity, principally the Salma Dam, on the highly variable flows of the Harirud River introduces considerable energy security risks. These risks are sensitive not only to natural hydrological fluctuations but also to upstream water resource management decisions and potentially downstream demands. Exacerbating these energy challenges are high electricity transmission losses, reportedly around 45%.
Placing these findings within the wider context of transboundary water resource management, this study quantitatively illustrates how internal pressures within each nation's WEF nexus can intensify cross-border resource tensions. For Iran, the combination of acute water scarcity and energy-intensive groundwater exploitation elevates the political and economic stakes associated with securing reliable surface water inflows from the Harirud. Conversely, Afghanistan's national development goals, which include prospective upstream water infrastructure developments such as the Pashdan dam (Nagheeby et al., 2019), possess the potential to substantially modify downstream flow regimes. Such alterations could adversely affect not only Iran's surface water availability but also compromise the operational efficiency and energy output of Afghanistan's own Salma Dam. Our analysis provides quantitative substantiation for the complex, interacting feedback mechanisms often described in qualitative nexus studies (e.g., Aslani et al., 2023) and transboundary water analyses (e.g., Shoghi Javan et al., 2018). It demonstrates empirically how interventions or trends within a single sector (e.g., energy infrastructure investment, agricultural expansion) within one riparian state can propagate cascading impacts across multiple sectors and international borders.
The policy and governance implications arising from this assessment are significant. The results argue compellingly for a paradigm shift away from conventional, sector-isolated management approaches (such as traditional Integrated Water Resources Management (IWRM), critiqued in the introduction) towards more holistic, integrated WEF nexus frameworks, consistent with evolving international best practice (e.g., Rosell et al., 2023). For the Iranian basin section, policy interventions must prioritize enhancing water-use and energy efficiency within irrigated agriculture to mitigate unsustainable pressure on groundwater aquifers. For Afghanistan, strategic priorities should include improving agricultural water productivity, upgrading energy infrastructure (specifically addressing transmission losses and diversifying supply sources), and strengthening overall water resource management capacity. Critically, the findings highlight the absolute necessity for effective transboundary cooperation mechanisms. Establishing robust platforms for hydro-meteorological data exchange, collaborative infrastructure planning that explicitly considers nexus trade-offs, and equitable benefit-sharing arrangements concerning the Harirud's water resources are indispensable for mitigating potential conflicts and fostering sustainable, basin-wide development. This echoes persistent calls for enhanced regional cooperation in managing shared river basins globally (Saidi et al., 2017). Methodologies like MUSIASEM, by offering a standardized quantitative lexicon, hold potential as tools to underpin and facilitate such vital transboundary dialogues.
It is important, however, to acknowledge the limitations inherent in this study, chief among them being data scarcity and resolution, particularly for the Afghan portion of the basin. Future research endeavors should focus intently on addressing these data deficiencies, especially concerning detailed groundwater abstraction rates, sector-specific energy consumption in agriculture, and post-harvest food losses within Afghanistan. Building upon the current static, metabolic assessment, subsequent work could fruitfully employ dynamic simulation models (e.g., system dynamics, agent-based modeling). Such approaches would permit exploration of the longer-term trajectories of the basin's WEF nexus under various plausible future scenarios, encompassing climate change impacts (as explored by Parsa et al., 2024), demographic shifts, technological evolution, and diverse policy interventions (including dam construction scenarios, irrigation modernization programs, and energy pricing reforms). A more comprehensive understanding would be achieved by more deeply integrating socio-economic variables, encompassing governance structures, political economy dynamics, and livelihood impacts. Furthermore, broadening the environmental assessment scope beyond CO2 emissions to explicitly include water quality degradation and land use/land cover change impacts would add significant value. Such future research directions can assist in identifying more robust and equitable pathways—and navigating the inherent trade-offs—towards achieving sustainable water, food, and energy security within the complex geopolitical and hydrological setting of the Harirud River Basin.
5. Conclusion
This study utilized the MUSIASEM framework based on the nexus approach to analyze the interdependencies and vulnerabilities of the three functional sectors of local water, food, and energy supply, separately for the Iranian and Afghan sections, and the cross-border interactions through trade in the Harirud River Basin. The results showed that in the Iranian territory, the agricultural sector heavily relies on groundwater resources, leading to over-extraction and pressure on these resources.
Continuing this trend, besides environmental impacts, will cause a severe decline in groundwater levels and increase the depth of exploitation wells. This is while energy consumption for water pumping has already been significant. Furthermore, the transboundary nature of the Harirud River basin is crucial for the sustainability and security of water resources in the Iranian section, as Iran receives a limited share of the river flow, increasing pressure on groundwater resources. Considering that the water supply for the metropolis of Mashhad has become more dependent on the inflow of the Harirud River compared to the past, a significant reduction in this flow could lead to a severe deficit in meeting water demands. Additionally, the Mashhad plain is classified as a restricted plain with limitations on water extraction. Using groundwater to compensate for this shortfall seriously threatens the sustainability of water resources. Consequently, this issue could escalate into a serious crisis in the future.
While Iran has performed well in electricity production, the reliance on non-renewable fossil fuels for energy production and the consequent emission of carbon dioxide will lead to impacts such as air pollution and increased concentration of greenhouse gases.
While productive, the Iranian section's food system shows significant dependence on water and energy and faces shortages in some main products, necessitating imports into the region. In Afghanistan, the energy sector's dependence on imports and the limited capacity of the local hydropower system pose serious challenges to energy security vulnerability.
The agricultural sector, while heavily dependent on water resources, shows lower energy consumption than Iran, indicating a less mechanized agricultural system. Food production is significantly lower than in Iran, resulting in substantial food imports to meet domestic demand.
In the Afghan section, there is a need to increase agricultural land and water productivity and educate farmers on fertilization, pest control, seed management, and irrigation, especially for strategic crops like cereals. Uncertainties arising from limited data access, assumptions, and estimation of some values in the processors, especially in the Afghan section, are undeniable in this study and could affect the accuracy of the results.
Despite these limitations, this study provides valuable insights into the interconnectedness of the water, food, and energy nexus in the Harirud river basin. The findings help propose strategies for efficient management and reduction of resource vulnerability in both countries and identify areas for cooperation towards improving the sustainability of the Harirud River Basin resources.
References
- Abdelradi, F., & Serra, T. (2015).Food–energy nexus in Europe: Price volatility approach. Energy Economics. 48, 157–167. [CrossRef]
- Ahmadi, A.W., Heravi, A.N.(2023). A Perspective on the Water Resources of Harirud Marghab and Investigation of the Quality of Groundwater in Rural Areas of Herat Province. International Journal of Sustainability in Energy and Environment,1(1).
- Almulla, Y., Ramos, E., Gardumi, F., & Howells, M., (2017). Integrated resource assessment of the Drina River Basin, EGU General Assembly, 19, 15215.
- Al-Saidi, M., Elagib, N., Ribbe, L., Schellenberg, T., Roach, E., & Oezhan, D. (2017). Water-Energy-Food Security Nexus in the Eastern Nile Basin: Assessing the Potential of Transboundary Regional Cooperation. In book water-energy-food nexus: Principles and Practices. 10, 103–116. [CrossRef]
- Antonelli, M., & Tamea, S. (2015). Food-water security and virtual water trade in the Middle East and North Africa. International Journal of Water Resources Development, 31(3), 326–342. [CrossRef]
- An, D. (2022). Interactions in water-energy-food security nexus: A case study of South Korea. Frontiers in Water, 4, 943053. [CrossRef]
- Aslani, M., Monem, M. J., & Bagheri, A. (2023). Development of the Conceptual Model for Water, Food and Energy Chain (Nexus) in Water Management in Irrigation Networks Using Systems Dynamics Approach. J Watershed Manage Res, 14(28), 16–36. (In Persian). [CrossRef]
- Bakhshi, R. (2023). Environmental assessment of renewable and non-renewable power plants for electricity generation from the perspective of CO2 emission. Iranian Energy Economics. (In Persian).
- Conway, D., Archer, E., Krueger, E., & Landman, W. A. (2015). Climate and Southern Africa's Water–Energy–Food Nexus.” Nature Climate Change, 5(9), 837–846. [CrossRef]
- Daher, B.T., & Mohtar, R.H. (2015).Water–Energy–Food (WEF) Nexus Tool 2.0: Guiding integrative resource planning and decision-making. Journal of Water International,40, 748–771. [CrossRef]
- El-Gafy, 1. I. (2017). Water–food–energy nexus index: analysis of water–energy–food nexus of crop’s production system applying the indicators approach. Applied Water Science, 7, 2857–2868. [CrossRef]
- Fengping, w., Xia, X., Qianwen, Y., Xiangnan, C., Yue, Z. (2022). Analysis on Management Policies on Water Quantity Conflict in Transboundary Rivers Embedded with Virtual Water—Using Ili River as the Case. Sustainability, 14(15), 9406. [CrossRef]
- Food and Agriculture Organization (FAO). Available online: https://www.fao.org/faostat.
- Giampietro, M., Renner, A., & Benelcazar, J. C. (2022). An accounting framework recognizing the complexity of the nexus. Handbook on the Water-Food-Energy Nexus, 18, 329–345. [CrossRef]
- Ghadami Firouzabadi, A., Dehghani Sanij, H., Khoshravesh, M., & Seyedan, S. M. (2015). Evaluation of Energy Efficiency and Water Consumption in Gasoline Pumping Stations. Journal of Water Research in Agriculture, 29(3), 367–377. (In Persian). [CrossRef]
- Ghosh, B., Gubareva, M., Ghosh, A., Paparas, D., & Vo, X.V. (2024). Food, energy, and water nexus: a study on interconnectedness and trade-offs. Energy Econ, 133, 107521. [CrossRef]
- Ghodrati, S., Kargari, N., Farsad, F., Javid, A. H., & Kani, A. R. (2021). Investigation of Water Consumption with Water and Energy Nexus Approach in Iranian Combined Cycle Power Plants. Journal of Water and Sustainable Development, 8(1), 11–18. (In Persian).
- Kargari, N., & Mastouri, R. Comparison of GHG Emission in Different Kinds of Power Plants by LCA Approach. (2010). Iranian Journal of Energy, 13(2), 67–78. (In Persian).
- Karnib, A. (2017). A Quantitative Assessment Framework for Water, Energy and Food Nexus. Computational Water, Energy, Environmental.6(1), 11–23. [CrossRef]
- Li, J., Cui, J., Sui, P., Yue, Sh., Yang, J., Lv, Z., Wang, D., Chen, X., Sun, B., Ron, M., & Chen, Y. (2021).Valuing the synergy in the water-energy-food nexus for cropping systems: a case in the North China Plain. Ecological Indicators.127, 107741. [CrossRef]
- Ministry of Energy & Water, Islamic Republic of Afghanistan. No Data. Final Report: Institutional Capacity Assessment of Vocational Training for Operation and Maintenance in the Energy Sector of Afghanistan. Available online: https://energypedia.info/images/0/0f/VTC_Assessment_Report_Final.pdf.
- Motaghi, A., kavianirad, M., Zarghani, S. H., & Sadrania, H. (2018). Identifying and analyzing the factors affecting the hydropolitical relations of Iran and Afghanistan in the Harirud Basin. Journal of Subcontinent Researches, 10(34), 235–254. (In Persian).
- Nasrollahi, Z., Dehghan, F., & Operajuneghani, E. Evaluating the Energy - Water Nexus in the Economic Sectors of Isfahan and Yazd Based on Two-Region Input - Output Analysis. (2022). QJER, 22(1), 53–82. (In Persian).
- Nazari Mejdar, H., Moridi, A., & Yazdi, J., & KhazaiePoul, A. Sustainability Outlook of Domestic and Agricultural Demand of Dusti Dam Considering Climate change Scenarios and Impact of Salma Dam. (2019). Iran-Water Resources Research, 15(3), 17–32. (In Persian).
- Neifer, R. (2013). Islamic Republic of Afghanistan: Power Sector Master Plan: Sovereign Project. Retrieved from Asian Development Bank. Available online: https://www.adb.org/projects/43497-012/main.
- Parsa, S., Zarrin, A., Mofidi, A., & Dadashi-Roudbari, A. (2024). The Impact of Climate Change on Temperature and Precipitation in Afghanistan with Emphasis on the Helmand and Hariroud Basins. Journal of Water and Sustainable Development, 11(1), 35–48. (In Persian). [CrossRef]
- Report of GIZ Afghanistam, Submitted to Ministry of Energy & Water, Islamic Republic of Afghanistan. Institutional Capacity Assessment of Vocational Training for Operation and Maintenance in the Energy Sector of Afghanistan.
- Rosell, A.G., Arfa, I., & Blanco, M. (2023). Introducing GoNEXUS SEF: a solutions evaluation framework for the joint governance of water, energy, and food resources. Sustainability Science, 18, 1683–1703. [CrossRef]
- Safaee, V., Pourmohamad, Y., & Davari, K. (2020). Integrated Approach of Water, Energy and Food in Water Resources Management (Case Study: Mashhad Catchment). Iranian Journal of Irrigation and Drainage, 14(5), 1708–1721. (In Persian).
- Saffi, M., Javid, H. (2013). Water Resource Potential, Quality Proplems, Challenges and Solutions in Afghanistan: Research Report. Retrieved from DACAAR Main Office Kabul. Available online: https://www.dacaar.org.
- Schlemm, A., Mulligan, M., Tang, T., Agramont, A., Namugize, J., Malombala, E., & Griensven, A. V. (2024). Developing meaningful water-energy-food-environment (WEFE) nexus indicators with stakeholders: An Upper White Nile case study. Science of the Total Environment.931, 172839. [CrossRef]
- Shoghi, J. A., & Ahmadi, A. (2018). A Stability Analysis of Treaties in Transboundary Rivers Using Game Theory, A Case Study: Harirud River. Iran-Water Resources Research, 14(4), 102–113. (In Persian).
- Tovar, T. S., Suarez, B. P., Musicki, A., Bencomo, J. F., Cabello, V., & Giampietro, M. (2019). Structuring an integrated water-energy-food nexus assessment of a local wind energy desalination system for irrigation. Science of the Total Environment, 689(1), 945057. [CrossRef]
- Uhl, V. W., Uhl, B., Associates, R. (2003). Stream: An Overview of Groundwater Resources and Challenges. Washington Crossing, PA, USA: Academic Press.
- White, D. J., Hubacek, k., Kuishuang, F., Laxiang, S., & Meng, B. (2018). The Water-Energy-Food Nexus in East Asia: A tele-connected value chain analysis using inter-regional input-output analysis. Applied Energy, 210, 102–113. [CrossRef]
- Xiaoa, Z., Yaob, M., Tang, X., & Su, L. (2019). Identifying critical supply chains: An input-output analysis for Food-Energy-Water Nexus in China. Ecological modelling. 392, 31–37. [CrossRef]
Figure 1.
Location of the Harirud River Basin, Rivers, and Important Dams.
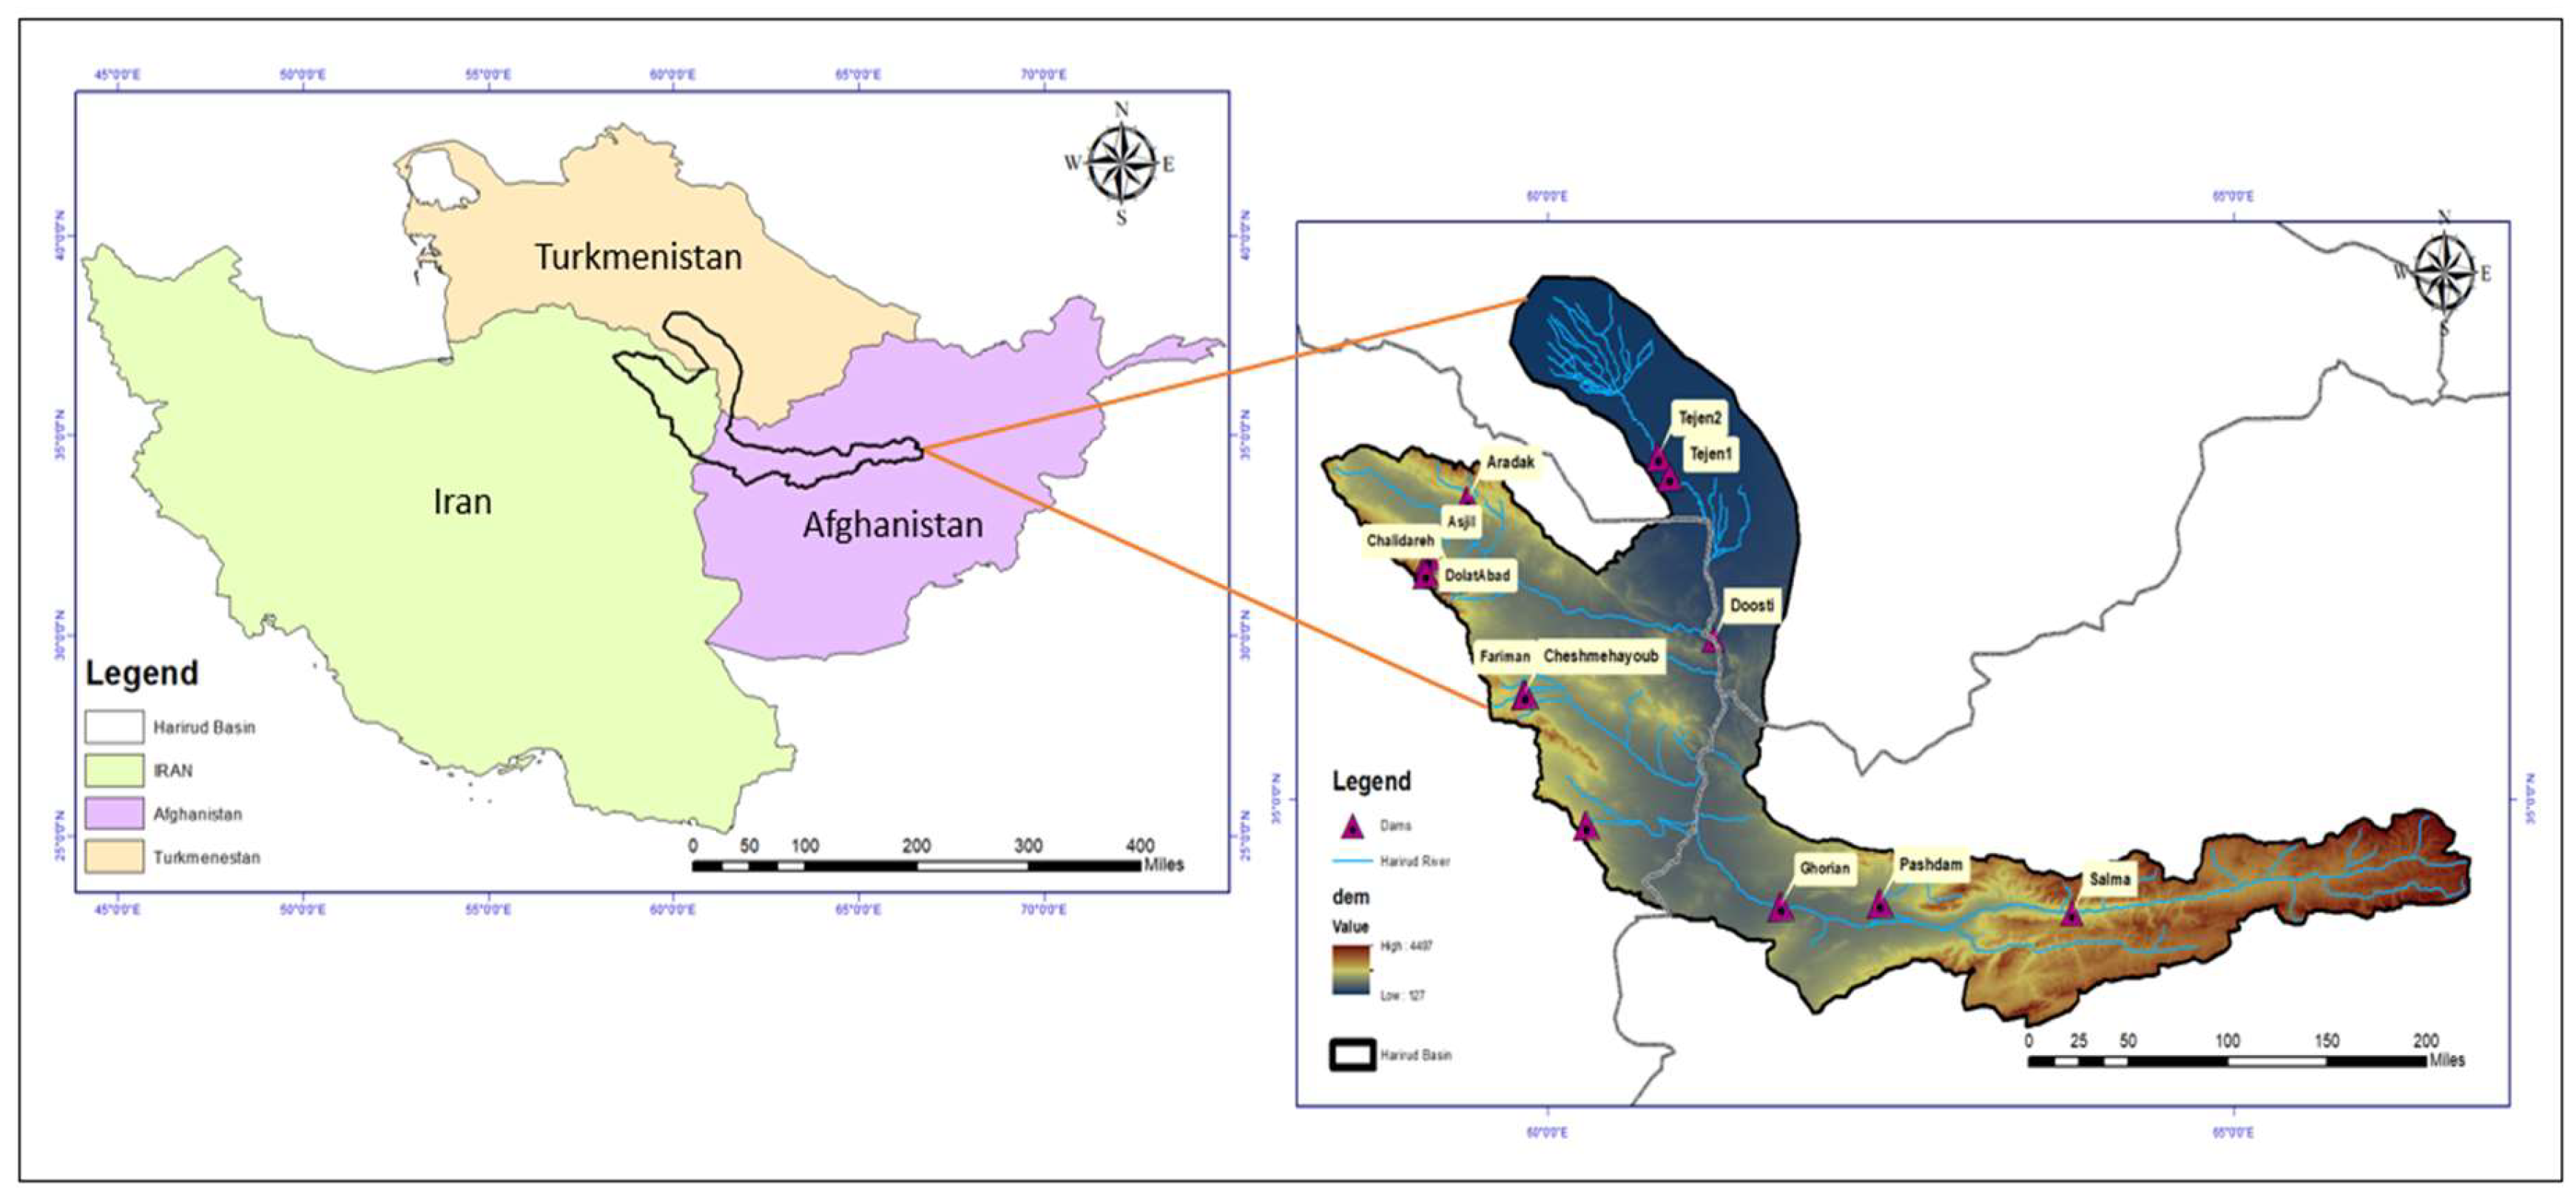
Figure 2.
Graphical representation of processor’s components.
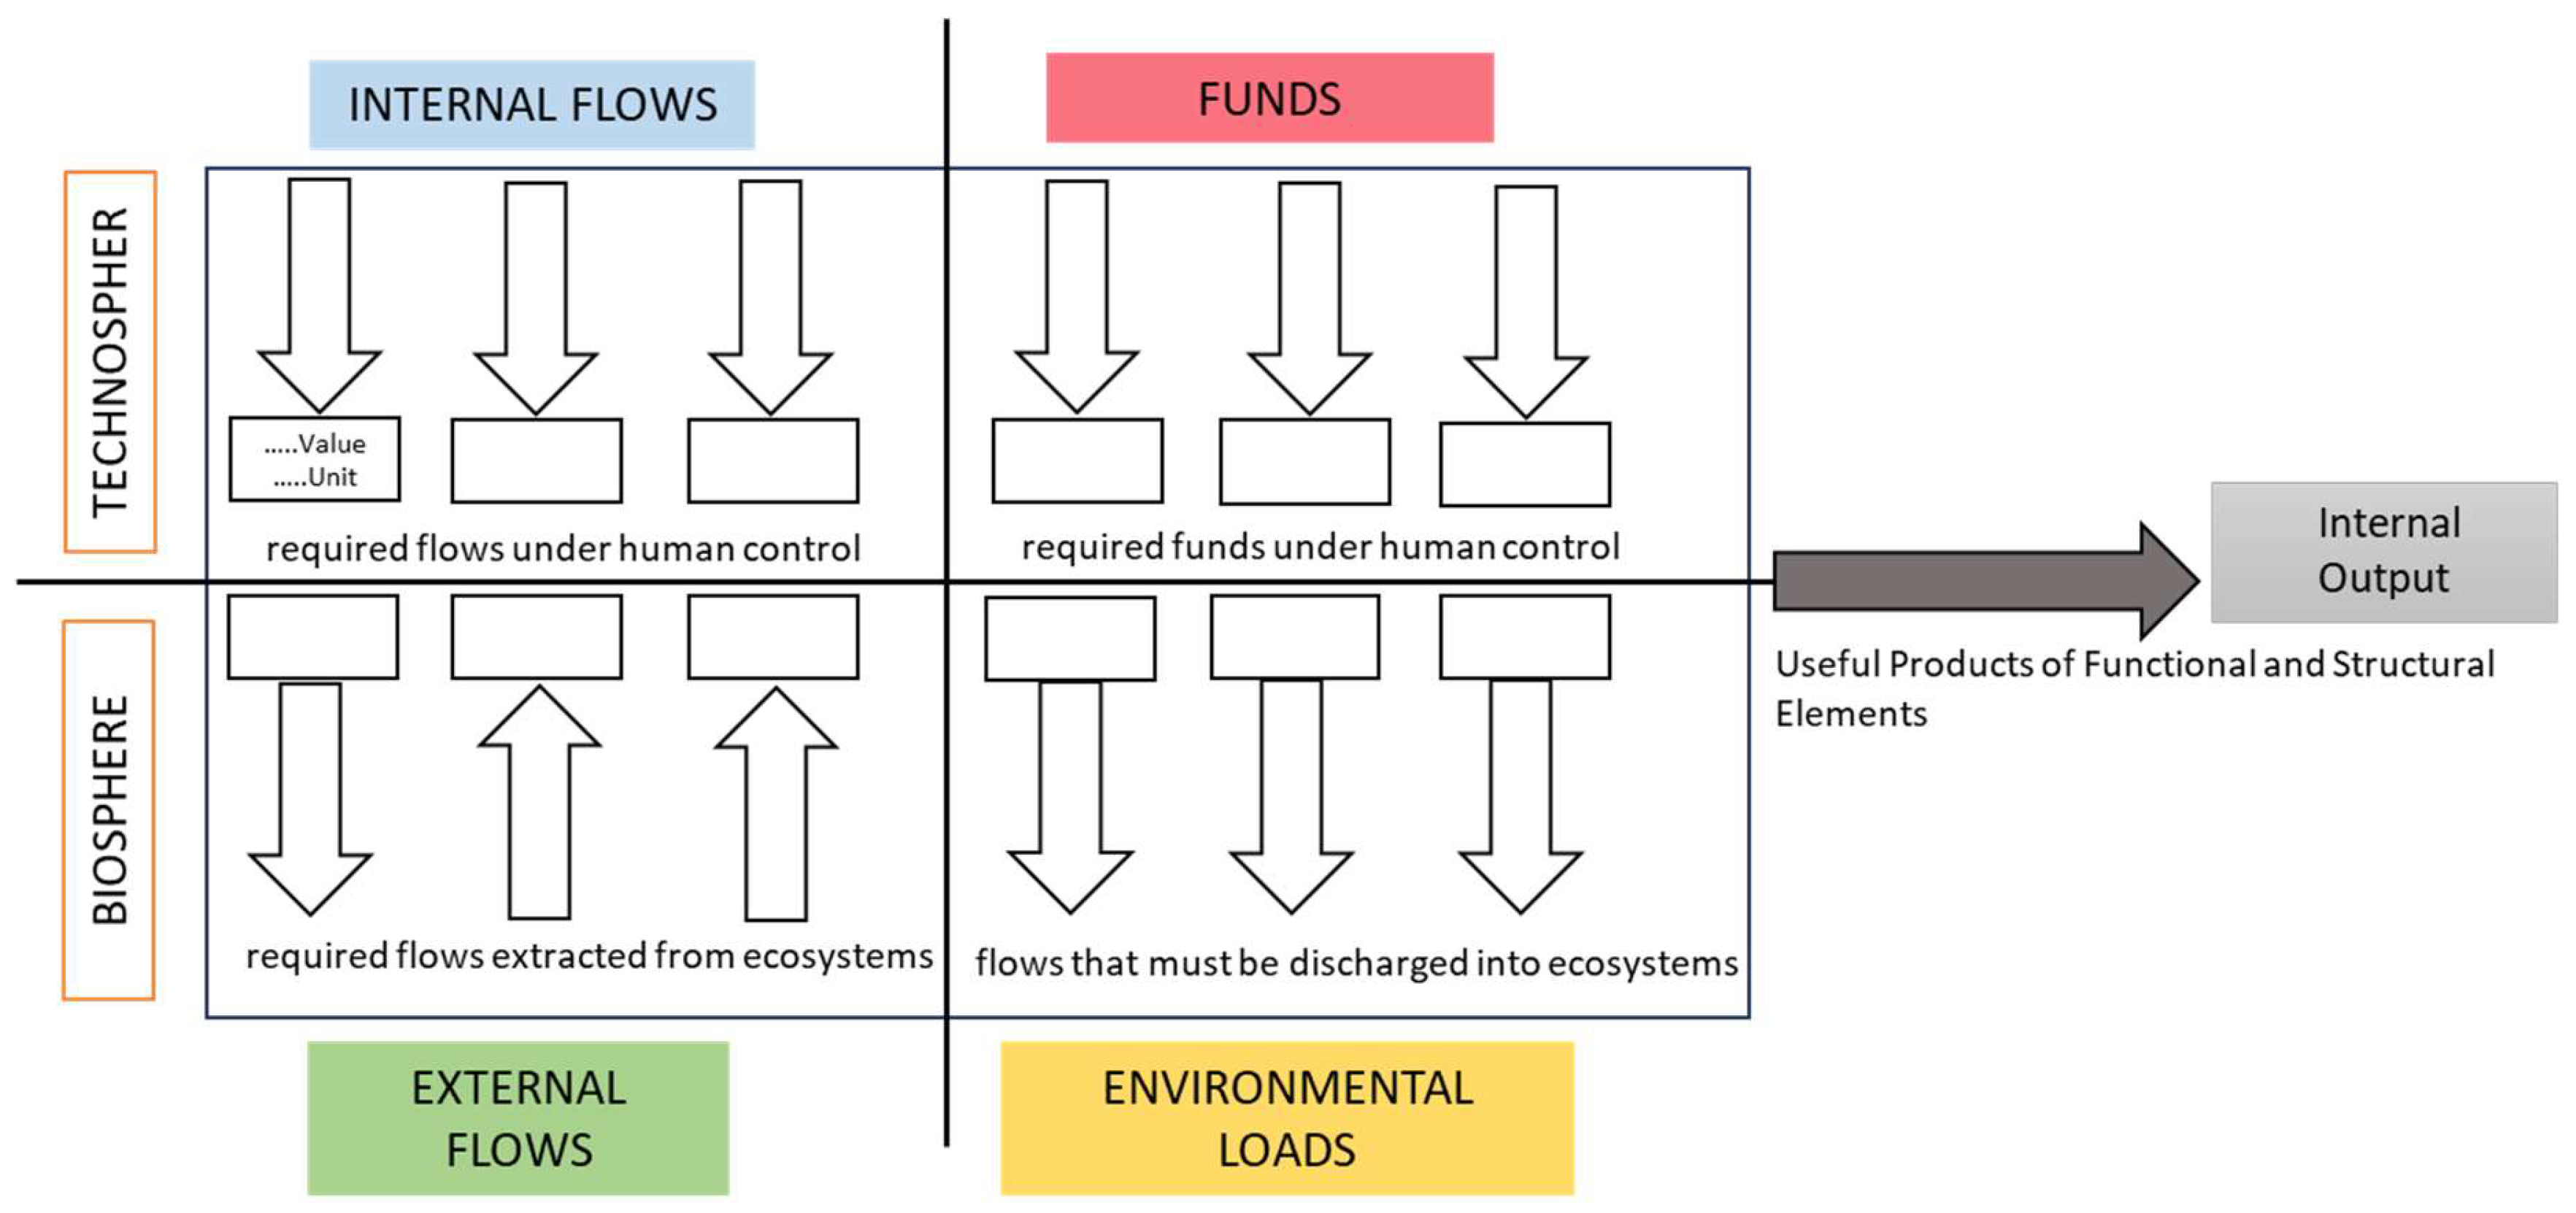
Figure 3.
Performance of a metabolic system under WFE NEXUS approach.
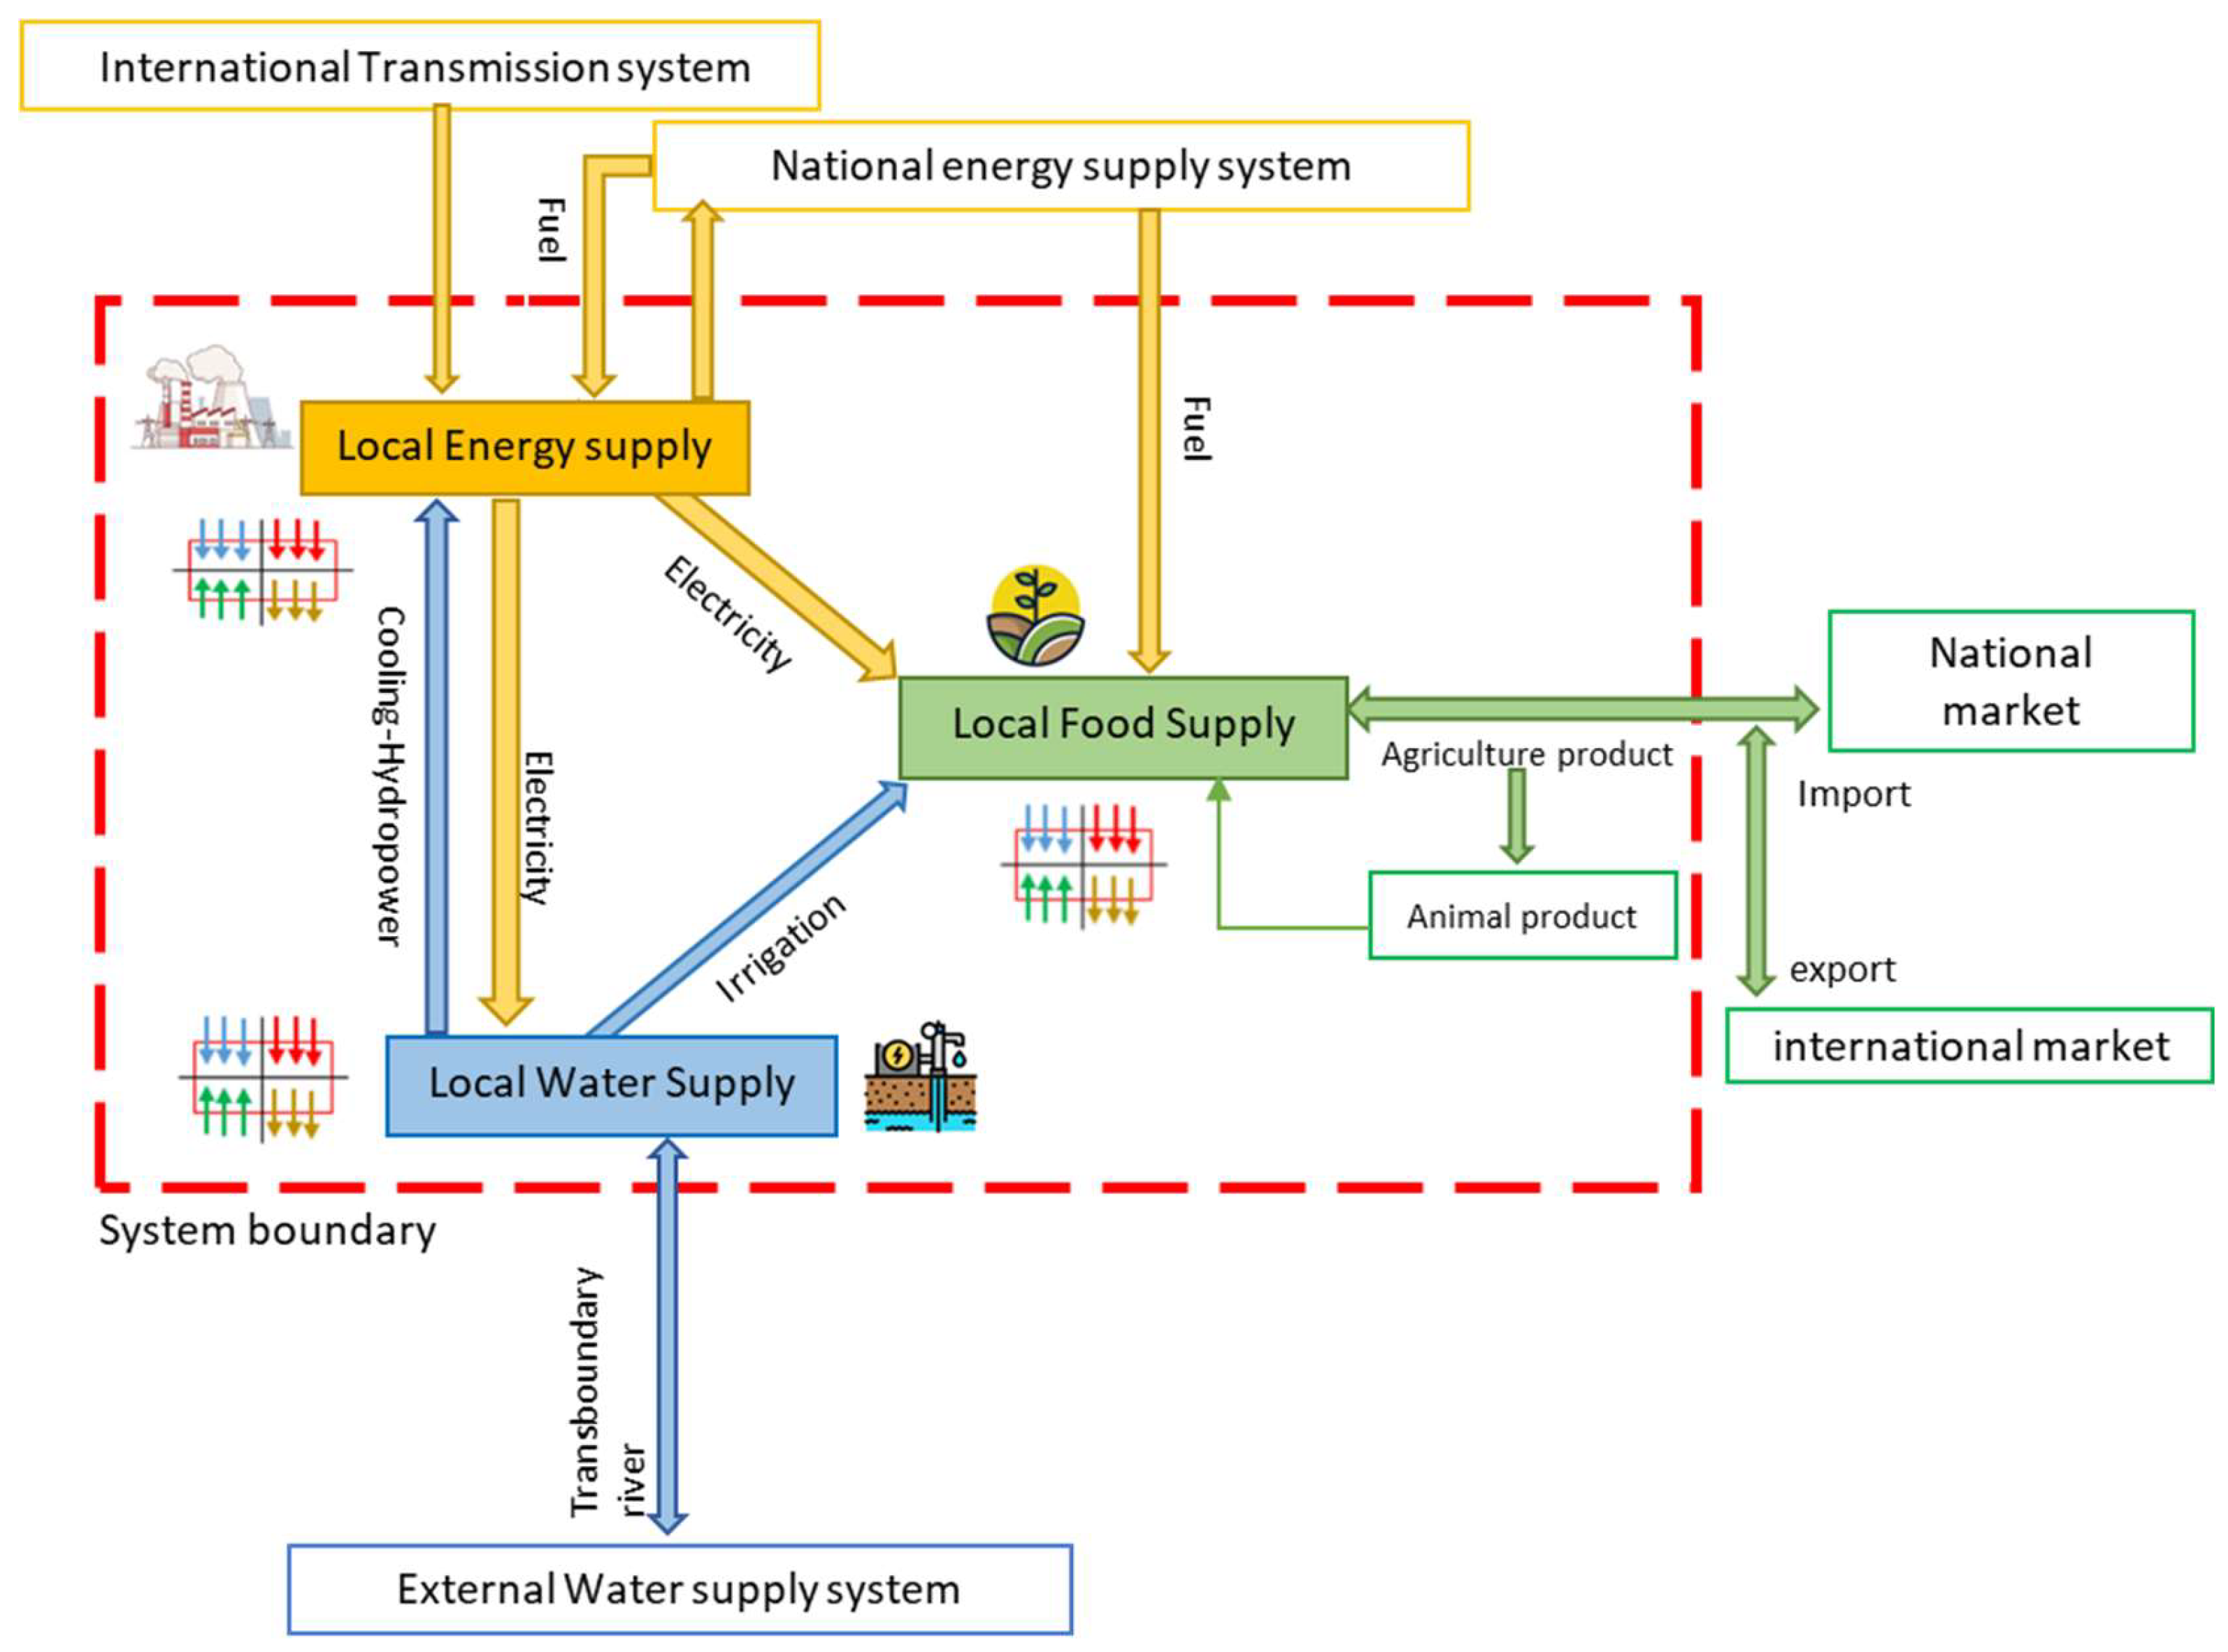
Figure 4.
Sized processor of the functional element local water withdrawal (Iran).
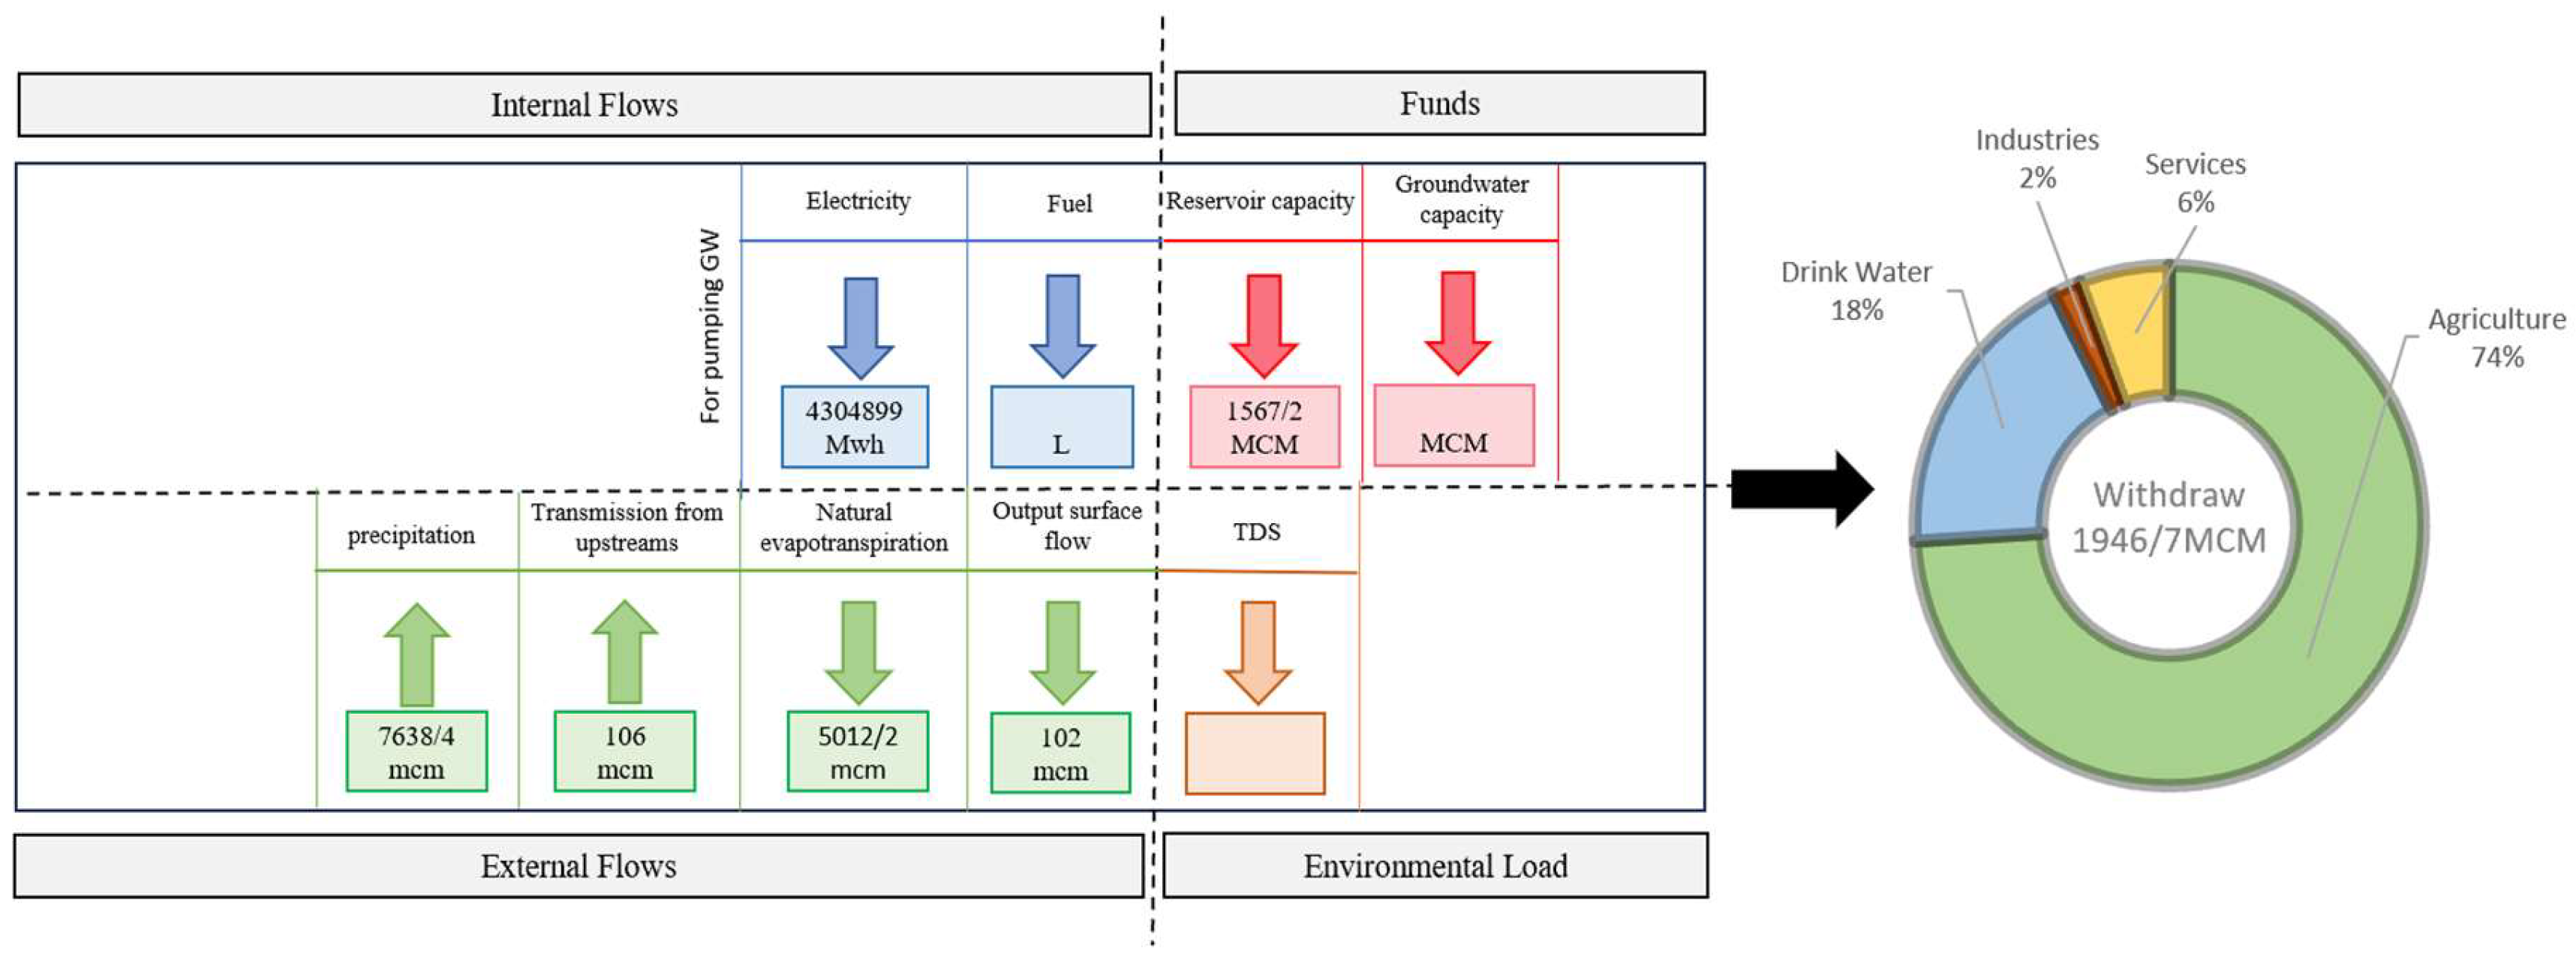
Figure 5.
Sized processor of the functional element local water withdrawal (Afghanistan).
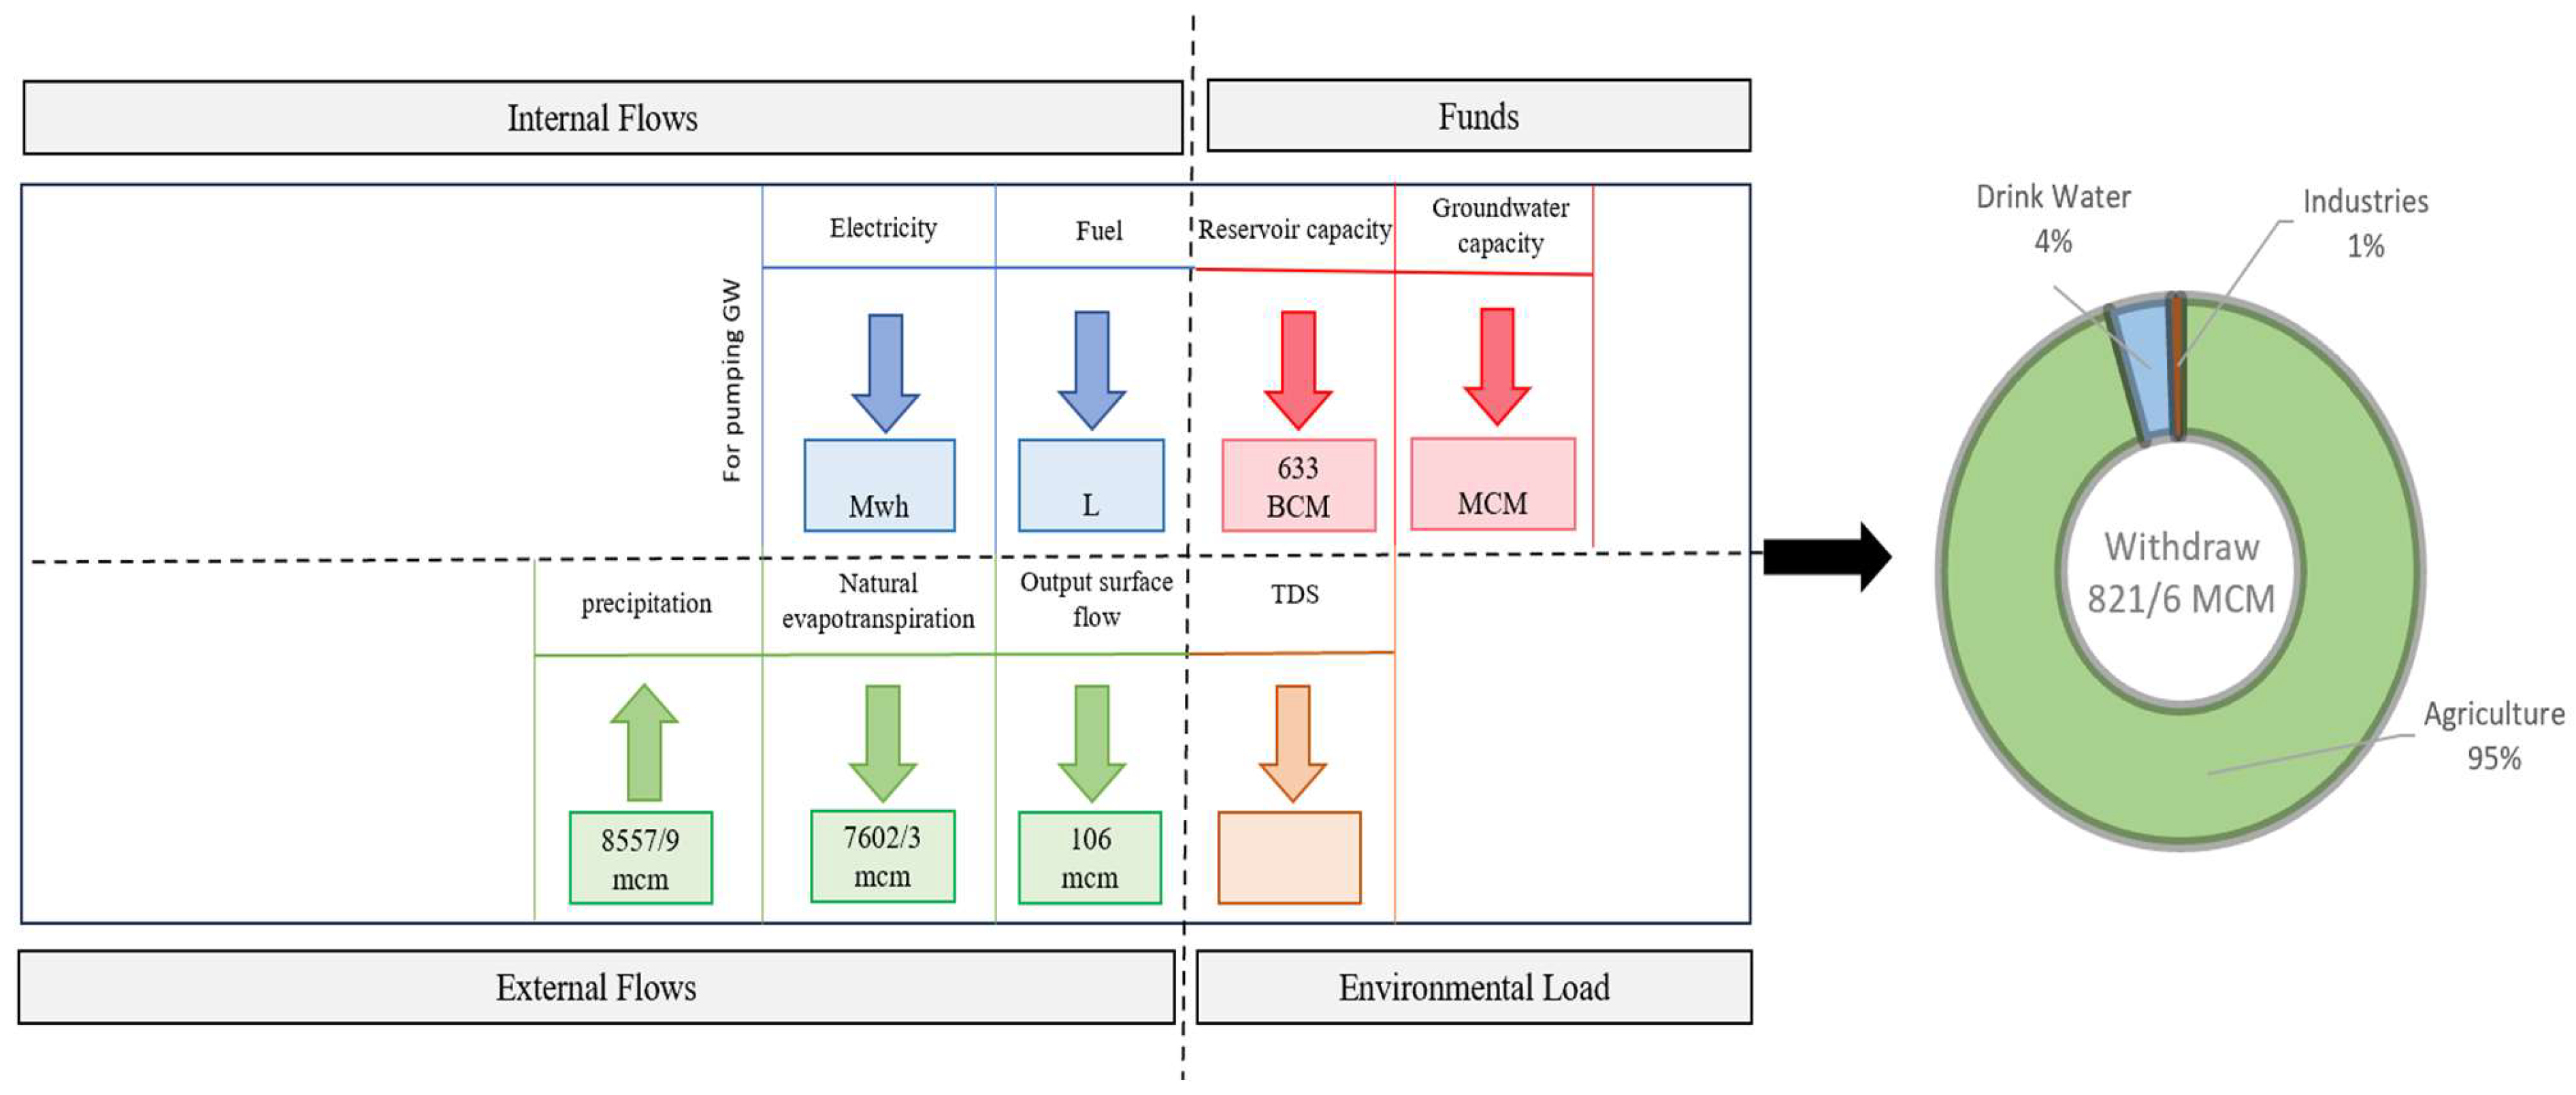
Figure 6.
Sized processor of the functional element local crop production(Iran).
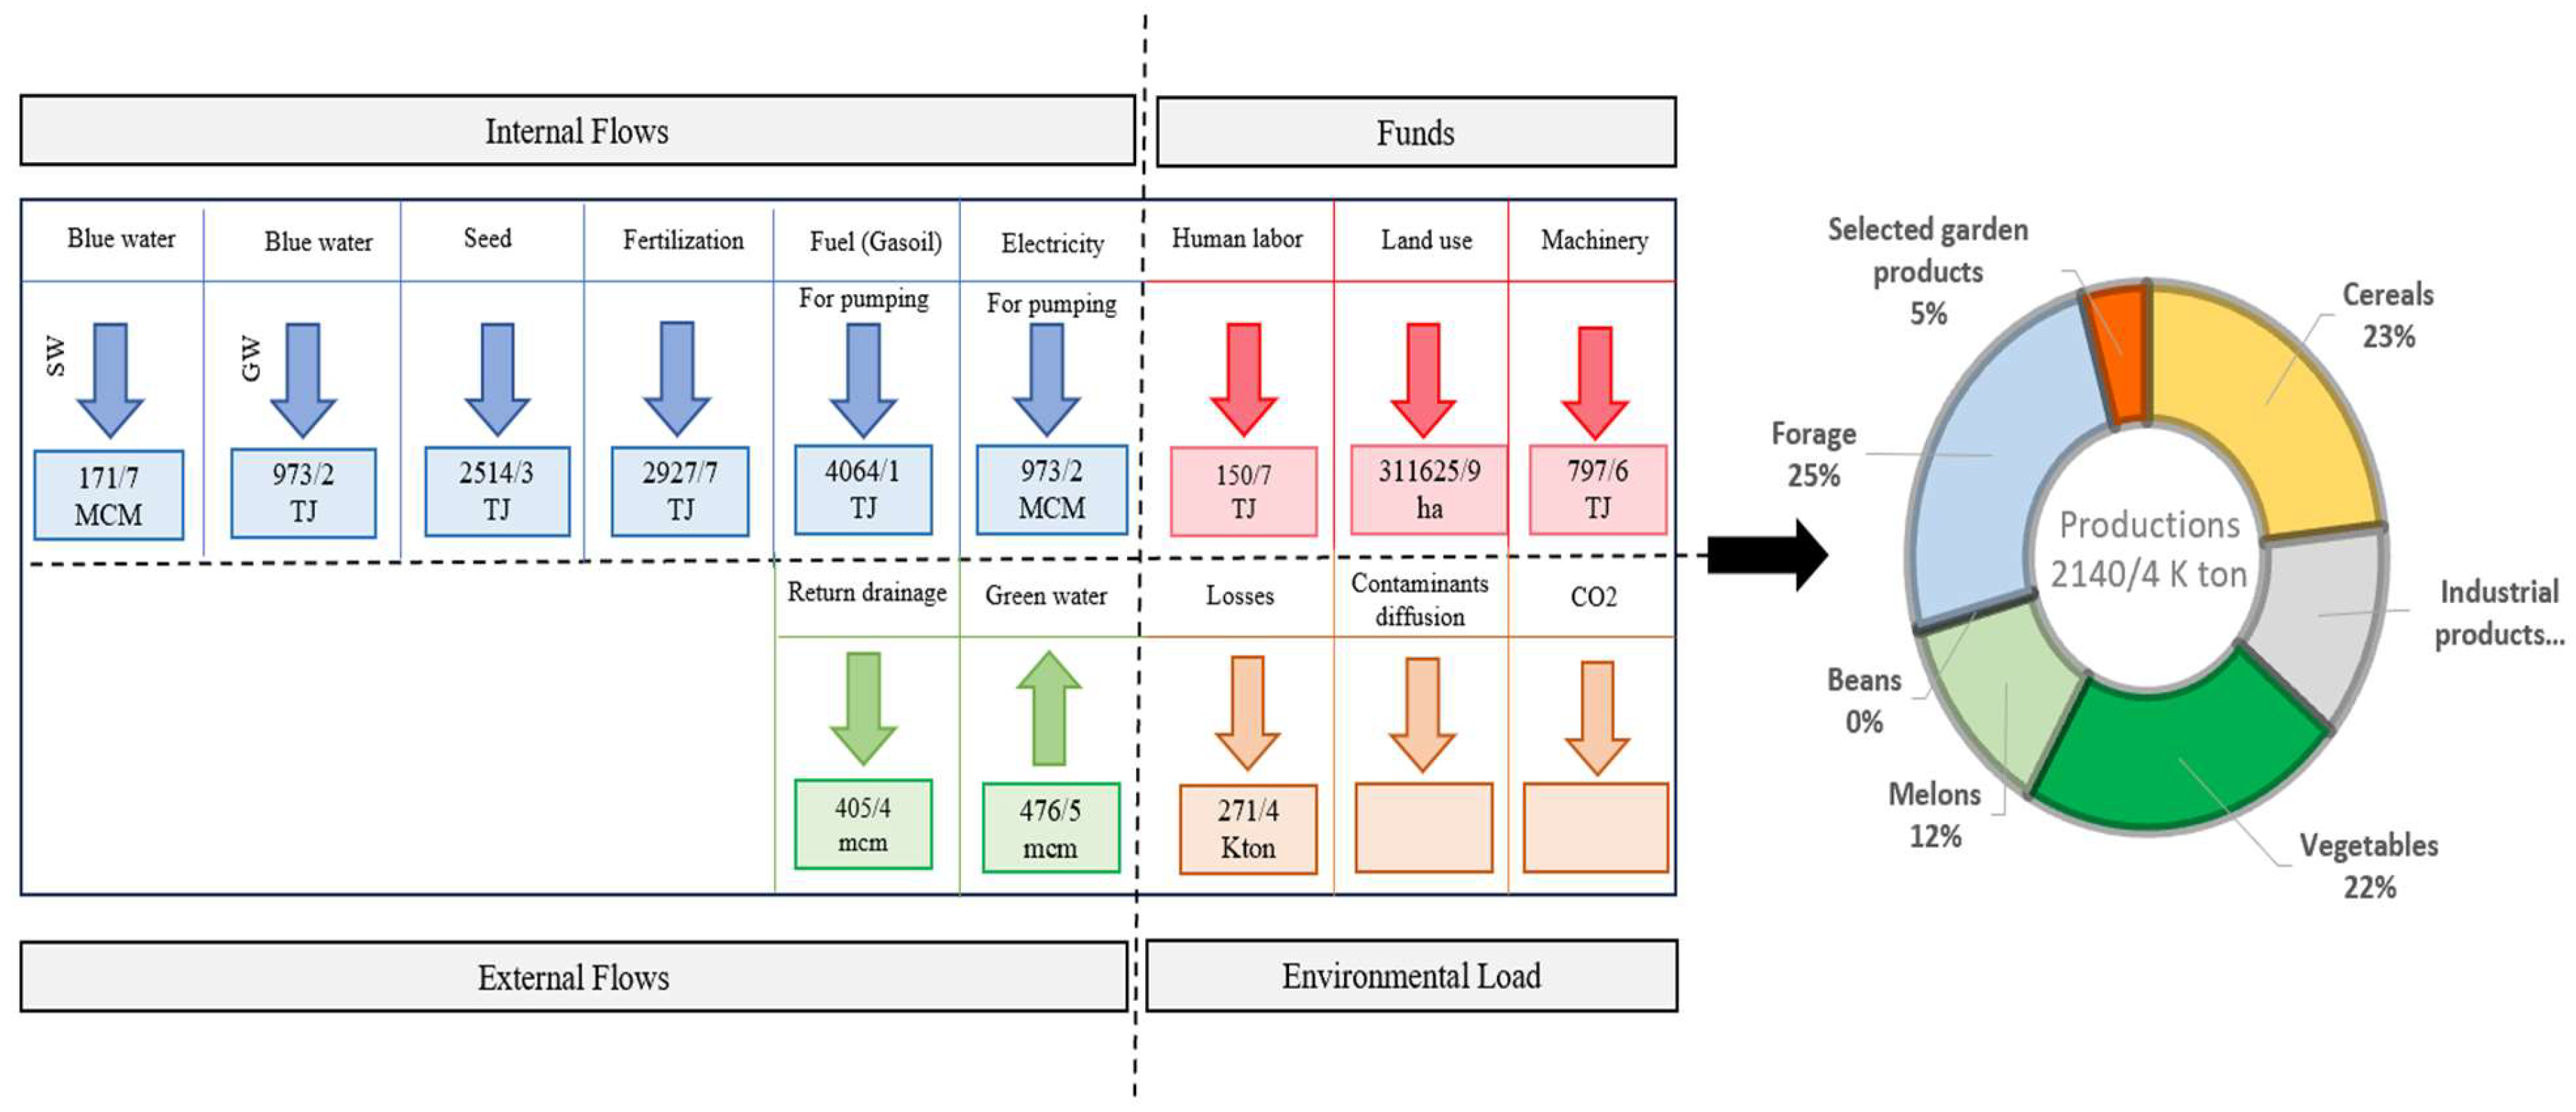
Figure 7.
Sized processor of the functional element local crop production (Afghanistan).
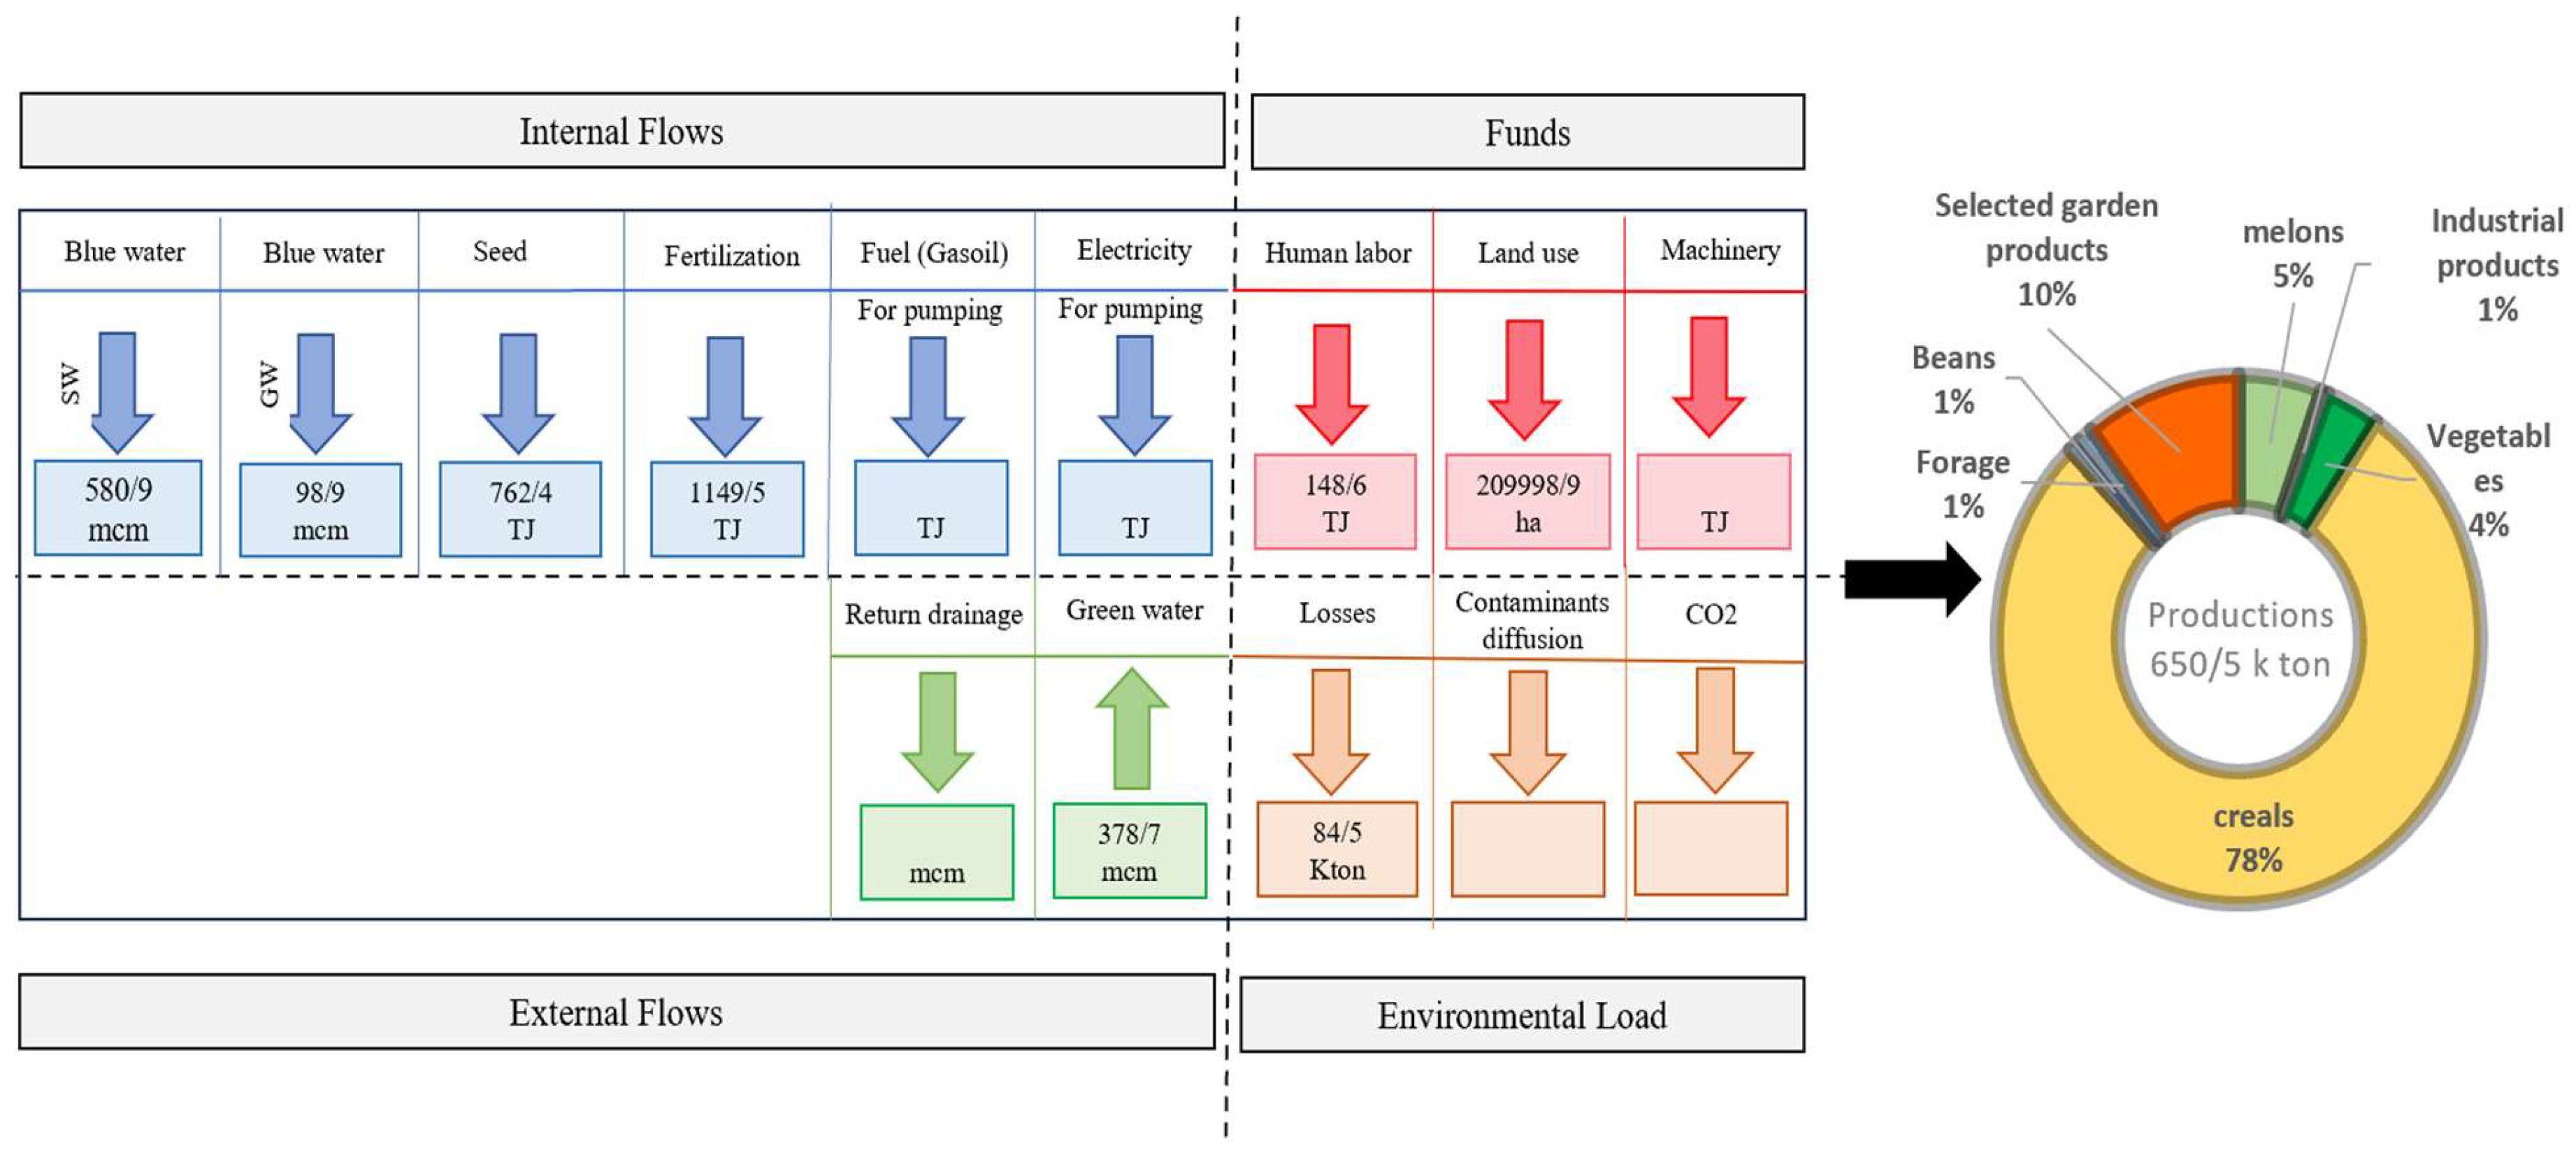
Figure 9.
WEF nexus system of the Harirud basin.
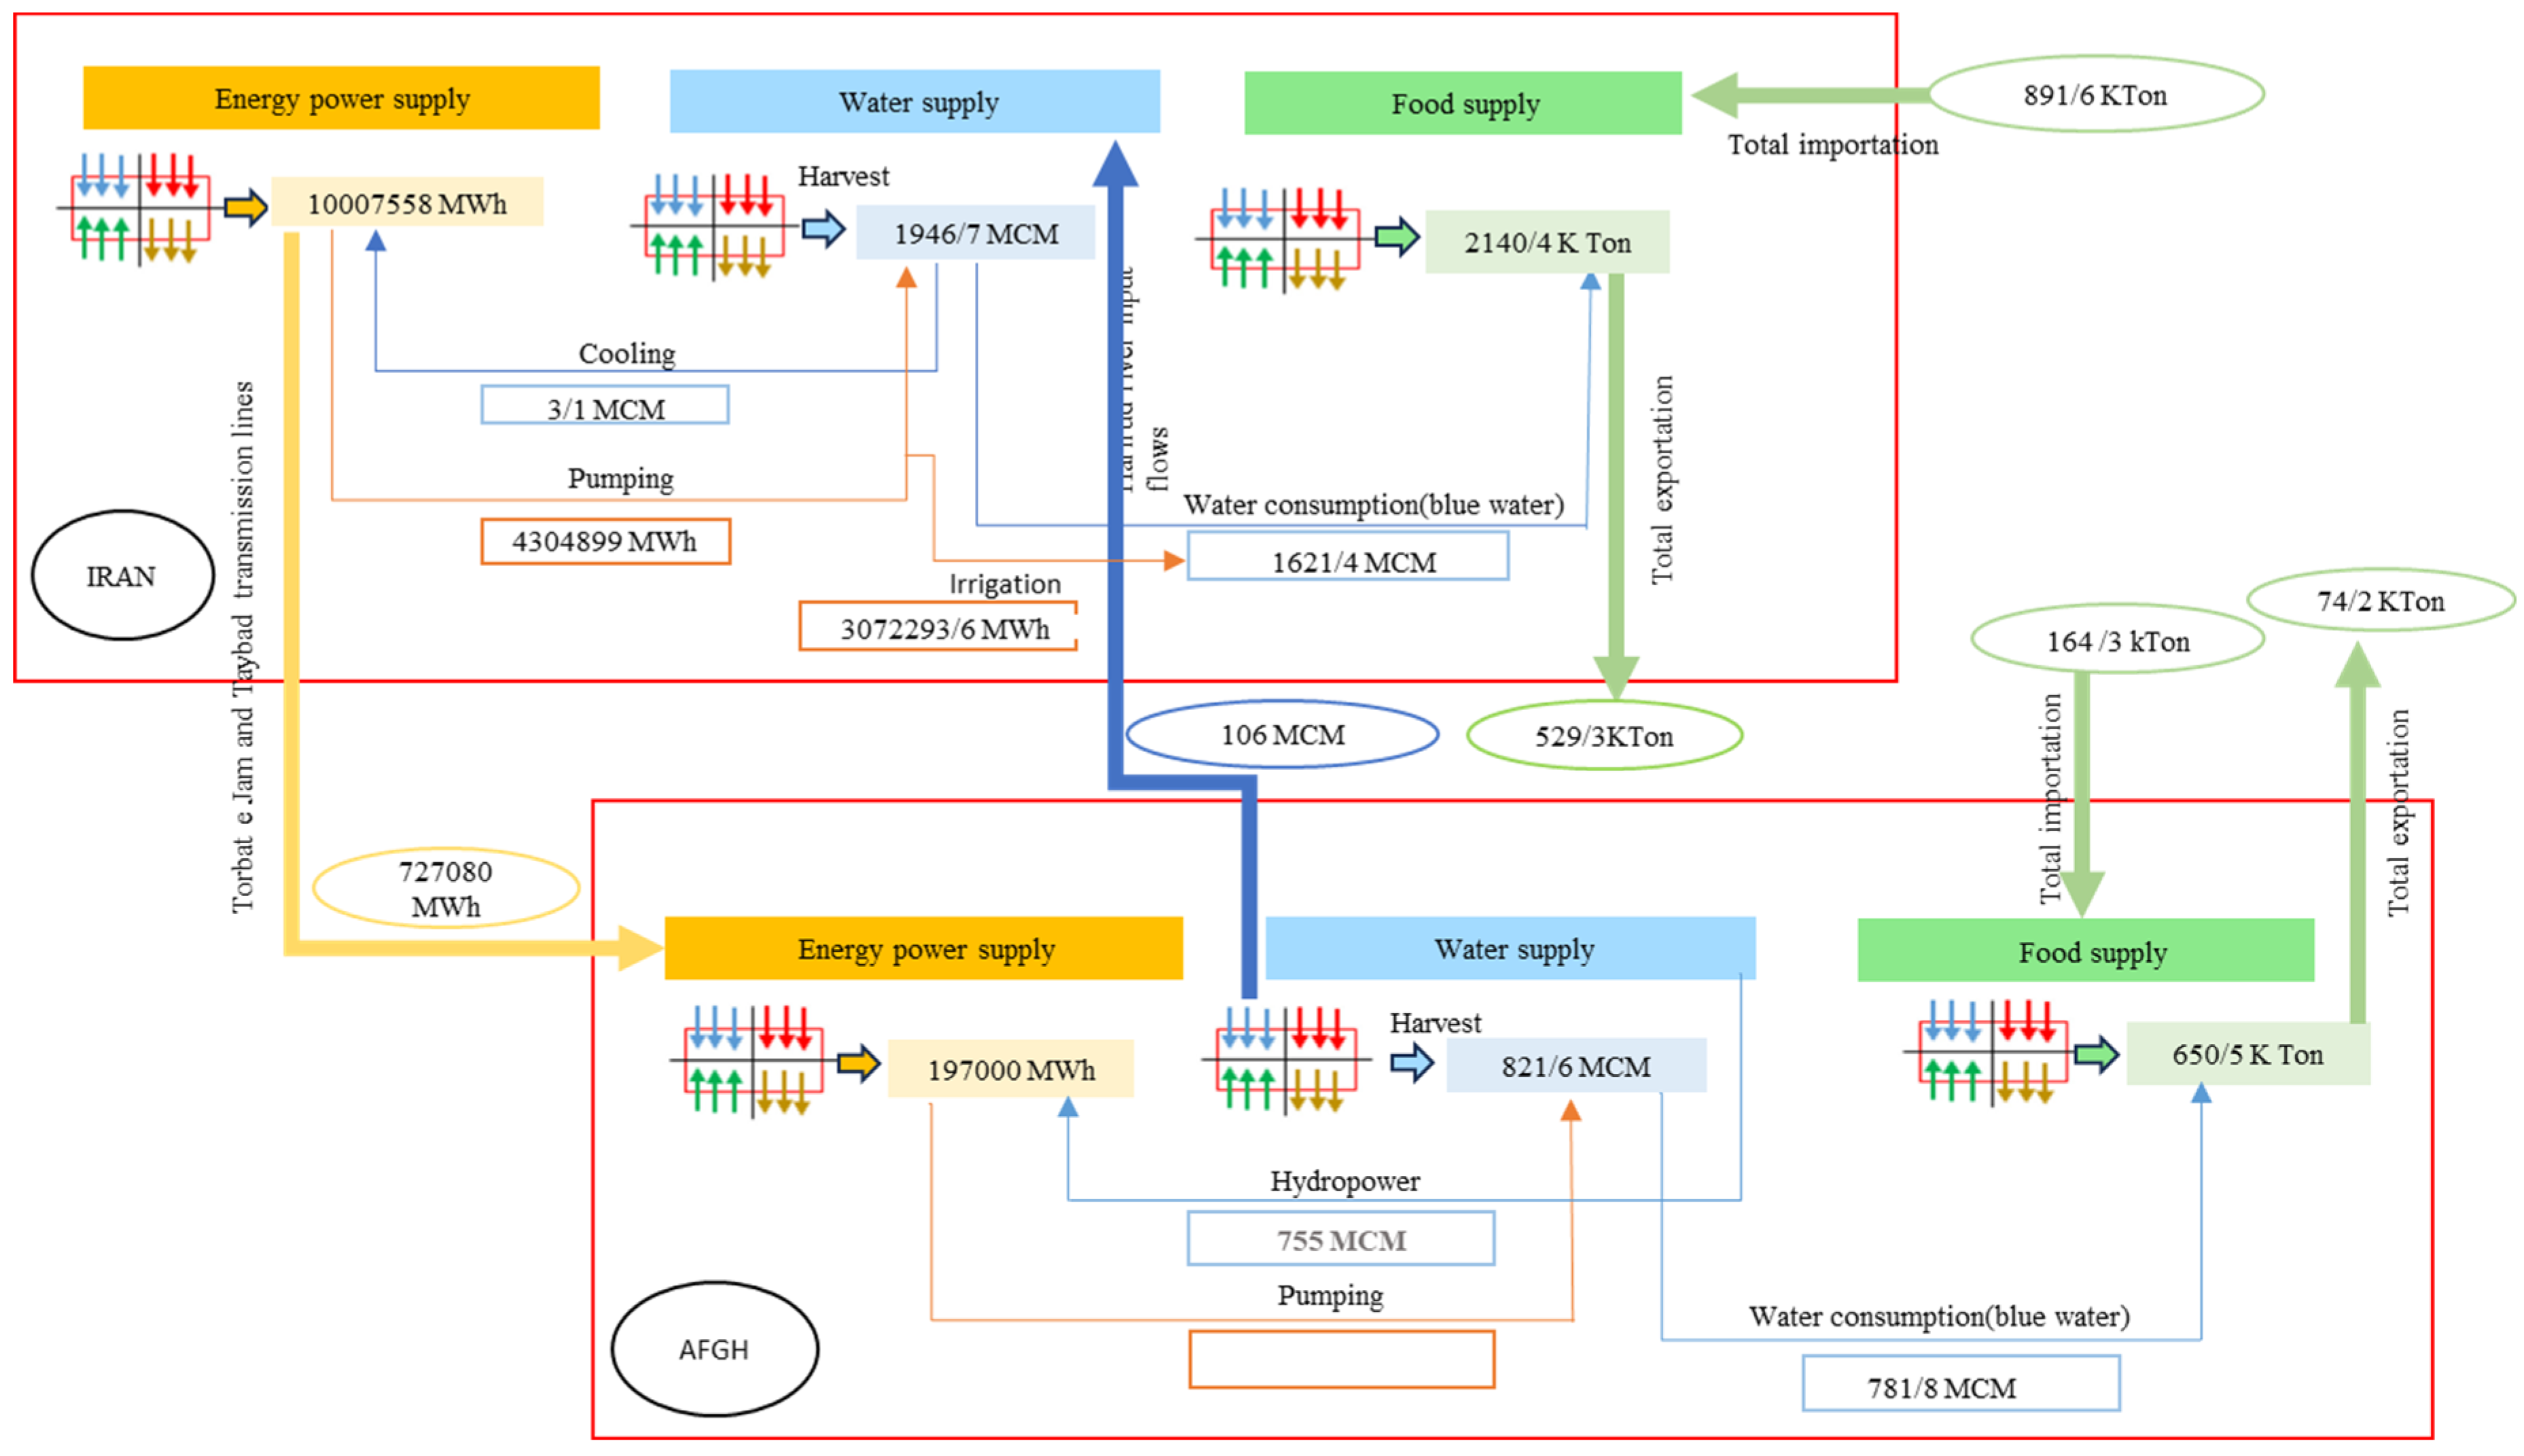

Table 1.
References and data sources.
| Main Sector | Data Type | Method of Collection/Calculation | Source/Reference | |
| Iran | Afghanistan | |||
|
Water |
Evapotranspiration Precipitation |
Remote Sensing Data | Global Land Data Assimilation System (GLDAS) Data period:2000-2021 Spatial resolution: 0.25, 1 |
|
| Dam information |
Data collection |
Ministry of Energy, Macro Planning Office for Water and Wastewater. Final Report (2011). Updated Studies of the Country (Ghareh Ghum Basin) Volume 4: Surface Water Resources Volume 11: Balance of Resources and consumption |
Nagheeby et al (2019) Based on statistics provided in the Iran section |
|
| Water Withdraw |
Calculation based on cultivated area and gross irrigation requirement |
Agriculture: Gross water requirement from NETWAT Drink Water and Services: Regional Water Company of Khorasan Razavi, Per Capita and Profile Water Data Period:2016-2022 Industries: Iran Water Resourses Management, Report of Ministry of Industry, Mine and Trade (2021) |
Agriculture: Gross water requirement Based on ET0 Calculator Fao/KC extracted from Fao irrigation and drainage paper No.56 Drink water: Based on the study by Ahmadi and heravi (2024) and Population (Calculating per capita consumption) Industries: Based on the number of industrial units extracted from the study area map and the amount of water consumed by similar units in the Iranian sector |
|
| Operating wells Information | Data Collection | Ministry of Energy, Iran water resources management Company, Water Resources Basic Studies Statistics |
____ |
|
| Electricity for groundwater pumping | Calculation with Formula 1 and 2: Monem et al (2019) | Calculating fuel and electricity for the pumping process is not possible for the Afghanistan sector due to lack of data | ||
| Fuel consumption for pumping water Renewable Water (for Calculate the Andicators) |
Calculation with Formula 3 Calculation with Formula 4: Fengping et al.(2022) |
|||
|
Food |
Cultivated surface Crop Pattern Crop Production |
Data Collection | Ministry of Jihad Agriculture Khorasan Razavi, Statistical yearbook Data period:2011-2021 |
Land Use Map ESA Data Period:2000-2021 Ministry of Agriculture, Irrigation and Livestock, Annual report of agriculture Data Period:2019-2022 |
| Separation of blue and green water consumption | Based on the amount of effective precipitation and Potential evapotranspiration | Based on the USDA method: Pe=min(Total Precipitation, ETp) ET blue = max (0, ETp-Pe) ET green = min (Etp, Pe) |
||
| Losses per capita consumption Trade Quantity |
Data Collection Based on per capita national consumption Calculation based on the difference between agricultural product imports and exports and estimation of the basin's share of the country's total trade. (FaizAbadi (2022)) |
FAO STAT, Food Balance Data Data Period:2000-2021 app.indexbox.io, Market Data (For years without statistics in FAO) |
||
| Agricultural consumables chemical fertilizers, seeds, labor Technical coefficients |
Calculation with Formula 5: El Gafy (2017) Data Collection |
Ministry of Agriculture Jihad, Deputy of Planning and Economic, Annual statistics on the costs of agricultural product cultivation Data Period:2011-2021 |
Basiri(2013) Soltani and khajehpour (2020) |
|
|
Energy |
Technical information of Generating Plant Amount of energy exchanges |
Data Collection Data Collection |
Ministry of Energy, Energy balance book Data Period:2018-2021 Safai., V (2018) Khorasan Regional Electric Company, Summary of power plant production status (2021) |
Report of GIZ Afghanistan (2015) Report of Asian Development Bank, Power Sector Master Plan Afghanistan (2013) |
|
The amount of carbon dioxide emitted in the electricity generation process |
Calculation with Formula 6 Bakhsi (2023) |
______ | ||
| The annual flow rate passing through the turbine for generating electricity (Hydropower plant) | Calculation with Formula 7 | The hydropower plant exists only in the Afghanistan sector | ||
Table 2.
The energy coefficient used in the calculation.
| Reference | Unit |
Energy coefficients MJ/unit |
Energy source |
| Ozkan rt al,2004 | h | 1/96 | Human labor |
| Ozkan rt al,2005 | Kg | 62/7 | Machinery |
| Rafiee et al,2010 | Kg | 66/14 | Nitrogen |
| Rafiee et al,2011 | Kg | 12/44 | Phosphate |
| Yilmaz et all,2011 | Kg | 11/11 | Potassium |
| Yilmaz et all,2012 | Kg | 24/88 | Seed |
| Erdal et al. (2007 | L | 56/31 | Fuel (Diesel) |
| Ozkan rt al,2004 | kwh | 3/6 | Electricity |
Table 3.
Indicators used in evaluating components of WEF system processors.
|
Food indicators | |||
|
Indicator |
Formula |
Reference |
Description |
| Blue Water Use productivity | (Howell,2001) | The (WUE) index in agriculture measures how effectively water is used to produce crops. | |
|
Land Water Use Productivity |
(Zwart & Bastiananssen,2004) |
The CWP index measures the efficiency of water use in crop production. | |
|
Land productivity |
(Kambouzia.,2010) | indicator used to measure the amount of agricultural production per unit of land. It is essential for evaluating farm efficiency. | |
|
Water indicators | |||
| Falkenmark indicator | (Falkenmark,1989) |
It calculates the annual freshwater availability per person, and it is typically expressed in cubic meters per capita per year (m³/capita/year).
Classification Range: < 500 m³/capita: Severe water scarcity 500–1,000 m³/capita: Water scarcity > 1,000 m³/capita: Water stress or adequate water |
|
| Water withdrawal index | UN-water (2018) |
The index helps assess the pressure on water resources and is used to monitor the sustainability of water consumption in different regions.
Classification Range: <20%: Stable situation 20–40 %: low Water scarcity > 40%: Sever water stress |
|
| Ground water withdrawal | Khazaei et al. (2018) | It is used to evaluate the extent to which groundwater is being withdrawn relative to total water withdrawals in region. | |
| Food water scarcity | Rockstrom et al. (2014) | It is useful for assessing the sustainability of freshwater resources. It helps identify regions under high water stress | |
Table 4.
The Calculated Values of Indices for Iran and Afghanistan in Harirud section.
| Food indicators | ||||||
| LP(Kg/ha) | LWUP(kg/m^3) | BWUP(kg/m^3) | ||||
| Products | Iran | Afghanistan | Iran | Afghanistan | Iran | Afghanistan |
| Cereals | 2330/5 | 1953/5 | 0/57 | 0/35 | 1/84 | 0/76 |
| Industrial Products | 21943/6 | 5592/3 | 2/53 | 0/66 | 2/53 | 0/69 |
| Pulses* | 748/7 | 1660/8 | 0/13 | 0/24 | 0/14 | 0/29 |
| Vegetables | 35056/1 | 13576/4 | 4/22 | 1/58 | 4/75 | 1/65 |
| Melons | 20384/0 | 13190/8 | 3/46 | 2/38 | 4/13 | 2/99 |
| Forage | 29941/8 | 13546/6 | 0/94 | 0/58 | 2/31 | 1/45 |
| Sunflower | - | 1208.3 | - | 0.16 | - | 0/18 |
| Fruits | 13263/0 | 7420/9 | 2.17 | 1/17 | 2.26 | 1/12 |
| Pistachio | 729/1 | - | 0.074 | - | 0.097 | - |
| Saffron |
3/62 |
2/2 |
0.001 | 0.00035 |
0.001 |
0.0003 |
| Water Indicators |
||||||
| Iran | Afghanistan | |||||
|
Water Withdrawal index |
0.875 | 0.456 | ||||
| Falken mark indicator | 415.909 | 1011.236 | ||||
| Ground water withdrawal | 0.664 | 0.185 | ||||
| Food water scarcity |
0.813 | 0.434 | ||||
Disclaimer/Publisher’s Note: The statements, opinions and data contained in all publications are solely those of the individual author(s) and contributor(s) and not of MDPI and/or the editor(s). MDPI and/or the editor(s) disclaim responsibility for any injury to people or property resulting from any ideas, methods, instructions or products referred to in the content. |
© 2025 by the authors. Licensee MDPI, Basel, Switzerland. This article is an open access article distributed under the terms and conditions of the Creative Commons Attribution (CC BY) license (http://creativecommons.org/licenses/by/4.0/).
Copyright: This open access article is published under a Creative Commons CC BY 4.0 license, which permit the free download, distribution, and reuse, provided that the author and preprint are cited in any reuse.


