
Submitted:
02 May 2025
Posted:
07 May 2025
You are already at the latest version
Preprints on COVID-19 and SARS-CoV-2
Abstract
Background/Objectives: Severe COVID-19 pneumonia causes alveolar type II cell damage and surfactant dysfunction, contributing to acute respiratory distress syndrome (ARDS). Surfactant proteins (SP-A, SP-B, SP-C, SP-D) are critical for reducing alveolar surface tension and defending against infection. We aimed to evaluate how surfactant protein gene expression affects COVID-19 severity Methods: Peripheral blood was collected from 122 adults with confirmed COVID-19, categorized as asymptomatic (no symptoms), mild (hospitalized), or severe (ICU admission). We quantified mRNA expression of surfactant protein genes (SFTPA1, SFTPA2, SFTPB, SFTPC, SFTPD) by RT-qPCR and compared relative expression levels between groups. Results: Surfactant gene expression patterns differed markedly with disease severity. SFTPB and SFTPC transcripts decreased as severity increased. Notably, SFTPC was ~49-fold higher in mild cases than asymptomatic controls, but then dropped ~54-fold in severe cases relative to mild, returning to near-baseline levels. In contrast, SFTPA2 and SFTPD were dramatically upregulated in severe illness. SFTPD expression in severe patients was ~4346-fold higher than in asymptomatic individuals (and ~9.6-fold higher than in mild cases). SFTPA2 was ~50-fold higher in severe versus mild cases. By comparison, SFTPA1 showed a modest ~1.4-fold decrease in severe cases (vs. mild). All noted differences were statistically significant (p < 0.05). Conclusion: COVID-19 severity is associated with distinct surfactant gene expression changes. Critically ill patients exhibited loss of key surfactant components (SP-B and SP-C) alongside an excessive SP-D response. This imbalance in the surfactant system likely contributes to alveolar collapse in severe COVID-19, and elevated SP-D may serve as a biomarker of lung injury severity.
Keywords:
COVID-19
; Surfactant Protein
; Disease severity
; Gene expression
; SFTPD
1. Introduction
COVID-19 is a respiratory infection first identified in December 2019, caused by the Severe Acute Respiratory Syndrome Coronavirus 2 (SARS-CoV-2). Declared a global pandemic by the World Health Organization (WHO) on March 11, 2020, the COVID-19 outbreak spread rapidly worldwide shortly after its emergence. In the first year of the pandemic, it infected approximately 30 million people across 212 countries, and to date about 778 million cases have been reported, with roughly 9% of those infected having lost their lives [1].
COVID-19 virus infection can be seen in a clinical spectrum ranging from asymptomatic infection to mild infection and life-threatening critical infection [2,3]. The risk of serious disease varies according to age, underlying chronic diseases, and vaccination status [4]. Pre-vaccination studies have shown that asymptomatic infections account for 20–40% of all SARS-CoV-2 infections [5]. Of the 1.3 million cases reported to the United States Centers for Disease Control and Prevention (CDC) by the end of May 2020, 14% were hospitalized, 2% were admitted to the intensive care unit, and 5% died [6]. Most people infected with SARS-CoV-2 experience mild to moderate illness. Severe and critical illness is marked by pneumonia that affects more than half of the lung tissue, rapid breathing, difficulty breathing, and oxygen levels below 94% in normal air.
The clinical course of COVID-19 ranges from mild symptoms to critical pneumonia. In particular, in high-risk groups, the infection can lead to severe inflammation in the lungs, increased capillary permeability, and consequent edema and microthrombi, progressing to an acute respiratory distress syndrome (ARDS) [7]. In most patients with Covid-19 pneumonia, the pathologic finding in the lung is compatible with acute respiratory distress syndrome (ARDS) [8]. In most autopsy reports, hyaline membrane changes and microvascular thrombosis suggestive of early ARDS have been reported [9]. Deep, acute hypoxemic respiratory failure is the predominant finding in patients followed up in the intensive care unit with a diagnosis of ARDS [10]. The need for mechanical ventilation varies between 20% and 100% in patients followed up in the intensive care unit [11].
From the early stages of the pandemic, the high transmissibility and mortality rates were attributed to the lack of knowledge about SARS-CoV-2 and the initially limited availability of specific treatments. Therefore, over the past few years, intensive research has been undertaken to clarify the pathogenesis of COVID-19 and to develop effective treatment strategies.
SARS-CoV-2 primarily uses the angiotensin-converting enzyme 2 (ACE2) receptor to enter host cells. The virus attaches to epithelial cells in the respiratory tract that express ACE2 and crosses the host cell membrane via fusion to initiate infection [12]. Alveolar epithelial cells responsible for gas exchange (alveolar type I, AT1) and those producing surfactant (alveolar type II, AT2) also express ACE2 on their surface. Indeed, one of the main targets of the virus in COVID-19 is AT2 cells, which become infected and damaged, leading to disruption of alveolar integrity [13,14]. Damage to these cells results in decreased pulmonary surfactant production - a factor vital for alveolar function - causing alveolar collapse (atelectasis), ventilation-perfusion mismatch, and severe oxygenation disturbances that exacerbate ARDS [15]. Autopsy studies of COVID-19 patients have revealed severe damage to the alveolar-capillary barrier, hyaline membrane formation, widespread inflammation and microthrombi, along with a loss of surfactant proteins [16]. In other words, by targeting the alveoli, SARS-CoV-2 severely damages the pulmonary surfactant layer [17].
Pulmonary surfactant is a lipoprotein mixture that coats the inner surface of the alveoli, regulating the surface tension necessary for breathing and serving as the first line of defense against inhaled pathogens. It is composed of approximately 90% phospholipids (primarily dipalmitoylphosphatidylcholine) and about 10% proteins [18,19]. The major protein components of surfactant are surfactant protein A (SP-A), surfactant protein B (SP-B), surfactant protein C (SP-C), and surfactant protein D (SP-D). SP-B and SP-C are small, hydrophobic, and amphipathic proteins that facilitate the formation of the alveolar surface phospholipid film, thereby reducing surface tension. In contrast, SP-A and SP-D are larger, hydrophilic collectin proteins responsible for the immune functions of surfactant [20].
Under normal conditions, SP-A and SP-D are present in the alveolar fluid and mucus layer, where they recognize inhaled pathogens. By binding to specific carbohydrate structures on the surface of these pathogens, they cause agglutination and thus facilitate phagocytosis. These collectins also activate immune cells -especially alveolar macrophages- to clear pathogens and modulate the intensity of the inflammatory response when needed [21,22]. For example, SP-A has been shown to inhibit dendritic cell maturation and the release of IL-8 from eosinophils [23]. Thus, in addition to maintaining respiratory function, surfactant serves as an important component of innate immunity.
Viral pneumonias and other lung infections can adversely affect surfactant synthesis and structure; indeed, during SARS-CoV-2 infection, significant disruptions occur in the pulmonary surfactant. With alveolar epithelial damage, surfactant production decreases and the existing surfactant structure is also compromised in the inflammatory environment. In lung tissues of patients who have died from COVID-19, the expression of SP-A, SP-B, SP-C, and SP-D genes was reported to be markedly reduced, and this reduction was associated with high viral load. This is a consequence of the virus destroying the surfactant-producing AT2 cells. In moderate-to-severe COVID-19 cases, AT2 cell hyperplasia can be observed in the alveolar epithelium and initial increases in SP-A and SP-D levels may occur; however, as the disease worsens, these protein levels fall again due to the exhaustion of surfactant synthesis [24].
Indeed, in COVID-19 patients, SP-D levels have been found to be significantly higher than those in control groups -particularly in cases of severe lung involvement- and to correlate with disease severity [25]. Similarly, plasma SP-A levels also increase in severe COVID-19 cases and have been proposed as a biomarker of lung injury [26]. These observations underscore the close relationship between surfactant protein levels and the severity of COVID-19.
On the other hand, the changes in hydrophobic surfactant proteins such as SP-B and SP-C during COVID-19 have not been fully elucidated. However, a recent study suggested that SP-B could be a new biomarker potentially associated with post-COVID lung damage and respiratory failure [27]. Immunohistochemical staining of lung samples from COVID-19 patients has shown dense accumulations of SP-A in the alveolar spaces; these abnormal accumulations are thought to impede the distribution of exogenously administered surfactant preparations, thereby reducing treatment efficacy [28].
All these findings indicate that the surfactant system is severely affected during COVID-19 infection. Surfactant dysfunction may be an important factor contributing to increased disease severity. Therefore, examining changes in surfactant protein expression levels in different patient groups after COVID-19 (for example, asymptomatic, mild, and severe cases) could contribute to a better understanding of the disease’s pathogenesis and to the development of new therapeutic approaches.
2. Materials and Methods
2.1. Sampling
A total of 162 adult patients (20–65 years) with laboratory-confirmed SARS-CoV-2 infection at Biruni University Hospital between March and November 2021 were enrolled. Confirmation of COVID-19 was performed by reverse transcription–quantitative PCR (RT-qPCR) in accordance with WHO diagnostic protocols. Ethical approval for this non-interventional study was granted by the Biruni University Non-Interventional Ethics Committee (Approval No. 2021/49-05), and all participants provided written informed consent prior to sample collection.
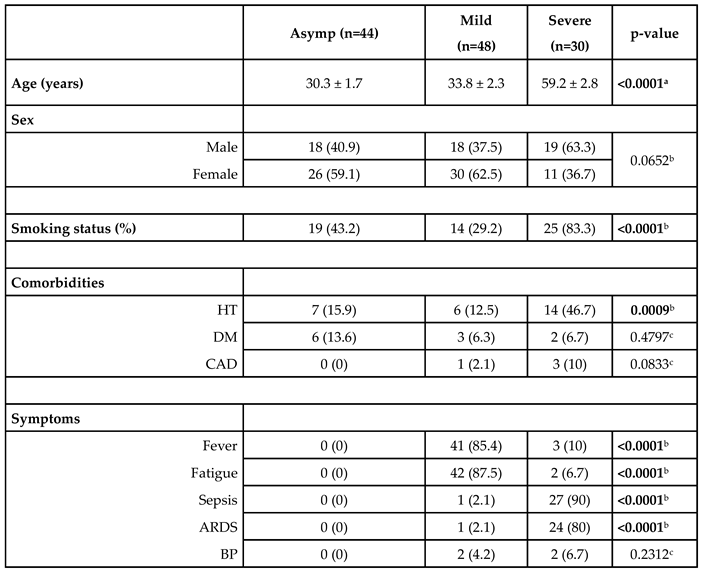
Participants were stratified into three clinical groups based on symptoms and need for care. The asymptomatic control group (n = 44; mean age 30.3 ± 1.7 years) includes outpatients with positive RT-qPCR but no COVID-19–related symptoms and no requirement for hospitalization. The mild group (n = 48; mean age 33.8 ± 2.3 years) includes symptomatic patients who required hospital admission but did not meet criteria for intensive care; and severe group (n = 30; mean age 59.2 ± 2.8 years) includes patients who required intensive care unit admission, mechanical ventilation, or who succumbed to the disease.
Severity grading followed WHO guidelines and was validated by a systematic review of each patient’s medical record. The overall cohort exhibited a balanced gender distribution (45 % male) with no significant sex differences across groups. We excluded individuals younger than 20 or older than 65 years, pregnant or lactating women, patients with known immunosuppression (for example, chemotherapy recipients), and anyone unable to complete follow-up. Key comorbidities—including coronary artery disease, diabetes mellitus, hypertension, and smoking status—were recorded; the full demographic and clinical profile is summarized in Table 1. All enrolled participants had received the Pfizer-BioNTech COVID-19 vaccine and were monitored for 12 months post-diagnosis to assess disease progression and clinical outcomes.
2.2. Expression Analysis
2 mL of peripheral venous blood were collected from each participant into EDTA tubes and immediately began total RNA isolation using the RNeasy Mini Kit (Qiagen, Cat. No. 74 106) in strict accordance with the manufacturer’s instructions. Purified RNA was quantified, assessed for purity, and stored at –20 °C until further use.
For gene-expression analyses, 0.5µg of each RNA sample was reverse-transcribed into cDNA using the QuantiTect Reverse Transcription Kit (Qiagen, Cat. No. 205 311) following the manufacturer’s protocol. The transcript levels of SFTPA1 (OMIM#178630), SFTPA2 (OMIM#178642), SFTPB (OMIM#178640), SFTPC (OMIM#178620), and SFTPD (OMIM#178635) were then measured by real-time quantitative PCR with the QuantiTect SYBR Green PCR Kit (Qiagen, Cat. No. 154 027 284). Gliseraldehit-3-Fosfat Dehidrogenaz gene (GAPDH)(OMIM#13400) was included as the internal housekeeping control.
All primer pairs were designed in silico with Primer3Plus to span exon–exon junctions and to minimize off-target amplification. The sequences for SFTPA1, SFTPA2, SFTPB, SFTPC, SFTPD, and GAPDH are detailed in Table 2. Amplification was carried out under standard cycling conditions, and each reaction was performed in triplicate. Relative expression levels were calculated using the 2–ΔΔCt method, normalizing each surfactant gene to GAPDH and then to the asymptomatic control group.
2.3. Statistical Analysis
The statistical analyses were conducted using GraphPad Prism Software, versions 5.0 and 10.3 (GraphPad Software, San Diego, CA, USA). Age and gene expression levels were presented as mean ± standard error of the mean, while demographic, comorbidity, and symptomatic data were summarized as counts and percentages. Group age differences were analyzed using the Kruskal-Wallis test. Frequency comparisons between groups were assessed with the Chi-square test or Fisher's exact test, as appropriate. The Mann-Whitney U test was applied to compare gene expression levels between two groups, and Spearman's correlation was used to explore relationships between gene expression levels. A p-value of <0.05 was considered indicative of statistical significance.
3. Results
In our study, 44 asymptomatic (having no symptoms), 48 symptomatic (mild, having symptoms but no need for intensive care unit), and 30 severe (intensive care unit required) cases were included. All individuals were COVID-19 positive. The demographic data, comorbidities, and symptomatic characteristics of the cases are presented in Table 3.
When evaluating the age differences among groups, it was observed that as the severity of the disease increased, there was a statistically significant increase in the mean age across all group comparisons (p < 0.0001).
Among the asymptomatic group, 40.9% were male and 59.1% were female; in the mild group, 37.5% were male and 62.5% were female; and in the severe group, 63.3% were male and 36.7% were female. No statistically significant difference was found in gender distribution among the groups (p = 0.0652).
43.2% of the asymptomatic group, 29.2% of the mild group, and 83.3% of the severe group were smokers. A significant difference in smoking rates was found among the groups (p < 0.0001).
A statistical comparison revealed a significant difference in HT among the groups (p = 0.0009); however, no significant differences were observed for DM and CAD (p = 0.4797 and p = 0.0833, respectively). Significant differences were found among the three groups regarding fever, fatigue, sepsis, and ARDS (p < 0.0001), while no significant difference was observed for BP (p = 0.2312) (Table 3).
The mean expression values for the studied genes across the groups were as follows: SFTPA1 showed levels of 0.0461 ± 0.0270 in the asymptomatic group, 0.0271 ± 0.0069 in the mild group, and 0.0199 ± 0.0136 in the severe group. For SFTPA2, the expression was 0.2635 ± 0.1272 in asymptomatic individuals, 0.0271 ± 0.0035 in the mild group, and 1.3530 ± 0.7601 in severe cases. SFTPB exhibited values of 0.0075 ± 0.0034, 0.0052 ± 0.0012, and 0.0030 ± 0.0004 in the asymptomatic, mild, and severe groups, respectively. The expression of SFTPC was 0.0092 ± 0.0016 for asymptomatic individuals, 0.4503 ± 0.1464 for the mild group, and 0.0084 ± 0.0019 for severe cases. Lastly, SFTPD demonstrated levels of 0.0252 ± 0.0140 in the asymptomatic group, 11.430 ± 5.8230 in the mild group, and 109.30 ± 52.20 in the severe group (Figure 1).
When comparing gene expression levels between groups, SFTPA1 showed a 1.36-fold very significant decrease in the severe group relative to the mild group (p = 0.0013). For SFTPA2, expression increased 5.13-fold in the severe group compared to the asymptomatic group and 50.02-fold compared to the mild group, both changes being highly significant (p < 0.0001).
The expression of SFTPB decreased significantly by 1.44-fold in the mild group compared to the asymptomatic group (p = 0.0482) and by 1.73-fold in the severe group compared to the mild group (p = 0.0120). For SFTPC, there was a 48.74-fold highly significant increase in the mild group compared to the asymptomatic group (p < 0.0001), followed by a 53.84-fold highly significant decrease in the severe group relative to the mild group (p < 0.0001).
Finally, SFTPD expression increased by 454.47-fold in the mild group compared to the asymptomatic group, 4345.92-fold in the severe group compared to the asymptomatic group, and 9.56-fold in the severe group relative to the mild group (p < 0.0001, p < 0.0001, and p = 0.0002, respectively) (Table 4).
A strong positive correlation was identified between the gene pairs SFTPA1-SFTPA2 and SFTPC-SFTPD in the mild group, with correlation coefficients of r = 0.673 (p < 0.0001) and r = 0.722 (p < 0.0001), respectively. This indicates that the expression levels of these genes tend to rise or fall together under similar conditions, suggesting potential co-regulation or shared functional roles (Table 5).
In contrast, medium negative correlations were observed between the pairs SFTPA1-SFTPC, SFTPA2-SFTPC, and SFTPA2-SFTPD in the mild group, with coefficients of r = -0.492 (p = 0.0015), r = -0.537 (p = 0.0004), and r = -0.499 (p = 0.0004), respectively. These inverse relationships imply differing regulatory or functional mechanisms for these gene pairs (Table 5).
For SFTPA1 and SFTPD, the correlation shifted based on disease severity. A weak negative correlation was noted in the asymptomatic group (r = -0.396, p = 0.0273), progressing to a medium negative correlation in the mild group (r = -0.549, p = 0.0001), and culminating in a strong negative correlation in the intensive care group (r = -0.653, p = 0.0007). This pattern highlights an intensifying inverse relationship as disease severity increases, suggesting these genes may have distinct and potentially opposing roles in the pathophysiology of COVID-19. The findings point to a dynamic interplay between these genes that becomes more pronounced with worsening clinical conditions (Table 5).This section may be divided by subheadings. It should provide a concise and precise description of the experimental results, their interpretation, as well as the experimental conclusions that can be drawn.
4. Discussion
Mortality in a COVID-19 infection has been associated with the presence of severe ARDS and varies between 12% and 78%, with an average of 25–50% [29]. As the pandemic progressed and vaccination rates increased, mortality rates decreased [30].The most important risk factor associated with mortality in critically ill patients is advanced age. Severe ARDS development and the need for mechanical ventilation, comorbid chronic diseases (obesity, hypertension, chronic heart and lung diseases, cancer), right ventricular dysfunction, and male gender are risk factors associated with mortality [31]. In a study involving more than 2000 critically ill patients, an 11-fold increase in mortality rates over the age of 80 was reported [32]. Worse still, ARDS caused by COVID-19 with reduced pulmonary surfactant levels may severely impose alveolar collapse, impair gas exchange, and increase the work of breathing [33].According to this, COVID-19 patients with severe pneumonia requiring intensive care follow-up in our study were predominantly male and relatively middle-aged, had a high number of cardiovascular comorbidities, and were mainly patients with signs of sepsis, which is consistent with the current literature on this subject.
In our study, we examined changes in surfactant protein gene expression in COVID-19 patients, and our results are largely consistent with the literature. Notably, SFTPD (SP-D) gene expression was dramatically elevated in severe patients, aligning with numerous studies that reported increased SP-D protein levels in severe COVID-19 and ARDS cases [34]. In a large-scale study by Salvioni et al., plasma SP-D levels were identified as a biomarker for predicting COVID-19 diagnosis and mortality, with threshold values of 150 ng/mL and 250 ng/mL indicating the presence of disease and the risk of death, respectively [25]. Our finding of a several-hundred-fold increase in SFTPD expression in the severe group supports these data.
Our findings on the SFTPA genes parallel the complex picture in the literature. In our study, SFTPA2 (SP-A2) expression was markedly increased in critically ill patients requiring intensive care, whereas SFTPA1 (SP-A1) expression showed a declining trend. Some studies reported that SP-A protein levels rise as COVID-19 pneumonia progresses and that SP-A could be an important marker in the early stages of lung injury; in one such study (which also assessed SP-D), the authors suggested that although SP-A and SP-D serum levels in COVID-19 patients were higher than in healthy individuals, these levels might drop again in very advanced disease due to alveolar type II cell destruction [35]. On the other hand, other research found no significant difference in SP-A levels between severe and mild cases [36]. Our results highlight a divergence in the behavior of SP-A genes: SP-A2 increased in severe patients while SP-A1 decreased. This may be because human SP-A is encoded by two separate genes, and different variants can play distinct roles in the immune response. Indeed, Floros and Phelps propose that SP-A1 and SP-A2 have different effects in COVID-19 and may influence the disease outcome in different ways [37]. The decrease in SP-A1 and increase in SP-A2 might reflect the differentiated immune response described in the literature.
SFTPC (SP-C) gene expression exhibited a notable biphasic pattern in our study: in mild patients (hospitalized but not requiring ICU) it showed a dramatic rise, whereas in the severe group it fell sharply to near control levels. This change is in line with some observations, as moderate COVID-19 pneumonia has been associated with alveolar type II cell hyperplasia and increased surfactant production [28]. At that stage, the lung may be attempting to compensate for injury via increased surfactant synthesis; indeed, the 50-fold increase in SFTPC in our mild group indicates a functional alveolar response. However, as disease severity increases and diffuse alveolar damage with hyaline membrane formation develops, SFTPC expression falls markedly due to the loss of type II cells [38]. Similarly, a COVID-19 lung transcriptome analysis by Islam and Khan showed that SARS-CoV-2 infection suppresses surfactant protein genes [39]. The drop in SFTPC observed in our severe group corroborates that the virus severely impairs surfactant-producing cell function. Overall, these findings support the general notion that in severe cases the surfactant system fails, leading to gas exchange impairments. Assessing circulating levels of hydrophobic surfactant proteins (SP-B and SP-C) is challenging. In our study, SFTPB expression progressively decreased in both the mild and severe groups. A study in pediatric patients similarly reported no significant correlation between plasma SP-B levels and COVID-19 severity [40]. This is likely due to the limited passage of SP-B into the bloodstream and the difficulty of detecting it.
The structural differences among surfactant proteins influence their presence in circulation: SP-A and SP-D are water-soluble collectins, whereas SP-B and SP-C are extremely hydrophobic [41]. Therefore, normally SP-B and SP-C remain embedded in the alveolar lipid film and cannot easily cross an intact alveolar-capillary barrier. Even in severe lung injury, only small amounts of these proteins may leak into the blood, and detecting them is technically difficult. Indeed, even in ARDS patients, measuring SP-B in serum requires special sensitivity; SP-B is present in blood only at ng/mL levels and can only be measured with advanced methods [42]. Our qPCR-based approach to indirectly measure gene expression reflected this difficulty as well: SFTPB and SFTPC transcript levels were extremely low in all groups, and although their changes were statistically significant, the magnitude of change was limited. Consequently, SP-B and SP-C levels or expression did not show as pronounced changes as those of SP-A and SP-D, and appeared less useful for distinguishing COVID-19 severity. This aligns with the general view that in COVID-19 the most notable changes occur in the hydrophilic surfactant proteins (which have immunological functions), whereas changes in the hydrophobic proteins remain unclear due to detection challenges [43].
5. Conclusions
This study aimed to elucidate the effect of COVID-19 on the lung’s surface tension regulatory system by examining surfactant protein gene expression (SFTPA1, SFTPA2, SFTPB, SFTPC, and SFTPD) across different disease severity groups. By focusing on a relatively new topic and directly evaluating surfactant gene expression in patient samples, the study holds a unique place in the literature. Traditionally, COVID-19 research has concentrated on the cytokine storm, immune response, or viral load; in contrast, this study demonstrates surfactant system disruption with quantitative gene expression data, filling an important gap. It provides concrete evidence of disrupted surfactant homeostasis in COVID-19. The findings show that in severe cases some surfactant genes are significantly suppressed, whereas others (especially SFTPA2 and SFTPD) are abnormally elevated. In particular, the exponential rise in SFTPD expression in critical patients suggests that this protein may be an indicator of tissue damage and inflammatory response. This finding underscores SP-D as a potential biomarker for disease progression and prognosis. Meanwhile, the marked reduction of fundamental surfactant components in severe cases indicates a loss of alveolar type II cell function, highlighting the importance of surfactant deficiency in COVID-19–related acute respiratory failure. Thus, the study provides a new perspective by showing that COVID-19 is closely linked not only to inflammatory processes but also to the mechanisms regulating surface tension in the lungs.
However, this study has some limitations. First, the sample is from a single center and includes a limited number of severe patients; therefore, to generalize the results, the findings should be confirmed in larger multi-center cohorts. Second, although measuring surfactant gene expression in peripheral blood is innovative, it is unclear to what extent these data reflect actual surfactant production in lung tissue; the source of the transcripts detected in blood (circulating immune cells vs. material from damaged alveolar cells) has not been fully determined. Third, the cross-sectional design of the study does not permit assessment of dynamic changes in expression over time or determination of cause-and-effect relationships. Finally, while all patients were vaccinated - which gives this cohort a unique characteristic - it remains unknown whether similar results would apply to unvaccinated patients or those infected with different viral variants.
In light of these findings, several recommendations for future studies can be proposed:To better understand the role of the surfactant system in COVID-19 pathogenesis, similar gene and protein levels should also be measured in direct lung-derived samples (e.g., lung tissue or bronchoalveolar lavage fluid). This would clarify how the findings from peripheral blood relate to the lung microenvironment. With long-term follow-up, changes in surfactant gene expression should be evaluated in relation to patient recovery and “long COVID” symptoms.
Overall, this study provides a valuable contribution to the literature on COVID-19 lung biology; at the same time, the questions and hypotheses it raises lay a foundation for further research.
Author Contributions
Conceptualization, S.K.; G.Y; M.Dokur; methodology, G.Y;. H.A.; K.C.S; S.C.; software, G.Y.; H.A.; validation, K.C.S and S.C.; formal analysis, S.K; M.D.; P.A.; E.A.; investigation, S.K.; K.C.S; S.C.; M.D.; P.A.;E.A. and M.Dokur; resources, S.K.; G.Y.; M.D.; P.A.; E.A. and M.Dokur; data curation, G.Y. and H.A.; writing—original draft preparation, S.K.; G.Y.; M.Dokur; writing—review and editing, K.C.S.; S.C.; H.A.; M.D.; P.A. and E.A.; supervision, M.Dokur; project administration, G.Y; M.Dokur; funding acquisition, S.K.; K.C.S; S.C.; G.Y.; H.A.; M.D.; P.A.;E.A. and M.Dokur. All authors have read and agreed to the published version of the manuscript.
Funding
This research received no external funding
Institutional Review Board Statement
The study was conducted in accordance with the Declaration of Helsinki, and approved by the Biruni University Non-Interventional Ethics Committee (Approval No. 2021/49-05; Approval Date: March 19th,2021)
Informed Consent Statement
Informed consent was obtained from all subjects involved in the study.
Data Availability Statement
The original contributions presented in this study are included in the article. Further inquiries can be directed to the corresponding author.
Conflicts of Interest
The authors declare no conflicts of interest.
References
- Number of COVID-19 deaths reported to WHO.WHO COVID-19 dashboard/WHO Data/Cumulative total (April 13, 2025). Available online: https://data.who.int/dashboards/covid19/deaths? (accessed on day month year).
- Huang, C.; Wang, Y.; Li, X.; Ren, L.; Zhao, J.; Hu, Y.; Zhang, L.; Fan, G.; Xu, J.; Gu, X.; et al. Clinical features of patients infected with 2019 novel coronavirus in Wuhan, China. Lancet, 1022. [Google Scholar] [CrossRef]
- Chen, N.; Zhou, M.; Dong, X.; Qu, J.; Gong, F.; Han, Y.; Qiu, Y.; Wang, J.; Liu, Y.; Wei, Y.; et al. Epidemiological and clinical characteristics of 99 cases of 2019 novel coronavirus pneumonia in Wuhan, China: a descriptive study. Lancet, 1022. [Google Scholar] [CrossRef]
- Wu, Z.; McGoogan, J.M. Characteristics of and Important Lessons From the Coronavirus Disease 2019 (COVID-19) Outbreak in China: Summary of a Report of 72 314 Cases From the Chinese Center for Disease Control and Prevention. JAMA, 1239. [Google Scholar] [CrossRef]
- Oran, D.P.; Topol, E.J. The Proportion of SARS-CoV-2 Infections That Are Asymptomatic : A Systematic Review. Epub 2021 Jan 22. Ann Intern Med. [CrossRef]
- Centers for Disease Control and Prevention. COVID Data Tracker. Trends in United States COVID-19 Hospitalizations, Deaths, Emergency Department (ED) Visits, and Test Positivity by Geographic Area. https://covid.cdc.gov/covid-data tracker/#trends_weeklyhospitaladmissions_select_00 (Accessed on , 2025). 04 March.
- Xu, *!!! REPLACE !!!*; Z., *!!! REPLACE !!!*; Shi, L.; Wang, Y.; Zhang, J.; Huang, L.; Zhang, C.; Liu, S.; Zhao, P.; Liu, H.; Zhu, L. Xu; Z.; Shi, L.; Wang, Y.; Zhang, J.; Huang, L.; Zhang, C.; Liu, S.; Zhao, P.; Liu, H.; Zhu, L.; et al. Pathological findings of COVID-19 associated with acute respiratory distress syndrome. Lancet Respir Med. [CrossRef]
- Arentz, M.; Yim, E.; Klaff, L.; Lokhandwala, S.; Riedo, F.X.; Chong, M.; Lee, M. Characteristics and Outcomes of 21 Critically Ill Patients With COVID-19 in Washington State. JAMA, 1612. [Google Scholar] [CrossRef]
- Zhang, Y.; Gao, Y.; Qiao, L.; Wang, W.; Chen, D. Inflammatory Response Cells During Acute Respiratory Distress Syndrome in Patients With Coronavirus Disease 2019 (COVID-19). Ann Intern Med. [CrossRef]
- Wu, C.; Chen, X.; Cai, Y.; Xia, J.; Zhou, X.; Xu, S.; Huang, H.; Zhang, L.; Zhou, X.; Du, C.; et al. Risk Factors Associated With Acute Respiratory Distress Syndrome and Death in Patients With Coronavirus Disease 2019 Pneumonia in Wuhan, China. JAMA Intern Med. [CrossRef]
- Chand, S.; Kapoor, S.; Orsi, D.; Fazzari, M.J.; Tanner, T.G.; Umeh, G.C.; Islam, M.; Dicpinigaitis, P.V. COVID-19-Associated Critical Illness-Report of the First 300 Patients Admitted to Intensive Care Units at a New York City Medical Center. J Intensive Care Med. [CrossRef]
- Zhang, X.; Li, S.; Niu, S. ACE2 and COVID-19 and the resulting ARDS. Postgrad Med J, 1137. [Google Scholar] [CrossRef]
- Zhou, P.; Yang, X.L.; Wang, X.G.; Hu, B.; Zhang, L.; Zhang, W.; Si, H.R.; Zhu, Y.; Li, B.; Huang, C.L.; et al. A pneumonia outbreak associated with a new coronavirus of probable bat origin. Nature, 7798. [Google Scholar] [CrossRef]
- Glasser, J.R.; Mallampalli, R.K. Surfactant and its role in the pathobiology of pulmonary infection. Microbes Infect. [CrossRef]
- Spragg, R.G.; Lewis, J.F.; Wurst, W.; Häfner, D.; Baughman, R.P.; Wewers, M.D.; Marsh, J.J. Treatment of acute respiratory distress syndrome with recombinant surfactant protein C surfactant. Am J Respir Crit Care Med, 1562. [Google Scholar] [CrossRef]
- Katsura, H.; Sontake, V.; Tata, A.; Kobayashi, Y.; Edwards, C.E.; Heaton, B.E.; Konkimalla, A.; Asakura, T.; Mikami, Y.; Fritch, E.J.; et al. Human Lung Stem Cell-Based Alveolospheres Provide Insights into SARS-CoV-2-Mediated Interferon Responses and Pneumocyte Dysfunction. Cell Stem Cell. [CrossRef]
- Hartl, D.; Griese, M. Surfactant protein D in human lung diseases. Eur J Clin Invest. [CrossRef]
- Pérez-Gil, J. Structure of pulmonary surfactant membranes and films: the role of proteins and lipid-protein interactions. Biochim Biophys Acta, 1676. [Google Scholar] [CrossRef]
- Echaide, M.; Autilio, C.; Arroyo, R.; Perez-Gil, J. Restoring pulmonary surfactant membranes and films at the respiratory surface. Biochim Biophys Acta Biomembr, 1: Pt B), 1725. [Google Scholar] [CrossRef]
- Weaver, T.E.; Whitsett, J.A. Function and regulation of expression of pulmonary surfactant-associated proteins. Biochem J, 2: 2)(Pt 2). [CrossRef]
- Crouch, E.; Hartshorn, K.; Ofek, I. Collectins and pulmonary innate immunity. Immunol Rev. [CrossRef]
- Wright, JR. Immunomodulatory functions of surfactant. Physiol Rev. [CrossRef]
- Cheng, G.; Ueda, T.; Nakajima, H.; Nakajima, A.; Kinjyo, S.; Motojima, S.; Fukuda, T. Suppressive effects of SP-A on ionomycin-induced IL-8 production and release by eosinophils. Int Arch Allergy Immunol, 5: Suppl 1. [CrossRef]
- Chait, M.; Yilmaz, M.M.; Shakil, S.; Ku, A.W.; Dogra, P.; Connors, T.J.; Szabo, P.A.; Gray, J.I.; Wells, S.B.; Kubota, M.; et al. Immune and epithelial determinants of age-related risk and alveolar injury in fatal COVID-19. JCI Insight, 1576. [Google Scholar] [CrossRef]
- Salvioni, L.; Testa, F.; Sulejmani, A.; Pepe, F.; Giorgio Lovaglio, P.; Berta, P.; Dominici, R.; Leoni, V.; Prosperi, D. Vittadini G, et al. Surfactant protein D (SP-D) as a biomarker of SARS-CoV-2 infection. Clin Chim Acta. [CrossRef]
- Takenaka, H.; Saito, A.; Kuronuma, K.; Moniwa, K.; Nishikiori, H.; Takahashi, S.; Chiba, H. The Soluble Lectin Families as Novel Biomarkers for COVID-19 Pneumonia. In Vivo, 1721. [Google Scholar] [CrossRef]
- Mapelli, M.; Salvioni, E.; Mattavelli, I.; Banfi, C.; Ghilardi, S.; Greco, A.; Biondi, M.L.; Rovai, S.; Mancini, E.; Harari, S.; et al. Surfactant-derived protein type B: a new biomarker linked to respiratory failure and lung damage in mild to moderate SARS-CoV-2 pneumonia. ERJ Open Res, 0030. [Google Scholar] [CrossRef]
- Gerosa, C.; Fann, D.; Cau, F.; Ravarino, A.; Senes, G.; Demontis, R.; Coni, P.; Piras, M.; Orrù, G.; Coghe, F.; et al. Immunohistochemical findings in the lungs of COVID-19 subjects: evidence of surfactant dysregulation. Eur Rev Med Pharmacol Sci, 4639. [Google Scholar] [CrossRef]
- Sjoding, M.W.; Admon, A.J.; Saha, A.K.; Kay, S.G.; Brown, C.A.; Co, I.; Claar, D.; McSparron, J.I.; Dickson, R.P. Comparing Clinical Features and Outcomes in Mechanically Ventilated Patients with COVID-19 and Acute Respiratory Distress Syndrome. Ann Am Thorac Soc, 1876. [Google Scholar] [CrossRef]
- Vahidy, F.S.; Drews, A.L.; Masud, F.N.; Schwartz, R.L.; Askary, B.B.; Boom, M.L.; Phillips, R.A. Characteristics and Outcomes of COVID-19 Patients During Initial Peak and Resurgence in the Houston Metropolitan Area. JAMA 2020,324(10):998-1000. [CrossRef]
- Grasselli, G.; Pesenti, A.; Cecconi, M. Critical Care Utilization for the COVID-19 Outbreak in Lombardy, Italy: Early Experience and Forecast During an Emergency Response. JAMA, 1545. [Google Scholar] [CrossRef]
- Gupta, S.; Hayek, S.S.; Wang, W.; Chan, L.; Mathews, K.S.; Melamed, M.L.; Brenner, S.K.; Leonberg-Yoo, A.; Schenck, E.J.; Radbel, J.; et al. , Leaf DE; STOP-COVID Investigators. Factors Associated With Death in Critically Ill Patients With Coronavirus Disease 2019 in the US. JAMA Intern Med, 1436. [Google Scholar] [CrossRef]
- Schousboe, P.; Ronit, A.; Nielsen, H.B.; Benfield, T.; Wiese, L.; Scoutaris, N.; Verder, H.; Berg, R.M.G.; Verder, P.; Plovsing, R.R. Reduced levels of pulmonary surfactant in COVID-19 ARDS. Sci Rep, 4040. [Google Scholar] [CrossRef]
- Tong, M.; Xiong, Y.; Zhu, C.; Xu, H.; Zheng, Q.; Jiang, Y.; Zou, L.; Xiao, X.; Chen, F.; Yan, X.; et al. Serum surfactant protein D in COVID-19 is elevated and correlated with disease severity. BMC Infect Dis. [CrossRef]
- Bastani, M.N.; Jalilian, S. Unraveling the enigma: The emerging significance of pulmonary surfactant proteins in predicting, diagnosing, and managing COVID-19. Immun Inflamm Dis, 1302. [Google Scholar] [CrossRef]
- Maddaloni, L.; Zullino, V.; Bugani, G.; Lazzaro, A.; Brisciani, M.; Mastroianni, C.M.; Santinelli, L.; Ruberto, F. Could SP-A and SP-D Serum Levels Predict COVID-19 Severity? Int J Mol Sci, 5620. [Google Scholar] [CrossRef]
- Floros, J.; Phelps, D.S. Is the role of lung innate immune molecules, SP-A1 and SP-A2, and of the alveolar macrophage being overlooked in COVID-19 diverse outcomes? Pneumon.
- Das, A.; Meng, W.; Liu, Z.; Hasib, M.M.; Galloway, H.; Ramos da Silva, S.; Chen, L.; Sica, G.L.; Paniz-Mondolfi, A.; Bryce, C.; et al. Molecular and immune signatures, and pathological trajectories of fatal COVID-19 lungs defined by in situ spatial single-cell transcriptome analysis. J Med Virol, 2900. [Google Scholar] [CrossRef]
- Islam, A.B.M.M.K.; Khan, M.A. Lung transcriptome of a COVID-19 patient and systems biology predictions suggest impaired surfactant production which may be druggable by surfactant therapy. Sci Rep, 1939. [Google Scholar] [CrossRef]
- Sicher, N.; Aldrich, B.; Zhang, S.; Mazur, L.; Juarez, S.; Lehman, E.; Liu, D.; Gandhi, C.K. Surfactant protein levels and genetic variants as biomarkers for COVID-19 severity in children. Am J Physiol Lung Cell Mol Physiol. [CrossRef]
- Numata, M.; Voelker, D.R. Anti-inflammatory and anti-viral actions of anionic pulmonary surfactant phospholipids. Biochim Biophys Acta Mol Cell Biol Lipids, 1591. [Google Scholar] [CrossRef]
- Bersten, A.D.; Hunt, T.; Nicholas, T.E.; Doyle, I.R. Elevated plasma surfactant protein-B predicts development of acute respiratory distress syndrome in patients with acute respiratory failure. Am J Respir Crit Care Med. [CrossRef]
- Dushianthan, A.; Grocott, M.P.W.; Murugan, G.S.; Wilkinson, T.M.A.; Postle, A.D. Pulmonary Surfactant in Adult ARDS: Current Perspectives and Future Directions. Diagnostics (Basel), 2964. [Google Scholar] [CrossRef]
Figure 1.
Relative gene expression levels of (A) SFTPA1, (B) SFTPA2, (C) SFTPB, (D) SFTPC, and (E) SFTPD across the three groups. Each dot represents the Log 2-ΔCt value, and the bar indicates the range from minimum to maximum. The Mann-Whitney U test was used for pairwise group comparisons. *p≤0.05, **p≤0.01, ***p≤0.001.
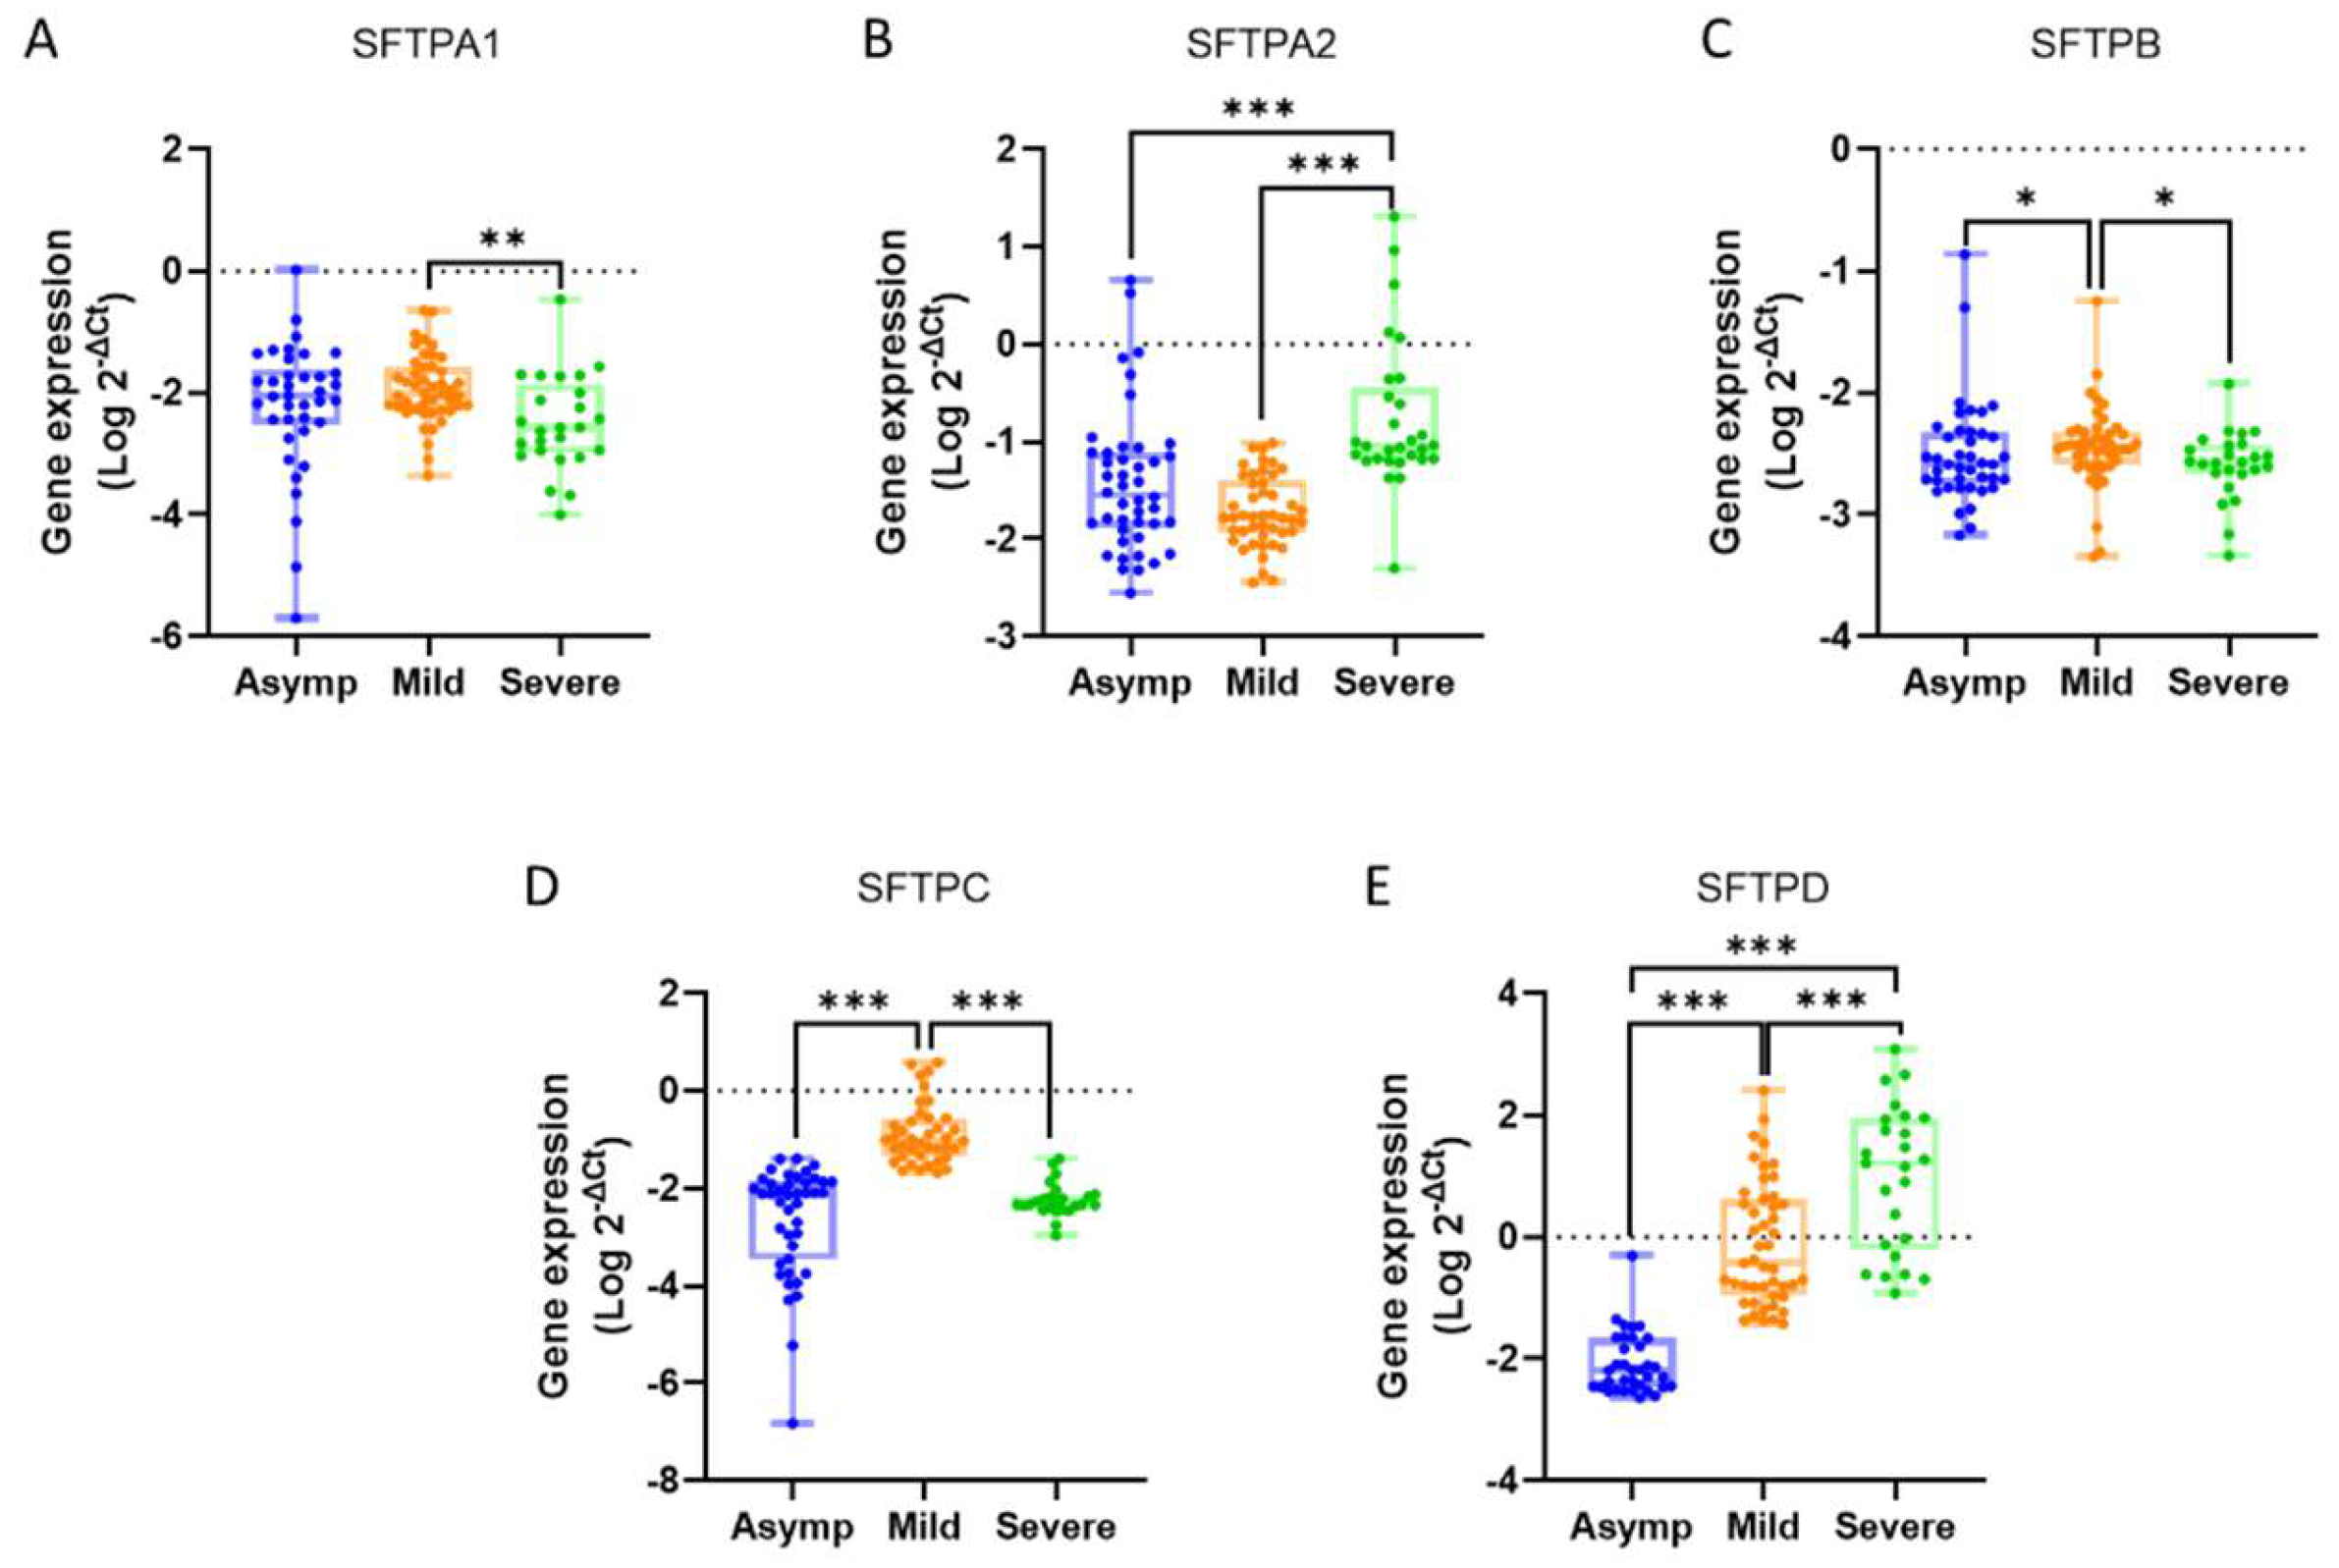

Table 1.
The demografic distribution of the participants
| Asymp (n=44) | Mild(n=48) | Severe(n=30) | ||
|---|---|---|---|---|
| Age (years) | 30.3 ± 1.7 | 33.8 ± 2.3 | 59.2 ± 2.8 | |
| Sex | ||||
| Male | 18 | 18 | 19 | |
| Female | 26 | 30 | 11 | |
| Smoking status | 19 | 14 | 25 | |
| Comorbidities | ||||
| HT | 7 | 6 | 14 | |
| DM | 6 | 3 | 2 | |
| CAD | 1 | 3 | ||
| Symptoms | ||||
| Fever | 41 | 3 | ||
| Fatigue | 42 | 2 | ||
| Sepsis | 1 | 27 | ||
| ARDS | 1 | 24 | ||
| BP | 2 | 2 | ||
Data was shown as mean ± standart error of mean, or number. HT,Hypertension; DM,Diabetes Mellitus; CAD, Coronary Artery Disease; ARDS, Acute Respiratory Distress Syndrome; BP, bronchopneumonia.
Table 2.
The primer sequences of the expression analysis.
| Name | Sequence (5'-3') |
|---|---|
| SFTPA1_sense | CTCCTGGAAATGATGGGCTGC |
| SFTPA1_antisense | GTCTAAAGTCGTGGAGTGTGGC |
| SFTPA2_sense | TGGAGAGCGTGGAGAGAAGG |
| SFTPA2_antisense | TGATGTCTGAAGTCGTGGAGTG |
| SFTPB_sense | CACCTCATCCTTGGCCTGTG |
| SFTPB_antisense | CTTGGCATAGGTCATCGGCTC |
| SFTPC_sense | GCCTTCTTATCGTGGTGGTGG |
| SFTPC_antisense | TGGTAACCAGGTGCTCACTCA |
| SFTPD_sense | GGAGCAAAGGGAGAAAGTGGG |
| SFTPD_antisense | CTGAGAGAAAGCAGCCTGGAG |
| GAPDH_sense | GAGTCAACGGATTTGGTCGT |
| GAPDH_antisense | GACAAGCTTCCCGTTCTCAG |
Data was shown as mean ± standart error of mean, or number (percent). HT, hypertension; DM, diabetes mellitus; CAD, coronary artery disease; ARDS, Acute respiratory distress syndrome; BP, Bronchopneumonia. Values with p<0.05 are highlighted in bold. a Kruskal Wallis Test, b Chi Square Test, c Fisher Exact Test.
Table 3.
Demographic evaluation of the participants.
 |
Data was shown as mean ± standart error of mean, or number (percent). HT, hypertension; DM, diabetes mellitus; CAD, coronary artery disease; ARDS, Acute respiratory distress syndrome; BP, Bronchopneumonia. Values with p<0.05 are highlighted in bold. a Kruskal Wallis Test, b Chi Square Test, c Fisher Exact Test.
Table 4.
Relative comparison of gene expression among the groups.
| Mild/Asymp | Severe/Asymp | Severe/Mild | ||||
|---|---|---|---|---|---|---|
| Genes | Fold Change | p-value | Fold Change | p-value | Fold Change | p-value |
| SFTPA1 | -1.70 | 0.3997 | -2.31 | 0.0632 | -1.36 | 0.0013 |
| SFTPA2 | -9.74 | 0.0663 | 5.13 | <0.0001 | 50.02 | <0.0001 |
| SFTPB | -1.44 | 0.0482 | -2.50 | 0.7874 | -1.73 | 0.0120 |
| SFTPC | 48.74 | <0.0001 | -1.10 | 0.9741 | -53.84 | <0.0001 |
| SFTPD | 454.47 | <0.0001 | 4345.92 | <0.0001 | 9.56 | 0.0002 |
The 2-ΔCt values were compared among the groups. The Mann-Whitney U test was applied, and values with p<0.05 are highlighted in bold.
Table 5.
Evaluation of the correlation between gene expression levels across all groups.
| Asymptomatic | Mild | Severe | ||||
|---|---|---|---|---|---|---|
| Gene Pair | r | p-value | r | p-value | r | p-value |
| SFTPA1-SFTPA2 | 0.307 | 0.0541 | 0.673 | <0.0001 | 0.020 | 0.9258 |
| SFTPA1-SFTPB | -0.080 | 0.6345 | 0.102 | 0.5062 | 0.370 | 0.0748 |
| SFTPA1-SFTPC | 0.001 | 0.9946 | -0.492 | 0.0015 | -0.049 | 0.8281 |
| SFTPA1-SFTPD | -0.396 | 0.0273 | -0.549 | 0.0001 | -0.653 | 0.0007 |
| SFTPA2-SFTPB | 0.024 | 0.8781 | 0.037 | 0.8105 | -0.033 | 0.8671 |
| SFTPA2-SFTPC | 0.058 | 0.7115 | -0.537 | 0.0004 | -0.059 | 0.7785 |
| SFTPA2-SFTPD | -0.092 | 0.5974 | -0.499 | 0.0004 | 0.074 | 0.7243 |
| SFTPB-SFTPC | -0.013 | 0.9341 | -0.083 | 0.6126 | 0.050 | 0.8150 |
| SFTPB-SFTPD | 0.046 | 0.7949 | -0.254 | 0.0927 | -0.230 | 0.2787 |
| SFTPC-SFTPD | 0.161 | 0.3705 | 0.772 | <0.0001 | -0.037 | 0.8712 |
Spearman's test was applied. r represents the correlation coefficient. Values with p<0.05 are highlighted in bold.
Disclaimer/Publisher’s Note: The statements, opinions and data contained in all publications are solely those of the individual author(s) and contributor(s) and not of MDPI and/or the editor(s). MDPI and/or the editor(s) disclaim responsibility for any injury to people or property resulting from any ideas, methods, instructions or products referred to in the content. |
© 2025 by the authors. Licensee MDPI, Basel, Switzerland. This article is an open access article distributed under the terms and conditions of the Creative Commons Attribution (CC BY) license (http://creativecommons.org/licenses/by/4.0/).
Copyright: This open access article is published under a Creative Commons CC BY 4.0 license, which permit the free download, distribution, and reuse, provided that the author and preprint are cited in any reuse.


