Submitted:
05 May 2025
Posted:
06 May 2025
You are already at the latest version
Abstract
Chalcone derivatives with intriguing optical and electrochemical properties have been synthesized and systematically studied for their potential as anticancer agents. This article, insights strategically synthesis followed by their spectroscopic, computational, electrochemical, and biological studies of 3-(naphthalen-3-yl)-1-phenylprop-2-en-1-one (3NPEO). The absorption and emission bands witness 320-370 nm and 375–462 nm respectively. The solvatochromic effect was investigated in different solvents of various polarities with significant Stokes shifts (50–87 nm) indicating intramolecular charge transfer (ICT) in the excited state. Molar absorptivity (1.7–4.26 × 10⁴ M⁻¹ cm⁻¹) and fluorescence quantum yields (0.368–0.917) were determined, along with nonlinear optical properties in solution. Cyclic voltammeter is employed to analyze Electrochemical parameters, while quantum chemical calculations (DFT) by B3LYP/G(d,p) in chloroform confirmed promising results with experimental data. Molecular docking and dynamics simulations revealed strong interactions with the progesterone receptor enzyme, supported by structure-activity relationship (SAR) analyses. In vitro cytotoxicity assays on the MDAMB-231 cell line demonstrated moderate tumor cell inhibitory activity, with apoptosis studies confirming early and late apoptosis induction. These results suggest that the title compound holds promise as a potential anticancer agent.
Keywords:
Stoke’s shift
; fluorescence quantum yield
; cyclic voltammetry
; Nonlinear optics (NLO)
; molecular docking
; molecular dynamics simulations
; flow cytometry
; apoptotic pathway
1. Introduction
Chalcone derivatives, a prominent subclass of open-chain flavonoids, have gained considerable devotion owing to their versatile applications across various scientific domains. These compounds, biosynthesized by plants and synthetically accessible via robust methods [1], are illustrated by two aromatic rings connected through a ketoethylenic α,β-unsaturated carbonyl system. Their structural features, including extensive π-electron delocalization, facilitate the synthesis of novel derivatives and enhance their functional versatility [2,3,4].
Traditionally used as dyes, chalcone derivatives now serve as critical tools for studying photo-induced electron transfer processes [5,6,7,8,9]. Their chromophoric properties and diverse biological activities position them as valuable resources in chemistry, optics, and biology. Applications extend to optoelectronics, nonlinear optical materials, dye-sensitized solar cells, and bioimaging. Their D–π–A framework and photophysical attributes, such as UV–vis absorption (redshift), Stokes shifts, intramolecular charge transfer, fluorescence quantum yield [10], and light stability, make them ideal for high-efficiency electron transport, photoluminescence [11], material science, and optics [12] and biological imaging [13]. In addition to it chalcones have revealed attention-grabbing biomedical applications, namely antimicrobial [14], antifungal [15], antiviral [16], antimalarial [17], antituberculosis [18], antioxidant [19], and anticancer [20].
Chalcones also exhibit significant nonlinear optical (NLO) capabilities, sensitive to electric fields, have been utilized in photonic devices [21,22], optical switching [21], data processing, and waveguide modulators [21,22,23,24]. Furthermore, the electrochemical behavior of chalcone derivatives, governed by their conjugated α,β-unsaturated carbonyl structure and substituent effects, provides insights into their redox properties and stability. This renders them promising candidates for applications in catalysis, photophysics, and biomedical fields, including anticancer therapies [25,26].
With a curiosity to explore the title compound, in the recent work, we focus on photophysical characteristics, nonlinear optical properties and electrochemical analysis. Further, we tried to correlate with theoretical studies of highest occupied molecular orbital (HOMO)/lowest unoccupied molecular orbital (LUMO) energy level, molecular electrostatic potential (MEP). The elaborated photophysical and photochemical features are integral characteristics of chalcone derivatives which have yet to undergo systematic investigation for potential biological applications. Wide literature survey validates that the chalcone derivatives are impressive contenders for antibacterial, antifungal, anti-inflammatory, and anticancer properties. By adding several functional groups like aryls, halogens, hydroxyls, carboxyls
phenyl, etc. [27] empower chalcones to reveal a broad spectrum of biological activities. In view of this, we have emphasized on the approaches to develop the target compound as a probable candidate as an anticancer agent. However, there are no reports available in literature and no prior research has been conducted on this class of molecules. Therefore, we have performed a molecular docking, dynamics simulations, in-vitro cytotoxicity assays on specific cell line which has demonstrated a moderate tumor cell inhibitory activity, with apoptosis studies.
2. Materials and Methods
2.1. Materials
The required analytical grade chemicals and reagents were procured from Sigma Aldrich. The spectrum of spectroscopic graded solvations with diverse polarities were employed for evaluates solvatochromism. The concentration of solutions prepared was 1X10⁻⁵ M to evade self-absorption and aggregation. All solvatochromic studies were plotted and analysed via Origin 8.0 software.
2.1.1. Design and Synthesis
All organic chemicals and solvents were of spectroscopic graded and purchased from Sigma-Aldrich, utilized without additional refinement. The title compound 3-(naphthalen-3-yl)-1-phenylprop-2-en-1-one (3NPEO) is blended by the Claisen–Schmidt condensation protocol. Acetophenone (1.0 mmol) and 2-naphthaldehyde (1.0mmol) were dissolved in 30ml of ethanol. Sodium hydroxide (1.0 mmol) was added. The reaction mixture was refluxed for four hours. Progress of the reaction was monitored by TLC. After completion of the reaction, the reaction mixture was quenched to ice cold water, solid dispersed was filtered and recrystallized using ethanol [28,29,30]. The molecular structure is displayed in Figure 1.
2.2. Instrumentation
2.2.1. UV-Vis Spectroscopy
The optical properties of exploratory molecule [3NPEO] was planned at 1x10⁻⁵ M concentration in variety of dissolvable. The excitation spectra were traced by employing two-fold beam UV-VIS Spectrophotometer (Analytic Jena Specord 210 plus) in the wavelength range of 200 to 800 nm.
2.2.2. FT-IR and NMR
The FT-IR spectrum was acquired by Perkin Elmer Spectrophotometer in the scan region 4000-450 cm-1 with a resolution of 2 cm-1 and 100 numbers of scans using KBr pellet. Bruker 400 MHz spectrometer is engaged to record 1H NMR and 13C NMR spectra and DMSO-d6 as solvent and TMS as an internal standard. The chemical shifts are documented in δ ppm with reference to the residual solvent signal.
2.2.3. Photoluminescence Spectroscopy and Fluorescence Quantum Yield (Φf)
The molecule’s fluorescence emission spectra were recorded by a Fluorescence spectrophotometer (Hitachi F - 7000) at USIC, Karnataka University, Dharwad, India at room temperature. Spectral records were quantified at ambient temperature. The fluorescence quantum yield (Φ) was computed by employing a typical comparative scheme comparative to standard Tryptophan by using the following relationship,
where all the notations signify their usual meaning. The theory of fluorescence quantum yield is discussed in supplementary Th-S2.
2.2.4. Nonlinear Optical Measurements
The nonlinear optical (NLO) properties of the sample was studied utilizing standard and sensitive Z-Scan experimental procedure, which springs the statistics about nonlinear absorption and nonlinear refraction coefficients [31]. The sample was transferred in the visible region; hence one can measure the nonlinear optical properties in the wavelength of interest, and we performed our experiment at 532nm. The open aperture z-scan measure the nonlinear absorption whereas the closed aperture z-scan measures the nonlinear refraction. The experimental setup is shown in Figure S1. The optical limiting properties were studied with the open aperture scan only which gives the radiance dependent transmission through elevated accuracy. A constant energy beam of laser is focused by means of a lens, and maximum beam intensity is observed the focal point (z=0) and diminishes gradually on either side (as z is decreased). Then the sample is decoded through the beam and the transmission T(z) is quantified. A graph of z vs. T(z) evidences the intensity reliant on transmission, the diversity of the nonlinearity and the pertinent nonlinear coefficients [32]. Sample was dissolved in a DMF solvent with the concentration 0.01 M collected in a quartz cuvette and mounted on a stepper motor controlled by linear translation phase. The linear transmittance was adjusted to be 75% at 532nm. The experiment was conducted utilizing a continuous-wave diode-pumped solid-state (DPSS) laser, operating at 532nm wavelength and 200 mW input power. Data acquisition was accomplished using a fully automated interface.
2.2.5. Computational Methods
The theoretical study of the title molecule was carried out by means of Gaussian 16 software [33] and further Gauss View 6.0 program was employed. DFT and TD-DFT were used to optimized the molecular geometry of 3NPEO by employing B3LYP/6-311G(d,p) were calculate electronic and spectroscopic parameters. The HOMO, LUMO and energy gap values, The Global Chemical Reactivity Descriptors (GCRD) and Molecular Electrostatic Potential (MEP) were calculated.
2.2.6. Electrochemical Characterization
The electrochemical characteristics of 3NPEO compound were systematically examined using Cyclic Voltammetry (CV) on a CHI 6156e workstation with a three-electrode cell system. The analysis was conducted at room temperature in anhydrous acetonitrile, employing a 0.1 M solution of tetrabutylammonium hexafluorophosphate (nBu4NPF6) as the supporting electrolyte. A scan rate of 100 mVs−1 was applied within a voltage range of −1.2 to 0.8 V. The glassy carbon electrode was employed as the working electrode, the Pt wire was applied as the counter electrode, and the Ag/AgCl electrode was engaged as the reference electrode. The surface of the working electrode was sterilized thereafter each scan by mechanical polishing via alumina slurry.
The below mentioned empirical relation has been employed to estimate the highest occupied molecular orbital energy.
where Eₒₓ represents the onset of the corresponding oxidation potential peak, and E₁/₂ (ferrocene) denotes the onset of the oxidation potential peak of the ferrocene redox couple used as a reference. The energy of lowest unoccupied molecular orbital was estimated by employing the following relation.
where Egopt is the optical band gap evaluated by applying the formula 1240/λonset, where λonset is the long edge of absorption spectra.
HOMO= - {[Eox- E1/2 ferrocene] + 4.8} ev
LUMO= - [HOMO + Egopt] ev
2.3. Biological Evaluation
2.3.1. Structure Preprocessing, Validation and Molecular Docking
The progesterone receptor with bound ulipristal acetate and a peptide from the corepressor SMRT structure generated through X-ray diffraction was downloaded from the Research Collaboratory for Structural Bioinformatics Protein Data Bank (PDB ID: 4OAR). All water molecules and heteroatoms were removed from the downloaded pdb file to obtain a clean protein structure. As the structure contained missing residues, homology modeling through MODELLER 10.2 [34] was adopted to remodel the incomplete structure. The generated model was further subjected to ERRAT and PROCHECK programs hosted on the UCLA-DOE Lab - SAVES v6.0 (https://saves.mbi.ucla.edu/). The validated model is then subjected to molecular docking with AutoDock4 assisted through AutoDockTools [35]. Polar hydrogens and appropriate charges were added to the protein structure, and the pdbqt file was generated. Similarly, the optimized ligand structure was embedded and converted to pdbqt format using AutoDockTools. Reference-based active site docking was performed considering the grid box coordinates around the co-crystallized ligand in 4OAR with X, Y, Z grid centre 14.5X24.8X14.8 and Grid size of 20.6X20.9X18.3. A total of 9 docking runs were performed, and the best pose was selected for further analysis.
2.3.2. Molecular Dynamic Simulation and Trajectory Analysis
MD simulations of the Native protein structure (4OAR-APO) and the protein-ligand complex (4OAR-CMP6) were accomplished by means of GROMOS 54A7 force field using GROMACS-2020.6 simulation package. The Automated Topology Builder generated the ligand topology [36]. ATB generates the heteroatom topology by decomposing the molecule into its constituent atoms and bonds, assigning force field parameters to each atom and bond. Finally, it generates a force field topology file for the molecule. To incorporate the hydrogens of heavy atoms, the pdb2gmx module of GROMACS was utilized. Additionally, the H++ server specifies the protonation states of each amino acid [37]. The formulated arrangements underwent preliminary vacuum attenuation of 1500 steps by means of the sharpest descent algorithm to initiate the process. Subsequently, the structures were solvated in a cubic periodic box employing the TIP3P water model, with the water extending 10 Å beyond the protein on all sides [38]. The structures were then negated, and an ionic strength of 0.15 M was sustained by introducing suitable number of Na+ and Cl− hostage ions. Wide-ranging rounds of diminishment and thermal equilibrium were conducted to eliminate any overlaps or adjacent proximities of the additional water and ions to the biomolecular assembly, as well as to diminish the protein from its lattice-constrained configuration in the crystal. Notably, an energy depletion step of 2500 steps was carried out using the steepest descent algorithm. Under isobaric and isothermal conditions the solvent density was adjusted to 1 bar and 310 K by means of Parrinello−Rahman barostat through an isotropic pressure coupling with a coupling constant of 0.1 ps [39]. Then both arrangements were equalized in the NPT assemble with an interval 2 fs for 10 ns each. The enduring electrostatic interrelationships were accomplished by means of particle-mesh Ewald sum with a cutoff of 1.0 nm [40]. The van der Waals interrelationships were concluded elsewhere the optimim of 1.0 nm, and the LINCS algorithm was employed to compel all bonds connecting hydrogen atoms [41]. The NPT equilibration phase was crucial for achieving the convergence of energy components and mass density. The consequential assembly from the NPT steadiness phase was then exploited for the concluding output run in the NPT ensemble, spanning a chemical time of 500 ns. Trajectory analysis with the GROMACS analysis utilities was done to estimate the Root-mean-square deviation (RMSD) (backbone), Root mean square fluctuation (RMSF) calculation (C-α), Radius of gyration (Rg), and Solvent Accessible Surface Area (SASA).
2.3.3. Free Energy and Decomposition
To comprehend the binding free energy (ΔG binding) of the substrate or inhibitor with the protein over the course of the simulation, we implemented the Molecular Mechanics Poisson-Boltzmann Surface Area (MM-PBSA) approach [42]. This allowed us to gain insights into the energetic contributions of the binding process. The binding free energy estimation was performed using the g_mmpbsa software [43], ensuring a precise determination of the energetic landscape. The ΔG was computed over the last 300 ns to accurately determine the binding free energy, with a window size of 200 ns. We derived the free energy of binding by computing the distinction between the bound and unbound states. This approach provided a comprehensive understanding of the thermodynamics underlying the molecular interactions within the system, aiding in the elucidation of crucial aspects of the binding mechanism. Further, the residue contribution towards the binding was also calculated through decomposition.
2.3.4. Free Energy and Decomposition
To comprehensively assess the binding free energy (ΔG binding) between the inhibitor and the protein during the simulation, we employed the Molecular Mechanics Poisson-Boltzmann Surface Area (MM-PBSA) methodology [69]. This approach facilitated a thorough examination of the energetic components involved in the binding process. The g_mmpbsa software [70] was utilized to accurately determine the binding free energy, ensuring precise insights into the energetics of the system. To ensure robust calculations, the ΔG was computed over the final 300 ns, with a window size of 200 ns, allowing for a comprehensive understanding of the binding progression amongst the ligand and the protein, as outlined in prior studies [71]. This strategy enabled a comprehensive exploration of the thermodynamic underpinnings of the molecular interactions, facilitating a deeper comprehension of the critical facets of the binding mechanism. Additionally, the influence of each deposit towards the binding was determined through a comprehensive decomposition analysis, shedding light on the specific amino acids pivotal to the binding process [72].
2.3.5. Cytotoxicity Studies
The MTT (3-(4,5-dimethylthiazol-2-yl)-2,5-diphenylbyetrazolium bromide assay is used extensively in breast cancer research to assess cell viability and proliferation. This colorimetric assay is instrumental in investigating the effect of various treatments, compounds, or experimental conditions on breast cancer cell lines. By measuring the metabolic activity of cells, the MTT assay provides valuable insights into the efficacy of potential therapeutic interventions. This study employed the MTT assay to evaluate the cytotoxic effects of 3-(naphthalen-3-yl)-1-phenylprop-2-en-1-one on the MDAMB-231 Cell line. Our methodology involved treating MDAMB-231 and normal MTT L929 cells with 3-(naphthalen-3-yl)-1-phenylprop-2-en-1-one, followed by the addition of the MTT reagents, which is subsequently reduced by metabolically active cells to form formazan crystals. The optical density, measures at 570 nm, serves as an indicator of cell viability. This method allows for a quantitative assessment of cell health and is a pivotal component of our research, shedding light on the potential effectiveness of novel strategies in managing breast cancer [44].
2.3.6. Apoptosis by Flow Cytometer
The cells were seeded in a 6-well flat bottom microplate containing coverslips and maintained overnight at 370C in a CO2 incubator. The GI50 concentrations of each sample were treated at 24 hrs. After the incubation, cells were washed with PBS twice. Centrifuge for 5 minutes at 500 x g at 4°C. Discard the supernatant, and resuspend the cell pellets in ice-cold 1X Binding Buffer to 1 x 10⁶ per mL. Keep tubes on ice. Then add 5 µl of AbFlour 488 Annexin V and 2 µL PI and Mix gently. Keep tubes on ice and incubate for 15 minutes in the dark. Add 400 µL of ice-cold 1X binding buffer and mix gently. Analyze cell preparations within 30 minutes by flow cytometry. The analysis was done using FlowJoX 10.0.7 software [44].
3. Results and Discussions
3.1. Structural Analysis
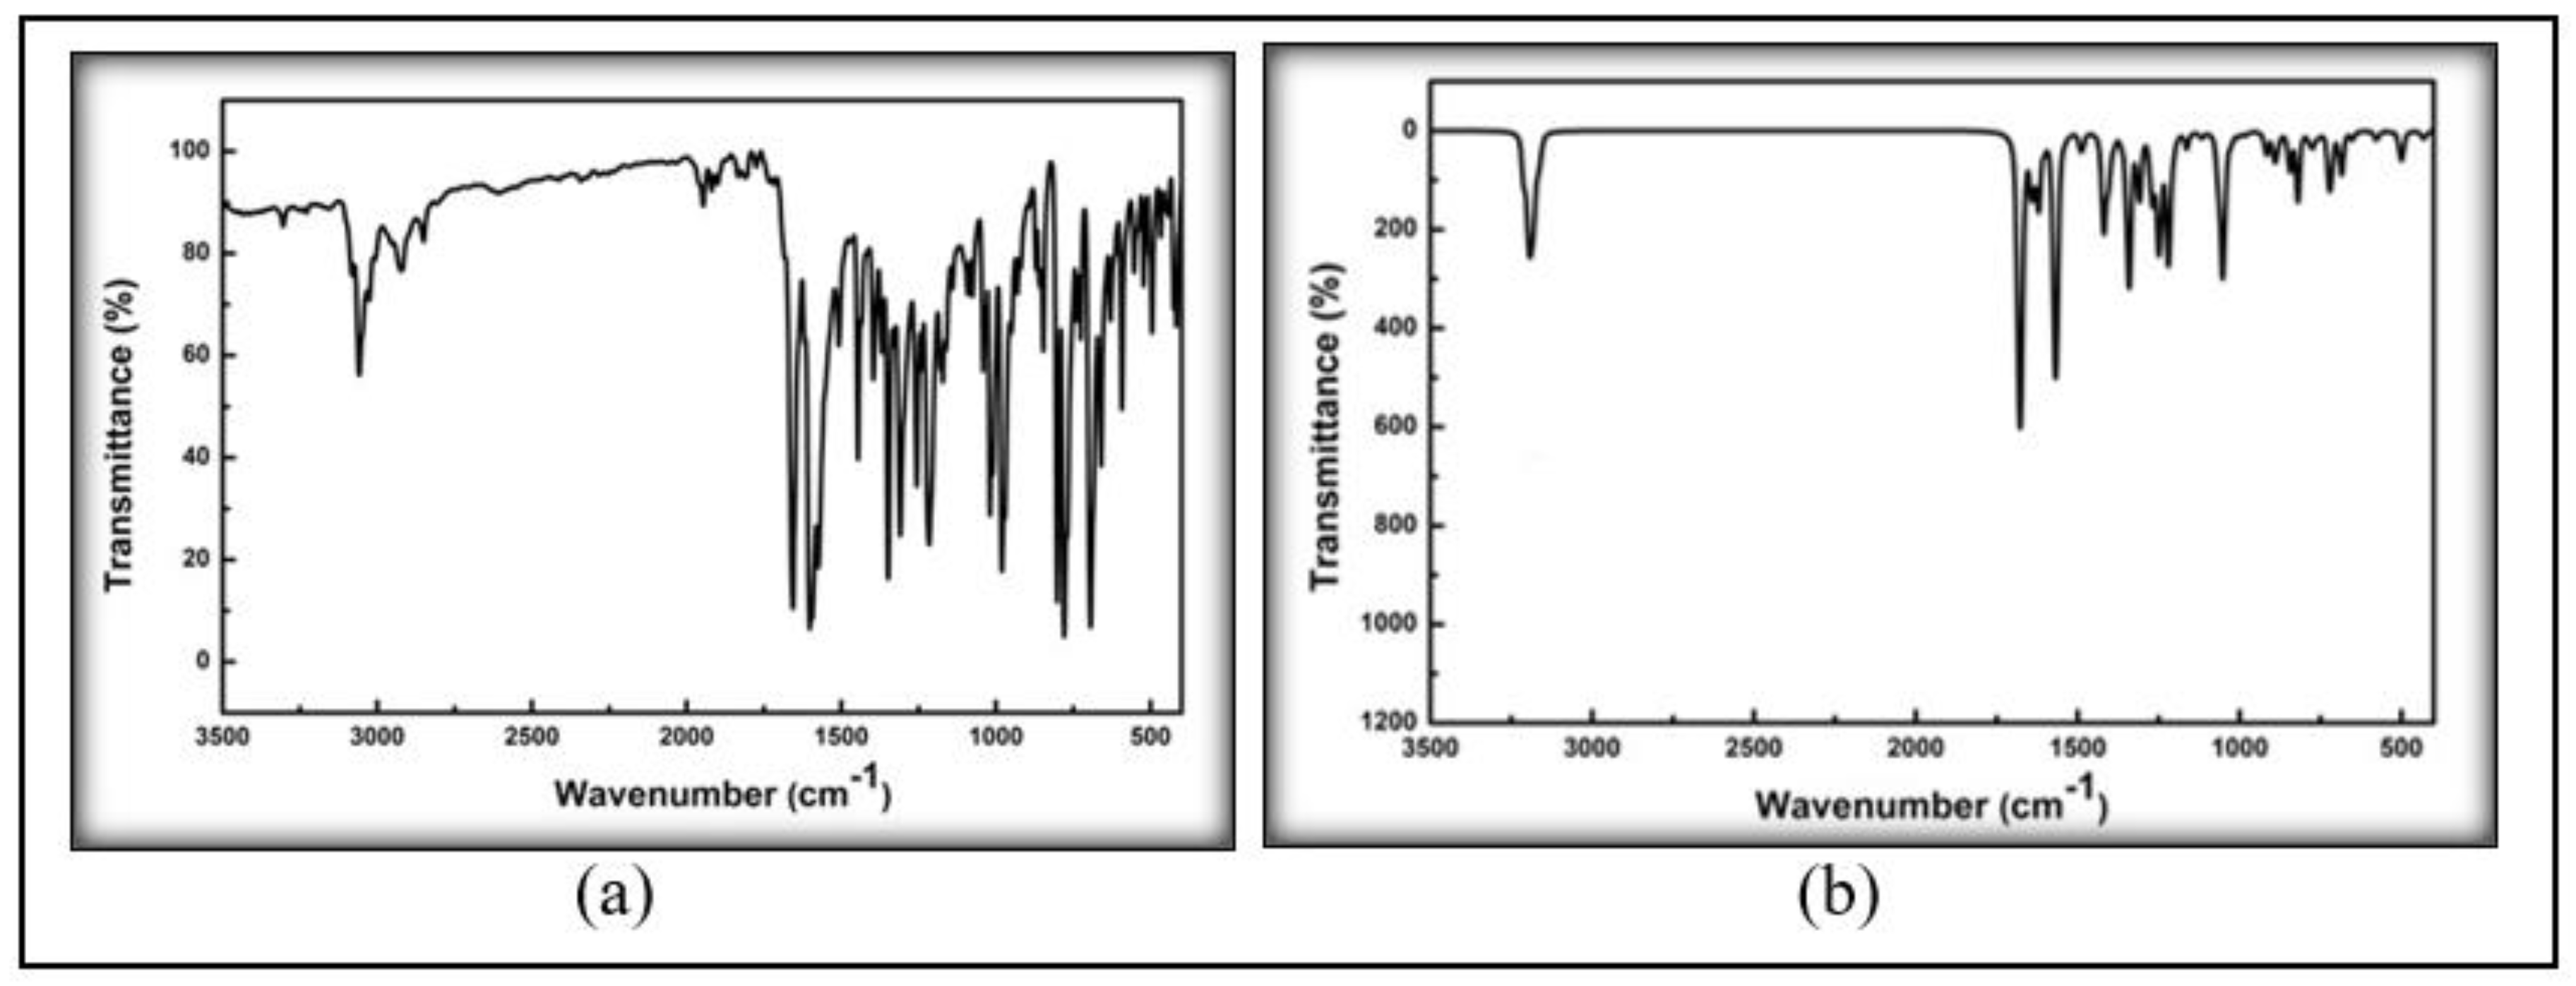
The molecular structure of synthesized molecule 3-(naphthalen-3-yl)-1-phenylprop-2-en-1-one (3NPEO) is as shown in Figure 1. The FTIR and NMR serves as the dominant spectroscopic tool for the structural identification and associated functional group of the molecule. The test molecule 3NPEO is ananlysied by FTIR spectroscopy. The corresponding experimental and theoretical spectra are given in Figures 2a and 2b respectively.
The FTIR spectrum of 3NPEO shows characteristic stretching bands at 1680 cm-1(koto carbonyl stretching), 1620 cm-1(C=C stretching), 3050 cm-1(C-H stretching). It can be observed that, there is a good correlation between experimental and theoretical graphs.
Figure 2.
Experimental and simulated FT-IR spectra of 3NPEO.
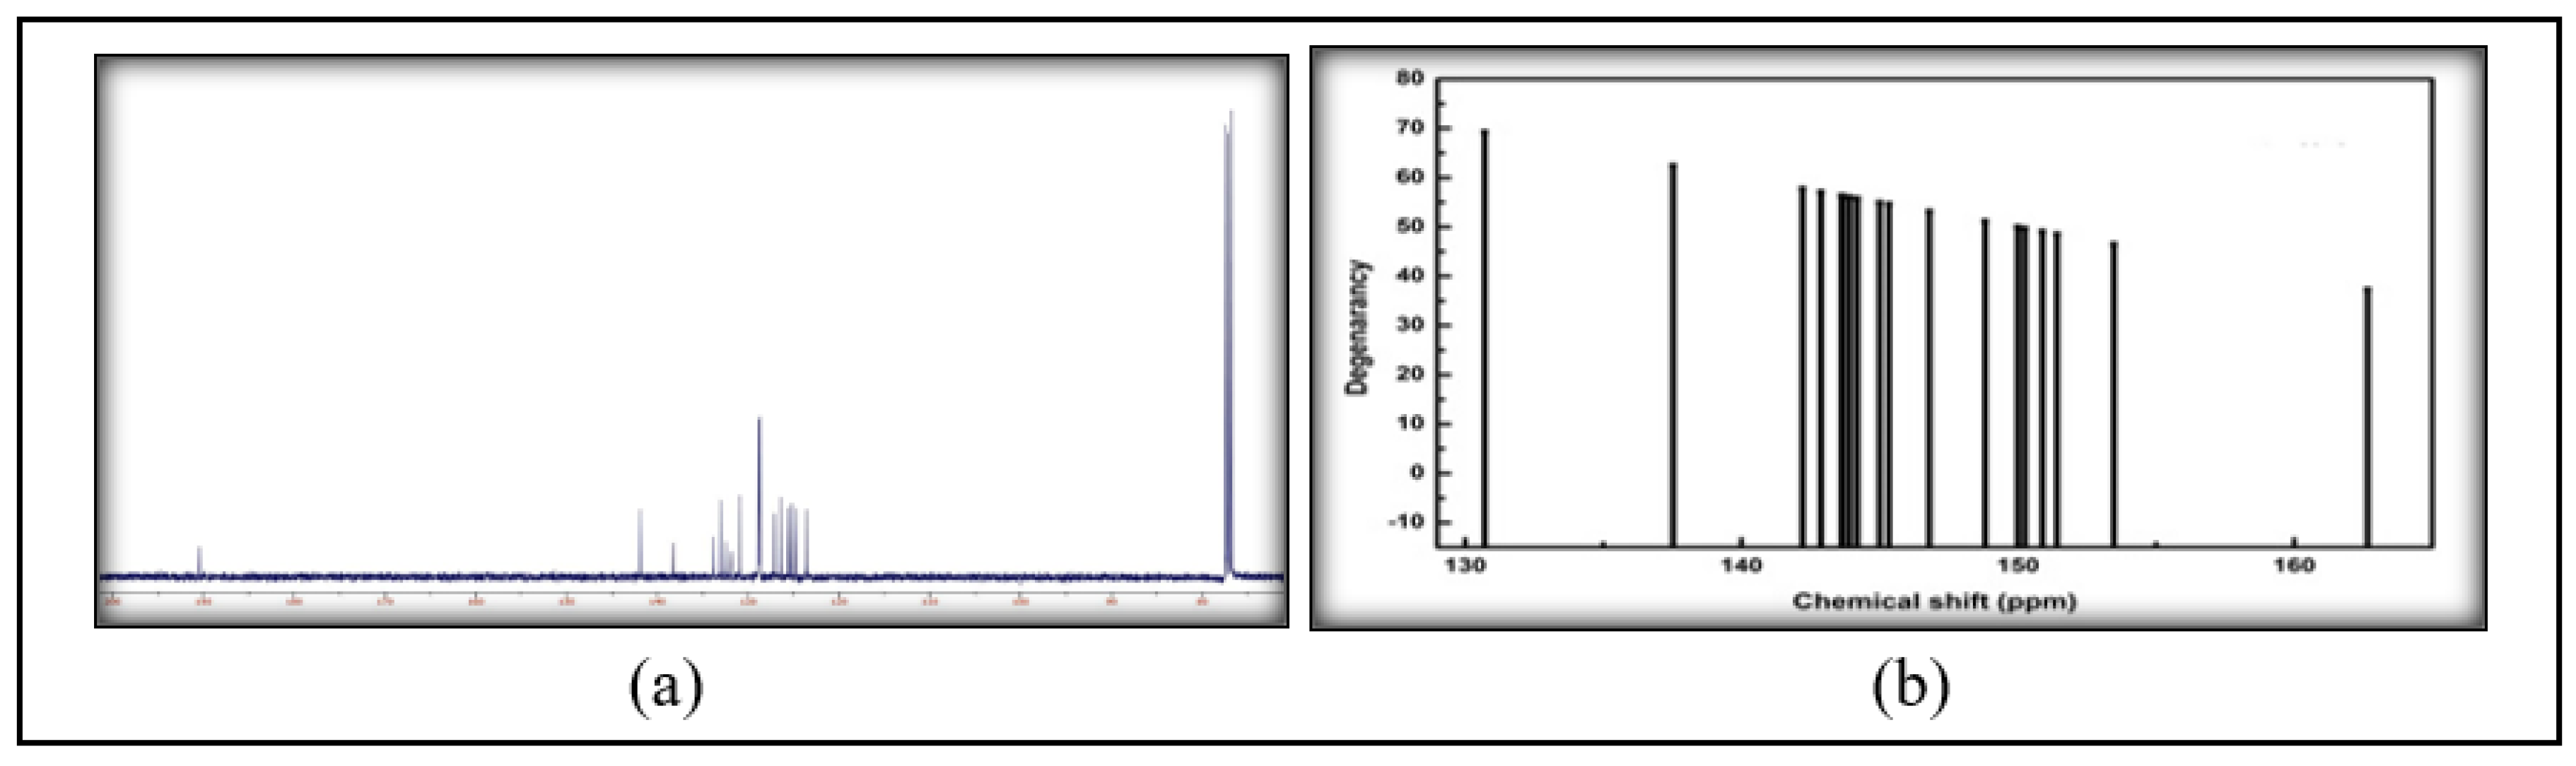
Further, the test molecule 3NPEO has been analyzed by 1HNMR and 13CNMR, and the corresponding experimental and theoretical spectra are shown in Figures 3a,b and 4a,b. For the title molecule, the 1HNMR chemical shift values are present in the span of 7.14-7.32 (m. 7H) 7.56-7.86 (m, 4H), 7.86-8.22 (m, 3H) ppm whereas the 13C NMR chemical shift values occur in the range of 121.4, 124.2, 126.4 (2), 126.9, 127.7, 128, 128.3, 128.7 (2), 128.8, 129.5, 132.5, 134.7, 135.2, 135.6, 145.2, 189.7 ppm. The same experimental shift values can be compared with theoretical spectra and it can be concluded that, the experimental and computationally obtained spectral values by the DFT method are in good agreement.
Figure 3.
Experimental and simulated 1HNMR spectra of 3NPEO.
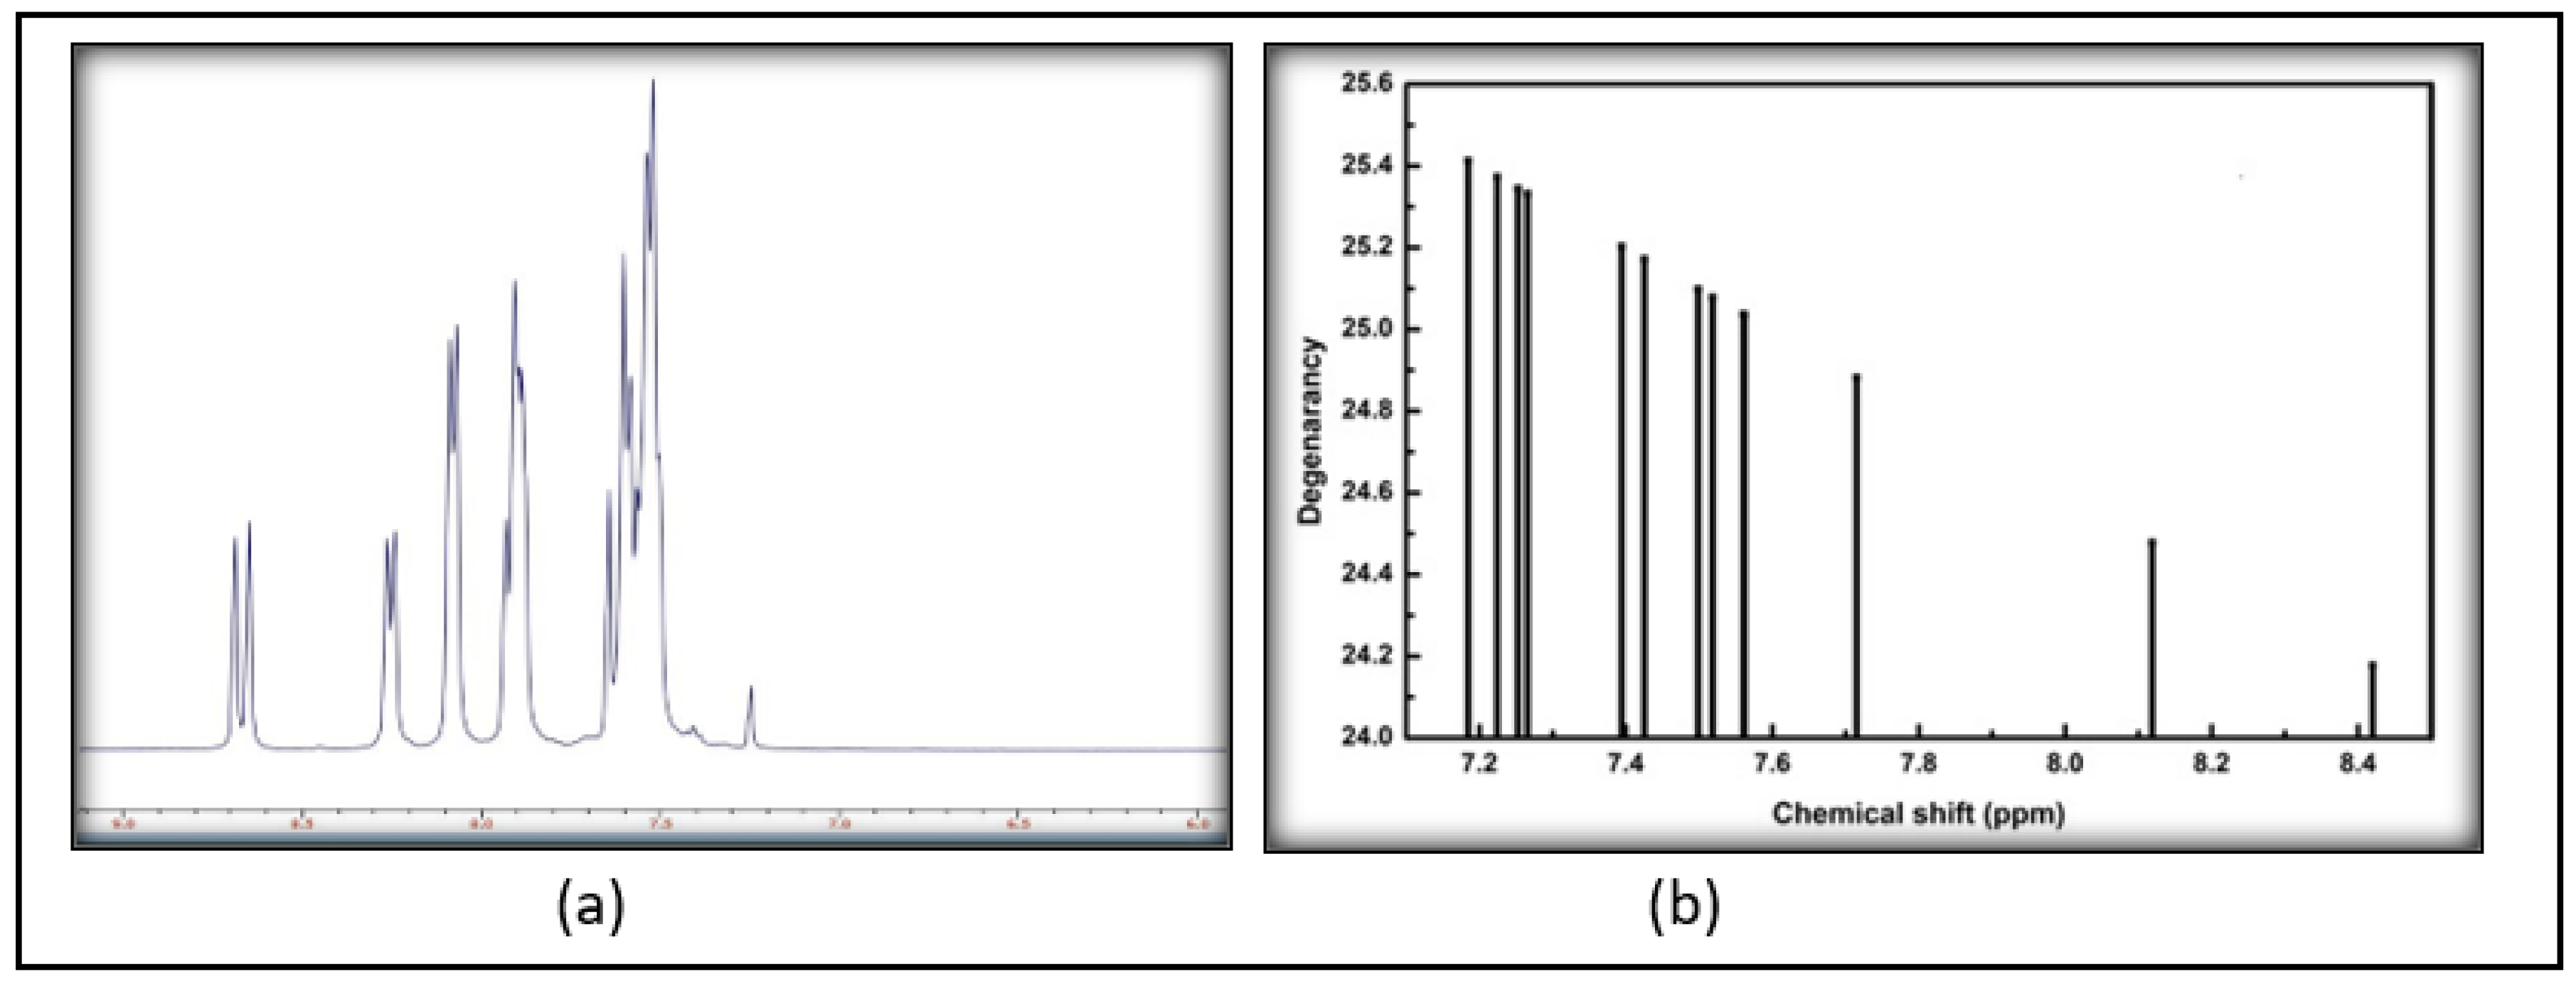
Figure 4.
Experimental and simulated 13CNMR spectra of 3NPEO.
3.2. Spectroscopic Analysis
3.2.1. Photophysical Properties
In the systematic investigation of the electronic absorption and fluorescence phenomena exhibited by 3NPEO, meticulous scrutiny was conducted across a spectrum of twenty-two solvents, spanning a gradient of polarities ranging from non-polar to polar, while maintaining a concentration of 10-5 M. An excitation and emission spectra of the test molecule in pentane is presented in Figure S2. The resultant normalized absorption and fluorescence spectra, illustrated in Figure 5a,b, unveiled a profound sensitivity to solvent parameters encompassing polarity, dielectric constant, refractive index, and polarizability. This discernible responsiveness underscores the intricate interplay between the molecular environment and the optical characteristics of the system under scrutiny.
Within the discerned absorption spectra of 3NPEO, the maxima manifested within the wavelength range of 320–370 nm. In contrast, the fluorescence spectra exhibited maxima spanning the range of 375–462 nm. A noteworthy observation emerged as the solvent polarity increased-a conspicuous red shift transpired in the fluorescence spectra of 3NPEO, quantified at Δλf= 87 nm, in comparison to their absorption spectra (Δλa= 50 nm). This observation served to corroborate the assertion that the singlet excited state energy level Figure 5. absorption and emission maxima, Stokes shift, and arithmetic mean of absorption and emission peak values for the investigated molecule, presenting a comprehensive overview across diverse solvent environments. The results, presented in Table 1, intricately detail the interaction between the molecular entity and surrounding solvents. This meticulous tabulation offers nuanced insights into the molecule’s optical behaviour in varied conditions. The comprehensive analysis sheds light on the spectral characteristics, providing a nuanced understanding of its Photophysical properties across diverse chemical environments.
The intensification of solvent polarities correlated with discernible variations in Stokes shift values for 3NPEO, ranging from 4583.33 to 5382.01cm-1. This significant shift of 798.68 cm-1 underscored a bathochromic shift and Intramolecular Charge Transfer (ICT) attributed to π→π* transitions [45,46,47,48,49]. The observed bathochromic shifts resulted from potent interactions between singlet excited state solute molecules and polar solvents, leading to extensive charge distribution between the ground and singlet excited states. This intricate intermolecular interplay indicated that 3NPEO achieved greater stabilization in polar solvents, emphasizing the pronounced impact of solvent polarity on the electronic characteristics of the molecule. Our scientific pursuits are distinctly focused on the exploration of chalcones endowed with fluorescent properties, with an overarching objective to harness their potential for pivotal biological applications. Specifically, our interest lies in leveraging these compounds for cellular imaging and microorganism targeting. In order to realize these aspirations, the imperative lies in the strategic development of chalcone-based fluorescent dyes characterized by mega-Stokes shifts [25,50,53]. In the realm of bioimaging applications, the advantageous role of Stokes shifts becomes apparent in their capacity to mitigate self-quenching phenomena arising from molecular self-absorption. The augmentation of Stokes shifts offers an alternative scientific mechanism by which the potential interference of self-quenching is alleviated. This phenomenon is intrinsic to the reduction of overlap between absorption and emission spectra, consequently minimizing the likelihood of molecular self-absorption events. The strategic manipulation of Stokes shifts thus stands as a pivotal strategy to enhance the precision and reliability of bio imaging, facilitating an environment conducive to reduced self-quenching and, consequently, improved fluorescence signal integrity [53].
3.2.2. Solvatochromic Analysis
The comprehensive analysis of spectroscopic parameters, elegantly embodied in Table S1, further elucidated the intricate interplay of solvent polarities on the behaviour of 3NPEO. The Solvatochromic behaviour of 3NPEO was subjected to a comprehensive analysis employing the linear correlation methodologies formulated by Bilot–Kawski, Lippert–Mataga, Bakhshiev, Kawski–Chamma–Viallet, and Reichardt, methodology involves systematically correlating spectroscopic properties with diverse solvent polarity gauges to approximate the trial values of singlet ground and excited state dipole moments. The entire theory is discussed in supplementary TH-1. This approach intricately intertwines theoretical frameworks with empirical measurements, offering a rigorous and comprehensive assessment of molecular behavior in varying solvent environments.
The solvation polarity roles, namely f(ε,n) , φ(ε,n) , were meticulously computed using equations (1), (2), and (3) for a diverse set of twenty four solvents exhibiting incremental polarities are listed in Table S1. Employing equations (1) and (2), the Bilot–Kawski correlation method () vs f(ε, n) , and ( ) vs φ(ε, n) are represented in Figure S3. Table 2 displays the slopes, represented as m(1) and m(2). The computation of dipole moments in the ground and excited states for the specified molecule yielded values of 10.74 D and 12.88 D, respectively. These calculations, executed through the utilization of equations (4) and (5), have been meticulously recorded in Table 3 for reference and analysis. In all investigated solvents, the observed trend reveals a consistently more pronounced excited state dipole moment compared to the ground state dipole moment for the studied molecule. The alignment of ground and excited state dipole moments has been a subject of consideration among several authors [45,46,47,48,49,54,55], who posited the collinearity of these moments. The angular relationship between the ground and excited state dipole moments, determined through equation (6), yields an angle of 0o, confirming their parallel orientation [45,46,47,48,49]. This alignment underscores the dependence of dipole moment direction on the distribution of positive and negative charges within the molecule. The evaluated collinearity suggests increased charge mobility throughout the molecule in the excited state in contrast to the ground state, providing empirical support for the augmentation of molecular charge dynamics upon excitation.
Solvatochromic plots of 3NPEO were delineated by employing equations (7), (8) and (9), where linear graphs of Lippert () vs F1(ε, n), Bakshiev () vs F2(ε, n), and Kawaski-Chamma-Viallet vs F3(ε, n) are presented in Figure S4a–c. The values of F1(ε, n), F2(ε, n), and F3(ε, n) have been determined using equations (10), (11), and (12) respectively. The corresponding slopes, denoted as m1, m2, and m3, are derived from equations (13), (14), and (15) and are tabulated in Table 2 for comprehensive reference.
Additionally, the assessment of ground and excited state dipole moments for the test molecule has been accomplished through the utilization of equations (16), (17), and (19). The resultant values are systematically organized and presented in Table 3 for detailed documentation and analysis. Quantification of excited state dipole moments (μe) was accomplished employing Lippert Mataga, Bakhshiev, and Kawski-Chamma-Viallet correlations, utilizing the corresponding slopes (m1, m2, and m3). Table 3 presents detailed results, offering a comprehensive dataset for meticulous scrutiny and comparative analysis. Among the listed solvents, the excited state dipole moment surpasses that of the ground state, indicating a significant increase in molecular polarity upon excitation. This heightened polarity emphasizes intensified solvent-solute interactions in the excited state compared to the ground state. Consequently, an observable redistribution of charge densities between these electronic states is inferred, highlighting the dynamic nature of molecular charge interactions during the transition to the excited state. Notably, Table 3 reveals a consistent pattern in excited state dipole moments across various methods, except for the Kawski-Chamma-Viallet approach, which exhibits divergence.
The observed redistribution of charge densities between electronic states highlights the dynamic nature of molecular charge interactions during the transition to the excited state. This observation underscores a commendable level of agreement among the employed methods, underscoring the necessity for further scrutiny and potential refinement of the Kawski-Chamma-Viallet methodology for accurate determination of excited state dipole moments. The current formulation of the Kawski-Chamma-Viallet equation lacks explicit consideration for solute-solvent interactions, omitting factors like hydrogen bonding effects, complex formation, and molecular aspects of solvation [56]. This omission highlights a limitation in providing a comprehensive depiction of nuanced intermolecular dynamics and molecular-level intricacies governing solute behavior within a solvent environment.
The Figure S5 illustrates the correlation between the Stokes shift and the Molecular-Microscopic Solvent Polarity Parameter across diverse solvents for 3NPEO. This representation is achieved by plotting () vs offering a visual insight into the variation of the Stokes shift concerning the molecular-microscopic solvent polarity parameter in the context of different solvents. The slope m4, derived from these plots, played a pivotal role in the evaluation of the singlet excited state dipole moment (μe) for the subject molecule. This rigorous analytical approach provides a robust framework for discerning the intricate solvatochromic characteristics of 3NPEO and elucidates the nuanced interplay between its electronic structure and solvent polarity [45,46,47,48,49]. The observed linear relationship between the Stoke’s shift and the Molecular-Microscopic Solvent Polarity Parameter implies a pervasive solute-solvent interaction, where the Stoke’s shift correlates with the dielectric constant and refractive index of the solvents. The computation of the excited state dipole moment (μej), utilizing the microscopic solvent polarity parameter and detailed in Table 3, reveals a value slightly surpassing Bakshiev’s equation and slightly below the Kawaski-Chamma-Viallet equation. This disparity may be attributed to the latter methods’ oversight of specific solute-solvent interactions, including hydrogen bonding effects and complex formation, as well as the neglect of molecular aspects of solvation. Moreover, the escalation in solvent polarity aligns with a red shift and is observed in both absorption and emission bands, indicative of intermolecular charge transfer (ICT) absorption [57,58,59,60]. This phenomenon denotes the absorption of the less dipolar ground-state molecule, characterized by a prevailing mesomeric structure, leading to a highly dipolar excited state with a distinct structural manifestation of the Chalcone derivative. A meticulous examination of molecular dynamics unveils a captivating transformation as the molecule transitions from its ground state to the realm of excitement. This metamorphosis, marked by intensified polarity, can be eloquently attributed to the intricate ballet of intermolecular charge transfer phenomena. The heightened polarity observed in the excited state, juxtaposed with the more subdued ground state, stands as a testament to the molecular intricacies at play. The delicate choreography of electrons engaged in intermolecular charge transfers orchestrates a symphony of polarity, where each transition becomes a mesmerizing dance of energy exchange.

Table 3.
A Comparative Analysis of Ground and Excited State Dipole Moments of 3NPP.
|
Radius ‘r’ (Ao) |
D |
D |
D |
D |
D |
D |
D |
D |
D |
D |
D |
D |
||
|---|---|---|---|---|---|---|---|---|---|---|---|---|---|---|
| 3.89 | 3.51 | 5.72 | 10.74 | 12.88 | 1.19 | 2.47 | 14.41 | 12.91 | 18.07 | 13.08 | 2.14 | 1.29 | 1.20 | 00 |
Debye = 3.33564X10⁻³⁰ cm = 10-18 esu cm, aThe ground state dipole moment calculated using Gaussian software; bThe excited state dipole moment calculated using Gaussian software; cThe ground state dipole moment calculated from Bilot-Kawaski Eqn. (4); dThe excited state dipole moment calculated using Bilot-Kawaski Eqn. (5); eThe ground state dipole moment calculated using Eqn.16; fThe excited state dipole moment calculated using Eqn.17; gThe experimental excited state dipole moment calculated from Lippert’s equation; hThe experimental excited state dipole moment calculated from Bakshiev equation; iThe experimental excited state dipole moments calculated from Kawaski-Chamma-Viallet equation; jThe excited state dipole moments calculated from equation; kThe change in dipole moments for μe and μg,; lThe change in dipole moment calculated using Eqn.20; mThe ratio of change in dipole moment; nThe angle between ground state dipole moment and excited state dipole moment.
The quantitative analysis, exemplified in Table 3, reveals the profound influence of the molecular dynamics on the dipole moment. Equation (20) is judiciously applied, incorporating experimentally determined values of μg and μe, resulting in the calculated change in dipole moment (Δμ = μe-μg) as a numerical representation of this dynamic interplay. Notably, the comparison of calculated changes in dipole moment using two distinct methodologies demonstrates a harmonious accord, emphasizing the robustness of the analytical approaches and instilling confidence in the symphony of scientific inquiry. The convergence of results speaks to the precision embedded in our understanding of these molecular nuances, further enhancing the scientific allure of this captivating narrative.
3.2.3. Computational Analysis
The Gaussian 16W program, renowned for its prowess in quantum chemical calculations, assumes the role of a virtuoso conductor in orchestrating this molecular symphony. The exploration of 3NPEO’s dipole moments, meticulously conducted through quantum chemical computations utilizing the (B3LYP/6-311G(d,p)) program, provides invaluable insights into the molecular electrostatics of this intriguing species. Figure 6 points out an optimized structure of 3NPEO. In its grounded state, the molecule exhibits a dipole moment (μg) of 3.51 Debye, indicative of inherent polarity. Upon transitioning to the excited state, the computed dipole moment (μe) awaits empirical revelation at 5.72 Debye, adding an air of anticipation to our molecular narrative.
The Figure 7a,b depicts the direction of dipole moments in both ground and excited states, offering a canvas for understanding the molecular architecture. Notably, the directional arrows in these figures eloquently convey the orientation of the dipole moments, akin to compass needles pointing to the magnetic north of molecular polarity. A scientific intrigue unfolds as it is revealed that the dipole moments in both ground and excited states align themselves in perfect parallelism, indicative of an angle of zero degrees between them. This rare alignment underscores a remarkable molecular symmetry, where the electrostatic nuances remain unwavering even in the face of excitation-induced dynamism.
Furthermore, these theoretically determined dipole moments, serving as computational beacons, find purpose in the assessment of the singlet state. The convergence of theoretical predictions and experimental observations enhances our confidence in unravelling the molecular secrets of 3NPEO, painting a more detailed and nuanced portrait of its electrostatic personality.
These values were then juxtaposed with experimentally derived dipole moments using solvatochromic shift methods. This comparative analysis serves to elucidate the concordance or dissonance between the experimentally measured dipole moments and theoretically predicted, contributing to a comprehensive understanding of the molecular system’s electronic behavior [47].
3.3. Fluorescence Quantum Yield (Photonic Efficiency)
Embarking on the complex journey to unknot the relative photonic efficiency of 3NPEO, our scientific inquiry employed the single-point method—a directional compass guiding us through a diverse solvent. The exploration work included the hydrocarbon solvents namely hexane and cyclohexane, the ethereal embrace of butanol, methanol, isopropanol, and ethanol and DMSO. In this methodical journey, the possibility of self-quenching, once impending on the horizon, was authoritatively overcame. The low concentrations of 3NPEO nullified any propensity for self-interference, enabling our scientific gaze to penetrate through the molecular intricacies without the veils of confounding self-quenching considerations.
Tryptophan, a steadfast standard bearer, stood sentinel as the reference [47], dissolving gracefully in the primeval waters of double-distilled purity. In a tuneful composition of scientific precision, all solutions, including the venerable reference, were summoned to dance under the enchanting radiance of a 280 nm excitation. The optical density, analogous to a expressive upsurge, stretched its dynamic range from the subtle whispers of 0.118 in cyclohexane expanse to the bold declarations resonating at 0.558 in the organic embrace of DMSO. This range of optical signatures highlighted a vivid spectrum of responses, a witness to the spectrum of solvation encountered by 3NPEO in its photonic break. In this work of solvents and spectra, the determination of relative photonic efficiency emerges not just as a scientific pursuit but as an artful exploration, where each solvent, each solution, and each optical density contribute to the harmonious expression of understanding, reverberating with the core of molecular details.
The extravagant account of molecular radiance discloses through the elucidation of absorption and emission spectra, illustrated in Figure S6a,b, where Tryptophan reveals its secrets in water, while 3NPEO graces in isopropanol with its luminous signature as illustrated in Figure 8a,b. The meticulous examination extends to the fluorescence integrated intensity (Fint) of 3NPEO, involving a quantitative exploration across a spectrum of solvents. Remarkably, the discerning eye of scientific inquiry reveals an elevated Fint resonance in the presence of isopropanol, reaching the zenith of luminosity for 3NPEO. Our attention then shifts to the quantitative metrics presented in Table 4, a display of molecular signifiers that unravel the essence of 3NPEO in various solvents. The relative photonic efficiency or the quantum yield (Φ), a beacon of radiative efficiency, resonates with prominence. Intriguingly, 3NPEO manifests a notably elevated photon efficiency in the enigmatic realm of cyclohexane, defying conventional expectations arising from optical density comparisons with butanol, ethanol and DMSO.
The molecular orchestra continues its performance with the unveiling of the radiative decay constant (kr) and non-radiative decay constant (knr), intricate parameters that delineate the pathways of energy dissipation. A nuanced dance of radiative and non-radiative processes orchestrates the molecular fate of 3NPEO, each solvent adding its unique note to this spectral composition. As we delve deeper, the lifetime (τ0) of 3NPEO is given in Figure S7 and emerges as a progressive maestro, conducting the symphony of luminescence. The solvents, diverse in their molecular embraces, influence the temporal rhythm, shaping the lifetime of 3NPEO with a nuanced hand. In this scientific tableau, the quantum yield, lifetime, radiative and non-radiative decay constants, of 3NPEO in various solvents become not mere numerical values but convincing expressions in the language of molecular photophysics, enriching our understanding of its luminous journey through spectrum of solvations.
In the elaborative configuration of molecular decay, the rate of radiative dissolution (kr) gracefully surpasses its non-radiative counterpart (knr) across most of the solvents, delineating 3NPEO’s inclination toward a predominantly radiative fate in the delighted dominion of the excited state. This elegant exposure reveals a molecular identity characterized by diminished intersystem crossing, affirming the molecule’s proclivity for luminous transitions. The decay narrative of 3NPEO, as artistically depicted in the Figure S3, provides a captivating glimpse into the temporal distinctions of its existence in the ethereal embrace of isopropanol. A scientific exposure unfolds, where the radiative grace of 3NPEO manifests itself, casting a luminous trail that surpasses the non-radiative possibilities—a testament to the molecule’s preference for the radiative pathways in its journey through the excited state.
Upon careful scrutiny of Table 4, a notable trend emerges, the peak of the quantum yield hierarchy for 3NPEO in the realm of cyclohexane. This intriguing revelation defies conventional expectations, as cyclohexane, despite its relatively lower optical density compared to butanol, ethanol and DMSO, becomes the environment where 3NPEO achieves its zenith of quantum efficiency. The rate of radiative decay (kr) consistently outpaces non-radiative decay (knr) for cyclohexane, methanol and isopropanol solvents which supports the notion that 3NPEO predominantly exhibits radiative behavior within the excited state. The persistent dominance of kr over knr serves as a compelling signature, affirming the molecule’s inclination towards radiative pathways and concurrently indicating a mitigated propensity for intersystem crossing. Further, it can be noted that, the quantum efficiency and radiative behavior are considerably too low in ethanol but it exhibits higher rate of non-radiative behaviour. In this scientific panorama, the comparison of quantum yield dynamics and decay kinetics exposes a nuanced representation of 3NPEO’s behavior, enriching our understanding of its photophysical behaviors in diverse solvent environments.
3.4. Nonlinear Optical Studies
3.4.1. Third Order Nonlinear Optical Properties
The test molecule is liquified in DMF solvent (0.01 M) was elucidated coupled with the Z-axis. The imparted laser beam was acquired by photodetector with aperture (closed aperture) and without aperture (open aperture) to quantify the nonlinear refraction (NLR) and nonlinear absorption (NLA) of the material, respectively [61,62,63]. Figure 9a,b exhibit the normalized curves of 3NPEO for closed and open aperture. The transmissions are symmetric with respect to the focus (Z=0). Nonlinear absorption coefficient can be estimated from the open aperture Z-scan data by fitting the curves using the following rule,
where T(z) is the normalized transmittance, Io is the intensity at the focus, Leff is the effective length of the sample which is given by the equation
Leff = (1- exp -αL)/α
Here ‘α’ is the linear absorption coefficient and L is the sample thickness. The Figure 9b shows the normalized transmittance for closed aperture. The valley -peak configuration indicate a positive nonlinear refractive index n2 (self-focusing effect), i.e., a decrease in the transmitted intensity due to refraction as the sample approaches the focal point (Z=0) followed by an increase in intensity as it moves away from the focal point and towards the detector. The magnitude of nonlinear phase transition is computed by tailoring the closed aperture probed curve through theoretically adapted equation,
where X= Z/ZO, Z and ZO are the magnitudes of the analyte from the focus and Rayleigh length, respectively. The nonlinear refractive index [64] can be quantified by exchanging this procured value of in the equation,
where k=2π/λ is the wave vector, I0 is the beam intensity at focus, and Leff = [1−exp(−αL)]/α is the effective thickness, with α being the linear absorption coefficient and L is the sample thickness. By tailoring the experimental open aperture curve, the nonlinear absorption coefficient β is enumerated by employing the formula β = (, where is peak value of open aperture. The estimated measures of β and n2 are tabulated in Table 5.
The computed magnitudes of n2 and β are replaced in the correlated equations to elucidate the explicit, quixotic and ultimate magnitudes of the third-order nonlinear optical susceptibility (χ3) and additionally the second order hyperpolarizability (γh) [65] from the subsequent relationships,
N represents the density of molecules in cm−3. Two-photon absorption cross section, (cm4 s photon-1molecule-1), describe the efficiency of a particular molecule in the ground state to reach the excited state via a two-photon absorption process. It can be expressed in the SI unit (GM) and defined as 1GM = 10-50 cm4 s photon-1 molecule-1. The calculated nonlinear susceptibility, hyperpolarizability and two photon absorptions are present in the Table 5.
3.4.2. Optical Limiting
The input fluence at which transmittance diminishes to half of the linear transmittance designates the boundary value for optical limiting which follows lower limiting threshold value analogous to better the optical limiting performance. Employing Gaussian beam from open aperture Z-scan data, input fluence at each z-positions is specified by,
where Ein is input laser pulse energy and ω(z) is the beam radius, which is expressed as , where w(0) is the beam radius at the focus and is the Rayleigh range.
The optical liming response of the title chalcone is due the decreasing transmittance with increasing input fluence. The limiting threshold was observed 4.06 KJ/cm2 which is the shown in the Table 5. The molecule demonstrated optimal NLO coefficient, reduced optical limiting (OL) critical value is illustrated in Figure 10 and a optimal photon (W) and two photon (T) benchmarks the convinced condition for optical switching exploitations as shown in Table 5 (W˃1 and T˂1), consequently validating their appliance in visible wavelength of the laser in photonic device applications.
3.4.3. HOMO-LUMO Analysis
To understand the chemical reactivity and kinetic stability of the molecule, the Frontier molecular orbitals (FMOs) are nothing but highest occupied molecular orbitals (HOMO) and lowest unoccupied molecular orbitals (LUMO) are important descriptors. The calculated HOMO-LUMO plots of 3NPEO crystals are shown in the Figure 11. And corresponding energy are shown in the Table S2. Since, π-electrons are being straightforwardly polarized, π-electron orbitals and the frontier molecular orbitals are predominantly accountable for the nonlinear optical characters of the probed compound. The first-order hyperpolarizability and FMOs can be found by analyzing of their surfaces and their interdependence linkage.
From the Figure 11, it can be observed that, in LUMO and LUMO+1, the charge density is distributed overall the surface of the title molecule. Where as in case of HOMO and HOMO-1 the charge density is spread aromatic π-conjugated bridge in the title molecule. The intra-molecular charge transfer evidences the transition is in accordance with the experimental observations. Hence, the UV-vis absorption spectrum of the sample clearly exhibits the charge transfer interaction in the molecule.
The complexed molecule is distinguished by a minute quantity of separation of HOMO-LUMO which is the outcome of noteworthy grade of intra-molecular charge transfer from the electron donor clusters to the resourceful electron acceptor assemblies by way of π-conjugated path and elevated value of second hyperpolarizability (λh). The HOMO-LUMO energy gap of the present compound (3.737 eV) found to be infinitesimal, indicates the higher charge transfer occur in it which has the highest value of λh (1.23 x 10⁻²⁶ e.s.u).
3.4.4. The Global Chemical Reactivity Descriptors (GCRD)
One of the main purposes of computational chemistry is evaluation of the impulsiveness of chemical groups and density functional theory has been efficacious in affording theoretical context of validated and subjective chemical hypothesis. In this framework, several reactivity descriptors are nothing but GCRD have been forecasted and employed to analyze chemical receptiveness and site selectivity. Global hardness (η), global softness (S), electro negativity (χ), chemical potential (µ) and electrophilicity index (ω) are extensively employed to comprehend the universal nature of molecule in terms of their stability and reactivity. Employing Koopman’s theorem [67] for confined shell molecules, electronegativity, chemical potential and global hardness can be computed as,, , , , and by taking -EHOMO as ionization energy (I) and -ELUMO as electron affinity (A) with the help of CAM-B3LYP/6-311 G*(d, p) level theory. The calculated GCRD parameters are given in Table S2
A strong chemical reactivity and a weak kinetic stability of the molecule are signified by considerably minute energy gap of the HOMO-LUMO. The present molecule has high IP (HOMO) value (6.225 eV) and the molecule is highly reactive. IP is a measure of the nucleophilicity of a molecule and is important in modeling molecular properties and reactivity in particular for radical reactions and EA (LUMO) is the measure of the capability of a molecule to give the corresponding negative ion. Typically, EA and IP are employed as electronic descriptors and have the benefit of easy accessibility from experiment as well as theory.
The tendency of interaction of electron cloud on the way to functional assemblage is elucidated by the electronegativity. The stability of the substance and instinctive recalcitrant natures are manifested by the negative value of the chemical potential. It is difficult to synthesize and conserve the substances of positive chemical potential and are found to possess electronegativity values around 4.83 eV. An enhanced degree of chemical potential and a diminished degree of chemical hardness are distinguished by a good electrophilicity and it evaluates the resistance to change in the electron distribution in a collection of nuclei and electrons. The hardness or softness of a molecule is categorized on the nature of the energy gap. A pronounced energy gap suggests hard molecule whereas a narrow energy gap designates soft molecule and exhibit greater polarizability relative to hard molecules because of least energy to transition to an excited state. The global hardness and softness values of the title molecule are presented in the Table S3 which shows that the molecule was comparatively soft which undertake alterations or chemical reactions easily. The notion of electrophilic indication deemed as a reactivity index [52], which quantifies equilibrium in energy as the system attains an added electronic charge from the environs. It signifies the stabilization energy of the system upon saturation by electrons originating from the surrounding environment. The electrophilicity encompasses knowledge about structural, reactivity and selectivity patterns of many electron systems in both ground and excited electronic states we found the electrophilic index values 5.794 eV.
3.4.5. Molecular Electrostatic Potential (MEP)
Innovations of computational technology explores molecular interactions namely molecular electrostatic potential (MEP) which has turned out to be a reliable instrument. Currently MEP is being applied to chemical and biological systems which largely concentrates on electrophilic and nucleophilic attacks to emphasize zeolites, molecular cluster, crystal behaviour, the correlation and prediction of a broad spectrum of macroscopic properties [67,68]. An accumulative eminence of density functional theory has raised the molecular electrostatic potential to a new stature on a more fundamental conceptual level. Further, the electron density is an interesting topological characteristic and obviously replicates contradictory contributions from the nuclei and the electrons.
MEP demonstrates molecular size, shape as well as positive, negative and neutral electrostatic potential regions by means of colour grading, a significant negative zone is the predominant binding site for electrophilic attack is specified by red while a large positive region is the optimal region for nucleophilic attack designated by blue colour. The negative potential regions are interrelated with the electronegative atoms around oxygen atom representing the possible sites for electrophilic attack, and the value of the electronegativity found that -0.0354 a.u. for title molecule. The molecular electrostatic potential surface of the molecule generated by their optimized geometries was shown in Figure 12. The MEP plot authorizes the supreme positive region localized on Hydrogen atoms of the molecule with the values of positive potentials of the order of 0.0224 a.u, demonstrating the probable sites for nucleophilic attack. The utmost negative province is about Oxygen atom would predict an electrophile preferentially attack the title molecule. These locations spring evidence the region from where the compound can endure non-covalent interactions.
3.5. Electrochemical Property
Cyclic voltammograms in acetonitrile, as illustrated in Figure 13a, revealed a reversible redox process, indicating a favorable hole/electron transport potential. HOMO and LUMO energies of the compound 3NPEO was computed via oxidation and reduction potential standards [49,50]. The determined HOMO and LUMO energy levels were found to be −4.849 eV and −1.498 eV respectively.
Figure 13b utilized Density Functional Theory (DFT) to portray the Highest Occupied Molecular Orbital (HOMO) -6.855 eV to Lowest Unoccupied Molecular Orbital (LUMO) -2.817 eV leading an energy gap 3.737 eV of the 3NPEO compound. This information offers crucial insights into the electronic structure of the compound, emphasizing its prospective
applications in electronic and optoelectronic domains. The existence of coumarin, acting as an electron-donating fraction, influenced the HOMO and LUMO energy levels. A succinct summary of the pertinent electrochemical statistics is presented in Table 6.
3.6. Structure Preprocessing, Validation and Molecular Docking
The test molecule 3NPEO has docked and is represented in Figure 14. The PDB structure of 4OAR was downloaded, pre-processed, and validated. The missing residues, ALA-900, LEU-901, SER-902, VAL-903, GLU-904, PHE-905, PRO-906, GLU-907, MET-908, LYS-932, and LYS-933 were homology modelled back to generate complete protein model. The generated model had an ERRAT Overall Quality Factor of 95.7447. Ramachandran plot statistics indicate 90.7% residues in the most favoured region, 8.8% in the additionally allowed region, 0.4% in the generously allowed region, and none in the disallowed region. DSSP analysis indicates that themodel has 61.6% α-helices, 3.6% 3-helices (310 helix), 4.4% extended strand residues that participate in β ladder, 10.8% hydrogen bonded turns, 6.4% bends, and 13.2% coils. This comprehensive analysis showcases the protein model’s diverse structural components and overall stability and integrity. The validated model was further set as the receptor for molecular docking with the optimized ligand using Vina.
Upon generating the docking poses, we filtered the poses based on the affinity values. The best-generated docking pose had a binding affinity of -8.5 kcal/mol. The molecular docking scrutiny of the protein (PDB ID: 4OAR) provides significant perceptions into probable communications with synthesized compound. The docking score was 8.5 Kcal/mol, representing considerable binding affinities among the protein and the synthesized compound. The interacting protein sites were also found to be different and included LEU 763, PHE 778, LEU 718, PHE 794 and LEU 715. Nanjundaswamy et al. (2022) reported two thiophene-based chalcone derivatives for their activity against bacterial with docking scores of -6.0 Kcal/Mol and -7.1 Kcal/Mol [69]. Thillainayagam et al. (2017) reported that, the docking of different chalcone derivatives was also done for antimalarial activity that, the docking scores ranged from -12.95 to -1.33 Kcal/Mol [70]. Our study has a binding score of -8.5 Kcal/Mol, indicating strong affinity binding according to the docking scores.
3.7. Simulation trajectory analysis
This study used molecular dynamics simulations for 4OAR-APO and 4OAR-CMP6 to demystify the ligand’s efficiency. The simulation was carried out for 500ns with the generated model and the docked complex as input. The Figure 15 implies the trajectory for calculating the backbone atom Root Mean Square Deviation (RMSD) to monitor structural stability during simulation yielded an average value of 0.4021 nm for 4OAR-APO, and 0.5030 nm for 4OAR-CMP6. However, as evident from the RMSD graph in Figure S7a, a stable trend in for the RMSD values is observed for both the systems beyond the 300ns mark. This hints at convergence and the suitability of this stable trajectory window for further analyses. The hydrogen bonds between 4OAR and the ligand were calculated as depicted in Figure Sb. Evidently, up to 2 hydrogens bonds exist in 4OAR-CMP6. We then calculated the Root Mean Square Fluctuation (RMSF) of the protein residues to observe the deviation in fluctuations around the averaged position of the amino acids. As seen in Figure S8, significantly high fluctuations can be observed for 4OAR-APO relative to 4OAR-CMP6. The fluctuations in the regions marked as A, B, and D can be accounted for by the loops that exist in the region, as evident in the Secondary Structure Evolution plot in Figure S8. Fluctuations in the region marked as E peaks at 0.6149 nm for 4OAR-APO. In comparison, it is 0.1573 nm for 4OAR-CMP6. This significant difference in fluctuation is due to the ligand’s interaction with the helix-loop-helix region that denies its outward movement, as observed in 4OAR-APO of Figure 16. So, this hints that the ligand has significant stabilizing effects on the protein’s fluctuations.
It can be widely recognized that the flexibility and density of a protein are closely entangled, and compactness of the protein significantly impacting its solvent accessible surface area. To investigate the impact of inhibitors on protein compactness, we determined the radius of gyration (Rg) of the protein. Additionally, to examine the effect of inhibitors on the accessible surface area of the protein for the solvent, we calculated the solvent accessible surface area (SASA). The kernel density estimation plots (KDE) of SASA and Rg for all systems are illustrated in Figure 17. This analysis clearly points out the effects of inhibitors on the conformational states of 4OAR, as seen from the KDE plot in Figure 17, 4OAR-CMP6 has a much more compact and less bulky conformation with average SASA and Rg values of 129.5627 nm and 1.8307 nm, respectively. Conversely, average SASA and Rg values for 4OAR-APO were 136.0825 nm and 1.8765 nm, respectively. This might be due to the capability of the ligand to induce conformational changes within the protein that subsequently changed the compactness and the surface area.
It can be widely recognized that the flexibility and density of a protein are closely entangled, and compactness of the protein significantly impacting its solvent accessible surface area. To investigate the impact of inhibitors on protein compactness, we determined the radius of gyration (Rg) of the protein. Additionally, to examine the effect of inhibitors on the accessible surface area of the protein for the solvent, we calculated the solvent accessible surface area (SASA). The kernel density estimation plots (KDE) of SASA and Rg for all systems are illustrated in Figure 17. This analysis clearly points out the effects of inhibitors on the conformational states of 4OAR, as seen from the KDE plot in Figure 17, 4OAR-CMP6 has a much more compact and less bulky conformation with average SASA and Rg values of 129.5627 nm and 1.8307 nm, respectively. Conversely, average SASA and Rg values for 4OAR-APO were 136.0825 nm and 1.8765 nm, respectively. This might be due to the capability of the ligand to induce conformational changes within the protein that subsequently changed the compactness and the surface area.
3.8. Conformational Minima and Total System Energy
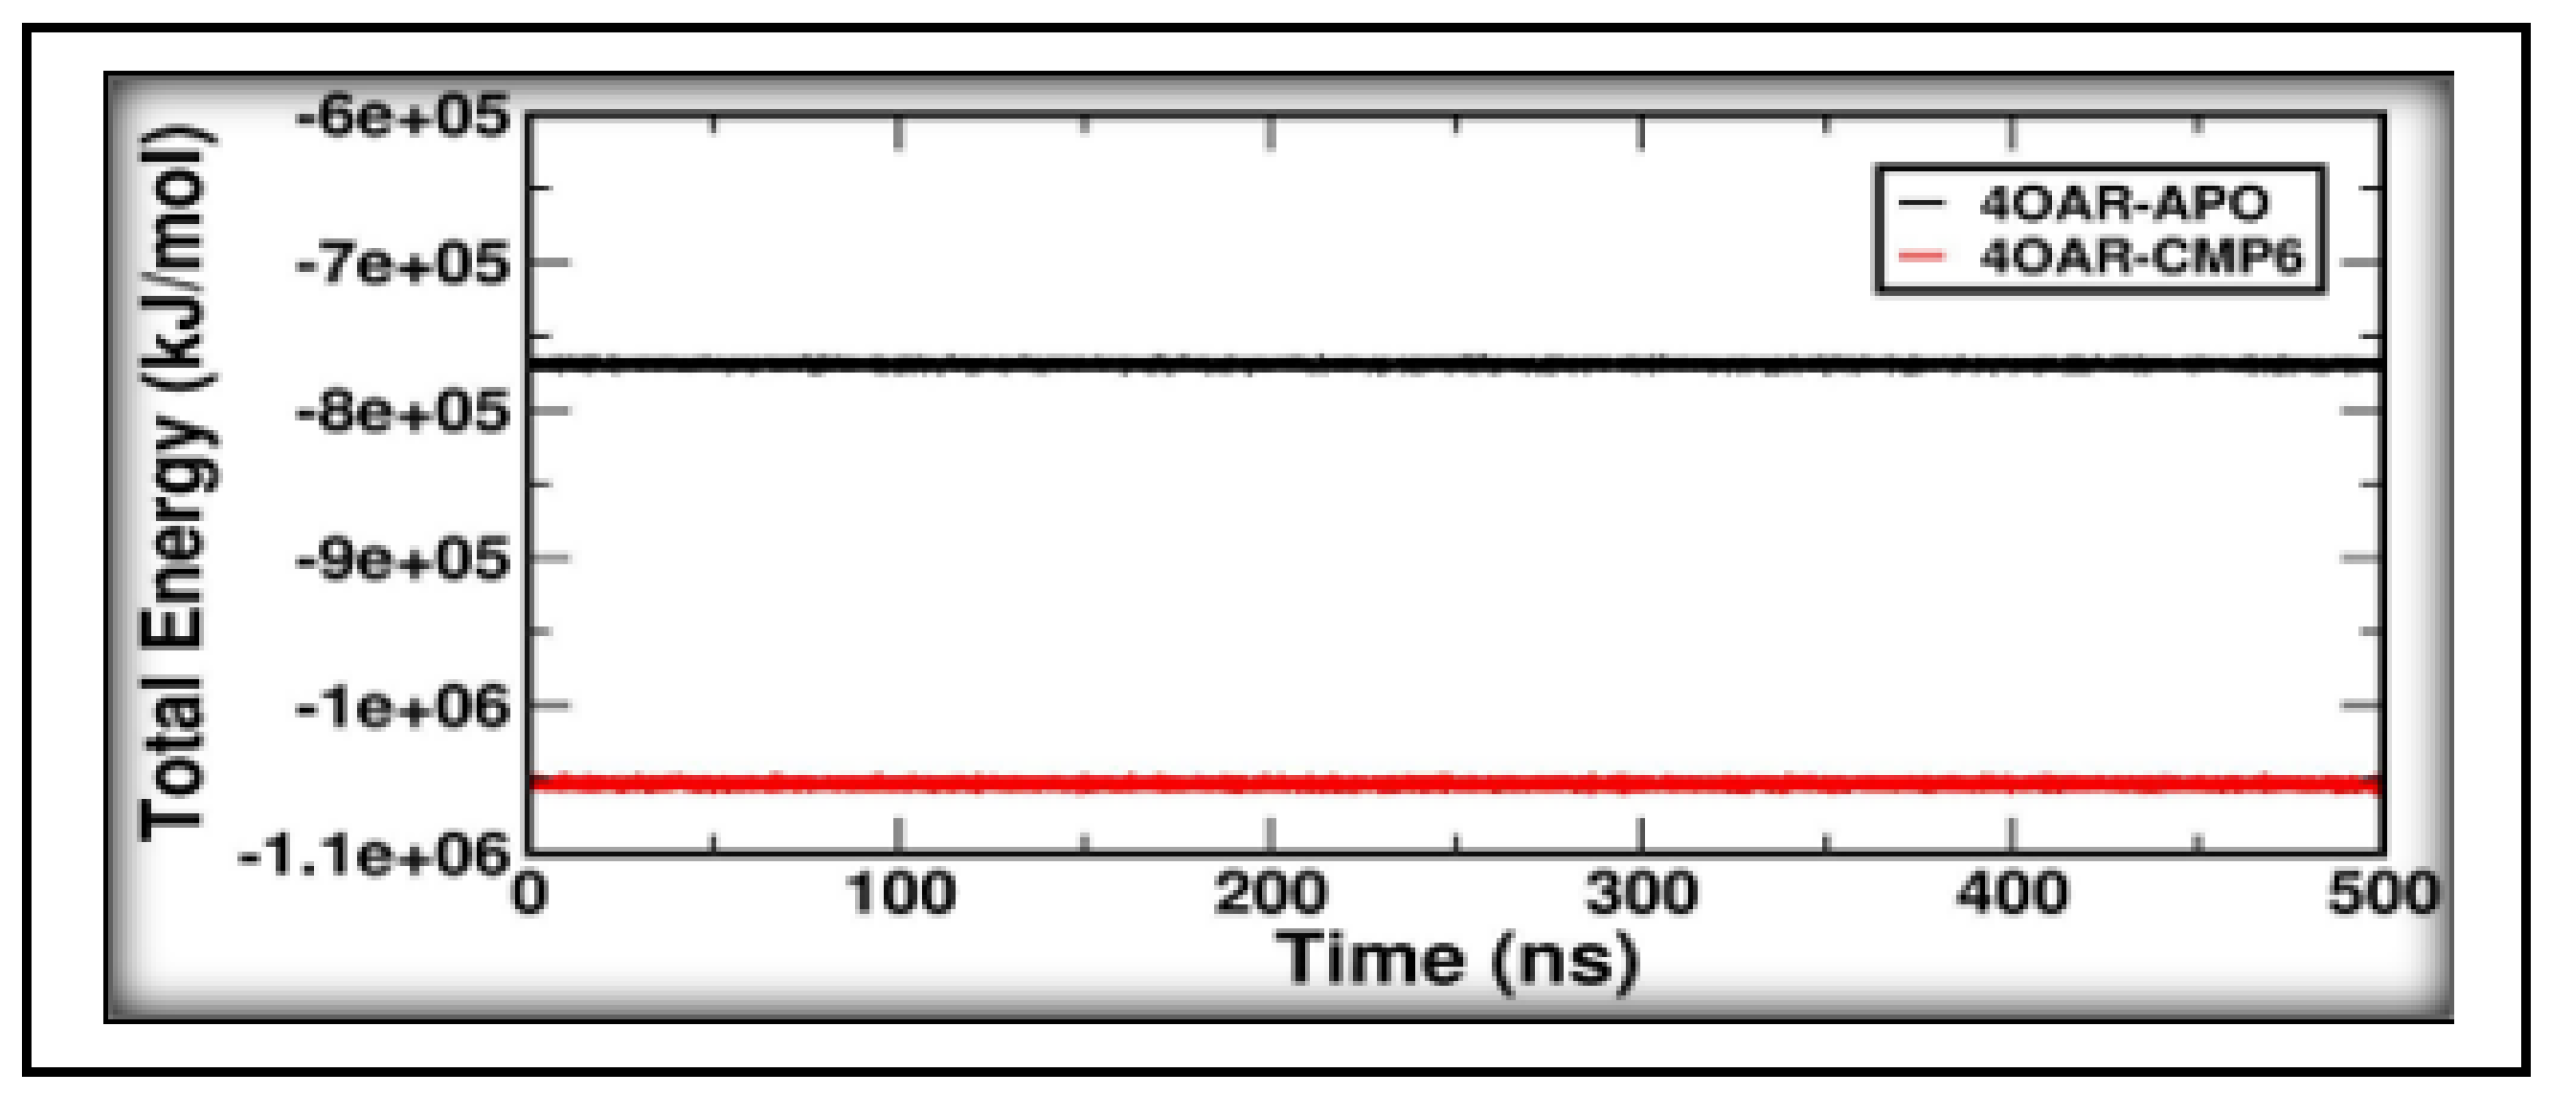
We explored the interaction between two key metrics, the radius of gyration (Rg) and the root mean square deviation (RMSD), to gain important insights into the structural dynamics and stability of our systems. The Rg tells us how compact a given structure is and conveys where the mass of the structure is distributed around what would be its centre of mass. The Rg is thus a useful tool for characterizing the size of a molecule. And although it is a scalar quantity, it can be thought of as occupying an axis of the multidimensional space we call the “free-energy landscape.” Conversely, the RMSD is a tool we use to measure the difference between two structures. And because it can account for every individual atom in a molecule, it offers a very high-dimensional kind of axis in the FES, through which we can see all the back-and-forth motions that a flexible molecule might make. This analysis aids in identifying the stable and metastable states of the molecule and can help elucidate the underlying mechanisms governing its conformational transitions and dynamic behavior. Also, investigating the relationship between Rg and RMSD within the FEL offers critical insights into the conformational space accessible to the molecule and the energy barriers associated with transitions between different structural states. Conformational minima with -13.384 kJ/mol Free Energy, 0.5762 nm RMSD, and 1.825 nm Rg was observed for 4OAR-CMP6 while a minimum with -12.612 kJ/mol Free Energy, 0.416 nm RMSD, and 1.872 nm Rg for 4OAR-APO was observed. The energy dynamics for 4OAR-CMP6, as observed in Figure 18, and shows that the conformation underwent energy barrier jumps with two metastable states. Hence, the 4OAR-CMP6 system has a higher RMSD and has achieved a lower minimum with compact conformations. The overall energy of the systems was also calculated with GROMACS energy which is the sum of all of the energy components in the system, including potential energy, kinetic energy, bond energy, angle energy, dihedral energy, non-bonded energy, and distance restraint energy. As seen in Figure 19, an overall energy of -7.69280x10⁻⁵ kJ/mol for 4OAR-APO and a lower energy value of -10.53075x10⁻⁵ kJ/mol for 4OAR-CMP6 was observed. This evidence suggests that the ligand has a significant role in stabilizing the protein’s dynamics and energetics.
3.9. Conformational Minima and Total System Energy
We explored the interaction between two key metrics, the radius of gyration (Rg) and the root mean square deviation (RMSD), to gain important insights into the structural dynamics and stability of our systems. The Rg tells us how compact a given structure is and conveys where the mass of the structure is distributed around what would be its centre of mass. The Rg is thus a useful tool for characterizing the size of a molecule. And although it is a scalar quantity, it can be thought of as occupying an axis of the multidimensional space we call the “free-energy landscape.” Conversely, the RMSD is a tool we use to measure the difference between two structures. And because it can account for every individual atom in a molecule, it offers a very high-dimensional kind of axis in the FES, through which we can see all the back-and-forth motions that a flexible molecule might make. This analysis aids in identifying the stable and metastable states of the molecule and can help elucidate the underlying mechanisms governing its conformational transitions and dynamic behavior. Also, investigating the relationship between Rg and RMSD within the FEL offers critical insights into the conformational space accessible to the molecule and the energy barriers associated with transitions between different structural states. Conformational minima with -13.384 kJ/mol Free Energy, 0.5762 nm RMSD, and 1.825 nm Rg was observed for 4OAR-CMP6 while a minimum with -12.612 kJ/mol Free Energy, 0.416 nm RMSD, and 1.872 nm Rg for 4OAR-APO was observed. The energy dynamics for 4OAR-CMP6, as observed in Figure 18, and shows that the conformation underwent energy barrier jumps with two metastable states. Hence, the 4OAR-CMP6 system has a higher RMSD and has achieved a lower minimum with compact conformations. The overall energy of the systems was also calculated with GROMACS energy which is the sum of all of the energy components in the system, including potential energy, kinetic energy, bond energy, angle energy, dihedral energy, non-bonded energy, and distance restraint energy. As seen in Figure 19, an overall energy of -7.69280x10⁻⁵ kJ/mol for 4OAR-APO and a lower energy value of -10.53075x10⁻⁵ kJ/mol for 4OAR-CMP6 was observed. This evidence suggests that the ligand has a significant role in stabilizing the protein’s dynamics and energetics.
Figure 19.
The total energy calculated for the two systems. A stable trend is observed for both the systems indicating that the systems are stable throughout the trajectory.
Figure 19.
The total energy calculated for the two systems. A stable trend is observed for both the systems indicating that the systems are stable throughout the trajectory.
3.9. Binding Free Energy and Decomposition
To delve into the essence of how proteins and ligands interact, we explored the relative affinity of the ligand for the protein’s binding site, probing the part each ligand and residue plays in the interaction. We employed binding-free energy calculations to do so, specifically the molecular mechanics/Poisson–Boltzmann surface area (MM/PBSA) method, and we applied the g_mmpbsa tool in the GROMACS software suite to accomplish this. The trajectories from our molecular dynamics simulations gave us the foundation for our binding-free energy calculations, allowing us to map out the energy landscape of our protein-ligand systems. To ensure accurate calculations, representative frames were carefully selected and recorded, and the free energy analysis was conducted over the stable 200 ns time period, capturing the key interactions between the protein and the ligand. This approach enabled a comprehensive assessment of the energetic contributions from various components, shedding light on the intricacies of the binding process and providing valuable insights for potential therapeutic interventions or drug design strategies. Table 7 summarizes the energy terms and their individual contribution to the total binding energy between 4OAR and the ligand. A binding energy of -125.888 +/- 11.935 is estimated to exist for the 4OAR-CMP6 protein-ligand system. The residue-wise energy plot in Figure S10 indicates that the residues PHE-895, VAL-760, PHE-778, LEU-763, and TRP-755 contribute -6.2959, -4.887, -3.9421, -3.8266, and -3.7275 kJ/mol respectively. The high binding energy between the protein and the ligand suggests the efficiency of the ligand in binding with 4OAR and its potential to act as an effective inhibitor. The simulation pursues to elucidate the complex’s dynamic behaviour, stability, and structural dynamics, providing in-depth elucidates the structural dynamics and stability of protein complexes are critical factors in determining their functional properties and stability of protein complexes 4OAR-APO and 4OAR-CMP6, accompanying their functional inferences in biological frameworks. The work explicates the response of these complexes during a 500 ns simulation span by numerous studies, as well as RMSD, RMSF, Rg, SASA, MM-PBSA, and FELs. Negligible variations in RMSD signify elevated stability during the simulation, with minor increases noted for 4OAR-CMP6 while still within permissible thresholds.
Rg investigation specifies organizational squeezing and steadiness with time. According to Neelamma et al. (2025), during over-all simulation duration of 300 ns, RMSD analysis was conducted, resulting in final RMSD values of 0.25 for 3EQM-TOP1, 0.3 for 3EQM-APO and about 0.4 for 3EQM-ASD. The observed variations were minimal, suggesting that the 3EQM-ASD and 3EQM-TOP1 classifications exhibited stability during the simulation period without considerable oscillations [44]. Thillainayagam et al. in 2018 conducted a simulation of the chalcone complex for 40,000 ps, observing RMSD values ranging from 0.1 nm to 0.25 nm, which they deemed indicative of stability [71].
3.10. Cytotoxicity Studies
In our in-vitro study, we assessed the effect of synthesized compound 3-(naphthalen-3-yl)-1-phenylprop-2-en-1-one [3NPEO] on the viability and proliferation of breast cancer cell lines. MDAMB-231 Cell line was treated with different concentrations of the synthesized compound for 48 hours, and cell viability was measured using the MTT assay and is shown in Figure 20a–c. Results showed a dose-dependent decrease in cell viability. At higher concentrations of synthesized compound, the inhibition of cell proliferation was more pronounced, with an IC50 value of 50.27 µg/ml for the MDAMB-231 Cell line [72].
Our research finding reveals the anticancer efficacy of an CMP6 in contrary to the MDMAB-231 triple-negative breast cancer cell line via the MTT assay, with untreated and cisplatin-treated cells serving as controls. Cisplatin, a platinum-based chemotherapeutic agent, is frequently utilized in the treatment of many aggressive malignancies [73]. Our findings exhibited dose-dependent anticancer efficacy, with elevated concentrations resulting in reduced cell viability.
Infinitesimal structural analyses confirmed these conclusions, revealing alterations in cell anatomy, such as cell contraction and the emergence of apoptotic characteristics, in therapeutic cells relative to unprocessed cells.The IC50 of the trial compound was regulated to be 50.27 µg/ml. and investigated the MTT assay of synthesized chalcone derivative on the TNBC cell line, determining the IC50 to be 44.07 µg/ml [44].
3.11. Detection of Early and Late Apoptosis
The results reveal that there was no sign of apoptosis in the case of untreated cells, whereas, in the case of the synthesized compound treated with MDAMB-231 cells showed positive results for early and late apoptosis around 20.80 % and 3.10 % of cells, respectively and is represented in Figure 21. The study in breast cancer MDAMB-231 cells revealed that the synthesized compound was inducing apoptosis as represented in Table 8.
Apoptosis, a vital process for the removal of malfunctioning cells, which presents potential as a curative goal in cancer therapy [74]. Thoughtful apoptotic tracks may assist in the creation of innovative representatives. Moreover, regulating cell sequence evolution is essential for suppressing lump development, as indicated by the occurrence of mutations in cell cycle supervisors across numerous malignancies [75]. Flow cytometry-based cell cycle analyses clarified the machinery of accomplishment of CMP6, representing cell cycle apprehension at several segments in healed MDAMB-231 cells. The chalcone molecule confirmed promising anticancer efficacy contrary to the breast cancer cell line.
4. Conclusions
The photophysical properties in a chalcone-based heterocyclic derivative, employing a combination of experimental methods and theoretical calculations, unveiled a conical intersection between the S1 and S0 potential energy surfaces. This conformation signifies a π→π* character, elucidated through density functional theory calculations, emphasizing the involvement of charge transfer in the chalcone-based heterocyclic derivative. The incorporation of electron-donating groups into the naphthalene-based derivative linked to coumarin, as validated by cyclic voltammetry (CV), holds promise for enhancing fluorescence efficiencies in material development. The understanding of low fluorescence compounds, influenced by intersystem crossing and internal conversion, is crucial for applications in probes, sensors, and electron transfer reactions. The third-order nonlinear refractive index (n2), nonlinear susceptibility (χ3) and non-linear absorption coefficient (β) are of the order 10−9 cm2/W, 10−6 esu and 10−5 cm/W respectively for 3NPEO chalcone. The chalcone reveled upright optical limiting threshold rates of about 4.0 kJ/cm2. In addition to it, a comprehensive investigation of synthesized chalcone’s anticancer properties employing various methodologies, such as docking studies, molecular dynamics simulations, and investigational assays, including the MTT assay and apoptosis analysis, has yielded significant new insights. We have performed the docking investigations against PDB id 4OAR which yielded a favourable score of -8.5 kcal/mol. Molecular dynamics and simulations were conducted for the complex under study over a duration of 200 ns, during which the complex exhibited stability throughout the investigation. All experiments demonstrated favourable outcomes, and the results align with the anticancer efficacy of the synthesized molecule.
Associated Content
Supplementary Materials
The following supporting information can be downloaded at the website of this paper posted on Preprints.org. Basic theory: Th-1, Th-2.
Author Contributions
RKH- Investigation, Writing—original draft; DAY- Software, Resources, validation and editing; NGB-NLO characterization and validation, RK-Synthesis, Validation; NRP- Conceptualization, Supervision, review & editing.
Funding
This research received no external funding.
Conflicts of Interest
The authors declare no competing financial interest and have no potential conflicts of interest.
References
- D.N. Dhar, The Chemistry of Chalcones and Related Compounds, John Wiley & Sons, 1981.
- R. G. M da Costa, R de Queiroz Garcia, R. M. d. R. Fiuza, L. Maqueira, A. Pazini, De Boni, L.; Limberger, J. Synthesis, photophysical properties and aggregation-induced enhanced emission of bischalcone-benzothiadiazole and chalcone-benzothiadiazole hybrids. J. Lumin. 2021, 239, 118367. [CrossRef]
- R. Irfan, S. Mousavi, M. Alazmi, R. S. Z. Saleem, A comprehensive review of aminochalcones. Molecules, 2020, 25, 5381.
- C. Zhuang, W. Zhang, C. Sheng, W. Zhang, C. Xing, Z. Miao, Chalcone: a privileged structure in medicinal chemistry. Chem. Rev. 2017, 117, 7762−7810. [CrossRef]
- M.K.M. Ali, A.O Elzupir, M.A. Ibrahem, I.I. Suliman, A. Modwi, Hajo Idriss, K.H. Ibnaouf, Characterization of optical and morphological properties of chalcone thin films for optoelectronics applications. Optik 2017, 145, 529−533. [CrossRef]
- Vinay S. Sharma, Anuj S. Sharma, Nikhil K. Agarwal, Priyanka A. Shah and Pranav S. Shrivastav, Self-assembled blue-light emitting materials for their liquid crystalline and OLED applications: from a simple molecular design to supramolecular materials. Mol. Syst. Des. Eng. 2020, 5, 1691−1705. [CrossRef]
- T. A. Fayed, A novel chalcone-analogue as an optical sensor based on ground and excited states intramolecular charge transfer: A combined experimental and theoretical study. Chem. Phys. 2006, 324, 631−638. [CrossRef]
- Jean M.F. Custodio, Fernando Gotardo, Wesley F. Vaz, Giulio D.C. D’Oliveira, Leonardo R. de Almeida, Ruben D. Fonseca, Leandro H.Z. Cocca, Caridad N. Perez, Allen G. Oliver, Leonardo de Boni, Hamilton B. Napolitano, Benzenesulfonyl incorporated chalcones: Synthesis, structural and optical properties. J. Mol. Struct. 2020, 1208, 127845. [CrossRef]
- Devaraj Anandkumar, Shanmugam Ganesan, Perumal Rajakumar and Pichai Maruthamuthu, Synthesis, photophysical and electrochemical properties and DSSC applications of triphenylamine chalcone dendrimers via click chemistry. New J. Chem. 2017, 41, 11238−11249. [CrossRef]
- Ainizatul Husna Anizaim, Dian Alwani Zainuri, Muhamad Fikri Zaini, Ibrahim Abdul Razak, Hazri Bakhtiar, Suhana Arshad, Comparative Analyses of New Donor-π-Acceptor Ferrocenyl-Chalcones Containing Fluoro and Methoxy-Fluoro Acceptor Units as Synthesized Dyes for Organic Solar Cell Material. PLoS One 2020, 15 (11), No. e0241113.11. [CrossRef]
- Haichuang Lan, Tao Guo, Feijun Dan, Yujie Li, Qian Tang, Ratiometric Fluorescence Chemodosimeter for Hydrazine in Aqueous Solution and Gas Phase Based on Quinoline-Malononitrile. Spectrochim. Acta, Part A 2022, 271, 120892. [CrossRef]
- Sneha Kagatikar, Dhanya Sunil, Dhananjaya Kekuda, M.N. Satyanarayana, Suresh.D. Kulkarni, Y.N. Sudhakar, Anoop Kishore Vatti, Aditya Sadhanala, Pyrene- Based Chalcones as Functional Materials for Organic Electronics Application. Mater. Chem. Phys. 2023, 293, No. 126839. [CrossRef]
- René Maltais, Jenny Roy, Donald Poirier, Turning a Quinoline-Based Steroidal Anticancer Agent into Fluorescent Dye for Its Tracking by Cell Imaging. ACS. Med. Chem. Lett. 2021, 12 (5), 822−826. [CrossRef]
- C.H. Praveen Kumar, Manjunatha S. Katagi, B.P. Nandeshwarappa, Novel Synthesis of Quinoline Chalcone Derivatives - Design, Synthesis, Characterization and Antimicrobial Activity. Chem. Data Collect. 2022, 42, No. 100955. [CrossRef]
- Shivangi Sharma and Shivendra Singh, Synthetic Routes to Quinoline-Based Derivatives Having Potential Anti-Bacterial AndAnti-Fungal Properties. Curr. Org. Chem. 2022, 26 (15), 1453−1469. [CrossRef]
- Mohamed M. Kaddah, Alaa R. I. Morsy, Abdelgawad A. Fahmi, Mustafa M. Kamel, Mounir M. Elsafty, Sameh A. Rizk & Sayed K. Ramadan, Synthesis and Biological Activity on IBD Virus of Diverse Heterocyclic Systems Derived from 2-Cyano-N-((2-Oxo-1,2-Dihydroquinolin-3-Yl)Methylene)-Acetohydrazide. Synth. Commun. 2021, 51 (22), 3366−3378.
- Ibrahim Ali M Radini, Tarek M Y Elsheikh3, Emad M El-Telbani, Rizk E Khidre, New Potential Antimalarial Agents: Design, Synthesis and Biological Evaluation of Some Novel Quinoline Derivatives as Antimalarial Agents. Molecules 2016, 21 (7), 909. [CrossRef]
- Jhesua Valencia, Vivian Rubio, Gloria Puerto, Luisa Vasquez, Anthony Bernal, José R. Mora, Sebastian A. Cuesta, José Luis Paz, Braulio Insuasty, Rodrigo Abonia, Jairo Quiroga, Alberto Insuasty, Andres Coneo, Oscar Vidal, Edgar Márquez and Daniel Insuasty, QSAR Studies, Molecular Docking, Molecular Dynamics, Synthesis, and Biological Evaluation of Novel Quinolinone-Based Thiosemicarbazones against Mycobacterium Tuberculosis. Antibiotics, 2023, 12 (1), 61.
- Andrea Bacci, Francesca Corsi, Massimiliano Runfola, Simona Sestito, Ilaria Piano, Clementina Manera, Giuseppe Saccomanni, Claudia Gargini and Simona Rapposelli, Design, Synthesis, and In Vitro Evaluation of Novel 8-Amino-Quinoline Combined with Natural Antioxidant Acids. Pharmaceuticals, 2022, 15 (6), 688. [CrossRef]
- Mamdouh F. A. Mohamed and Gamal El-Din A. Abuo-Rahma, Molecular Targets and Anticancer Activity of Quinoline−Chalcone Hybrids: Literature Review. RSC Adv. 2020, 10 (52), 31139−31155. [CrossRef]
- Y. S. Kivshar, Nonlinear optics: The next decade, Opt. Exp. 16 (2008) 22126. [CrossRef]
- Jean M. F. Custodio, Giulio D. C. D’Oliveira, Fernando Gotardo, Leandro H. Z. Cocca, Leonardo De Boni, Caridad N. Perez, Lauro J. Q. Maia, Clodoaldo Valverde, Francisco A. P. Osório, and Hamilton B. Napolitano, Chalcone as Potential Nonlinear Optical Material: A Combined Theoretical, Structural, and Spectroscopic Study, J. Phys. Chem. C 2019, 123, 10, 5931–594. [CrossRef]
- P. N. Prasad, D. J. Williams, Introduction to Nonlinear Optical Effects in Organic Molecules and Polymers, Wiley, New York, 1991.
- R. L. Sutherland, Hand book of Nonlinear Optics, second edition, Marcel Dekker Inc, 2003.
- Humera Baig, Amber Iqbal, Alvina Rasool, Syed Zajif Hussain, Javed Iqbal, Meshari Alazmi, Nawaf Alshammari, Amira Alazmi, Amer AlGhadhban, Abdel Moneim E. Sulieman, Kamaleldin B. Said,Habib-ur Rehman, and Rahman Shah Zaib Saleem, Synthesis and Photophysical, Electrochemical, and DFT Studies of Piperidyl and Pyrrolidinyl Chalcones, ACS Omega 2023, 8, 28499−28510. [CrossRef]
- Daniel Insuasty, Mario Mutis, Jorge Trilleras, Luis A. Illicachi, Juan D. Rodríguez, Andrea Ramos-Hernández, Homero G. San-Juan-Vergara, Christian Cadena-Cruz, José R. Mora, José L. Paz, Maximiliano Méndez-López, Edwin G. Pérez, Margarita E. Aliaga, Jhesua Valencia, and Edgar Márquez, Synthesis, Photophysical Properties, Theoretical Studies, and Living Cancer Cell Imaging Applications of New 7-(Diethylamino)quinolone Chalcones, ACS Omega 2024, 9, 17, 18786-18800. [CrossRef]
- M.N. Gomes, E.N. Muratov, M. Pereira, J.C. Peixoto, L.P. Rosseto, P.V.L. Cravo, C.H. Andrade, B.J. Neves, Chalcone Derivatives: Promising Starting Points for Drug Design, Molecules, 2017, 22, 1210. [CrossRef]
- R. A. Kusanur, M.V. Kulkarni, A Novel Route for the Synthesis of Recemic 4-(Coumaryl) Alanines and Their Antimicrobial Activity, , Asian J. of Chem., 2014, 26(4), 1077. [CrossRef]
- Raviraj Kusanur, Manjunath Ghate, Manohar Kulkarni, Synthesis and biological activities of some substituted 4-{4-(1, 5-diphenyl-1H-pyrazol-3-yl) phenoxymethyl} coumarins, Indian Journal of Heterocyclic Chemistry, 2004,13 (3), 201-204.
- Dayanand Patagar, Akshay Uttarkar, Swarna M Patra, Jagadish H Patil, Raviraj Kusanur, Vidya Niranjan, H G Ashok Kumar, Spiro benzodiazepine substituted fluorocoumarins as potent anti-anxiety agents, Russian Journal of Bioorganic Chemistry, 2021,47 (2), 390-398. [CrossRef]
- M. Sheik-Bahae, A.A. Said, T.H. Wei, D.J. Hagan, E.W. Van Stryland, Sensitive measurement of optical nonlinearities using a single beam, IEEE J. Quant. Electron., 1990, 26, 760–769. [CrossRef]
- M. Sheik Bahae, D.C. Hutchings, D.J. Hagan, E.W. Van Stryland, Dispersion of bound electronic nonlinear refraction in solids, IEEE J. Quant. Electron, 199127, 1296–1309. [CrossRef]
- M. J. Frisch, G. W. Trucks, H. B. Schlegel, G. E. Scuseria, M. A. Robb, J. R. Cheeseman, G. Scalmani, V. Barone, G. A. Petersson, H. Nakatsuji, X. Li, M. Caricato, A. V. Marenich, J. Bloino, B. G. Janesko, R. Gomperts, B. Mennucci, H. P. Hratchian, J. V. Ortiz, A. F. Izmaylov, J. L. Sonnenberg, D. Williams-Young, F. Ding, F. Lipparini, F. Egidi, J. Goings, B. Peng, A. Petrone, T. Henderson, D. Ranasinghe, V. G. Zakrzewski, J. Gao, N. Rega, G. Zheng, W. Liang, M. Hada, M. Ehara, K. Toyota, R. Fukuda, J. Hasegawa, M. Ishida, T. Nakajima, Y. Honda, O. Kitao, H. Nakai, T. Vreven, K. Throssell, J. A. Montgomery, Jr., J. E. Peralta, F. Ogliaro, M. J. Bearpark, J. J. Heyd, E. N. Brothers, K. N. Kudin, V. N. Staroverov, T. A. Keith, R. Kobayashi, J. Normand, K. Raghavachari, A. P. Rendell, J. C. Burant, S. S. Iyengar, J. Tomasi, M. Cossi, J. M. Millam, M. Klene, C. Adamo, R. Cammi, J. W. Ochterski, R. L. Martin, K. Morokuma, O. Farkas, J. B. Foresman, and D. J. Fox, Gaussian, Inc., Wallingford CT, 2016. Gaussian 16, Revision C.01.
- Narayanan Eswar, Ben Webb, Marc A Marti-Renom, M S Madhusudhan, David Eramian, Min-Yi Shen, Ursula Pieper, Andrej Sali, Comparative Protein Structure Modeling Using Modeller, Curr. Protoc. Bioinforma., 2006, 15, Oct: Chapter 5: Unit-5.6.
- M. Ahmad, W. Bauer, S. Katz, Ulcerative colitis, hyperamylasemia, and asymptomatic pancreatic calcifications: making the case for pancreatitis as an extra luminal manifestation., Am. J. Gastroenterol. 1997, 92, 2307–9.
- A.K. Malde, L. Zuo, M. Breeze, M. Stroet, D. Poger, P.C. Nair, C. Oostenbrink, A.E. Mark, An Automated Force Field Topology Builder (ATB) and Repository: Version 1.0, J. Chem. Theory Comput., 2011, 7, 4026–4037. [CrossRef]
- R. Anandakrishnan, B. Aguilar, A. V Onufriev, H++ 3.0: automating pK prediction and the preparation of biomolecular structures for atomistic molecular modeling and simulations., Nucleic Acids Res. 2012, 40, W537-41. [CrossRef]
- P. Mark, L. Nilsson, Structure and Dynamics of the TIP3P, SPC, and SPC/E Water Models at 298 K, J. Phys. Chem. A., 2001,105, 9954–9960. [CrossRef]
- S.C. Tuble, J. Anwar, J.D. Gale, An Approach to Developing a Force Field for Molecular Simulation of Martensitic Phase Transitions between Phases with Subtle Differences in Energy and Structure, J. Am. Chem. Soc., 2004,126, 396–405. [CrossRef]
- T. Darden, D. York, L. Pedersen, Particle mesh Ewald: An N ⋅log( N ) method for Ewald sums in large systems, J. Chem. Phys., 1993, 98, 10089–10092.
- B. Hess, H. Bekker, H.J.C. Berendsen, J.G.E.M. Fraaije, LINCS: A linear constraint solver for molecular simulations, J. Comput. Chem., 1997, 18, 1463–1472.
- B.R. Miller, T.D. McGee, J.M. Swails, N. Homeyer, H. Gohlke, A.E. Roitberg, MMPBSA.py : An Efficient Program for End-State Free Energy Calculations, J. Chem. Theory Comput., 2012, 8, 3314–3321.
- R. Kumari, R. Kumar, A. Lynn, g_mmpbsa —A GROMACS Tool for High-Throughput MM-PBSA Calculations, J. Chem. Inf. Model., 2014, 54, 1951–1962.
- N.B. Gummagol, D.A. Yaraguppi, S.B. Patil, P.S. Patil, N.R. Patil, N.H. Ayachit, Exploring the anticancer potential of novel chalcone derivatives: Synthesis, characterization, computational analysis, and biological evaluation against breast cancer, J. Mol. Struct., 2025, 1320, 139586. [CrossRef]
- G. V. Muddapur, N. R. Patil, S. S. Patil, R. M. Melavanki and R. A. Kusanur, Estimation of Ground and Excited State Dipole Moments of aryl Boronic acid Derivative by Solvatochromic Shift Method, J. Fluoresc., 24, (2014) 1651–165949. [CrossRef]
- S. S. Patil, G. V. Muddapur, N. R. Patil, R. M. Melavanki, R. A. Kusanur, Fluorescence characteristics of aryl boronic acid derivative (PBA), Spectrochimica Acta Part A: Molecular and Biomolecular Spectroscopy, 138, (2015) 85-91.
- G. V. Muddapur, R. M. Melavanki, P. G. Patil, D. Nagaraja, N. R. Patil, Photophysical properties of 3MPBA: Evaluation and co-relation between solvatochromism and quantum yield in different solvents, J. Mol. Liq., 224(1), (2016) 201-210. [CrossRef]
- G. V. Muddapur, R M Melavanki, K Sharma, H T Srinivasa, J Thipperudrappa, Fluorescence properties of aromatic asymmetric di-ketone compound in polar and non-polar solvents, Journal of Physics: Conference Series 1473 (1), (2020) 012044.
- R.M. Melavanki, G. V. Muddapur, H.T. Srinivasa, S.S. Honnanagoudar, N. R. Patil Solvation, rotational dynamics, photophysical properties study of aromatic asymmetric di-ketones: An experimental and theoretical approach J. Mol. Liq., 337 (2021) 116456.
- Sirilak Wangngae, Kantapat Chansaenpak, Jukkrit Nootem, Utumporn Ngivprom, Sirimongkon Aryamueang, Rung-Yi Lai, and Anyanee Kamkaew, Photophysical Study and Biological Applications of Synthetic Chalcone-Based Fluorescent Dyes, Molecules 2021, 26, 2979. [CrossRef]
- Humera Baig, Rimsha Irfan, Alvina Rasool, Syed Zajif Hussain, Sabir Ali Siddique, Javed Iqbal, Meshari Alazmi, Nawaf Alshammari, Amira Alazmi, Amer AlGhadhban, Abdel Moneim E. Sulieman, Kamaleldin B. Said, Habib-ur- Rehman, Rahman Shah Zaib Saleem, Synthesis, photophysical, voltammetric, and DFT studies of 4-aminochalones, J. Photochem. & Photobiol., A: Chemistry, 2023, 442(1), 114790.
- Tanisha Sachdeva , Marilyn Daisy Milton, AIEE active novel red-emitting D-π-A phenothiazine chalcones displaying large Stokes shift, solvatochromism and “turn-on” reversible mechano fluorochromism, Dyes and Pigments, 2020,181, 108539.
- Shangfeng Wang, Benhao Li, Fan Zhang, Molecular Fluorophores for Deep-Tissue Bioimaging, ACS Cent. Sci. 2020, 6, 1302−1316. [CrossRef]
- NR Patil, Raveendra M Melavanki, SB Kapatkar, NH Ayachit, J Saravanan, Solvent Effect on Absorption and Fluorescence Spectra of Three Biologically Active Carboxamides (C1, C2 and C3). Estimation of Ground and Excited State Dipole Moment from Solvatochromic Method Using Solvent Polarity Parameters, J. Fluoresc., 2011, 21, 1213–1222. [CrossRef]
- Raveendra M Melavanki, NR Patil, SB Kapatkar, NH Ayachit, Siva Umapathy, J Thipperudrappa, AR Nataraju, Solvent effect on the spectroscopic properties of 6MAMC and 7MAMC, J. Mol. Liq., 2011, 158 (2), Pages 105-110. [CrossRef]
- Tapati Mallik & Debashis Banerjee, Solvation and Solvatochromism: An Overview, Ind. J. Chem., 2022, 61, 472-481. [CrossRef]
- P. Bhavya, Raveendra Melavanki, M. N. Manjunatha, Varsha Koppal, N. R. Patil and V.T. Muttannavar, Solvent Effects on the Photophysical Properties of Coumarin Dye, AIP Conference Proceedings 1953, (2018), 080022.
- V. V. Koppal, G. V. Muddapur, N. R. Patil and R. M. Melavanki, Spectroscopic studies of biologically active coumarin laser dye: Evaluation of dipole moments by solvatochromic shift method, AIP Conf. Proc. 1728, (2016), 020411.
- V.V. Koppal, P.G. Patil, R.M. Melavanki and N.R. Patil., Study on Solvent Effect and Estimation of Dipole Moments of Laser Dye 3ADHC, Materials Today: Proceedings 5 (2018) 2759–2764. [CrossRef]
- Varsha V. Koppal, P. G. Patil, Raveendra Melavanki, Raviraj Kusanur, and N. R. Patil, Solvent Effect on the Relative Quantum Yield and Preferential Solvation of Biologically Active Coumarin Derivative, Macromol. Symp., 387, (2019), 1800210. [CrossRef]
- A. Gaur, P. Gaur, D. Sharma, D.K. Sharma, N. Singh, B.P. Malik, Study of transmittance dependence closed-aperture Z-scan curves in the materials with nonlinear refraction and strong absorption, Optik 123 (2012) 1583–1587. [CrossRef]
- X.Q. Yan, Z.B. Liu, X.L. Zhang, W.Y. Zhou, J.G. Tian, Polarization dependence ofZ-scan measurement: theory and experiment, Opt Express 17 (2009) 6397–6406. [CrossRef]
- F. D’Amore, J. Osmond, S. Destri, M. Pasini, V. Rossi, W. Porzio, Effects of backbone modification on the linear and third order nonlinear optical properties in fluorene based copolymers, Synth. Met. 149 (2005) 123–127. [CrossRef]
- A.J. Kiran, D. Udayakumar, K. Chandrashekaran, A.V.Adhikari, H.D.Shashikala, Z-Scan and degenerate four wave mixing studies on newly synthesized copolymers containing alternating substituted thiophene and 1,3,4-oxadiazole units, J. Phys. B 39 (18) (2006) 3747-3756. [CrossRef]
- A. Ekbote, P.S.Patil, S.R. Maidur, T.S. Chia, C.K. Quah, Structural, third-order optical nonlinearities and figures of merit (E)-1-(3-substituted phenyl)-3-(4-fluorophenyl) prop2-en-1-one under CW regime: new Chalcone derivatives for optical limiting applications, Dyes Pigments 139 (2017) 720-729. [CrossRef]
- P. Thanikaivelan, V. Subramanian), J. Raghava Rao, Balachandran Unni Nair, Application of quantum chemical descriptor in quantitative structure activity and structure property relationship, Chem. Phy. Lett., 2000, 323, 59–70. [CrossRef]
- J.S. Murray, K. Sen, Molecular electrostatic potentials: concepts and applications, Elsevier, 1996.
- E. Scrocco, J. Tomasi, Advances in Quantum Chemistry, Vol. 2, P. Lowdin, ed, in, Academic Press, New York, 1978.
- Nanjundaswamy, S., Gurumallappa, Hema, M.K., Karthik, C.S., Rajabathar, J.R., Arokiyaraj, S., Lokanath, N.K., Mallu, P., Synthesis, crystal structure, in-silico ADMET, molecular docking and dynamics simulation studies of thiophene-chalcone analogues. J. Mol. Struct. 2022, 1247, 131365.
- Mahalakshmi Thillainayagam, Kullappan Malathi & Sudha Ramaiah, In - Silico molecular docking and simulation studies on novel chalcone and flavone hybrid derivatives with 1, 2, 3-triazole linkage as vital inhibitors of Plasmodium falciparum dihydroorotate dehydrogenase. J. Biomol. Struct. Dyn. 2018, 36, 3993–4009.
- Mahalakshmi Thillainayagam, Kullappan Malathi, Anand Anbarasu, Harpreet Singh, Renu Bahadur & Sudha Ramaiah, Insights on inhibition of Plasmodium falciparum plasmepsin I by novel epoxyazadiradione derivatives – molecular docking and comparative molecular field analysis, Journal of Biomolecular Structure and Dynamics, 2019, 37 (12), 3168-3182. [CrossRef]
- Abdullahi, S.H., Uzairu, A., Shallangwa, G.A., Uba, S., Umar, A.B.,. In-silico activity prediction, structure-based drug design, molecular docking and pharmacokinetic studies of selected quinazoline derivatives for their antiproliferative activity against triple negative breast cancer (MDA-MB231) cell line, Bull. Natl. Res. Cent. 2022, 46, 2. [CrossRef]
- Kamala K. Vasu, Hemantkumar D. Ingawale, Sneha R. Sagar, Jayesh A. Sharma, Daivat H. Pandya, and Milee Agarwal, 2-((1H-1,2,3-triazol-1-yl)methyl)-3-phenylquinazolin-4(3H)-ones: Design, Synthesis and Evaluation as Anti-cancer Agents, Curr. Bioact. Compd., 2018, 14, 254–263. [CrossRef]
- Giuseppa Pistritto, Daniela Trisciuoglio, Claudia Ceci, Alessia Garufi, and Gabriella D’Orazi, Apoptosis as anticancer mechanism: function and dysfunction of its modulators and targeted therapeutic strategies. Aging (Albany. NY)., 2016, 8, 603–619. [CrossRef]
- Zbigniew Darzynkiewicz, Elzbieta Bedner, Piotr Smolewski, Flow cytometry in analysis of cell cycle and apoptosis. Semin. Hematol. 2001, 38, 179–193.
Figure 1.
The molecular structure of 3NPEO.
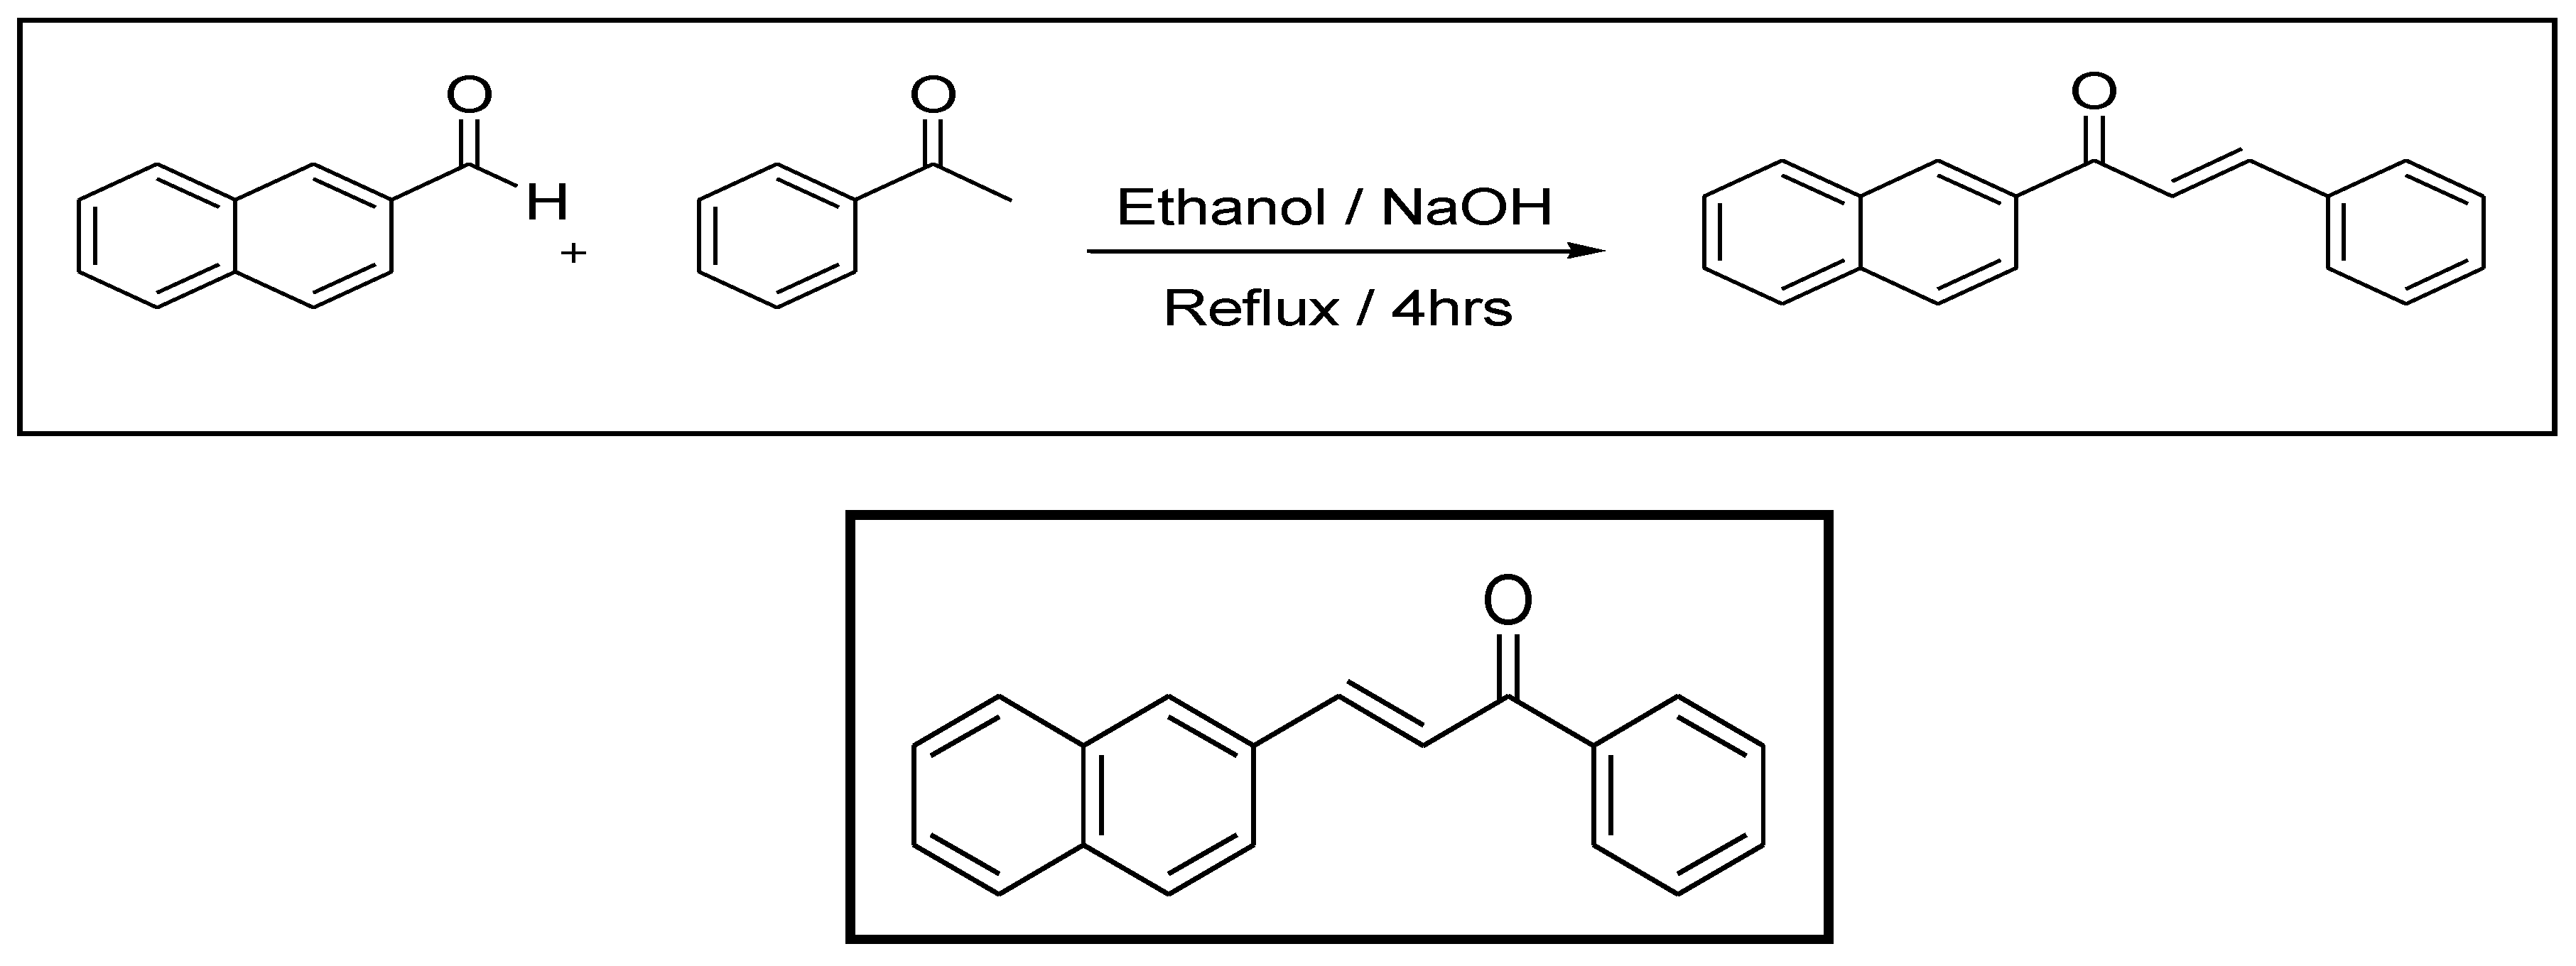
Figure 5.
(a) Normalized absorption and (b) emission spectra of 3NPEO in different solvents.
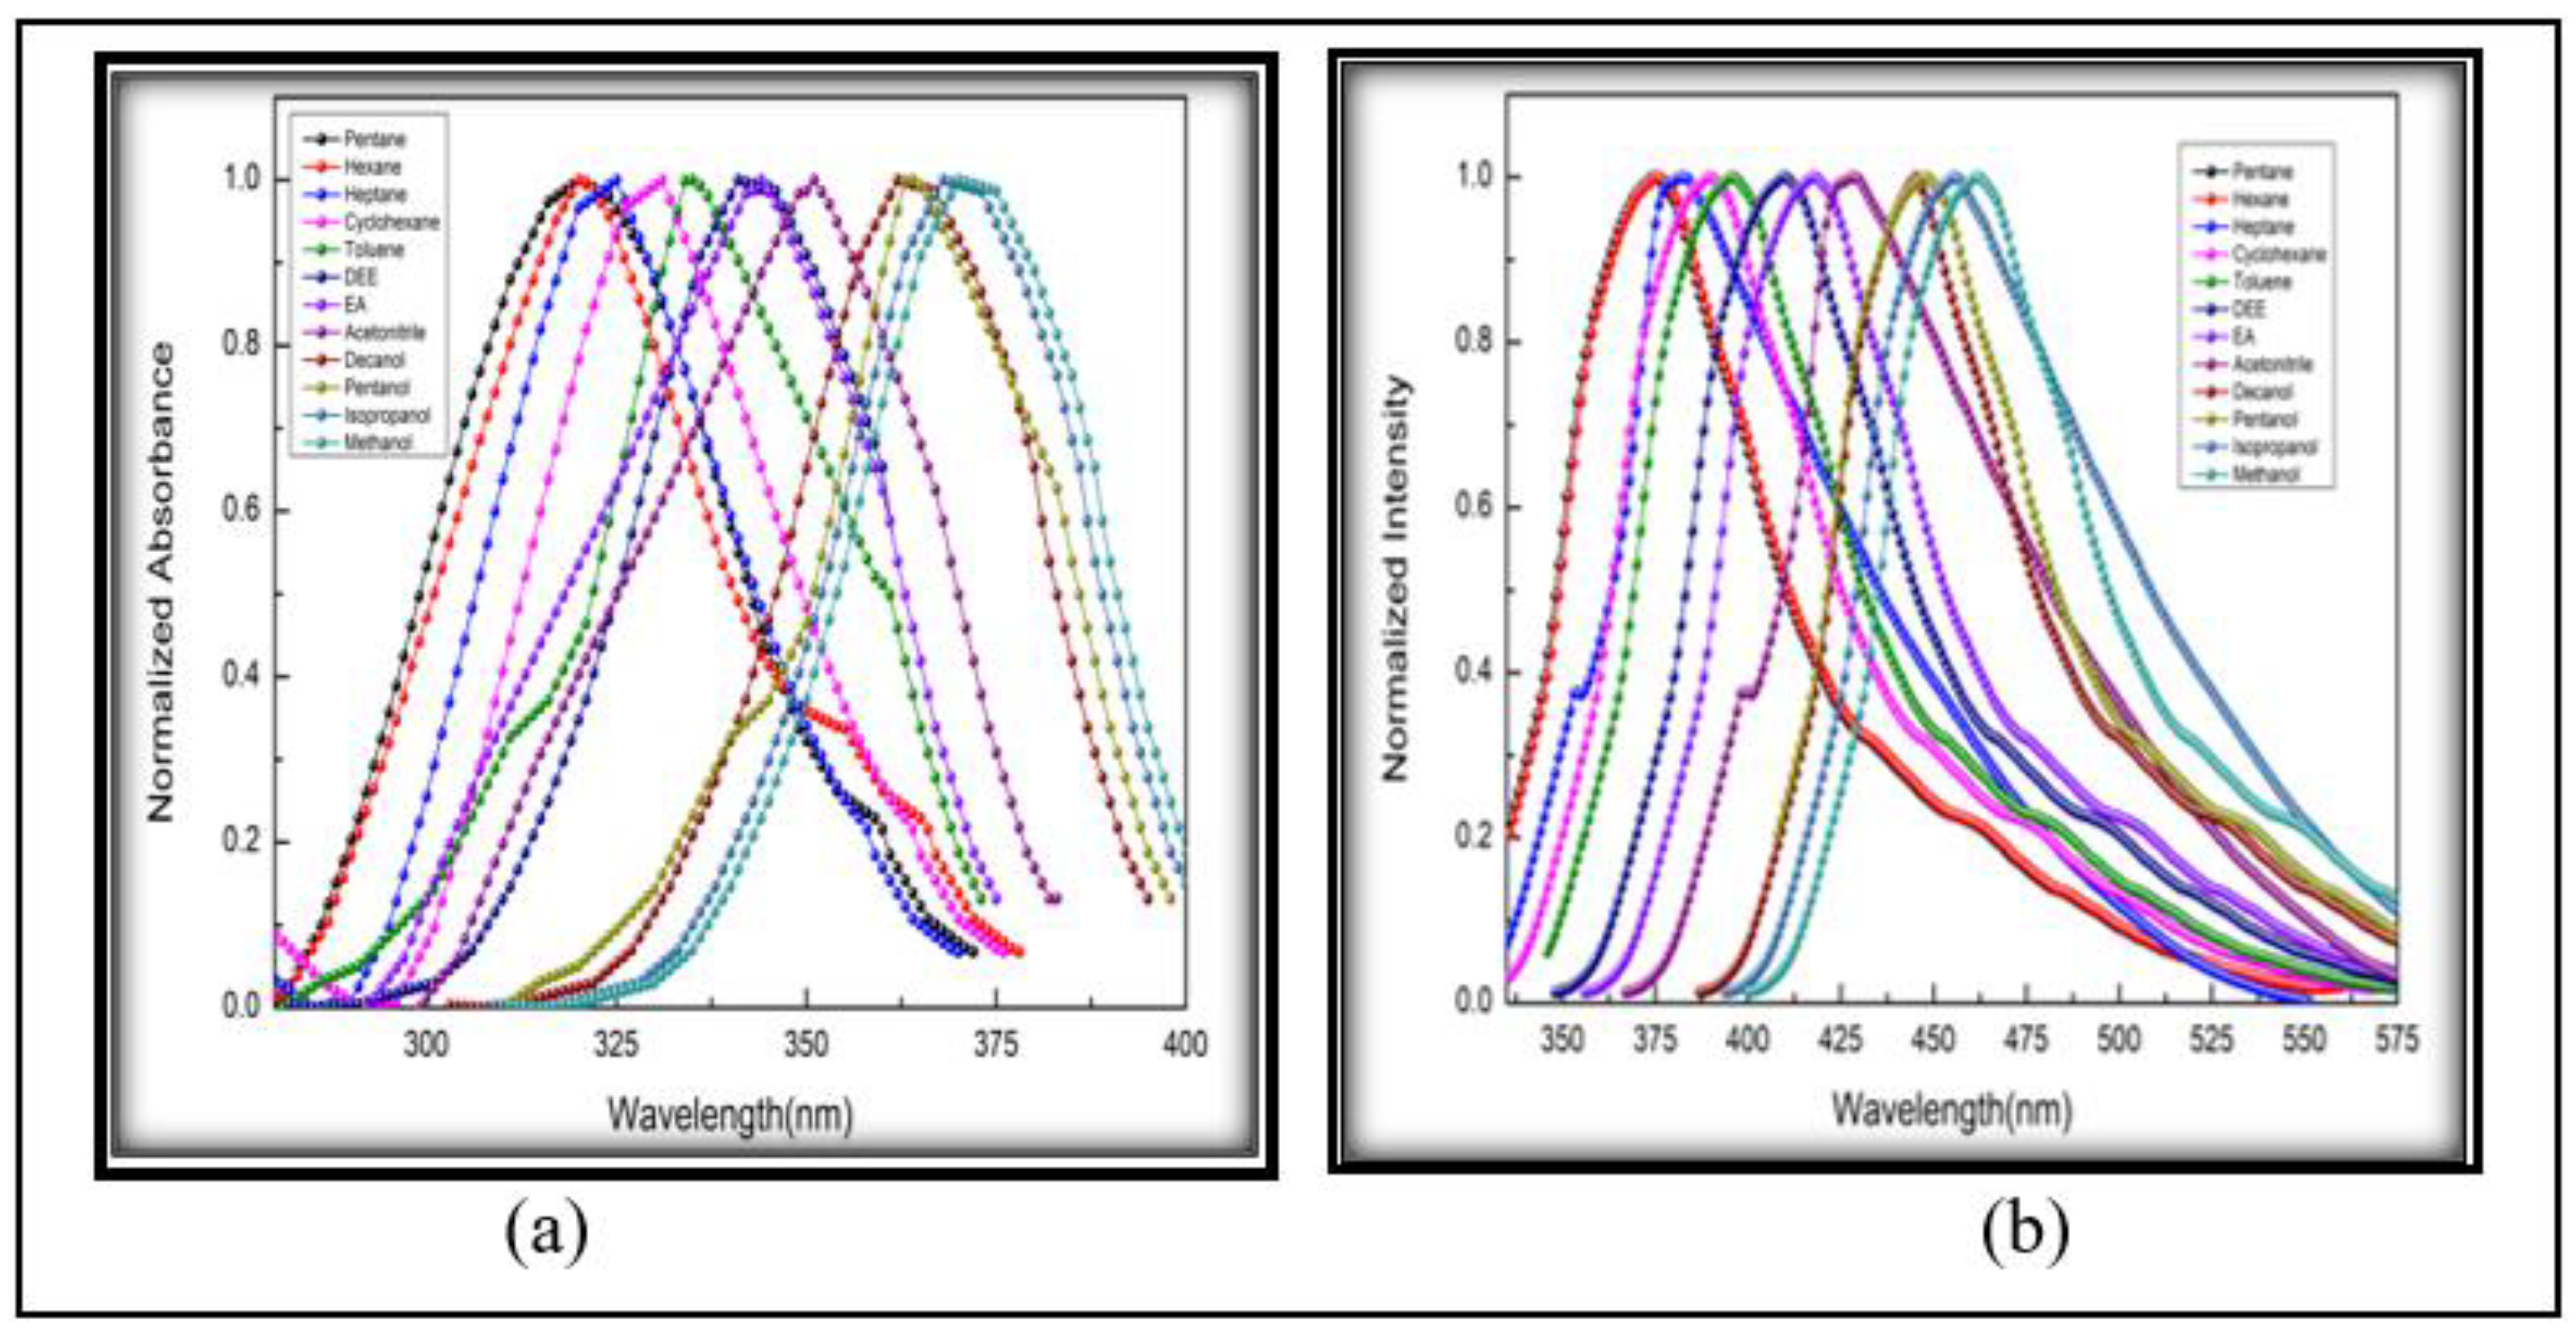
Figure 6.
optimized geometrical structure of 3NPEO.
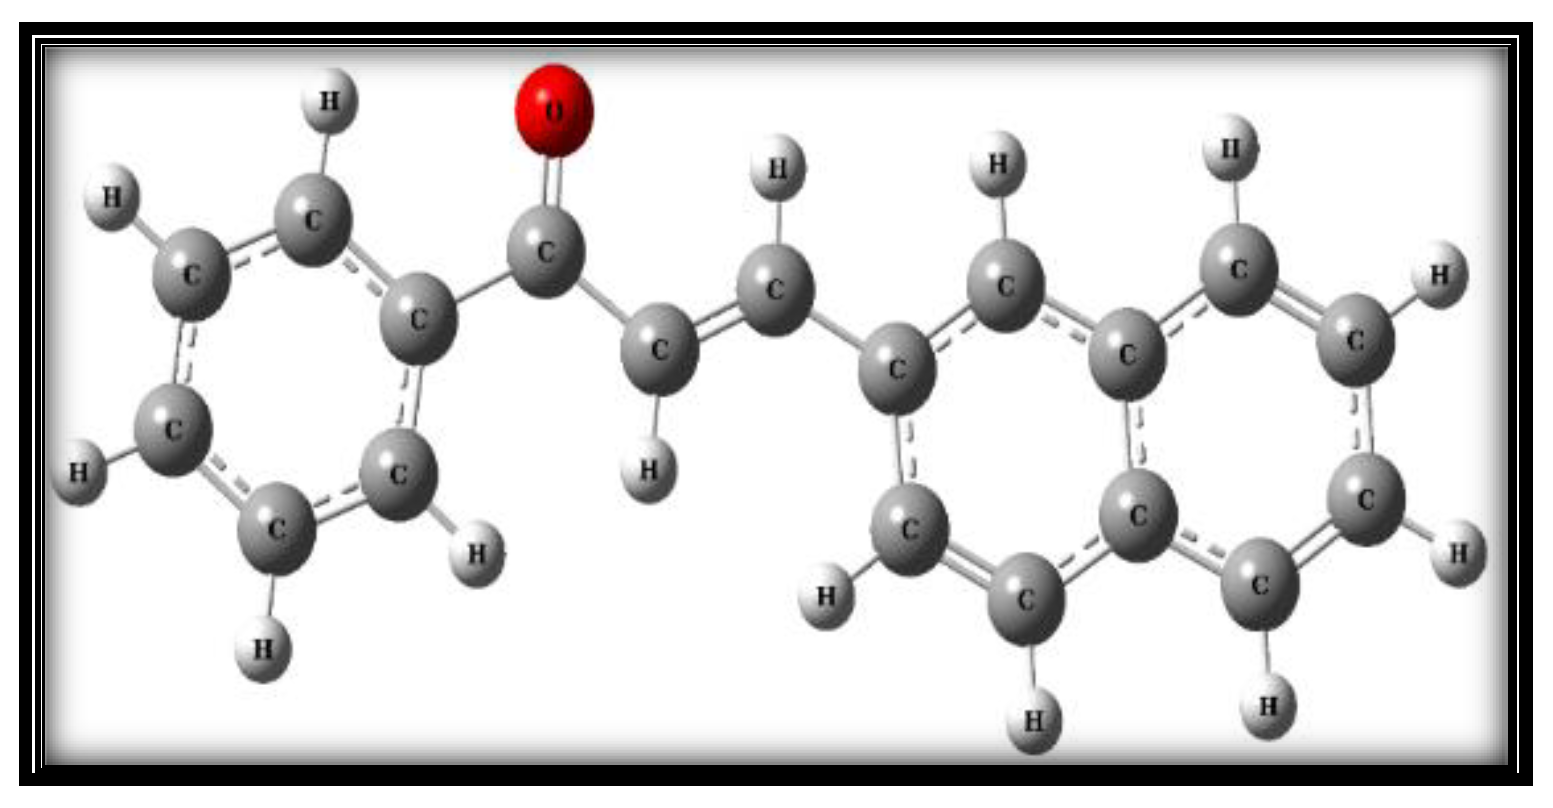
Figure 7.
(a) Optimized geometry in ground state (b) Optimized geometry in excited state of 3NPEO. The arrow mark represents the direction of the dipole moment.
Figure 7.
(a) Optimized geometry in ground state (b) Optimized geometry in excited state of 3NPEO. The arrow mark represents the direction of the dipole moment.
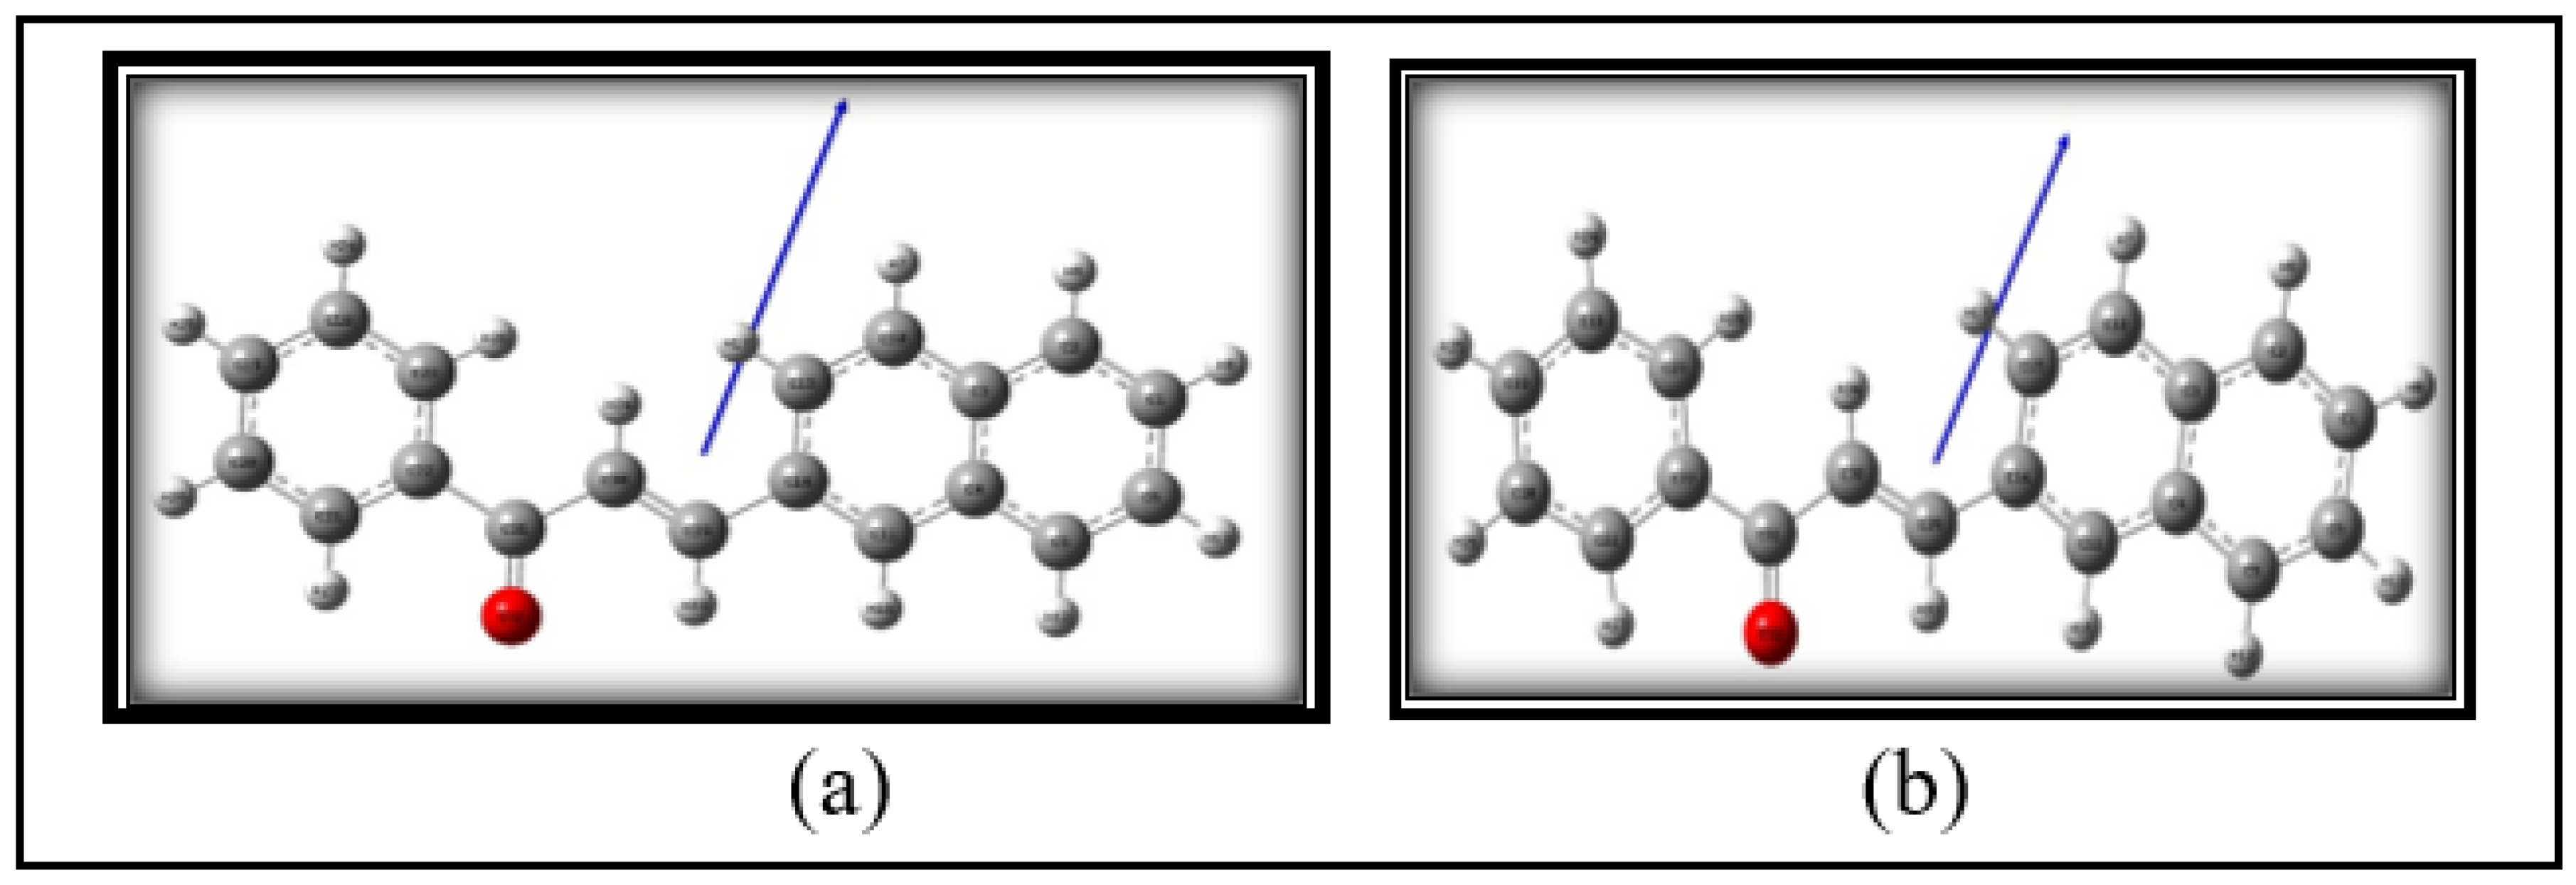
Figure 8.
(a) Absorption and (b) emission spectra of 3NPP in isopropanol with fluorescence.
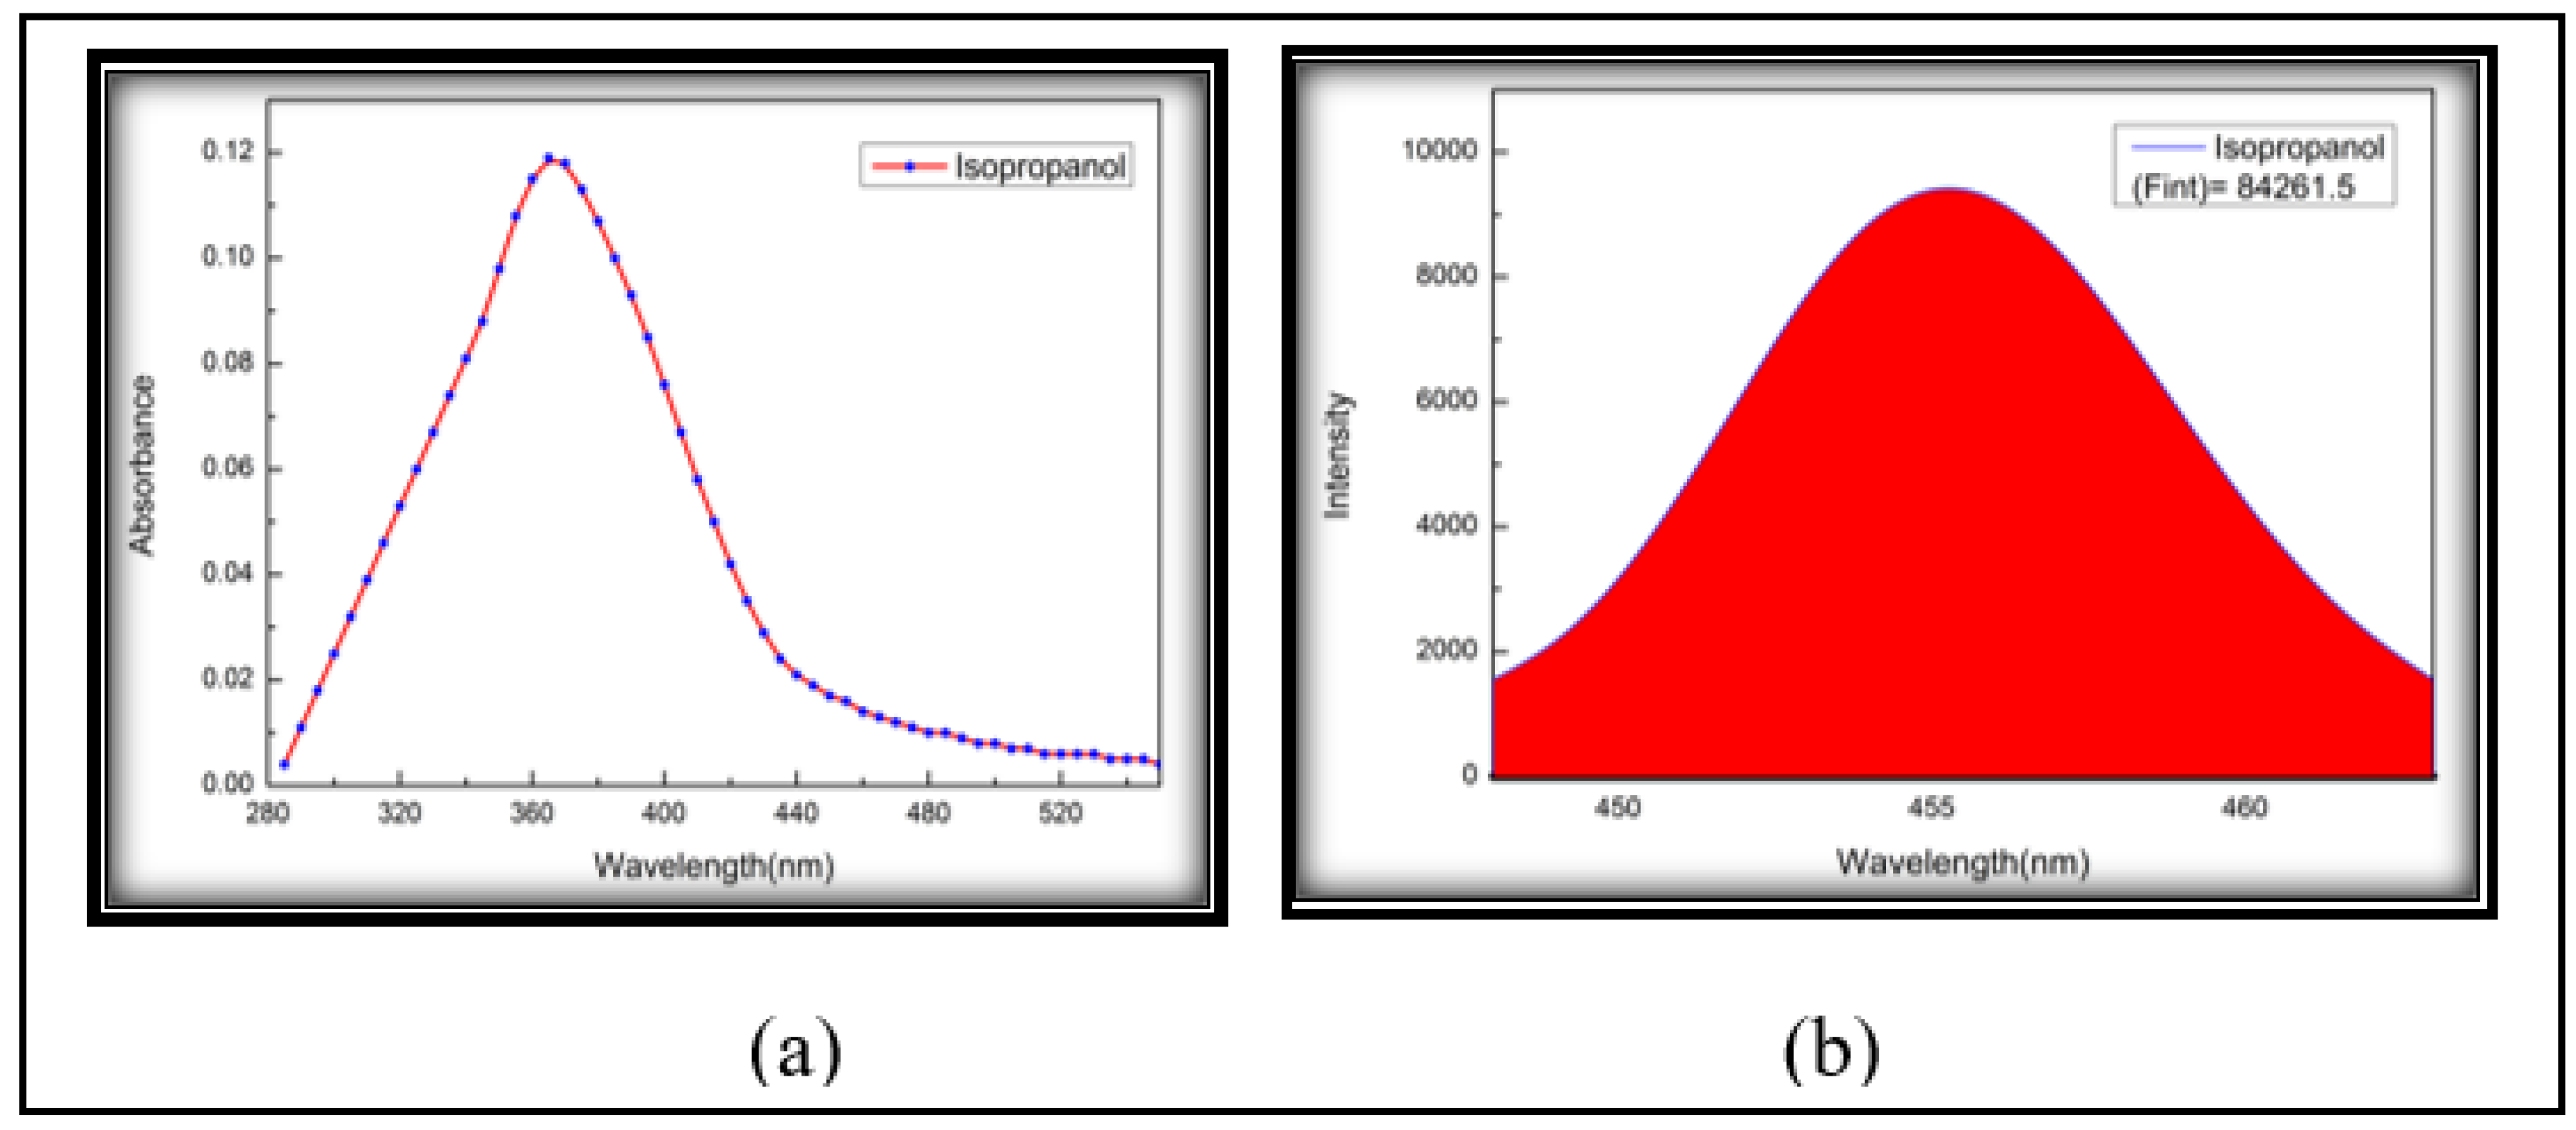
Figure 9.
(a) Open aperture and (b) closed aperture Z-scan curve of 3NPEO.
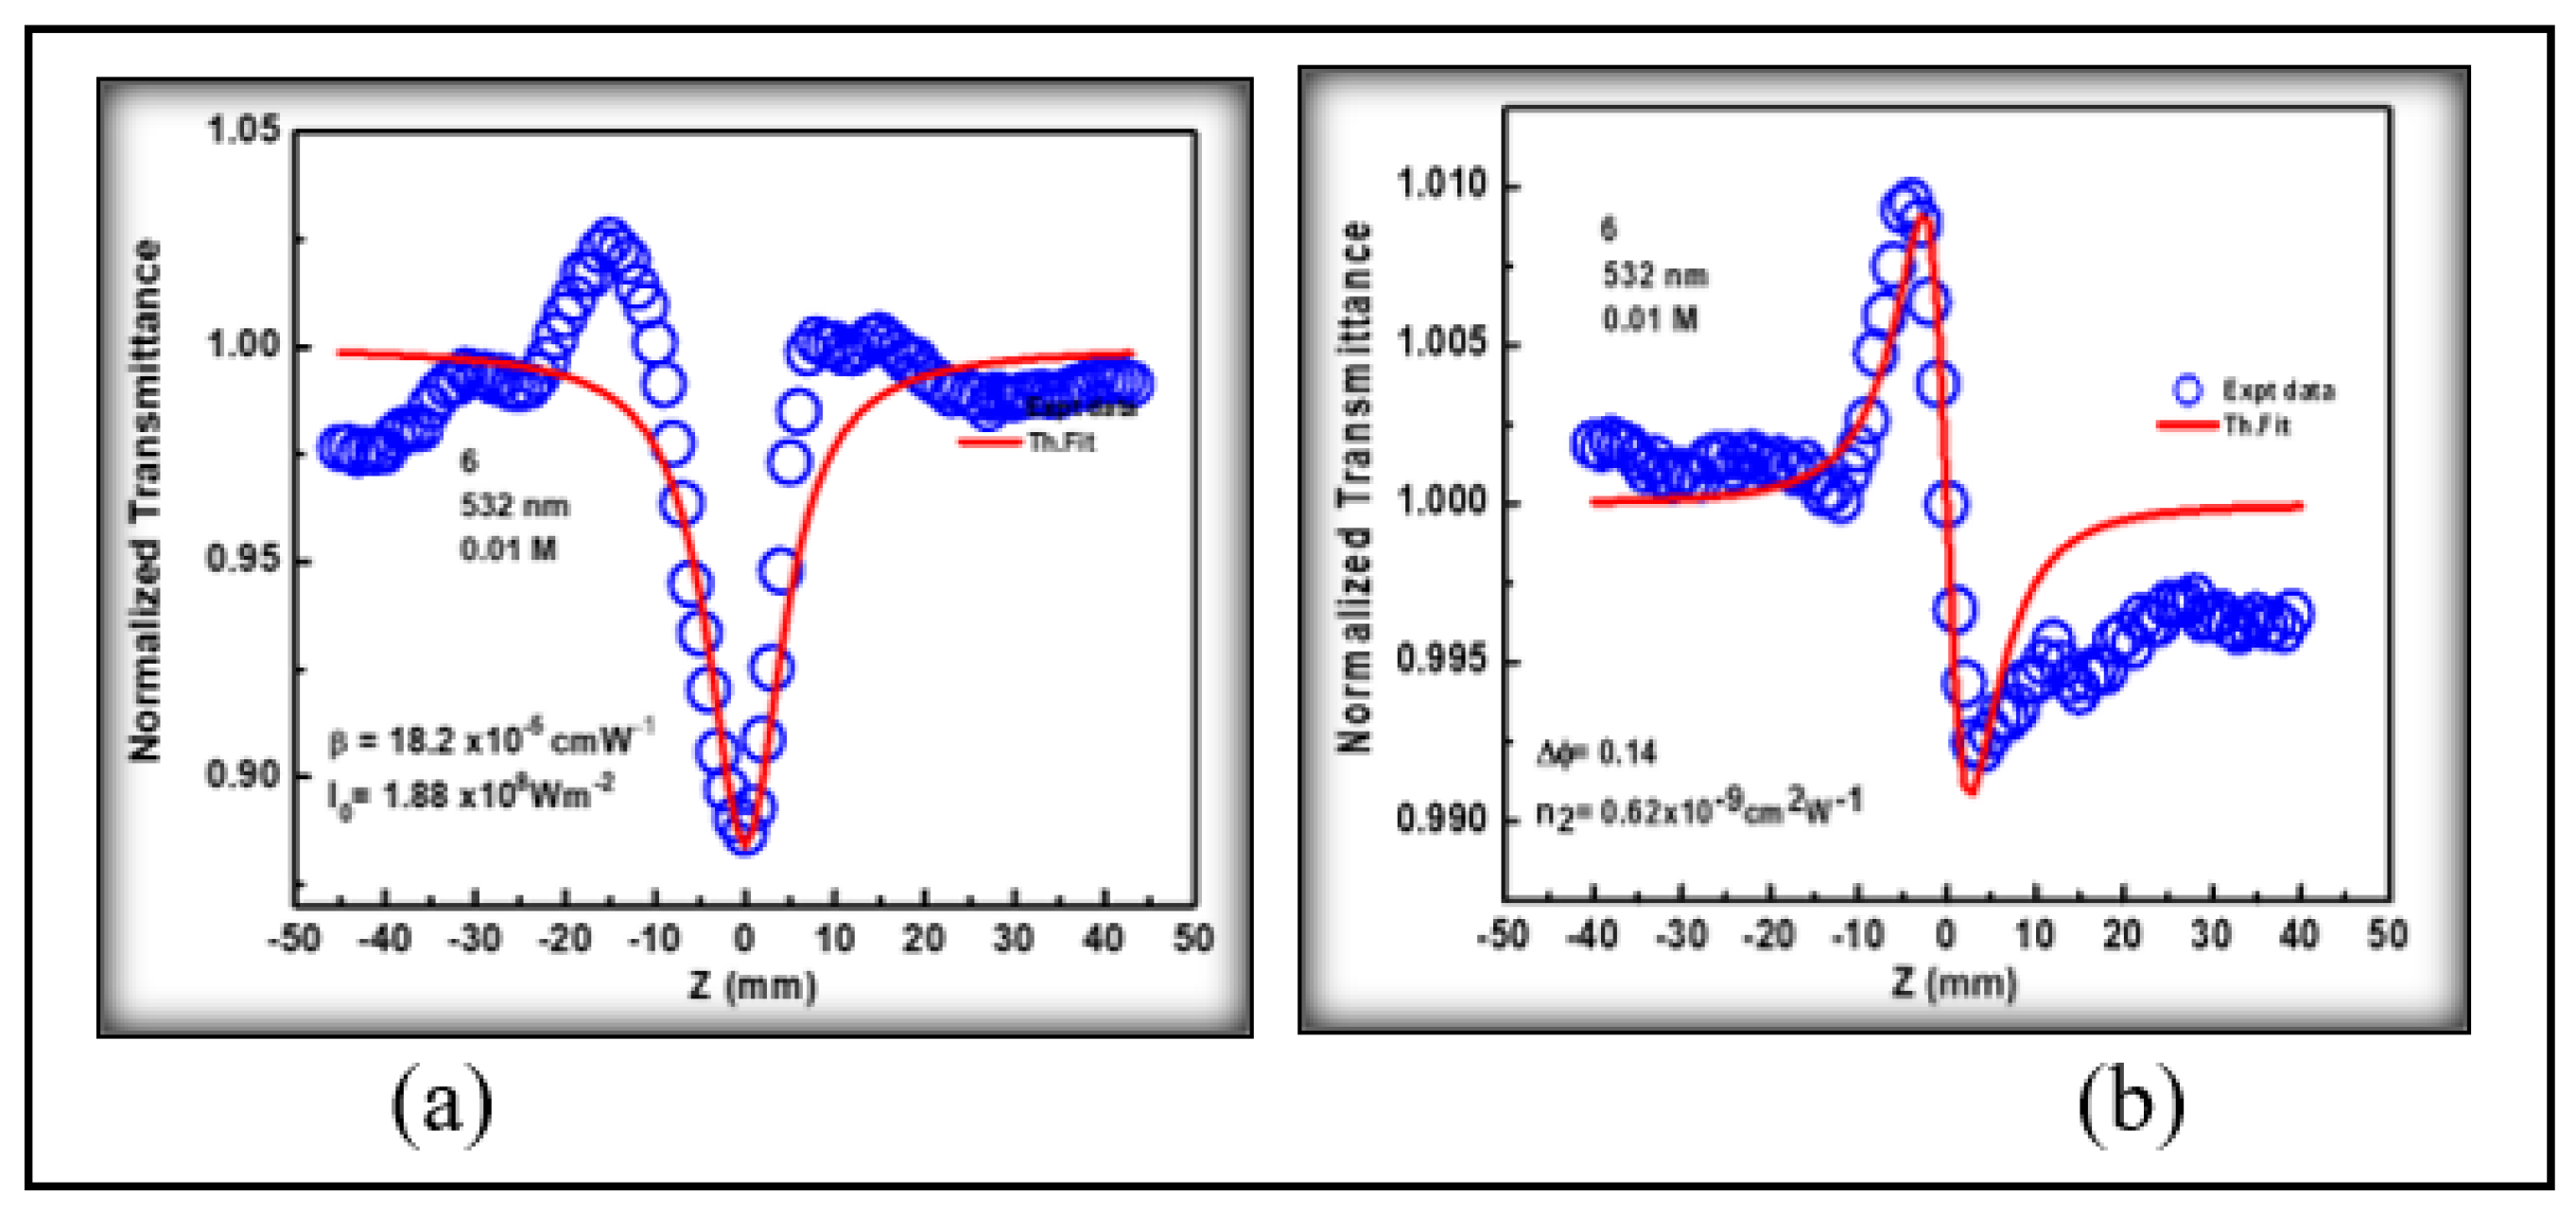
Figure 10.
Optical limiting curve of 3NPEO.
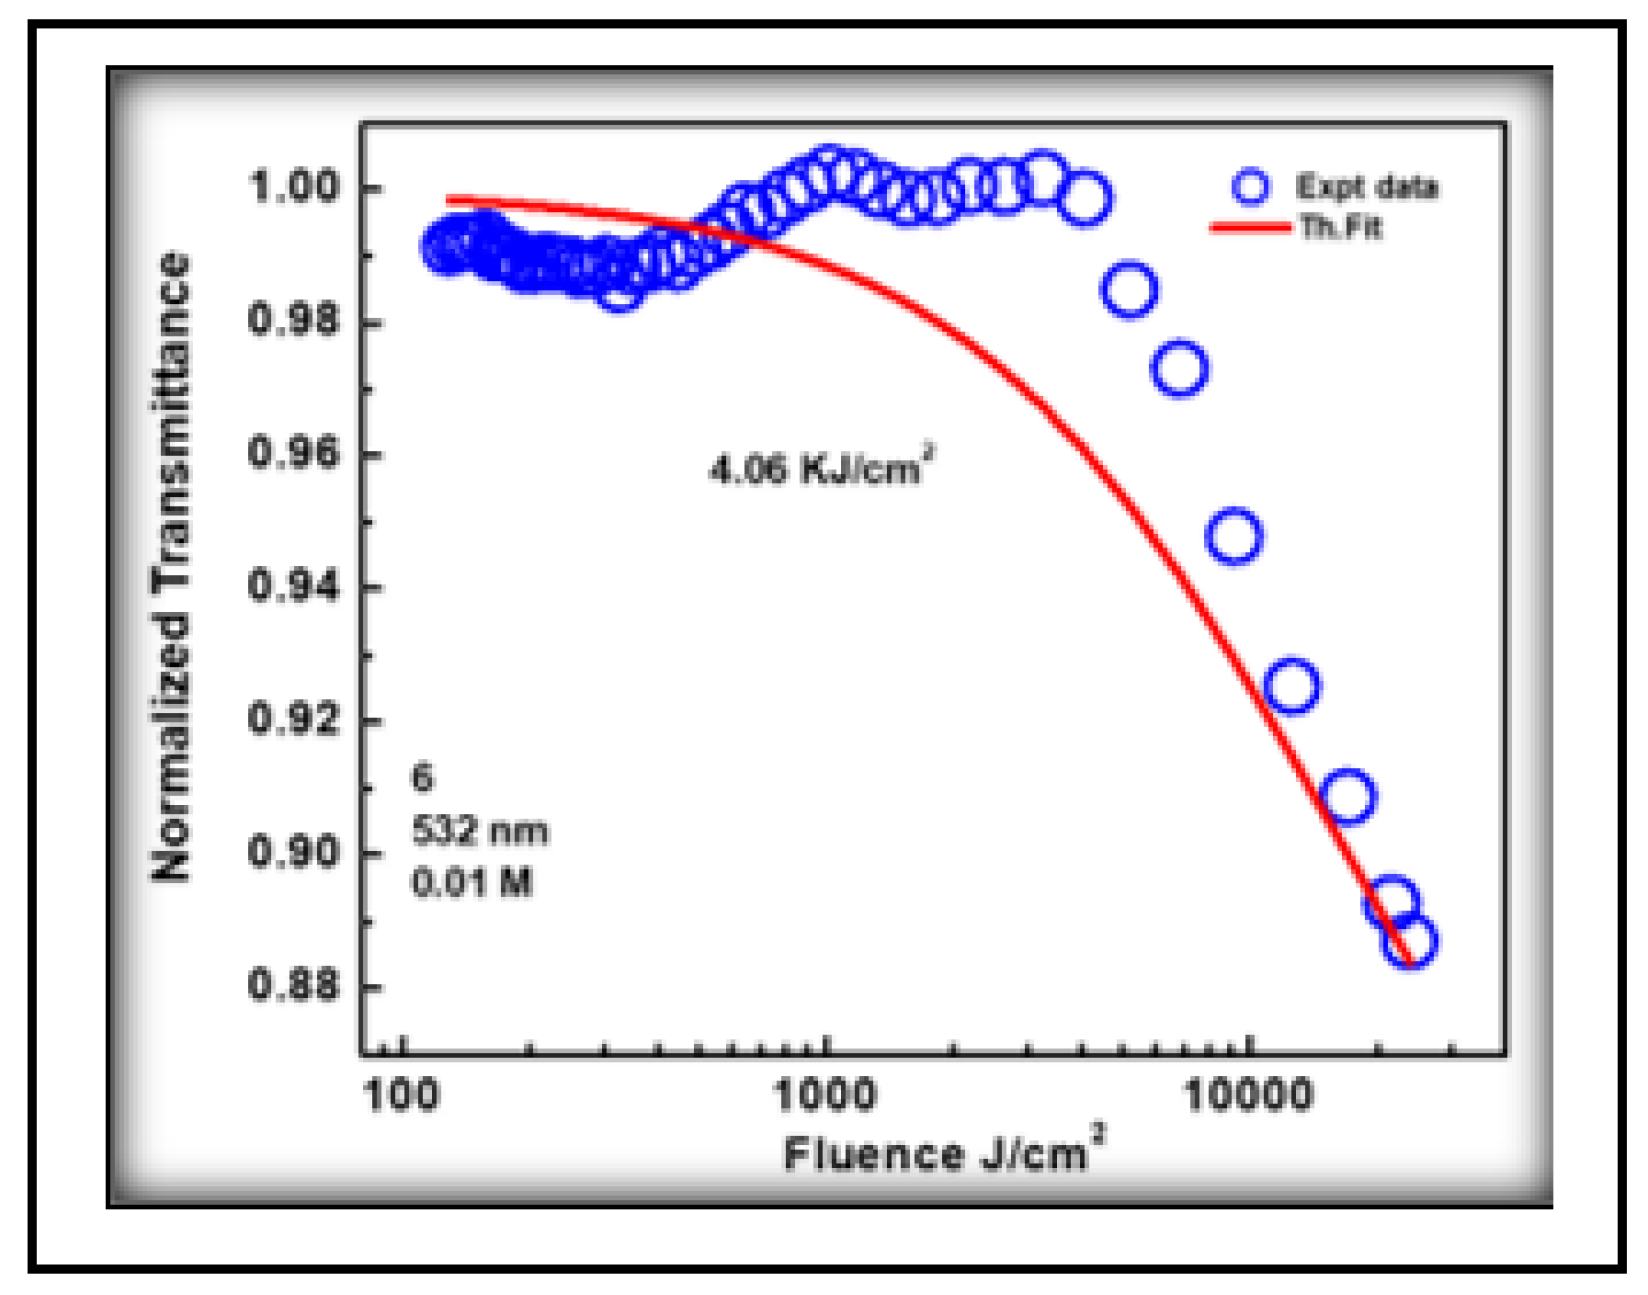
Figure 11.
HOMO-LUMO and the band gap of 3NPEO.
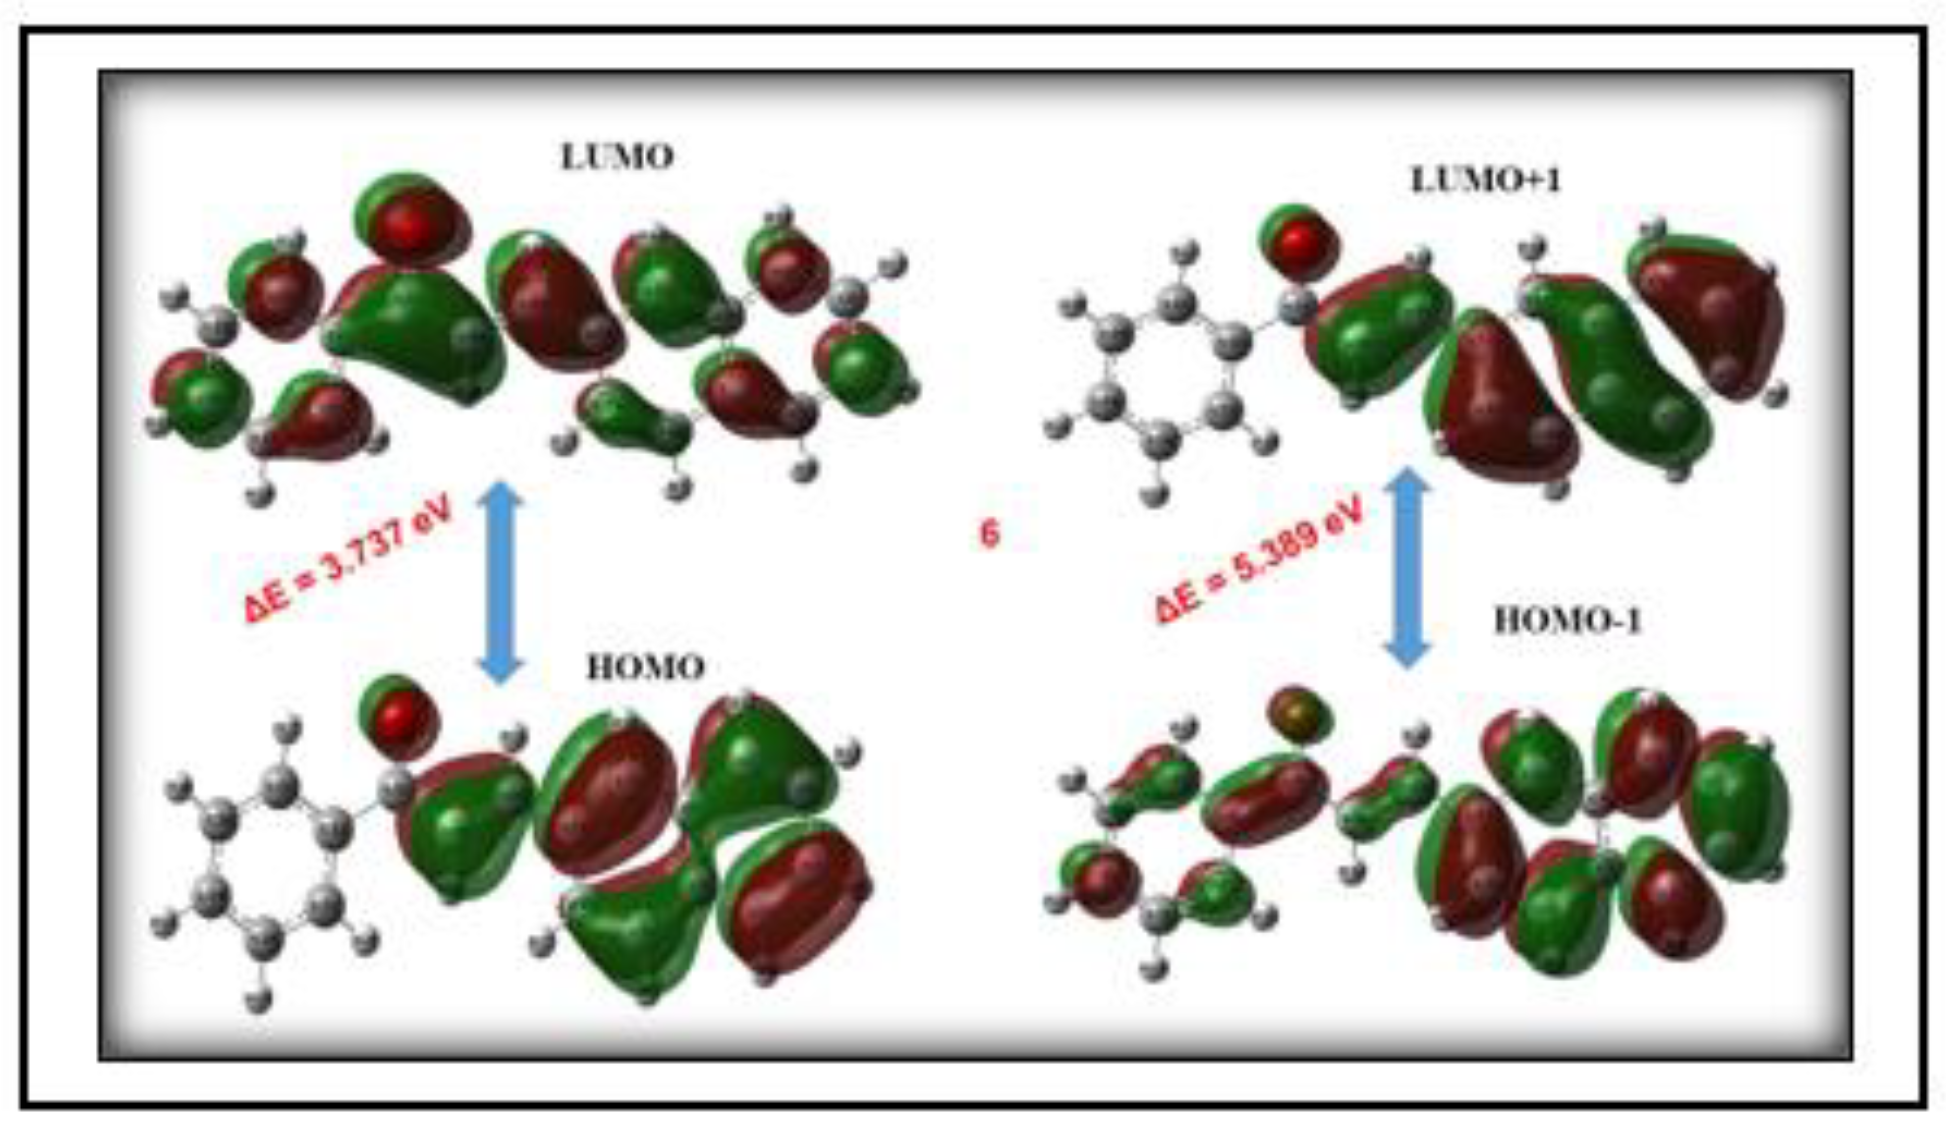
Figure 12.
The molecular electrostatic potential map of 3NPEO.
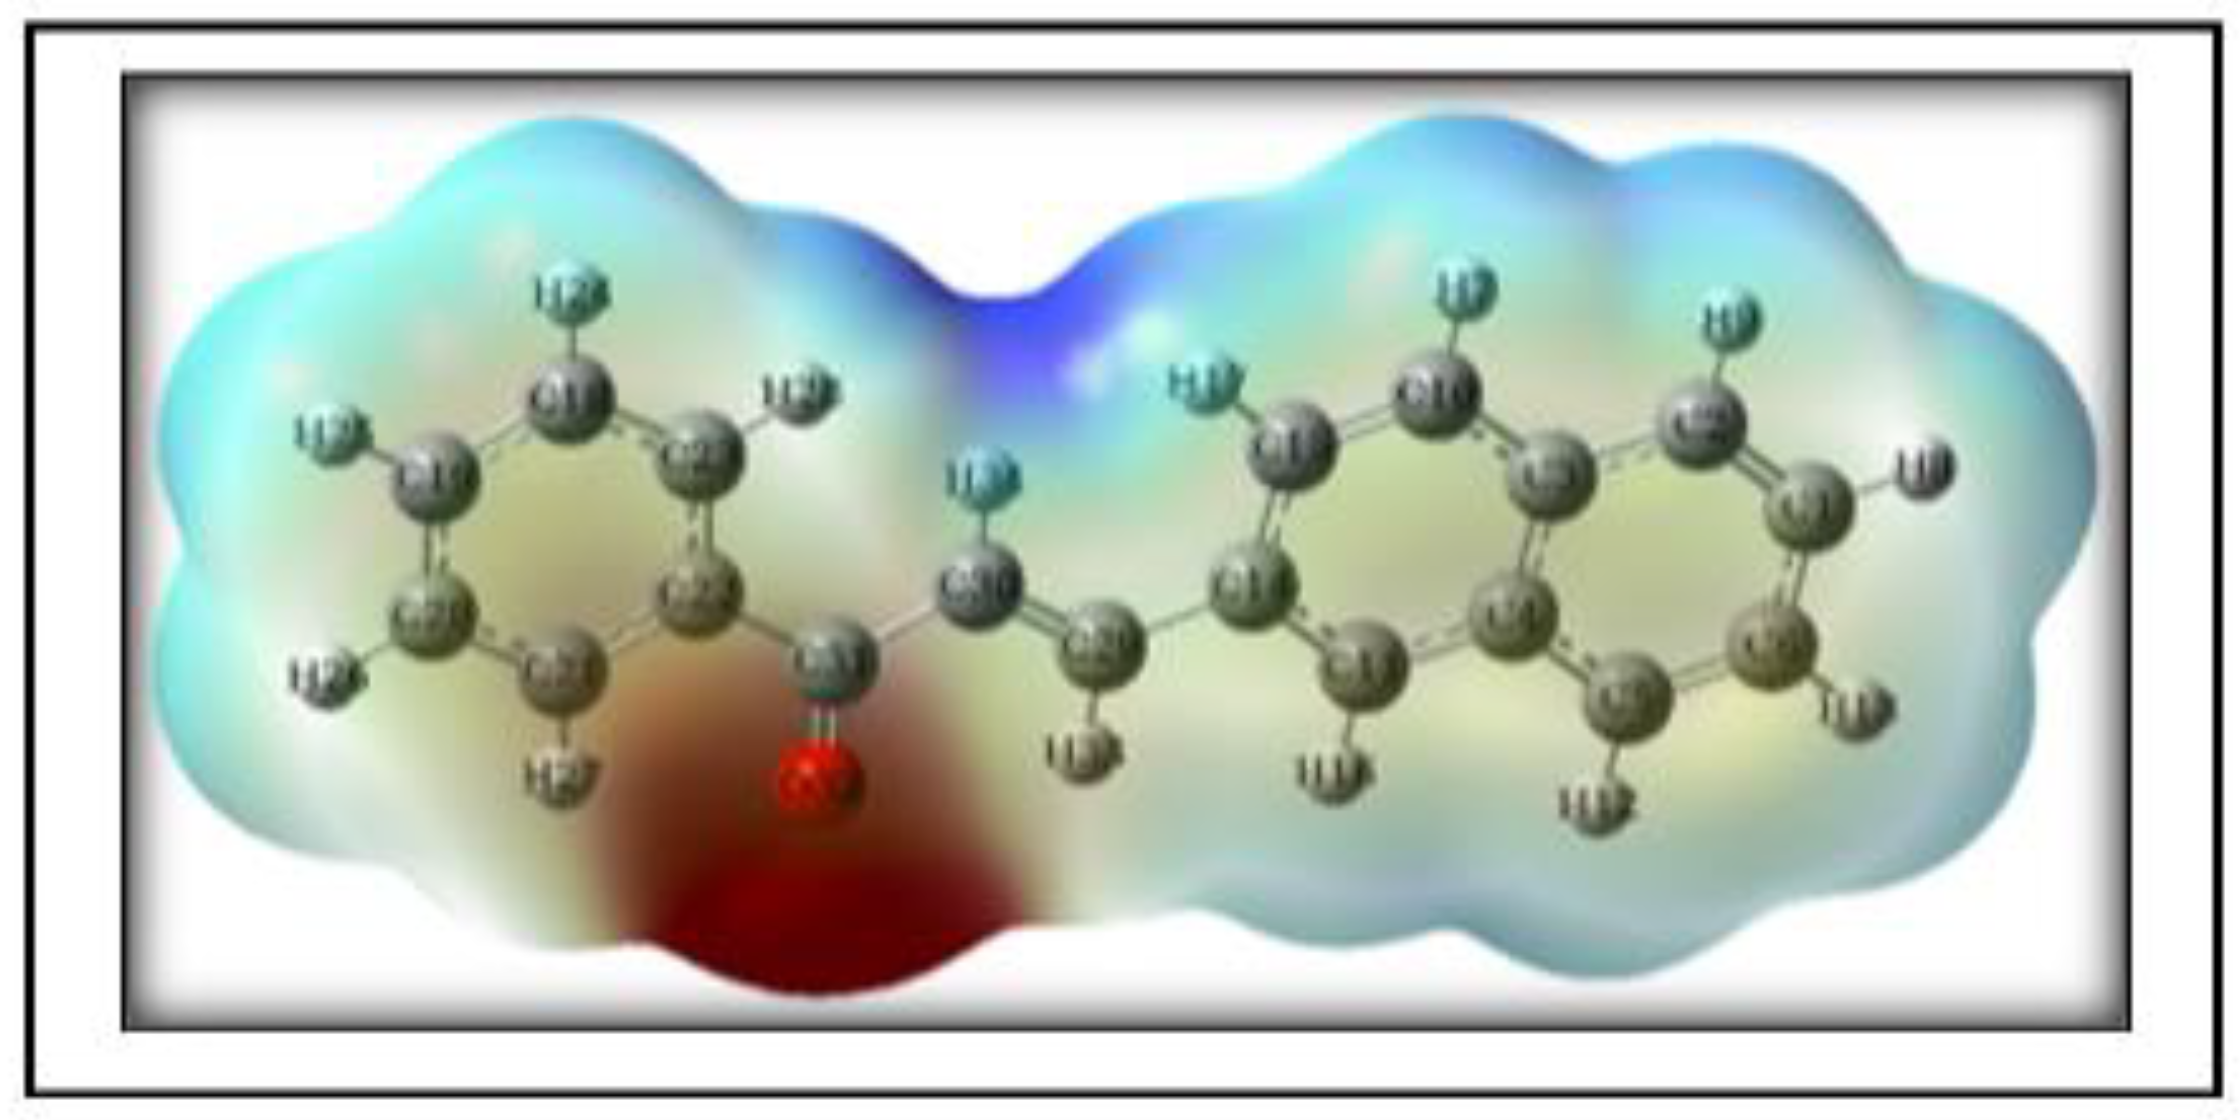
Figure 13.
(a) Cyclic voltammograms of 3NPEO in acetonitrile (b) HOMO-LUMO Energy gap diagram of 3NPEO.
Figure 13.
(a) Cyclic voltammograms of 3NPEO in acetonitrile (b) HOMO-LUMO Energy gap diagram of 3NPEO.
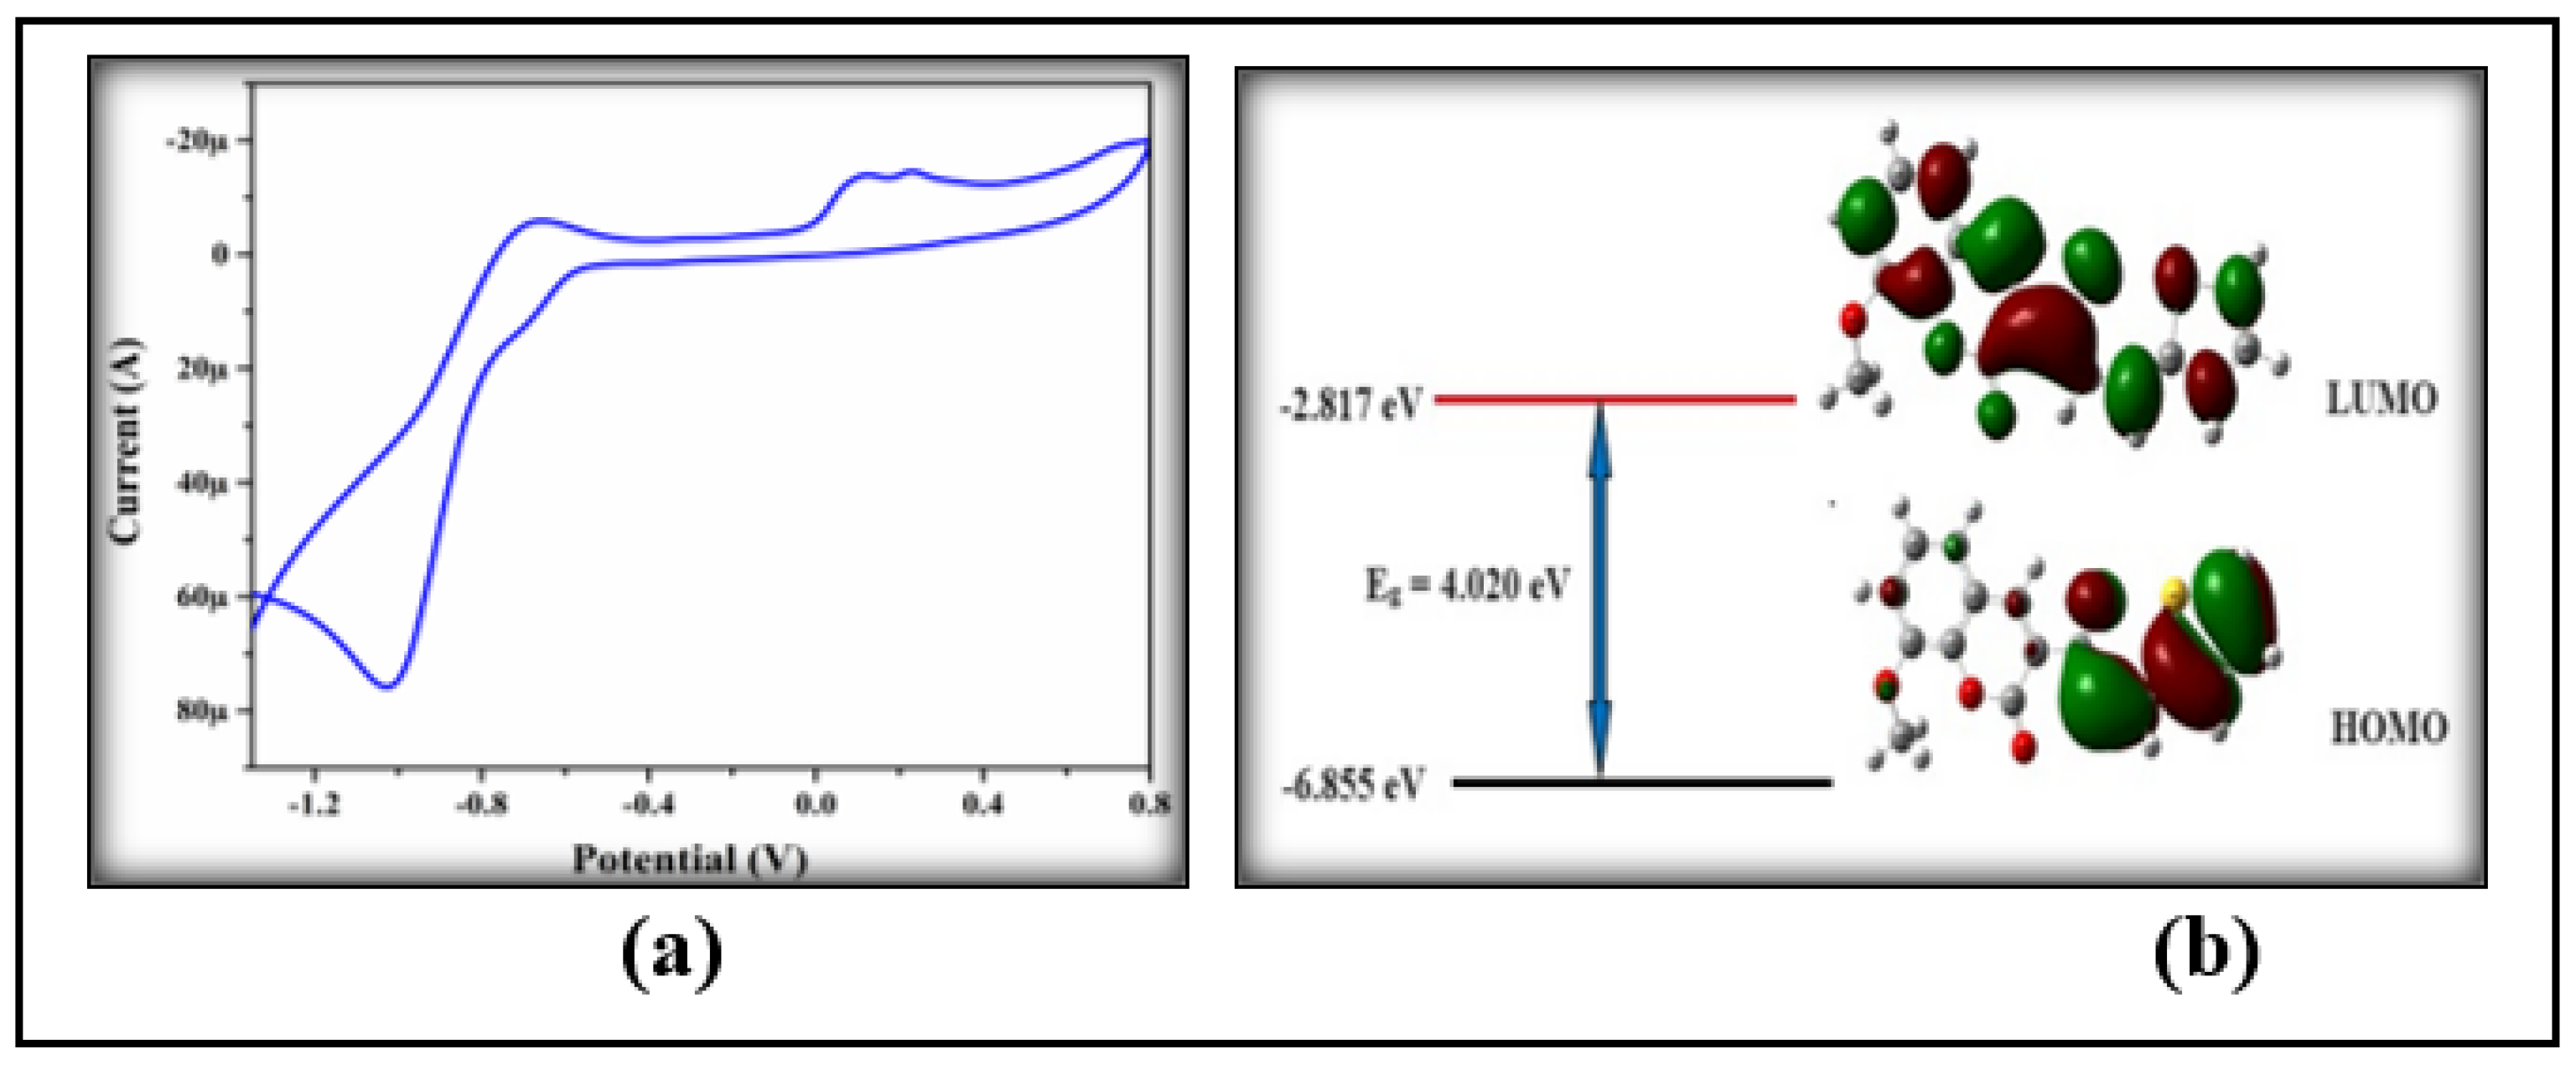
Figure 14.
The best docked pose generated through molecular docking of 3NPEO.
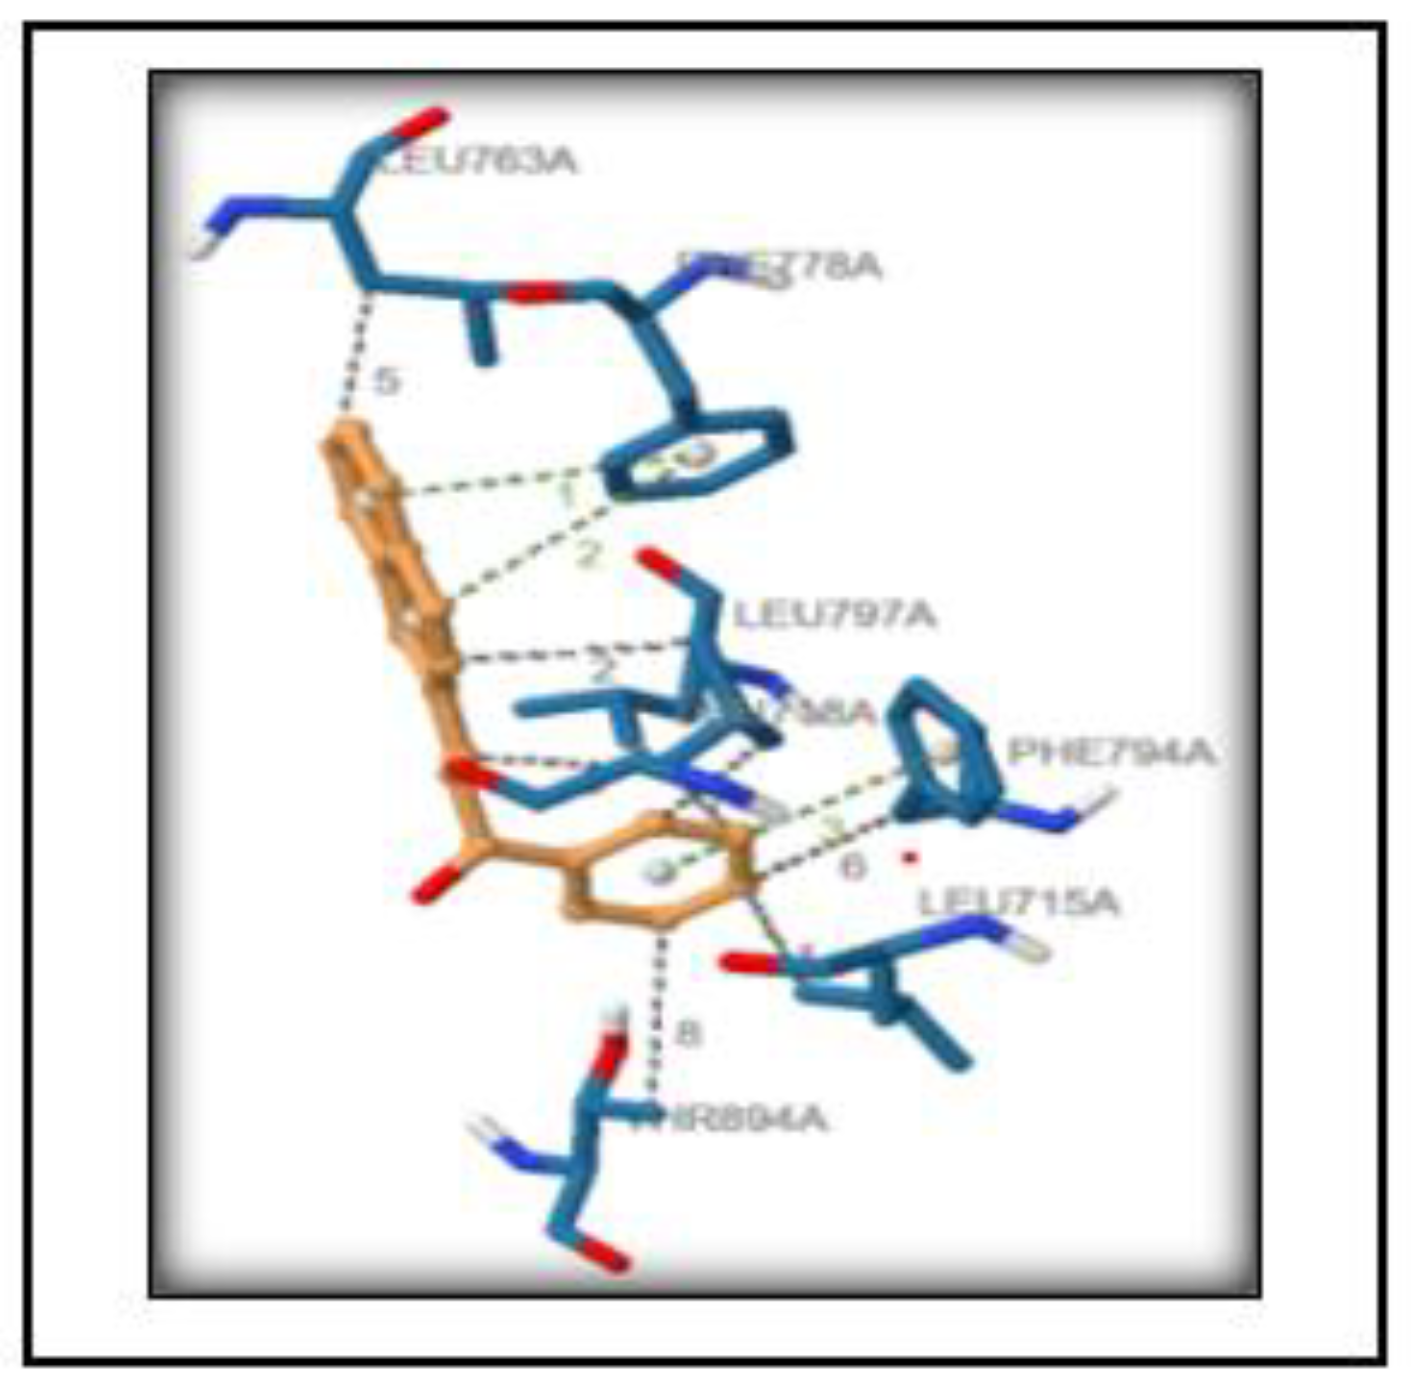
Figure 15.
The Root Mean Square Deviation trend plot for 4OAR-APO and 4OAR-CMP6 is indicated in the main plot of A. The subplot represents the violin plot or the data. B indicates the hydrogen bond plot between the protein and the ligand.
Figure 15.
The Root Mean Square Deviation trend plot for 4OAR-APO and 4OAR-CMP6 is indicated in the main plot of A. The subplot represents the violin plot or the data. B indicates the hydrogen bond plot between the protein and the ligand.
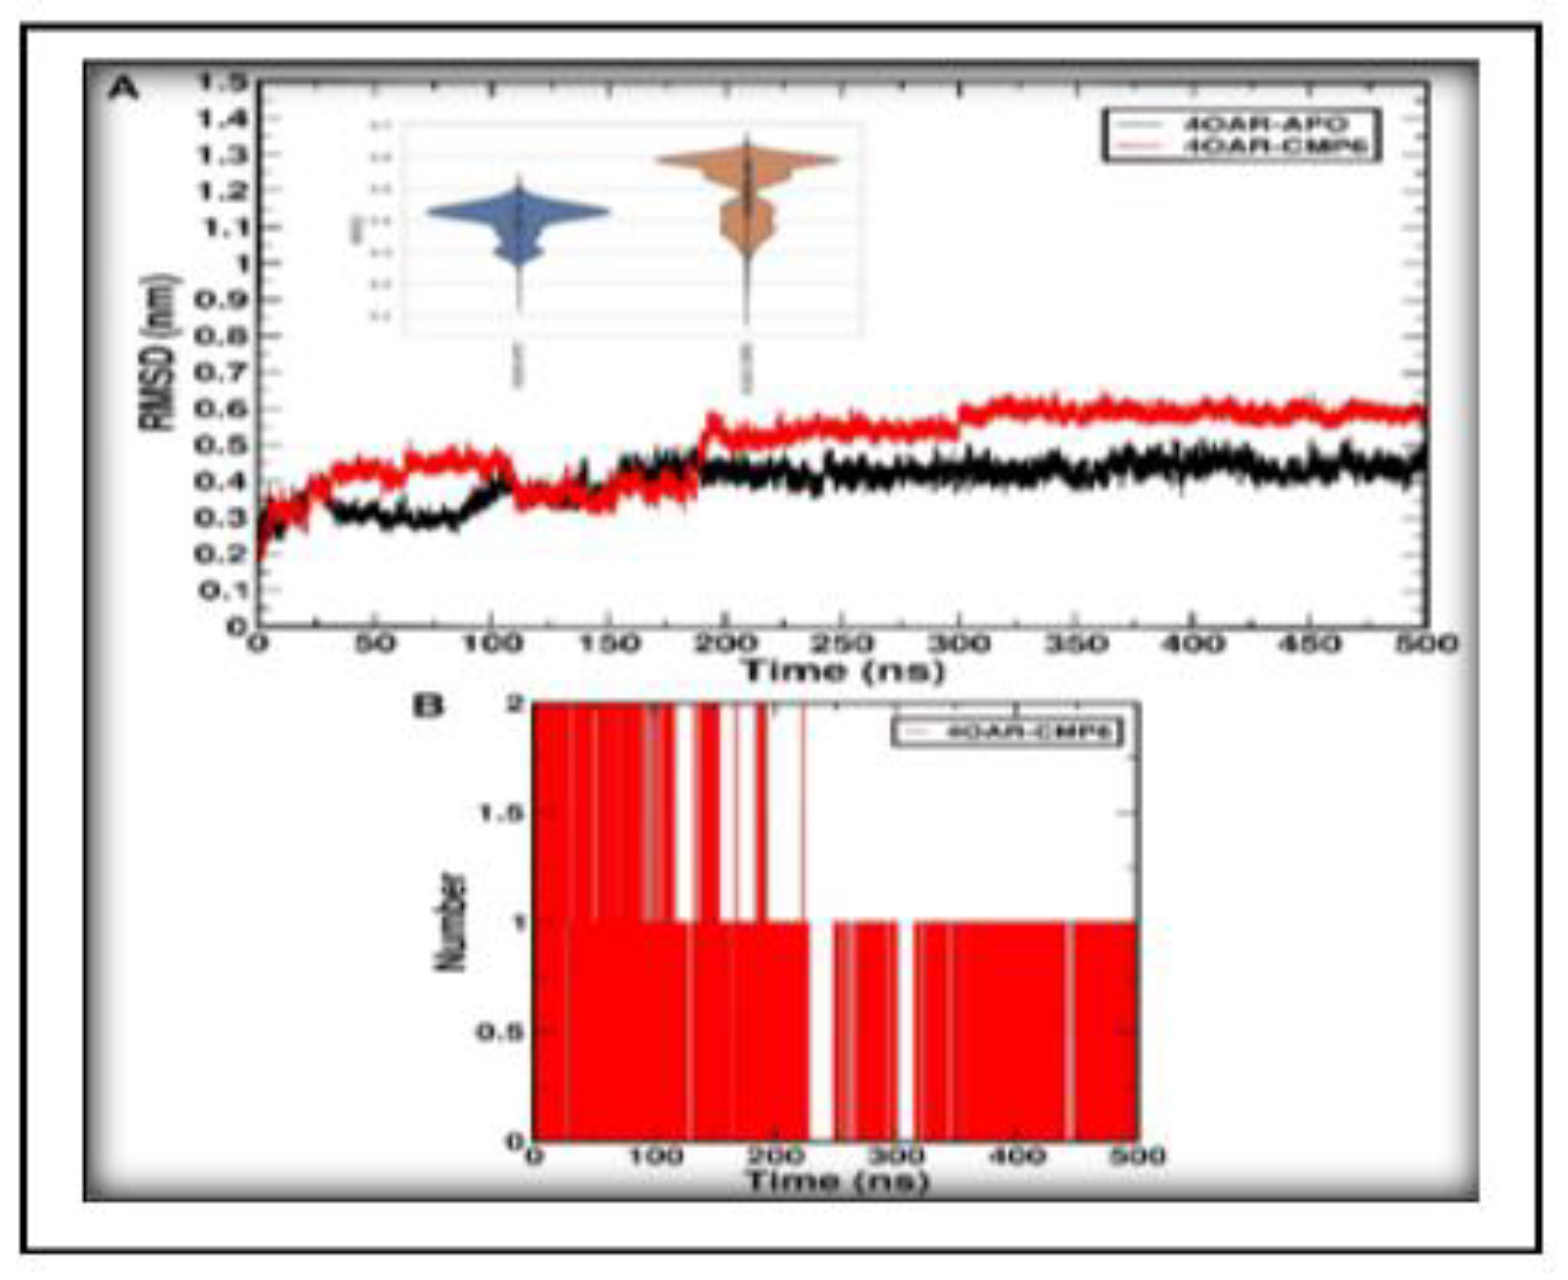
Figure 16.
The fluctuation observed in the helix loop helix region or the region termed E (residues ranging 895 to 920) for the systems. 4OAR-APO is displayed on the left and 4OAR-CMP6 on the left while the residue region is highlighted in red. Outward movement of the residue region is observed for 4OAR-APO and inward for 4OAR-CMP6.
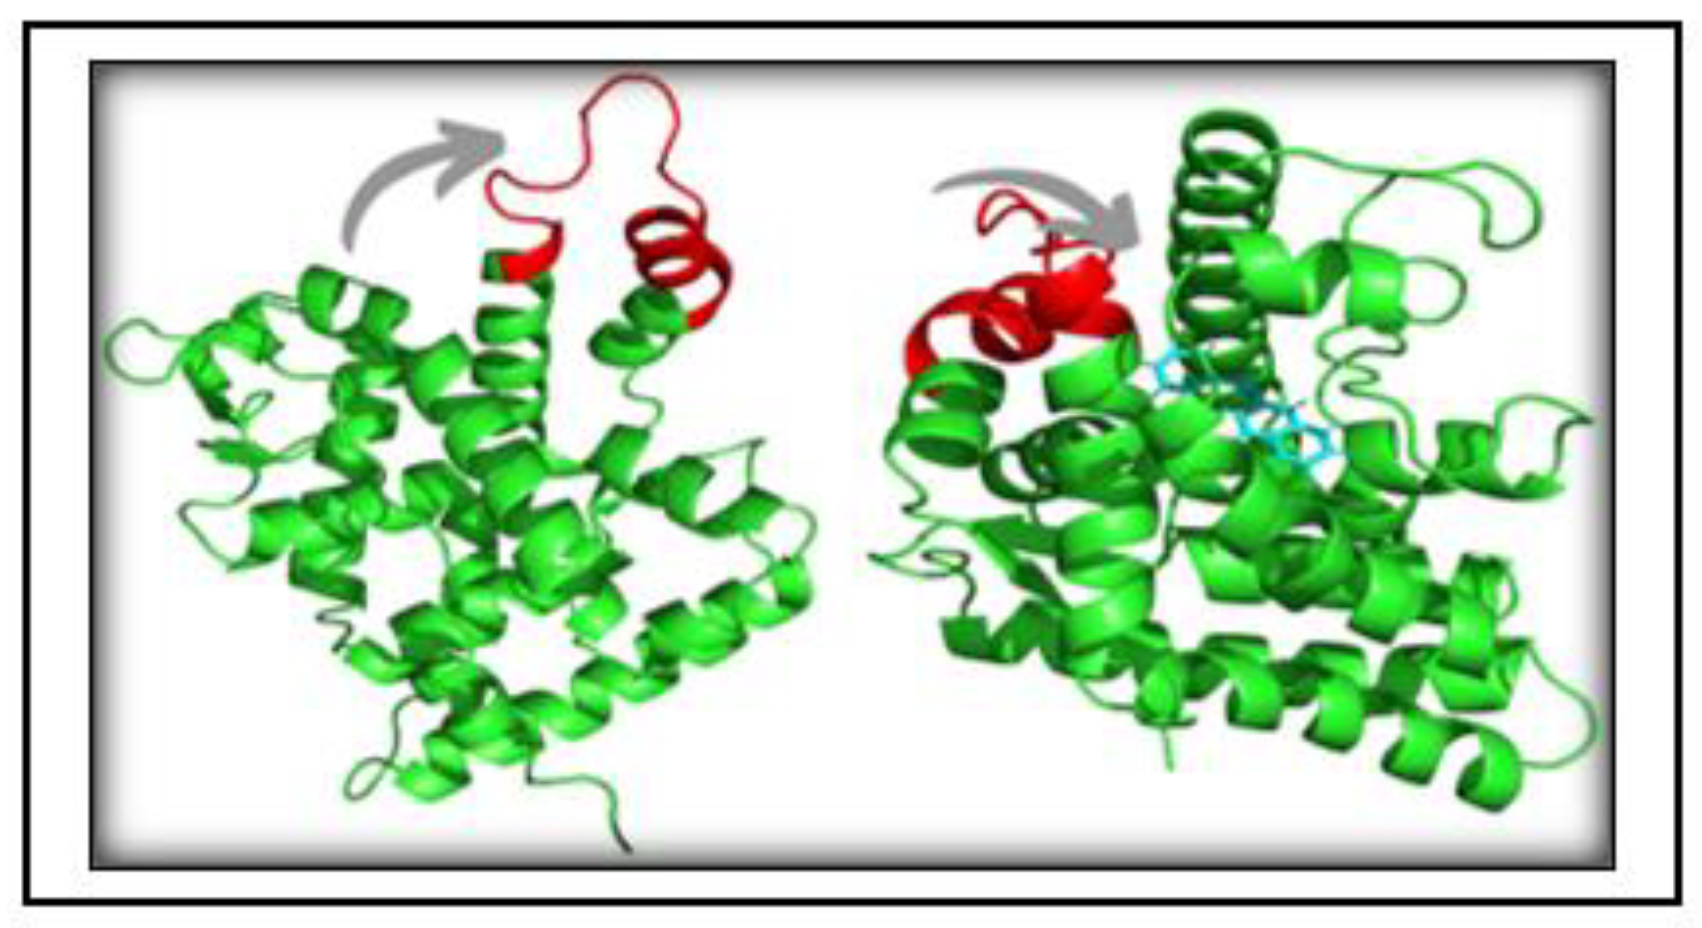
Figure 17.
The KDE plot for the Rg and SASA values of the systems’ dynamics.
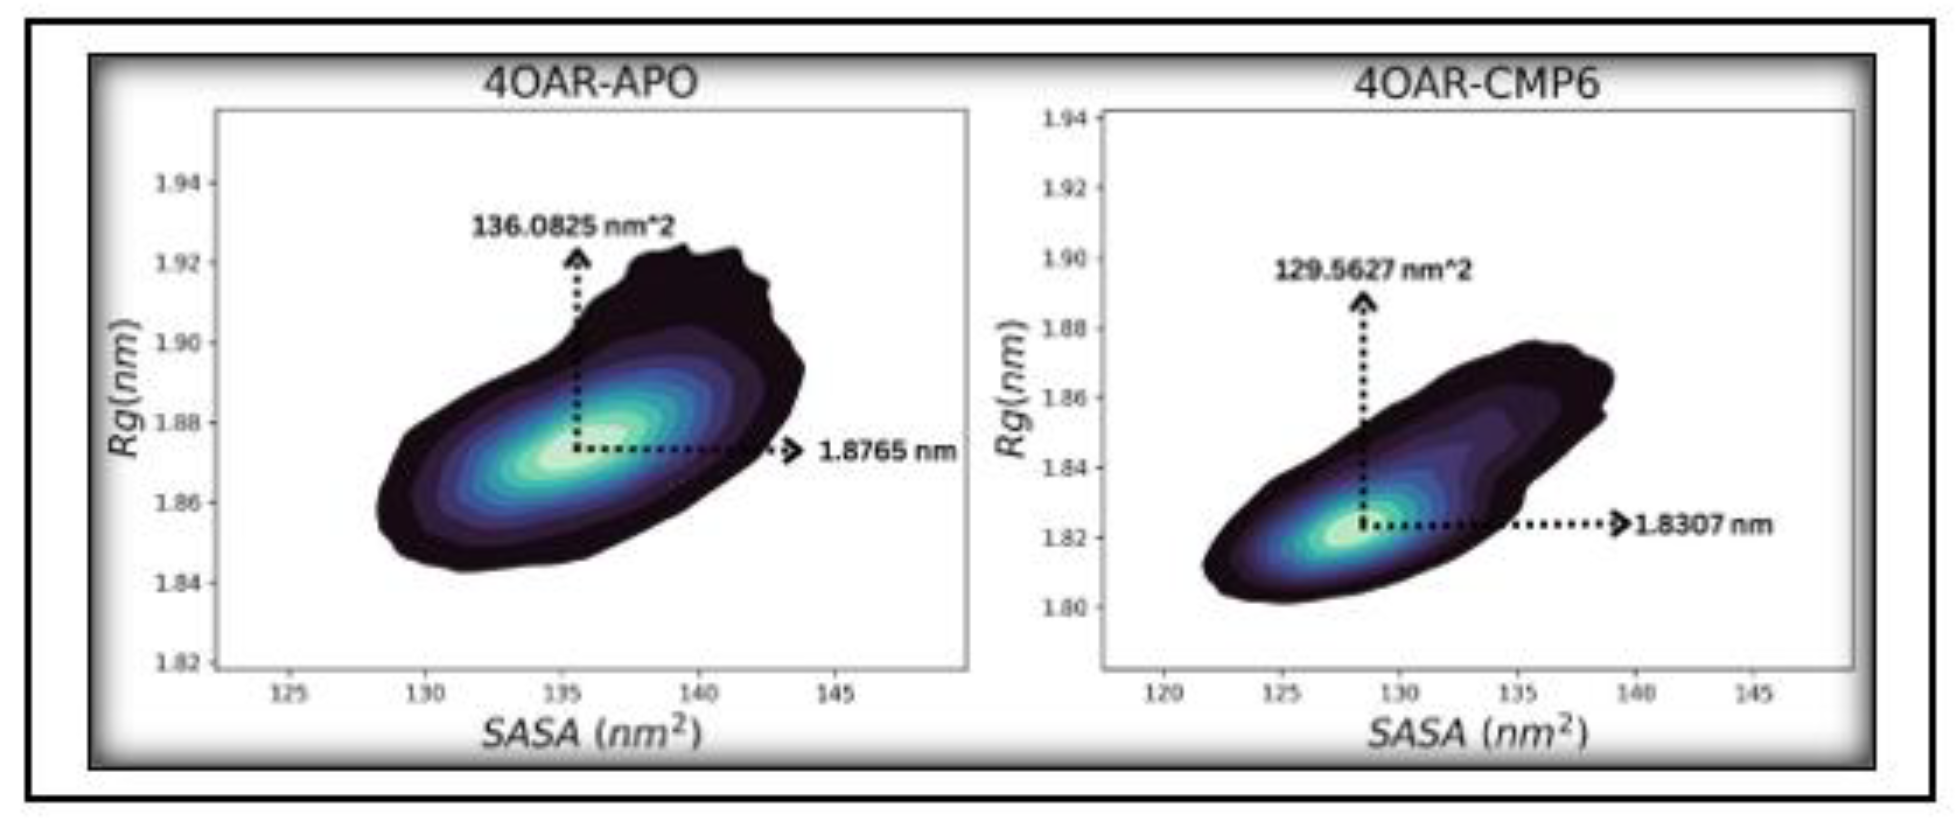
Figure 18.
The Free Energy Landscape (FEL) plot for Radius of Gyration and Root Mean Square Deviation data. The 3D plot is color coded on a yellow to blue color scale with the lowest energy coded with dark blue while the highest energy with yellow.
Figure 18.
The Free Energy Landscape (FEL) plot for Radius of Gyration and Root Mean Square Deviation data. The 3D plot is color coded on a yellow to blue color scale with the lowest energy coded with dark blue while the highest energy with yellow.
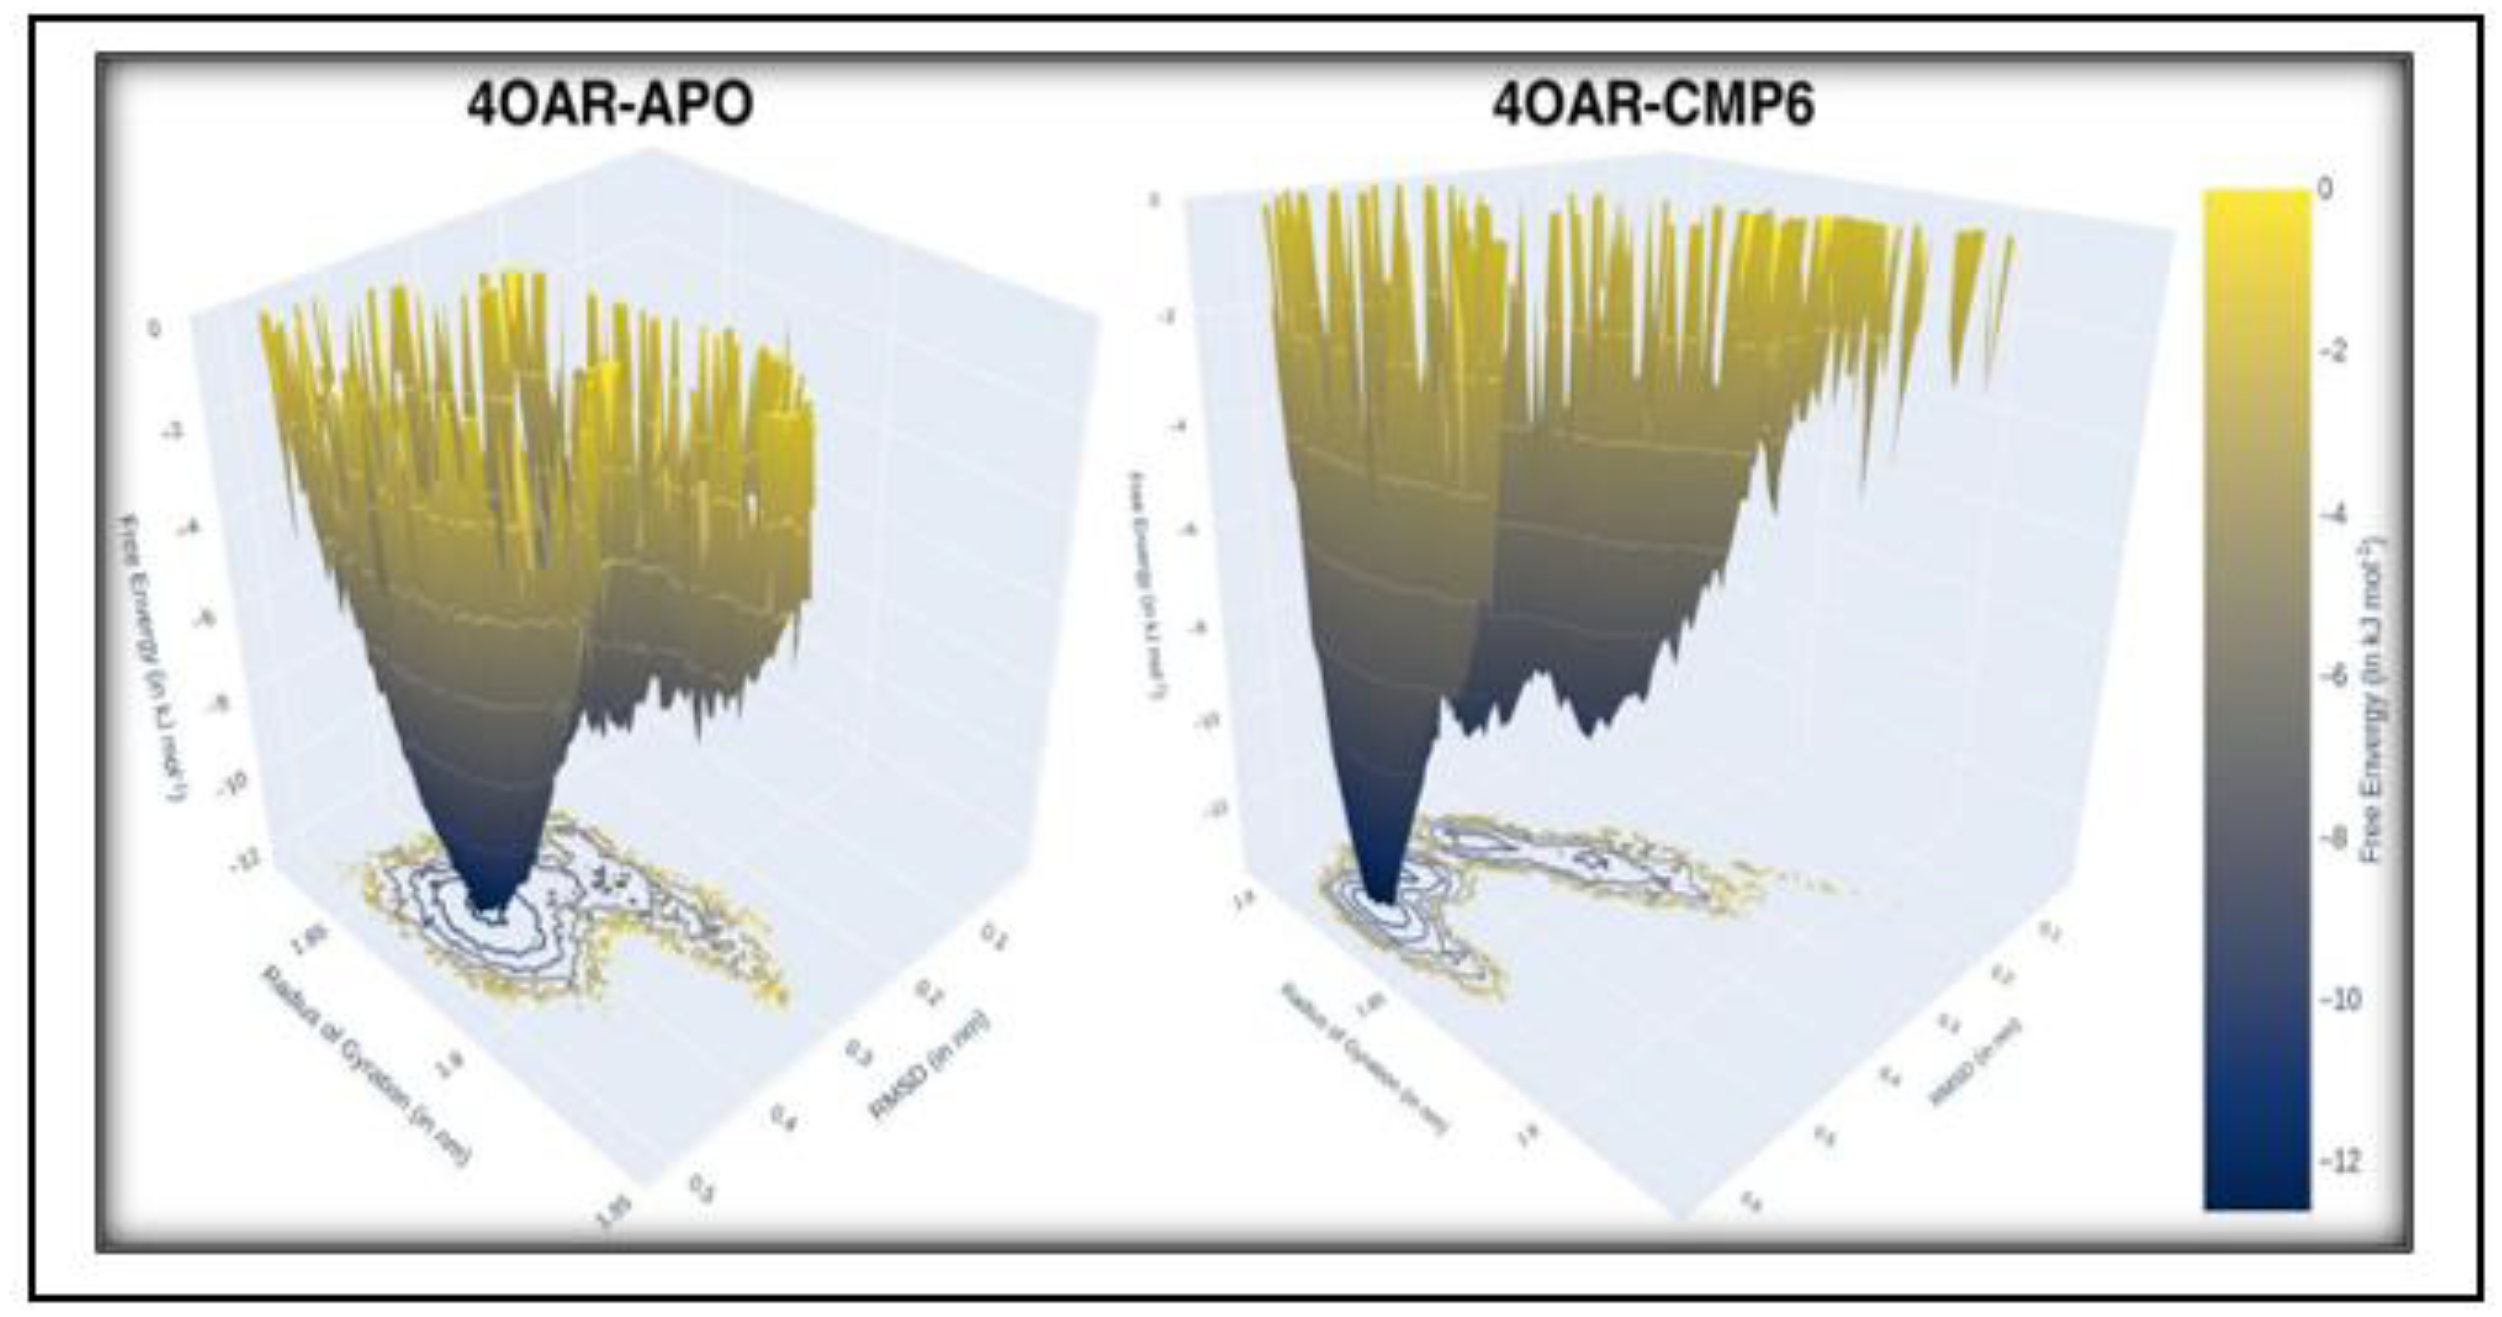
Figure 20.
(A) & (B) Cytotoxicity activity of 3-(naphthalen-3-yl)-1-phenylprop-2-en-1-one against breast cancer cell line MDAMB-231. (C) cell viability percentage and (B) 3-(naphthalen-3-yl)-1-phenylprop-2-en-1-one -treated cancerous cells.
Figure 20.
(A) & (B) Cytotoxicity activity of 3-(naphthalen-3-yl)-1-phenylprop-2-en-1-one against breast cancer cell line MDAMB-231. (C) cell viability percentage and (B) 3-(naphthalen-3-yl)-1-phenylprop-2-en-1-one -treated cancerous cells.
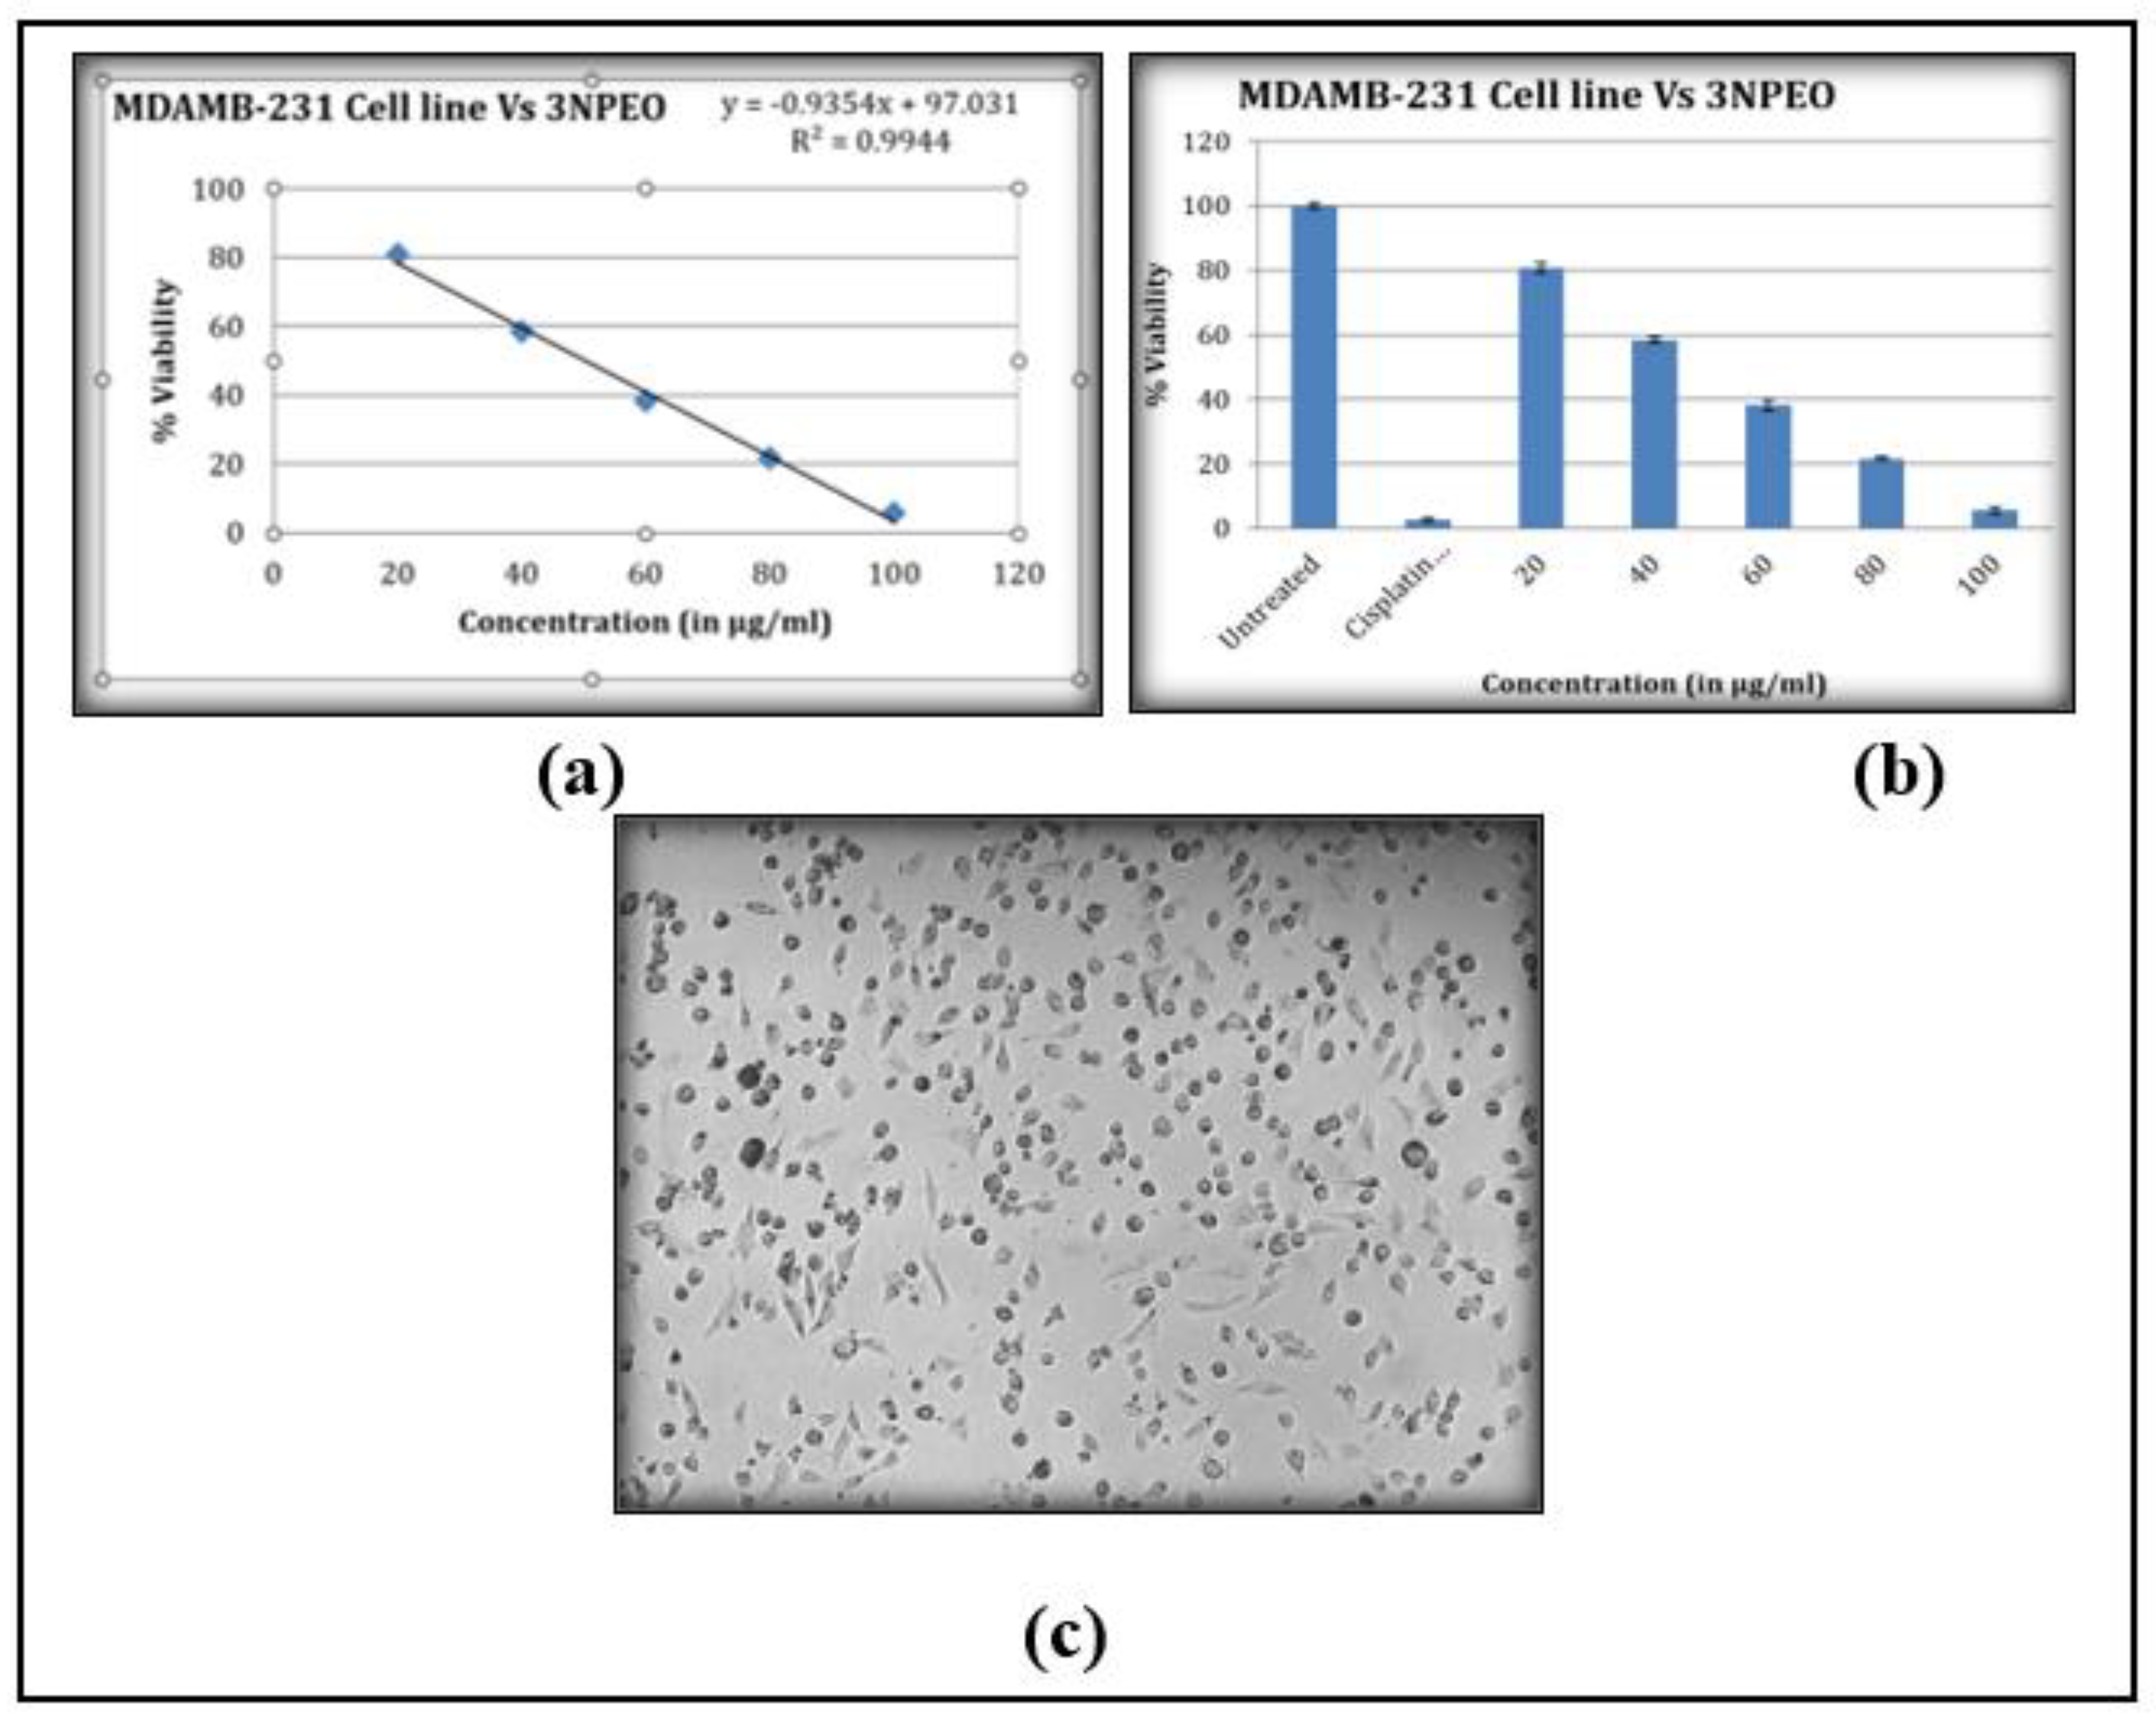
Figure 21.
Detection of early and late apoptosis induced by the synthesized compound in MDAMB-231 cell lines.
Figure 21.
Detection of early and late apoptosis induced by the synthesized compound in MDAMB-231 cell lines.
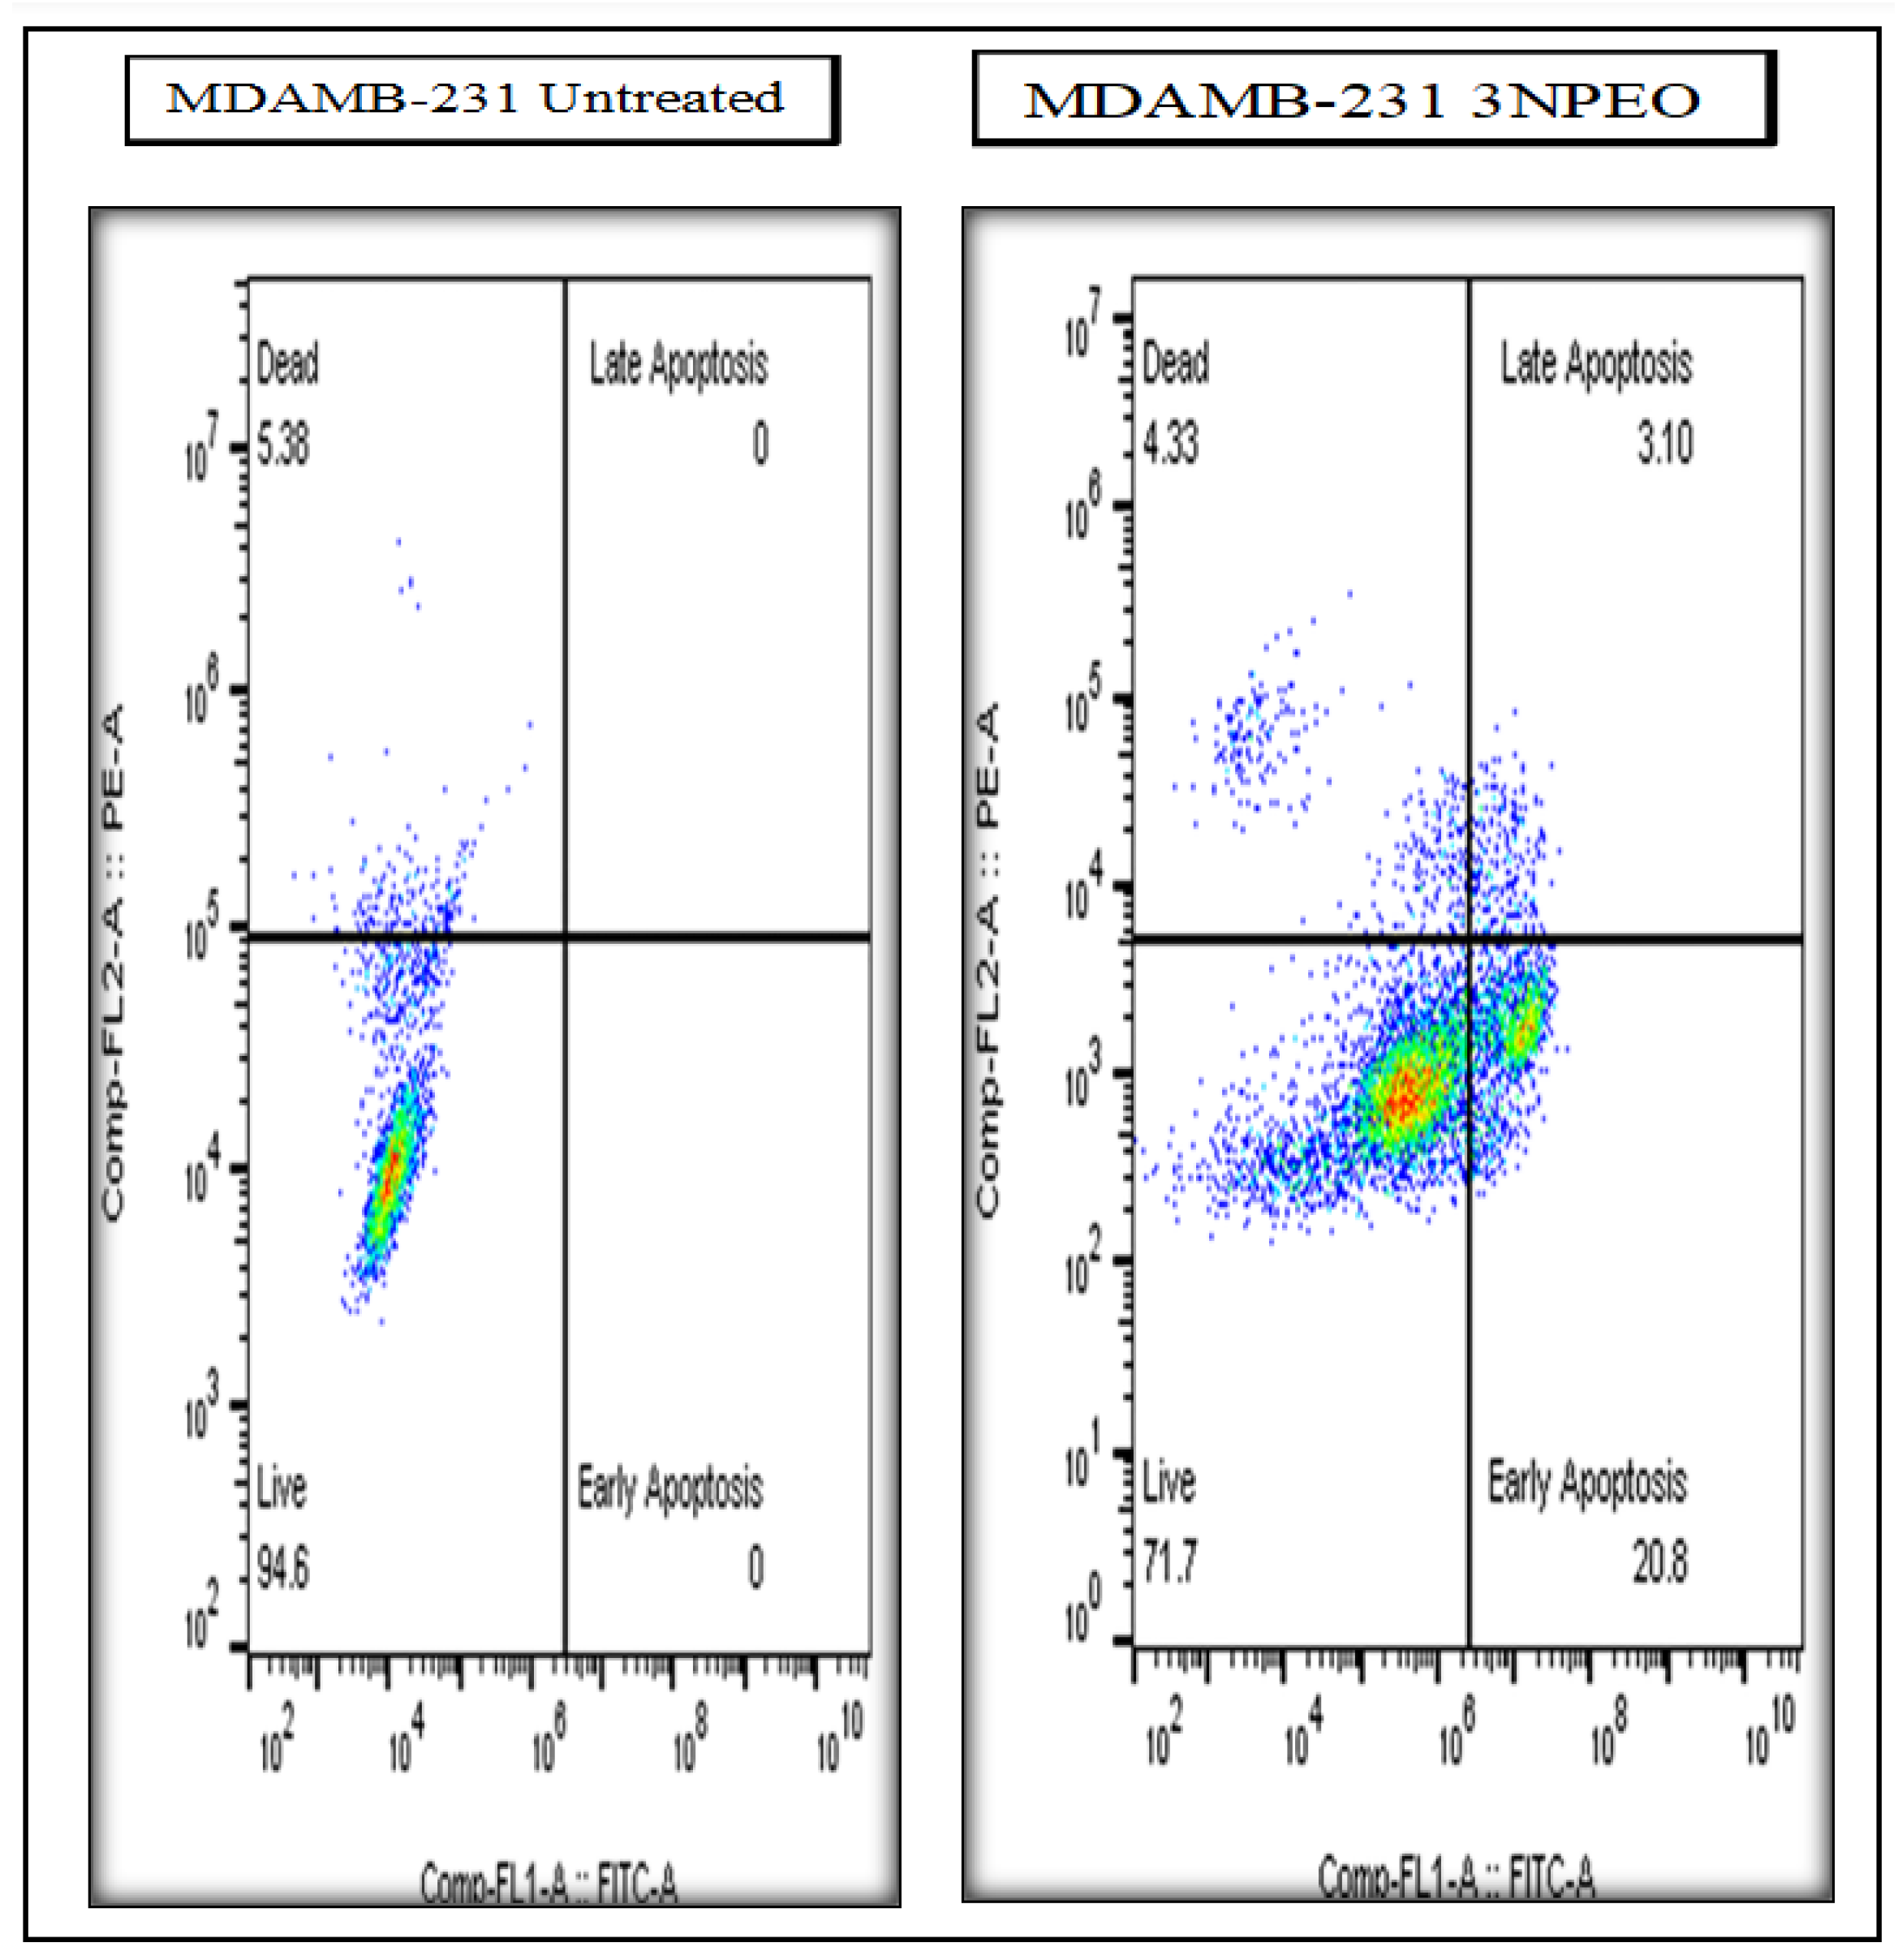
Table 1.
Solvatochromic data of 3NPP.
| Sl. No. | Solvents |
λa (nm) |
λf (nm) |
(cm-1) |
(cm-1) |
) (cm-1) |
(cm-1) |
(cm-1) |
|---|---|---|---|---|---|---|---|---|
| 1 | Pentane | 320.00 | 375.00 | 31250.00 | 26666.67 | 4583.33 | 57916.67 | 28958.33 |
| 2 | Hexane | 320.00 | 376.60 | 31250.00 | 26553.37 | 4696.63 | 57803.37 | 28901.69 |
| 3 | Heptane | 325.00 | 382.00 | 30769.23 | 26178.01 | 4591.22 | 56947.24 | 28473.62 |
| 4 | Cyclohexane | 331.90 | 390.00 | 30129.56 | 25641.03 | 4488.53 | 55770.58 | 27885.29 |
| 5 | 1 4 Dioxane | 332.00 | 392.00 | 30120.48 | 25510.20 | 4610.28 | 55630.69 | 27815.34 |
| 6 | Toluene | 335.20 | 396.00 | 29832.94 | 25252.53 | 4580.41 | 55085.46 | 27542.73 |
| 7 | TCE | 338.00 | 402.00 | 29585.80 | 24875.62 | 4710.18 | 54461.42 | 27230.71 |
| 8 | DEE | 341.70 | 410.00 | 29265.44 | 24390.24 | 4875.19 | 53655.68 | 26827.84 |
| 9 | DCE | 343.00 | 415.00 | 29154.52 | 24096.39 | 5058.13 | 53250.90 | 26625.45 |
| 10 | EA | 344.90 | 418.00 | 28993.91 | 23923.44 | 5070.47 | 52917.36 | 26458.68 |
| 11 | THF | 348.00 | 423.00 | 28735.63 | 23640.66 | 5094.97 | 52376.29 | 26188.15 |
| 12 | Acetonitrile | 351.30 | 428.00 | 28465.70 | 23364.49 | 5101.21 | 51830.18 | 25915.09 |
| 13 | DMF | 352.00 | 430.00 | 28409.09 | 23255.81 | 5153.28 | 51664.90 | 25832.45 |
| 14 | DMSO | 355.00 | 435.00 | 28169.01 | 22988.51 | 5180.51 | 51157.52 | 25578.76 |
| 15 | Water | 360.00 | 441.00 | 27777.78 | 22675.74 | 5102.04 | 50453.51 | 25226.76 |
| 16 | Decanol | 362.00 | 445.00 | 27624.31 | 22471.91 | 5152.40 | 50096.22 | 25048.11 |
| 17 | Octanol | 363.00 | 446.00 | 27548.21 | 22421.52 | 5126.68 | 49969.73 | 24984.87 |
| 18 | Pentanol | 364.00 | 448.00 | 27472.53 | 22321.43 | 5151.10 | 49793.96 | 24896.98 |
| 19 | Butanol | 367.00 | 452.00 | 27247.96 | 22123.89 | 5124.06 | 49371.85 | 24685.93 |
| 20 | Isopropanol | 368.00 | 455.00 | 27173.91 | 21978.02 | 5195.89 | 49151.94 | 24575.97 |
| 21 | Ethanol | 369.00 | 458.00 | 27100.27 | 21834.06 | 5266.21 | 48934.33 | 24467.17 |
| 22 | Methanol | 370.00 | 462.00 | 27027.03 | 21645.02 | 5382.01 | 48672.05 | 24336.02 |
Table 2.
Statistical Analysis of 3NPP Molecule Correlations, Slopes (m), Intercepts, Correlation Factors (r), and Number of Solvents (n).
Table 2.
Statistical Analysis of 3NPP Molecule Correlations, Slopes (m), Intercepts, Correlation Factors (r), and Number of Solvents (n).
| Correlations | Slope (m) | Intercept |
Correlation factor (r) |
Number of solvents (n) |
|---|---|---|---|---|
|
Bilot Kawaski’s correlation |
786.07 | 4574.17 | 0.98 | 22 |
| -8673.38 | 61402.92 | 0.99 | 22 | |
| Lippert - Mataga | 2304.82 | 4561.99 | 0.98 | 22 |
| Bakhshiev’s | 802.98 | 4588.12 | 0.97 | 21 |
| Kawski-Chamma-Viallet’s | -9177.84 | 33602.13 | 0.99 | 21 |
| Reichardt | 937.53 | 4651.53 | 0.98 | 20 |
Table 4.
Physicochemical parameters and Photophysical characteristics of 3NPP in various solvents.
| Sl. No. | Solvents | N | OD | Fint | Φ | τ0 (ns) |
Kr 109 (S-1) |
Knr 109 (S-1) |
|---|---|---|---|---|---|---|---|---|
| 1 | Hexane | 1.375 | 0.240 | 156847.12 | 0.578 | 1.320 | 0.438 | 0.320 |
| 2 | Heptane | 1.388 | 0.342 | 46816.213 | 0.123 | 1.630 | 0.076 | 0.538 |
| 3 | Cyclohexane | 1.426 | 0.118 | 113862.115 | 0.917 | 1.284 | 0.714 | 0.064 |
| 4 | Pentanol | 1.409 | 0.122 | 23826.105 | 0.181 | 1.575 | 0.115 | 0.520 |
| 5 | Butanol | 1.399 | 0.122 | 49067.2595 | 0.368 | 1.458 | 0.252 | 0.433 |
| 6 | Iso-Propanol | 1.378 | 0.119 | 84261.500 | 0.629 | 1.729 | 0.364 | 0.215 |
| 7 | Ethanol | 1.361 | 0.239 | 109265.055 | 0.396 | 1.591 | 0.249 | 0.380 |
| 8 | Methanol | 1.328 | 0.118 | 109265.055 | 0.763 | 2.045 | 0.373 | 0.116 |
| 9 | Acetonitrile | 1.344 | 0.140 | 47916.138 | 0.289 | 1.840 | 0.157 | 0.386 |
| 10 | DMSO | 1.479 | 0.558 | 304283.865 | 0.558 | 1.964 | 0.284 | 0.225 |
(OD)s=0.160, (Fint)s=20435.159.
Table 5.
The third order nonlinear optical parameters of 3NPEO molecule.
| Molecule | α0 (cm-1) |
β (cmW-1) x10-5 |
n2 (cm2W-1) x 10-9 |
Re χ(3) (e.s.u) x 10-6 |
Im χ(3) (e.s.u) x 10-6 |
χ(3) (e.s.u) x 10-6 |
γh (e.s.u) x 10-26 |
OL kJ/cm2 |
W x 103 |
T |
|---|---|---|---|---|---|---|---|---|---|---|
| 3NPEO | 4.52 | 1.82 | -0.62 | 0.84 | 0.44 | 0.94 | 0.39 | 4.06 | 49.4 | 0.15 |
Table 6.
HOMO, LUMO, and Band Gap of 3NPP estimated Theoretically and CV Investigation.
| Compound | HOMO (eV) | LUMO (eV) | E0−0 | λonset | |||
|---|---|---|---|---|---|---|---|
| Theor. | Expl. | Theor. | Expl. | Theor. | Expl. | Ao | |
| 3NPEO | -6.855 | -4.849 | -2.817 | -1.498 | 4.020 | 3.351 | 370 |
Table 7.
The summary table for the individual energy term contribution toward the binding energy for 4OAR-CMP6.
Table 7.
The summary table for the individual energy term contribution toward the binding energy for 4OAR-CMP6.
| Energy Term | Energy in kJ/mol |
|---|---|
| van der Waal energy | -166.204 +/- 12.377 |
| Electrostatic energy | -25.227 +/- 7.903 |
| Polar solvation energy | 83.791 +/- 5.629 |
| SASA energy | -18.248 +/- 0.662 |
| Binding energy | -125.888 +/- 11.935 |
Table 8.
Tabulation of early and late apoptosis by the synthesized compound in MDAMB-231 cell lines.
Table 8.
Tabulation of early and late apoptosis by the synthesized compound in MDAMB-231 cell lines.
| Treatments and cell line | Early Apoptosis | Late Apoptosis | Total Apoptosis |
|---|---|---|---|
| 3NPEO - (MDAMB-231) | 20.80 | 3.10 | 23.90 |
Disclaimer/Publisher’s Note: The statements, opinions and data contained in all publications are solely those of the individual author(s) and contributor(s) and not of MDPI and/or the editor(s). MDPI and/or the editor(s) disclaim responsibility for any injury to people or property resulting from any ideas, methods, instructions or products referred to in the content. |
© 2025 by the authors. Licensee MDPI, Basel, Switzerland. This article is an open access article distributed under the terms and conditions of the Creative Commons Attribution (CC BY) license (http://creativecommons.org/licenses/by/4.0/).
Copyright: This open access article is published under a Creative Commons CC BY 4.0 license, which permit the free download, distribution, and reuse, provided that the author and preprint are cited in any reuse.


