
Submitted:
05 May 2025
Posted:
06 May 2025
You are already at the latest version
Abstract
Background: Aging and the female sex are considered risk factors for the development of heart failure with preserved ejection fraction (HFpEF). Unlike other risk factors, such as hypertension, obesity or diabetes, they do not represent therapeutic targets.
Methods: In a recently developed two-hit murine HFpEF model (Angiotensin II + High-fat diet; MHS), we studied the relative contribution of the biological sex, aging and gonadal hormones to cardiac remodelling and function. We aimed to reproduce a fre-quent HFpEF phenotype in mice characterized by aging, hypertension, female sex, menopause and metabolic alterations. Using the MHS mouse model, we studied cardiac remodelling and function in C57Bl6/J mice of both sexes, young (12 weeks) and old (20 months), gonadectomized (Gx) or not.
Results: We observed that aging was associated in mice with body weight gain, cardiac hypertrophy (CH), left ventricle (LV) concentric remodelling, left atrial (LA) enlargement and changes in echocardiography diastolic parameters (E and A wave velocities), but only in females. Submitting young and old mice to the MHS stress for 28 days induced the expected HFpEF phenotype consisting of CH, LV walls thickening, LA enlargement and diastolic dysfunction with preserved EF except for old males, which was signifi-cantly reduced. Young mice were Gx at five weeks, and old mice at six months (over a year before the MHS). Gx increased myocardial fibrosis in MHS females and helped preserve EF in males.
Conclusion: Our results suggest that MHS has sex-specific effects in old mice, and loss of gonadal hormones significantly impacts the heart failure observed phenotype.
Keywords:
mouse
; heart failure
; sex differences
; cardiac hypertrophy
; aging
; preclinical model
; HFpEF
1. Introduction
Aging, female sex, and menopause are among risk factors for heart failure with preserved ejection fraction (HFpEF) [1,2]. These factors often combine to create a background where hypertension, metabolic alterations such as obesity or type 2 diabetes, atrial fibrillation, kidney disease, valve disease, or other anomalies can trigger the development of HFpEF [3,4]. The relative contribution of aging and menopause in women is difficult to study since these are interrelated.
We developed a “two-hit” murine HFpEF model combining an Angiotensin II (AngII) continuous infusion and a High-Fat Diet (HFD) for 28 days (metabolic-hypertensive stress or MHS) in C57Bl/6J young male and female mice. We also observed that this MHS regimen was efficient in inducing an HFpEF phenotype in old (19 months) ovariectomized (Ovx at the age of 6 months) female four-core genotype (FCG) mice [5]. In this study, we used Ovx as a surrogate for menopause since the MHS was only induced a year later [6].
Withaar and collaborators had previously developed an HFpEF model in aging mice [7]. They treated old intact females (20 months) with an HFD for four months and added an AngII infusion during the last four weeks. In males, they observed that they evolved towards heart failure with reduced ejection fraction (HFrEF), suggesting that old male mice were not a useful preclinical model since this HFpEF towards HFrEF transition is seldom observed in human patients.
Since their model is more severe than ours, we felt that older male and female mice could be used to study the relative impact of aging, loss of gonadal hormones, and sex differences.
We report that aging is sufficient for the appearance of several cardiac features associated with HFpEF in mice and that Ovx in females can exacerbate these. The MHS in Ovx-aging females reproduces the expected HFpEF phenotype, whereas in males, several animals evolved towards an HFrEF phenotype. Loss of testosterone by castration completely reversed this and maintained the HFpEF phenotype in old males.
2. Materials and Methods
2.1. Animals
C57BL6/J male and female 4-week-old mice were purchased from Jackson Laboratory (Bar Harbor, ME, USA). Mice were housed on a 12h light-12h dark cycle with free access to chow and water. The protocol was approved by the Université Laval's animal protection committee and followed the recommendations of the Canadian Council on Laboratory Animal Care (#2020-603 and #2020-701). This study was conducted following the ARRIVE guidelines. Mice were randomly distributed into various experimental groups.
Gonadectomy surgical procedures were performed as previously described in young groups at the age of 5 weeks and in old groups at the age of 6 months [6,8]. Old mice had a running device in their cage until the beginning of the experimentation at 19 months [5,6,9].
Metabolic and hypertensive stress (MHS). Mice were implanted or not with an osmotic minipump (Alzet #1004) providing a continuous infusion of angiotensin II (AngII; 1.5mg/kg/day) (Sigma) for 28 days and fed with a high-fat diet (HFD: 60% calories; Research Diets Cat. #D12492) [5].
Young groups: Eight to ten mice of each sex were used. At eight weeks, mice of both sexes were divided into the following groups: controls (Ctrl), ovariectomized (Ocx) or Ovx controls, MHS and Ocx or Ovx MHS.
Old groups: The experimental design was like that of younger animals, except that 19-month-old animals were used.
Experienced technicians monitored the mice's health and behaviour daily during the protocol, and the animals were weighed weekly. Three intact male mice died in the MHS group.
2.2. Echocardiography
2.3. Myocardial Fibrosis Evaluation
Myocardial samples were fixed, sliced into serial sections (10μm thick), and stained with Picrosirius Red to assess the overall percentage of interstitial fibrosis. The formula used to calculate the percentage of interstitial fibrosis was (% red staining area) / (% red staining area + % Total tissue) X 100.
2.4. Cardiomyocyte Cross-Sectional Area
The cardiomyocyte cross-sectional area (CSA) was visualized with immunofluorescent wheat germ agglutinin FITC (Sigma) staining. At least 50 myocytes per section were analyzed. CSA was then measured and expressed in µm2 as previously described [11].
2.5. RNA Isolation and Quantitative Real-Time Polymerase Chain Reaction
As described previously, total RNA from LV tissue was extracted [5]. Quantitative RT-PCR quantified LV gene expression for at least six animals per group. Pre-optimized primers were from IDT (Coralville, Iowa), and Sso Advanced Universal SYBR Green Supermix (Bio-Rad, Hercules, CA) were used. Cyclophilin A (Ppia) was the control “housekeeping” gene. The primers used are listed in Table S1.
2.6. Western Blots.
Protein content was estimated by Western blotting as described previously [11]. Antibodies were diluted 1:1000 (PDK4 and p-PDH) or 1:250 (PDH1) in a TSB-T solution with 5% bovine serum albumin (BSA). Phospho-PDH was obtained from Cell Signalling Technologies (Danvers, MA; #31866), whereas PDH (AB110416-1002) and PDK4 antibodies were from Abcam (AB214938) (Toronto, ON, Canada). The appropriate second antibody was diluted 1:2000 in TBS-T with 5% milk. Western Lightning Plus ECL (Perkin-Elmer, Woodbridge, ON, Canada) and Clarity Max ECL (Bio-Rad) were used for membrane revelation with the Gel Doc system and Image Lab software (Bio-Rad). The “Total lane method” was used for normalization, and adjustments were made according to pre-blocking membrane exposure and a standard pool run on each gel.
2.7. Statistical Analysis
All data are expressed as mean ± standard error of the mean (SEM). Outliers were removed using the ROUT test with a Q of 1% with Prism. Intergroup comparisons were conducted using the Student's T-test using GraphPad Prism 10.4 (GraphPad Software Inc., La Jolla, CA, USA). Comparisons of more than two groups were analyzed using one-way or two-way ANOVA and Holm-Sidak post-test. P<0.05 was considered statistically significant.
3. Results
3.1. Short and Long-Term Effects on Cardiac Morphology and Function in Male and Female Mice.
As illustrated in Figure 1a, C57Bl6/J mice were either gonadectomized (Gx) at 5 weeks or 6 months, respectively. Younger mice were euthanized three months later, and older ones, 14 months later. Age-matched sham-operated intact controls were also studied.
Orchiectomy (Ocx) of young and adult males reduced their body weight, and ovariectomy (Ovx) had no effect (Figure 1B). The body growth was also reduced in young Ocx mice (Figure 1c). Gx resulted in reduced indexed heart weight (iHeart, Figure 1d) except in young males.
We studied these mice by echocardiography just before euthanasia. Using M-mode imaging, we measured LV internal end-diastolic diameter (EDD; Figure 1E), LV walls end-diastolic thickness (Interventricular septal wall thickness + posterior wall thickness; Figure 1F), and the ratio of the two measurements (RWT; Figure 1G) to evaluate LV remodelling caused by both aging and Gx. In males, aging was associated with increased EDD and LV wall thickening and more concentric remodelling as illustrated by an increased RWT ratio. Ocx strongly reduced EDD and LV wall thickness in older animals, but RWT was maintained. In intact females, EDD was slightly increased by age, but LV walls were thicker, increasing RWT. Ovx reduced LV wall thickening, resulting in less LV concentric remodelling with age. Ejection fraction (EF; Figure 1h) estimated using the Simpson’s method remained unchanged in young and old animals, except for old Ocx males displaying raised EF. Stroke volume (SV; Figure 1i) and cardiac output (CO; Figure 1j) were increased in older intact animals. In Gx animals, SV and CO were reduced compared to intact age-matched controls in old males and young females.
Diastolic function parameters were modulated by age or Gx in these mice. E and A wave velocities (Figure 1K and 1l) were reduced in Ocx males and increased in Ovx females. Aging increased these velocities in old females, not in females. The E/A ratio remained unchanged except for young Ocx males (Figure 1M). Tissue Doppler E’ wave velocity was unchanged in all groups (Figure 1n). E/E’ ratios were reduced in Ocx males (Figure 1o) and increased in old females. Finally, Ocx significantly reduced the left atrial tissue weight in young and old males and only in old females (Figure 1p). Additional echo results are displayed in Tables S1 and S2.
Representative M-mode LV views are illustrated in Figure 2a and LV long-axis sections in Figure 2B, stained using picrosirius red. Quantification of myocardial fibrosis is illustrated in Figure 2c. Aging did not increase this parameter in intact males but did in Ocx ones. In females, aging was associated with a mild increase in myocardial fibrosis. Ocx increased expression levels of four genes related to extracellular matrix remodelling in older males, namely procollagens 1 and 3 (Col1a and Col3a; Figure 2D and 2e), periostin (Post; Figure 2f) and thrombospondin 4a (Thbs4a; Figure 2g). In young males, Col3a and Thbs4a mRNAs were modulated in the opposite direction by Ocx. Aging intact males had lower mRNA levels of these two genes. In females, aging reduced gene expression of these four genes and Ovx reversed this.
3.2. Aging in Female Mice Is Associated with a Circulatory Inflammation Profile.
Using Olink® proteomic technology, we measured the levels of 46 inflammatory molecules in the plasma of young and old mice of both sexes, Gx or not. As illustrated in Figure 3, the levels of CCL2, Csf3, IL-17a, IL-17f, IL-6, and Tnfα in older females were higher than in their younger counterparts. This was not observed in old males. Aging also reduced circulatory contents of Cxcl9 and PDCD1LG2, again only in females. The only factor modulated by age in male mice was Ctla4. The rest of the measured inflammation markers were not significantly modulated by age or differed between sexes.
3.3. The Effects of Metabolic-Hypertensive Stress (MHS) Are Similar in Mice Regardless of Age, Sex, or Gx.
Young and old mice, Gx or not, received a continuous Angii infusion for four weeks and were fed a high-fat diet (Figure 4Aa). As illustrated in Figure 4B and 4c, body weight (BW) remained stable after MHS in young males and females and old male mice. Old Ovx females had a significant BW reduction after MHS. Heart weight (Figure 4d and 4e) and left atrial weight (Figure 4f and 4g) were, as expected, increased by the MHS.
We then concentrated on clinically relevant groups: old ovx females, which mimic post-menopausal aging women and old intact males. Young mice will provide controls for the effects related to aging. Figure 5a and 5B illustrate that the MHS effects on cardiac hypertrophy (CH; iHeart) were similar in young and old males. In old ovx females, CH was reduced compared to young controls after MHS. Left atrial enlargement after MHS (iLA; LA weight indexed for tibial length) did not lead to superior values in older animals. However, baseline LA weight was increased in these mice compared to younger controls (Figure 5c). The levels of heart failure in our animals were mild, as lung congestion was not present (Figure 5d).
Echocardiography evidenced that MHS resulted in thickened LV walls and concentric remodelling (Figure 5e and 5f). This was accompanied by smaller LV internal diameters (EDD) except for older males (Figure 5g). Several older males also showed significant losses in LV ejection fraction (Figure 5h). A slight decrease in EF was observed in older females, but all animals remained over normal (50%). As illustrated in Figure 5i in long-axis LV diastolic and systolic views of representative animals (EF near the mean of each group), the MHS in an old male mouse (EF=40%) resulted in larger LV diastolic and systolic areas compared to the other groups’ LV tracings.
Cardiomyocyte cross-sectional area (CSA) was increased in older animals compared to young mice (Figure 6a and 6b). The MHS, as expected, further increased CSA compared to controls. Myocardial interstitial fibrosis was more abundant after MHS in young mice (Figure S1). In older animals, fibrosis levels after MHS were highest (Figure 6c and 6d and Figure S2) in males.
3.4. In Young Female Mice, the MHS Induced a Circulatory Inflammation Profile Similar to Aging.
We measured the levels of 46 inflammatory molecules in the plasma of young mice of both sexes, in control and MHS mice. As illustrated in Figure S3, the levels of Il-6, Csf3, Il-17a, Il-10, Il-16, Ccl11, and Pdcdlg2 were significantly higher in MHS females. In males, only Il17f showed higher plasma concentrations than controls.
3.5. Modulation of Myocardial Hypertrophy and Fibrosis Marker Genes by MHS
We assayed the expression levels of several myocardial hypertrophy or fibrosis marker genes to determine if they showed differences in modulation related to aging or sex. As illustrated in Figure 7a and 7b, MHS increased LV gene expression of natriuretic peptides, Nppa (atrial) and Nppb (brain). For Nppa, this increase was more similar irrespective of the age or sex of the animals. Nppb mRNA levels were more strongly increased in young males than in old mice.
Procollagens 1 and 3 genes (Col1a1 and Col3a1) were increased in young and old males after MHS (Figure 7c and 7d). In females, MHS did not significantly increase the expression levels of these two genes in young animals, but only in older ones. Periostin (Postn) and Thrombospondin 4 (Thbs4), marker genes of extracellular matrix remodelling, increased their expression levels by MHS in young and old males. In contrast, in females, they were modulated more markedly in old females (Figure 7e and 7f).
3.6. The MHS Increases the Pyruvate Dehydrogenase Kinase 4 (PDK4) Protein Content in Young and Old HFpEF Male and Female Mice.
We recently observed that the MHS possibly blocked the use of glucose as a myocardial energy substrate by reducing glucose entry into the cell via the glucose transporter 4 (Glut4) and pyruvate entry into the mitochondrion via pyruvate dehydrogenase (PDH) phosphorylation by the pyruvate dehydrogenase kinase 4 (Pdk4) [11]. We were interested to see if this shift in myocardial energy substrate preference was present in older animals.
We measured mRNA levels of genes encoding for fatty acids (CD36/FAT) entry into the cell and one in their entry into the mitochondrion (carnitine palmitoyl dehydrogenase 1B, Cpt1b). As illustrated in Figure 8a and 8b, those two genes are less expressed in older animals and not controlled by MHS except for younger males (CD36/FAT). Glut4 gene expression was also reduced in the myocardium of older animals and was significantly reduced by MHS in females (Figure 8c). Pdk4 mRNA levels increased after MHS in young and old mice (Figure 8d).
BDH1 (3-Hydroxybutyrate Dehydrogenase 1) is involved in ketone body metabolism. Age increased Bdh1 gene expression in males and did the opposite in females (Figure 8e). The MHS increased its expression in males, while a similar tendency (p=0.08) was observed in females. As for the AMP kinase subunit B1 (Ampkb1) gene expression, age reduced mRNA levels in males, and MHS did the same in females, but not with age (Figure 8f).
3.7. Loss of Testosterone Rescues LV Systolic Function in Old Males.
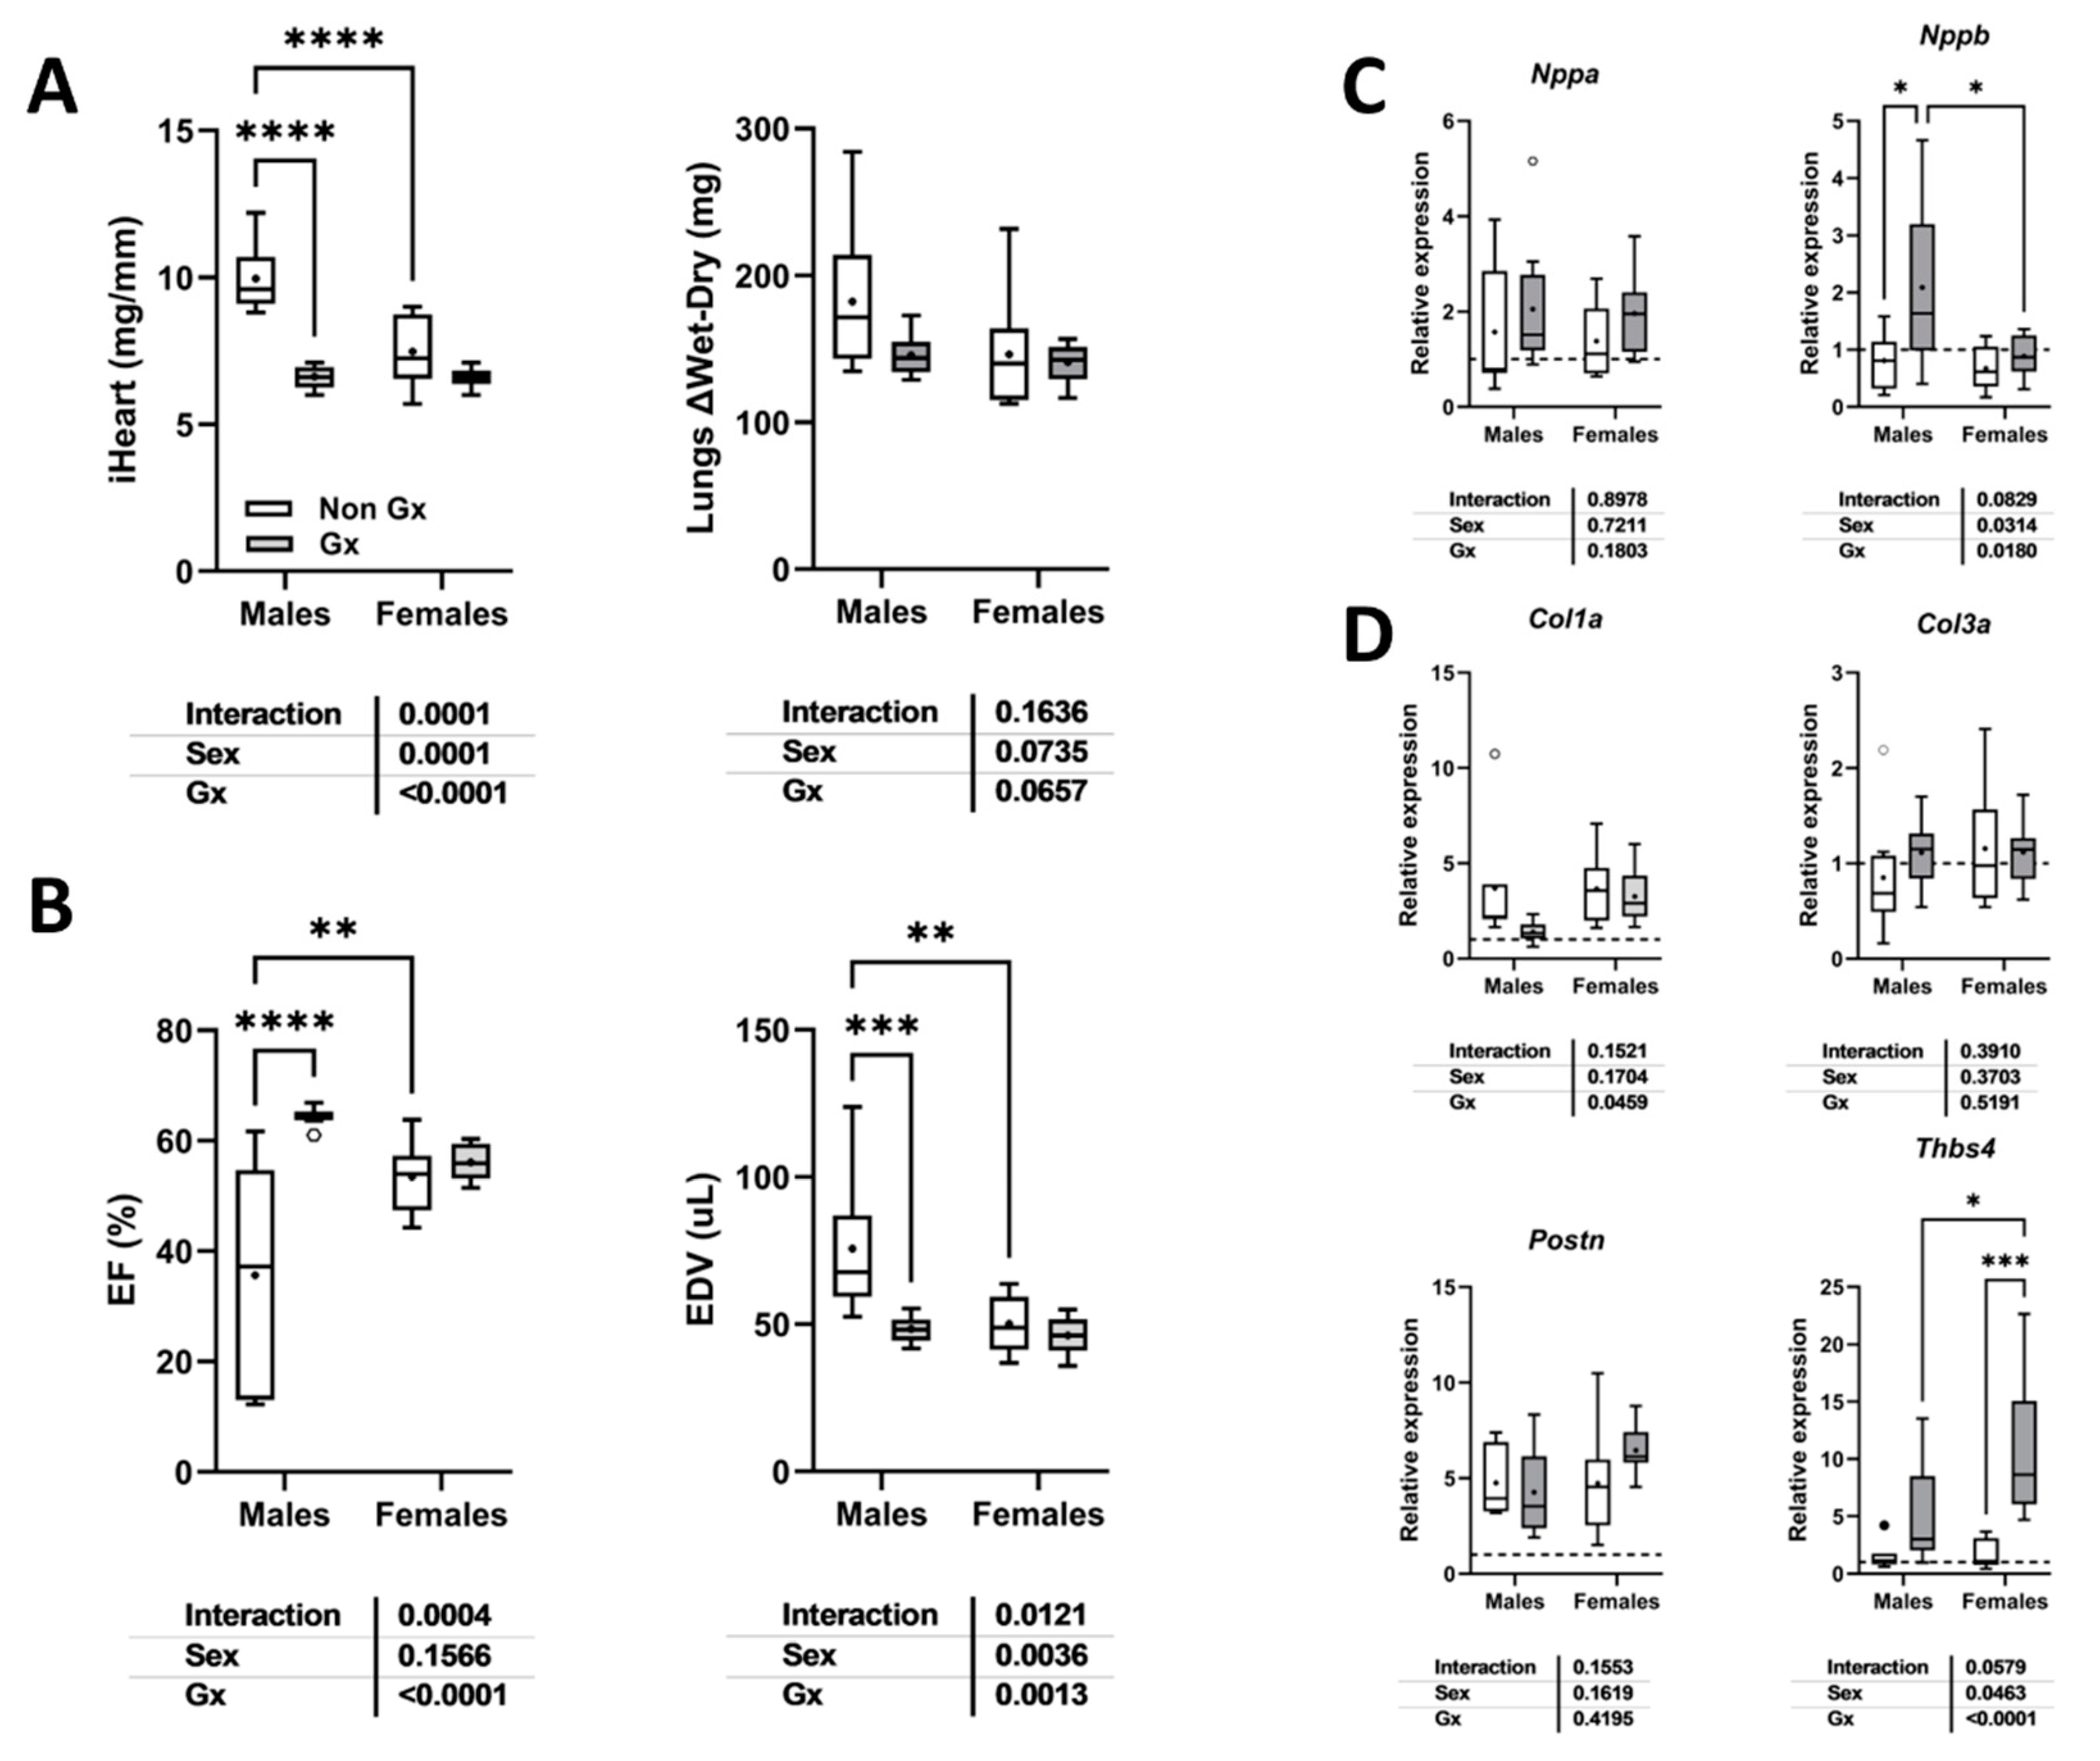
As illustrated in Figure 5e, MHS in old male mice led to three premature deaths and EF levels below 50% in five of the seven surviving animals. Figure 9a shows that gonadectomy reduced the indexed heart weight after MHS in males but not females. Ejection fraction loss after MHS was also completely reversed in old males, and LV dilation was prevented (Figure 9b). Ocx did not change Nppa, Col1a, Col3a and Postn mRNA levels in old MHS males but increased Nppb and Thbs4 expression (Figure 9c and 9d). Thbs4 levels were more enhanced in Ovx females compared to intact old ones.
4. Discussion
We previously described the HFpEF two-hit mouse model combining AngII continuous infusion and an HFD for 28 days [5]. In this study, we studied factors such as aging and gonadectomy that could influence cardiac remodelling and function in mice of both sexes. We used young animals as controls to highlight changes occurring with aging. We studied in parallel mice of both sexes using gonadectomy as a surrogate of menopause in aging females and to potentially explain observed differences related to biological sex.
In mice of both sexes, aging was associated with cardiac hypertrophy, LV concentric remodelling, and left atrial enlargement. Ejection fraction remained stable. Diastolic function was altered only in females. We let our aging mice exercise voluntarily (VE) for 6 to 20 months, which could have helped them maintain better cardiac health. Diastolic dysfunction has been reported previously in sedentary old mice. In a recent study in old mice (24 months), we observed that they maintained relatively stable diastolic and systolic functions when left to VE, reducing unwanted and destructive behaviours (aggression, shedding…) and better reproducing their natural life in the wild [6,9].
Loss of gonadal hormones at 6 months and for 14 months reduced cardiac hypertrophy related to aging in male and female mice. Old Gx males were leaner than Ovx females. Gx at 6 months did not inhibit body growth. LV wall thickening decreased in gonadectomized animals. Moreover, in males, LV diameter was smaller, which resulted in smaller stroke volume and cardiac output. Diastolic function in older Gx females was similar to that of intact ones.
We observed in male mice that aging changed the cardiac phenotype achieved after the MHS from the expected HFpEF to HFrEF. Loss of gonadal steroids completely reversed the EF decrease and LV dilation.
Gonadectomy in older mice was associated with increased myocardial fibrosis content and higher gene expression levels of Col1, Col3, Postn, and Thbs4. In females, mRNA levels for these four genes were also increased in old Ovx mice. This was not observed in young animals. It is unclear why the loss of gonadal steroids, still after more than a year after Gx, was associated with this activation of extracellular matrix (ECM)-related genes. Moreover, Col1 (females), Col3 and Thbs4 gene expression were reduced in older intact mice compared to young controls. It is possible that myocardial remodelling during cardiac growth in young mice requires higher levels of ECM-related gene expression, which is not the case for older animals.
As mentioned, we used Gx as a surrogate for menopause in our mice. We chose to study the animals late after the surgery to concentrate on the long-term cardiac effects of aging. Two recent studies in HFpEF mice have used a chemical method (vinylcyclohexene dioxide or VCD) to induce ovarian failure (menopause) in mice [12,13]. One was conducted in the C57Bl6/J strain, as ours, and the other in the C57Bl6/N strain [12]. Both used the L-NAME + HFD two-hit HFpEF murine model in young animals. These two inbred mouse strains show differences in the vulnerability of females to develop HFpEF under this regimen, the J strain being more susceptible. Troy et al. reported that ovary-intact menopause did not increase vulnerability to HFpEF, whereas Methawasin et al. observed the opposite [13]. Differences in the mouse strains and experimental designs have been proposed to explain this discrepancy. In one study, HFpEF-causing stress was initiated during the VCD treatment, while in the other, it was after the perimenopausal period. Unfortunately, both studies were conducted in young mice to exclude aging as a confounding factor.
Interestingly, older female mice had a sex-specific plasma inflammation profile characterized by a marked increase in interleukin-17 (A and F), suggesting an involvement of T helper 17 (Th17) cells during aging. This was not observed in males. This increase in IL-17 was also present in young MHS female mice. The meaning of this sex difference is unclear and will require confirmation and additional research. It is unclear whether these changes in IL-17 plasma levels affect the heart or indicate that aging and the MHS in female mice trigger a similar response from IL-17-producing T cells. Myocardial infiltration by T cells has been reported in various murine heart disease models, but there is less literature about Th17 cells, the main producers of IL-17 [14,15,16,17].
Links between IL-17 and heart failure have been observed before, however [18,19,20,21]. In heart failure patients, the level of plasma IL-17 was higher than that in patients without heart failure. These levels were negatively correlated with the ejection fraction, suggesting that HFrEF was probably linked to this rise. In male mice with transverse aortic constriction (TAC), IL-17a circulatory and myocardial levels were increased again, linking this interleukin to the development of heart failure. In addition to raised IL-17 levels, we observed that IL-6 (interleukin-6) and TNFα (tumour necrosis factor alpha) levels were increased in older females [22].
The MHS stress in young mice produced similar cardiac effects irrespective of the presence or absence of gonadal steroids. The main difference was that Ocx males were smaller and had a smaller heart at baseline. The influence of Ocx on cardiac growth in older males was even more evident, highlighting the role of androgens. In females, Ovx did not influence cardiac growth in young animals and cardiac hypertrophy later in life, as we previously reported [10].
The MHS led older females toward LV concentric remodelling with maintained ejection fraction. In contrast, this stress in old males was associated with a significant loss of EF, including three animals out of 10 that did not survive the 28-day stress. This observation is similar to the one previously reported by Withaar et al [7]. in their HFpEF model aging model; they also observed that older males developed HFrEF instead of HFpEF. Here, we show that Ocx can prevent this and return the phenotype toward HFpEF, suggesting that androgens are a critical factor in the heart's response to this type of stress. As with other cardiovascular disease animal models, sexual dimorphisms are often apparent when a component of pressure overload is present [23]. Male animals consistently develop more severe disease symptoms in various experimental settings. Male hearts are more prone to develop eccentric cardiac hypertrophy, whereas female hearts exhibit concentric hypertrophy. For instance, this is also true in patients with aortic stenosis [24]. This eccentric hypertrophy pattern will accompany more myocardial fibrosis and decreased contractility. In our model, fibrosis was not more important in old MHS males than in old Ovx females, but contractility was severely affected. The expression of cardiac marker genes such as Nppa, Nppb or collagens was not more modulated in old males than in females.
Observations in the L-NAME+HFD mouse model indicate that glucose utilization is partially reduced as a substrate for myocardial ATP production via downregulation of PDH activity [25,26]. We observed that the MHS strongly increased myocardial PDK4 content, but this translated into increased levels of PDH phosphorylation only in young animals and old females.
In the MHS model, because of the lipolytic action of AngII [27], young mice did not gain weight after being fed a high-fat diet for 28 days. Young intact females even lost weight after MHS, not Ovx ones. Loss of estrogens is usually associated with body weight gain in mice [6], but here, it prevented the loss due to AngII. Older mice were more obese than young animals, as expected. Still, voluntary exercise likely reduced the extent of obesity development, which could have contributed to a milder response to the MHS.
Study Limitations
Affirming that the MHS similarly impacted young male and female mice is difficult. The cardiac response was similar at the morphological and functional levels, but hidden factors must be identified to confirm this.
We did not monitor the mice's running activity since they were not housed individually. Males are expected to run less than females, and the distance covered diminishes with age. In the wild, mice cover significant daily distances to ensure their subsistence. We consider that providing a running device helps to improve their environment by allowing natural murine behaviour.
We did not include hormone replacement groups in our study. Since old Gx animals were kept for over a year, hormone replacement therapy (HRT), although possible, would have been problematic to administer. In addition, it is challenging to design HRT regimens that mimic the real situation in aging animals.
This study was conducted in the C57Bl6/J mouse strain, as are most studies in the field. Studies conducted in inbred strains potentially have a more limited translational value. It will be essential to confirm the validity in various strains or outbred mice that the MHS or other HFpEF-inducing models (27,28).
5. Conclusions
In conclusion, aging exacerbated the cardiac response to MHS in old mice. We observed that old male mice cannot be used as a HFpEF preclinical model since they are more prone to decompensate toward eccentric LV hypertrophy and a loss of contractility. Old ovx females, on the other hand, do not show a worsened phenotype compared to intact females at the morphological or functional level. For them, aging is associated with increased gene expression levels of four ECM-related genes.
Gonadectomy of old male mice slowed the development of cardiac hypertrophy related to aging and helped the myocardium withstand the MHS stress. This situation is challenging to translate to humans, but it emphasizes the need for further research on the cardiac effects of gonadal hormones in the context of aging.
Supplementary Materials
The following supporting information can be downloaded at the website of this paper posted on Preprints.org.
Author Contributions
Conceptualization, MA. and JC.; methodology, DCT, EWW, AMG and JAC.; validation, EWW and JC.; formal analysis, DCT, EWW and JC.; investigation, DCT, EWW, EAL, SET, AST.; data curation, DCT, EWW and JC.; writing—original draft preparation, DCT and JC.; writing—review and editing, MA and JC.; supervision, JC.; project administration, JC.; funding acquisition, MA and JC. Funding: The work was supported by grants from the Canadian Institutes for Health Research PJT-1665850 (to J. Couet and M. Arsenault) and from the Fondation de l’Institut universitaire de cardiologie et de pneumologie de Québec.
Data Availability Statement
The raw data supporting the conclusions of this article will be made available by the authors on request.
Abbreviations
The following abbreviations are used in this manuscript:
| AngII | Angiotensin II |
| HFpEF | Heart failure with preserved ejection fraction |
| HFrEF | Heart failure with reduced ejection fraction |
| MHS | Metabolic and hypertensive stress (AngII + HFD) |
| HFD | High-fat diet |
| LA | Left atrial or left atrium |
| LV | Left ventricle |
| Gx | Gonadectomized |
| Ovx | Ovariectomized or ovariectomy |
| Ocx | Orchiectomized or orchiectomy |
| CH | Cardiac hypertrophy |
| EF | Ejection fraction |
| FCG | Four core genotypes |
| ECM | Extracellular matrix |
| EDD | End-diastolic diameter |
| ESD | End-systolic diameter |
| RWT | Relative wall thickness |
| SV | Stroke volume |
| CO | Cardiac output |
| BW | Body weight |
| CSA | Cross-sectional area |
| VE | Voluntary exercise |
| VCD | Vinylcyclohexene dioxide |
| L-NAME | L-NG-Nitroarginine Methyl Ester |
| HRT | Hormonal replacement therapy |
| EDV | End-diastolic volume |
| ESV | End-systolic volume |
| Nppa | Atrial natriuretic peptide |
| Nppb | Brain natriuretic peptide |
| Col1a | Pro-collagen1 alpha |
| Col3a | Pro-collagen3 alpha |
| Postn | Periostin |
| Thbs4 | Thrombospondin 4 |
| CD36/FAT | CD36/Fatty acid transporter |
| Cpt1b | Carnitine palmitoyl transferase 1b |
| Glut4 | Glucose transporter 4 |
| Pdk4 | Pyruvate dehydrogenase kinase 4 |
| PDH | Pyruvate dehydrogenase |
| Bdh1 | 3-Hydroxybutyrate Dehydrogenase 1 |
| AMPK1b | Adenosyl monophosphate kinase 1b |
| GAPDH | Glyceraldehyde 3-phosphate dehydrogenase |
| PW | Posterior wall |
| IVSW | Interventricular septal wall |
| SEM | Standard error of the mean |
References
- Hamo CE, DeJong C, Hartshorne-Evans N, Lund LH, Shah SJ, Solomon S, Lam CSP. Heart failure with preserved ejection fraction. Nat Rev Dis Primers. 2024 Aug 14;10(1):55. [CrossRef]
- Radakrishnan A, Agrawal S, Singh N, Barbieri A, Shaw LJ, Gulati M, Lala A. Underpinnings of Heart Failure With Preserved Ejection Fraction in Women - From Prevention to Improving Function. A Co-publication With the American Journal of Preventive Cardiology and the Journal of Cardiac Failure. J Card Fail. 2025 Feb 10:S1071-9164(25)00037-5. Epub ahead of print. PMID: 39971643. [CrossRef]
- Ketema EB, Lopaschuk GD. The Impact of Obesity on Cardiac Energy Metabolism and Efficiency in Heart Failure With Preserved Ejection Fraction. Can J Cardiol. 2025 Jan 30:S0828-282X(25)00099-6. Epub ahead of print. PMID: 39892611. [CrossRef]
- Triposkiadis F, Giamouzis G, Parissis J, Starling RC, Boudoulas H, Skoularigis J, Butler J, Filippatos G. Reframing the association and significance of co-morbidities in heart failure. Eur J Heart Fail. 2016 Jul;18(7):744-58. Epub 2016 Jun 30. PMID: 27358242. [CrossRef]
- Aidara ML, Walsh-Wilkinson É, Thibodeau SÈ, Labbé EA, Morin-Grandmont A, Gagnon G, Boudreau DK, Arsenault M, Bossé Y, Couët J. Cardiac reverse remodeling in a mouse model with many phenotypical features of heart failure with preserved ejection fraction: effects of modifying lifestyle. Am J Physiol Heart Circ Physiol. 2024 Apr 1;326(4):H1017-H1036. Epub 2024 Feb 16. PMID: 38363584. [CrossRef]
- Morin-Grandmont A, Walsh-Wilkinson É, Labbé EA, Thibodeau SÈ, Dupont É, Boudreau DK, Arsenault M, Bossé Y, Couet J. Biological sex, sex steroids and sex chromosomes contribute to mouse cardiac aging. Aging (Albany NY). 2024 May 13;16(9):7553-7577. Epub 2024 May 13. PMID: 38742935; PMCID: PMC11131996. [CrossRef]
- Withaar C, Meems LMG, Markousis-Mavrogenis G, Boogerd CJ, Silljé HHW, Schouten EM, Dokter MM, Voors AA, Westenbrink BD, Lam CSP, de Boer RA. The effects of liraglutide and dapagliflozin on cardiac function and structure in a multi-hit mouse model of heart failure with preserved ejection fraction. Cardiovasc Res. 117:2108-2124, 2021. [CrossRef]
- Walsh-Wilkinson É, Aidara ML, Morin-Grandmont A, Thibodeau SÈ, Gagnon J, Genest M, Arsenault M, Couet J. Age and sex hormones modulate left ventricle regional response to angiotensin II in male and female mice. Am J Physiol Heart Circ Physiol. 2022 Oct 1;323(4):H643-H658. Epub 2022 Aug 19. PMID: 35984762. [CrossRef]
- Morin-Grandmont A, Walsh-Wilkinson E, Thibodeau SÈ, Boudreau DK, Arsenault M, Bossé Y, Couet J. A murine model of hypertensive heart disease in older women. PeerJ. 2024 May 23;12:e17434. PMID: 38799057; PMCID: PMC11128216. [CrossRef]
- Walsh-Wilkinson E, Arsenault M, Couet J. Segmental analysis by speckle-tracking echocardiography of the left ventricle response to isoproterenol in male and female mice. PeerJ. 2021 Mar 12;9:e11085. PMID: 33763310; PMCID: PMC7958899. [CrossRef]
- Labbé EA, Thibodeau SE, Walsh-Wilkinson E, Chalifour M, Sirois PO, Leblanc J, Arsenault M, Couet J. Relative contributions of correcting the diet and voluntary exercise to myocardial recovery in a two-hit murine model of heart failure with preserved ejection fraction. bioRxiv 2025.02.03.636256. [CrossRef]
- Troy AM, Normukhamedova D, Grothe D, Momen A, Zhou YQ, McFadden M, Hussain M, Billia F, Cheng HM. Impact of ovary-intact menopause in a mouse model of heart failure with preserved ejection fraction. Am J Physiol Heart Circ Physiol. 2024 Mar 1;326(3):H522-H537. Epub 2024 Jan 5. PMID: 38180450; PMCID: PMC11221814. [CrossRef]
- Methawasin M, Strom J, Marino VA, Gohlke J, Muldoon J, Herrick SR, van der Piji R, Konhilas JP, Granzier H. An ovary-intact postmenopausal HFpEF mouse model; menopause is more than just estrogen deficiency. Am J Physiol Heart Circ Physiol. 2025 Apr 1;328(4):H719-H733. Epub 2025 Feb 18. [CrossRef]
- Brenes-Castro D, Castillo EC, Vázquez-Garza E, Torre-Amione G, García-Rivas G. Temporal Frame of Immune Cell Infiltration during Heart Failure Establishment: Lessons from Animal Models. Int J Mol Sci. 2018 Nov 22;19(12):3719. PMID: 30467294; PMCID: PMC6321195. [CrossRef]
- Wang D, Weng X, Yue W, Shang L, Wei Y, Clemmer JS, Xu Y, Chen Y. CD8 T cells promote heart failure progression in mice with preexisting left ventricular dysfunction. Front Immunol. 2024 Sep 11;15:1472133. PMID: 39324134; PMCID: PMC11422781. [CrossRef]
- Smolgovsky S, Bayer AL, Kaur K, Sanders E, Aronovitz M, Filipp ME, Thorp EB, Schiattarella GG, Hill JA, Blanton RM, Cubillos-Ruiz JR, Alcaide P. Impaired T cell IRE1α/XBP1 signaling directs inflammation in experimental heart failure with preserved ejection fraction. J Clin Invest. 2023 Dec 15;133(24):e171874. PMID: 37874641; PMCID: PMC10721145. [CrossRef]
- Huang S, Kang Y, Liu T, Xiong Y, Yang Z, Zhang Q. The role of immune checkpoints PD-1 and CTLA-4 in cardiovascular complications leading to heart failure. Front Immunol. 2025 Apr 4;16:1561968. PMID: 40255399; PMCID: PMC12006013. [CrossRef]
- Zhao Z, Qi D, Zhang Z, Du X, Zhang F, Ma R, Liang Y, Zhao Y, Gao Y, Yang Y. Prognostic Value of Inflammatory Cytokines in Predicting Hospital Readmissions in Heart Failure with Preserved Ejection Fraction. J Inflamm Res. 2024 May 14;17:3003-3012. PMID: 38764501; PMCID: PMC11102073. [CrossRef]
- Baumhove L, Bomer N, Tromp J, van Essen BJ, Dickstein K, Cleland JG, Lang CC, Ng LL, Samani NJ, Anker SD, Metra M, van Veldhuisen DJ, van der Meer P, Voors AA. Clinical characteristics and prognosis of patients with heart failure and high concentrations of interleukin-17D. Int J Cardiol. 2024 Feb 1;396:131384. Epub 2023 Sep 21. PMID: 37739044. [CrossRef]
- Huang L. The role of IL-17 family cytokines in cardiac fibrosis. Front Cardiovasc Med. 2024 Oct 22;11:1470362. PMID: 39502194; PMCID: PMC11534612. [CrossRef]
- Miao Y, Yan T, Liu J, Zhang C, Yan J, Xu L, Zhang N, Zhang X. Meta-analysis of the association between interleukin-17 and ischemic cardiovascular disease. BMC Cardiovasc Disord. 2024 May 16;24(1):252. PMID: 38750443; PMCID: PMC11097571. [CrossRef]
- Alogna A, Koepp KE, Sabbah M, Espindola Netto JM, Jensen MD, Kirkland JL, Lam CSP, Obokata M, Petrie MC, Ridker PM, Sorimachi H, Tchkonia T, Voors A, Redfield MM, Borlaug BA. Interleukin-6 in Patients With Heart Failure and Preserved Ejection Fraction. JACC Heart Fail. 2023 Nov;11(11):1549-1561. Epub 2023 Aug 9. PMID: 37565977; PMCID: PMC10895473. [CrossRef]
- Albar Z, Albakri M, Hajjari J, Karnib M, Janus SE, Al-Kindi SG. Inflammatory Markers and Risk of Heart Failure With Reduced to Preserved Ejection Fraction. Am J Cardiol. 2022 Mar 15;167:68-75. Epub 2022 Jan 3. PMID: 34986991. [CrossRef]
- Fleury MA, Clavel MA. Sex and Race Differences in the Pathophysiology, Diagnosis, Treatment, and Outcomes of Valvular Heart Diseases. Can J Cardiol. 2021 Jul;37(7):980-991. Epub 2021 Feb 11. PMID: 33581193. [CrossRef]
- Sun Q, Güven B, Wagg CS, Almeida de Oliveira A, Silver H, Zhang L, Chen B, Wei K, Ketema EB, Karwi QG, Persad KL, Vu J, Wang F, Dyck JRB, Oudit GY, Lopaschuk GD. Mitochondrial fatty acid oxidation is the major source of cardiac adenosine triphosphate production in heart failure with preserved ejection fraction. Cardiovasc Res. 120:360-371, 2024. [CrossRef]
- Güven B, Sun Q, Wagg CS, Almeida de Oliveira A, Silver H, Persad KL, Onay-Besikci A, Vu J, Oudit GY, Lopaschuk GD. Obesity Is a Major Determinant of Impaired Cardiac Energy Metabolism in Heart Failure with Preserved Ejection Fraction. J Pharmacol Exp Ther. 388:145-155. [CrossRef]
- Cai Z, Fang L, Jiang Y, Liang M, Wang J, Shen Y, Wang Z, Liang F, Huo H, Pan C, Shen L, He B. Angiotensin II Promotes White Adipose Tissue Browning and Lipolysis in Mice. Oxid Med Cell Longev. 2022:6022601, 2022. [CrossRef]
- Srinivas B, Alluri K, Peng H, Ortiz PA, Xu J, Sabbah HN, Rhaleb NE, Matrougui K. Unveiling the vulnerability of C57BL/6J female mice to HFpEF and its related complications. J Mol Cell Cardiol Plus. 7:100062, 2024. [CrossRef]
- Yoshii A, McMillen TS, Wang Y, Zhou B, Chen H, Banerjee D, Herrero M, Wang P, Muraoka N, Wang W, Murry CE, Tian R. Blunted Cardiac Mitophagy in Response to Metabolic Stress Contributes to HFpEF. Circ Res. 2024 Oct 25;135(10):1004-1017. Epub 2024 Sep 27. Erratum in: Circ Res. 2024 Dec 6;135(12):e154. DOI :10.1161/RES.0000000000000702. PMID: 39328167; PMCID: PMC11502249. [CrossRef]
Figure 1.
Effects of gonadectomy (Gx) on cardiac morphology and function in young (4 months) and old (20 months) mice of both sexes. A. Schematic representation of the experimental design (Created in BioRender. Couet, J. (2025) https://BioRender.com/4zt874x). C57Bl6/J/J male and female mice were Gx at 5 weeks or 6 months and were allowed to age until 4 and 20 months. All mice were fed a standard diet described in the Materials and Methods section. Older animals had a running device installed in their cage after Gx to prevent unwanted behaviour and as environmental enrichment. B. Body weight, C. Tibial length and D. indexed heart weight (iHeart) of male (blue) and female (orange) mice. Gx animals (Ocx or ovx) are represented as solid dots. Echocardiography data. E. End-diastolic LV diameter (EDD), F. LV wall thickness in diastole (PWd+IVSd). G. LV relative wall thickness (LV walls/EDD; RWT), H. Ejection fraction (EF). I. LV stroke volume (SV), J. Cardiac output (CO). Diastolic function. K. Pulsed-wave Doppler E wave velocity (E wave), L: A wave velocity and M: E/A ratio. N: Tissue Doppler E’ wave velocity (E’ wave), O: E/E’ ratio and P: Left atrial weight. Results are expressed as mean ± standard error of the mean (SEM). Two-way ANOVA followed by Holm-Sidak post-test. *: p<0.05, **: p<0.01, ***: p<0.001 and ****: p<0.0001 between indicated groups (n=8-14 mice/group).
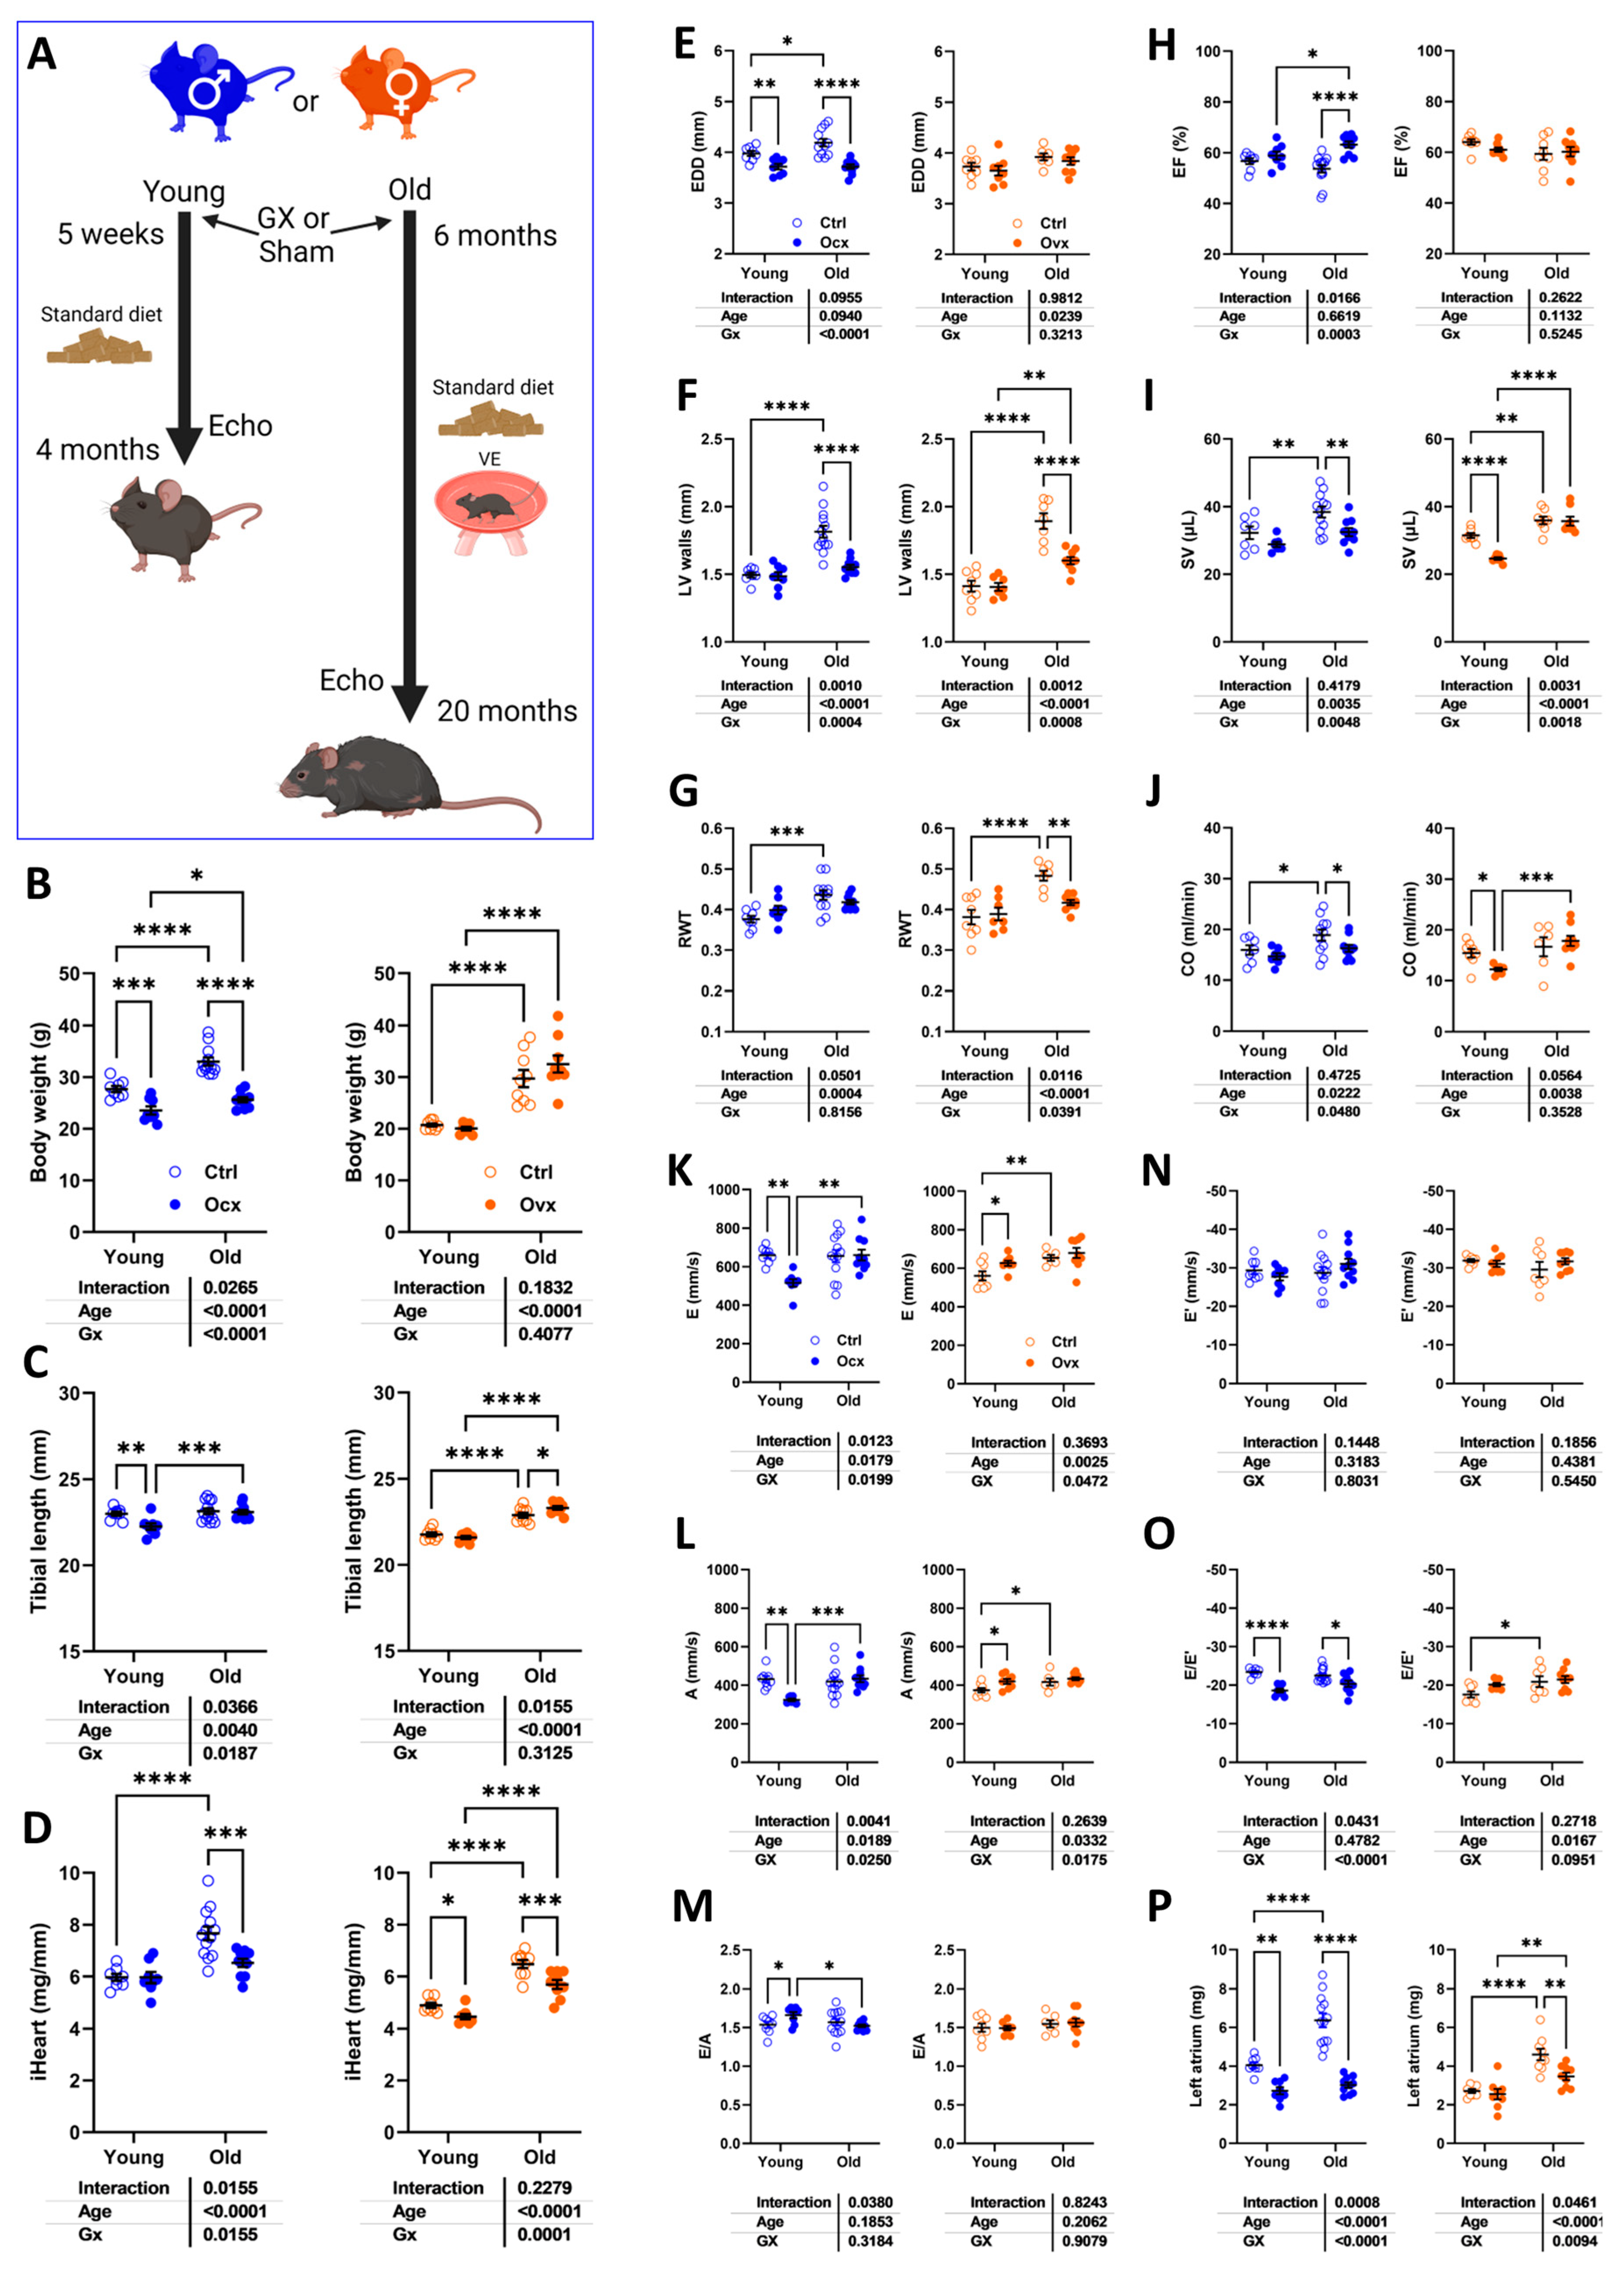
Figure 2.
Effects of aging on cardiac morphology and development of myocardial interstitial fibrosis. A. Representative M-mode echo LV tracings of young and old mice, Gx or not. B. Representative images of picrosirius red staining of male and female heart long-axis sections for each indicated group. C. Myocardial fibrosis (picrosirius red staining) Males (left) and females (right). E. The graph on the left is for females (red), and the one on the right is for males (blue). D. Col1a1, Collagen 1 α1, E. Col3a1, Collagen 3 α1, F. Postn, periostin and G. Tbsp4, thrombospondin 4. Data are represented as mean ± SEM (n=6-8 per group). Two-way ANOVA followed by Holm-Sidak post-test. *: p<0.05, **: p<0.01, ***: p<0.001 and ****: p<0.0001 between indicated groups.
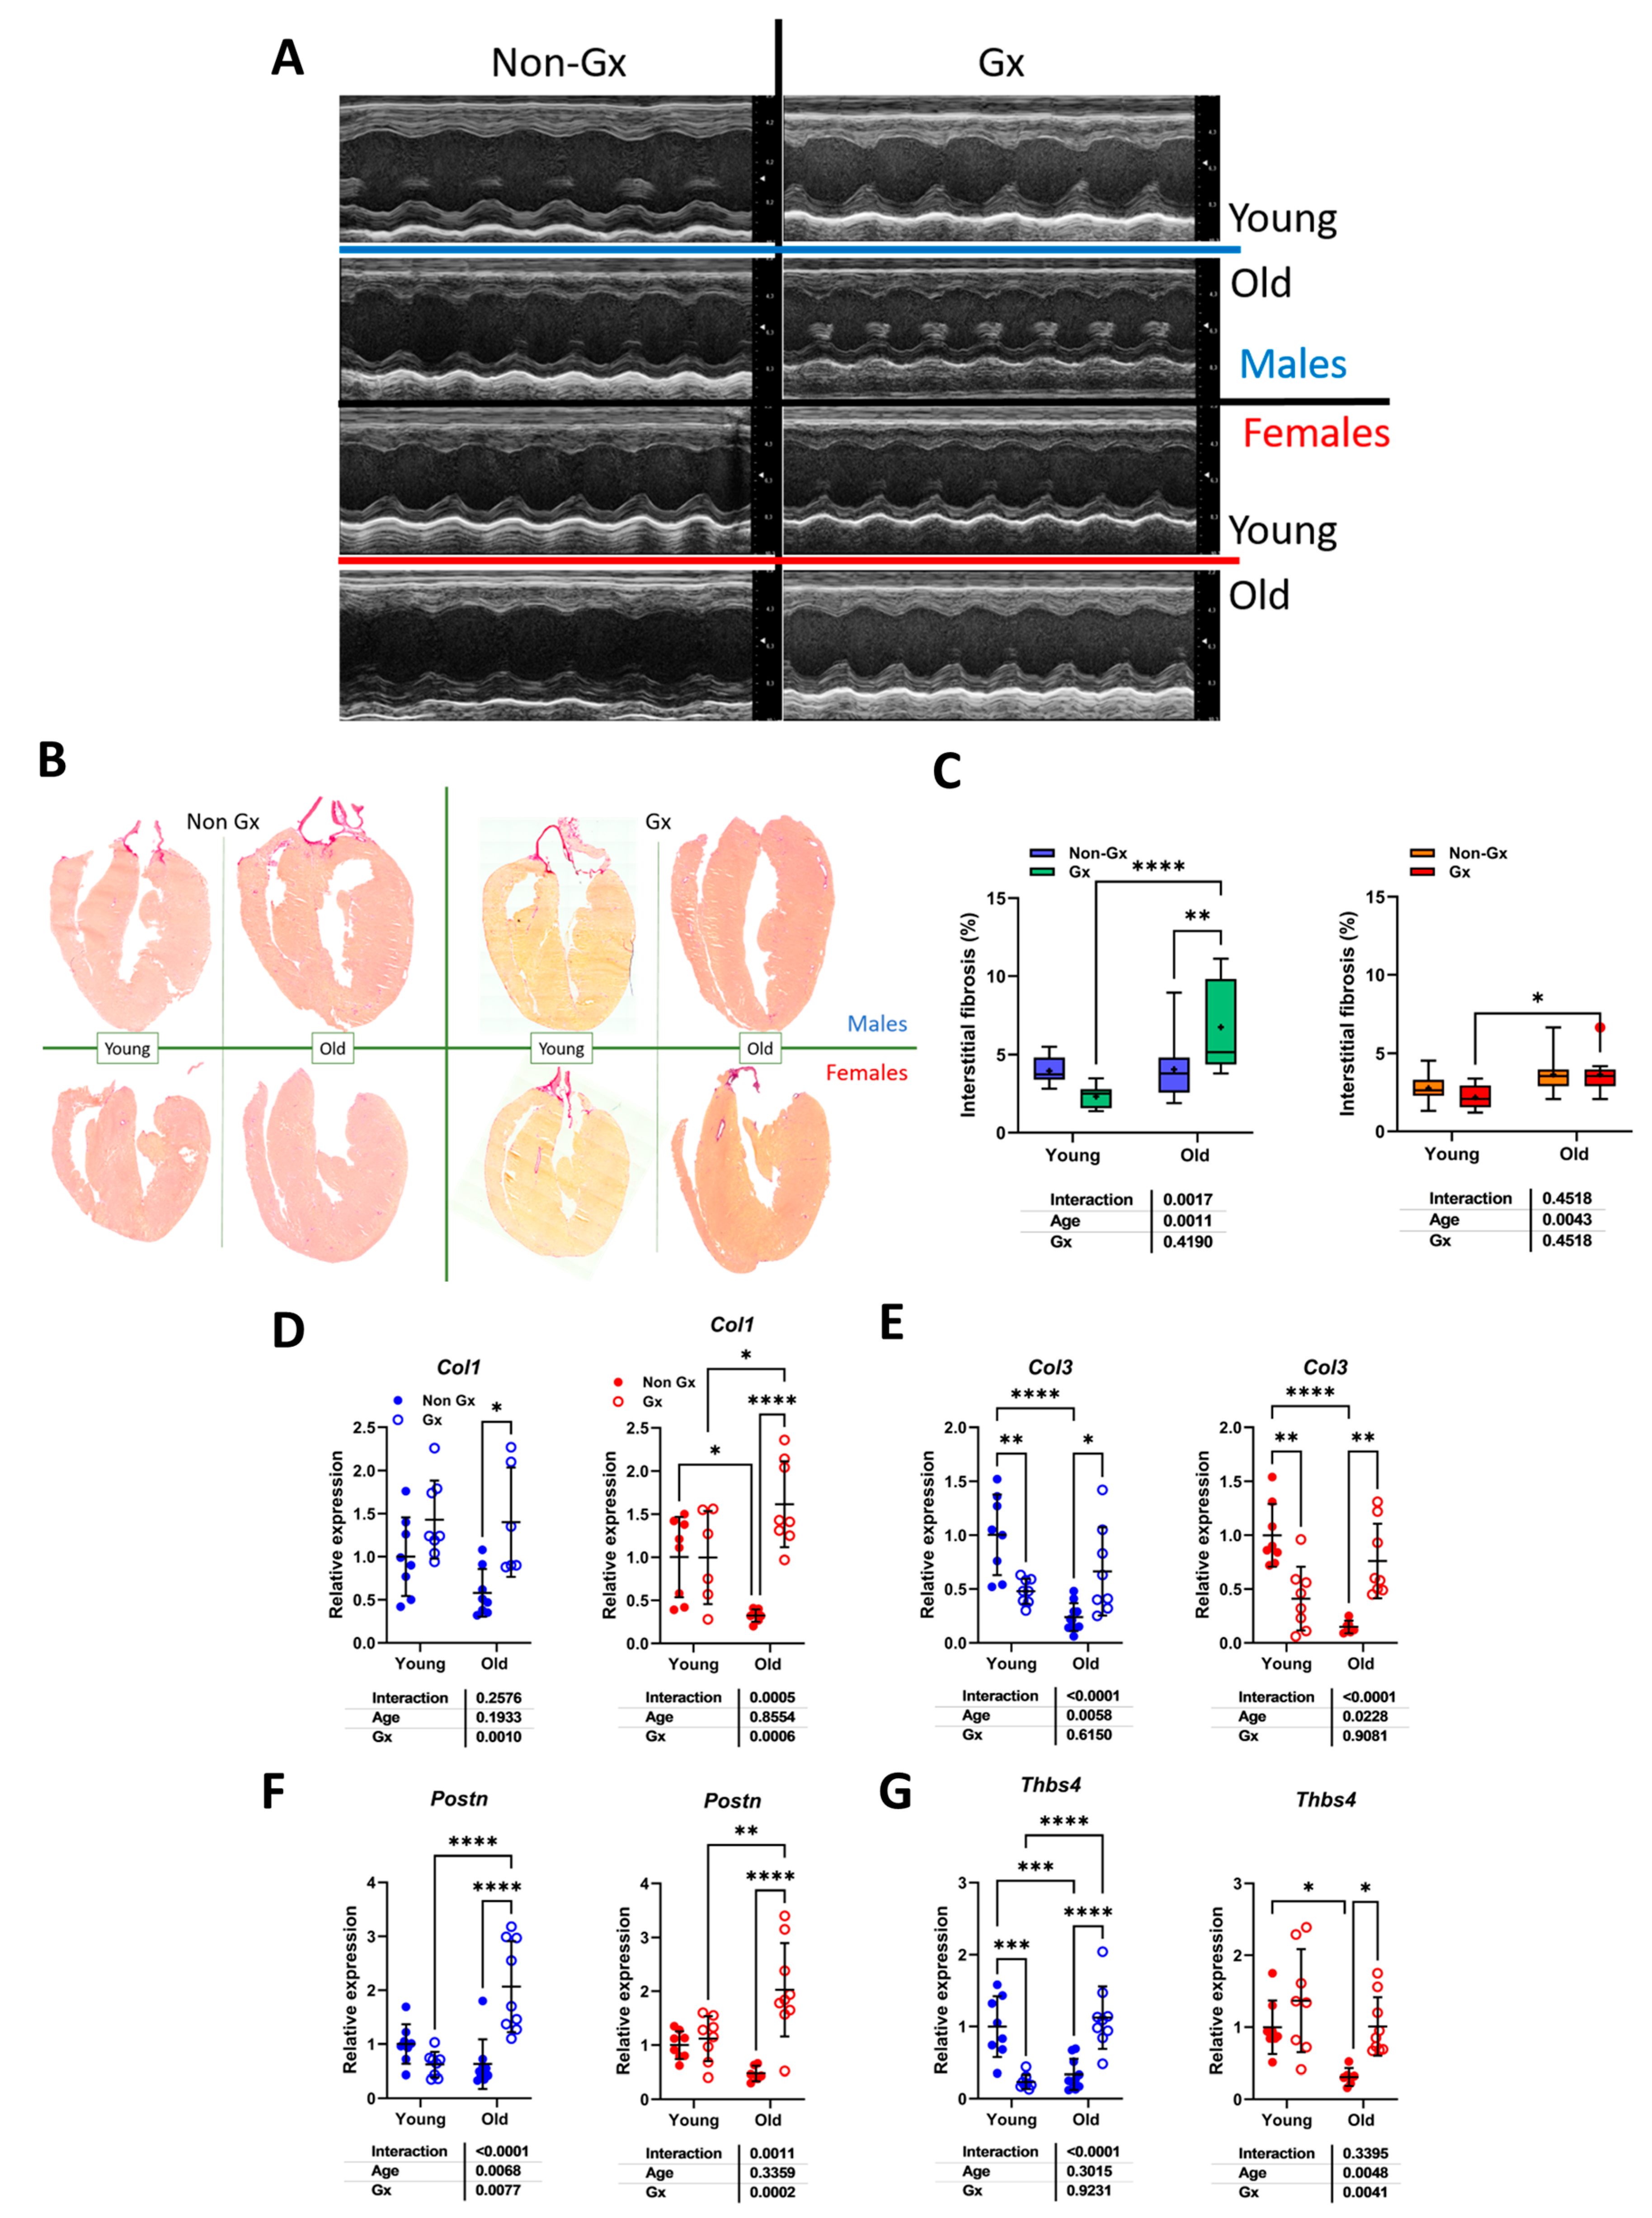
Figure 3.
Plasma protein concentration of 9 immunity-related molecules in male and female mice exposed or not to MHS. Levels of these molecules were evaluated as described in the Materials and Methods section. CCL2: C-C Motif Chemokine Ligand 2, Csf3: Colony Stimulating Factor 3, Ctla4: Cytotoxic T-lymphocyte associated protein 4, Cxcl9: C-X-C Motif Chemokine Ligand 9, IL-17: interleukin 17, Il6: interleukin-6, Tnf: tumor necrosis factor alpha, and Pdcd1lg2: Programmed Cell Death 1 Ligand 2.- Data are represented as mean ± SEM (n=4). F: females, and M: males. Student T-test between young and old animals. *: p<0.05, **: p<0.01 and, ***: p<0.001 and ****: p<0.0001 between indicated groups.
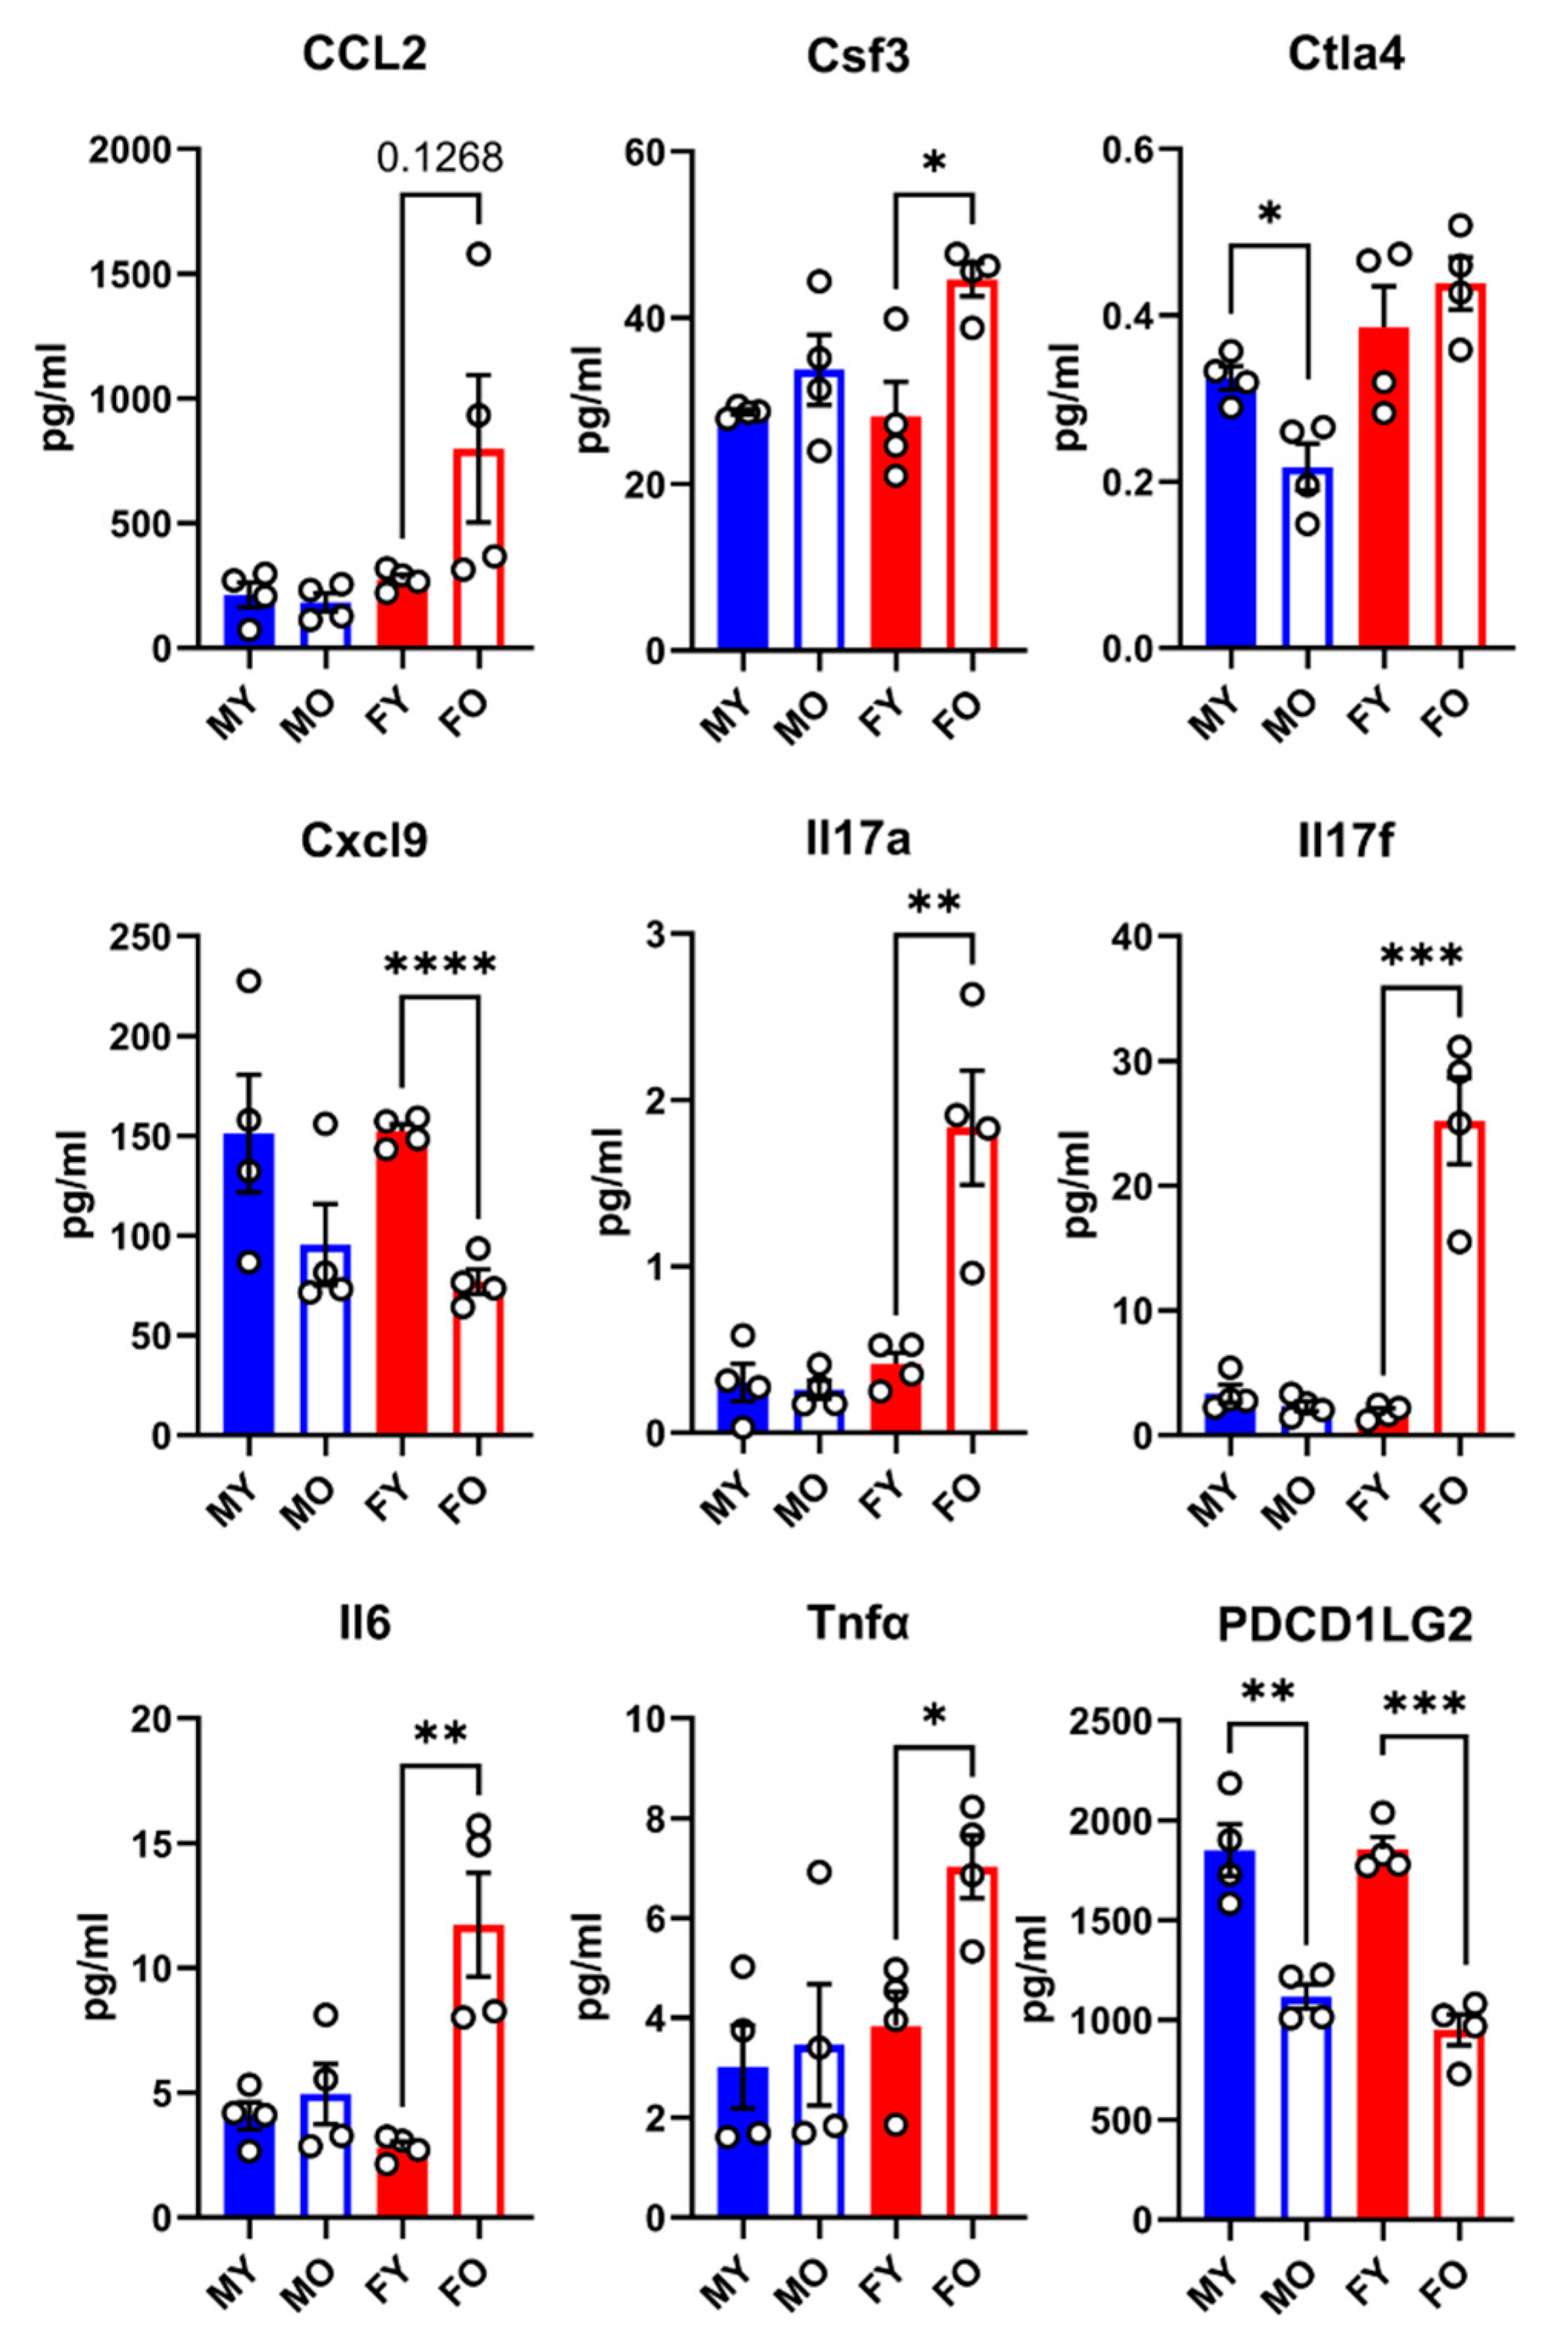
Figure 4.
MHS in young and old mice: impact of gonadectomy. A. Schematic representation of the experimental design. Created in BioRender. Couet, J. (2025) https://BioRender.com/aqzg5bj). B. Body weight in young and old intact and Ovx males, C. Body weight in young and old intact and Ovx females, D. Heart weight of males, E. Heart weight of females, F. Left atrial weight of males, and G. Left atrial weight of females. Data are represented as mean +SEM (n=7-14 per group). Two-way ANOVA followed by Holm-Sidak post-test. *: p<0.05, **: p<0.01, ***: p<0.001 and ****: p<0.0001 between indicated groups.
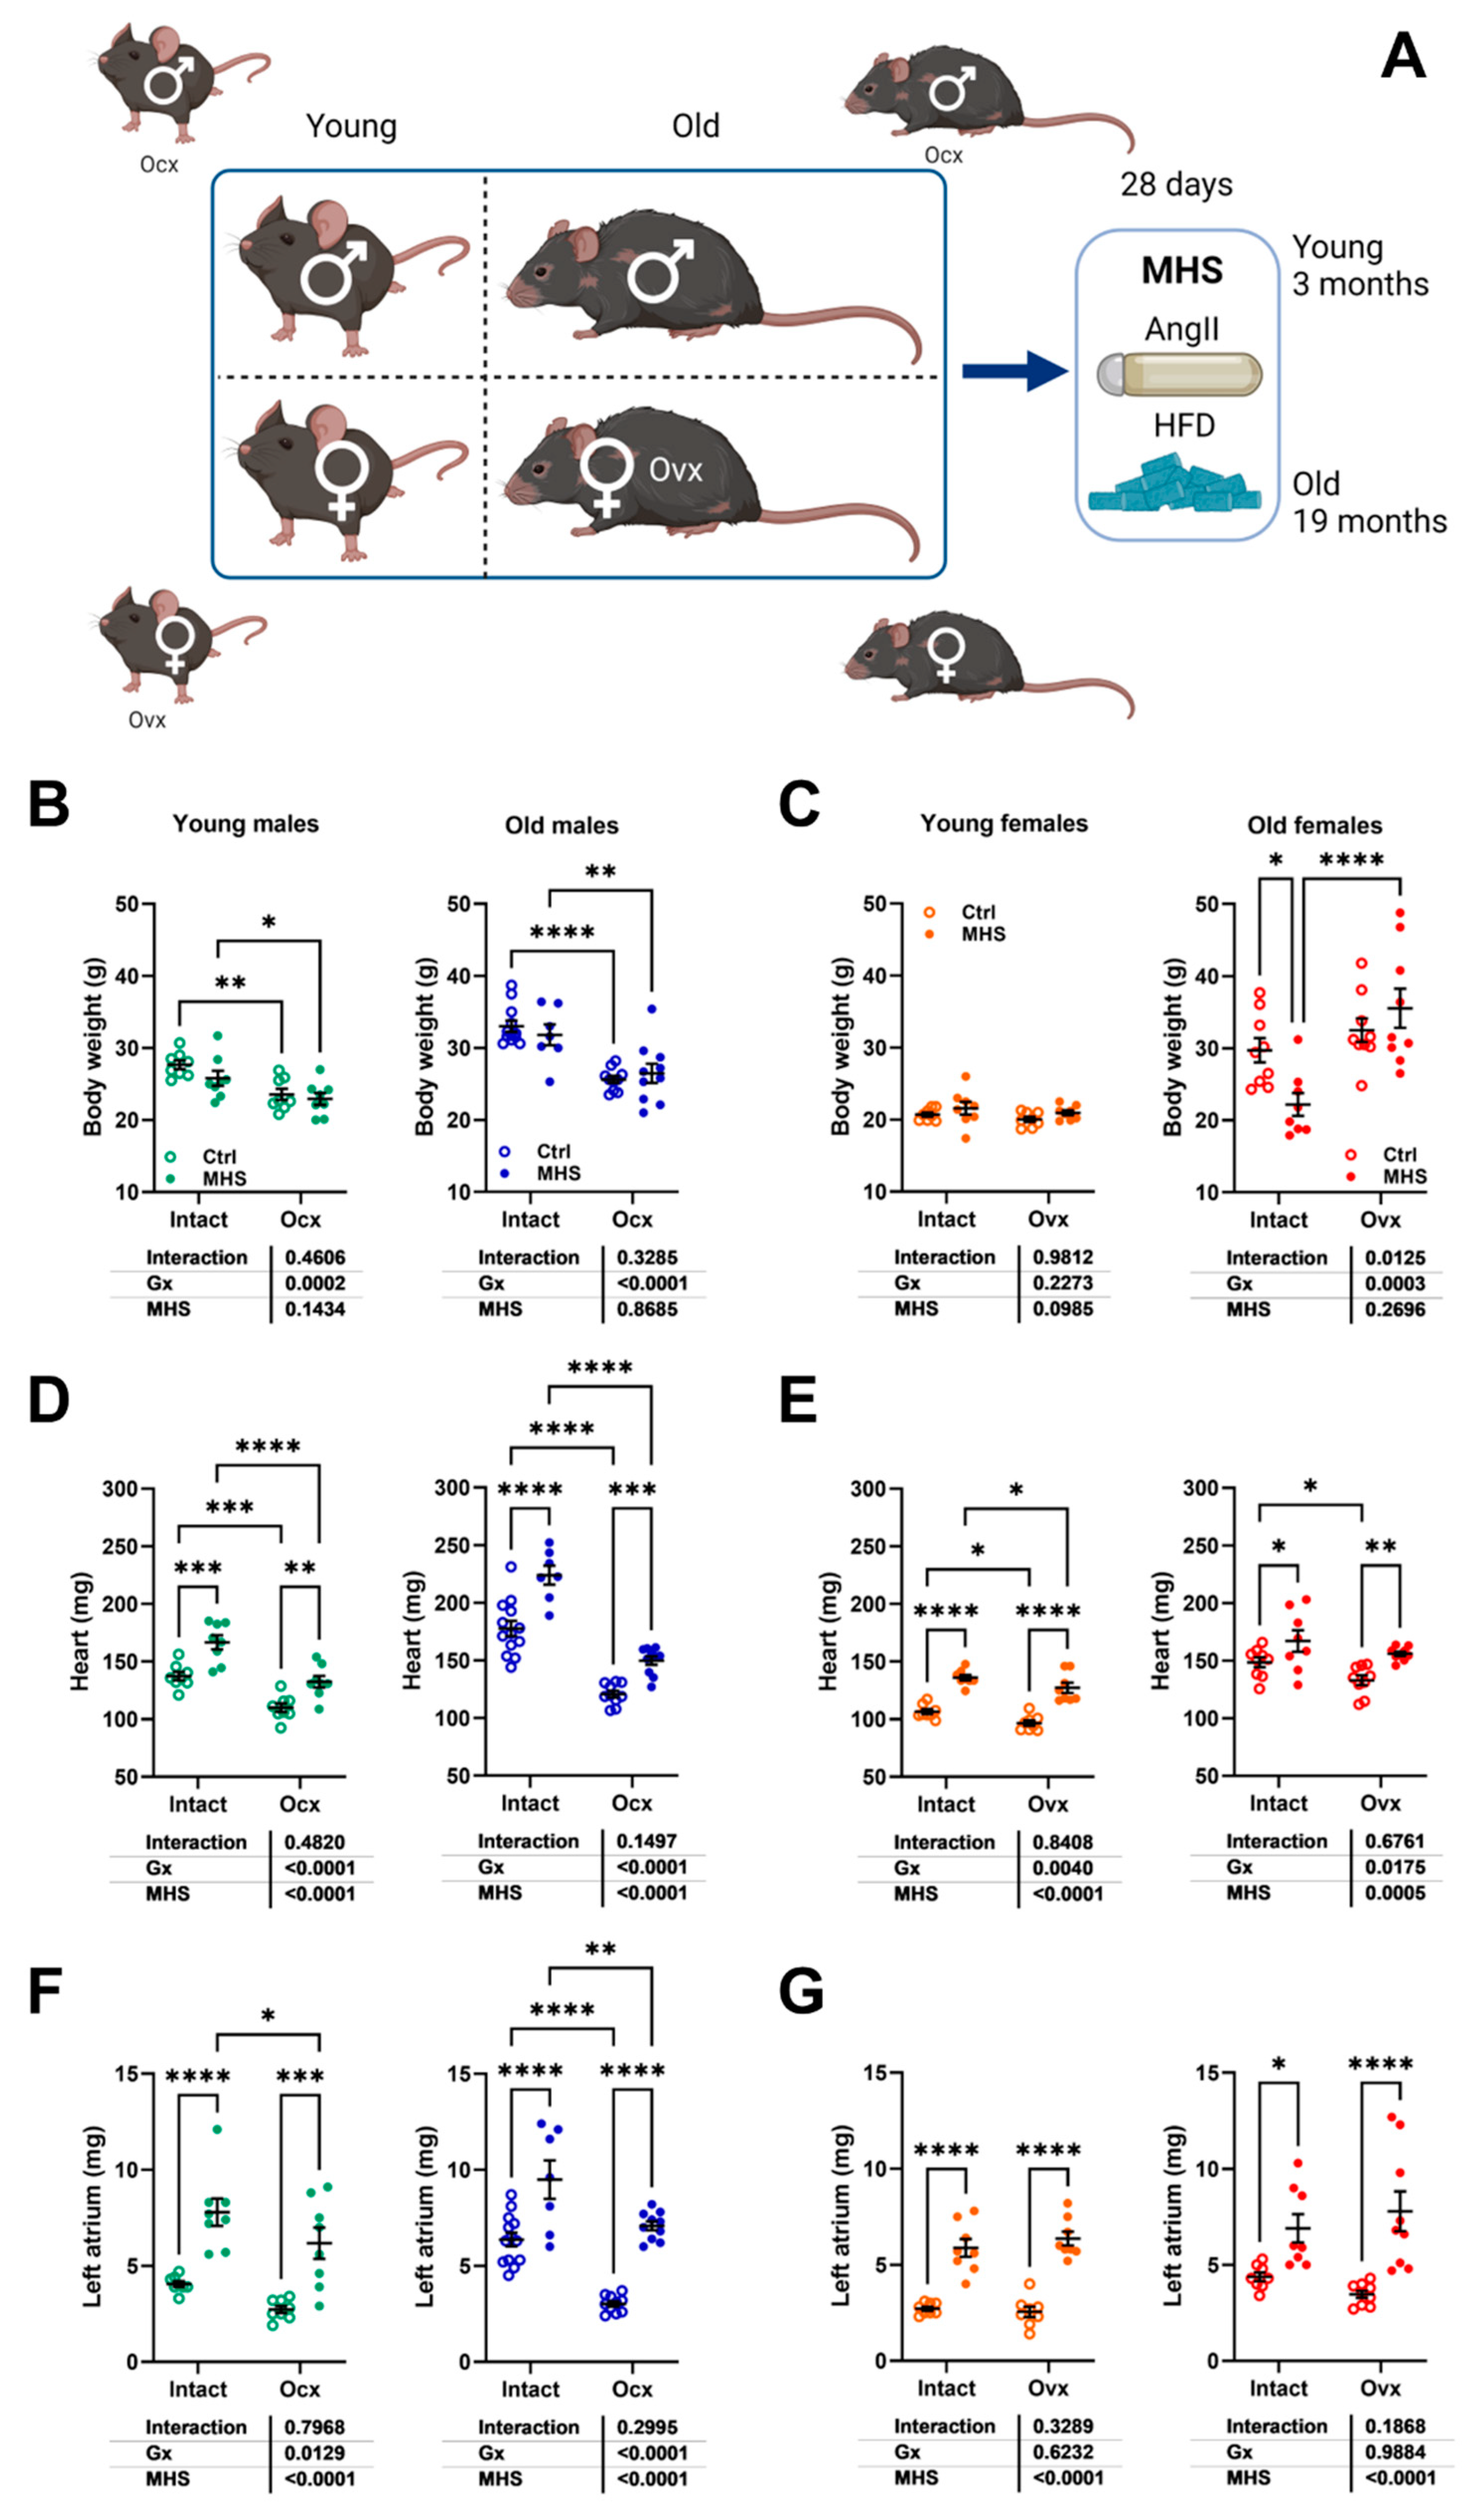
Figure 5.
The effects of age (males) and age + Ovx (females) on the cardiac response to MHS. A. Indexed heart weight (iHeart; Males, left and Females, right). B. iHeart gain from MHS in % (ΔHW/TL). C. Indexed left atrial weight (iLA). D. Lungs water weight (difference between wet and dry weight). Echocardiography data. E. LV wall thickness in diastole (PWd+IVSd). F. LV relative wall thickness (LV walls/EDD; RWT). G. End-diastolic LV diameter (EDD) and H. Ejection fraction (EF). Data are represented as mean ± SEM (n=7-14 per group). Two-way ANOVA followed by Holm-Sidak post-test. *: p<0.05, **: p<0.01, ***: p<0.001 and ****: p<0.0001 between indicated groups. I. Representative B-mode LV tracings (diastolic and systolic) used to estimate LV volumes and ejection fraction in the represented groups.
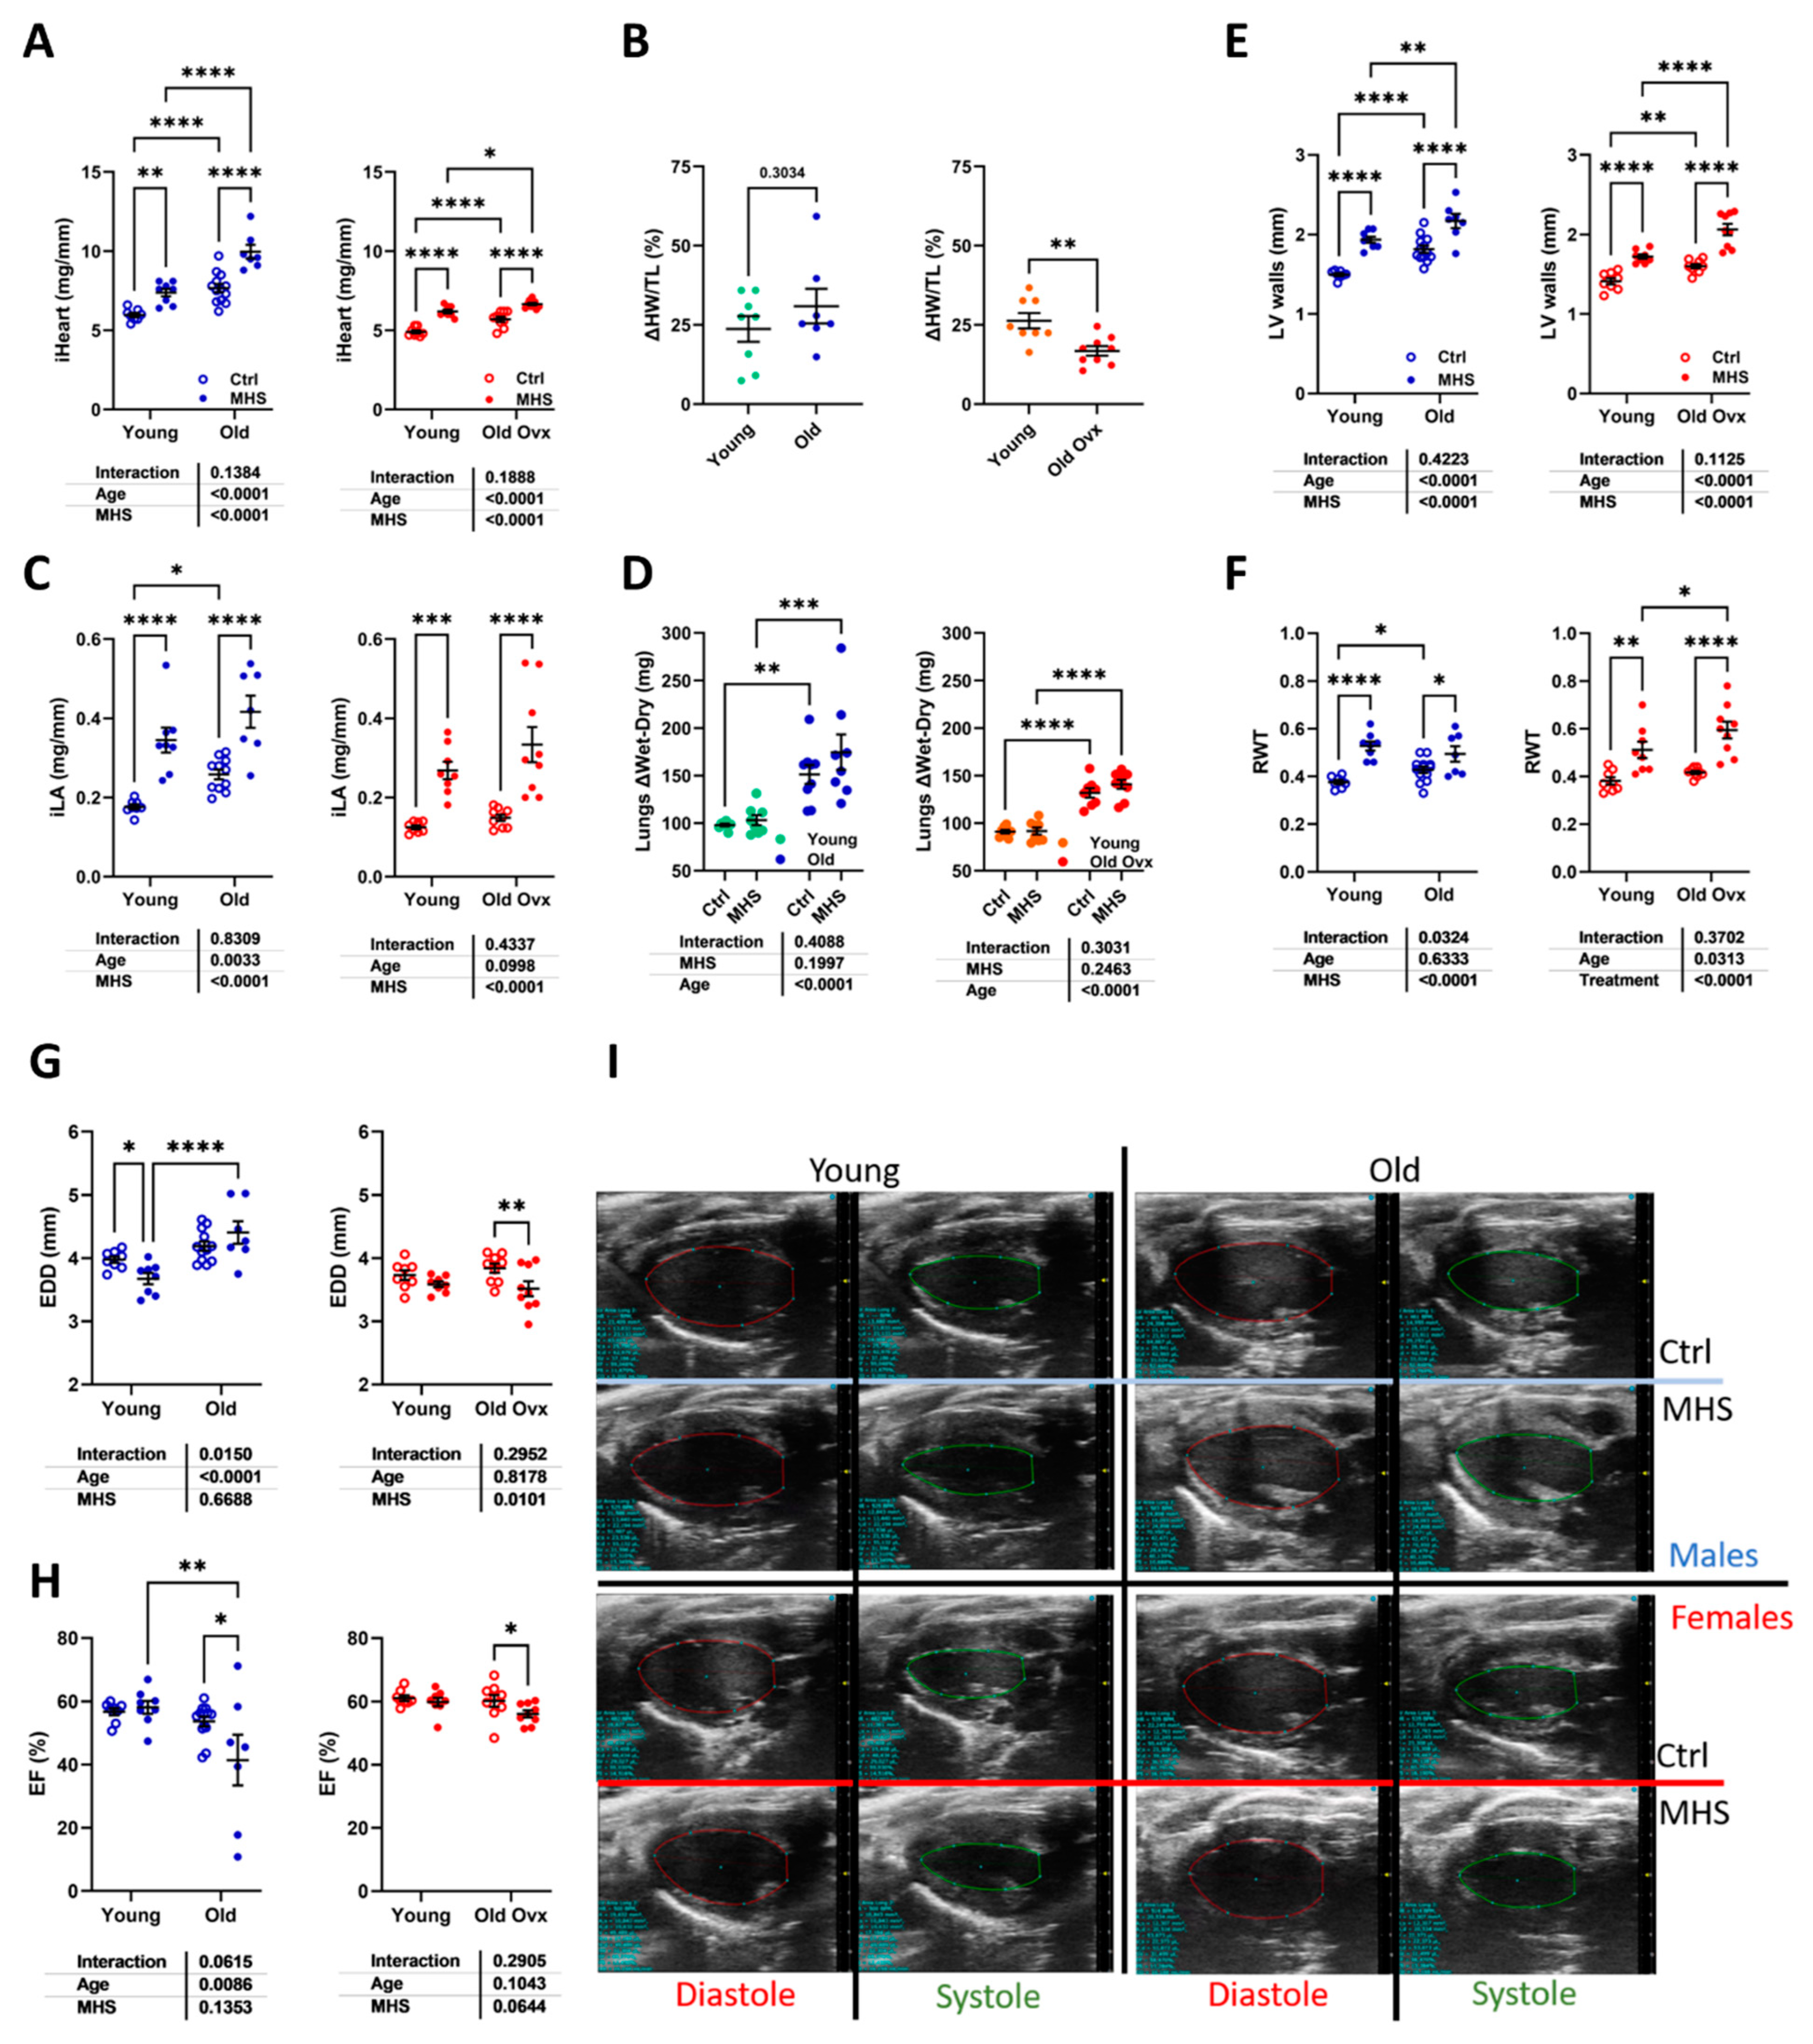
Figure 6.
Cardiac myocyte hypertrophy and myocardial interstitial fibrosis after MHS. A. Representative images of WGA-FITC staining from LV sections of the various indicated groups. B. Cross-sectional area of cardiomyocytes quantified by WGA-FITC staining control (Ctrl; left) and MHS (middle) groups. CSA gain (% over control; right) from MHS. C. Representative images of picrosirius red staining of old female and male heart sections (Ctrl vs. MHS). D. Myocardial fibrosis (picrosirius red staining). Data are represented as mean ± SEM (n=7-8 per group). Two-way ANOVA followed by Holm-Sidak post-test. *: p<0.05, **: p<0.01, ***: p<0.001 and ****: p<0.0001 between indicated groups.
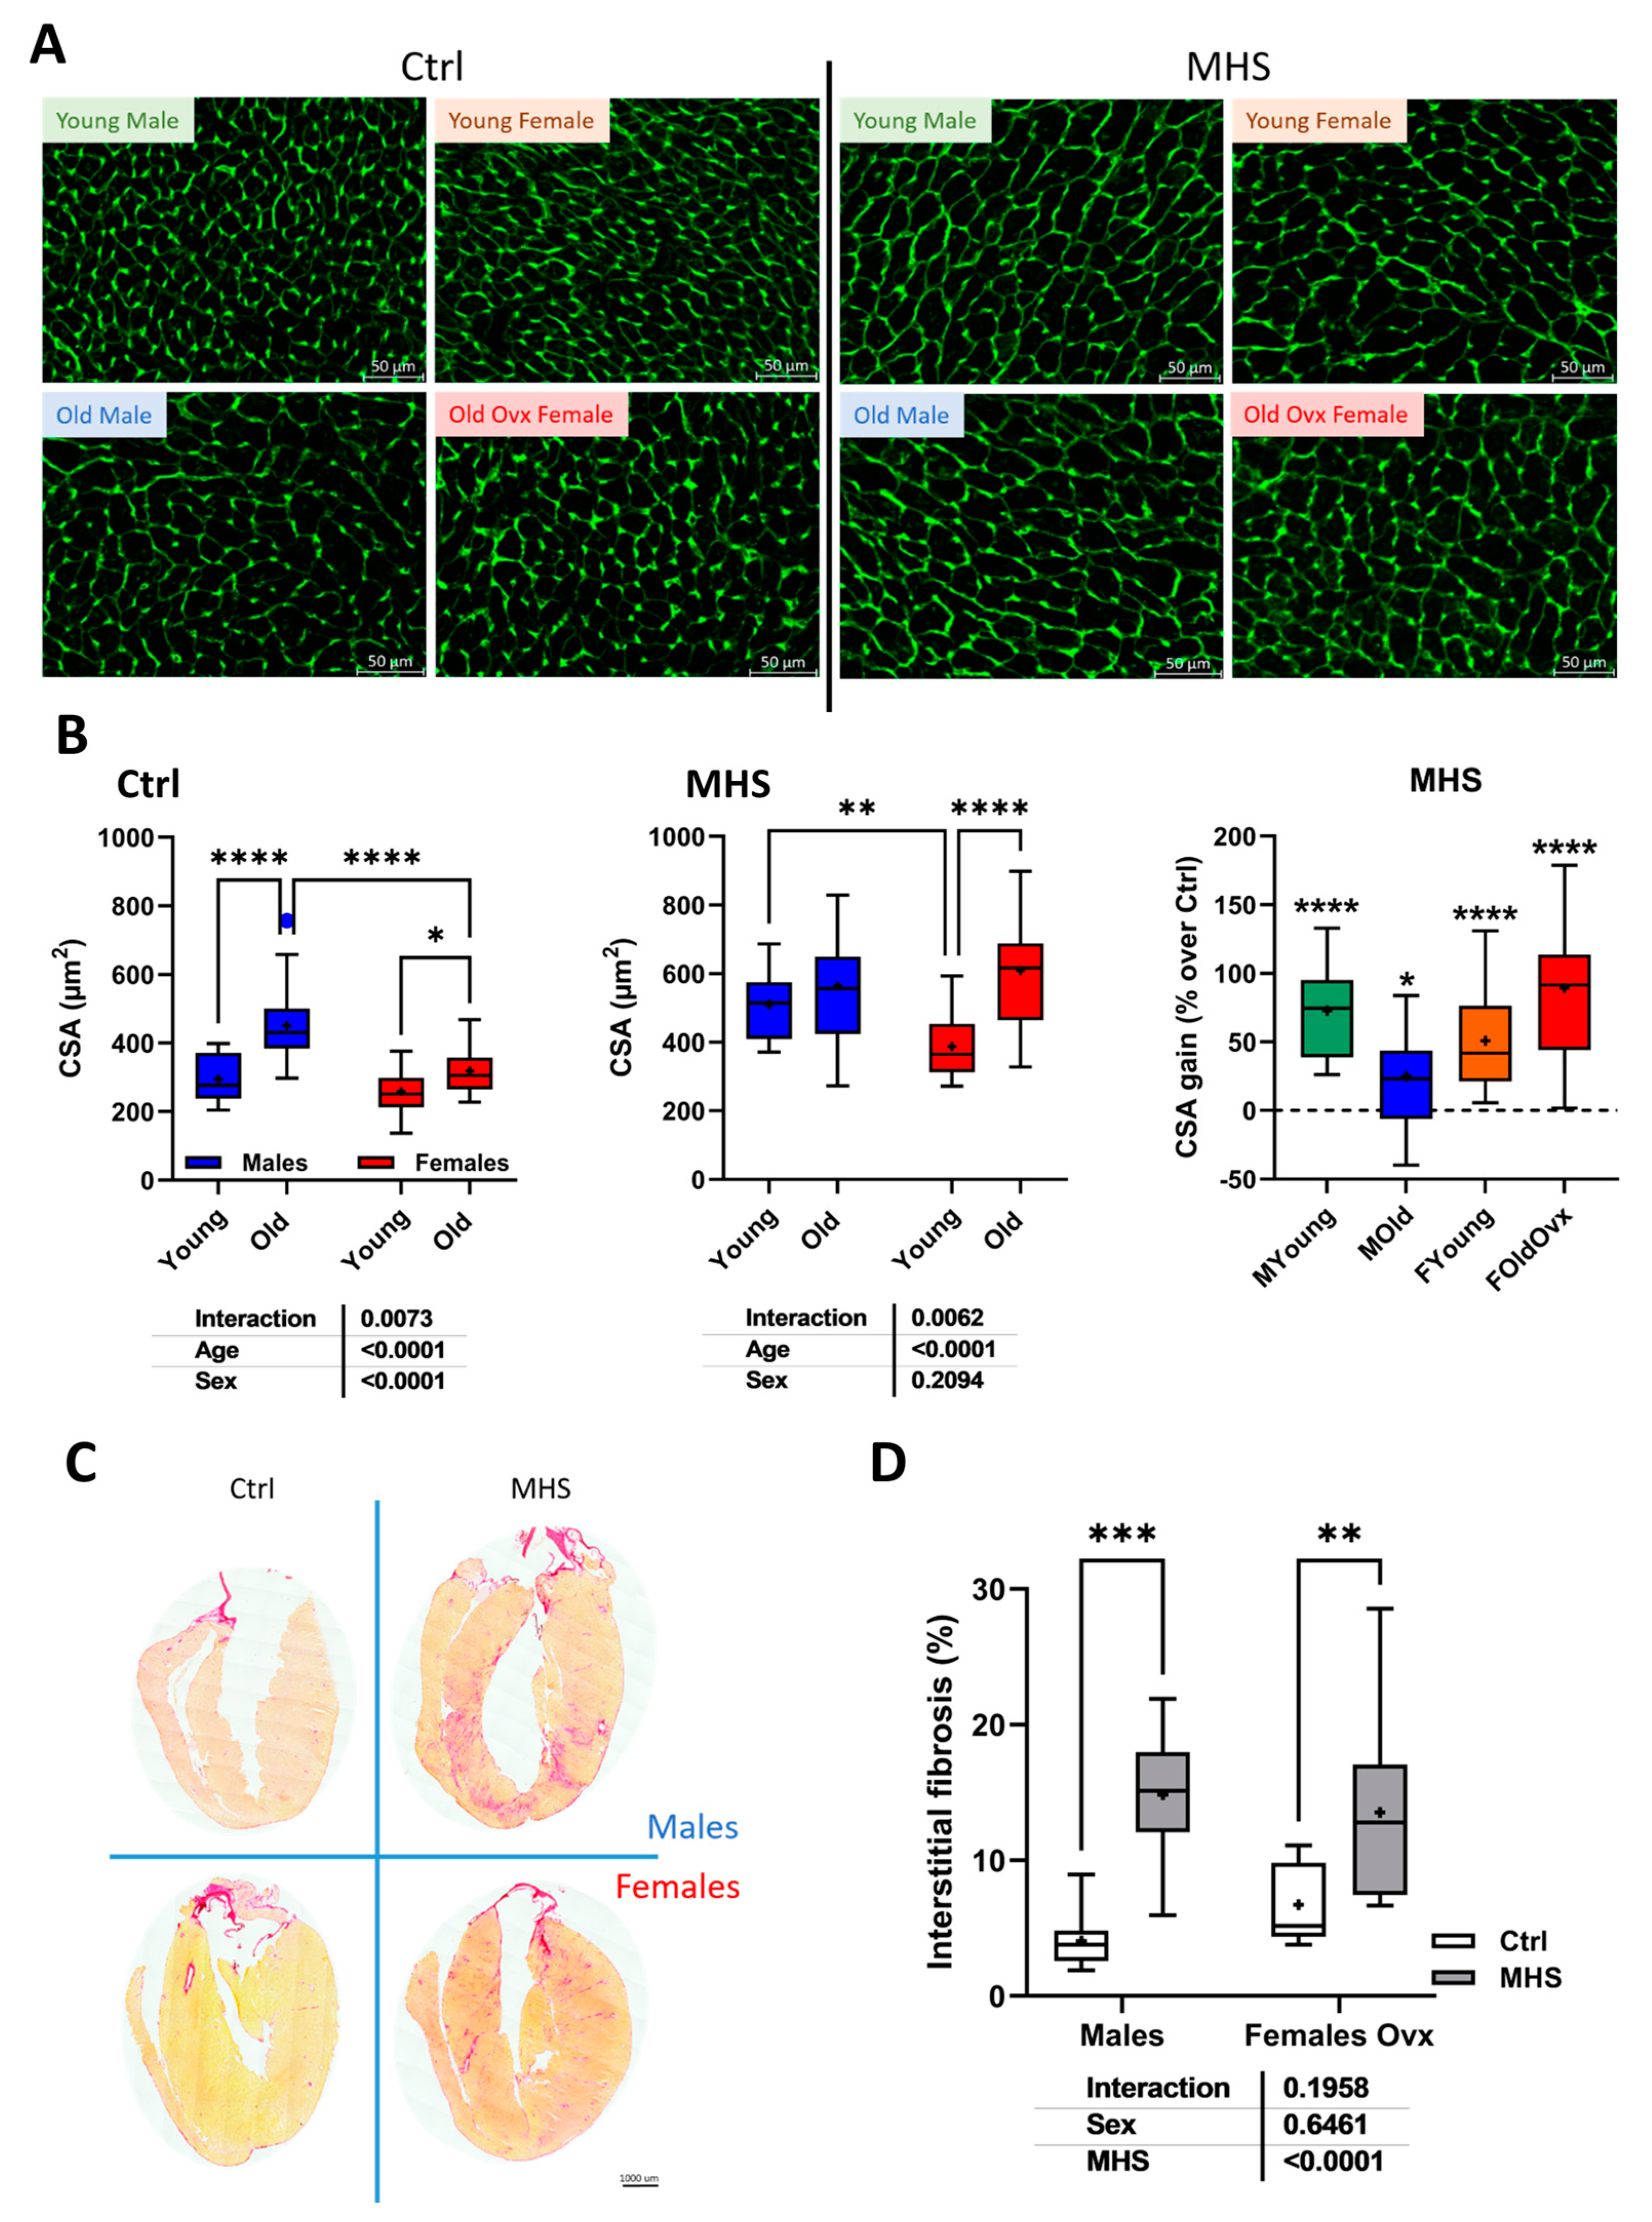
Figure 7.
Modulation of LV gene expression after MHS in young and old mice. A. Nppa, atrial natriuretic peptide. B. Nppb, brain natriuretic peptide. C. Col1a1, Collagen 1 α1, D. Col3a1, Collagen 3 α1, E. Postn, periostin and F. Tbsp4, thrombospondin 4. Data are represented as mean ± sem (n=7-8 per group). Two-way ANOVA followed by Holm-Sidak post-test. *: p<0.05, **: p<0.01, ***: p<0.001 and ****: p<0.0001 between indicated groups.
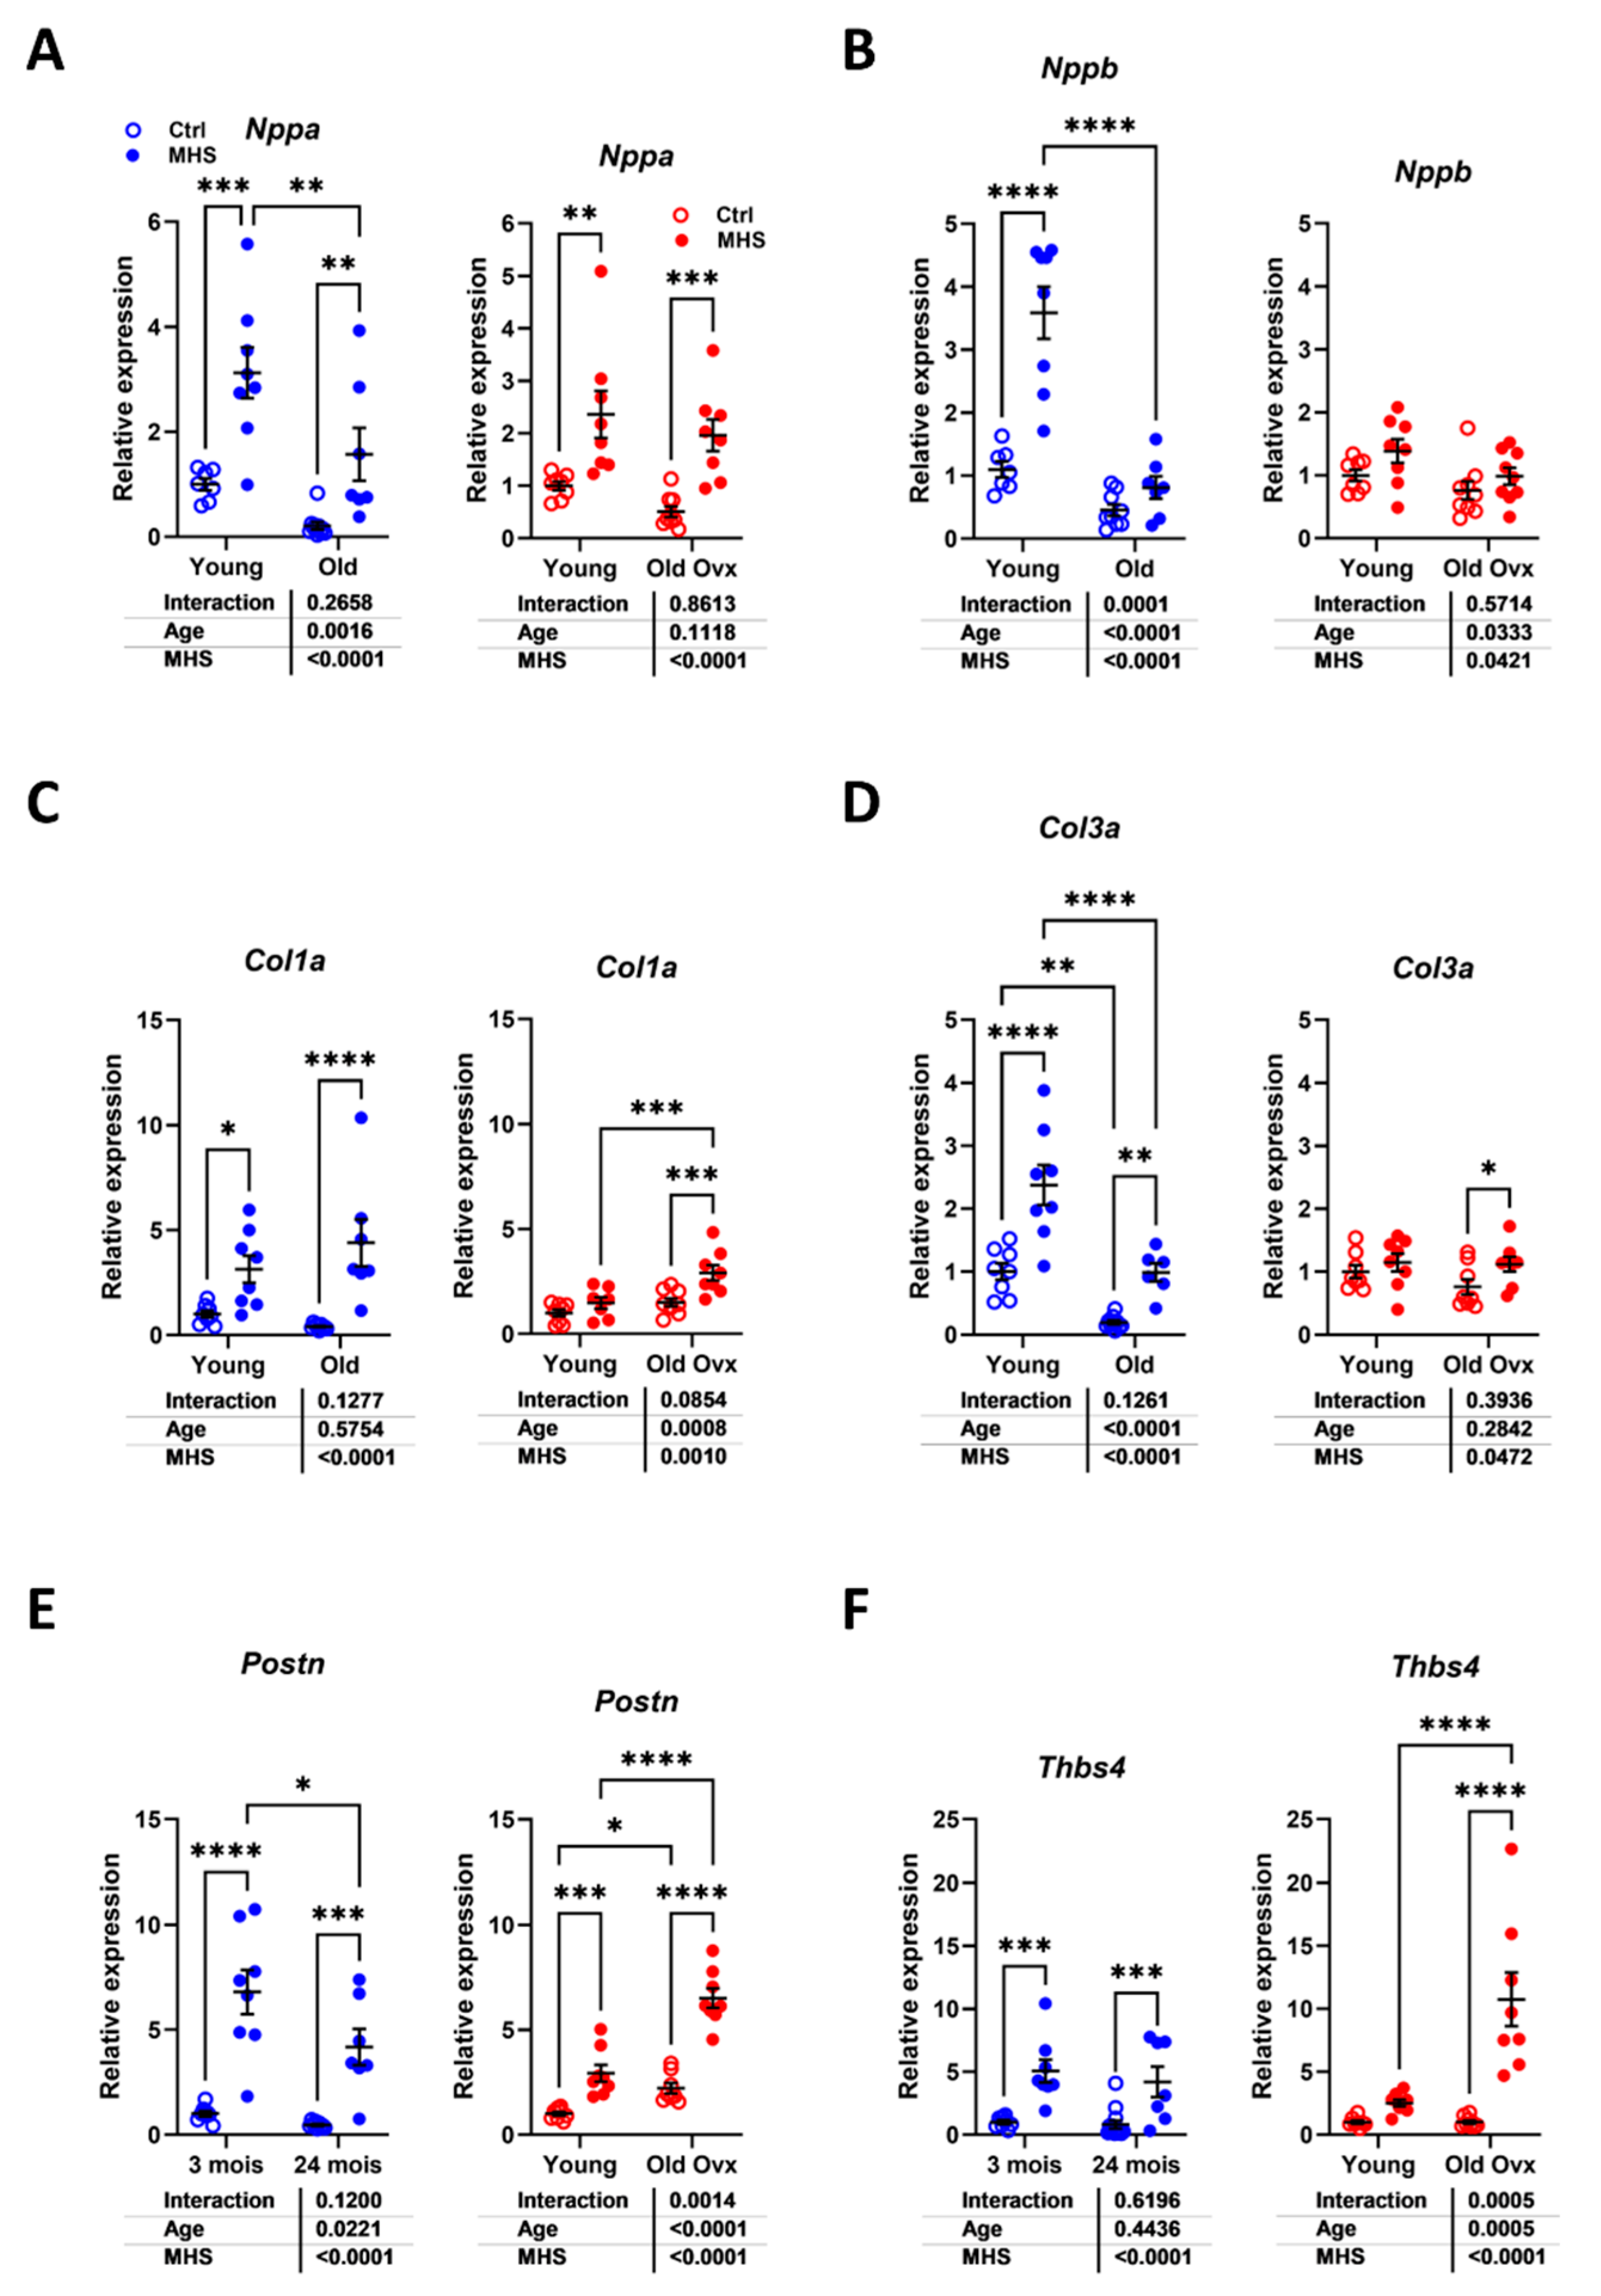
Figure 8.
The MHS inhibits myocardial energy metabolism via the inhibition of glucose utilization. A-D. Expression levels of various genes implicated in myocardial energy production. A. CD36/FAT, fatty acid transporter, B. Cpt1b, carnitine palmitoyl transferase 1b, C. Glut4, glucose transporter 4, D. Pdk4, pyruvate dehydrogenase kinase 4, E. Bdh1, 3-Hydroxybutyrate Dehydrogenase 1 and F. Ampkb1, AMP kinase b1. Protein content estimated by immunoblotting. G. PDK4, H. phospho-PDH (pyruvate dehydrogenase) and I. PDH. J. Representative blots of Pdk4, p-PDH, PDH, and GAPDH (Glyceraldehyde 3-phosphate dehydrogenase) content in young controls (CtrlY), young old controls (CtrlO) and old MHS. Two-way ANOVA followed by Holm-Sidak post-test. *: p<0.05, **: p<0.01, ***: p<0.001 and ****: p<0.0001 between indicated groups.
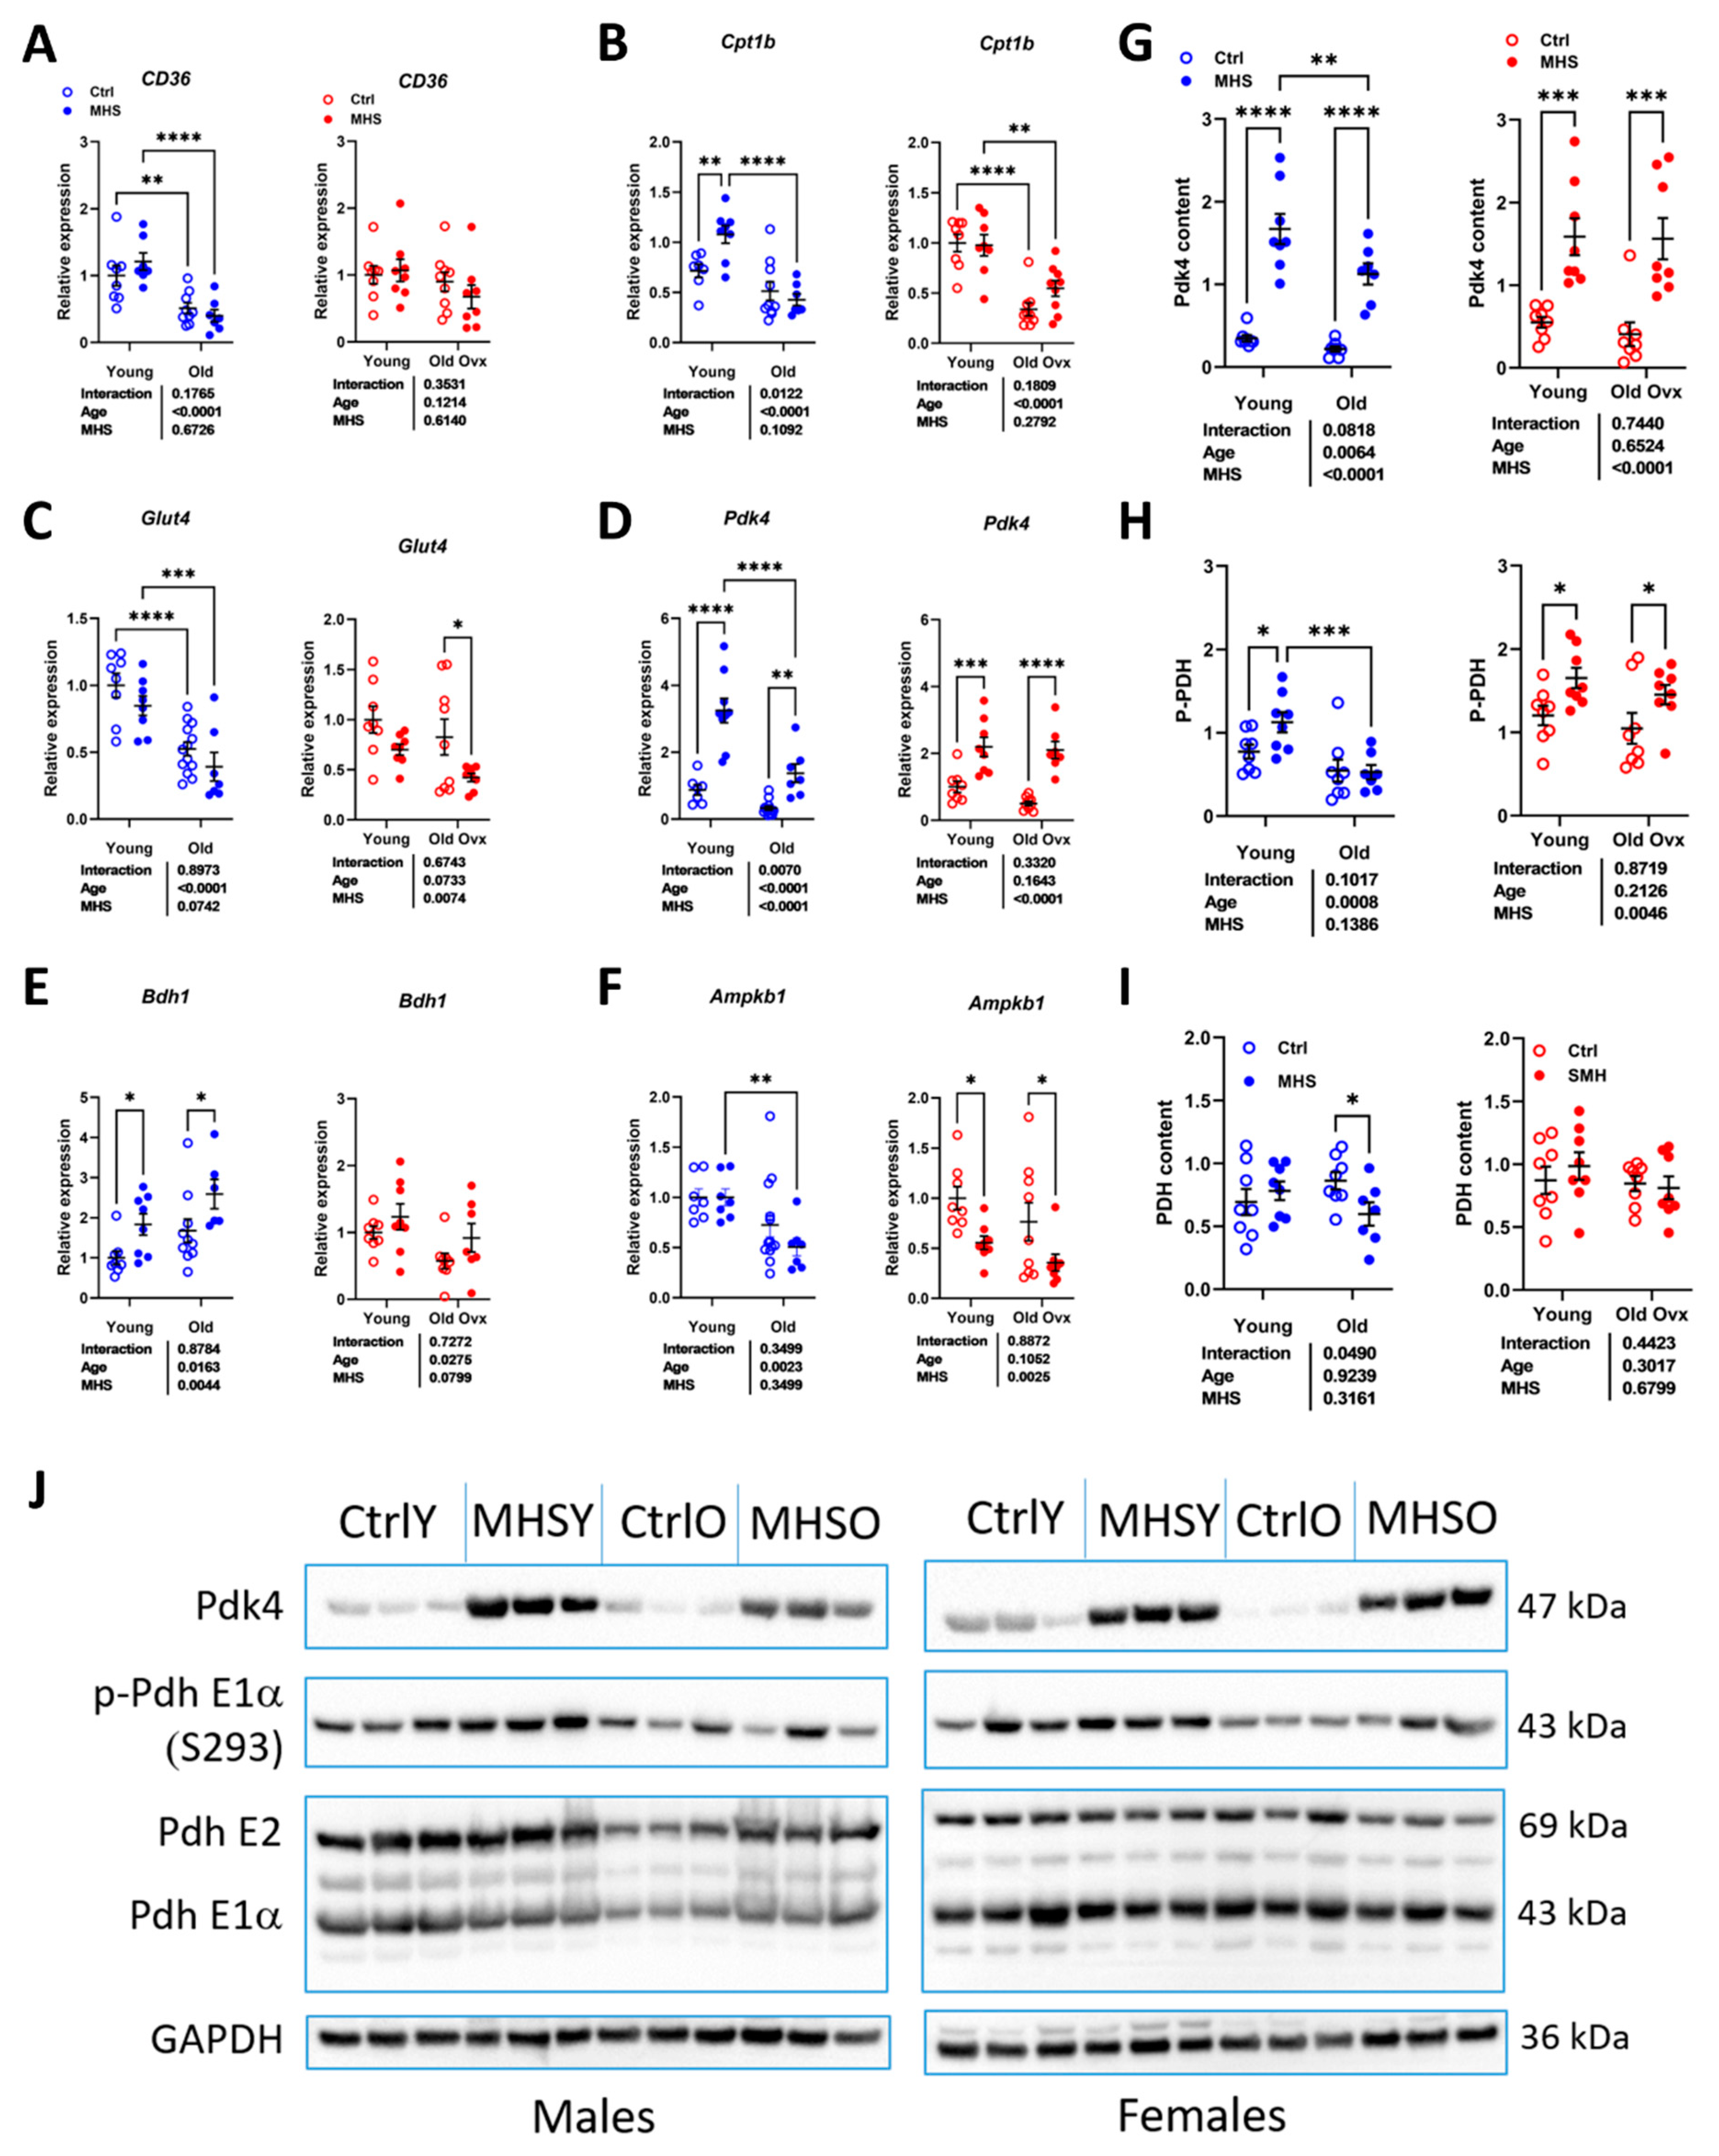
Figure 9.
Loss of gonadal hormones modulates the cardiac response to MHS in old mice of both sexes. A. Indexed heart weight and lung water weight (difference between wet and dry weight), B. Ejection fraction and end-diastolic LV volume (EDV). C. Nppa and Nppb LV mRNA levels. D. Col1a, Col3a Postn and Thbs4 LV mRNA levels. Two-way ANOVA followed by Holm-Sidak post-test. *: p<0.05, **: p<0.01, ***: p<0.001 and ****: p<0.0001 between indicated groups.
Disclaimer/Publisher’s Note: The statements, opinions and data contained in all publications are solely those of the individual author(s) and contributor(s) and not of MDPI and/or the editor(s). MDPI and/or the editor(s) disclaim responsibility for any injury to people or property resulting from any ideas, methods, instructions or products referred to in the content. |
© 2025 by the authors. Licensee MDPI, Basel, Switzerland. This article is an open access article distributed under the terms and conditions of the Creative Commons Attribution (CC BY) license (http://creativecommons.org/licenses/by/4.0/).
Copyright: This open access article is published under a Creative Commons CC BY 4.0 license, which permit the free download, distribution, and reuse, provided that the author and preprint are cited in any reuse.


