Submitted:
02 May 2025
Posted:
06 May 2025
You are already at the latest version
Abstract
Stiffness parameters are very important and effective in the constitutive models used in finite element analysis. It is not easy and common to obtain these parameters in the laboratory. However, even if the modulus is determined in the small and medium deformation range, there is a need to make transitions in both static and dynamic parameters. In almost all studies, the Alpan approach is used for the relationship between static and dynamic moduli of elasticity. Therefore, a better understanding of this approach is required. In this study, the relationship between static and dynamic stiffness was determined by monotonic triaxial and resonant column tests on five different sand samples with different relative stiffness and grain distributions and the results were compared with Alpan's approach. The initial or maximum modulus of elasticity (E₀), secant modulus of elasticity (E₅₀) and derived reloading modulus (Eur) are considered as static stiffness parameters assuming Estat = Rsec × E₅₀. The dynamic modulus of elasticity (Edyn) was calculated using the small deformation shear modulus (G₀) obtained from resonant column experiments and assuming Poisson's ratio (ν= 0.2, 0.3, 0.4). The Edyn/Estat ratio was compared with Alpan's empirical approach and also evaluated with the data of other researchers who have studied the same topic. Comparing the results with the Alpan approach, it was observed that the best agreement for the dynamic and static stiffness ratio in the sand specimens in this study was obtained with v=0.2 and Rsec =2-3.
Keywords:
stiffness
; dynamic and static elastic modulus
; Alpan’s approach
; resonant column test
; monotonic triaxial test
1. Introduction
In recent years, modeling of problems with complex geometries and challenging soil conditions has become widely used by engineers and researchers due to significant advances in numerical tools and computational technologies. A major challenge in numerical modeling is the determination of parameters related to the stress-strain behavior of soils affected by both static and dynamic loading conditions. Soils under geotechnical applications such as foundations and embankment structures are subjected to a relatively slow loading rate. The stress-strain behavior of such soils can be described by the static elasticity modulus (ES) (Jiang, 2019). On the other hand, the behavior of soils under cyclic and dynamic loading such as earthquakes, winds, explosions, and machine vibrations can be represented and modeled by the dynamic modulus of elasticity (Edyn), which is considered as a fundamental parameter in geotechnical engineering applications (Liu et al., 2022).
The decrease in stiffness of sandy soils with increasing deformation levels has been extensively investigated and clarified by numerous researchers using both monotonic and cyclic experiments (Alarcon-Guzman et al., 1989; Chung et al, 1984; Clayton, 2011; El Mohtar et al, 2013; Hardin & Drnevich, 1972; Iwasaki et al, 1978; Jafarzadeh & Sadeghi, 2012; Kokusho, 1980; Lanzo et al, 1997; D. Lo Presti et al, 1993; Lo Presti et al, 1997; Vucetic, 1994; Wichtmann & Triantafyllidis, 2013; Zhang et al, 2005).
In geotechnical engineering applications, strain levels usually range from small to medium (ε=10-⁵-10-³%). Large deformation problems (ε ≥ 10-³%) are usually caused by seismic events such as liquefaction and lateral spreading, and such cases are controlled by both stiffness and strength parameters.
At very small deformation levels (γ ≤ 10-⁵ %), where the elastic behavior remains essentially constant, the modulus is defined as the initial shear modulus (G₀-Gₘaₓ) or "dynamic" stiffness, whether obtained by laboratory tests or by measurement or calculation by seismic in-situ methods. In contrast, the "static" stiffness is derived from the initial loading curve of oedometer or monotonic triaxial tests. Although the initial difference between static and dynamic stiffness was initially attributed to the difference in loading rates, later studies have shown that these differences are mainly determined by the deformation levels. The effect of drainage conditions on the stiffness of sandy soils at small to moderate deformations is another important issue that needs to be clarified.
Another factor affecting the initial stiffness of sandy soils and its decrease with deformation is the drainage conditions during loading. It is well documented in the literature that the stiffness decreases faster due to the decrease in the effective stress as a result of the additional pore water pressure caused by shear and axial deformations (Chen et al., 2008; Fjær, 2009; He et al., 2012; Wang et al., 2023). Several studies, especially focusing on water-saturated sands, have shown that changes in drainage conditions lead to an initial softening due to cyclic stress effects and liquefaction at larger deformation levels (Johan et al., 2022; Li et al., 2024). Studies conducted by Konstadinou & Georgiannou (2013) and Georgiannou & Tsomokos (2008) on different sands revealed that the stiffness of drained specimens in cyclic triaxial compression tests (CTX) decreased at larger deformation levels compared to undrained specimens. However, in monotonically loaded triaxial tests (MTX), the difference in stiffness reduction between the drained and undrained cases was reported to be negligible.
Since the introduction of the finite element method (FEM) and the finite difference method (FDM) on computers, numerical codes have evolved significantly. These advances have made it possible to build more complex and accurate constitutive models that require many parameters to accurately describe the stress-strain behavior of soils. In particular, the determination of parameters such as the initial shear modulus (G₀), the unloading-reloading modulus of elasticity (Eur) and the secant modulus of elasticity (E₅₀) is necessary to determine the modulus reduction behavior of soils under dynamic loading conditions. When dealing with static problems with slower deformation rates, Young's modulus (E), oedometric modulus (Eoed) and secant modulus are critical in modeling the compressibility and deformation properties of soils (Bentley, 2025; Benz, 2007).
By the 1970s, a comprehensive experimental database of various soil types had been established in the literature, thanks to the more consistent results of monotonic experiments performed under stress or deformation control. However, the acquisition of dynamic parameters was very limited in this period. To overcome this deficiency, Alpan (1970) proposed an empirical relationship derived from the solution of a differential equation subject to boundary conditions and thus successfully introduced the concept of dynamic-static modulus ratio into the principles of soil mechanics. This concept is still widely accepted and applied by researchers and engineers today. This relationship allows a direct transition between Edyn/Estat and Estat.
The concepts of static and dynamic rigidity were first introduced in the context of the rheological model by Alpan (1970). In the Kelvin-Voigt (Kelvin, 1865; Voigt, 1892) rigid body considered by Alpan, the static stiffness is defined as a ratio of constant normal stress, s0, time dependent axial strains ε(t) as presented in Eqn. (1).
Where Tret, denotes the retardation time of the force applied in rheologic model, the E represents the modulus of elasticity for the springs within model; and t refers to the duration of the static test. In this context, the value of E is employed in the static elasticity formula. The Tret, reflecting the nature of loading in saturated soils, can be associated with the dissipation time of excess pore water pressure. It may be interpreted as the characteristic duration over which the stress induced by dynamic or static loading is transferred to the soil skeleton. When the applied stress and deformation in a dynamic experiment are considered as a periodic function, as illustrated in Eqn. (2):
Here; ω is angular frequency, φ is the phase angle. For the dynamic loading states, the Kelvin-Voigt rigid body exhibits dynamic stiffness influenced by the periods (T) of cyclic loading, given Eqn. (3).
Where and denotes the vibration period of dynamic stress. Consequently, the ratio between dynamic to static stiffness can be explained in Eqn. (4):
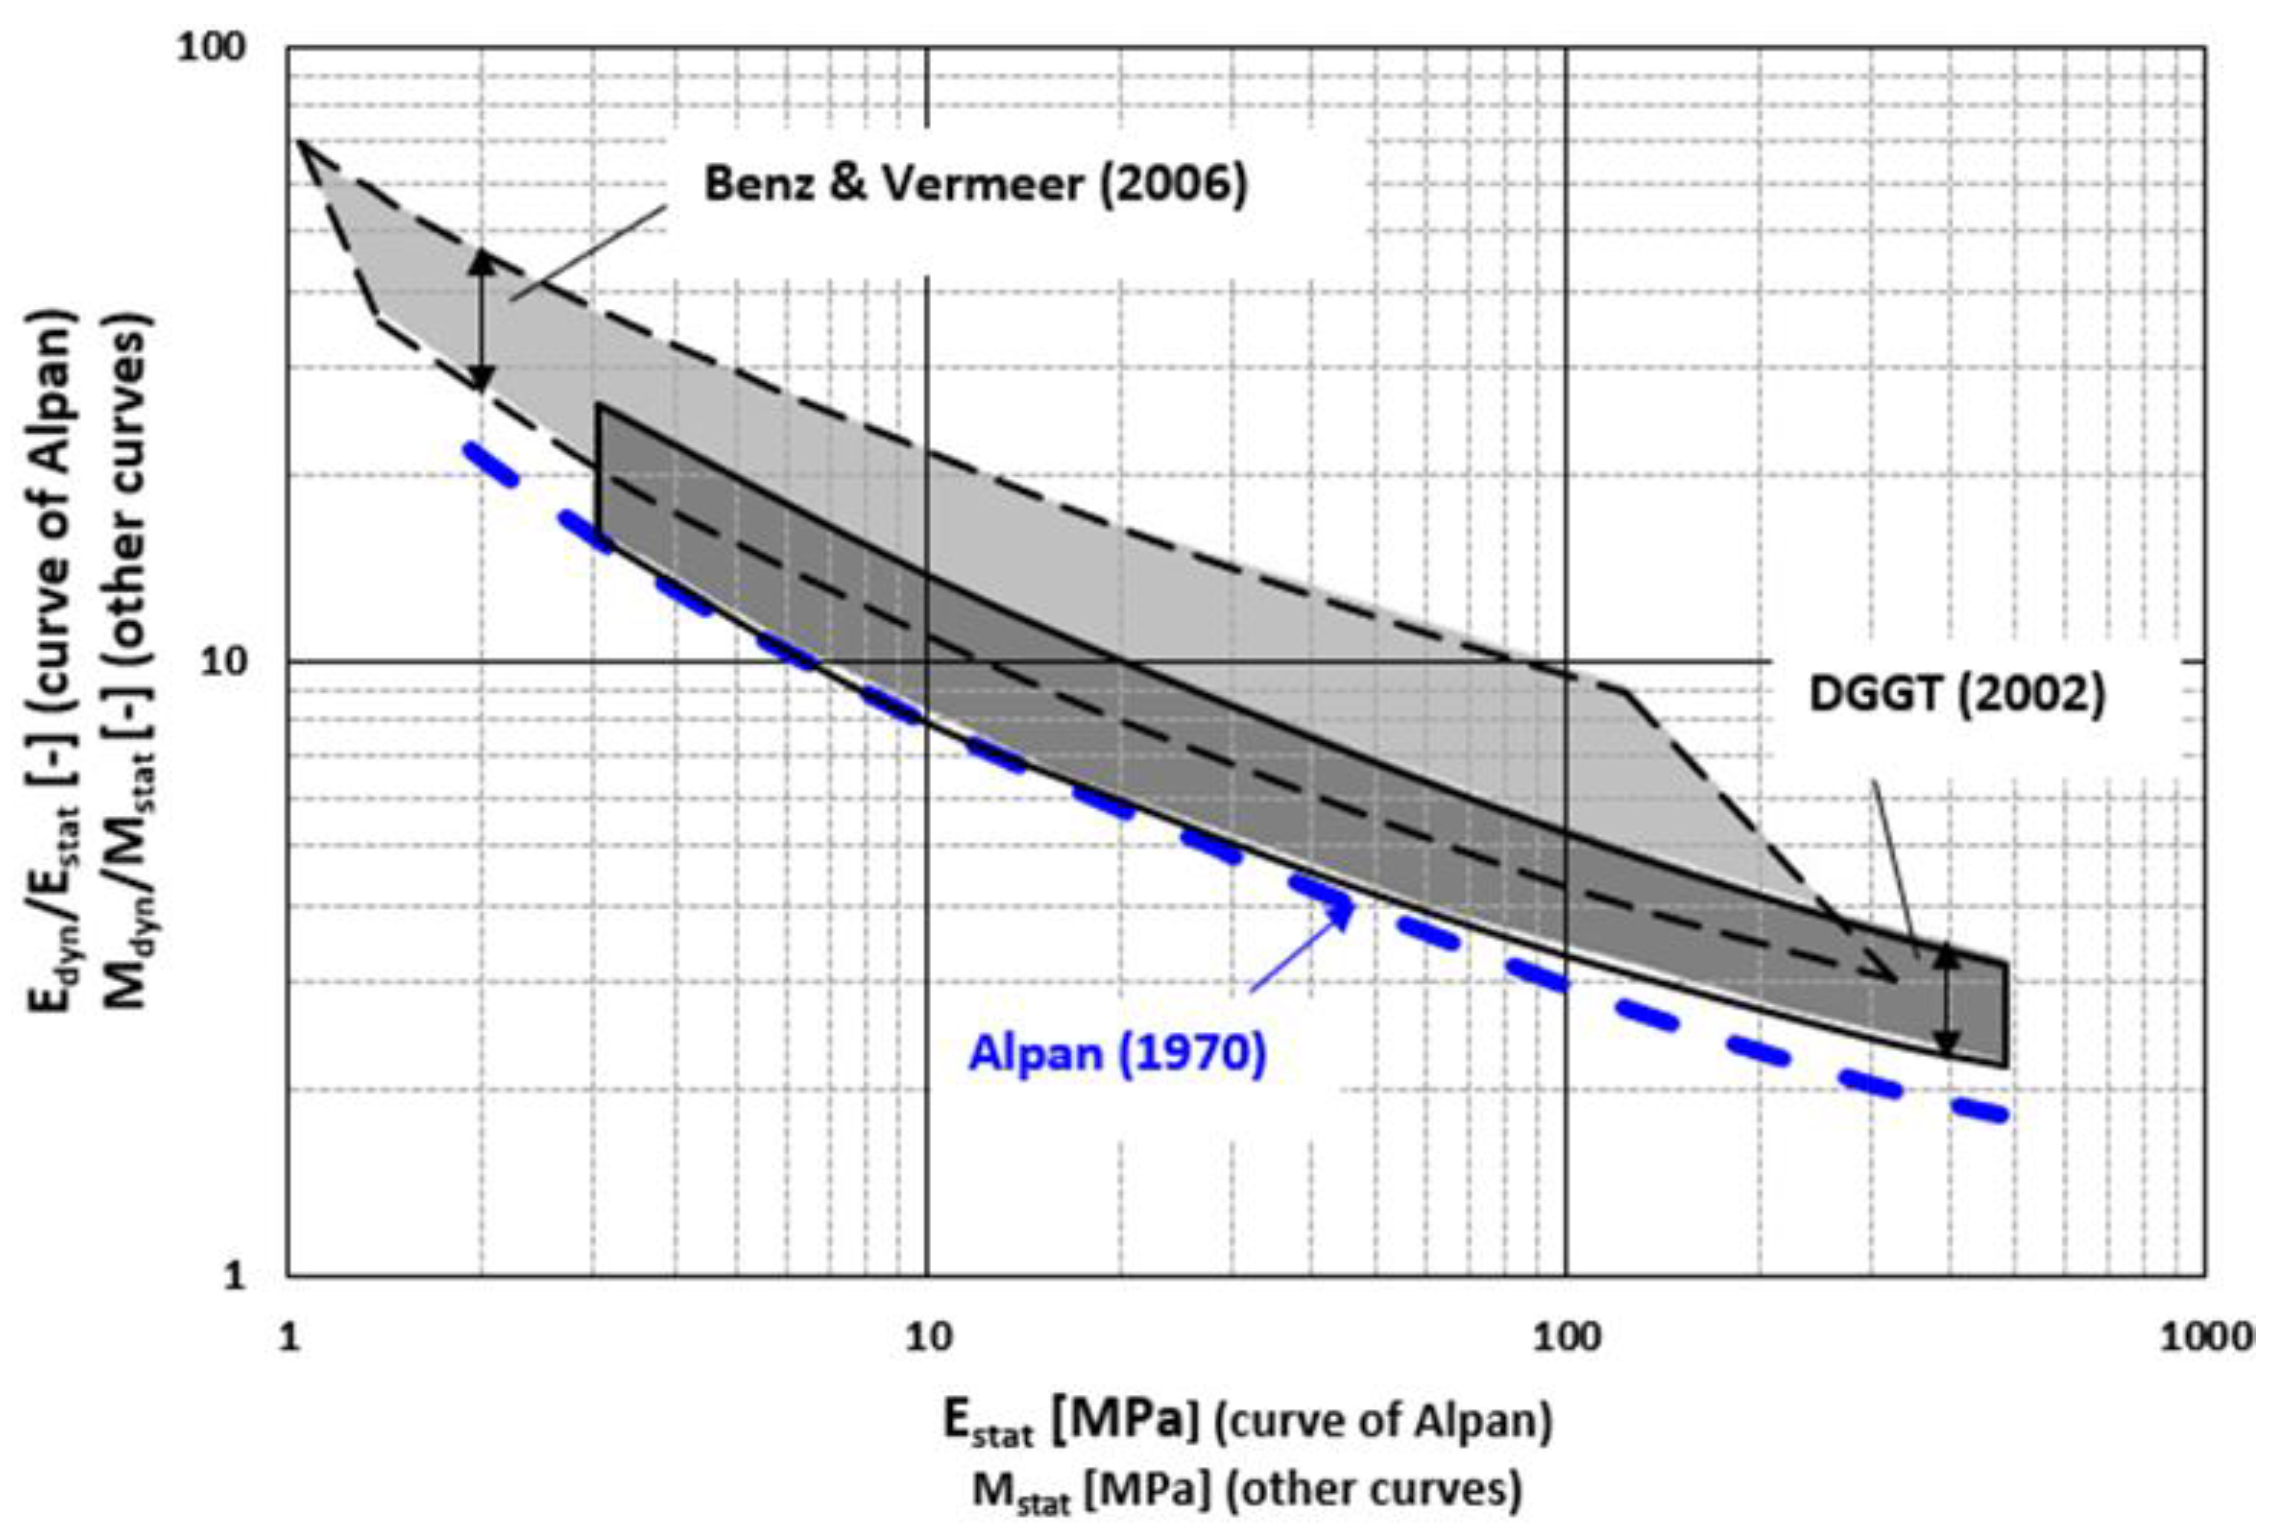
Although there are uncertainties regarding the applicability of the empirical correlations derived from these relationships (Figure 1) in terms of soil type, index properties and stress conditions, the experimental program carried out covers sands with different firmness (loose and tight) and uniformity under different environmental stresses.
Similar to the Alpan’s (1970) concept, German Geotechnical Society (DGGT) proposed a correlation between modulus ratio and static modulus retrieved from oedometer test results (des Arbeitskreises, 2002). The relationship between dynamic and static modulus is explained by comparing the measured constraint modulus (Mdyn for dynamic constraint modulus, Mstat for static constraint modulus). Following Alpan (1970), Benz & Vermeer (2006) proposed the correlation illustrating the relationship between static and dynamic modulus in the "Recommendations of the Soil Dynamics Working Committee" of the DGGT. The correlation between dynamic and static moduli is expressed in terms of the oedometer modulus for one-dimensional compression (zero lateral deformation), with Mstat = Moedo. Benz and Vermeer (2006) further contributed to the DGGT findings by expanding the ES range from approximately 1 MPa to 300 MPa, while the dynamic to static ratio increases significantly according to DGGT (Fig. 1). It can be observed that Alpan's proposal exhibits limitations in estimating the modulus ratio (Edyn/Estat) when compared to the curves presented by both DGGT (2002) and Benz and Vermeer (2006).
Figure 1.
The comparison of the relationships proposed by Alpan (1970), DGGT (2002) and Benz & Vermeer (2006) (adopted from Wichtmann & Triantafyllidis, 2009).
Figure 1.
The comparison of the relationships proposed by Alpan (1970), DGGT (2002) and Benz & Vermeer (2006) (adopted from Wichtmann & Triantafyllidis, 2009).
This paper presents the results of a comprehensive experimental study aimed at assessing the small to medium strain stiffness parameters of the different types of sands. The experimental outcomes of five different types of sandy soils are evaluated and analyzed in conjunction with the Alpan concept. To achieve this, the index and classification properties of the sandy specimens were determined. Subsequently, the relative density of the specimens was defined in accordance with traditional density classifications, ranging from medium dense to dense. The specimens were subjected to both monotonic compression in static tests (MTX) and high-frequency vibration in resonant column tests (RCT).
The initial Young's modulus (E0) for small strain and the secant modulus (E50) for medium to large strain, as observed in MTX, were compared with RCT test results, assuming different Poisson's ratios (n=0.2, 0.3, and 0.4). The test results are also discussed with the findings Wichtmann & Triantafyllidis (2009) and it could be concluded that the findings of the experimental part of this study have a good agreement with both the Wichtmann & Triantafyllidis (2009) and Alpan’s concept if the secant modulus values measured in MTX, are multiplied by 3. This research provides a detailed geotechnical database that add new experimental evidence about the mechanical behaviour of sandy soils, highlighting the relationships of small-to-medium strain stiffness for tested sands.
2. Materials and Testing Methods
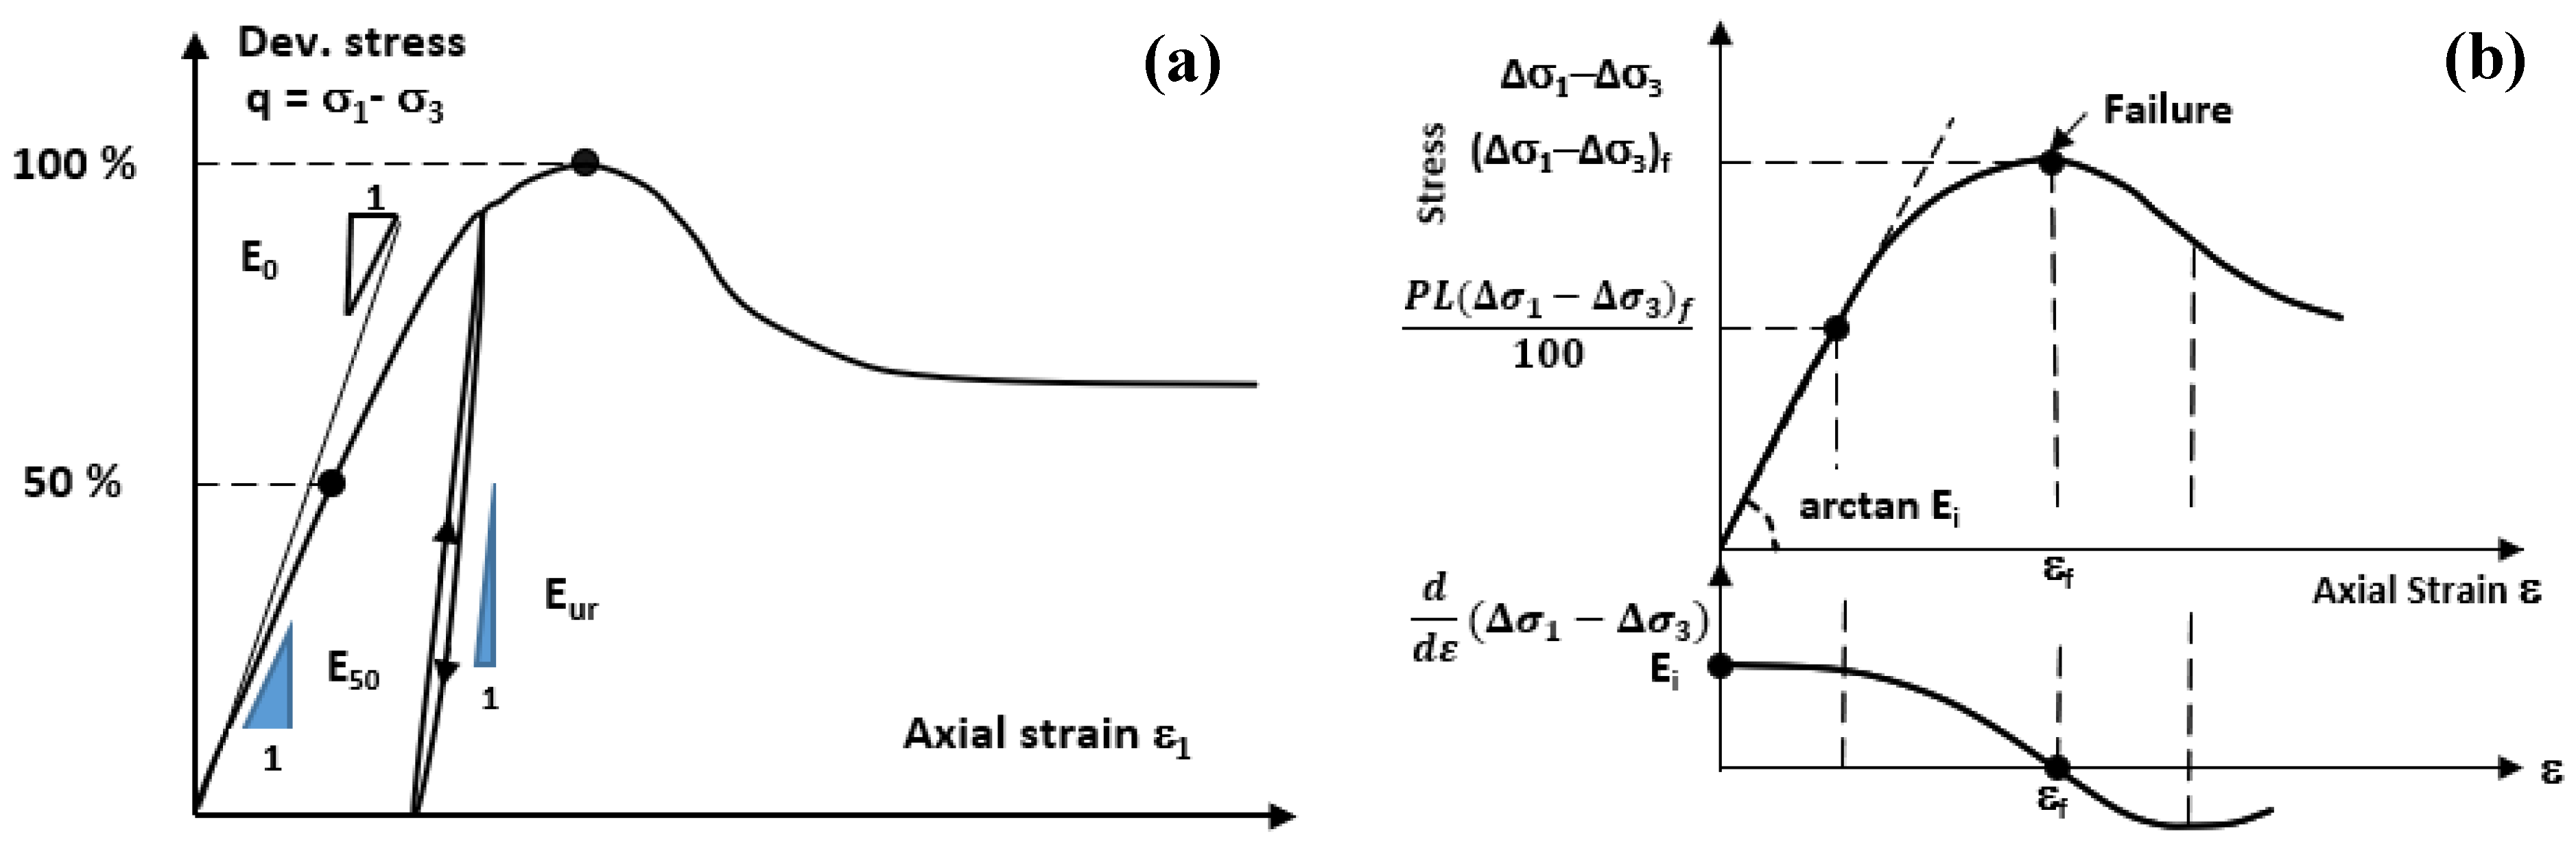
In this study, special emphasis was placed on defining the static stiffness of the tested soils in accordance with the conceptual framework proposed by Alpan (1970). As shown in Figure 2(b), the slope of the initial linear portion of the stress-strain curve is used as the tangent stiffness (denoted as Ei). However, in widely accepted constitutive model relations, such as HSSmall, the concept of static stiffness introduced by Alpan is related to the unloading/loading stiffness (Eur) and this relationship is defined in Eqn(5) (Bentley, 2025).
Here Rsec is the ratio between the secant modulus (E50) and the initial modulus (E0) and is suggested as 3 by Bentley (2025). In the monotonic triaxial experiments conducted in this study, Eur could not be measured reliably. Instead, the values of E₀ and E₅₀ shown in Figure 2(a) were used as representative static stiffness parameters of the soil.
Figure 2.
a) Scheme of a curve q(ε) in a monotonic triaxial test with an unloading-reloading cycle, definition of E0, E50 and Eur b) Definition of the tangent elastic modulus Ei according to (Alpan, 1970).
Figure 2.
a) Scheme of a curve q(ε) in a monotonic triaxial test with an unloading-reloading cycle, definition of E0, E50 and Eur b) Definition of the tangent elastic modulus Ei according to (Alpan, 1970).
The clayey sand and silty sand specimens (S1 to S4) collected from the city center of Çanakkale consist of sediments deposited by the Sarıçay Stream during the prehistoric period. These sandy specimens were obtained as part of a geotechnical exploration conducted within a research project funded by TÜBİTAK (Oztoprak et al., 2021), aiming to investigate basin edge effects in Çanakkale. The sampling site is located at 40°09'19"N, 26°24'47"E. The depth from which the specimens were retrieved ranges between 3 and 14 meters, primarily determined through standard penetration tests (SPT). Additionally, geophysical measurements using the multichannel analysis of surface waves (MASW) method were conducted to estimate the in situ relative density and to define the confining stress levels to be applied during laboratory testing.
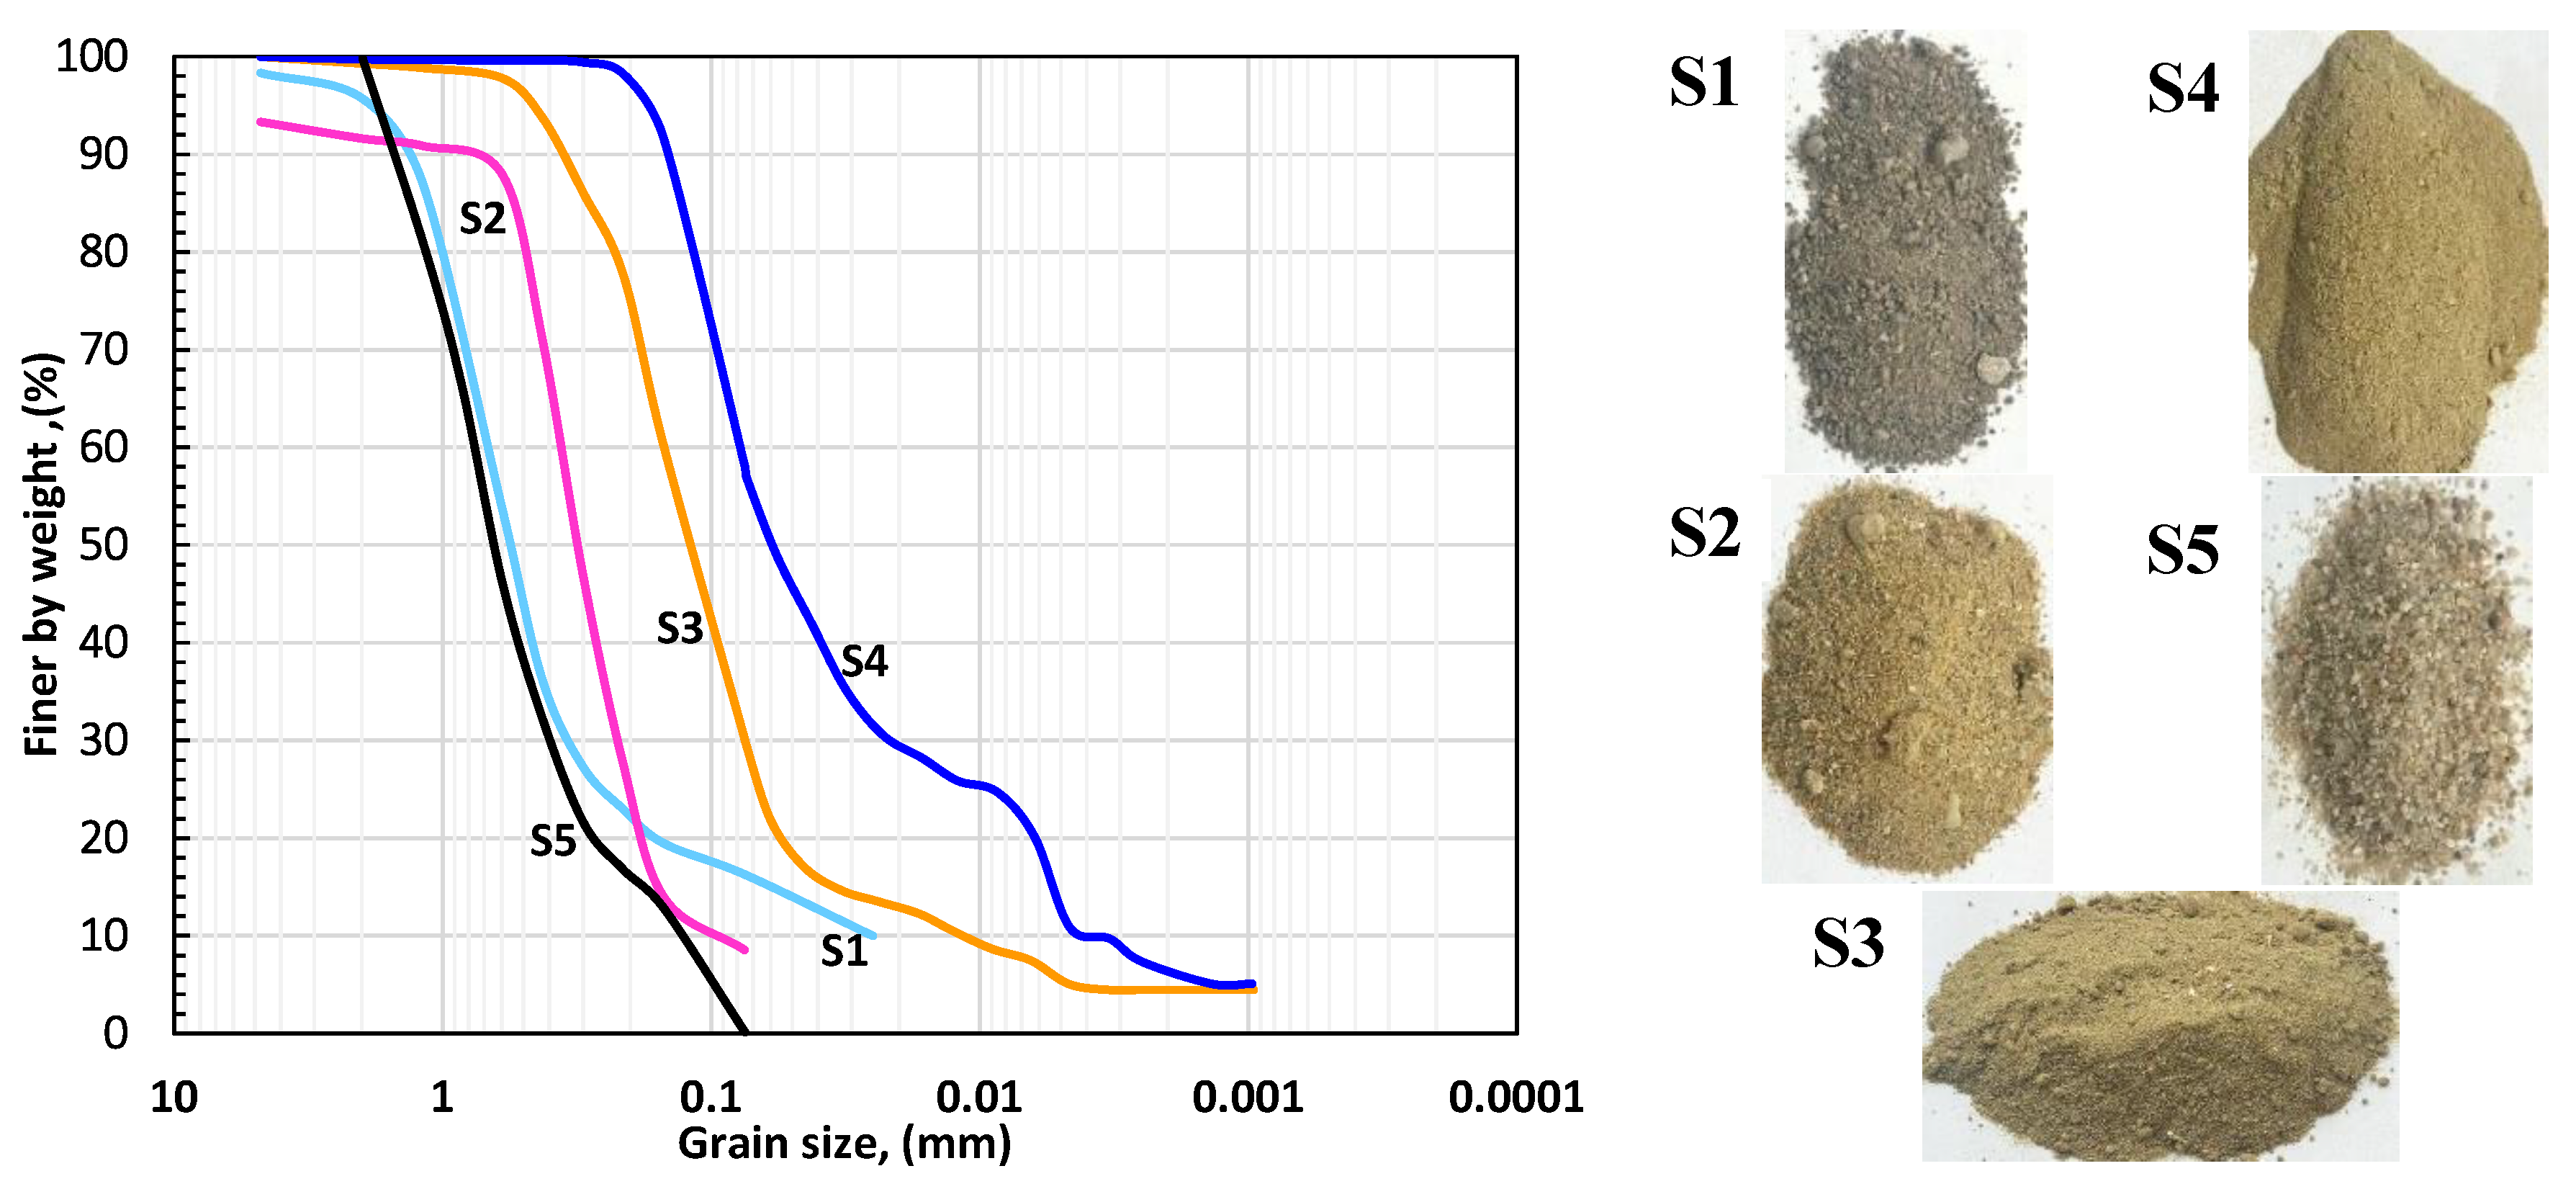
Furthermore, a commercially standardized clean sand specimen (S5), as defined by EN 196-1 (CEN, 1994), was examined to expand the variety of sand types under consideration. For this sand, two distinct relative density values were established, corresponding to medium and dense states. The index properties of the soils were determined in accordance with relevant ASTM standards (ASTM, 2004, 2006) and are summarized in Table 1. The granulometry curves derived from sieve analysis are also presented in Figure 3, with accompanying legend photographs included.
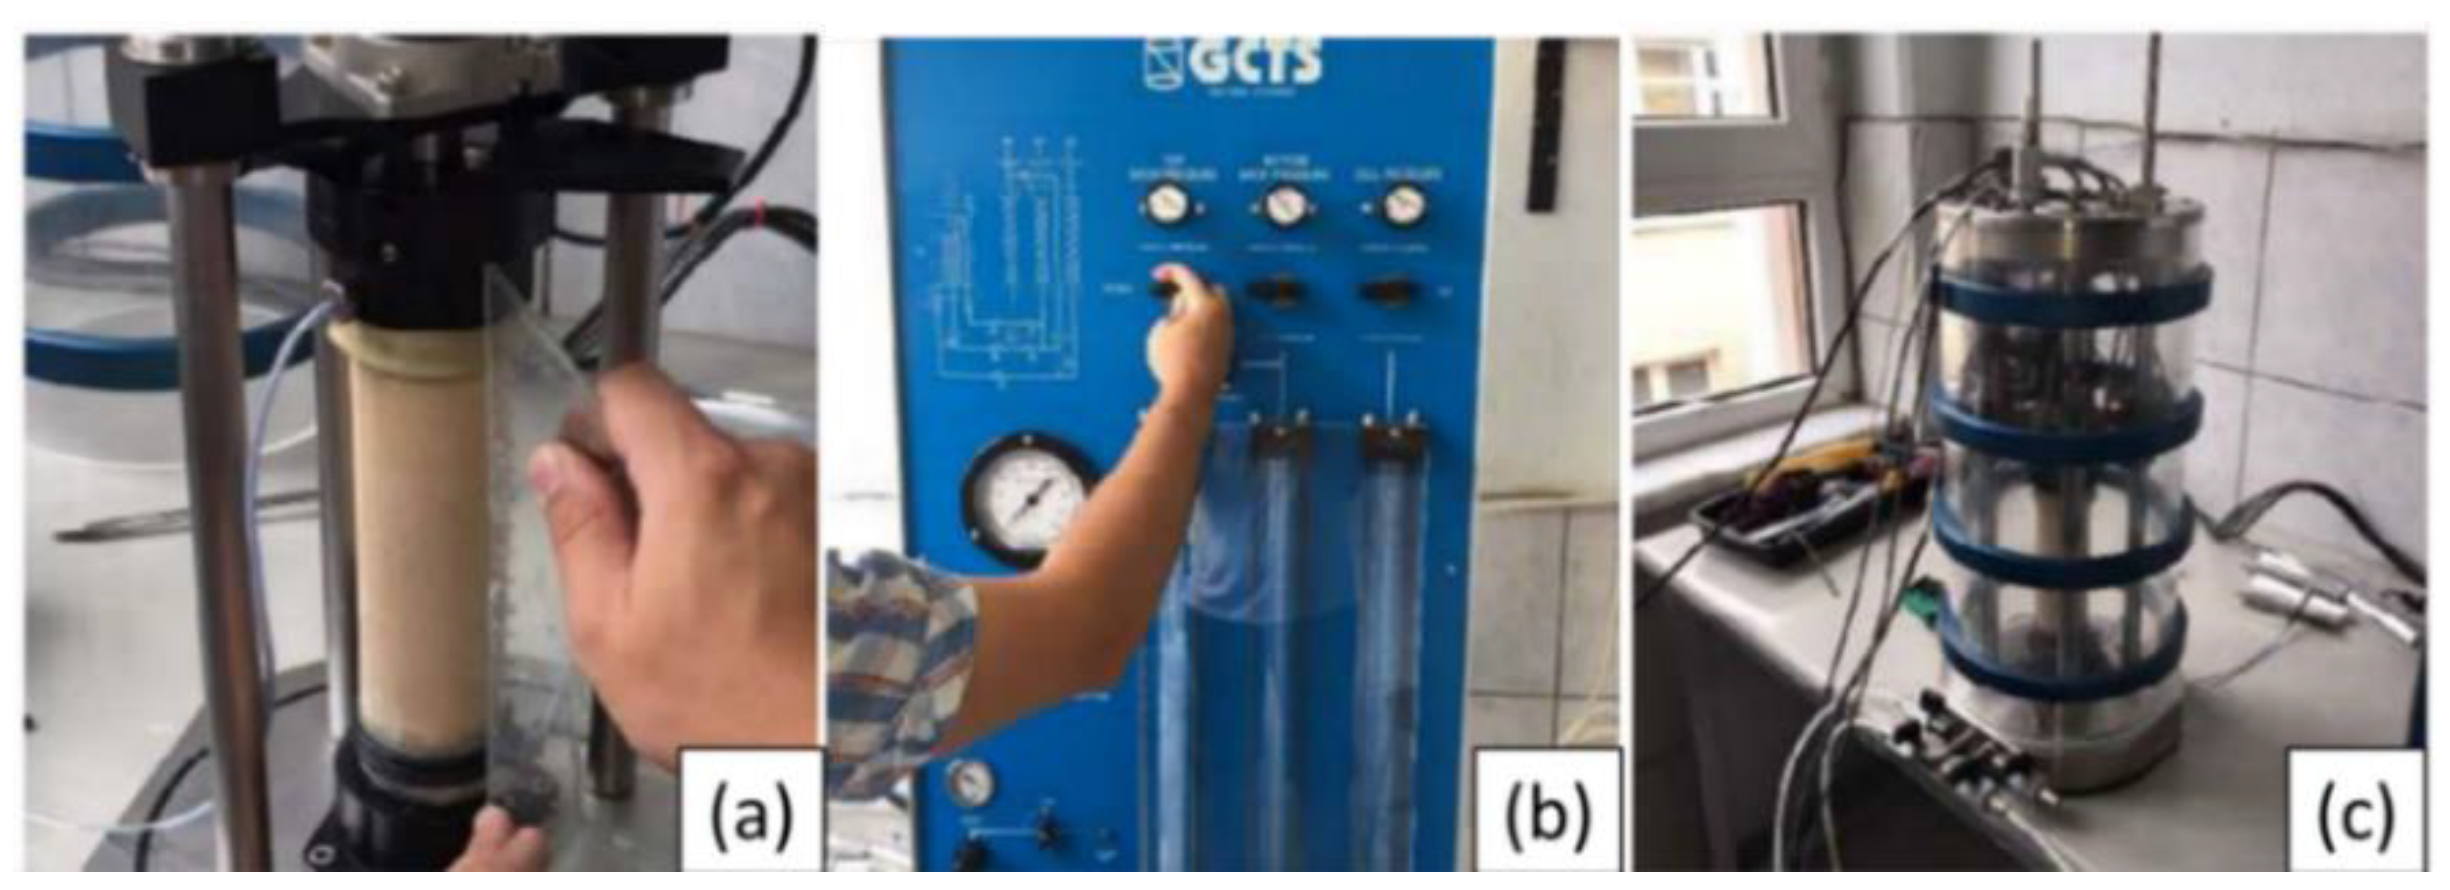
Specimens with a diameter of 50 mm and a height of 100 mm as presented Fig. 5(a) were prepared using the dry deposition method to achieve the target relative density specified in Table 2 for both monotonic triaxial (MTX) and resonant column (RC) tests. To prevent the dispersion of the sandy specimens, a vacuum pressure ranging from 10 to 30 kPa was applied to the samples via the pipe at the top cap prior to the application of confining stress (refer to Fig. 4(a)-(b)). Subsequently, the samples were isotropically consolidated at the mean principal stress indicated in Table 2.
Figure 3.
Tested grain size distribution curves.
The RC tests employ a pneumatic stress-controlled system, which utilizes an electric motor to generate shear strain (torsion) at the specimen's top cap. The RC test is based on the theory of the wave propagation of prismatic bars. The testing apparatus not only automatically applies the necessary confining pressure (σ3) via the control panel depicted in Fig. 5(b) but also independently measures and records shear stress (τ) and strain (γ) at the specimen's top cap, as shown in Fig. 5(c). The resonant frequencies of the excited torque range from 60 to 160 Hz for fine sands (S1 to S4) and from 80 to 180 Hz for clean sand.
In the MTX tests, the hydraulic system was employed to apply σ3 isotropically, as illustrated in Fig 4 (c). To ensure the acquisition of precise stress-strain curves during the tests, a minimum rate of 0.05 mm/min was selected at shearing stage, owing to the data reading capabilities of the S-type load cell in the apparatus. The tests were conducted until an axial strain of 15% was achieved (Fig 4(d)). Table 2 presents the initial conditions and testing program for both types of tests, as well as the measured modulus values obtained from each test.
Figure 4.
MTX test equipment: a) ve b) Placing the specimen with the vacuum c) applying cell pressure and shearing; d) specimen at the end of test.
Figure 4.
MTX test equipment: a) ve b) Placing the specimen with the vacuum c) applying cell pressure and shearing; d) specimen at the end of test.
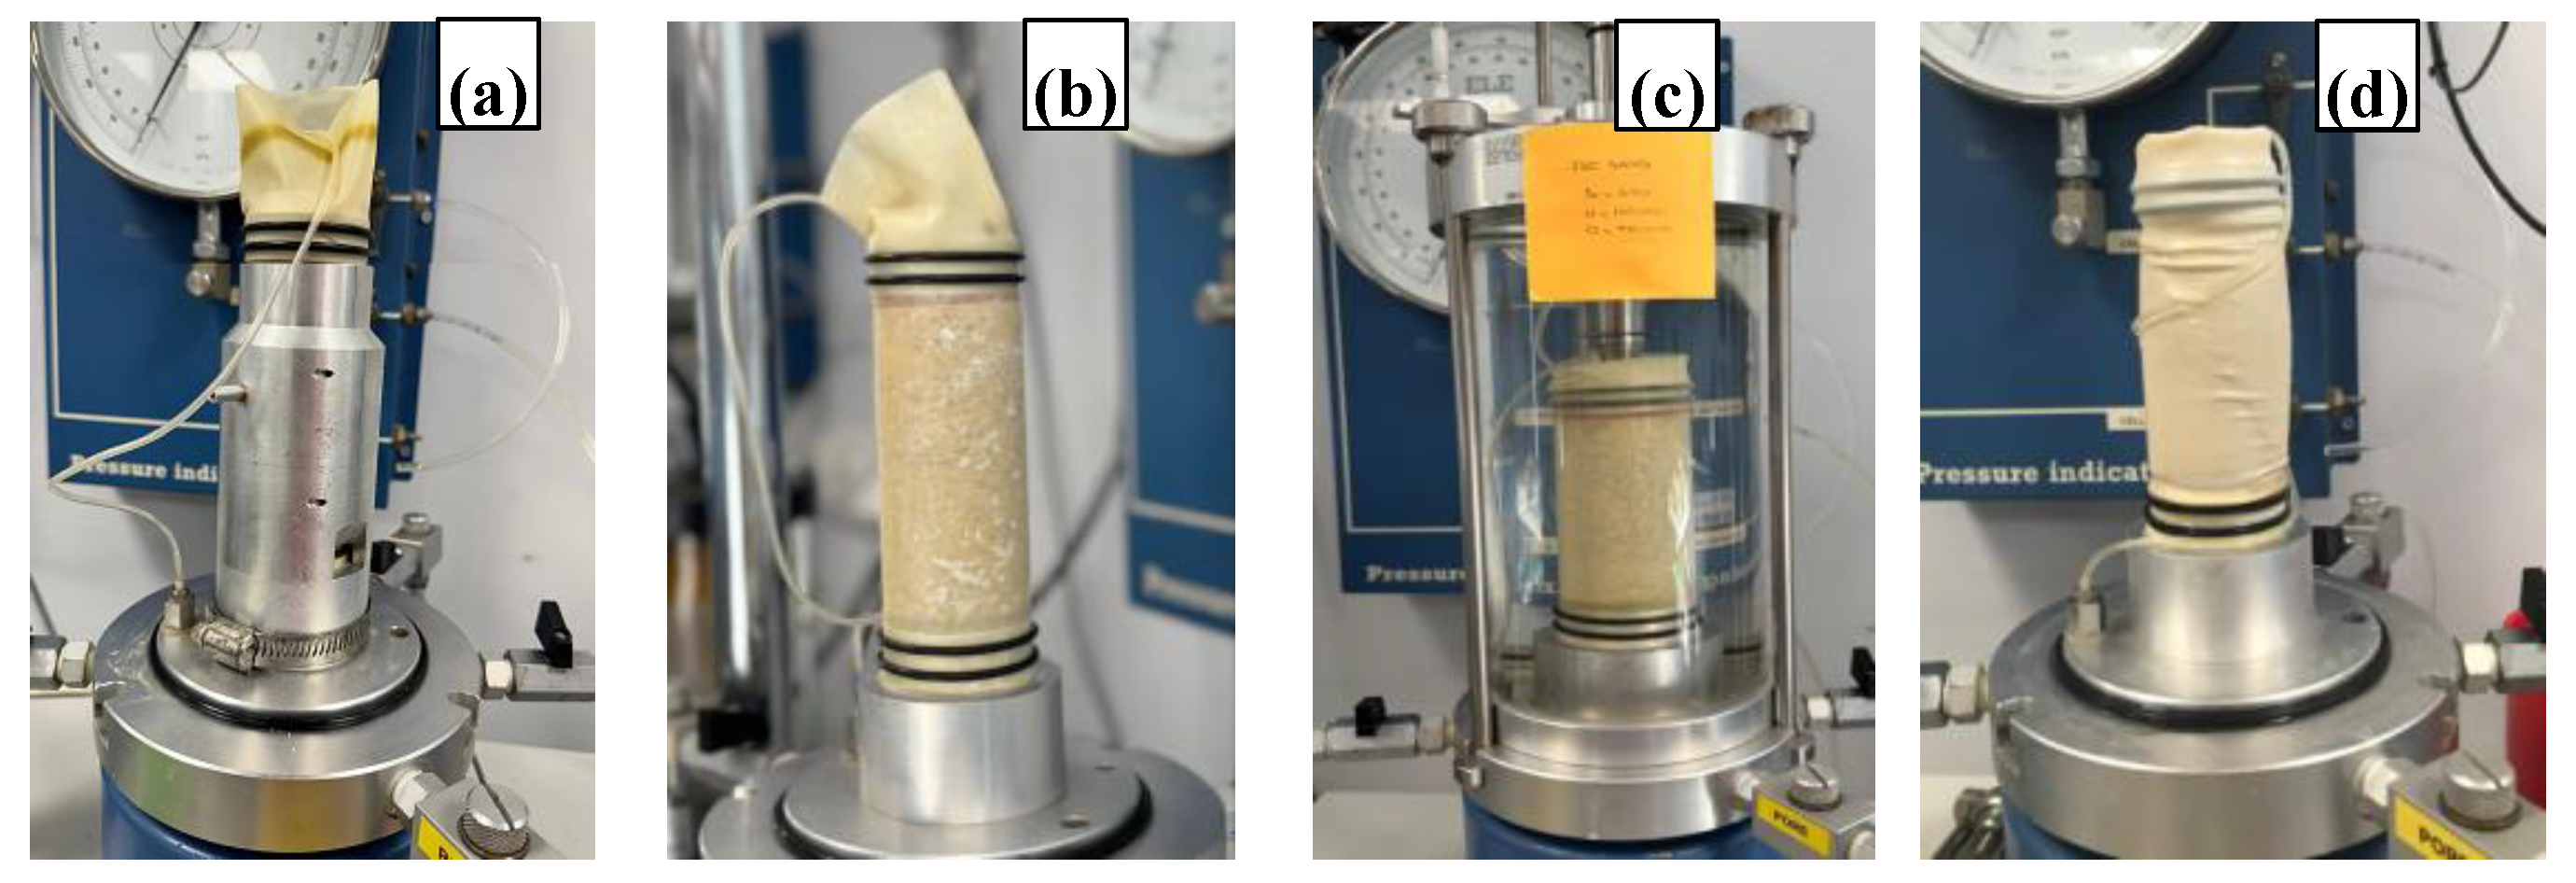
Figure 5.
RCT equipment and stages: a) Placing the specimen and dimension control b) adjusting the cell pressure and vacuum by servo-system c) testing stage.
Figure 5.
RCT equipment and stages: a) Placing the specimen and dimension control b) adjusting the cell pressure and vacuum by servo-system c) testing stage.
3. Results and Discussion
Within the scope of this study, using the stress-strain relationship obtained from monotonic triaxial tests as a result of the laboratory studies presented in detail above (an example is given for S1 in Fig. 6), E and E50 were determined by evaluating the stress-strain curves as presented Fig.2(a) and Edyn is derived from G₀ obtained from resonant column tests considering the Poisson's ratio range (ν = 0.2,0.3 and 0.4) recommended in the literature. The relationships between the obtained E₀, E₅₀ and Edyn moduli are presented graphically and compared with Alpan (1970) correlation.

Table 2.
Initial conditions and experimental testing program.
| Sand No | Type of Experiment | Initial Void Ratio e0 (-) | Relative Density DR (%) | Confining Stress σ3 (kPa) | Initial Shear Modulus G0 (MPa) | Initial Static Modulus E0 (MPa) | Secant Static Modulus E50 (MPa) |
| S1 | RCT, MTX | 0.794 | 45 | 50 | 55.1 | 13.4 | 20.0 |
| RCT, MTX | 100 | 71.3 | 32.7 | 22.0 | |||
| RCT, MTX | 200 | 111.9 | 58.1 | 30.0 | |||
| RCT, MTX | 0.701 | 70 | 50 | 60.9 | 35.2 | 25.3 | |
| RCT, MTX | 100 | 78.1 | 57.2 | 33.0 | |||
| RCT, MTX | 200 | 122.4 | 96.8 | 48.0 | |||
| S2 | RCT, MTX | 0.682 | 45 | 50 | 69.6 | 19.0 | 27.0 |
| RCT, MTX | 100 | 93.6 | 29.3 | 35.0 | |||
| RCT, MTX | 200 | 143.8 | 59.2 | 50.7 | |||
| RCT, MTX | 400 | 214.1 | 147.6 | 82.9 | |||
| RCT, MTX | 0.599 | 70 | 100 | 96.7 | 41.6 | 40.0 | |
| RCT, MTX | 200 | 148.8 | 77.9 | 55.3 | |||
| RCT, MTX | 400 | 216.5 | 200.0 | 100.0 | |||
| S3 | RCT, MTX | 0.831 | 45 | 100 | 83.04 | 20.0 | 17.2 |
| RCT, MTX | 200 | 136.1 | 53.9 | 24.5 | |||
| RCT, MTX | 400 | 203.4 | 64.1 | 32.0 | |||
| RCT, MTX | 0.726 | 70 | 100 | 84.4 | 36.4 | 20.0 | |
| RCT, MTX | 200 | 139.4 | 50.0 | 30.3 | |||
| RCT, MTX | 400 | 206.8 | 51.0 | 37.0 | |||
| S4 | RCT, MTX | 0.978 | 45 | 100 | 91.8 | 38.3 | 12.0 |
| RCT, MTX | 200 | 111.7 | 35.0 | 16.0 | |||
| RCT, MTX | 400 | 176.1 | 76.8 | 21.0 | |||
| RCT, MTX | 0.838 | 70 | 100 | 92.5 | 43.2 | 15.7 | |
| RCT, MTX | 200 | 131.9 | 59.4 | 20.8 | |||
| RCT, MTX | 400 | 203.4 | 78.1 | 26.0 | |||
| S5 | RCT, MTX | 0.56 | 45 | 50 | 70.0 | 47.4 | 40.2 |
| RCT, MTX | 100 | 85.0 | 68.6 | 53.2 | |||
| RCT, MTX | 150 | 118.0 | 90.0 | 63.7 | |||
| RCT, MTX | 200 | 136.1 | 111.2 | 83.0 | |||
| RCT, MTX | 300 | 157.9 | 128.2 | 102.8 | |||
| RCT, MTX | 0.44 | 90 | 50 | 83.6 | 54.7 | 44.0 | |
| RCT, MTX | 100 | 117.7 | 80.0 | 56.3 | |||
| RCT, MTX | 150 | 149.9 | 107.0 | 68.0 | |||
| RCT, MTX | 200 | 169.5 | 121.3 | 98.5 |
Figure 6.
Strain-stress curves obtained from monotonic triaxial experiments for S1.
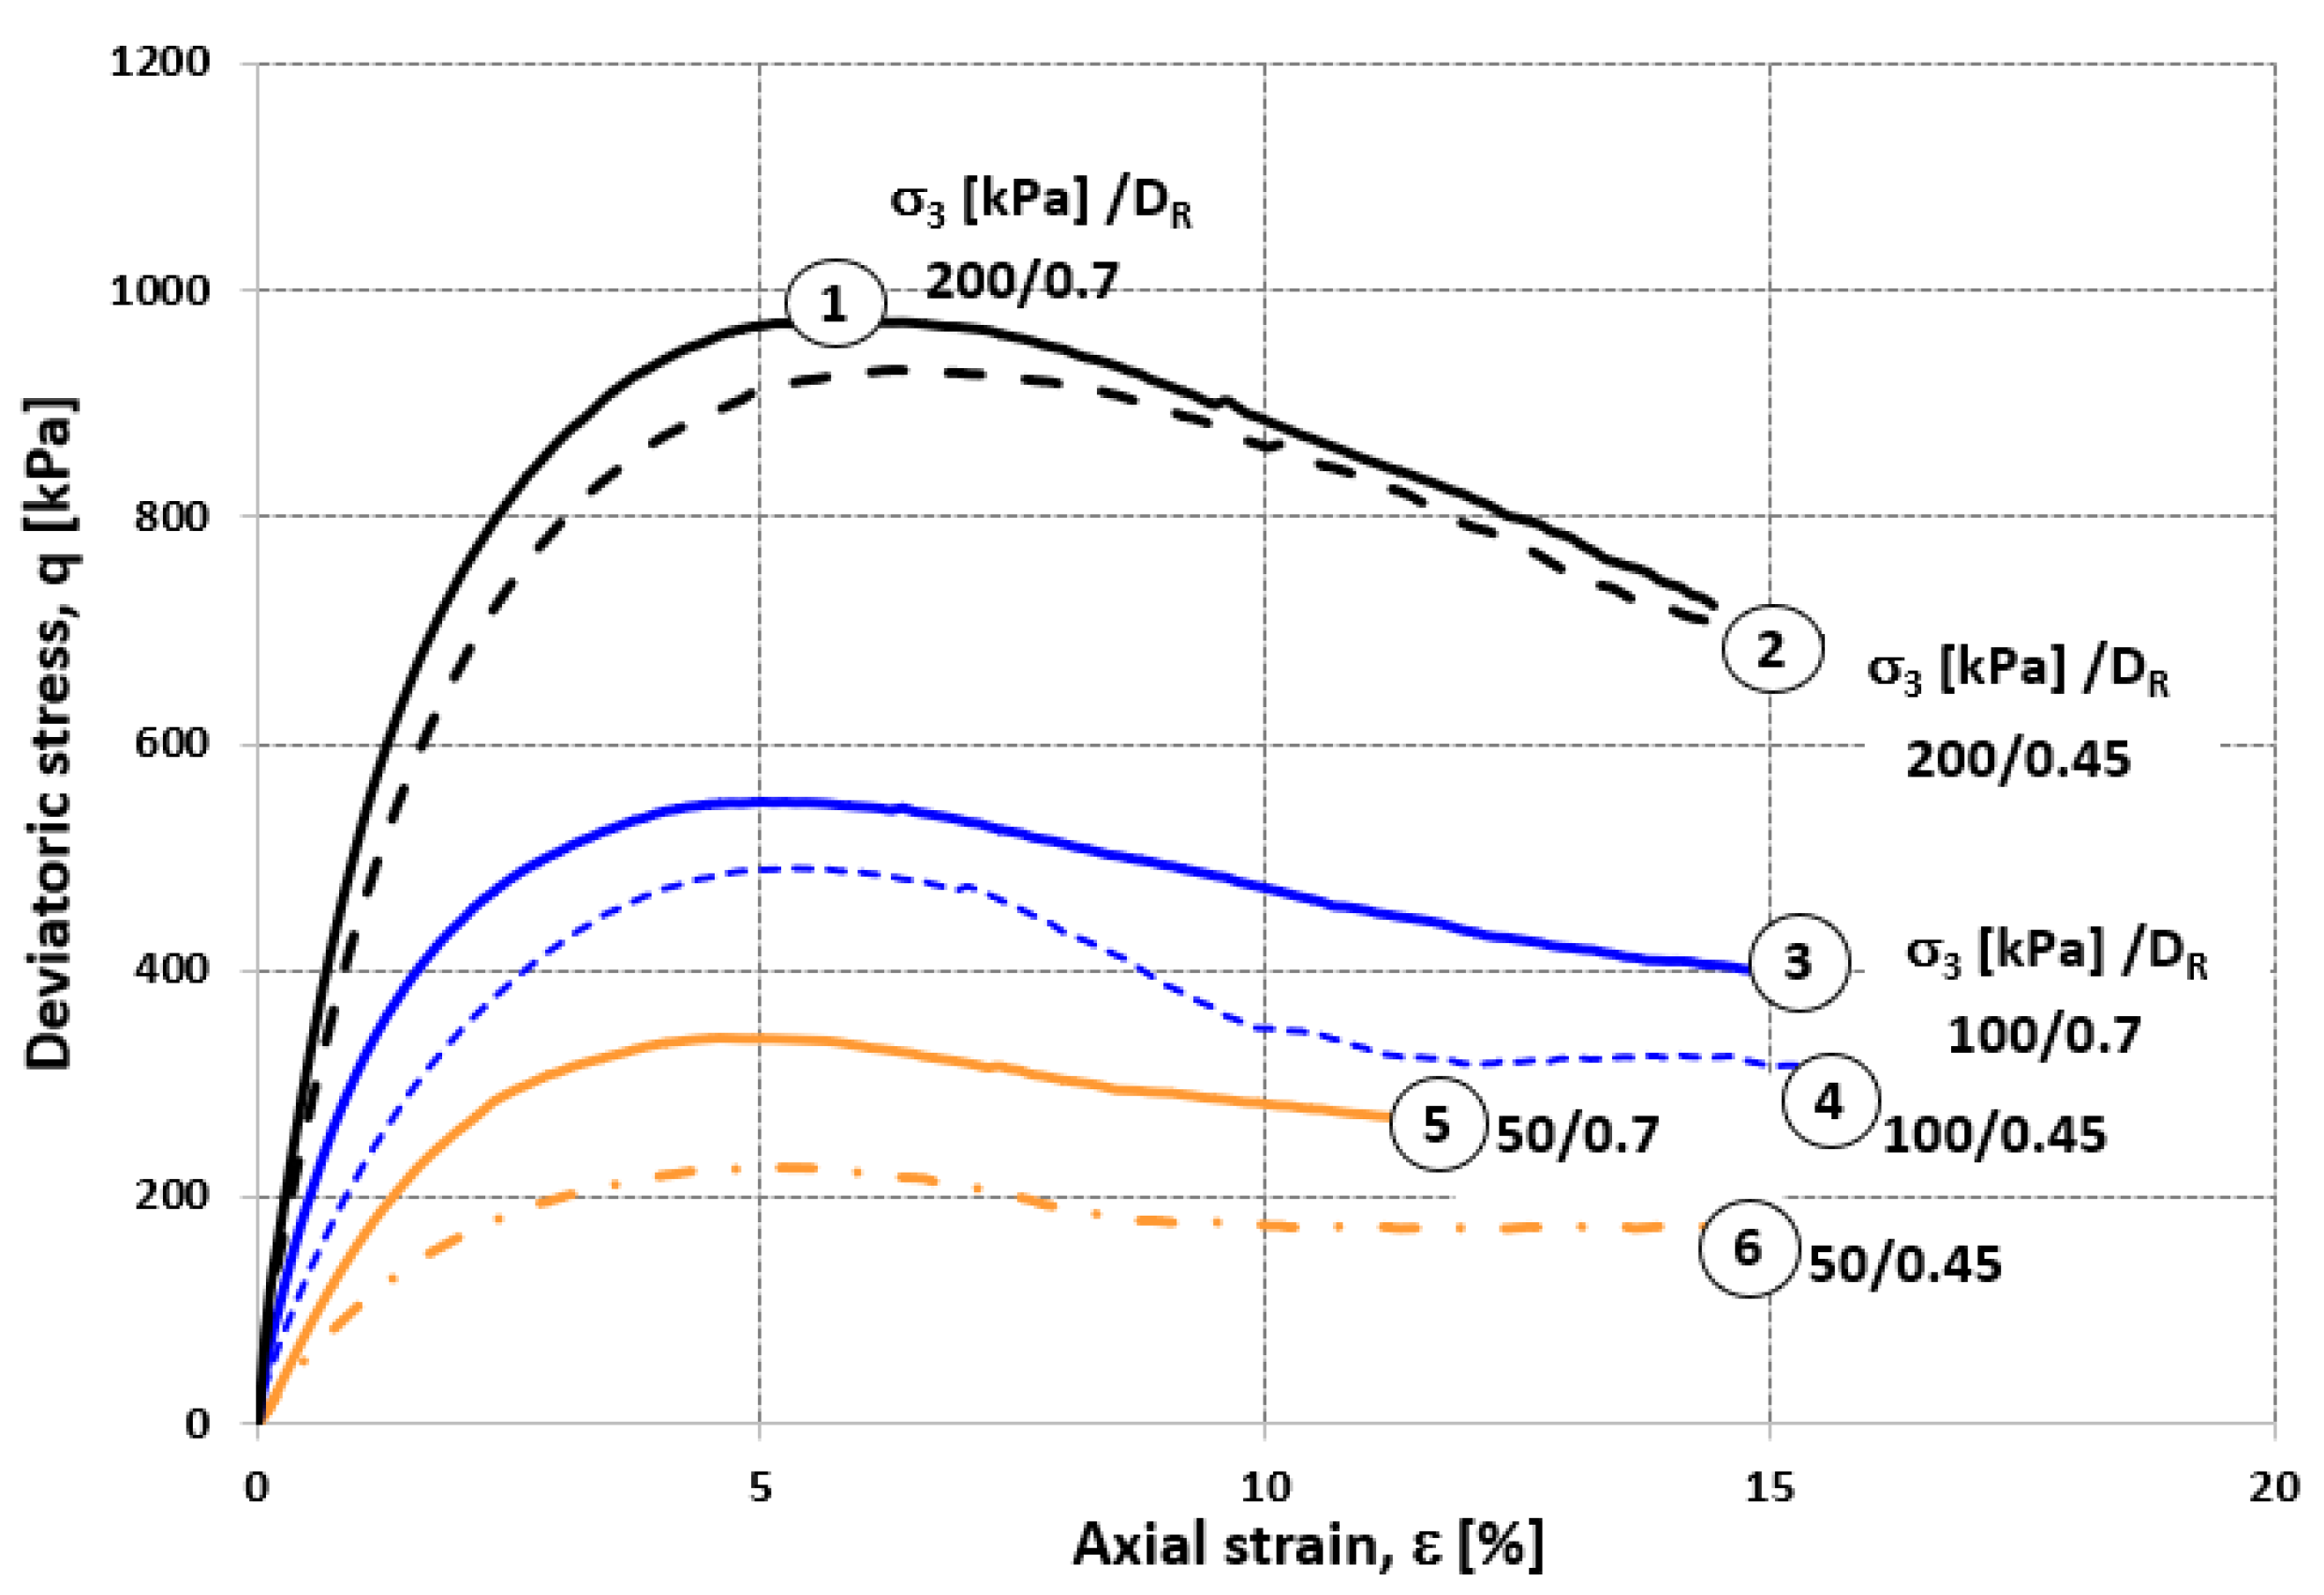
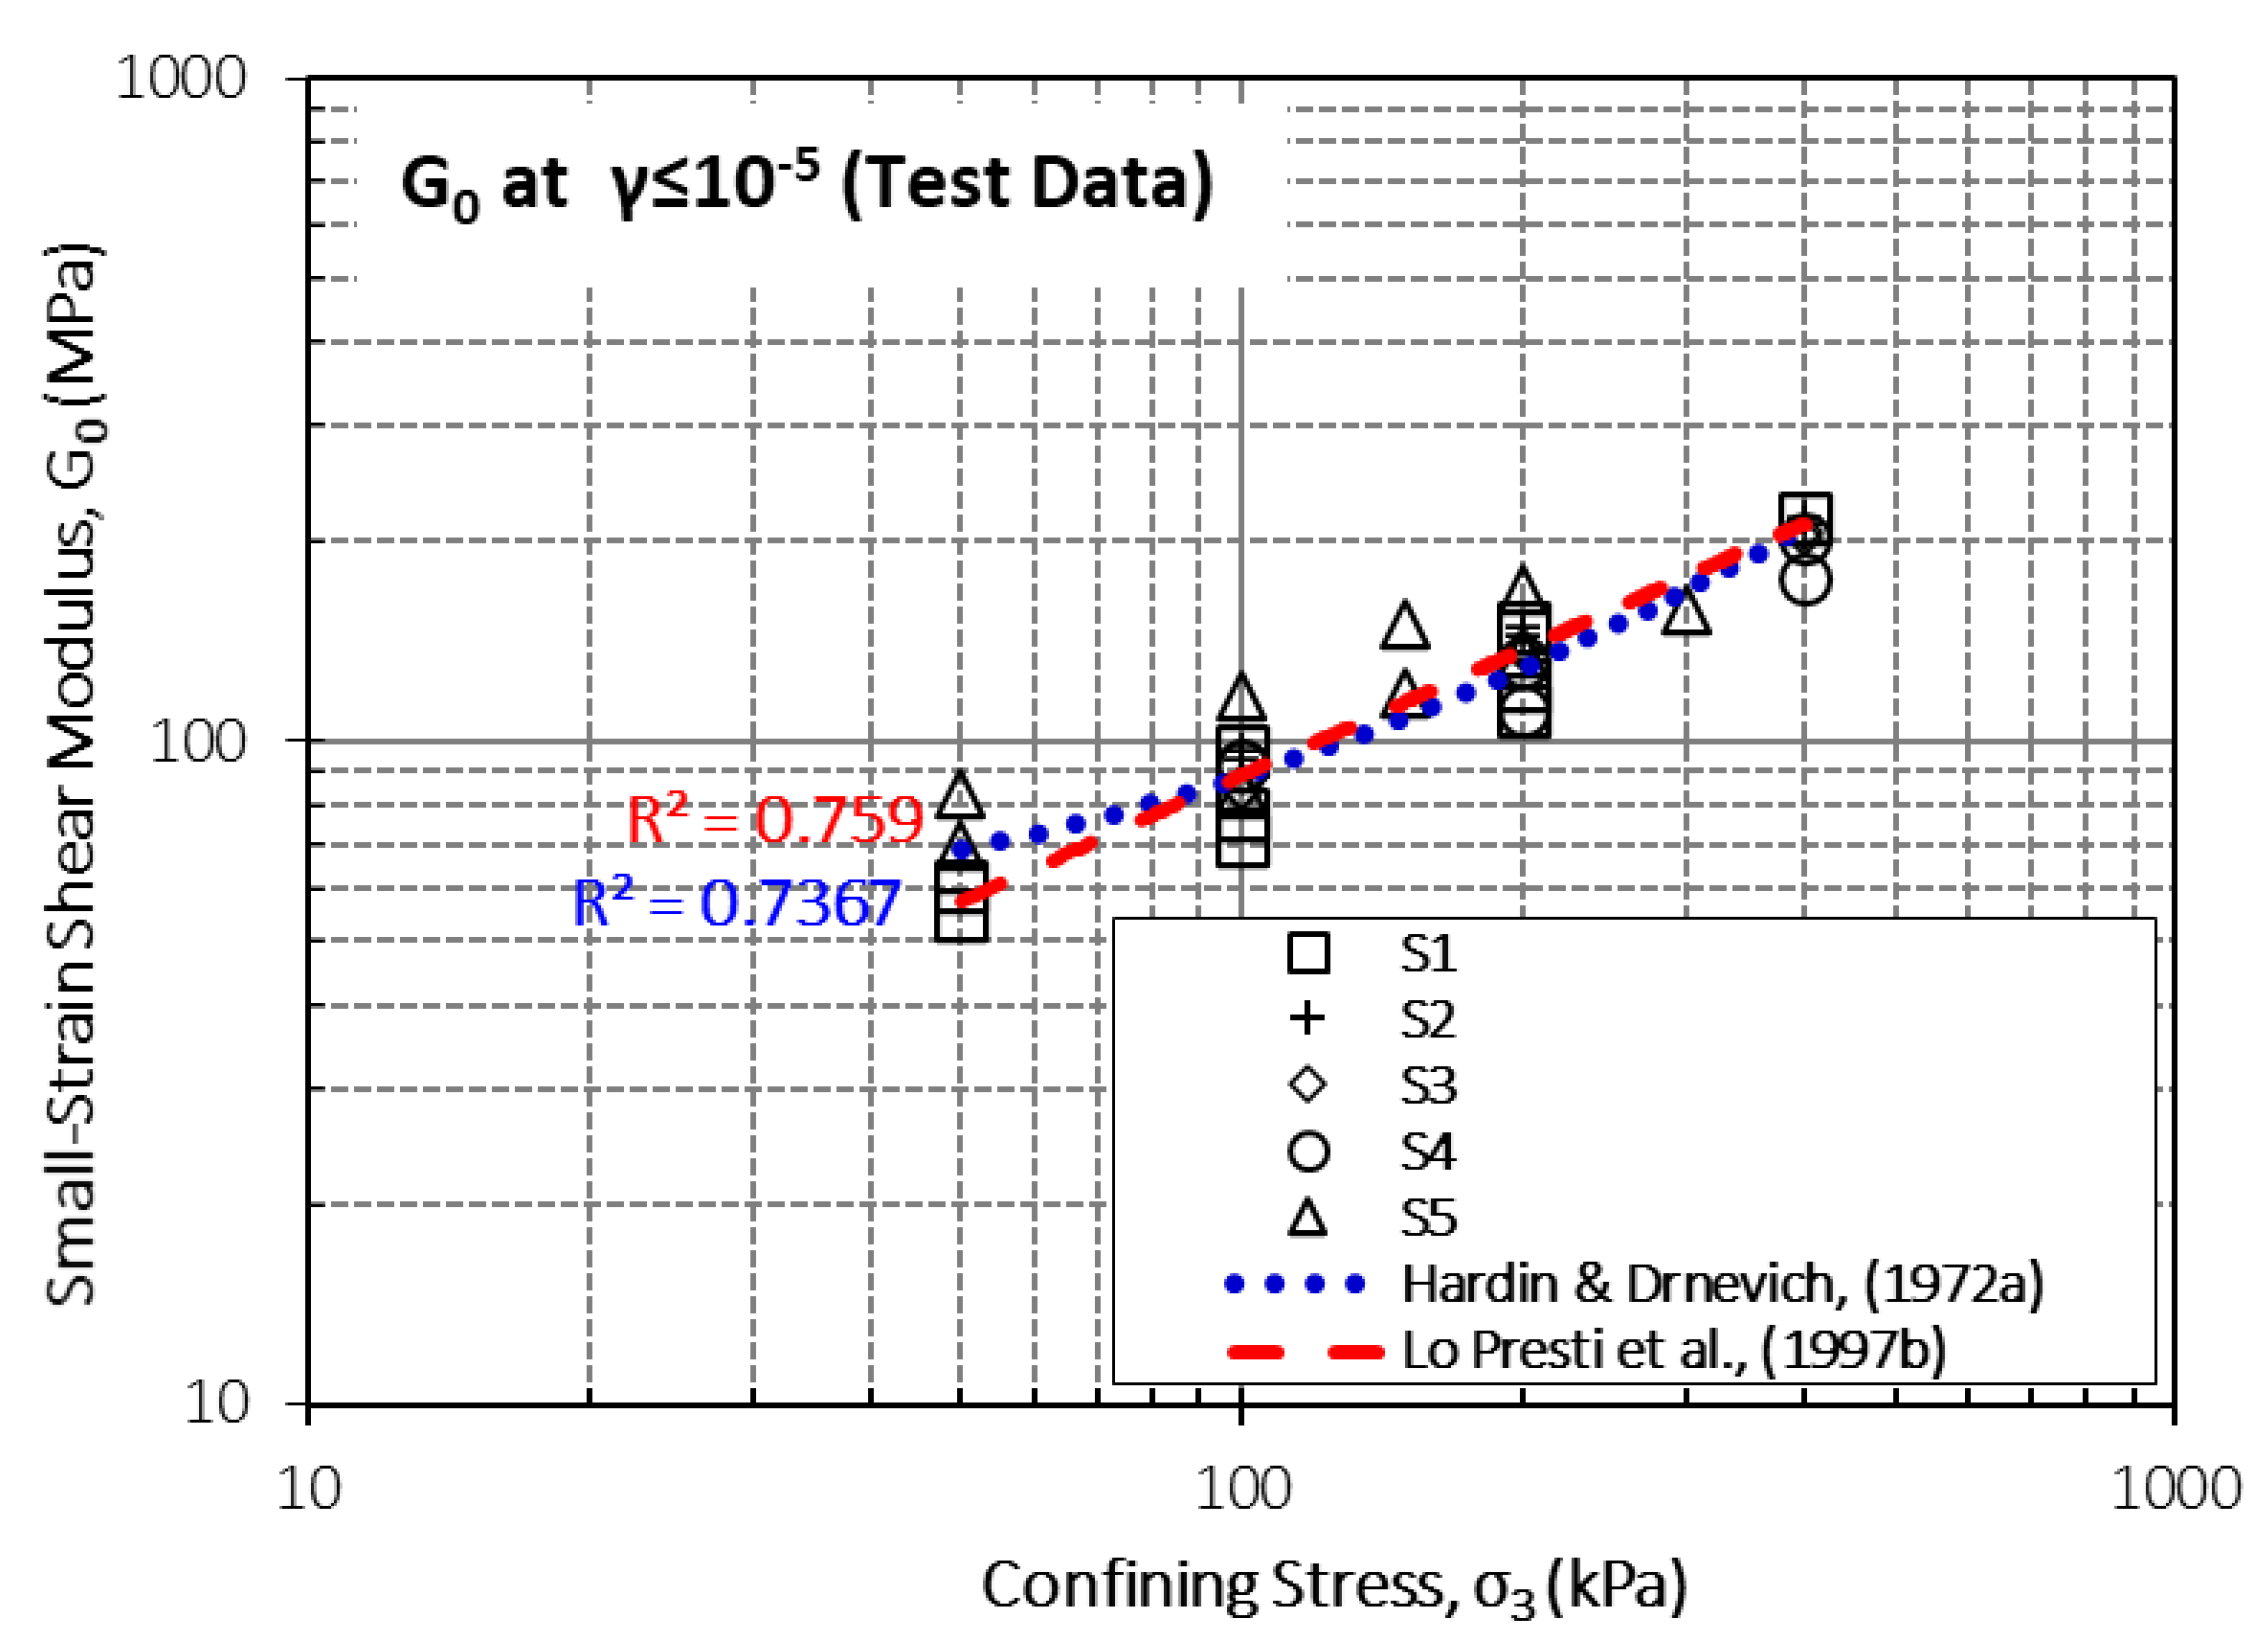
Fig 7. shows that the shear modulus (G₀) values obtained from resonant column tests for five different sand samples (S1-S5) increase with increasing confining stress. This indicates that the stiffness of granular soils increases with the applied stress level. The specimens appear to be confined within a narrow range under similar stress conditions; however, the S5 specimen consistently exhibits higher G₀ values compared to the others. This difference can be attributed to the fact that S5 is a clean sand, since the grain-to-grain contact is more direct and the stiffness properties are generally higher in sands without fine grains.
The effects of stress (p’) and void ratio (e0) on G0 were discussed using Eqn. (7) and Eqn. (8) proposed by Hardin & Drnevich (1972a) and Lo Presti et al. (1997b),respectively.
The parameters required to compute the equation were determined through regression analysis of the experimental data. This analysis employed an iterative algorithm that adjusted the x parameter within F(e)=e-x to derive the optimal values of C and n in Eq. (7) considering all RC test results. From regression analysis, the following values were determined: C=600, x=0.92 and n=0.7. Note that these parameters, excluding x, are compatible with the findings Lo Presti (1997b) for Toyoura and Quiou sands. The void ratio parameter (x) can vary in a wide range in the literature due to the test and soil type, drainage conditions (Molina-Gomez et al.,2020; Senetakis et al., 2012).
In the empirical correlation presented in Eqn. (8), Hardin and Drnevich (1972b) proposed initial values of A=3230 and B=2.973, respectively, based on experimental data from clean sands. In this study, including fine sands, the A=890 and B=3.2 are determined. Fig 7. shows the performance of these model in terms of R2. Therefore, it can be concluded that the proposed models and the RC results are in good agreement.
Figure 7.
Small-strain shear modulus G0 versus confining stress of tested soils.
The initial elastic modulus (E₀) and secant elastic modulus (E₅₀) obtained from monotonic triaxial compression tests were evaluated for five different sand specimens at varying relative densities (DR = 0.45–0.90). As shown in Figure 8a,b, both modulus values increase with increasing confining stress. In specimens with high relative density (DR ≥ 0.70), E₀ and E₅₀ values are significantly higher, especially specimen S5 exhibited higher modulus of elasticity values compared to other sands under the same confining stress.
Figure 8.
E₀ and E50 versus confining stress of tested soils.
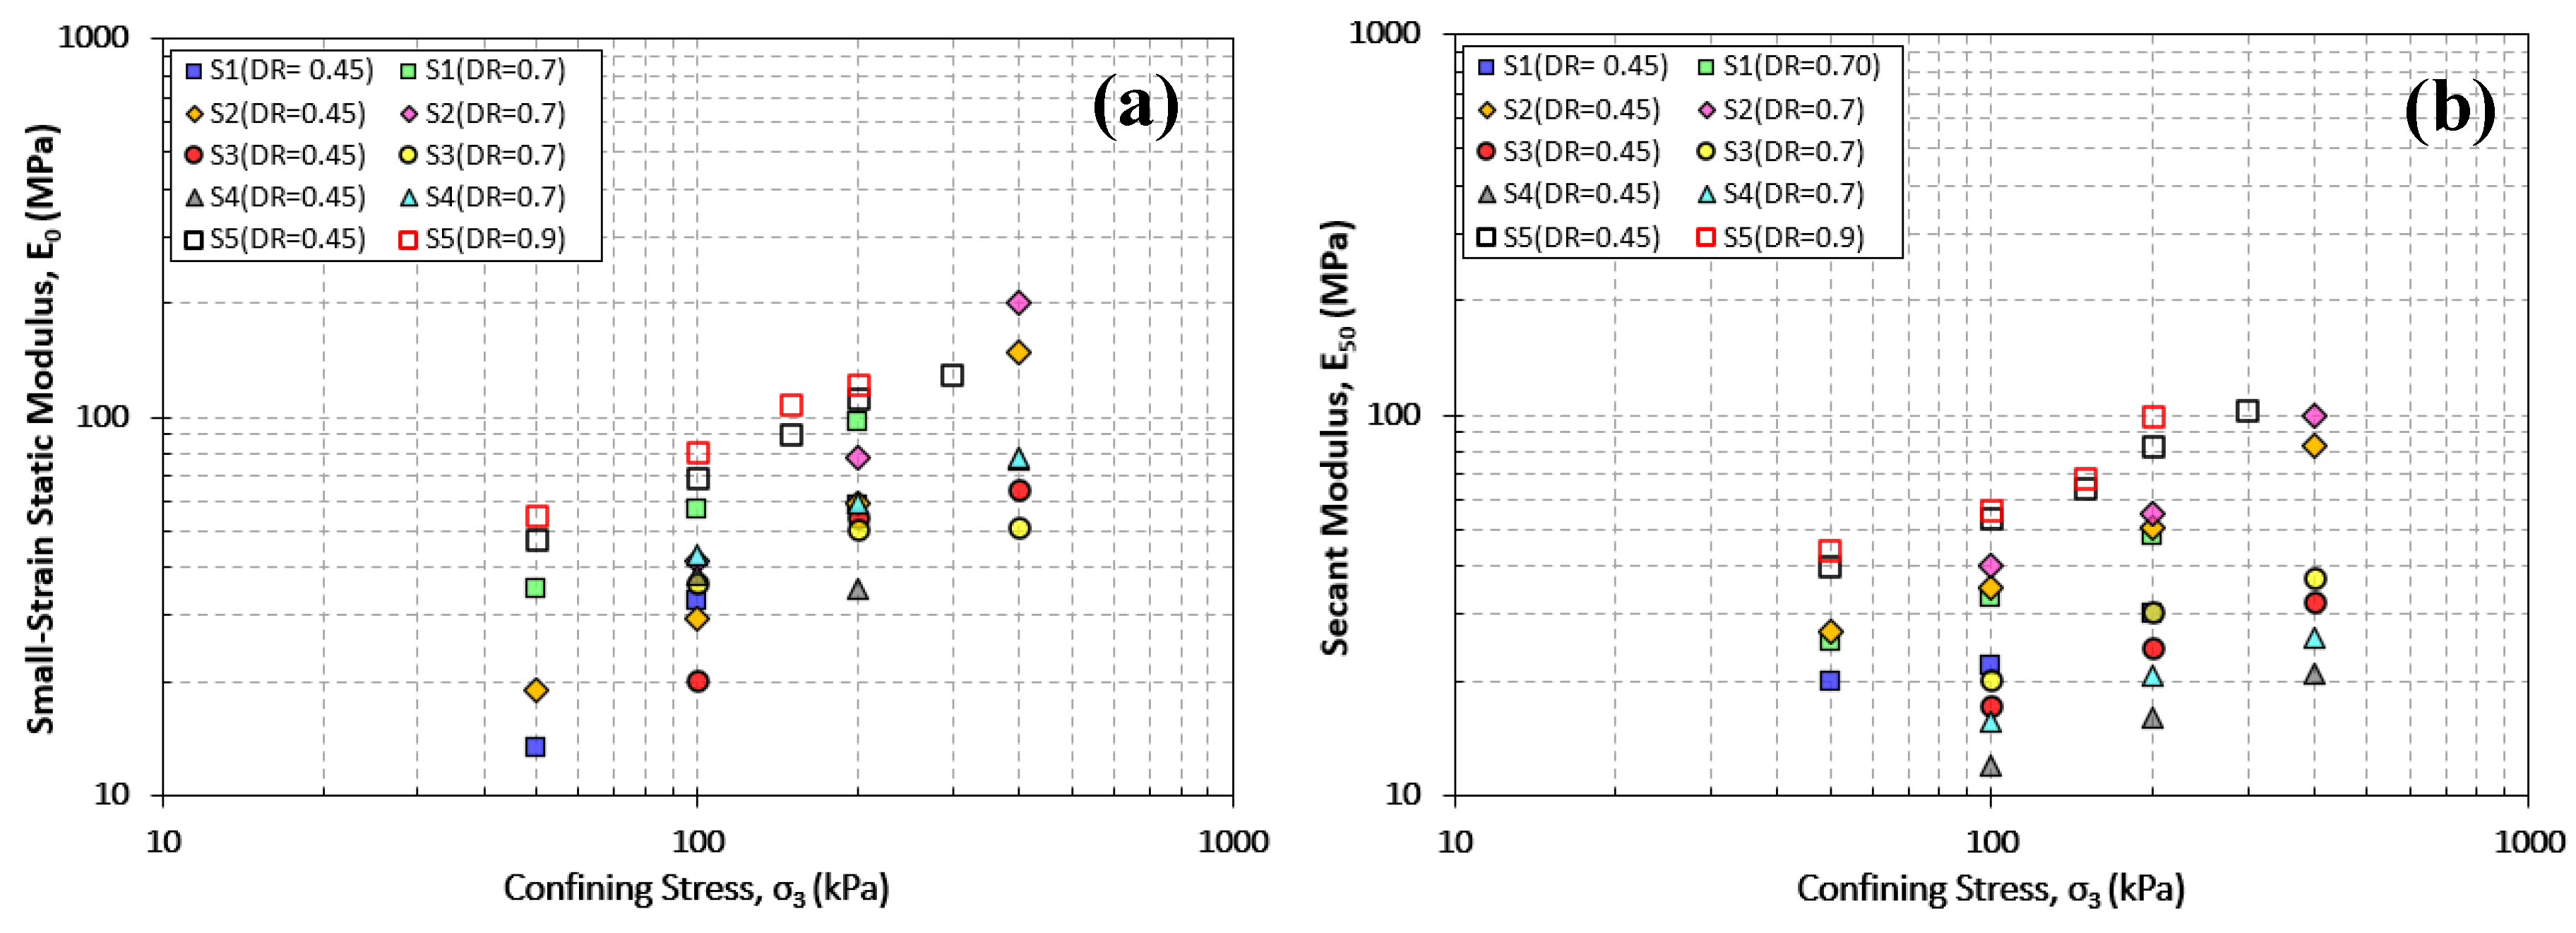
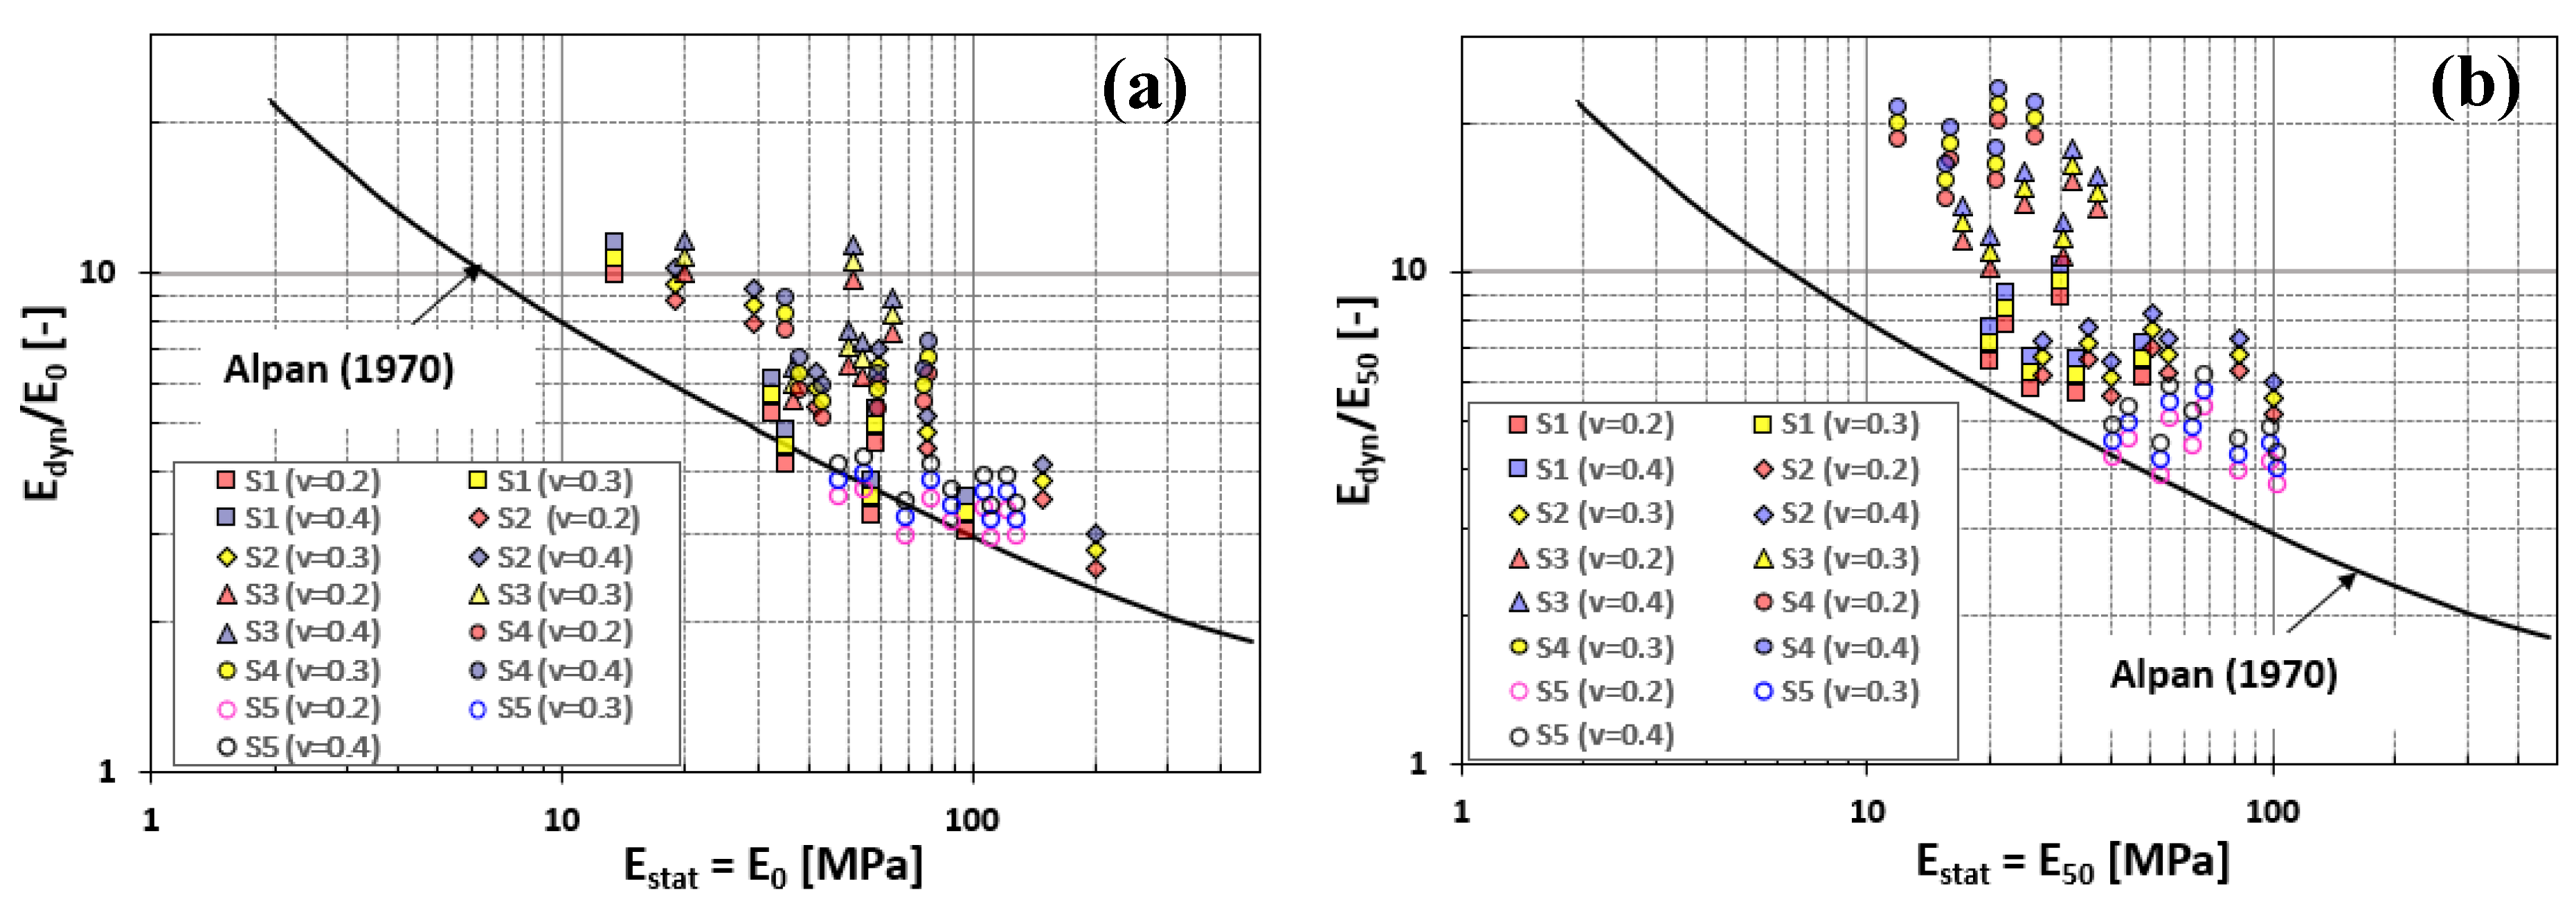
Figure 9 illustrates the relationships between elastic moduli and their respective ratios, as calculated for five distinct sand specimens under varying assumptions of Poisson’s ratio (ν = 0.2, 0.3, 0.4), relative densities (DR), and confining stress levels. The experimental findings are compared with the empirical correlation proposed by Alpan (1970).
The Alpan (1970) correlation posits that an increase in the static elastic modulus corresponds to a decrease in the Edyn/Estat ratio. This hypothesis is predicated on the notion that in loose and low-stiffness sands, the dynamic elastic modulus is substantially greater than the static modulus; however, this disparity diminishes as soil stiffness increases. The experimental data acquired in this study predominantly exceed the Alpan correlation curve, particularly at lower Estat values. The correlation between Edyn/E₀ and E₀ demonstrates a closer alignment with the Alpan trend, whereas the Edyn/E₅₀ and E₅₀ relationship exhibits greater variability.
Furthermore, the distribution observed among the specimens varies according to the fines content of the sands. The clean sand specimens (S5) exhibit lower Edyn/Estat ratios, indicating a more rigid internal structure and a smaller discrepancy between dynamic and static stiffness. Conversely, specimens with higher fines content (S1–S4) display a broader range of variation. Consequently, the position of the data relative to the Alpan curve also varies with fines content: as the fines content decreases, the data tend to align more closely with the sand region defined by Alpan (1970).
Figure 9.
Comparison of the curve of Alpan (1970) with the correlation Edyn/Estat Estat, a) assuming Estat = E0, b) assuming Estat = E50.
Figure 9.
Comparison of the curve of Alpan (1970) with the correlation Edyn/Estat Estat, a) assuming Estat = E0, b) assuming Estat = E50.
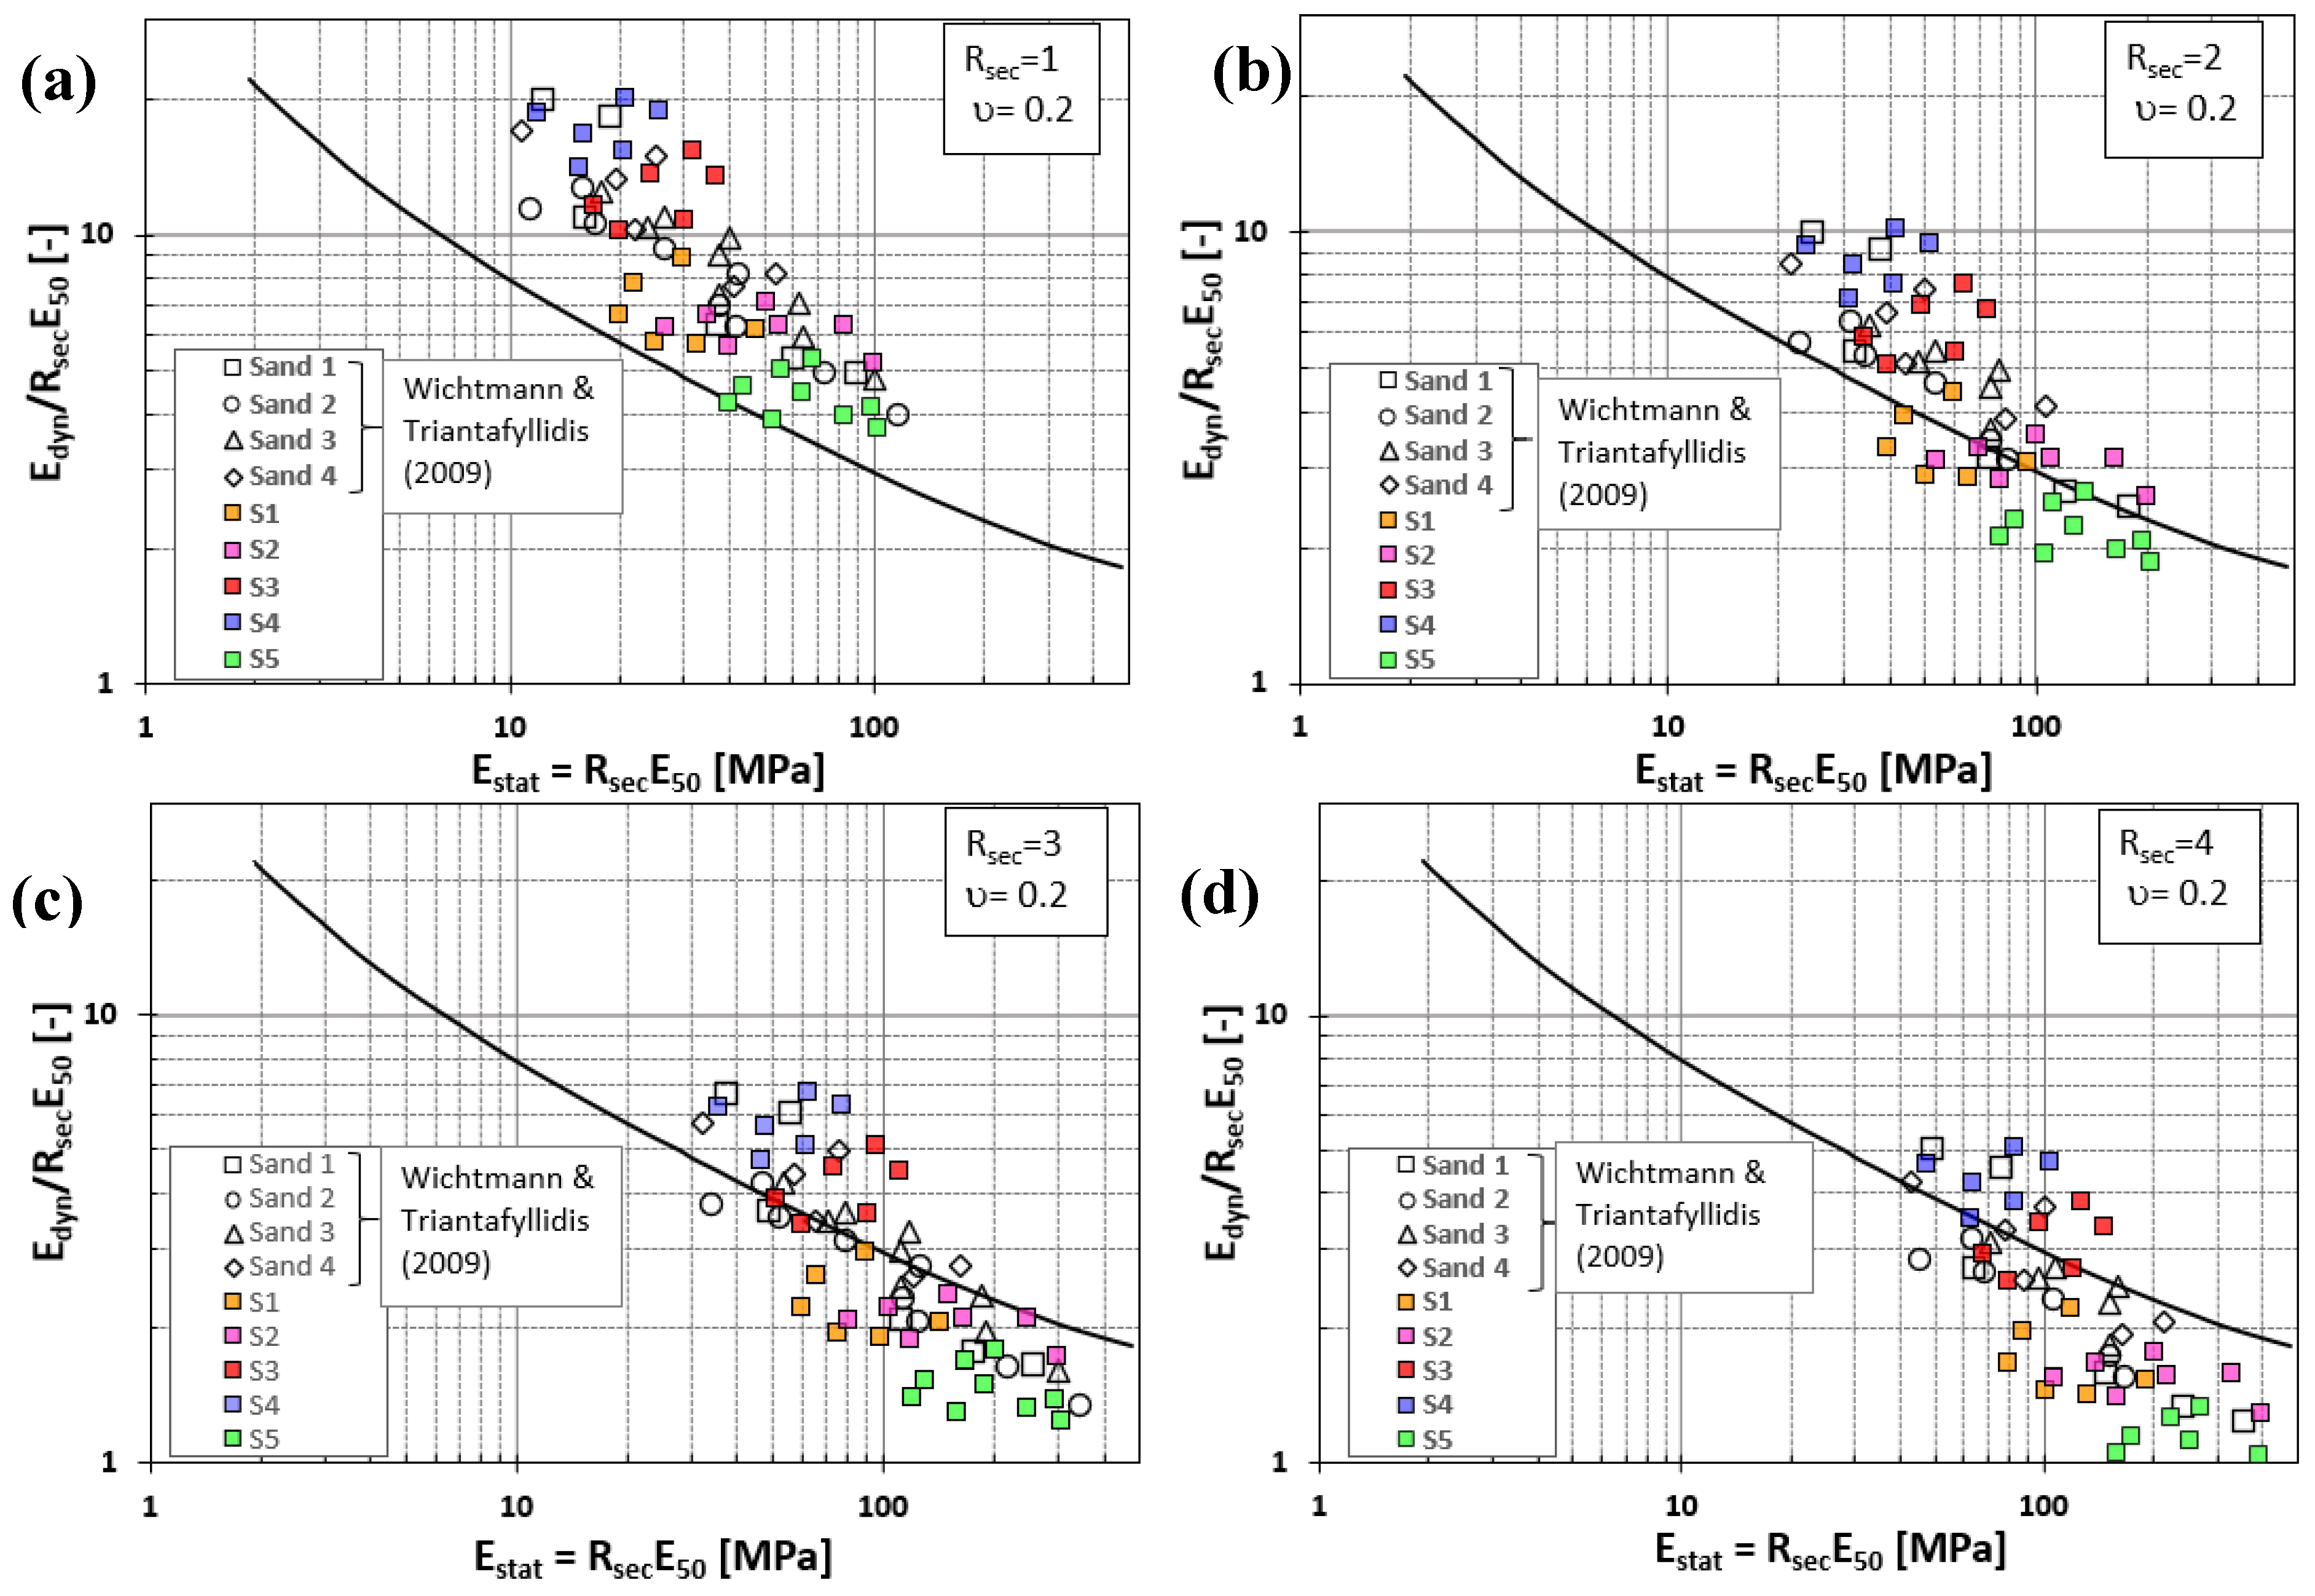
In addition, the data obtained in this study were analyzed in comparison with the experimental results presented by Wichtmann and Triantafyllidis (2009), who conducted experiments on four different sands (Sand 1-4) with varying grain distributions, utilizing the Alpan (1970) correlation (Figure 10). The experimentally obtained data were also considered and compared for different Rsec ratios (Rsec = 1, 2, 3, and 4). A high level of agreement was observed between the sands tested in this study (S1-S5) and the data reported by Wichtmann and Triantafyllidis (2009) in terms of Edyn/RsecE₅₀ ratios. This consistency supports the validity and reliability of the experimental methods and analytical approaches employed in both studies. However, the curve proposed by Alpan (1970) underestimates the experimentally obtained Edyn/RsecE₅₀ (Rsec = 1) values by approximately 1.5 to 2.5 times (Fig. 10a). Nonetheless, when Fig. 10b and Fig. 10c are considered, the assumption of Rsec = 2-3 indicates that the experimental data are in good agreement with the curve proposed by Alpan. However, for higher Rsec values (Rsec = 4), this relationship deteriorates slightly (Fig. 10d).
Upon evaluating Fig. 10 within the context of the sands tested, it is evident that the disparity between dynamic and static elastic moduli increases with a rise in fines content. The clean sand sample S5, characterized by lower Edyn/Estat ratios, demonstrates a closer alignment between dynamic and static stiffness. Conversely, for samples such as S4, which possess higher fines content, this disparity becomes more pronounced. This observation suggests that as the fines content decreases, the soil stiffness becomes more uniform, the dynamic–static stiffness ratio diminishes, and consequently, the position of the samples on the Alpan curve also varies according to their fines content.
Figure 10.
Comparison of the curve of Alpan (1970) and Wichtmann & Triantafyllidis (2009) with the correlation Edyn/Estat stat, assuming a) Estat = E50 and b) Estat = 2E50 c) Estat = 3E50 d) Estat = 4E50.
Figure 10.
Comparison of the curve of Alpan (1970) and Wichtmann & Triantafyllidis (2009) with the correlation Edyn/Estat stat, assuming a) Estat = E50 and b) Estat = 2E50 c) Estat = 3E50 d) Estat = 4E50.
4. Concluding Remarks
This paper presents the findings from a series of monotonic triaxial, and resonant column tests conducted on sandy specimens with varying characteristics. The primary objective of the study is to determine the dynamic and static stiffness of sandy soils and their interrelationship. To this end, a comprehensive laboratory testing program was implemented, encompassing different relative densities and confining pressures. The results of this study may assist engineers in selecting appropriate stiffness parameters for calibrating constitutive models. The deformation modulus at small to moderate strain levels of sandy soils, which share similar characteristics with the tested sands, could be utilized. Another significant outcome is the comparison and evaluation of the accuracy of Alpan’s concept in terms of stiffness ratio. Based on the results of this study, the following conclusions can be drawn:
- This study examines sand soils classified as poorly graded "SP" (S1-S3) and well graded "SW" (S2-S4-S5) according to the Unified Soil Classification System (USCS). These soils were tested with varying fine content (FC=0-45%) and different levels of relative density.
- The resonant column (RC) test results showed that at small strain level (γ ≤ 10 -5) the initial shear modulus value (G0) increases with the confining pressure. Moreover, even at high stress level (σ3 ≥ 200 kPa), the results were in agreement with the empirical expressions frequently used in the literature.
- The specific parameter x of the void ratio function, F(e), proposed for estimating G0 for the tested sandy soils based on results from RC experiments, differed from the default value suggested by Lo Presti et al. (1997b). However, it remained within the range of parameter x obtained from regression analyses by other researchers in the literature. Similarly, the coefficients of the empirical formula proposed by Hardin and Drnevich (1972a) were revised for the studied sands. As a result of the regression analysis, the performance of the empirical formulas (R2 ≥ 0.75) was deemed successful.
- The modulus of elasticity (E0), representing the linear region of the stress-strain curve derived from monotonic triaxial tests, and the secant moduli (E50) were found to be directly proportional to the increase in confining pressure.
- In the graph defining the ratio between dynamic and static modulus as proposed by Alpan, the static modulus is not explicitly defined. In this study, the static modulus is interpreted as the secant modulus. Furthermore, the initial shear modulus (G0), determined through RC tests utilizing the Poisson's ratio (ν)—a parameter that is challenging to ascertain in soil mechanics and is frequently assumed—is converted to the modulus of elasticity and presented as the dynamic modulus (Edyn).
- To discuss the agreement between the ratio of the secant modulus and the converted dynamic modulus with the Alpan curve, the Poisson's ratio (ν) was parametrically varied as 0.2, 0.3, and 0.4. The curve proposed by Alpan (1970) consistently underestimated the experimental data obtained within the scope of this study.
- The experimental database generated in this study was compared with the results of similar experimental investigations, which are relatively rare for sands, and a high level of agreement was observed. For both experimental studies, the best agreement with the Alpan curve was achieved when the Poisson’s ratio (ν) was set to 0.2 and the static elastic modulus (Estat), was assumed to be in a range of two-three times the secant modulus (E50).
- In the ongoing study, the mathematical expression originally proposed by Alpan (1970) is being updated through new empirical equations that account for index properties (such as CU, D50 and CC), confining stress (σ3), and relative density (DR).
References
- Alarcon-Guzman, A.; Chameau, J. L.; Leonards, G. A.; Frost, J. D. Shear Modulus and Cyclic Undrained Behavior of Sands. Soils and Foundations 1989, 29(4), 105–119. [Google Scholar] [CrossRef] [PubMed]
- Alpan, I. The geotechnical properties of soils. Earth-Science Reviews 1970, 6(1), 5–49. [Google Scholar] [CrossRef]
- ASTM. Test Methods for Particle-Size Distribution (Gradation) of Soils Using Sieve Analysis; ASTM International, 2004. [Google Scholar] [CrossRef]
- ASTM. Test Methods for Specific Gravity of Soil Solids by Water Pycnometer; ASTM International, 2006. [Google Scholar] [CrossRef]
- Bentley. PLAXIS PLAXIS 2D 2023.2 Material Models Manual 2D. 2025. [Google Scholar]
- Benz. Small-Strain Stiffness of Soils and its Numerical Consequences. 2007. [Google Scholar]
- Benz T, Vermeer PA. Discussion of On the Correlation of Oedometric and Dynamic Stiffness of Non-cohesive Soils by T. Wichtmann and Th. Triantafyllidis (Bautechnik 83(7), 2006) (in German). Bautechnik, 84(5); 2007. p. 361–64. Bautechnik 2006, 83(7), 482–491. [CrossRef]
- Chen, G.; Liu, X.; Ji-yan, Z. Undrained Dynamical Behavior of Nanjing Flake-Shaped Fine Sand Under Cyclic Loading. Journal of Central South University of Technology 2008, 15(S2), 215–221. [Google Scholar] [CrossRef]
- Chung, R. M.; Yokel, F. Y.; Wechsler, H. Pore Pressure Buildup in Resonant Column Tests. Journal of Geotechnical Engineering 1984, 110(2), 247–261. [Google Scholar] [CrossRef]
- Clayton, C. R. I. Stiffness at small strain: research and practice. Géotechnique 2011, 61(1), 5–37. [Google Scholar] [CrossRef]
- des Arbeitskreises, E. „Baugrunddynamik “. Deutsche Gesellschaft Für Geotechnik EV (Hrsg.). Berlin. 2002. [Google Scholar]
- El Mohtar, C. S.; Drnevich, V. P.; Santagata, M.; Bobet, A. Combined Resonant Column and Cyclic Triaxial Tests for Measuring Undrained Shear Modulus Reduction of Sand With Plastic Fines. Geotechnical Testing Journal 2013, 36(4), 484–492. [Google Scholar] [CrossRef]
- Fjær, E. Static and Dynamic Moduli of a Weak Sandstone. Geophysics 2009, 74(2), WA103–WA112. [Google Scholar] [CrossRef]
- Georgiannou, V. N.; Tsomokos, A. Comparison of two fine sands under torsional loading. Canadian Geotechnical Journal 2008, 45(12), 1659–1672. [Google Scholar] [CrossRef]
- Hardin, B. O.; Drnevich, V. P. Shear modulus and damping in soils: design equations and curves. Journal of the Soil Mechanics and Foundations Division 1972a, 98(7), 667–692. [Google Scholar] [CrossRef]
- Hardin, B. O.; Drnevich, V. P. Shear Modulus and Damping in Soils: Measurement and Parameter Effects (Terzaghi Leture). Journal of the Soil Mechanics and Foundations Division 1972b, 98(6), 603–624. [Google Scholar] [CrossRef]
- He, J.; Bai, B.; Chen, Q. F. The Responses of Soft Ground Materials Subjected to Dynamic Loading. Advanced Materials Research 2012, 591–593, 977–981. [Google Scholar] [CrossRef]
- Iwasak1, T.; Fum10, T.; Takagi, Y. NII-Electronic Library Service SHEAR MODULI OF SANDS UNDER CYCLIC TORSIONAL SHEAR LOADING. n.d. [Google Scholar]
- Iwasaki, T.; Tatsuoka, F.; Takagi, Y. Shear Moduli of Sands under Cyclic Torsional Shear Loading. Soils and Foundations 1978, 18(1), 39–56. [Google Scholar] [CrossRef]
- Jafarzadeh, F.; Sadeghi, H. Experimental study on dynamic properties of sand with emphasis on the degree of saturation. Soil Dynamics and Earthquake Engineering 2012, 32(1), 26–41. [Google Scholar] [CrossRef]
- Jiang, S. Study on the Dynamic Characteristics of Solidified Silt Under Dynamic Load. Vibroengineering Procedia 2019, 27, 24–29. [Google Scholar] [CrossRef]
- Johan, A.; Rahardjo, P. P.; Widjaja, B. Evaluating Liquefaction Phenomenon of Silty Sand Using Piezocone Penetration Test (CPTu). Ukarst 2022, 6(1), 1. [Google Scholar] [CrossRef]
- Kelvin, W. T. B. On the elasticity and viscosity of metals. 1865. [Google Scholar]
- Kokusho, T. Cyclic Triaxial Test of Dynamic Soil Properties for Wide Strain Range. Soils and Foundations 1980, 20(2), 45–60. [Google Scholar] [CrossRef]
- Konstadinou, M.; Georgiannou, V. N. Cyclic Behaviour of Loose Anisotropically Consolidated Ottawa Sand Under Undrained Torsional Loading. Géotechnique 2013, 63(13), 1144–1158. [Google Scholar] [CrossRef]
- Lanzo, G.; Vucetic, M.; Doroudian, M. Reduction of Shear Modulus at Small Strains in Simple Shear. Journal of Geotechnical and Geoenvironmental Engineering 1997, 123(11), 1035–1042. [Google Scholar] [CrossRef]
- Li, G.; Li, Y.; Hua, X.; Liu, J.; Yang, S.; Zhang, Y. Study on Pore Water Pressure Model of EICP-Solidified Sand Under Cyclic Loading. Materials 2024, 17(19), 4800. [Google Scholar] [CrossRef] [PubMed]
- Liu, S.; Li, J.; Ji, X.; Fang, Y. Influence of Root Distribution Patterns on Soil Dynamic Characteristics. Scientific Reports 2022, 12(1). [Google Scholar] [CrossRef]
- Lo Presti, D. C. F.; Jamiolkowski, M.; Pallara, O.; Cavallaro, A.; Pedroni, S. Shear modulus and damping of soils. Géotechnique 1997a, 47(3), 603–617. [Google Scholar] [CrossRef]
- Lo Presti, D. C. F.; Jamiolkowski, M.; Pallara, O.; Cavallaro, A.; Pedroni, S. Shear modulus and damping of soils, 1997b.
- Lo Presti, D.; Pallara, O.; Lancellotta, R.; Armandi, M.; Maniscalco, R. Monotonic and Cyclic Loading Behavior of Two Sands at Small Strains. Geotechnical Testing Journal 1993, 16(4), 409–424. [Google Scholar] [CrossRef]
- Molina-Gómez, F.; Fonseca, A. V.; Ferreira, C.; Baudet, B. A. Dynamic properties of two historically liquefiable sands in the Lisbon area. Soil Dynamics and Earthquake Engineering 2020, 132, 106101. [Google Scholar] [CrossRef]
- Öztoprak, S.; Iık, N. S.; Karaca, Ö.; Ocakbaşı, E.; Eyisüren, O.; Iık, M. F.; Bektaş, Ö.; Sargın, S.; Büyüksaraç, A.; Umu, S. U.; Okur, D. V. Development of corresponding methods, coefficients and maps for including the bedrock depth and basin effect into the design response spectrums obtained from earthquake design codes and seismic site response analyses (TÜBİTAK 1001 Project No. 121M760); The Scientific and Technological Research Council of Türkiye (TÜBİTAK), 2021. [Google Scholar]
- Senetakis, K.; Anastasiadis, A.; Pitilakis, K. The small-strain shear modulus and damping ratio of quartz and volcanic sands. Geotechnical Testing Journal 2012, 35(6), 1–17. [Google Scholar] [CrossRef]
- Voigt, W. Ueber innere Reibung fester Körper, insbesondere der Metalle. Annalen Der Physik 1892, 283(12), 671–693. [Google Scholar] [CrossRef]
- Vucetic, M. Cyclic Threshold Shear Strains in Soils. Journal of Geotechnical Engineering 1994, 120(12), 2208–2228. [Google Scholar] [CrossRef]
- Wang, J.; Cao, A.; Song, D.; Feng, B.; Li, H.; Long, Y.; Ye, Z. Laboratory Experiments and Numerical Simulation on Dynamic Response of Island Reclamation Coral Sand Under Aircraft Load. Materials 2023, 16(9), 3465. [Google Scholar] [CrossRef]
- Wichtmann, T.; Triantafyllidis, T. On the correlation of “static” and “dynamic” stiffness moduli of non-cohesive soils. Bautechnik 2009, 86 SUPPL. 1, 28–39. [Google Scholar] [CrossRef]
- Wichtmann, T.; Triantafyllidis, T. Effect of Uniformity Coefficient on G/Gmax and Damping Ratio of Uniform to Well-Graded Quartz Sands. Journal of Geotechnical and Geoenvironmental Engineering 2013, 139(1), 59–72. [Google Scholar] [CrossRef]
- Zhang, J.; Andrus, R. D.; Juang, C. H. Normalized Shear Modulus and Material Damping Ratio Relationships. Journal of Geotechnical and Geoenvironmental Engineering 2005, 131(4), 453–464. [Google Scholar] [CrossRef]
Table 1.
Index properties of the tested granular materials.
| Sand No | Uniformity Coeff. Cu [-] |
Coff. Of Curvature, CC [-] |
Average Diameter, D50 [mm] |
Specific Gravity, Gs [-] |
Fine Content FC [%] | Maximum Void Ratio, emax [-] |
Minimum Void Ratio emin [-] |
| S1 | 27 | 6 | 0.52 | 2.65 | 16 | 0.96 | 0.59 |
| S2 | 6.2 | 2.9 | 0.38 | 2.64 | 11 | 0.83 | 0.5 |
| S3 | 13.6 | 3.4 | 0.12 | 2.67 | 28 | 1.02 | 0.6 |
| S4 | 25 | 1.5 | 0.08 | 2.7 | 45 | 1.23 | 0.67 |
| S5 | 6 | 1.28 | 0.63 | 2.64 | 0 | 0.674 | 0.415 |
Disclaimer/Publisher’s Note: The statements, opinions and data contained in all publications are solely those of the individual author(s) and contributor(s) and not of MDPI and/or the editor(s). MDPI and/or the editor(s) disclaim responsibility for any injury to people or property resulting from any ideas, methods, instructions or products referred to in the content. |
© 2025 by the authors. Licensee MDPI, Basel, Switzerland. This article is an open access article distributed under the terms and conditions of the Creative Commons Attribution (CC BY) license (http://creativecommons.org/licenses/by/4.0/).
Copyright: This open access article is published under a Creative Commons CC BY 4.0 license, which permit the free download, distribution, and reuse, provided that the author and preprint are cited in any reuse.


