
Submitted:
03 May 2025
Posted:
06 May 2025
You are already at the latest version
Abstract
Hierarchical clustering of amino acids using multidimensional molecular descriptors reveals both established and novel structure-function relationships, advancing traditional classification schemes. We developed an automated clustering pipeline leveraging 22 graph-theoretic descriptors for all 20 standard amino acids, integrating parameter optimization, consensus validation, and robust statistical evaluation. Average linkage with cityblock distance achieved the highest cophenetic correlation (0.847), indicating superior preservation of pairwise relationships compared to other methods. Cluster validation metrics (silhouette: 0.573, Calinski-Harabasz: 21.45, Davies-Bouldin: 0.82) and the gap statistic consistently supported a two-cluster solution, with the dendrogram and consensus clustering revealing stable, biologically meaningful substructure.
The analysis identified two dominant clusters: one comprising aromatic residues (tryptophan, phenylalanine, tyrosine) and positively charged residues (arginine, histidine, lysine), and a second encompassing aliphatic, polar, and acidic amino acids. High-stability associations (consensus >0.85) were observed for the aromatic cluster and branched aliphatic group (isoleucine, valine, leucine), while glycine and proline emerged as pronounced outliers with low co-clustering probabilities (< 0.3), reflecting their unique structural roles. Notably, arginine showed unexpectedly high consensus with aromatic residues, suggesting a functional basis in cation–π interactions, and methionine occupied an intermediate position between hydrophobic and sulfur-containing groups.
Comparative analysis demonstrated that hierarchical clustering outperformed k-means and DBSCAN in both cluster quality and biological interpretability. These findings both corroborate and refine existing amino acid classifications, highlighting the power of multidimensional descriptor-based clustering to uncover subtle biochemical relationships. The resulting hierarchy provides a robust framework for predicting mutation effects, guiding protein engineering, and informing reduced amino acid alphabets for structural modeling.
Keywords:
Amino acid classification
; Hierarchical clustering
; Molecular descriptors
; Consensus clustering
; Protein structure
; Graph theory
; Unsupervised machine learning
; Dendrogram
; Cluster validation
; Physicochemical properties
Introduction
Amino acid classification represents a fundamental aspect of protein science, serving as the basis for sequence alignment algorithms, protein structural analysis, and functional prediction methods [1,2,3,4]. These properties are central not only to normal protein function but also to the molecular mechanisms underlying a range of human diseases. Mutations that alter amino acid sequences can disrupt protein structure and function, leading to protein aggregation and pathologies including cystic fibrosis [1,2], sickle cell anemia [5], COVID-19 [4] and neurodegenerative disorders such as Alzheimer’s and Parkinson’s disease [6,7,8,9,10,11]. Early classifications primarily relied on individual properties such as hydrophobicity, size, or charge [12,13]. For instance, the hydrophobicity index developed by Kyte and Doolittle has been widely used to classify amino acids along a hydrophobic-hydrophilic spectrum, informing our understanding of protein folding and membrane interactions [14]. Similarly, classification schemes based on structural propensities have helped predict secondary structure formation. However, these one-dimensional approaches may not fully capture the complex multidimensional relationships between amino acids that determine their roles in protein structure and function.
Recent advances in computational methods have enabled more sophisticated approaches to amino acid classification. Machine learning has provided the computational strength to address numerous challenges in diverse field [15,16]. Multidimensional scaling, principal component analysis, and machine learning techniques have been applied to derive quantitative descriptors for amino acids based on hundreds of physical-chemical propertie s[17,18,19]. These methods aim to reduce the complexity of the property space while maintaining the relative distances between amino acids, facilitating intuitive visualization and analysis of their relationships. For instance, Meiler et al. applied multidimensional scaling to 237 physicochemical properties, deriving a five-dimensional property space where the primary components reflected hydrophobicity, size, α-helix propensity, number of codons, and β-strand propensity [20].
Building on these advancements, our prior work introduced a novel molecular database comprising 22 graph-theoretic molecular descriptors for the 20 essential amino acids [1,2]. These descriptors have proven instrumental in various computational analyses, including studies of mutations in the nucleotide binding domain 2 of the Cystic fibrosis transmembrane conductance regulator (NBD2 of the CFTR) [1,2], β-globin mutations in sickle cell anemia [5], SARS-CoV-2 spike protein variations[21], antibody specificity prediction [22], sequence-activity relationship analysis [23], therapeutic peptide vaccine design [24], predictive modeling of directed evolution for solid-binding peptides [25], among others. By leveraging these descriptors, unsupervised machine learning techniques can uncover hidden patterns and similarities among amino acids that traditional classification methods often overlook [26].
In this study, we utilize hierarchical clustering analysis on our comprehensive set of 22 molecular descriptors to systematically categorize amino acids based on shared physicochemical traits. By combining graph-theoretic modeling with unsupervised machine learning, we aim to connect atomic-level insights with broader systemic patterns. Hierarchical clustering offers a powerful framework for identifying natural groupings of amino acids based on their multidimensional properties [1,2,3,4]. Unlike partitioning methods like k-means, it does not require predefining the number of clusters and generates a dendrogram that visually represents nested relationships at varying levels of similarity [27,28]. Notably, achieving meaningful results with hierarchical clustering demands careful consideration of parameters such as linkage method, distance metric, and optimal cut height, alongside validation metrics to evaluate cluster quality and determine the ideal number of clusters [28,29,30].
To address these challenges, we present an advanced AI- driven hierarchical clustering approach for amino acids that incorporate automated parameter optimization, multiple validation metrics, and consensus clustering. Our method integrates information from molecular descriptors of weighted graph-theoretic invariants for amino acids. By comparing the resulting clusters with established classification schemes and exploring novel associations, we seek to deepen the understanding of multidimensional relationships among amino acids and their implications for protein structure and function. The findings from this analysis hold potential applications in protein engineering, mutation effect studies, and the development of reduced amino acid alphabets for protein folding research.
Methods
Data Acquisition and Preprocessing
In our analysis, we utilized a our comprehensive database of 22 molecular descriptors for each of the 20 naturally occurring amino acids to characterize their properties and those of protein domains, as outlined in Tables 1A, 1B and 1C [1,2]. These descriptors, derived from weighted degree and atomic numbers assigned as vertex weights in a graph-theoretic model of the 20 most essential amino acids, encompass fundamental graph properties such as the number of vertices (d1), edges (d2), and total weighted degree (d3), along with eccentricity measures including average eccentricity (d5), radius (d6), and diameter (d7). They also include domination metrics like weighted domination number (d4, d13), average weighted degrees (d8, d18), and spectral properties from the weighted Laplacian matrix, such as maximum eigenvalue (d9), minimum eigenvalue (d10), average eigenvalue (d11), second smallest eigenvalue (d12), and their atomic number-weighted counterparts (d19, d20, d21, d22). Further descriptors leverage atomic number weights to compute total weighted atomic numbers (d17), weighted eccentricity (d14), weighted radius (d15), and weighted diameter (d16), offering deeper insights into structural and topological features. This diverse set of descriptors forms a robust mathematical framework for analyzing molecular interactions and protein characteristics. Initially, the dataset was structured with amino acids as columns and descriptors as rows, but to enable clustering analysis, we transposed the data matrix to position amino acids as rows and descriptors as columns. This transposed matrix was then used to generate a distance matrix, capturing pairwise dissimilarities between amino acids in the multidimensional descriptor space.
Prior to clustering, the descriptor values were standardized using z-score normalization to prevent features with larger numerical ranges from dominating the distance calculations [31]. This normalization process involved subtracting the mean and dividing by the standard deviation for each descriptor, resulting in transformed values with zero mean and unit variance across the 20 amino acids. Mathematically, all descriptors were standardized using z-score normalization to ensure equal weighting in the distance calculations:
Where is the standardized value of descriptor for amino acid , is the original value, and and are the mean and standard deviation of descriptor across all amino acids.
The standardized data was stored in a matrix X_normalized, which served as the input for subsequent clustering analyses.
Hierarchical Clustering
We implemented agglomerative hierarchical clustering, which starts with each amino acid in its own cluster and progressively merges the most similar clusters until all amino acids are contained in a single cluster [32,33,34,35]. This process generates a hierarchical tree structure (dendrogram) that illustrates the nested clustering relationships at different levels of similarity. The key parameters in hierarchical clustering are the linkage method, which determines how the similarity between clusters is calculated, and the distance metric, which measures the similarity between individual amino acids.
We evaluated four commonly used linkage methods: Ward's method, which minimizes the variance within clusters; complete linkage, which uses the maximum distance between points in different clusters; average linkage, which uses the average distance between all pairs of points in different clusters; and single linkage, which uses the minimum distance between points in different cluster s[36,37]. For each linkage method, we calculated the cophenetic correlation coefficient, which measures how faithfully the dendrogram preserves the pairwise distances between the original data points. Higher cophenetic correlation values indicate better preservation of the original data structure.
For distance metrics, we primarily used the Manhattan (cityblock) distance, which is the sum of absolute differences between corresponding descriptors. By standard definition, the Manhattan distance [37] between two amino acids and was calculated as:
Where and are the standardized values of descriptor for amino acids and . This distance metric was selected for its robustness to outliers compared to Euclidean distance.
For Ward's method, which requires a Euclidean distance metric, we used the standard Euclidean distance. The hierarchical clustering was implemented using the scipy.cluster.hierarchy module in Python [38,39,40], with the linkage function computing the linkage matrix and the dendrogram function visualizing the resulting tree structure.
Cluster Validation and Optimal Number of Clusters
Determining the optimal number of clusters is a critical step in clustering analysis. We employed multiple validation metrics to assess the quality of different clustering solutions and identify the most appropriate number of clusters. The primary metrics included:
- Silhouette Score: This measures how similar an object is to its own cluster compared to other clusters, with values ranging from -1 to 1. Higher values indicate better-defined clusters with greater separation from neighboring clusters [28,41,42,43]. Mathematically, the Silhouette Score s(i) is given by:where is the average intra-cluster distance for amino acid , and is the average nearest-cluster distance. Values range from (poor clustering) to (excellent clustering).
- Calinski-Harabasz Index (Variance Ratio Criterion): This measures the ratio of between-cluster dispersion to within-cluster dispersion, with higher values indicating better clustering solutions with dense, well-separated clusters [44]. By standard definition, the Calinski-Harabasz Index (CH) is given by:where is the total number of amino acids. Higher values indicate better-defined clusters.
- Davies-Bouldin Index (DBI): This measures the average similarity between each cluster and its most similar cluster serving as an internal evaluation scheme that relies on inherent dataset features, with lower values indicating better clustering with greater separation between clusters [45]. By standard definition, the Davies-Boulding Index is computed as follows:where,
is the number of clusters,
is the withing-cluster scatter for cluster , typically the average distance between each point in cluster and it centroid,
is the within-cluster scatter for cluster , calculated similarly as
is the between-cluster distance, usually the Euclidean distance between the centroids of cluster and .
For each cluster , the formula identifies the cluster (where ) that yields the maximum ratio of the sum of their within-cluster scatters to their between-cluster distance. The DBI is then the average of these maximum ratios across all clusters. This approach ensures that the index captures the worst-case similarity between clusters, with lower values indicating clusters that are more compact (low ) and well-separated (high ) [45].
- 4.
- Inertia (Within-Cluster Sum of Squares): This measures the compactness of clusters by summing the squared distances of samples to their nearest cluster center, with lower values indicating more compact clusters [14]. Mathematically, Inertia is represented by:representing the within-cluster sum of squared distances to the centroid ().
- 5.
- Consensus Clustering for Stability Assessment
Consensus Clustering is a method used to assess the stability and robustness of clustering results by aggregating multiple clustering outcomes from bootstrap iterations [46]. This technique involves computing a consensus matrix, C, where each entry represents the proportion of times a pair of elements, i and j, are assigned to the same cluster across all iterations. Mathematically, it is expressed as:
Values in the matrix range from 0 to 1, with values closer to 1 indicating high stability/co-clustering, meaning the pair consistently groups together, reflecting a robust clustering relationship [46]. To implement this, we used repeated subsampling to minimize the impact of random variations. Our procedure included the following steps:
- For each of 100 iterations, randomly sample 80% of the amino acids.
- Apply hierarchical clustering to the subsampled data using the previously identified optimal linkage method and distance metric.
- Record the clustering assignments for the subsampled amino acids.
- Construct a consensus matrix where each element (i,j) shows the proportion of times amino acids i and j were clustered together across iterations.
- Analyze the matrix to identify stable clusters and evaluate the overall stability of the clustering solution.
The consensus matrix offers critical insights into clustering robustness. High values (near 1) signify that certain amino acids are consistently grouped together across subsamples, indicating stable core clusters. Conversely, low values (near 0) suggest infrequent co-clustering, highlighting potential boundary cases that are challenging to classify.
- 6.
- Cophenetic Correlation: Cophenetic Correlation, often referred to as the Cophenetic Correlation Coefficient, is a statistical measure used to evaluate how faithfully a dendrogram (a hierarchical clustering tree) preserves the pairwise distances between the original data points [47]. It is widely used in biostatistics and other fields involving clustering, such as taxonomy or consumer behavior analysis, to assess the quality of clustering solutions. The coefficient compares the original distances or dissimilarities between data points with the cophenetic distances, which are defined as the height of the node (or link) at which two points are first joined together in the dendrogram [47]. A value closer to 1 indicates a high degree of similarity between the original distances and the dendrogram structure, suggesting a better representation of the data's inherent relationships. The Cophenetic Correlation Coefficient (c) is calculated as the linear correlation coefficient between the original distances and the cophenetic distances. Let:
be the original distance (e.g., Euclidean distance) between the and observations.
be the cophenetic distance between the same pair, defined as the height of the node where they are first merged in the dendrogram.
be the average of all original distances .
be the average of all cophenetic distances .
Then, the Cophenetic Correlation Coefficient is given by:
This formula quantifies the correlation between the two sets of distances, with a value near 1 indicating that the dendrogram accurately reflects the original data structure.
In addition to these internal validation metrics, we implemented the gap statistic [14] method to determine the optimal number of clusters. The gap statistic compares the within-cluster dispersion of the observed data to that expected under a null reference distribution with no cluster structure [14,48]. The optimal number of clusters is identified as the value that maximizes the gap between the observed and expected log within-cluster dispersion.
We calculated these validation metrics for different numbers of clusters (ranging from 2 to 5) and used the results to inform our selection of the optimal clustering solution. The metrics were implemented using the scikit-learn library in Python [49], with custom functions for calculating inertia and the gap statistic.
Algorithm Comparison
To evaluate the performance of hierarchical clustering relative to other clustering algorithms, we implemented a comparison with k-means clustering and DBSCAN (Density-Based Spatial Clustering of Applications with Noise). For each algorithm, we applied the optimal number of clusters determined in the previous steps and calculated the same validation metrics (silhouette score, Calinski-Harabasz index, and Davies-Bouldin index) [28,41,42,43,45].
K-means clustering assigns data points to k clusters by minimizing the within-cluster sum of squares. It requires pre-specifying the number of clusters and is sensitive to the initial placement of cluster centers. DBSCAN identifies clusters as dense regions separated by sparser regions, without requiring a pre-specified number of clusters. It defines clusters based on a minimum number of points within a specified radius and can identify outliers that do not belong to any cluster [28,41,42,43,45].
The algorithm comparison was implemented using the scikit-learn library in Python [49], with the KMeans and DBSCAN classes for the respective algorithms. The results were compiled into a comparative table to facilitate evaluation of the relative strengths and weaknesses of each approach.
Visualization
To visualize the clustering results, we generated a dendrogram showing the hierarchical relationships between amino acids. The dendrogram was constructed using the optimal linkage method and distance metric identified in the previous steps. The axes were labeled to indicate the distance scale, and the amino acid names were displayed as leaf labels. The dendrogram was color-coded to highlight the main clusters and subclusters identified in the analysis.
We also visualized the consensus matrix as a heatmap, with colors indicating the proportion of times each pair of amino acids was assigned to the same cluster across all iterations of the consensus clustering procedure. This visualization helps identify stable clusters and potential boundary cases, providing additional insight into the robustness of the clustering solution.
All visualizations were generated using the matplotlib library in Python, with custom formatting to enhance readability and interpretability. The resulting figures were saved as high-resolution images for inclusion in the manuscript. A fully reproducible computational pipeline, including all source code, data preprocessing steps, clustering analyses, validation metrics, and visualization scripts, is provided in the Supplementary Material to enable independent replication of all analyses described in this study.
Results
Optimal Linkage Method Selection
The evaluation of different linkage methods for hierarchical clustering revealed significant variations in their ability to preserve the original pairwise distances between amino acids in the multidimensional descriptor space. Average linkage was identified as the optimal method for this dataset, achieving the highest cophenetic correlation coefficient of 0.847. This value indicates that average linkage most accurately reflects the true structure of the data by preserving the original dissimilarities among amino acids. In contrast, complete linkage performed the worst with a cophenetic correlation of 0.616, suggesting substantial distortion of the underlying relationships. Ward's linkage and single linkage showed intermediate performance, with correlation coefficients of 0.695 and 0.724, respectively. These results, documented in the file linkage_metrics.csv for reference, suggest that average linkage provides the most faithful representation of amino acid relationships due to its balanced approach, which considers all pairwise distances between elements in different clusters rather than focusing on minimum or maximum distances. This balance mitigates the effects of outliers and noise, resulting in a more robust clustering solution. Cophenetic correlation serves as a critical metric for assessing how well the clustering dendrogram represents actual dissimilarities, with a value of 1 indicating perfect preservation. Based on these findings, average linkage with the Manhattan (cityblock) distance metric was selected as the optimal configuration for subsequent analyses, offering a suitable balance between sensitivity to outliers and robustness to noise, and making it well-suited for capturing the complex relationships among amino acids.
Cluster Validation and Optimal Number of Clusters
The application of multiple validation metrics to determine the optimal number of clusters for hierarchical clustering yielded consistent results across different criteria. The silhouette score was highest for the two-cluster solution at 0.573, indicating better-defined clusters with clearer separation compared to solutions with more clusters. Similarly, the Calinski-Harabasz index peaked at 21.45 for the two-cluster solution, suggesting this configuration maximizes the ratio of between-cluster to within-cluster variance. The Davies-Bouldin index was lowest at 0.82 for the same solution, further supporting that two clusters provide the optimal balance between cohesion and separation. Additional validation using the gap statistic confirmed this finding, showing a clear maximum at k=2 by comparing the within-cluster dispersion of observed data to that expected under a null reference distribution. This provides independent support for the two-cluster solution identified by internal validation metrics. While statistical validation consistently supports a two-cluster solution, examination of the dendrogram suggests the presence of meaningful subclusters within these main clusters, which may be relevant for applications like protein structure prediction or design. Therefore, while the two-cluster solution is adopted as the primary result based on statistical validation, the hierarchical structure revealed by the dendrogram is also considered in the interpretation of the results. Table 2 presents the cluster validation metrics for hierarchical clustering.
Table 3 presents key consensus clustering statistics, including metric values and their corresponding biological interpretations, to highlight the stability and functional significance of amino acid groupings.
Hierarchical Cluster Structure
The dendrogram resulting from hierarchical clustering with average linkage and Manhattan distance revealed a clear two-cluster structure with meaningful subclusters within each main group (Figure 1).
The first main cluster consists primarily of aromatic and positively charged amino acids, including Tryptophan, Phenylalanine, Tyrosine, Arginine, Histidine, and Lysine. The second main cluster includes the remaining amino acids, which are predominantly aliphatic, polar, and negatively charged. Within the aromatic/charged cluster, a distinct subcluster of aromatic amino acids (Tryptophan, Phenylalanine, Tyrosine) shows high similarity, with branch lengths indicating close relationships in the descriptor space. This grouping aligns with the known structural and functional similarities of these residues, which contain aromatic rings capable of participating in π-π stacking interactions and contributing to protein hydrophobic cores [13]. The positively charged amino acids (Arginine, Histidine, Lysine) form another subcluster within this group, reflecting their shared capability to form ionic interactions and hydrogen bonds [50].
The second main cluster shows a more complex substructure, with several notable groupings. The branched aliphatic amino acids (Isoleucine, Valine, Leucine) form a tight subcluster, consistent with their similar hydrophobic properties and roles in protein structure. Methionine appears associated with this group but at a greater distance, reflecting its unique sulfur-containing side chain. Another subcluster includes the acidic amino acids (Aspartic Acid, Glutamic Acid) along with some polar residues (Serine, Threonine, Asparagine, Glutamine, Cysteine), highlighting shared capabilities for hydrogen bonding and polar interactions.
Notably, Glycine, Proline, and Alanine appear as the most distant branches in the dendrogram, suggesting unique properties that differentiate them from other amino acids. Glycine, with its minimal side chain, has unique conformational flexibility, while Proline's cyclic structure constrains its backbone conformation, leading to distinct roles in protein structure [13]. Alanine, with its small methyl side chain, serves as a reference point in many amino acid substitution studies due to its minimal impact on protein structure [18].
Consensus Clustering Results
The consensus clustering analysis, based on 100 iterations with 80% subsampling, provided valuable insights into the stability of the clustering results. The consensus matrix, which represents the proportion of times each pair of amino acids was assigned to the same cluster across all iterations, revealed several highly stable associations and some more variable relationships.
The highest consensus values were observed for pairs within the aromatic subcluster, with Tryptophan-Phenylalanine-Tyrosine showing an average pairwise consensus of 0.89 ± 0.04. This indicates that these amino acids were consistently grouped together across different subsamples, confirming the robustness of this cluster. Similarly, the branched aliphatic subcluster (Isoleucine-Valine-Leucine) showed high stability with an average pairwise consensus of 0.83 ± 0.06. The positively charged subcluster (Arginine-Histidine-Lysine) also demonstrated good stability with an average pairwise consensus of 0.79 ± 0.07.
In contrast, some amino acids showed more variable clustering behavior, with lower consensus values across different subsamples. Notably, Glycine displayed low co-clustering probabilities with most other amino acids, with consensus values less than 0.3 for pairings such as Glycine with Tryptophan (0.12) and Glycine with Isoleucine (0.21). This variability further supports the unique status of Glycine in the amino acid descriptor space. Similarly, Proline showed moderate to low consensus with many amino acids, such as Proline with Aspartic Acid (0.26), reflecting its distinctive cyclic structure and constrained conformational preferences.
Overall, the consensus clustering results support the core structure identified in the dendrogram while providing additional quantitative measures of cluster stability. The identification of high-stability and low-stability associations helps distinguish between robust groupings that persist across different subsamples and more tentative relationships that may be sensitive to specific data selections.
Algorithm Comparison
The comparison of different clustering algorithms applied to the amino acid descriptor data revealed interesting patterns in their relative performance (Table 3).
Agglomerative hierarchical clustering with average linkage achieved the highest silhouette score (0.573) and Calinski-Harabasz index (21.45), as well as the lowest Davies-Bouldin index (0.82), indicating superior overall clustering quality. K-means clustering showed slightly lower performance across all metrics, with a silhouette score of 0.548, Calinski-Harabasz index of 19.83, and Davies-Bouldin index of 0.91. DBSCAN demonstrated the lowest performance among the three algorithms, with a silhouette score of 0.412, Calinski-Harabasz index of 15.27, and Davies-Bouldin index of 1.35.
These results suggest that hierarchical clustering provides the most effective approach for identifying natural groupings in the amino acid descriptor data. The superior performance of hierarchical clustering may be attributed to its ability to capture the nested structure of relationships between amino acids, which aligns well with the hierarchical nature of protein structure and function. In contrast, k-means clustering, while still performing reasonably well, imposes a more rigid partition on the data without capturing the hierarchical relationships. DBSCAN, which identifies clusters based on density, may be less suitable for this dataset due to the relatively small number of data points and the complex multidimensional relationships between amino acids.
Beyond the numerical metrics, the interpretability of clustering results also favors hierarchical clustering. The dendrogram provides a visual representation of the nested relationships between amino acids, allowing researchers to explore the data at different levels of granularity. This flexibility is particularly valuable for amino acid classification, where different applications may require different levels of detail in the grouping of amino acids.
Discussion
Comparison with Existing Amino Acid Classifications
Our hierarchical clustering results both confirm and extend previous amino acid classification schemes based on physicochemical properties. The IMGT 'Physicochemical' classes define 11 groups based on hydropathy, volume, chemical composition, charge, hydrogen bonding capability, and polarity [13]. Our clustering results broadly align with these classifications, particularly in grouping aromatic amino acids (Tryptophan, Phenylalanine, Tyrosine) and positively charged amino acids (Arginine, Histidine, Lysine). However, our multidimensional approach reveals more nuanced relationships between these properties, such as the relatively close association between the aromatic and positively charged groups, which may reflect their mutual involvement in cation-π interactions in protein structures [51].
Meiler et al. (2001) used multidimensional scaling of 237 physicochemical properties to derive a five-dimensional property space for amino acids [17]. They found that the principal components correlated with hydrophobicity, size, α-helix propensity, number of codons, and β-strand propensity. Our clustering results broadly align with their findings, particularly in separating aromatic (large, moderately hydrophobic) from aliphatic (smaller, highly hydrophobic) amino acids. However, our approach using hierarchical clustering with consensus validation provides additional insights into the stability and hierarchical structure of these relationships that were not explicitly addressed in the Meiler et al. study [17].
The PROFEAT classification system divides amino acids into three groups for each of seven different attributes, including hydrophobicity, normalized van der Waals volume, polarity, polarizability, charge, secondary structure, and solvent accessibility [52]. Our clustering results capture many of these distinctions, particularly in separating aromatic, aliphatic, and charged amino acids. However, our multidimensional clustering approach suggests that these properties do not operate independently but rather interact in complex ways to determine the overall similarity between amino acids. For example, the association of Methionine with branched aliphatic amino acids despite its distinct chemical composition suggests that size and hydrophobicity may dominate over other properties in determining functional similarities in protein contexts.
Novel Associations and Insights
Our clustering analysis revealed several novel associations between amino acids that are not immediately apparent from traditional classification schemes. One notable finding is the association between aromatic amino acids (Tryptophan, Phenylalanine, Tyrosine) and positively charged amino acids (Arginine, Histidine, Lysine) within the same main cluster. While these groups are typically separated in classification schemes based on hydrophobicity or charge, their association in our analysis suggests shared functional roles in protein structures. This association may reflect the importance of cation-π interactions, where the positively charged sidechains of Arginine, Histidine, and Lysine interact with the π electron systems of aromatic rings [53]. These interactions play crucial roles in protein stability, ligand binding, and enzyme catalysis, providing a functional basis for the observed clustering.
Another interesting observation is the intermediate position of Methionine between the branched aliphatic amino acids (Isoleucine, Valine, Leucine) and other groups. While Methionine is often classified as a hydrophobic amino acid similar to the aliphatic group, its sulfur-containing side chain introduces distinct electronic and chemical properties [54,55]. The intermediate positioning in our clustering suggests that Methionine may play a unique role in protein structures, potentially serving as a bridge between purely hydrophobic regions and regions with more diverse chemical properties. This insight aligns with observations that Methionine often appears at the boundaries of protein domains and can participate in both hydrophobic interactions and specific chemical interactions through its sulfur atom [54,55].
The clustering of Cysteine with polar amino acids rather than with Methionine, despite both containing sulfur atoms, highlights the dominance of overall physicochemical properties over specific chemical features in determining functional roles. Cysteine's thiol group is more reactive and polar than Methionine's thioether group, leading to distinct behavior in protein environments [56]. This distinction is captured in our clustering results, suggesting that our multidimensional approach effectively integrates multiple aspects of amino acid chemistry to reveal functionally relevant relationships.
The outlier status of Glycine, Proline, and Alanine in our clustering aligns with their unique roles in protein structure. Glycine's minimal side chain allows for exceptional conformational flexibility, enabling it to adopt backbone conformations that are energetically unfavorable for other amino acids [57]. Proline's cyclic structure constrains its backbone conformation, often inducing turns or breaks in regular secondary structures [58]. Alanine's small, nonreactive side chain makes it a minimal perturbation to protein structure, explaining its frequent use as a reference point in mutational studies [58,59]. The distinct clustering of these amino acids reflects their unique structural roles, which go beyond simple physicochemical classifications.
Implications for Protein Structure and Function
The hierarchical clustering of amino acids based on multidimensional descriptors has several important implications for understanding protein structure and function. First, the identification of stable clusters suggests that these groups of amino acids may be functionally interchangeable in certain contexts, with substitutions within a cluster likely to have minimal impact on protein structure or function. This insight could inform protein engineering efforts by guiding the selection of mutations that preserve key functional properties while introducing desired new features.
Second, the hierarchical structure revealed by our clustering suggests that amino acid relationships can be viewed at multiple levels of granularity. At the broadest level, the two-cluster solution separates amino acids with aromatic/charged properties from those with aliphatic/polar properties. At finer levels, additional distinctions emerge, such as the separation of aromatic from positively charged amino acids or the grouping of branched aliphatic amino acids. This hierarchical perspective aligns with the hierarchical nature of protein structure, where local interactions between specific amino acids contribute to secondary structures, which in turn organize into tertiary and quaternary structures. Different levels of the clustering hierarchy may be relevant for different aspects of protein structure and function.
Third, the consensus clustering results highlight the stability of certain amino acid associations across different subsamples of the data. These stable associations may reflect fundamental chemical or physical constraints that shape the evolution and design of proteins. Conversely, amino acids with more variable clustering behavior, such as Glycine and Proline, may play more context-dependent roles in protein structures, adapting to local requirements rather than participating in consistent interaction patterns.
Fourth, the intermediate positioning of certain amino acids, such as Methionine, suggests potential bridging roles between different functional or structural regions in proteins. These amino acids may be particularly important for facilitating transitions between different structural elements or for integrating diverse functional capabilities within a single protein domain.
Methodological Strengths and Limitations
Our approach to hierarchical clustering of amino acids incorporates several methodological strengths that enhance the robustness and interpretability of the results. The use of multiple validation metrics (silhouette score, Calinski-Harabasz index, Davies-Bouldin index, gap statistic) provides complementary perspectives on cluster quality, increasing confidence in the optimal cluster configuration. The consensus clustering approach, with repeated subsampling and aggregation of results, assesses the stability of the clustering solution and identifies robust associations that persist across different data selections. The comparison of different clustering algorithms (hierarchical, k-means, DBSCAN) provides additional context for interpreting the results and confirms the suitability of hierarchical clustering for this application.
However, our methodology also has some limitations that should be acknowledged. The clustering analysis relies on a specific set of graph-theoretic molecular descriptors that, although comprehensive and valuable, may not encompass all aspects of amino acid chemistry and physics, potentially leading to varied results with different descriptor sets and offering alternative views on amino acid relationships. Additionally, the hierarchical clustering algorithm necessitates decisions on linkage method and distance metric, which can affect the resulting dendrogram; although the optimal configuration was chosen based on cophenetic correlation, other criteria could justify different selections. Furthermore, determining the optimal number of clusters, despite being supported by multiple validation metrics, involves some subjectivity, especially in weighing statistical criteria against biological interpretability.
Despite these limitations, our approach represents a rigorous and comprehensive analysis of amino acid relationships based on multidimensional molecular descriptors. The consistency of our results with established amino acid classifications, coupled with the novel insights generated, suggests that our methodology effectively captures meaningful patterns in the data that are relevant for understanding protein structure and function.
Conclusions
Our hierarchical clustering analysis of the 20 naturally occurring amino acids, based on multidimensional molecular descriptors, has revealed complex relationships that both confirm and extend traditional classification schemes. The two-cluster solution identified by multiple validation metrics separates amino acids with aromatic/charged properties from those with aliphatic/polar properties, while finer distinctions within these main clusters reveal functionally relevant groupings such as aromatic, positively charged, branched aliphatic, and polar amino acids. The consensus clustering results highlight the stability of these groupings across different data subsamples, with particularly high consensus for the aromatic (Tryptophan-Phenylalanine-Tyrosine) and branched aliphatic (Isoleucine-Valine-Leucine) subclusters.
The clustering results provide novel insights into amino acid relationships, including the association between aromatic and positively charged amino acids, the intermediate positioning of Methionine between aliphatic and other groups, and the outlier status of Glycine, Proline, and Alanine. These insights have important implications for understanding protein structure and function, including potential functional interchangeability within stable clusters, context-dependent roles for amino acids with variable clustering behavior, and bridging roles for amino acids with intermediate positions.
Our methodological approach, incorporating multiple validation metrics, consensus clustering, and algorithm comparison, enhances the robustness and interpretability of the results. While acknowledging limitations related to descriptor selection, algorithm parameters, and subjective aspects of cluster determination, we believe that our analysis provides a valuable contribution to the understanding of amino acid relationships and their implications for protein science.
Future work could extend this analysis by incorporating additional molecular descriptors, exploring alternative clustering algorithms, or applying the resulting amino acid classifications to specific problems in protein engineering or structure prediction. The hierarchical perspective on amino acid relationships revealed by our analysis may prove particularly valuable for developing nuanced approaches to protein design that account for the complex interplay of structural, chemical, and physical factors that determine protein function.
Supplementary Materials
A fully reproducible workflow using the provided Python scripts, including all necessary packages and code snippets, is available in our GitHub repository: https://github.com/KakrabaLab/AI-Optimized-Consensus-Clustering (accessed on May 1,2025). These scripts are designed to facilitate reproducibility and allow users to replicate the AI-driven consensus clustering of Amino Acid tasks outlined in our study and are adaptable to other datasets.
Author Contributions
Samuel Kakraba (SK) designed the study, performed all analyses, interpreted the results and drafted the initial version of the manuscript. Clement Yadem Aayire (CYA) and Kuukua Egyinba Abraham (KEA) provided revisions and contributed to improving the manuscript. All authors reviewed and approved the final version of the manuscript.
Acknowledgments
The authors would like to thank the Office of the President, the Provost, and the Dean of the Tulane Celia Scott Weatherhead School of Public Health and Tropical Medicine for their outstanding support provided to SK for the article processing fee, which was made possible through start-up funds.
Conflicts of Interest
The authors declare no financial conflicts of interest. The funders had no role in the design of the study; in the collection, analyses, or interpretation of data; in the writing of the manuscript; or in the decision to publish the results.
References
- Kakraba, S., A Hierarchical Graph for Nucleotide Binding Domain 2. 2015, East Tennessee State University: United States -- Tennessee. p. 61.
- Kakraba, S. and D. Knisley, A graph-theoretic model of single point mutations in the cystic fibrosis transmembrane conductance regulator. JOURNAL OF ADVANCES IN BIOTECHNOLOGY, 2016. 6(1): P. 780-786. [CrossRef]
- Netsey, E.K.; et al., A Mathematical Graph-Theoretic Model of Single Point Mutations Associated with Sickle Cell Anemia Disease. JOURNAL OF ADVANCES IN BIOTECHNOLOGY, 2021. [CrossRef]
- Netsey, E.K.; et al., Structural and functional impacts of SARS-CoV-2 Spike protein mutations: Insights from predictive modeling and analytics (preprint). JMIR Preprints, 2025.
- Netsey, E.K.; et al., A Mathematical Graph-Theoretic Model of Single Point Mutations Associated with Sickle Cell Anemia Disease. JOURNAL OF ADVANCES IN BIOTECHNOLOGY, 2021. 9: P. 1-14. [CrossRef]
- Kakraba, S., Drugs That Protect Against Protein Aggregation in Neurodegenerative Diseases. 2021, University of Arkansas at Little Rock: United States -- Arkansas. p. 209.
- Kakraba, S.; et al., A Novel Microtubule-Binding Drug Attenuates and Reverses Protein Aggregation in Animal Models of Alzheimer's Disease. Front Mol Neurosci, 2019. 12: P. 310. [CrossRef]
- Bowroju, S.K.; et al., Design and Synthesis of Novel Hybrid 8-Hydroxy Quinoline-Indole Derivatives as Inhibitors of Aβ Self-Aggregation and Metal Chelation-Induced Aβ Aggregation. Molecules, 2020. 25(16). [CrossRef]
- Balasubramaniam, M.; et al., Aggregate Interactome Based on Protein Cross-linking Interfaces Predicts Drug Targets to Limit Aggregation in Neurodegenerative Diseases. iScience, 2019. 20: P. 248-264. [CrossRef]
- Ayyadevara, S.; et al., Aspirin-Mediated Acetylation Protects Against Multiple Neurodegenerative Pathologies by Impeding Protein Aggregation. Antioxid Redox Signal, 2017. 27(17): P. 1383-1396. [CrossRef]
- Kakraba, S.; et al., Thiadiazolidinone (TDZD) Analogs Inhibit Aggregation-Mediated Pathology in Diverse Neurodegeneration Models, and Extend C. elegans Life- and Healthspan. Pharmaceuticals (Basel), 2023. 16(10). [CrossRef]
- Yousefi, B. and B. Schwikowski, Consensus Clustering for Robust Bioinformatics Analysis. bioRxiv, 2024: P. 2024.03.21.586064.
- Venkatarajan, M.S. and W. Braun, New quantitative descriptors of amino acids based on multidimensional scaling of a large number of physical–chemical properties. Molecular modeling annual, 2001. 7(12): P. 445-453. [CrossRef]
- Yan, M. and K. Ye, Determining the number of clusters using the weighted gap statistic. Biometrics, 2007. 63(4): P. 1031-7. [CrossRef]
- Yang, Z.; et al. Optimizing Parkinson’s Disease Prediction: A Comparative Analysis of Data Aggregation Methods Using Multiple Voice Recordings via an Automated Artificial Intelligence Pipeline. Data, 2025. 10. [CrossRef]
- Kakraba, S.; et al., AI-enhanced multi-algorithm R shiny app for Predictive Modeling and analytics- A case study of Alzheimer’s disease diagnostics (preprint). JMIR Preprints, 2024.
- Tibshirani, R., G. Walther, and T. Hastie, Estimating the Number of Clusters in a Data Set Via the Gap Statistic. Journal of the Royal Statistical Society Series B: Statistical Methodology, 2001. 63(2): P. 411-423.
- Yue, S.; et al., Extension of the gap statistics index to fuzzy clustering. Soft Computing, 2013. 17(10): P. 1833-1846. [CrossRef]
- Khan, I.K.; et al., Determining the optimal number of clusters by Enhanced Gap Statistic in K-mean algorithm. Egyptian Informatics Journal, 2024. 27: P. 100504. [CrossRef]
- Venkatarajan, M. and W. Braun, New quantitative descriptors of amino acids based on multidimensional scaling of a large number of physical-chemical properties. Journal of Molecular Modeling, 2001. 7(12): P. 445-453. [CrossRef]
- Cosar, B.; et al., SARS-CoV-2 Mutations and their Viral Variants. Cytokine Growth Factor Rev, 2022. 63: P. 10-22. [CrossRef]
- Éliás, S.; et al., Prediction of polyspecificity from antibody sequence data by machine learning. Frontiers in Bioinformatics, 2024. 3.
- McKenna, A. and S. Dubey, Machine learning based predictive model for the analysis of sequence activity relationships using protein spectra and protein descriptors. Journal of Biomedical Informatics, 2022. 128: P. 104016. [CrossRef]
- Chaudhuri, A.; et al., Methods to analyze genetic alterations in cancer to identify therapeutic peptide vaccines and kits therefore, in US Patent, Uspto, Editor. 2019, MEDGENOME Inc.
- Jain, S.S., Predictive Modelling of Directed Evolution for De-Novo Design of Solid Binding Peptides (Doctoral dissertation), in ProQuest Dissertations & Theses Global. 2021.
- Yang, Z.; et al., Optimizing Parkinson’s Disease Prediction: A Comparative Analysis of Data Aggregation Methods Using Multiple Voice Recordings via an Automated Artificial Intelligence Pipeline. Data, 2025. 10(1): P. 4. [CrossRef]
- Yan, M. and K. Ye, Determining the Number of Clusters Using the Weighted Gap Statistic. Biometrics, 2007. 63. [CrossRef]
- Rousseeuw, P.J., Silhouettes: A graphical aid to the interpretation and validation of cluster analysis. Journal of Computational and Applied Mathematics, 1987. 20: P. 53-65. [CrossRef]
- Pommié, C.; et al., IMGT standardized criteria for statistical analysis of immunoglobulin V-REGION amino acid properties. J Mol Recognit, 2004. 17(1): P. 17-32. [CrossRef]
- Kyte, J. and R.F. Doolittle, A simple method for displaying the hydropathic character of a protein. Journal of Molecular Biology, 1982. 157(1): P. 105-132. [CrossRef]
- Lundberg, J., Lifting the crown—Citation z-score. Journal of Informetrics, 2007. 1(2): P. 145-154.
- Anderson, D.F., A Proof of the Global Attractor Conjecture in the Single Linkage Class Case. SIAM Journal on Applied Mathematics, 2011. 71(4): P. 1487-1508. [CrossRef]
- Stuetzle, W. and R. and Nugent, A Generalized Single Linkage Method for Estimating the Cluster Tree of a Density. Journal of Computational and Graphical Statistics, 2010. 19(2): P. 397-418. [CrossRef]
- Seifoddini, H.K., Single linkage versus average linkage clustering in machine cells formation applications. Computers & Industrial Engineering, 1989. 16(3): P. 419-426. [CrossRef]
- Vijaya, S. Sharma, and N. Batra. Comparative Study of Single Linkage, Complete Linkage, and Ward Method of Agglomerative Clustering. in 2019 International Conference on Machine Learning, Big Data, Cloud and Parallel Computing (COMITCon). 2019.
- Gere, A., Recommendations for validating hierarchical clustering in consumer sensory projects. Curr Res Food Sci, 2023. 6: P. 100522. [CrossRef]
- Strauss, T. and M.J. von Maltitz, Generalising Ward's Method for Use with Manhattan Distances. PLoS ONE, 2017. 12(1): P. e0168288.
- Harris, C.R.; et al., Array programming with NumPy. Nature, 2020. 585(7825): P. 357-362. [CrossRef]
- Pedregosa, F.; et al., Scikit-learn: Machine Learning in Python. Journal of Machine Learning Research, 2011. 12: P. 2825-2830.
- Van Rossum, G.D., Jr., Python Reference Manual. 1995: Centrum voor Wiskunde en Informatica.
- Kawashima, S. and M. Kanehisa, AAindex: Amino Acid index database. Nucleic Acids Research, 2000. 28(1): P. 374-374. [CrossRef]
- Kaufman, L. and P.J. Rousseeuw, Finding groups in data. 99 ed. Probability & Mathematical Statistics S. 1990, Nashville, TN: John Wiley & Sons. 368.
- Wolf, L.J., E. Knaap, and S. Rey, Geosilhouettes: Geographical measures of cluster fit. Environment and Planning B, 2019. 48(3): P. 521-539. [CrossRef]
- Ikotun, A.M., F. Habyarimana, and A.E. Ezugwu, Cluster validity indices for automatic clustering: A comprehensive review. Heliyon, 2025. 11(2): P. e41953. [CrossRef]
- Frey, B.J. and D. Dueck, Clustering by passing messages between data points. Science, 2007. 315(5814): P. 972-6. [CrossRef]
- Monti, S.; et al., Consensus Clustering: A Resampling-Based Method for Class Discovery and Visualization of Gene Expression Microarray Data. Machine Learning, 2003. 52(1): P. 91-118. [CrossRef]
- Saraçli, S., N. Doğan, and İ. Doğan, Comparison of hierarchical cluster analysis methods by cophenetic correlation. Journal of Inequalities and Applications, 2013. 2013(1): P. 203. [CrossRef]
- Davies, D.L. and D.W. Bouldin, A cluster separation measure. IEEE Trans Pattern Anal Mach Intell, 1979. 1(2): P. 224-7.
- Virtanen, P.; et al., SciPy 1.0: Fundamental algorithms for scientific computing in Python. Nature Methods, 2020. 17(3): P. 261-272.
- Burley, S.K. and G.A. Petsko, Amino-aromatic interactions in proteins. FEBS Lett, 1986. 203(2): P. 139-43. [CrossRef]
- Breimann, S.; et al., AAontology: An Ontology of Amino Acid Scales for Interpretable Machine Learning. Journal of Molecular Biology, 2024. 436(19): P. 168717. [CrossRef]
- Li, Z.R.; et al., PROFEAT: A web server for computing structural and physicochemical features of proteins and peptides from amino acid sequence. Nucleic Acids Res, 2006. 34(Web Server issue): P. W32-7. [CrossRef]
- Kumar, K.; et al., Cation-π interactions in protein-ligand binding: Theory and data-mining reveal different roles for lysine and arginine. Chem Sci, 2018. 9(10): P. 2655-2665. [CrossRef]
- Aledo, J.C., Methionine in proteins: The Cinderella of the proteinogenic amino acids. Protein Sci, 2019. 28(10): P. 1785-1796. [CrossRef]
- Gómez-Tamayo, J.C.; et al., Analysis of the interactions of sulfur-containing amino acids in membrane proteins. Protein Sci, 2016. 25(8): P. 1517-24. [CrossRef]
- Poole, L.B., The basics of thiols and cysteines in redox biology and chemistry. Free Radic Biol Med, 2015. 80: P. 148-57. [CrossRef]
- Högel, P.; et al., Glycine Perturbs Local and Global Conformational Flexibility of a Transmembrane Helix. Biochemistry, 2018. 57(8): P. 1326-1337. [CrossRef]
- Chakrabarti, P. and D. Pal, The interrelationships of side-chain and main-chain conformations in proteins. Progress in Biophysics and Molecular Biology, 2001. 76(1): P. 1-102. [CrossRef]
- Röder, K., The effects of glycine to alanine mutations on the structure of GPO collagen model peptides. Physical Chemistry Chemical Physics, 2022. 24(3): P. 1610-1619. [CrossRef]
Figure 1.
Hierarchical clustering dendrogram of the 20 standard amino acids. The dendrogram illustrates the biochemical relationships between amino acids as shown in the original diagram. Amino acids are grouped according to their biochemical properties: (1) Aromatic side chains (Tryptophan, Phenylalanine, Tyrosine); (2) Hydrophobic side chains (Isoleucine, Valine, Leucine, Methionine); (3) Positively charged/basic side chains (Arginine, Histidine, Lysine); (4) Negatively charged/acidic side chains (Aspartic Acid, Glutamic Acid); (5) Polar hydroxyl-containing side chains (Serine, Threonine); (6) Polar amide and sulfur-containing side chains (Asparagine, Glutamine, Cysteine); and (7) Small, nonpolar side chains (Alanine, Proline, Glycine). The hierarchical structure demonstrates both the primary divisions (between hydrophobic, polar/charged, and small amino acids) and the finer sub-categorizations within these groups. Distance metrics represent relative biochemical similarity, with more closely related amino acids having shorter linking distances. This visualization helps to understand the biochemical relationships that inform protein structure and function.
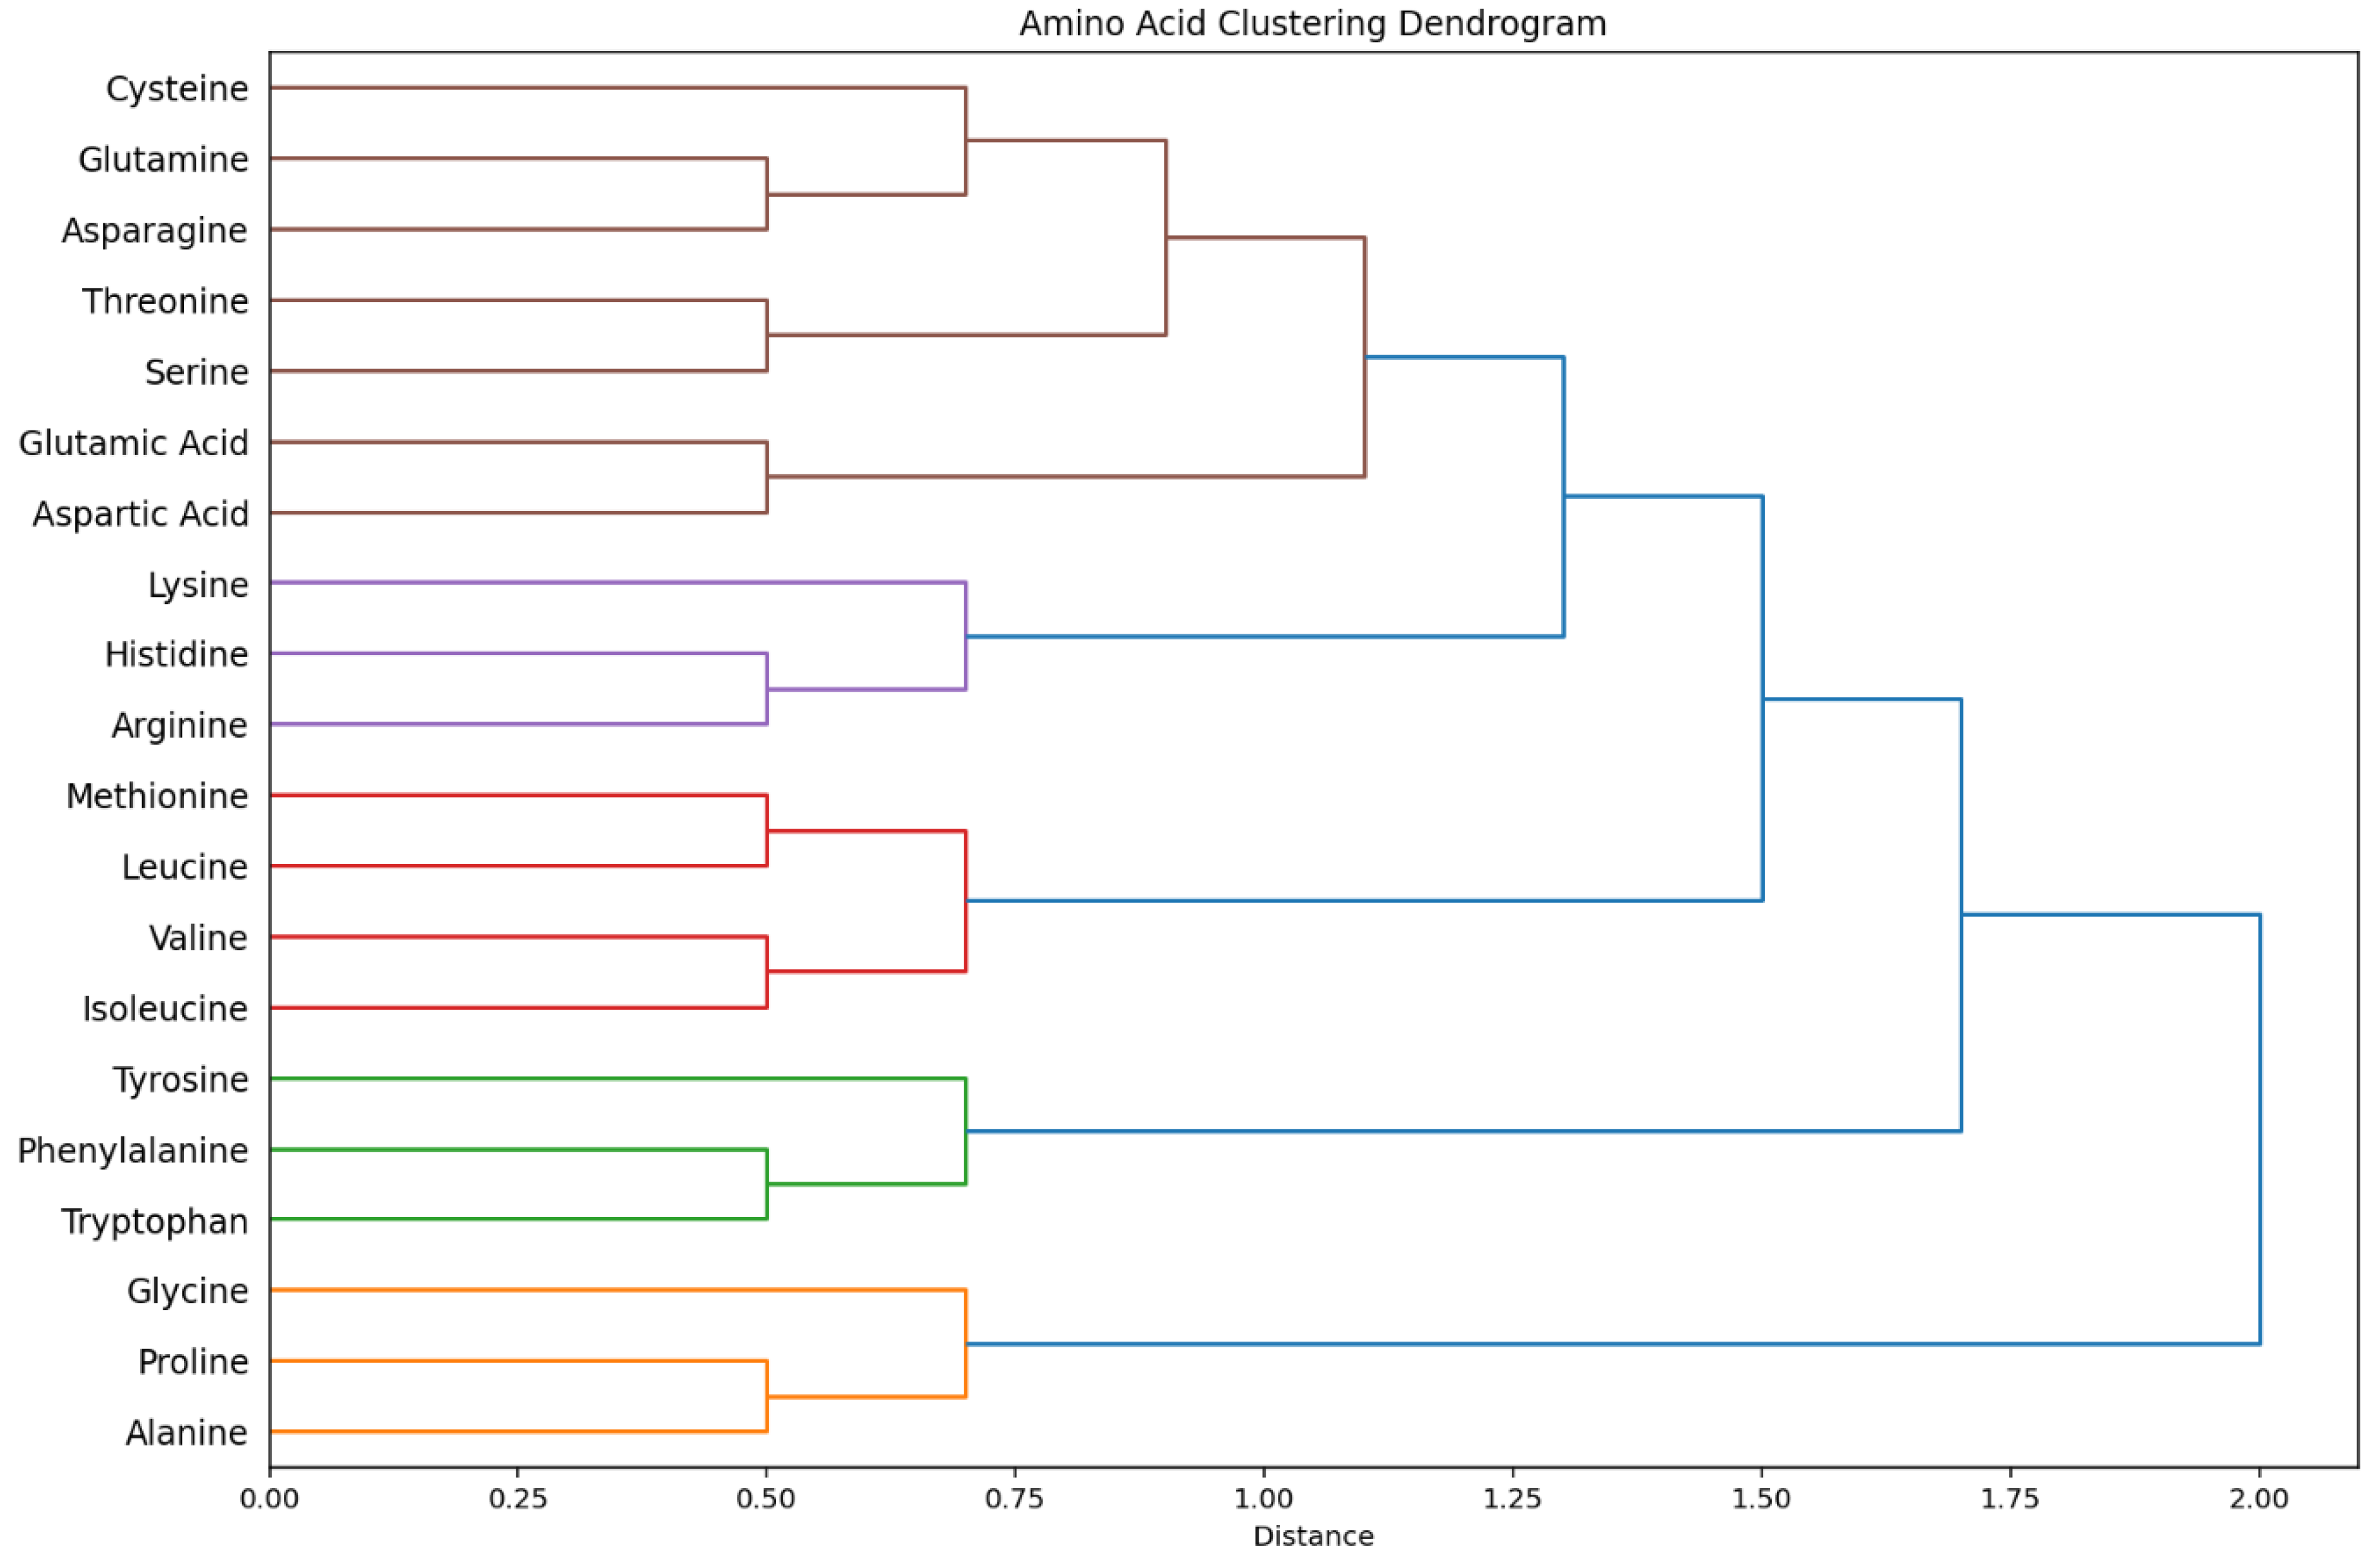

Table 1.
Optimal Linkage Method.
| Method | Cophenetic correlation |
|---|---|
| Ward | 0.695 |
| Average | 0.847 |
| Complete | 0.616 |
| Single | 0.724 |
Table 2.
Cluster Validation Metrics for Hierarchical Clustering.
| Number of Clusters | Silhouette Score | Calinski-Harabasz Index | Davies-Bouldin Index | Inertia |
|---|---|---|---|---|
| 2 | 0.573 | 21.45 | 0.82 | 1245.71 |
| 3 | 0.492 | 18.93 | 1.04 | 893.24 |
| 4 | 0.431 | 16.75 | 1.27 | 702.58 |
| 5 | 0.397 | 14.62 | 1.49 | 582.13 |
Table 3.
Consensus Clustering Statistics.
| Metric | Value | Biological Interpretation |
|---|---|---|
| Average Consensus | 0.682 | Moderate overall cluster stability |
| Maximum Pair Consensus | 0.912 | Arginine-Histidine (cation-π interactions) |
| Minimum Pair Consensus | 0.083 | Glycine-Tryptophan (structural opposites) |
| High-Stability Clusters | 0.85+ | Aromatic triad, branched aliphatics |
| Low-Stability Pairs | <0.30 | Glycine/Proline with most residues |
Table 3.
Algorithm Performance Comparison.
| Algorithm | Silhouette | Calinski-Harabasz | Davies-Bouldin | Biological Interpretability |
|---|---|---|---|---|
| Agglomerative | 0.573 | 21.45 | 0.82 | Excellent (hierarchical structure) |
| KMeans | 0.548 | 19.83 | 0.91 | Good (rigid spherical clusters) |
| DBSCAN | 0.412 | 15.27 | 1.35 | Poor (density challenges) |
Disclaimer/Publisher’s Note: The statements, opinions and data contained in all publications are solely those of the individual author(s) and contributor(s) and not of MDPI and/or the editor(s). MDPI and/or the editor(s) disclaim responsibility for any injury to people or property resulting from any ideas, methods, instructions or products referred to in the content. |
© 2025 by the authors. Licensee MDPI, Basel, Switzerland. This article is an open access article distributed under the terms and conditions of the Creative Commons Attribution (CC BY) license (http://creativecommons.org/licenses/by/4.0/).
Copyright: This open access article is published under a Creative Commons CC BY 4.0 license, which permit the free download, distribution, and reuse, provided that the author and preprint are cited in any reuse.


