Submitted:
02 May 2025
Posted:
06 May 2025
You are already at the latest version
Abstract
Background/Objectives: The line bisection task (LBT) is a well‐known test in which a horizontal line is presented in front of the subject and the subject is asked to draw a mark vertically bisecting the line. We developed the new LBT using three‐dimensionally transformed rectangles to enhance the sense of depth and evaluated the influence of vestibular dysfunction on the deviation. Methods: One hundred participants were recruited from patients referred to the vertigo outpatient clinic. The average deviation of the line bisection task was the leftward deviation in the figures viewed from the right‐side and the rightward deviation in the figures viewed from the left‐side, indicating that the figures were perceived three‐dimensionally, with the division point deviating to the far side. Results: In multivariate analysis of variance (MANOVA) analyses, the significant leftward deviation was observed in the group with vestibular dysfunction in caloric testing, and the significant rightward deviation dependent on increasing age was also observed. In univariate analyses, the significant leftward deviation in the figure viewed from the left side (135 degrees) was observed in the group with vestibular dysfunction in caloric testing, and the significant leftward deviation was also observed in figures viewed from the center, left orright side (0, 15 and 165 degrees) in the group with vestibular dysfunction in vHIT evaluation. Conclusions: Vestibular dysfunction can alter the deviation in the new LBT, suggesting the potential of the new LBT as an assessment of vestibular dysfunction.
Keywords:
line bisection task
; deviation
; pseudoneglect
; vestibular dysfunction
; caloric testing
; vHIT
1. Introduction
The line bisection task (LBT) is a well-known test in which a line is presented in front of the subject and the subject is asked to draw a mark vertically bisecting the line. The test was originally designed to detect visual field defects due to brain damage [1], and has been commonly used as a test for hemispheric neglect in clinical practice since around 1980. When this test is performed on normal subjects without brain damage, the division position tends to shift slightly to the left of the actual midpoint, which is called pseudoneglect (PN), and is considered to be one of the evidences of the dominance of the right cerebral hemisphere in information processing of the both hemispheres [2,3]. Many factors including age, sex, hemispheric dominance (dominant hand), direction of eye movements, line length, line direction, and variety of bisecting stimuli have been reported to influence the presence, degree, and direction of PN [2,3]. The vestibular function can be altered by applying electric current to the posterior part of the ear, which is called galvanic vestibular stimulation (GVS). The left or right vestibular imbalance caused by GVS can alter PN of the LBT to each side [4,5]. Ferré et al. reported that GVS induced polarity dependent effects in spatial perception in normal subjects, suggesting that GVS may affect the direction-dependent perception of body orientation in space (left-anodal and right-cathodal GVS induced a leftward bisection bias, while right-anodal and left-cathodal GVS induced a rightward bisection bias) [5]. Rorsman et al. assessed patients with right-hemisphere stroke with left neglect and found that left-anodal and right cathodal GVS decreased left neglect, i.e., induced the leftward deviation [6]. Utz et al. investigated the impact of GVS on performance in the line bisection task in right-brain damaged patients with or without left sided visual neglect, and found that both left-cathodal and right-cathodal GVS significantly reduced the rightward line bisection error (i.e., the leftward deviation compared to baseline and sham stimulation) as compared to the baseline and sham stimulation in left neglect patients, but not in control patients [7]. Oppenländer et al. reported that in patients with unilateral right-sided stroke with or without left neglect, subliminal right-anodal and left-cathodal GVS induced leftward bisection bias compared to sham stimulation, implicating the possibility of neurorehabilitation with GVS [8]. Contrary to the above studies, Ruet et al. evaluated the effect of GVS on the deviation of the LBT in patients with a first right ischemic or hemorrhagic stroke and unilateral spatial neglect, and found that GVS did not reduce spatial neglect symptoms in any of the stimulation conditions [9]. Based on these previous studies, the LBT can be a valuable tool for the evaluation of vertigo or dizziness disorders including vestibular function. We developed the new LBT using three-dimensionally transformed rectangles to enhance the sense of depth. The purpose of this study is to evaluate the influence of vestibular function on the deviation of the new LBT with three-dimensionally transformed rectangles in cases with vestibular dysfunction.
2. Materials and Methods
2.1. Standard Protocol Approvals, Registrations, and Participant Consents
This clinical study was conducted in a single institution. One hundred participants were recruited from patients referred to the vertigo outpatient clinic, Department of Otolaryngology, JR Tokyo General Hospital between August 2020 and August 2022. Inclusion criteria: (1) Male or female patients ≥20 years of age. (2) Written informed consent must be obtained before any study-related assessment is performed. Exclusion criteria: (1) Person with visual impairment. (2) Those who have difficulty operating a computer. The participants of the control group were recruited from students of Asia University (only Supplementary Table 8). The clinical study was approved by the regional ethical standards committee of JR Tokyo General Hospital (R02-03, 2020/7/29, University Hospital Medical Information Network (UMIN) Clinical Trials Registry (UMIN-CTR): UMIN000041573). The control study was approved by the research ethics committee of Asia University.
2.2. Procedures
2.2.1. New Line Bisecting Task (LBT)
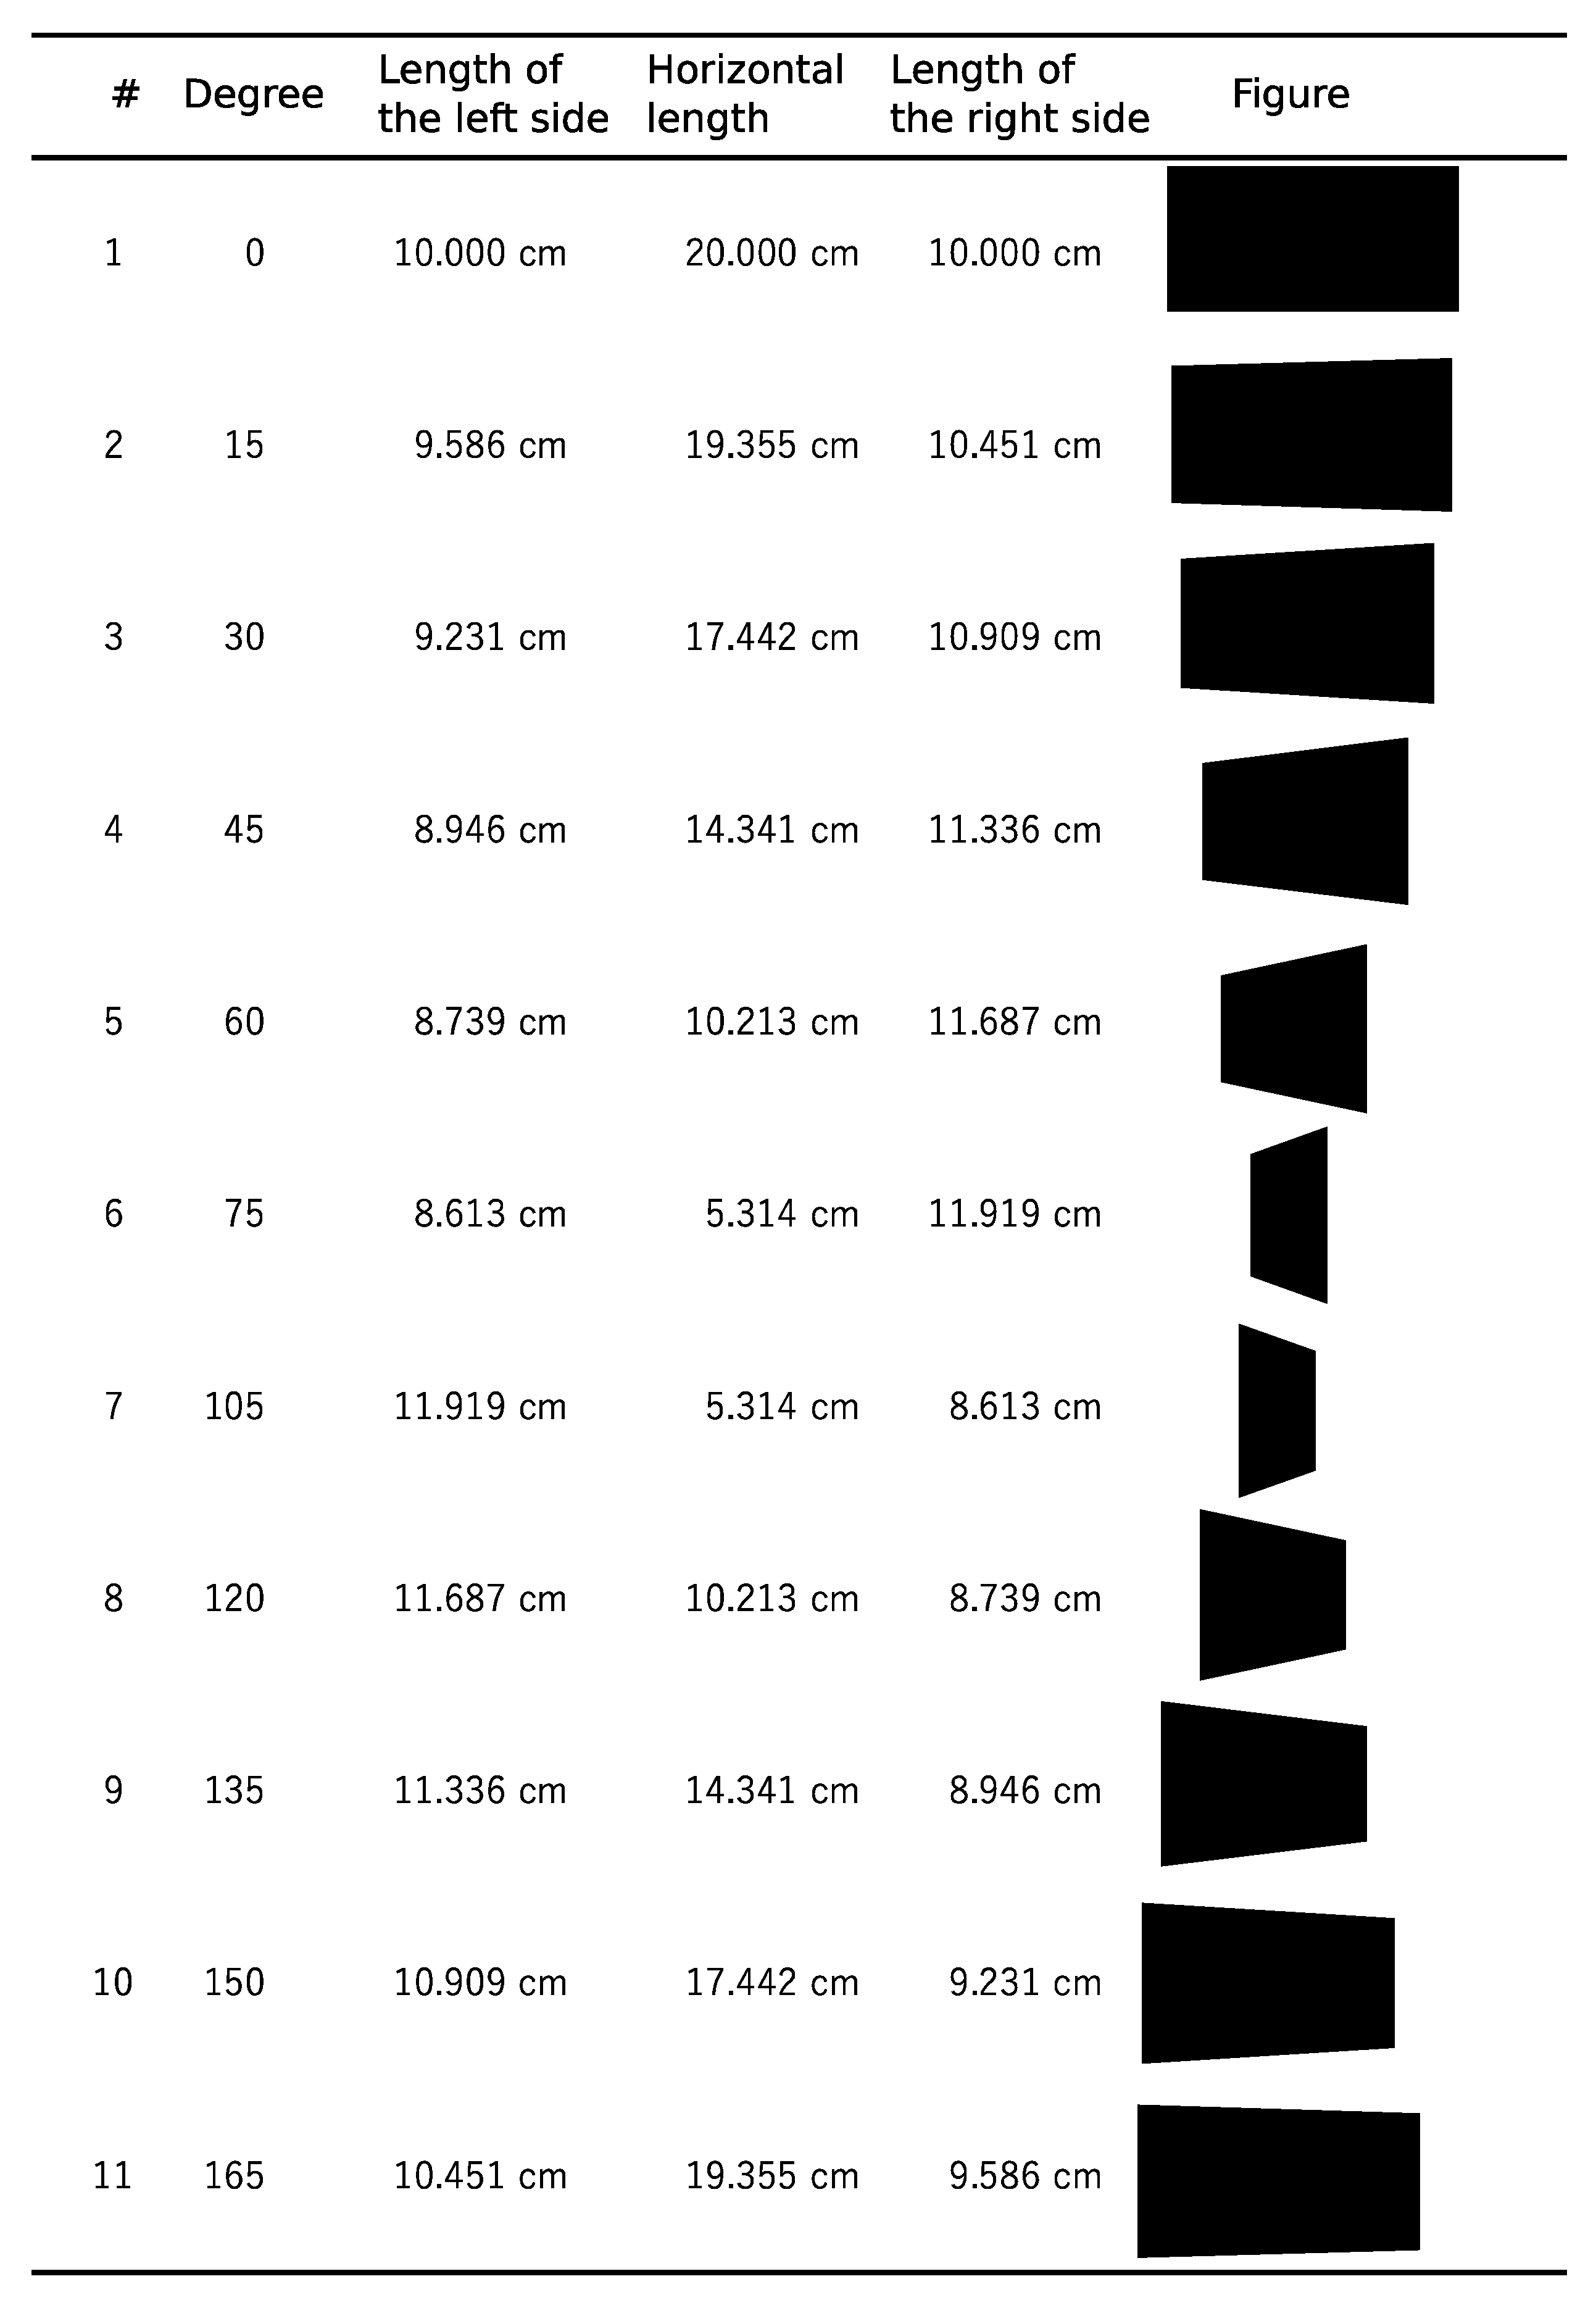
The new LBT was performed using a computer with the application softwares installed (Python3/PsychoPy2 for Windows version 1.90.3 [10]) following the procedures below; (1) The inspector asks the examinee to place the chin on a stand 60 cm away from the 24 inch liquid crystal display (LCD) monitor to fix the face position. The edges of the monitor are captured in the peripheral vision and will not affect the measurement by the participant [11,12]. (2) The inspector asks the examinee to see the cross-shaped figure displayed in the center of the LCD monitor and adjusts the position so that the examinee’s eye level and the center are aligned. (3) The inspector dims the lights in the inspection room. (4) The inspector asks the examinee to divide the quadrangle figures displayed on the LCD monitor into half in horizontal length regardless of the shape or the area of the figure with the movable vertical line using the mouse and click the button. The presented figures are rectangles and trapeziums, which are three-dimensionally equivalent to rectangles viewed from right-side or left-side perspectives and are projected onto a plane. The presented figures are always centered on the LCD. The view rotation angles are 0, 15, 30, 45, 60, 75, 105, 120, 135, 150 and 165 degrees (11 types) (Figure 1). The movable vertical line is displayed from the upper left, lower left, upper right or lower right outside of the displayed figure for each type (4 display starting positions). (5) The inspector conducts preliminary 4 exercises and starts the actual experiment if there are no questions from the examinee. (6) Total of 44 figures with 11 types and 4 display starting positions are displayed. (7) The inspector measures the time taken for the test. (8) The deviation from the true center of the figure was recorded and the average and standard deviation are calculated for each 11 types, respectively. The leftward deviation from the true center is shown in negative numbers, and the rightward deviation from the true center is shown in positive numbers.
Figure 1.
Figures used in the line bisection task. Figures presented in the line bisection task are rectangles and trapeziums, which are three-dimensionally equivalent to rectangles viewed from the side with specific degrees.
Figure 1.
Figures used in the line bisection task. Figures presented in the line bisection task are rectangles and trapeziums, which are three-dimensionally equivalent to rectangles viewed from the side with specific degrees.
2.2.2. Vestibular Function Examination and Questionnaire
Caloric testing was performed in a darkened room by irrigating the external auditory canal with 20 mL ice water (4 °C) for 10 seconds. Caloric nystagmus was recorded using videonystagmography (Interacoustics, Middelfart, Denmark). An abnormal caloric response was defined by either of the following criteria: 1) left or right canal paresis (CP); CP percentage >=20% [13]; or 2) both side CP; maximum slow phase eye velocity <10 degree/s [14].
The video head impulse test (vHIT) was performed using ICS Impulse 2.00 Build 605 Firmware 1.3 (Otometrics, Taastrup, Denmark) according to the instruction of the manufacturer. VOR gains were analyzed based on the manufacturer’s algorithms, using 175 samples out of a total of 250 samples obtained on each trial. Data from the onset of head motion and subsequent zero crossing of head velocity were used to measure the area under the curve (AUC) of head velocity. The value of VOR gain was calculated as (AUC of eye velocity) / (AUC of head velocity). The gain of <0.8 for the lateral semicircular canal or <0.7 for the anterior or posterior semicircular canal of the single side (left or right) or both sides was considered to be abnormal function evaluated with vHIT. Due to equipment availability, vHIT was performed in 40 cases.
The cervical vestibular evoked myogenic potential (cVEMP) and ocular VEMP (oVEMP) were recorded with the Nicolet EDX system (Natus) using a tone burst stimulus of 500 Hz at 125 dBpeSPL (rise, 1 ms; plateau, 2 ms; and fall, 1 ms) and a tone burst of 1kHz at 125 dBpeSPL (rise, 1 ms; plateau, 2 ms; and fall, 1 ms). In cVEMP testing, Electromyographic (EMG) activity was recorded from a surface electrode placed on the upper half of each sternocleidomastoid muscle (SCM), with a reference electrode on the side of the upper sternum and a ground electrode on the chin. During the recording, in the supine position, subjects were instructed to raise their heads from the pillow in order to contract the SCM. The EMG signal from the stimulated side was amplified and bandpass-filtered (20–2000 Hz). The stimulation rate was 5.1 Hz, and the analysis time was 100 ms. Responses to 20 stimuli were average three times [15]. In oVEMP testing, subjects lay supine on a bed, with their head supported by a pillow and with surface EMG electrodes placed on the skin 1 cm below (active) and 3 cm below (indifferent) the center of each lower eyelid. The ground electrode was placed on the chin. During testing, the subject looked up approximately 30 degrees above straight ahead and maintained their focus on a small dot approximately 1 m from their eyes. The signals were amplified by a differential amplifier (bandwidth: 0.5–500 Hz). Responses to 20 stimuli were average three times [15]. An abnormal VEMP response was defined by the following criteria: asymmetry ratio (AR) percentage >=33% or no response in both ears.
Questionnaire regarding psychological symptoms included Dizziness Handicap Inventory (DHI) [16], Self-rating Depression Scale (SDS) (age less than 65) [17] or Geriatric Depression Scale (GDS) (age 65 or over) [18,19], Hospital Anxiety and Depression Scale (HADS) [20], POUNDing (Pulsating, duration of 4-72 hOurs, Unilateral, Nausea, Disabling) [21], Migraine Disability Assessment (MIDAS) [22] and 4-item migraine screener (headache exacerbation in daily performance, nausea, light-sensitivity and hypersensitivity to odors) [23].
2.3. Data Analysis
Excel for Microsoft 365 (version 2207, Microsoft, Redmond, WA, USA) was used for processing data. LBT analysis and statistical analysis were performed using R version 4.3.3 software (R Core Team; R Foundation for Statistical Computing, Vienna, Austria, 2024) [24] with tableone package version 0.13.2. Data are expressed as mean (standard deviation). Multivariate analysis of variance (MANOVA) was used to evaluate dependent variables of deviations after confirming Kolmogorov-Smirnov normality test (P>0.05) and equality of variances using the Levene’s test (P>0.05). The Student's t test was used to compare the average between two groups and analysis of variance (ANOVA) was used to compare between more than two groups. The Pearson product-moment correlation coefficient was calculated to analyze correlations between parameters. Regression coefficients in multiple regression were calculated to analyze dependent variables. P < 0.05 was considered statistically significant.
3. Results
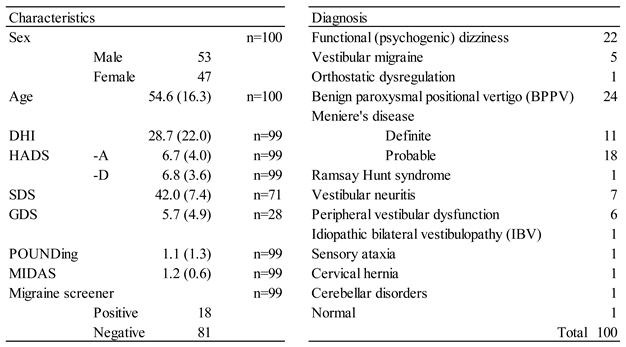
Characteristics of the participants are shown in Table 1 and Table A1. There were four left-handers. Three cases had a history of cerebellar infarction. There were no cases of dementia. A positive value means that the division position is to the right of the true center of the figure, and a negative value means to the left (Figure 1). The average deviation of the line bisection task was the leftward deviation in the figures viewed from the right-side and the rightward deviations in the figures viewed from the left-side, indicating that the figures were perceived three-dimensionally, with the division point deviating to the far side. The deviation of the figure viewed from the center showed no deviation (Table A2). The distributions of deviation are shown in Figure A1.

Table 1.
Case characteristics. The average (standard deviation) of each case characteristic for all cases. In cases of peripheral vestibular dysfunction, the caloric testing is abnormal.
Table 1.
Case characteristics. The average (standard deviation) of each case characteristic for all cases. In cases of peripheral vestibular dysfunction, the caloric testing is abnormal.
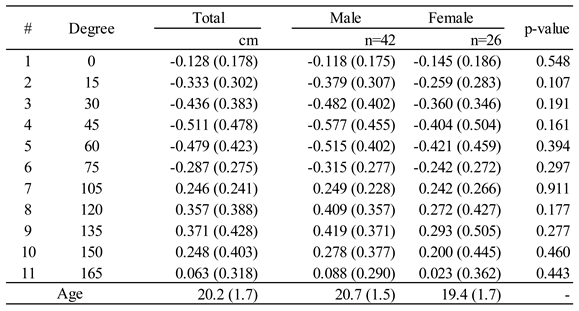
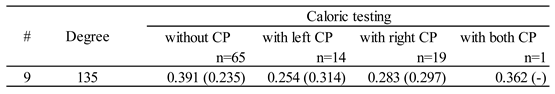
The significant leftward deviation was observed in the vestibular dysfunction. In multivariate analysis of variance (MANOVA) analyses, the significant leftward deviation was observed in the group with vestibular dysfunction in caloric testing, and the significant rightward deviation dependent on increasing age was also observed (Table 2). In univariate analysis, there were significant correlations between deviations and age in figures of 0, 15, 45, 60 and 75 degrees (Figure A2, Table 3), and the deviation of the line bisection task of the figure viewed from the left side (135 degrees) showed significant leftward deviation in the group with CP compared to the group without CP, whereas there was no significant difference in other figures (Table 4). The leftward deviation was observed in both left and right CP compared to cases without CP, whereas there was no significant difference between the left or right CP (Table 5). There was no significant difference of the deviation between male and female (Table A2). In MANOVA analyses, the significant age dependent deviation was observed but not in vHIT (Table A3). In univariate analyses, the significant leftward deviation in the abnormal group in lateral vHIT was also observed in figures viewed from the center, left or right (0, 15 and 165 degrees) (Table A4). The leftward deviation was observed in left, right and both abnormal cases in lateral vHIT compared to normal cases in lateral vHIT, whereas there was no significant difference between left, right and both abnormal cases in lateral vHIT (Table A5). There was no significant difference in the deviations between the group with normal AR of VEMP and with abnormal AR of VEMP (Table A6). There was no significant correlation between the deviations of the line bisection task and psychological scores (Table A7). Regression coefficients in multiple regression between the deviation of 135 degrees and age or CP showed significance only in CP (age: P=0.9023, CP: P=0.0358*). Regression coefficients in multiple regression between the deviation of 0, 15 and 165 degrees and age or lateral vHIT abnormal showed significance in both age and vHIT in 0 degree (age: P=0.0394*, vHIT: P=0.0293*), age in 15 degrees (age: P=0.0448*, vHIT: P=0.0808) and no significance in 165 degrees (age: P=0.0677, vHIT: P=0.0697), respectively.
The deviation of the figure viewed from the center showed significant left deviation in the control group of Asia University (Table A8). As noted above, age was found to significantly affect deviation, so direct comparisons between the control group of Asia University and the outpatient group were not made because the age distribution is very different from that of outpatient cases.
4. Discussion
In this study, PN, which is identical to the leftward deviation, was not observed in the total average of any figures. However the vestibular dysfunction partly affected the leftward deviation of the division point. The directions of deviations under the left or right vestibular dysfunction were both left-side compared to normal subjects, which was identical to the deviation side of PN, suggesting the relevance to PN of the LBT in previous reports.
There was no significant difference of the deviation between male and female, whereas there were significant positive correlations between deviation and age in several figures viewed from the right-side. Interestingly, the leftward deviation in figures from the right-side decreased with age, so aging may lead to the rightward deviation. This age-related rightward shift was also observed in several studies [25,26]. Age-related changes could influence the brain mechanisms of visuospatial attention affecting the deviation [3]. The rightward shift with increasing age (Table 2, Table 3) is consistent with a significant leftward shift of the figure viewed from the center only in the control group of Asia University but not in the outpatient group with aged people. The lack of a significant left bias in the outpatient group may have been influenced by a rightward bias due to age.
The effects of GVS on the line bisection deviation varied across studies, however the deviations tended to be biased to the left under GVS relative to baseline. Although a few subjects in this study have cerebellar infarction without hemisphere strokes, some studies on patients with brain lesions also observed the leftward deviation under GVS. In the previous studies, GVS basically induces the leftward deviation in the line bisection task. In most cases of vestibular dysfunction, the affected side is unilateral, which may be similar to the unbalanced condition under GVS. The deviation to the left side was observed in both left and right vestibular dysfunction cases, both in caloric testing and in vHIT evaluation, but the number of cases was relatively small to compare the deviation between the left and right vestibular dysfunction.
Another mechanism of the leftward deviation under GVS could be that GVS increased intrinsic alertness. Manly et al. reported that sleep deprivation and session continuation caused a significant rightward shift [27]. Matthias also reported similar results that the low intrinsic alertness can cause left-side neglect like performance with the rightward deviation [28]. However, Smaczny reported that alertness had no effect on spatial attention as measured by a line bisection task [29]. Input from the vestibular system may be stressful in the brain system and exacerbate alertness, so vestibular dysfunction may lead to the reduction of information input and may conversely improve alertness in the brain system. Further evaluation of vestibular function and alertness is needed.
The vestibular dysfunction can result in a predominance of visual information [30,31], which may influence PN phenomenon. The vestibular system and its hemispheric dominance can mature early during ontogenesis and are localized in opposite hemispheres [32]. DNA methylation in the DBH (Dopamine Beta-Hydroxylase) promoter region and other dopamine-related gene affected line bisection deviation in right-aligned trials, suggesting the influence of hemisphere-dominant type and attentional bias on the line bisection deviation [33]. The vestibular dysfunction of left, right or both sides and the vestibular imbalance may lead to an increase in the weight of visual information, which causes PN (i.e. the leftward deviation) in the LBT.
The deviation in the vHIT evaluation showed significant differences at 0, 15 and 165 degrees, and regression coefficients in multiple regression showed significance at 0 and 15 degrees in the vHIT evaluation, so the widths of figures of 75 and 105 degrees may be relatively small to sufficiently detect significant deviation, which needs the further analysis of the effect of the figure width because the deviation was affected by the three-dimensional perception. The sensitivity of the vestibular dysfunction is higher in caloric testing than in vHIT, and the specificity is higher in vHIT than in caloric testing [34,35]. More figures (3 figures) showed the leftward deviations in vestibular dysfunction in vHIT than in caloric testing (1 figure), suggesting that the leftward deviations tend to occur under more severe vestibular dysfunction.
There are several limitations in this study. Firstly, the analysis of the dominant hand has not been conducted because the number of cases with left-hander was small. Secondly, the chronological changes of the deviation were not evaluated, and the vestibular functions may change depending on the physical condition and climate in some vestibular disorders. Thirdly, the number of cases is insufficient to apply this new LBT clinically, because there are multiple tests to assess the vestibular functions including caloric testing, vHIT and VEMP. Although vestibular disorders increase with age, the number of cases with vestibular disorders at younger ages is small, making analysis of the interaction difficult. Fourthly, cases in this study included a diverse range of diseases, and further studies are needed using data from patients who do not generally visit an outpatient vertigo clinic. The results in this study may be useful in terms of reflecting the actual clinical picture, but difficult in terms of interpretation of physiologic effects. Fifthly, a regular bisection task was not enforced due to the time limitation, which should be addressed in further studies for comparison. The results of the deviations of the figure viewed from the center can be considered as an evaluation conforming a regular bisection task.
5. Conclusions
Vestibular dysfunction can alter the deviation in the new LBT, suggesting the potential of the new LBT as an assessment of vestibular dysfunction.
Author Contributions
Conceptualization, T.K. (Teru Kamogashira) and N.S. (Noriaki Sunaga); methodology, T.K. (Teru Kamogashira) and N.S. (Noriaki Sunaga); software, N.S. (Noriaki Sunaga); validation, T.K. (Teru Kamogashira) and S.A.; formal analysis, T.K. (Teru Kamogashira); investigation, T.K. (Teru Kamogashira); resources, H.F., K.I., N.S. (Noriaki Sunaga), N.S. (Nao Shikanai), F.I., T.K. (Toshitaka Kataoka), S.S. and M.K.; data curation, S.A.; writing—original draft preparation, T.K. (Teru Kamogashira); writing—review and editing, K.I., N.S. (Noriaki Sunaga), N.S. (Nao Shikanai) and F.I.; visualization, T.K. (Teru Kamogashira); supervision, S.I.; project administration, S.I. All authors have read and agreed to the published version of the manuscript.
Funding
This research received no external funding.
Institutional Review Board Statement
This study was performed in line with the principles of the Declaration of Helsinki. The clinical study was approved by the regional ethical standards committee of JR Tokyo General Hospital (R02-03, 2020/7/29, University Hospital Medical Information Network (UMIN) Clinical Trials Registry (UMIN-CTR): UMIN000041573). The control study was also approved by the Research Ethics Committee of Asia University.
Informed Consent Statement
Informed consent was obtained from all subjects involved in the study.
Data Availability Statement
The data that support the findings of this study are available from the corresponding author, upon reasonable request with the permission of the research ethics committee.
Acknowledgments
We thank Ayaka Ooishi for technical assistance.
Conflicts of Interest
The authors declare no conflicts of interest.
Abbreviations
The following abbreviations are used in this manuscript:
| LBT | Line bisection task |
| PN | Pseudoneglect |
| GVS | Galvanic vestibular stimulation |
| LCD | Liquid crystal display |
| CP | Canal paresis |
| vHIT | Video head impulse test |
| VOR | Vestibulo-ocular reflex |
| AUC | Area under the curve |
| cVEMP | Cervical vestibular evoked myogenic potential |
| oVEMP | Ocular vestibular evoked myogenic potential |
| EMG | Electromyographic |
| SCM | Sternocleidomastoid muscle |
| AR | Asymmetry ratio |
| DHI | Dizziness Handicap Inventory |
| SDS | Self-rating Depression Scale |
| GDS | Geriatric Depression Scale |
| HADS | Hospital Anxiety and Depression Scale |
| POUNDing | Pulsating, duration of 4-72 hOurs, Unilateral, Nausea, Disabling |
| MIDAS | Migraine Disability Assessment |
| MANOVA | Multivariate analysis of variance |
| ANOVA | Analysis of variance |
Appendix A
Figure A1.
Distributions of deviations of the line bisection task. Deviations of the line bisection task in figures of 15, 30, 45, 60 and 75 degrees shifted to the right of the true center of the figure, and deviations in figures of 105, 120, 135, 150 and 165 degrees shifted to the left. Both tended to shift toward shorter vertical lines.
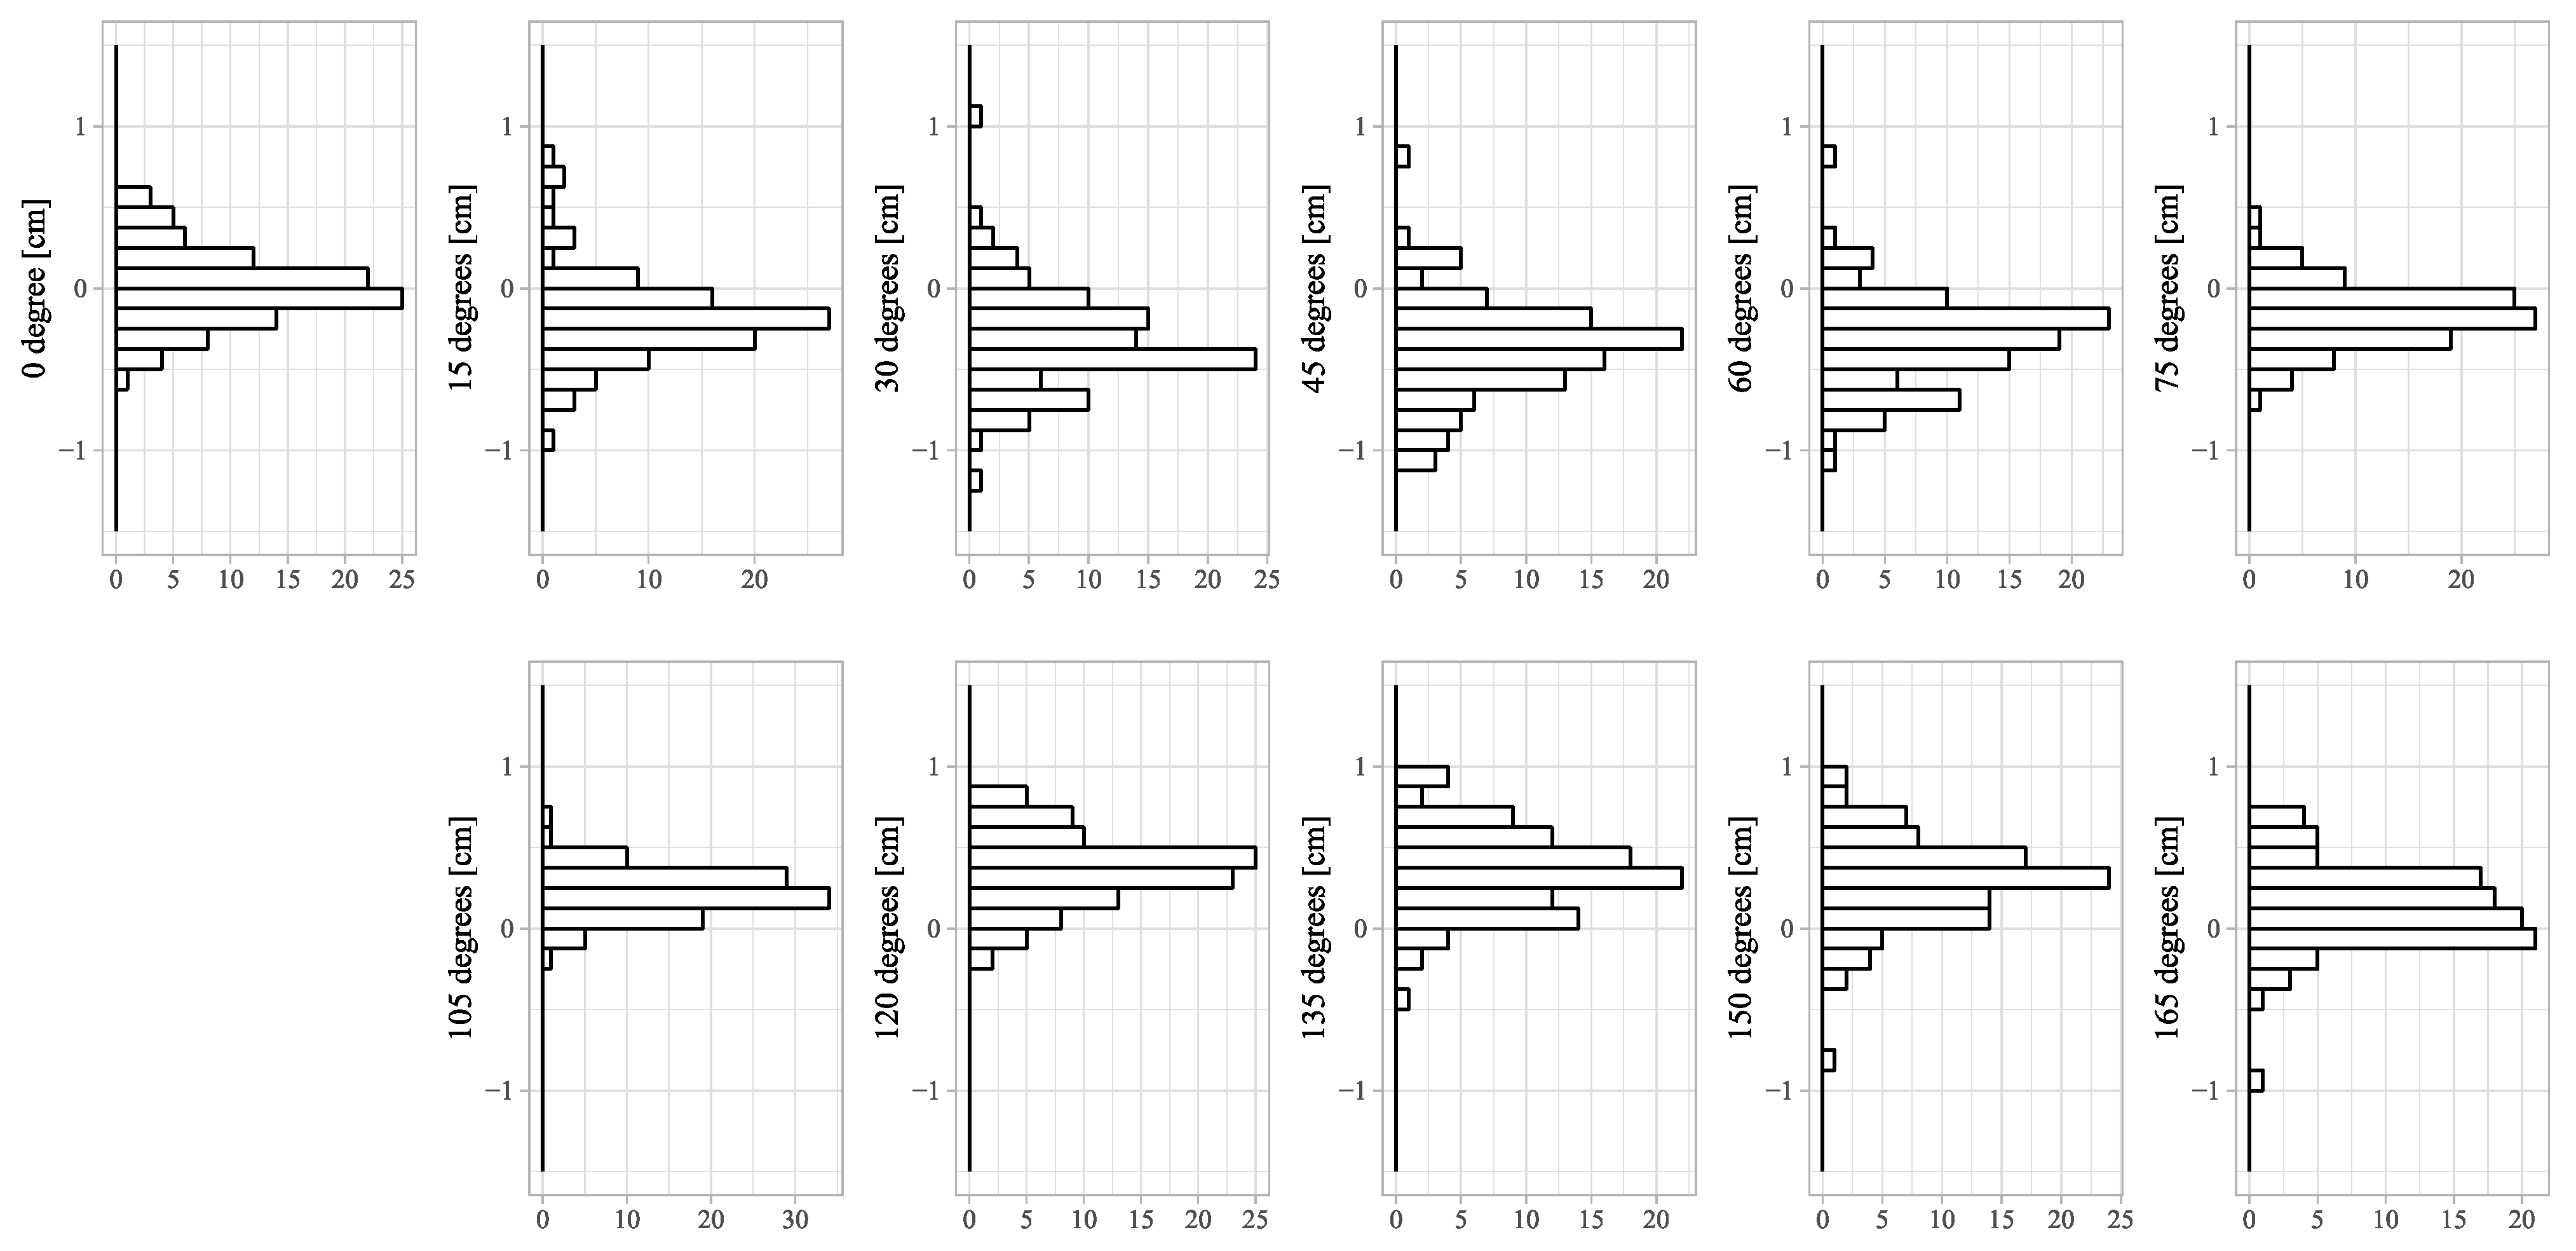
Figure A2.
Scatter plots of deviations of the line bisection task and age. Scatter plots and linear regression lines are shown for correlations between deviations of the line bisection task and age.
Figure A2.
Scatter plots of deviations of the line bisection task and age. Scatter plots and linear regression lines are shown for correlations between deviations of the line bisection task and age.
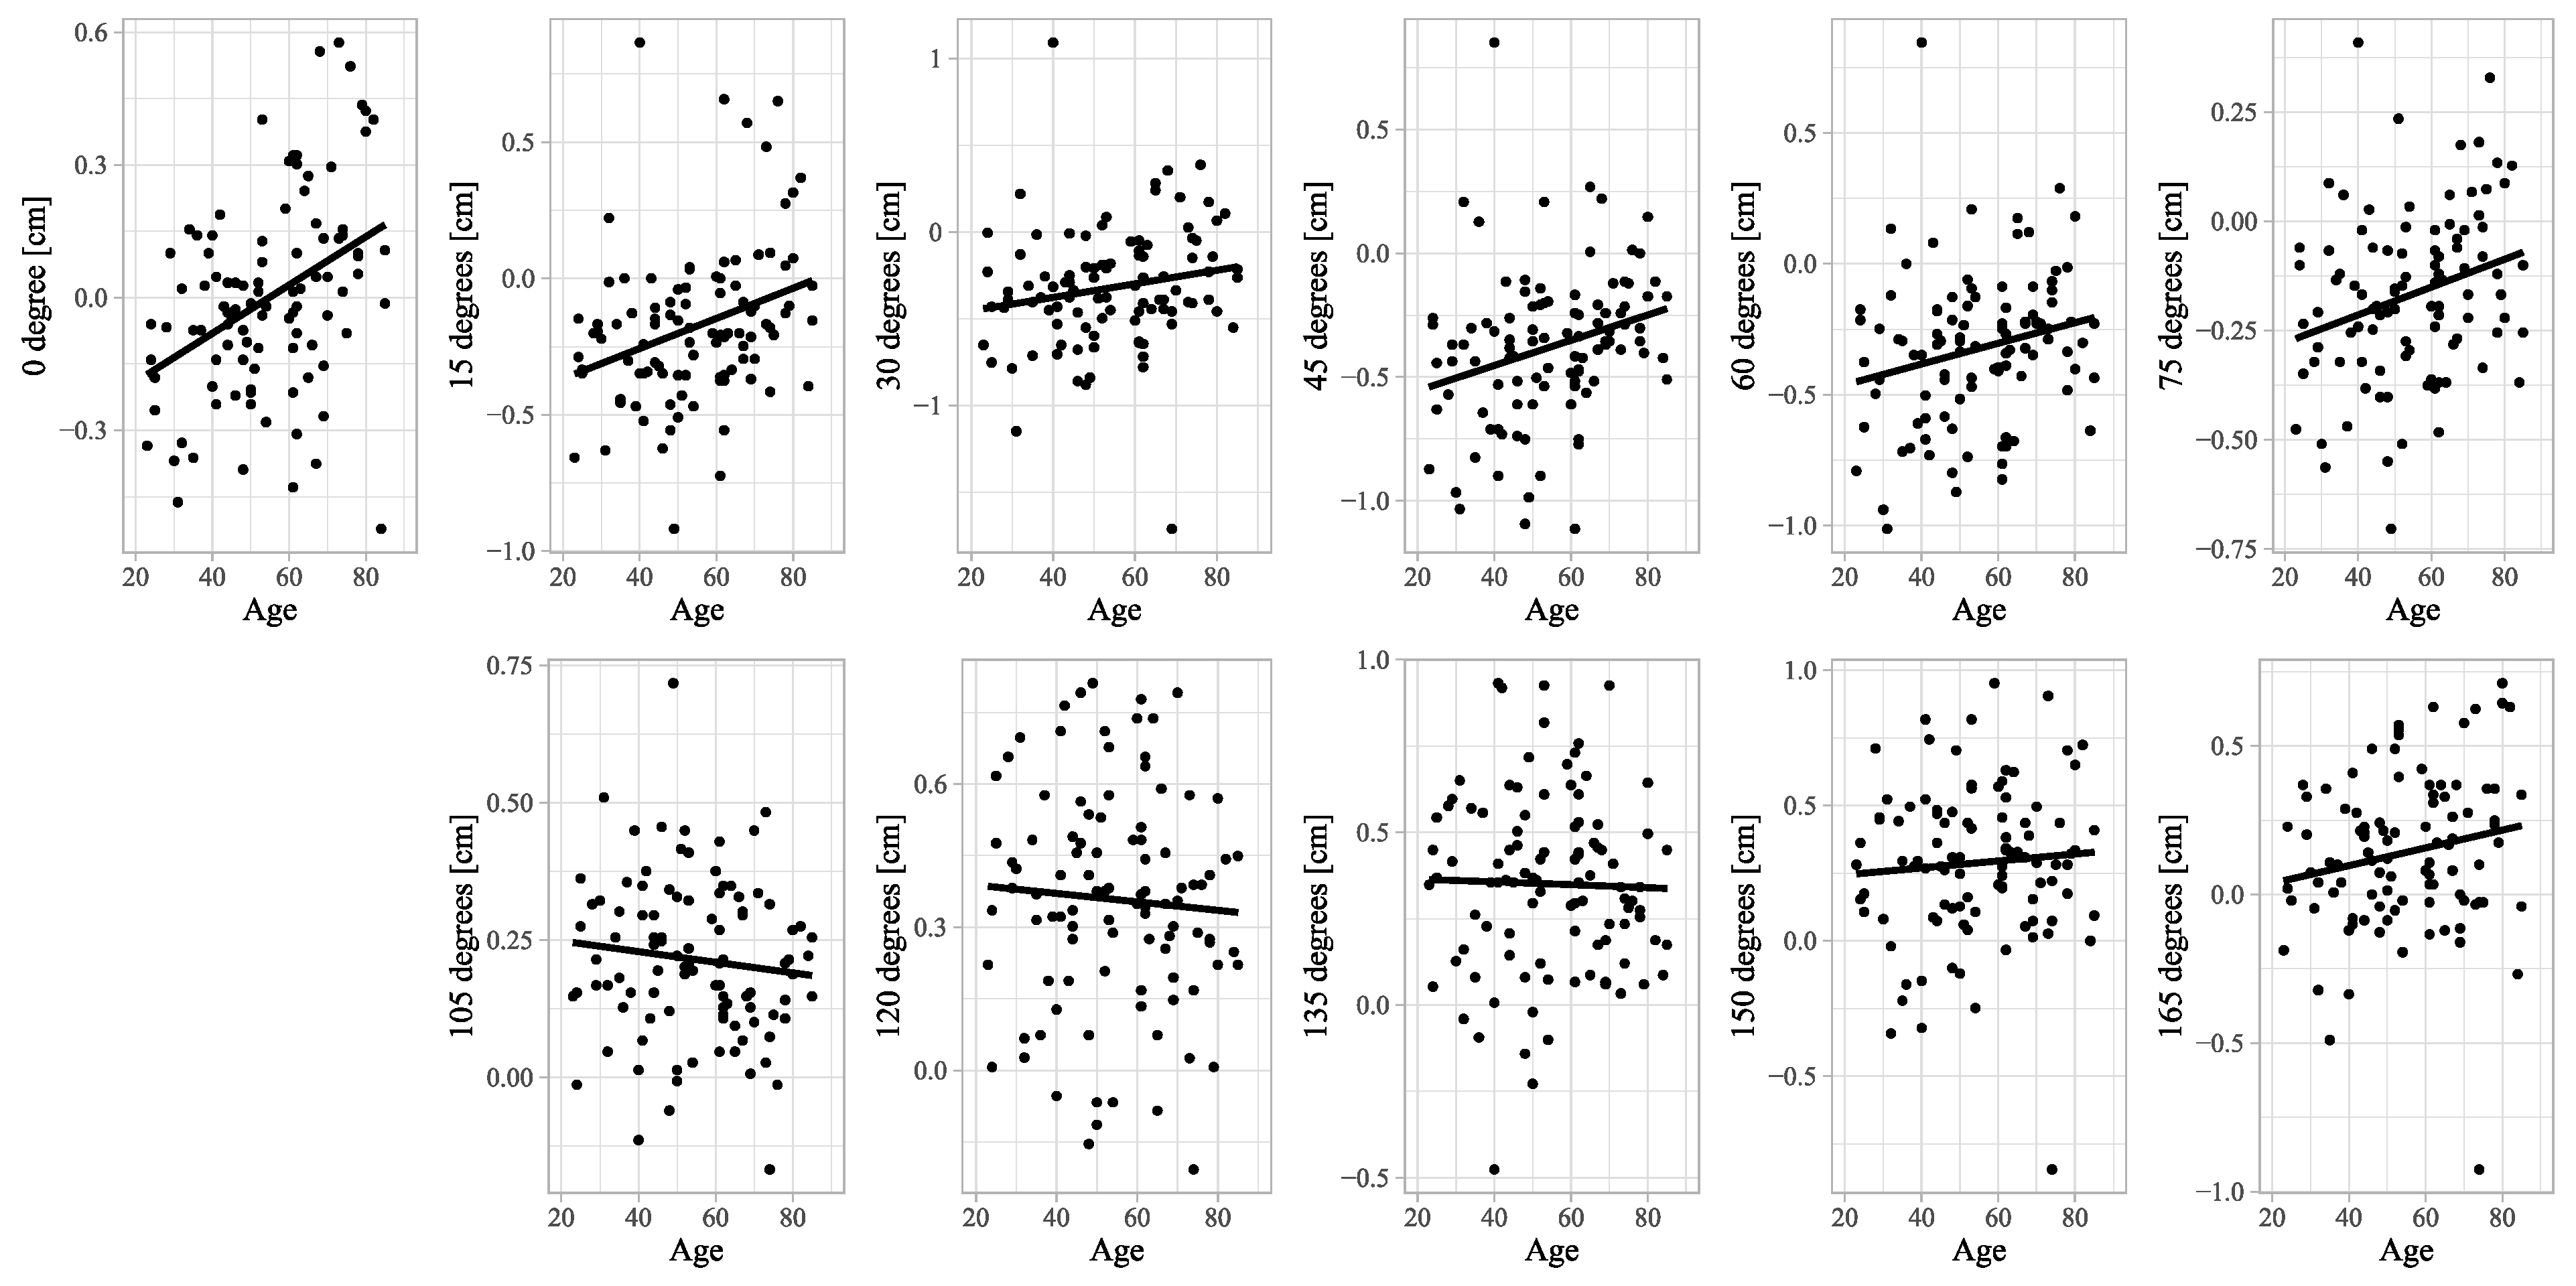
Table A1.
Case characeteristics for cases in which vHIT was performed. The average (standard deviation) of each case characteristic for cases in which vHIT was performed.
Table A1.
Case characeteristics for cases in which vHIT was performed. The average (standard deviation) of each case characteristic for cases in which vHIT was performed.
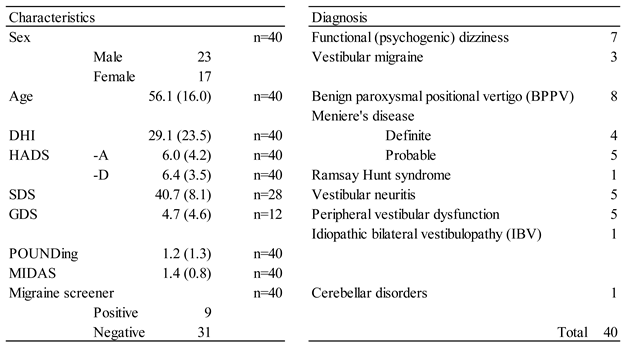
Table A2.
Univariate analysis of deviations of the line bisection task and sex. The average (standard deviation) of deviations of each task and the task time. A positive value means that the division position is to the right of the true center of the figure, and a negative value means to the left. The deviation of the figure viewed from the center (#1 Degree 0) showed no significant deviation. (n=100).
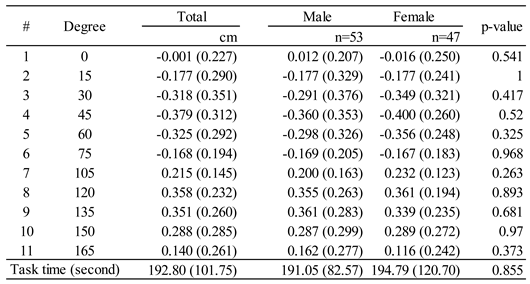
Table A3.
MANOVA analysis of factors of deviations of the line bisection task. MANOVA analysis of (0, 15, 30, 45, 60, 75, 105, 120, 135, 150, 165 degrees) ~ vHIT(lateral, anterior or posterior) + Sex + Age. *: p<0.05, **: p<0.01, Df: the degrees of freedom, approx F: MANOVA approximate F statistics, num Df: the numerator degrees of freedom, den Df: the denominator degrees of freedom.
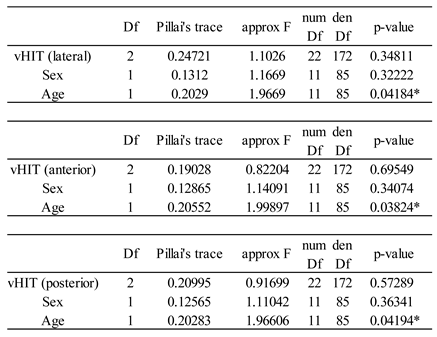
Table A4.
Univariate analysis of deviations of the line bisection task and video head impulse test. The average (standard deviation) of deviations of each task and the task time in the group with normal or abnormal in video head impulse test (vHIT).
Table A4.
Univariate analysis of deviations of the line bisection task and video head impulse test. The average (standard deviation) of deviations of each task and the task time in the group with normal or abnormal in video head impulse test (vHIT).
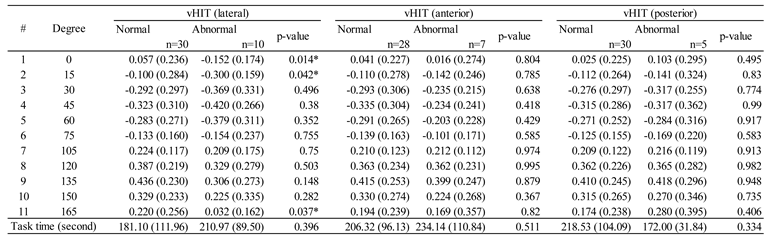
Table A5.
Deviation of the line bisection task and video head impulse test. The average (standard deviation) of deviations of each task in the group with normal or left, right or both abnormal in video head impulse test (vHIT).
Table A5.
Deviation of the line bisection task and video head impulse test. The average (standard deviation) of deviations of each task in the group with normal or left, right or both abnormal in video head impulse test (vHIT).
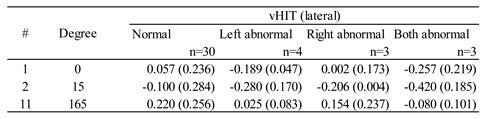
Table A6.
Deviations of the line bisection task and VEMP asymmetry. The average (standard deviation) of deviations of each task and the task time in the group without abnormal VEMP asymmetry ratio (AR) or with abnormal VEMP AR.
Table A6.
Deviations of the line bisection task and VEMP asymmetry. The average (standard deviation) of deviations of each task and the task time in the group without abnormal VEMP asymmetry ratio (AR) or with abnormal VEMP AR.
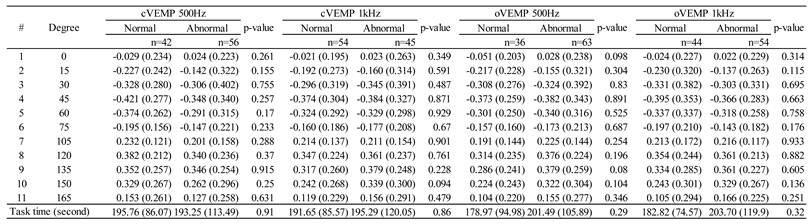
Table A7.
Deviations of the line bisection task and psychological scores. The Pearson product‐moment correlation coefficients between deviations of the line bisection task and psychological scores.
Table A7.
Deviations of the line bisection task and psychological scores. The Pearson product‐moment correlation coefficients between deviations of the line bisection task and psychological scores.
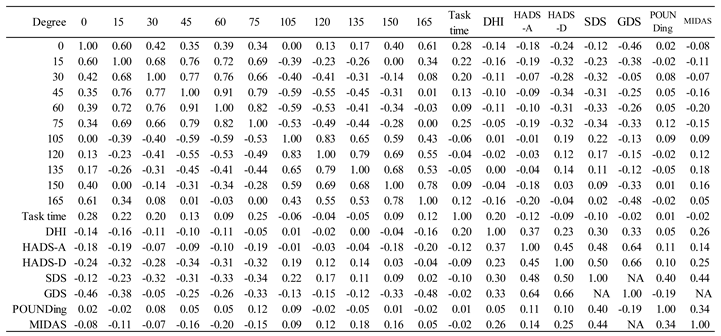
Table A8.
Univariate analysis of deviations of the line bisection task and sex in the control group. The average (standard deviation) of deviations of each task and the task time in the control group of Asia University. A
positive value means that the division position is to the right of the true center of the figure, and a negative value means to the left. The deviation of the figure viewed from the center (#1 Degree 0) showed significant left deviation. (n=68) (Data was not published elsewhere and orally presented at The 21 Century Science and Human Symposium (2020, Tokyo), “Exploring Representational Image Space in Random Number Generation Tasks (Part 3)”).
References
- Liepmann, H.; Kalmus, E. Über einer Augenmasstörung beu Hemianopikern. Berl Klin Wschr 1900, 38, 838–842. [Google Scholar]
- Bowers, D.; Heilman, K.M. Pseudoneglect: Effects of hemispace on a tactile line bisection task. Neuropsychologia 1980, 18, 491–498. [Google Scholar] [CrossRef] [PubMed]
- Jewell, G.; McCourt, M.E. Pseudoneglect: A review and meta-analysis of performance factors in line bisection tasks. Neuropsychologia 2000, 38, 93–110. [Google Scholar] [CrossRef] [PubMed]
- Ferrè, E.R.; Arthur, K.; Haggard, P. Galvanic vestibular stimulation increases novelty in free selection of manual actions. Front. Integr. Neurosci. 2013, 7. [Google Scholar] [CrossRef] [PubMed]
- Ferrè, E.R.; Longo, M.R.; Fiori, F.; Haggard, P. Vestibular modulation of spatial perception. Front. Hum. Neurosci. 2013, 7, 660. [Google Scholar] [CrossRef]
- Rorsman, I.; Magnusson, M.; Johansson, B.B. Reduction of visuo-spatial neglect with vestibular galvanic stimulation. Scand. J. Rehabil. Med. 1999, 31, 117–124. [Google Scholar] [CrossRef]
- Utz, K.S.; Keller, I.; Kardinal, M.; Kerkhoff, G. Galvanic vestibular stimulation reduces the pathological rightward line bisection error in neglect-A sham stimulation-controlled study. Neuropsychologia 2011, 49, 1219–1225. [Google Scholar] [CrossRef]
- Oppenländer, K.; Keller, I.; Karbach, J.; Schindler, I.; Kerkhoff, G.; Reinhart, S. Subliminal galvanic-vestibular stimulation influences ego- and object-centred components of visual neglect. Neuropsychologia 2015, 74, 170–177. [Google Scholar] [CrossRef]
- Ruet, A.; Jokic, C.; Denise, P.; Leroy, F.; Azouvi, P. Does galvanic vestibular stimulation reduce spatial neglect? A negative study. Ann. Phys. Rehabil. Med. 2014, 57, 570–577. [Google Scholar] [CrossRef]
- Peirce, J.; Gray, J.R.; Simpson, S.; MacAskill, M.; Höchenberger, R.; Sogo, H.; Kastman, E.; Lindeløv, J.K. PsychoPy2: Experiments in behavior made easy. Behav. Res. Methods 2019, 51, 195–203. [Google Scholar] [CrossRef]
- Vater, C.; Wolfe, B.; Rosenholtz, R. Peripheral vision in real-world tasks: A systematic review. Psychon. Bull. Rev. 2022, 29, 1531–1557. [Google Scholar] [CrossRef] [PubMed]
- Zhaoping, L. Peripheral vision is mainly for looking rather than seeing. Neurosci. Res. 2024, 201, 18–26. [Google Scholar] [CrossRef] [PubMed]
- Iwasaki, S.; Takai, Y.; Ozeki, H.; Ito, K.; Karino, S.; Murofushi, T. Extent of lesions in idiopathic sudden hearing loss with vertigo: Study using click and galvanic vestibular evoked myogenic potentials. Arch. Otolaryngol. - Head Neck Surg. 2005, 131, 857–862. [Google Scholar] [CrossRef] [PubMed]
- Fujimoto, C.; Murofushi, T.; Chihara, Y.; Suzuki, M.; Yamasoba, T.; Iwasaki, S. Novel subtype of idiopathic bilateral vestibulopathy: Bilateral absence of vestibular evoked myogenic potentials in the presence of normal caloric responses. J. Neurol. 2009, 256, 1488–1492. [Google Scholar] [CrossRef]
- Fujimoto, C.; Egami, N.; Kinoshita, M.; Sugasawa, K.; Yamasoba, T.; Iwasaki, S. Involvement of vestibular organs in idiopathic sudden hearing loss with vertigo: An analysis using oVEMP and cVEMP testing. Clin. Neurophysiol. 2015, 126, 1033–1038. [Google Scholar] [CrossRef]
- Jacobson, G.P.; Newman, C.W. The Development of the Dizziness Handicap Inventory. Arch. Otolaryngol. Neck Surg. 1990, 116, 424–427. [Google Scholar] [CrossRef]
- Zung, W.W.K. A Self-Rating Depression Scale. Arch. Gen. Psychiatry 1965, 12, 63–70. [Google Scholar] [CrossRef]
- Yesavage, J.A.; Brink, T.L.; Rose, T.L.; Lum, O.; Huang, V.; Adey, M.; Leirer, V.O. Development and validation of a geriatric depression screening scale: A preliminary report. J. Psychiatr. Res. 1982, 17, 37–49. [Google Scholar] [CrossRef]
- Sheikh, J.I.; Yesavage, J.A. 9/geriatric depression scale (Gds) recent evidence and development of a shorter version. Clin. Gerontol. 1986, 5, 165–173. [Google Scholar] [CrossRef]
- Zigmond, A.S.; Snaith, R.P. The Hospital Anxiety and Depression Scale. Acta Psychiatr. Scand. 1983, 67, 361–370. [Google Scholar] [CrossRef]
- Detsky, M.E.; McDonald, D.R.; Baerlocher, M.O.; Tomlinson, G.A.; McCrory, D.C.; Booth, C.M. Does this patient with headache have a migraine or need neuroimaging? JAMA 2006, 296, 1274–1283. [Google Scholar] [CrossRef] [PubMed]
- Stewart, W.F.; Lipton, R.B.; Dowson, A.J.; Sawyer, J. Development and testing of the Migraine Disability Assessment (MIDAS) Questionnaire to assess headache-related disability. Neurology 2001, 56, S20–8. [Google Scholar] [CrossRef] [PubMed]
- Takeshima, T.; Sakai, F.; Suzuki, N.; Shimizu, T.; Igarashi, H.; Araki, N.; Manaka, S.; Nakashima, K.; Hashimoto, Y.; Iwata, M.; et al. A simple migraine screening instrument; Validation study in Japan. Japanese J. Headache 2015, 42, 134–143. [Google Scholar]
- R Core Team R: A Language and Environment for Statistical Computing 2024.
- Stam, C.J.; Bakker, M. The prevalence of neglect: superiority of neuropsychological over clinical methods of estimation. Clin. Neurol. Neurosurg. 1990, 92, 229–235. [Google Scholar] [CrossRef]
- Fujii, T.; Fukatsu, R.; Yamadori, A.; Kimura, I. Effect of Age on the Line Bisection Test. J. Clin. Exp. Neuropsychol. 1995, 17, 941–944. [Google Scholar] [CrossRef]
- Manly, T.; Dobler, V.B.; Dodds, C.M.; George, M.A. Rightward shift in spatial awareness with declining alertness. Neuropsychologia 2005, 43, 1721–1728. [Google Scholar] [CrossRef]
- Matthias, E.; Bublak, P.; Costa, A.; Müller, H.J.; Schneider, W.X.; Finke, K. Attentional and sensory effects of lowered levels of intrinsic alertness. Neuropsychologia 2009, 47, 3255–3264. [Google Scholar] [CrossRef]
- Smaczny, S.; Bauder, D.; Sperber, C.; Karnath, H.O.; de Haan, B. Reducing alertness does not affect line bisection bias in neurotypical participants. Exp. Brain Res. 2024, 242, 195–204. [Google Scholar] [CrossRef]
- Pavlou, M.; Kanegaonkar, R.G.; Swapp, D.; Bamiou, D.E.; Slater, M.; Luxon, L.M. The effect of virtual reality on visual vertigo symptoms in patients with peripheral vestibular dysfunction: A pilot study. J. Vestib. Res. Equilib. Orientat. 2012, 22, 273–281. [Google Scholar] [CrossRef]
- Roberts, R.E.; Ahmad, H.; Patel, M.; Dima, D.; Ibitoye, R.; Sharif, M.; Leech, R.; Arshad, Q.; Bronstein, A.M. An fMRI study of visuo-vestibular interactions following vestibular neuritis. NeuroImage Clin. 2018, 20, 1010–1017. [Google Scholar] [CrossRef]
- Dieterich, M.; Bense, S.; Lutz, S.; Drzezga, A.; Stephan, T.; Bartenstein, P.; Brandt, T. Dominance for vestibular cortical function in the non-dominant hemisphere. Cereb. Cortex 2003, 13, 994–1007. [Google Scholar] [CrossRef] [PubMed]
- Schmitz, J.; Kumsta, R.; Moser, D.; Güntürkün, O.; Ocklenburg, S. DNA methylation of dopamine-related gene promoters is associated with line bisection deviation in healthy adults. Sci. Rep. 2019, 9, 5902. [Google Scholar] [CrossRef] [PubMed]
- Mezzalira, R.; Bittar, R.S.M.; Bilécki-Stipsky, M.M.D.C.; Brugnera, C.; Grasel, S.S. Sensitivity of caloric test and video head impulse as screening test for chronic vestibular complaints. Clinics 2017, 72, 469–473. [Google Scholar] [CrossRef] [PubMed]
- Vallim, M.G.B.; Gabriel, G.P.; Mezzalira, R.; Stoler, G.; Chone, C.T. Does the video head impulse test replace caloric testing in the assessment of patients with chronic dizziness? A systematic review and meta-analysis. Braz. J. Otorhinolaryngol. 2021, 87, 733–741. [Google Scholar] [CrossRef]
Table 2.
MANOVA analysis of factors of deviations of the line bisection task. MANOVA analysis of (0, 15, 30, 45, 60, 75, 105, 120, 135, 150, 165 degrees) ~ Caloric testing + Sex + Age. *: p<0.05, **: p<0.01, Df: the degrees of freedom, approx F: MANOVA approximate F statistics, num Df: the numerator degrees of freedom, den Df: the denominator degrees of freedom.
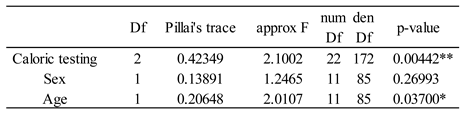
Table 3.
Correlations between deviations of the line bisection task and age. The Pearson product-moment correlation coefficients and p-values between deviations of the line bisection task and age showed significant correlations in figures of 0, 15, 45, 60 and 75 degrees.
Table 3.
Correlations between deviations of the line bisection task and age. The Pearson product-moment correlation coefficients and p-values between deviations of the line bisection task and age showed significant correlations in figures of 0, 15, 45, 60 and 75 degrees.
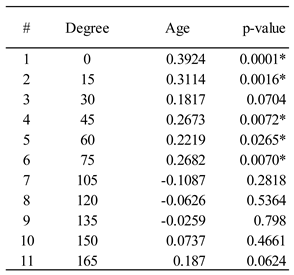
Table 4.
Univariate analysis of deviations of the line bisection task and caloric testing. The average (standard deviation) of deviations of each task and the task time in the group with canal paresis (CP) or without CP in caloric testing.
Table 4.
Univariate analysis of deviations of the line bisection task and caloric testing. The average (standard deviation) of deviations of each task and the task time in the group with canal paresis (CP) or without CP in caloric testing.
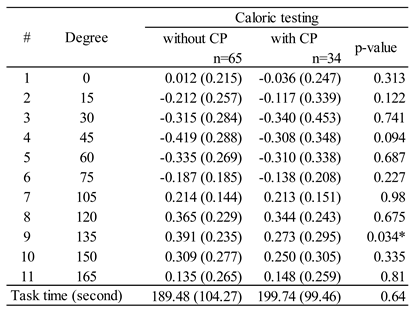
Table 5.
Deviation of the line bisection task and caloric testing. The average (standard deviation) of deviations of each task in the group with left or right canal paresis (CP) or without CP in caloric testing.
Table 5.
Deviation of the line bisection task and caloric testing. The average (standard deviation) of deviations of each task in the group with left or right canal paresis (CP) or without CP in caloric testing.
Disclaimer/Publisher’s Note: The statements, opinions and data contained in all publications are solely those of the individual author(s) and contributor(s) and not of MDPI and/or the editor(s). MDPI and/or the editor(s) disclaim responsibility for any injury to people or property resulting from any ideas, methods, instructions or products referred to in the content. |
© 2025 by the authors. Licensee MDPI, Basel, Switzerland. This article is an open access article distributed under the terms and conditions of the Creative Commons Attribution (CC BY) license (http://creativecommons.org/licenses/by/4.0/).
Copyright: This open access article is published under a Creative Commons CC BY 4.0 license, which permit the free download, distribution, and reuse, provided that the author and preprint are cited in any reuse.


