Submitted:
01 May 2025
Posted:
02 May 2025
You are already at the latest version
Abstract
To improve early-stage selection for stripe rust resistance in wheat, it is essential to use genomic selection models that can effectively capture genetic variation across different generations and environmental conditions. We assessed the performance of GS models for stripe rust resistance in a bi-parental wheat population derived from a cross between a resistant and a susceptible parent, selected to segregate for resistance under field conditions. Using RR-BLUP and Bayesian approaches, we trained models on F₆ lines and validated them on F₇ lines across four environments to evaluate prediction accuracy across generation and environments. Bayesian models showed better prediction accuracy (r = 0.59) than RR-BLUP (r = 0.49) to predict F₇ from F₆. Environment-specific prediction, training in one environment and testing in another—yielded lower accuracy (r = 0.36), underscoring the impact of environmental variability on model performance. Incorporating genotype × environment (G×E) interaction within a multi-environment Bayesian framework moderately improved prediction (r = 0.57) across environment. However, internal cross-validation within the training set produced low predictive accuracy (r = 0.09), suggesting potential overfitting or poor generalizability within the same environment. Our findings demonstrate the prediction potential of Bayesian models for predicting stripe rust resistance across generations and environments in highly structed populations like bi-parental wheat populations. However, to enhance model reliability and ensure broader applicability, further validation through additional testing is necessary. We recommend incorporating replicated trials and expanding the training population with larger and more diverse datasets to better capture environmental variation and improve model robustness.
Keywords:
RR-BLUP
; Bayesian GS
; G×E interaction
; cross-generational prediction
; multi-environment trials
; early-stage selection
; wheat improvement
Introduction
Plant breeding plays a fundamental role in the development of new crop varieties that are not only high-yielding and nutritionally superior but also resilient to a wide range of environmental and biological stresses. A striking example of this is wheat, whose global production increased from 200 million tons in 1961 to 775 million tons in 2023, despite no significant expansion in the area under cultivation (FAO, 2023). This impressive gain in productivity is primarily attributed to the widespread adoption of semi-dwarf, high-yielding, and input-efficient cultivars (Borlaug, 2002). These cultivars, developed through decades of breeding, were designed to combat pests and diseases and tolerate environmental extremes. Coupled with advances in agronomic practices, supportive policy frameworks, and infrastructure development, they helped revolutionize the global wheat supply chain (Tadesse et al., 2019).
Over the past four decades, breeding methodologies have been increasingly shaped by the integration of genomic tools—a movement now recognized as genomic-assisted breeding (Varshney et al., 2021). This began with the use of DNA markers for mapping quantitative trait loci (QTLs), as first demonstrated by Soller and Plotkin-Hazan in 1977. Marker-assisted selection (MAS) allowed breeders to identify genomic regions associated with specific traits and use them in selection. However, early MAS efforts primarily used bi-parental populations, which required time-intensive development and often lacked genetic diversity, limiting their practical utility (Bernardo, 2008). Subsequently, genome-wide association studies (GWAS) provided a more comprehensive means of identifying trait-associated loci (Zhu et al., 2008; Tibbs Cortes et al., 2021). Nonetheless, MAS based on GWAS has largely focused on large-effect QTLs, overlooking the polygenic nature of many traits and leaving numerous small-effect loci underutilized (Jannink et al., 2010).
The advent of genomic selection (GS) has since reshaped breeding strategies by enabling genome-wide prediction of breeding values using dense marker data. First conceptualized by Meuwissen et al. (2001), GS leverages advances in statistical learning to predict complex traits based solely on genotypic information. In this framework, genomic prediction (GP) models are trained on known genotype–phenotype pairs and then used to forecast trait performance in unphenotyped individuals (Desta and Ortiz, 2014; Bassi et al., 2016; Xu et al., 2020). However, these predictions must be validated, typically through cross-validation (CV) to ensure they are robust and reliable before they can inform selection.
One of the enduring challenges in plant breeding is predicting genotype performance across diverse environmental conditions. Multi-environment trials (METs) have long been used to dissect genotype × environment (G×E) interactions and to identify both broadly adapted and environment-specific lines. However, fully replicated METs are resource-intensive, especially when large breeding populations are involved (Smith et al., 2015; Smith et al 2015). Incorporating G×E into genomic prediction models offers a promising path forward, potentially increasing prediction accuracy while reducing reliance on extensive field trials.
Bi-parental populations, derived from crosses between two genetically distinct parents, are foundational in early-generation breeding. They are valued for their simplicity, controlled segregation, and alignment with traits of interest (Crossa et al., 2017). Due to their structured design and low within-population diversity, these populations offer ideal conditions for validating GP models and mapping trait inheritance (Roorkiwal etal., 2016). Although they may not match the resolution of diverse GWAS panels, bi-parental populations are critical for evaluating genomic prediction models in realistic breeding contexts—especially when modeling cross-generational inheritance and environment-specific responses (Wolfe et al., 2017).
In this study, we focus on a bi-parental wheat population segregating for stripe rust resistance, a disease of major concern worldwide. Our objectives were to (1) evaluate the accuracy of genomic prediction models across generations and environments, and (2) investigate the role of G×E interaction modeling in improving prediction accuracy.
Materials and Methods
1. Plant Material and Experimental Design
We developed a population of 180 recombinant inbred lines (RILs) at the F7 generation by crossing two genetically different wheat varieties. These lines were tested across three generations (F6 and F7) at two research farms in Washington: Pullman Conservation Farm and Mount Vernon. Each field trial followed a randomized complete block design (RCBD) with two to three replicates per environment-year for two years. Stripe rust resistance was evaluated using infection type (IT) scores to capture the severity of disease symptoms.
2. Genotypic Data
All 180 F8 lines underwent genotyping through Genotyping-by-Sequencing (GBS). We filtered SNP markers to include only those with a minor allele frequency (MAF) above 0.05 and with less than 20% missing data. Markers with excessive missing values were discarded. Homozygous alleles were encoded as 0 (reference) or 2 (alternate). The cleaned-up data was then used to build a kinship matrix via the A.mat() function from the rrBLUP R package, using the same filtering and imputation approach.
3. Phenotypic Data
IT scores were collected for F6 and F7 generations in multiple environments. We reshaped the data into a long-format dataframe using the tidyverse R package, tagging each record with genotype ID, year, site, and environment. In cases where it was helpful, we calculated average scores per environment to better summarize each genotype's performance.
4. Genomic Prediction with rrBLUP
We developed baseline genomic prediction models using ridge regression best linear unbiased prediction (RR-BLUP) (Meuwissen et al., 2001), implemented via the kin.blup() function in rrBLUP. The F6 data from 2018 was used to train the model, while the F7 data from 2023 was used for testing. The kinship matrix helped align genotypes between training and test sets. We measured holdout prediction accuracy ((Hu et al., 2012) as the Pearson correlation between the predicted genomic estimated breeding values (GEBVs) and the observed infection type (IT) scores in the independent F7 testing set. No adjustment was applied to the correlation values, as the aim was to directly assess raw predictive performance across generations without correcting for heritability or environment-specific variance. We also created a location-specific model trained with 2018 Pullman data and tested it on 2018 Mount Vernon data.
5. Genomic Prediction Across Environment
To explore genotype-by-environment (G×E) interactions, we built multi-environment models using the BGLR and BGGE R packages. Phenotypic data were converted into wide-format matrices (genotypes as rows, environments as columns). Separate kinship matrices were created for genotypes and environments, and their element-wise (Hadamard) product was used to represent G×E interactions. Bayesian genomic models using RKHS kernels were then run for genotype and G×E effects, with environment treated as a fixed effect. For multi-environment genomic prediction, the training set consisted of phenotypic records from all lines in 2018, and the model was tested on corresponding lines evaluated in the 2023 environments. Only genotypes common across years were included to ensure consistency across datasets. Model accuracy was evaluated via Pearson correlation between predicted and observed IT values. We visualized the results using ggplot2, creating scatter and jitter plots. To align predicted GEBVs with the observed IT scale (2 to 9), we linearly rescaled the GEBVs using min-max normalization, multiplying by a scalar based on the IT range.
Results
1. Predicting Across Generations
We started by testing how well genomic prediction works across generations. A model trained on 2018 F6 data was tested on 2023 F7 data. Using RR-BLUP, we achieved a prediction accuracy of 0.494 based on the correlation between predicted and observed IT scores (Figure 1). This indicates RR-BLUP has potential for early selection in bi-parental populations, even when predicting across time. While predictions generally followed observed trends, some variation remained unexplained, as shown by the spread of residuals. We also tried a Bayesian model using BGLR (Perez and Campos, 2014) and RKHS-based (Gianola et al., 2006) genomic relationships. This model performed better, reaching a prediction accuracy of 0.585 (Figure 2). The improvement likely comes from its ability to model more complex genetic patterns beyond additive effects. With a broad-sense heritability (H²) of 0.62 for IT scores, the trait showed a decent amount of genetic control, supporting the use of genomic selection for this purpose.
2. Location-Specific Prediction
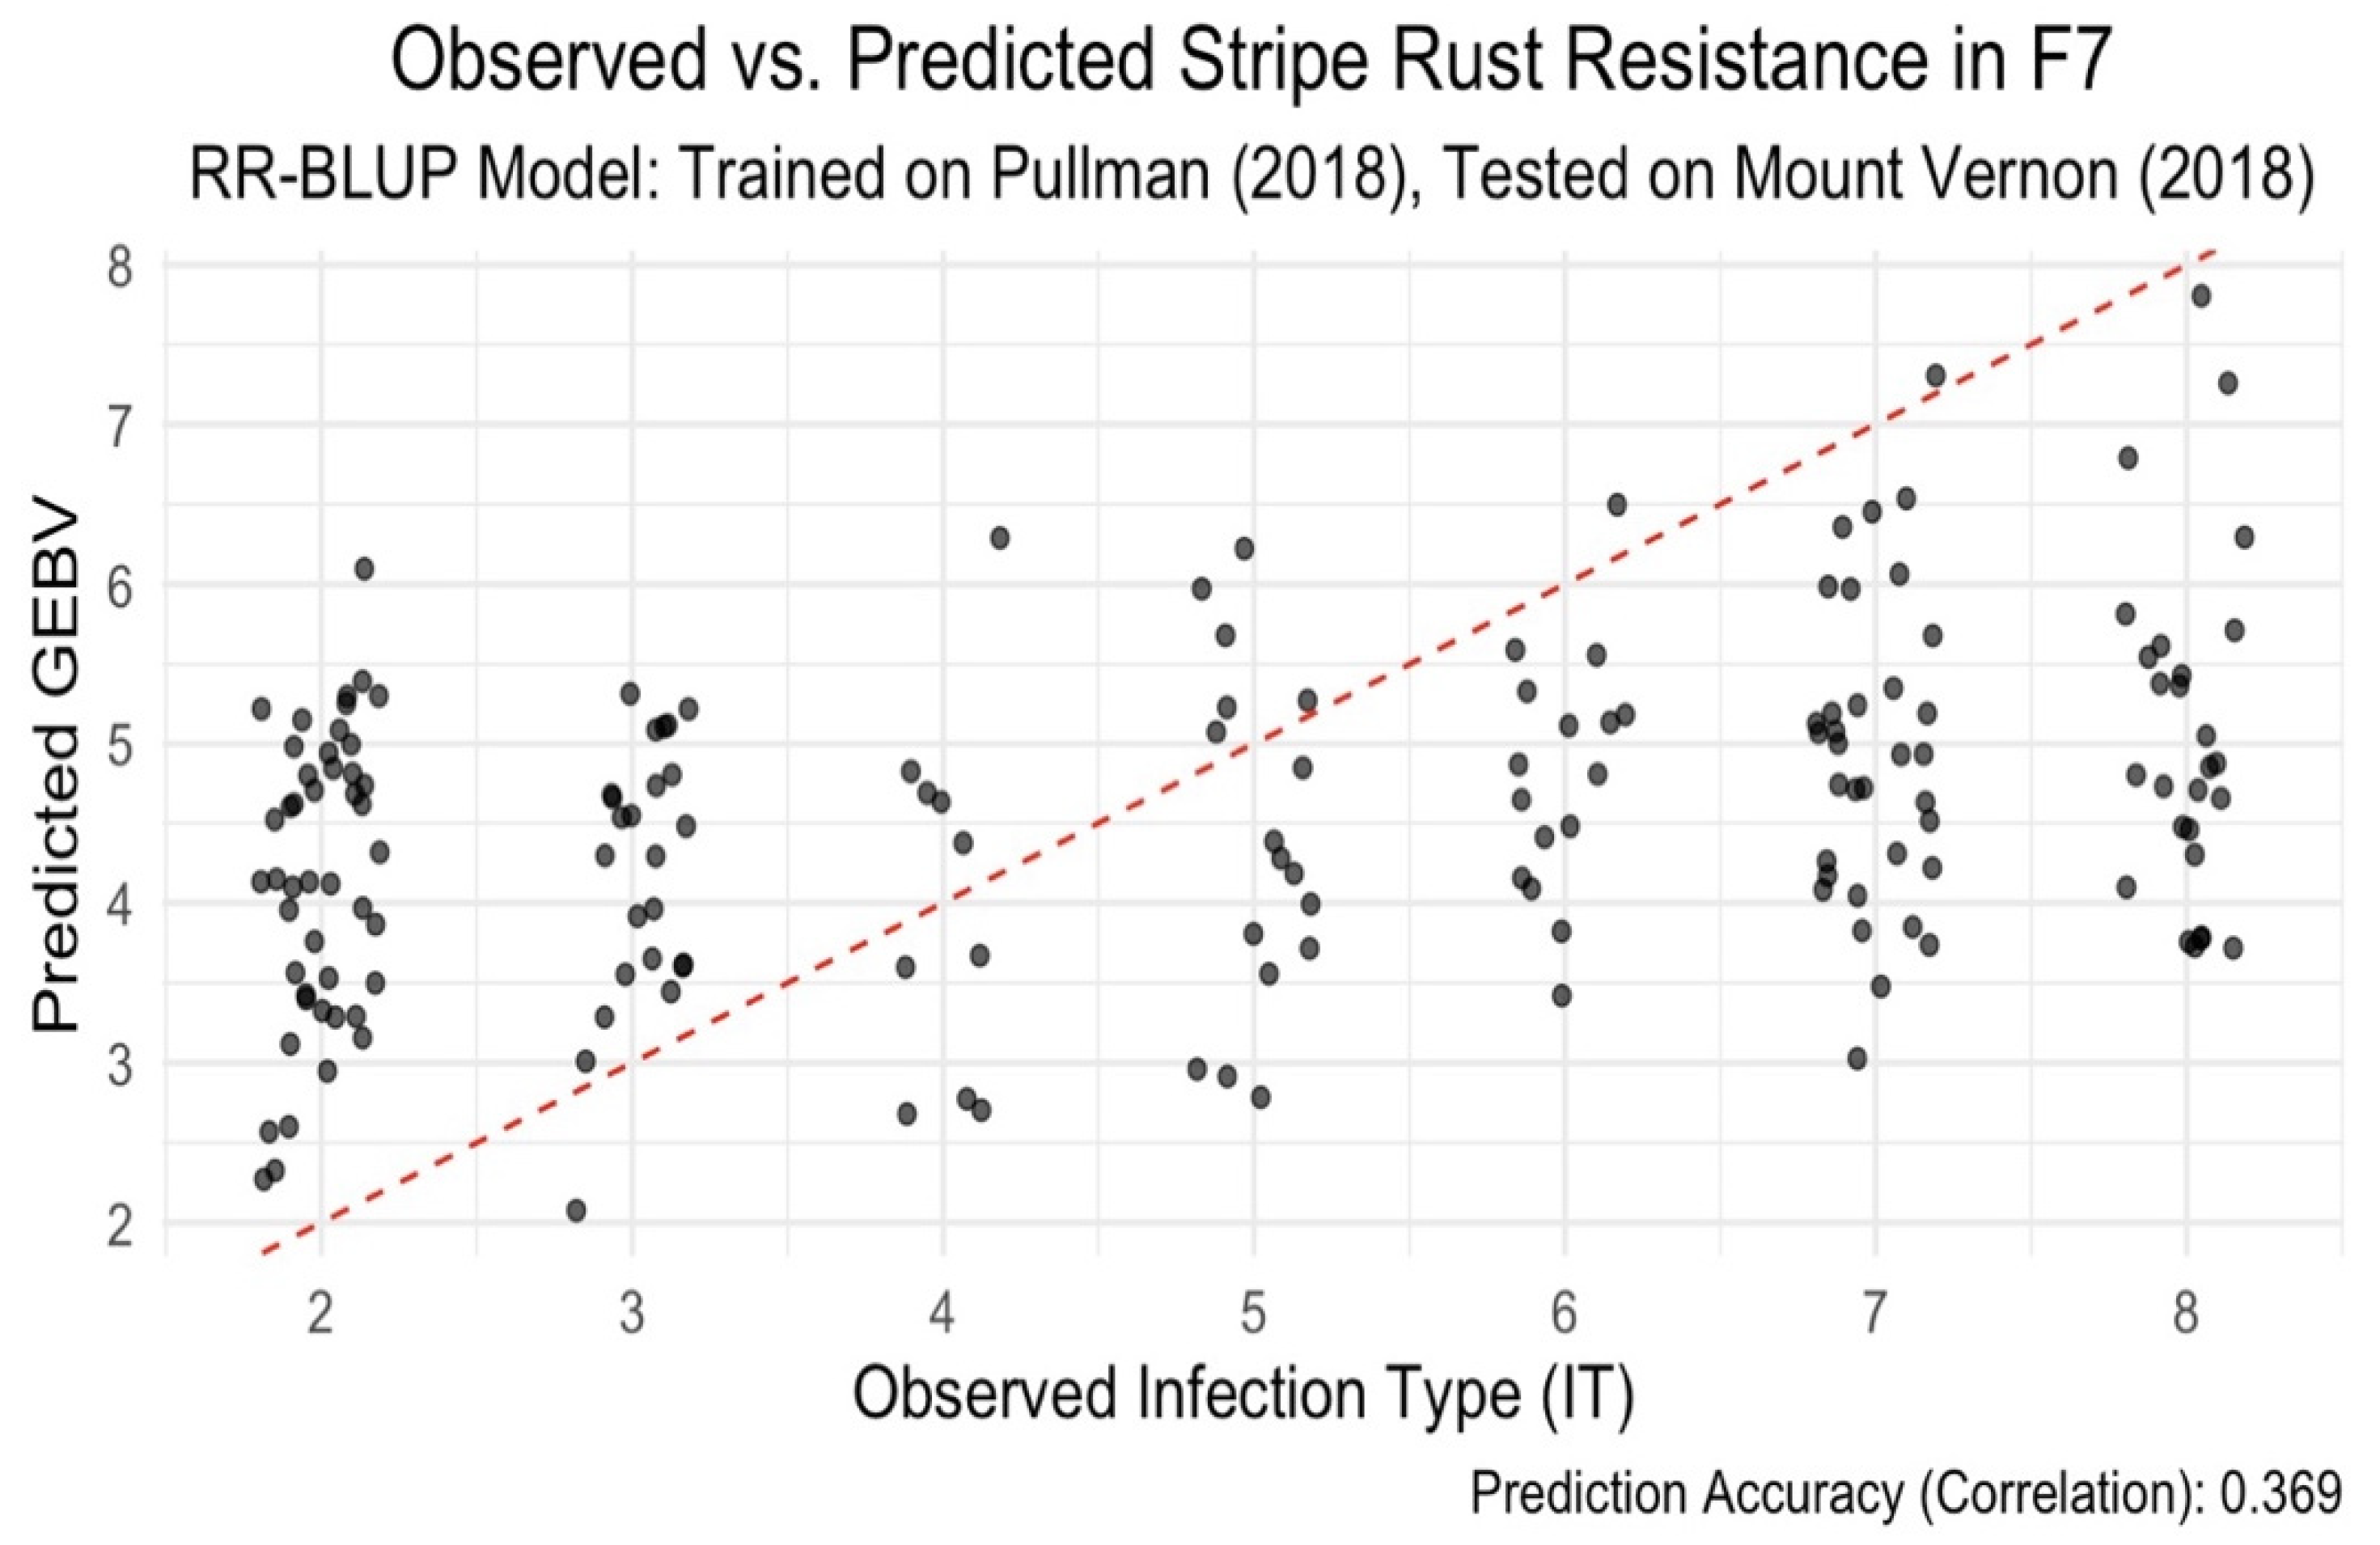
To test model transferability across environments, we trained an RR-BLUP model on 2018 Pullman data and evaluated it using Mount Vernon data from the same year. The prediction accuracy dropped to 0.365 (Figure 3), likely due to environmental differences—Pullman being drier and Mount Vernon more humid. This result emphasizes the role of G×E interaction.
3. G×E Interaction Modeling
To more accurately capture how different wheat genotypes respond to varying environmental conditions—a concept known as genotype-by-environment (G×E) interaction—we employed a multi-environment Bayesian genomic prediction model using the BGLR R package. This approach involved constructing three separate kernels: one for genotypic effects (G), another for environmental effects (E), and a third for the interaction between genotype and environment (G×E). By combining these components, the model aimed to account not only for the genetic makeup of each line and the environmental conditions individually, but also for how those two factors influence each other in combination.
The model was trained using data collected from the Pullman site and tested using data from the Mount Vernon site, both for the same growing year. Despite the sophistication of the model, its performance was notably poor, with a prediction accuracy of just 0.094 based on cross-validation results. This low correlation between predicted and actual values indicates that the model was unable to effectively generalize across the two environments.
There are several likely reasons for this outcome. First, Pullman and Mount Vernon differ significantly in their environmental conditions. Pullman is generally drier and more arid, while Mount Vernon tends to be more humid and wetter. These differences can lead to very distinct plant responses, even within the same genotype. If the training data does not adequately represent the environmental variability present in the test set, the model struggles to make accurate predictions.
Second, the amount of training data available for each environment may have been insufficient. In multi-environment models, especially those involving interaction terms, having a large and diverse dataset is crucial for capturing subtle interaction patterns. When the data is limited or skewed toward certain conditions (e.g., more data from one environment than another), the model lacks the context needed to make robust predictions in new or contrasting environments.
Lastly, it's also possible that the genetic architecture of the trait being predicted—stripe rust resistance in this case—is highly environment-specific. This means that the genes influencing resistance in one environment may not be as relevant or influential in another, making it inherently difficult to build a "universal" model across locations.
Overall, while the model technically accounted for G×E interactions, the magnitude of environmental variation and potential data limitations likely reduced its effectiveness. This result highlights the importance of balanced, multi-environmental datasets and suggests that site-specific models or more advanced approaches (e.g., deep learning or hierarchical Bayesian models) may be required to improve predictive performance in scenarios involving high G×E complexity.
Discussion
Breeding for complex traits like quantitative resistance to stripe rust continues to pose a significant challenge, largely due to the polygenic nature of these traits and the strong influence of genotype-by-environment (G × E) interactions. These interactions can complicate the selection process, especially under variable and unpredictable field conditions. Genomic selection (GS) has emerged as a promising approach to address these complexities, with multi-environment (ME) genomic prediction models showing potential in accounting for environmental variability and boosting prediction accuracy (Juarez et al., 2013; Váry et al., 2015; Fones et al., 2020). In this study, we explored different genomic prediction strategies within a bi-parental wheat population, tested across multiple environments and generations. The results underscore the value of ME-GS models in enhancing selection accuracy at early stages of breeding. Our cross-generational prediction efforts—from F6 to F7—demonstrated that it's possible to achieve reliable predictions even when the training and testing datasets span different generations. Both the RR-BLUP and Bayesian RKHS models were evaluated, with the Bayesian approach outperforming RR-BLUP (prediction accuracy of 0.585 vs. 0.494, respectively). This performance gap likely stems from the Bayesian model’s capacity to capture more complex variance components, including non-additive genetic effects. These findings build on earlier studies showing the advantages of GS over traditional selection methods, especially in early breeding stages where phenotypic data is limited (Rutkoski et al., 2012; Juliana et al., 2017; Sarinelli et al., 2019). When it came to predicting performance across locations, the results highlighted the difficulties of transferring models from one environment to another. Training the model on data from Pullman and applying it to Mount Vernon led to a noticeable drop in prediction accuracy (0.365), which can be attributed to environmental differences and the resulting G × E interactions. These findings align with prior research emphasizing the limitations of single-environment models and the need for ME-GS frameworks to better accommodate such variability (Mirdita et al., 2015; dos Santos et al., 2016; Huang et al., 2019). Even though we tried to explicitly account for G × E effects using a Bayesian model in the BGLR framework with dedicated kernels for genotype, environment, and their interaction, the overall prediction accuracy was still low (0.094 via cross-validation). This outcome suggests that simply modeling G × E statistically may not be enough, especially when the dataset has a limited number of genotype-environment combinations or when the interaction variance is not well captured in the kernel structure. There’s still room for improvement in ME-GS models. Our results indicate that with larger datasets or the addition of environmental descriptors possibly from omics sources, these models could become more accurate and broadly applicable. Previous work has shown that incorporating genomic, transcriptomic, and environmental data can significantly enhance the resolution of GS models and their utility in breeding (Badu-Apraku et al., 2019; Sallam and Smith, 2016). This study also adds to the growing body of evidence that while marker-assisted selection (MAS) has been effective for traits controlled by a few large-effect loci, it tends to fall short for traits like stripe rust resistance, which involve many small-effect QTLs. In contrast, GS is better suited for such traits because it leverages genome-wide marker information without requiring prior knowledge of specific QTLs (Bernardo, 2008; Daetwyler et al., 2014). We also found that the heritability of infection type was moderately high (H² = 0.62), indicating that genetic factors explain a good portion of the observed variation. This helps explain the solid performance of genomic models in our analysis. However, heritability alone doesn't guarantee high prediction accuracy. It interacts with other variables—such as the size and composition of the training population, marker density, genetic relationships between training and test sets, and the underlying genetic architecture of the trait (Lorenz et al., 2012). As such, achieving optimal results with GS requires thoughtful calibration of model complexity, population structure, and the environmental scope represented in the dataset.
Conclusions
This study highlights the potential of genomic selection (GS) as a tool to enhance early-stage selection for stripe rust resistance in bi-parental wheat populations. Our results show that models trained on F6 (2018) data and tested on F7 (2023) lines achieved moderate to high prediction accuracies across generations. Notably, the Bayesian RKHS model attained the highest correlation (r = 0.585), demonstrating its superiority over RR-BLUP (r = 0.489) in capturing genetic patterns transferable between generations. These findings support the use of Bayesian approaches for early selection where phenotypic data are limited in later generations. In contrast, prediction performance declined when models were transferred across environments, with an average correlation of r = 0.36. Even after incorporating genotype × environment (G×E) interactions in a multi-environment Bayesian framework, the observed accuracy gains were modest. Moreover, internal cross-validation within single environments yielded a very low accuracy (r = 0.09), indicating limited robustness and potential overfitting. These findings emphasize the potential of genomic selection for accurate prediction across generations in bi-parental wheat populations, especially when using Bayesian models. However, limited prediction accuracy across environments despite accounting for G×E interactions highlight existing challenges and reinforces the need to improve model robustness under environmental variability.
Prospects
Future efforts should focus on enhancing multi-environment GS frameworks by incorporating additional data layers such as transcriptomics, epigenomics, and high-resolution environmental metadata. Furthermore, the continuous updating of training sets, improved phenotyping in controlled yet diverse environments, and exploration of multi-trait and longitudinal models could significantly improve predictive power and stability. Ultimately, this work reinforces that GS, when properly optimized, holds great promise for developing disease-resistant wheat cultivars that are resilient to evolving climate conditions and pathogen populations. Advancing methodological precision, integrating omics data, and building robust decision-support pipelines will be key to unlocking the full potential of this predictive breeding strategy.
References
- Badu-Apraku, B.; Talabi, A.O.; Fakorede, M.A.B.; Fasanmade, Y.; Gedil, M.; Magorokosho, C.; et al. 2019. Yield gains and associated changes in an early yellow bi-parental maize population following genomic selection for Striga resistance and drought tolerance. BMC Plant Biol. 19, 129. [CrossRef] [PubMed]
- Bassi, F.M.; Bentley, A.R.; Charmet, G.; et al. 2016. Breeding schemes for the implementation of genomic selection in wheat (Triticum spp.). Plant Sci. 242, 23–36. [CrossRef]
- Bernardo, R. 2008. Molecular markers and selection for complex traits in plants: Learning from the last 20 years. Crop Sci. 48, 1649–1664. [CrossRef]
- Borlaug, N.E. 2002. Feeding a world of 10 billion people: The miracle ahead. In Vitro Cell. Dev. Biol. Plant. 38, 221–228. [CrossRef]
- Crossa, J.; Pérez-Rodríguez, P.; Cuevas, J.; et al. 2017. Genomic selection in plant breeding: Methods, models, and perspectives. Trends Plant Sci. 22, 961–975. [CrossRef] [PubMed]
- Daetwyler, H.D.; Bansal, U.K.; Bariana, H.S.; Hayden, M.J.; Hayes, B.J. 2014. Genomic prediction for rust resistance in diverse wheat landraces. Theor. Appl. Genet. 127, 1795–1803. [CrossRef]
- Desta, Z.A.; Ortiz, R. 2014. Genomic selection: Genome-wide prediction in plant improvement. Trends Plant Sci. 19, 592–601. [CrossRef]
- dos Santos, J.P.R.; Pires, L.P.M.; de Castro Vasconcellos, R.C.; et al. 2016. Genomic selection for resistance to Stenocarpella maydis in maize lines using DArTseq markers. BMC Genet. 17, 86. [CrossRef]
- FAO. 2023. The State of Food Security and Nutrition in the World 2023. Urbanization, Agrifood Systems Transformation and Healthy Diets across the Rural–Urban Continuum. FAOSTAT.
- Fones, H.N.; Bebber, D.P.; Chaloner, T.M.; et al. 2020. Threats to global food security from emerging fungal and oomycete crop pathogens. Nat. Food 1, 332–342. [CrossRef]
- Gianola, D.; Fernando, R.L.; Stella, A. (2006). Genomic-Assisted Prediction of Genetic Value with Semiparametric Procedures. Genetics 173, 1761–1776. [CrossRef]
- Huang, M.; Balimponya, E.G.; Mgonja, E.M.; et al. 2019. Use of genomic selection in breeding rice (Oryza sativa L.) for resistance to rice blast (Magnaporthe oryzae). Mol. Breed. 39, 1023–1032. [CrossRef]
- Hu, Z.; Wang, Z.; Xu, S. An infinitesimal model for quantitative trait genomic value prediction. PLoS One 2012, 7, e41336. [Google Scholar] [CrossRef]
- Jannink, J.L.; Lorenz, A.J.; Iwata, H. 2010. Genomic selection in plant breeding: From theory to practice. Brief. Funct. Genomics. 9, 166–177. [CrossRef]
- Juarez, M.; Legua, P.; Mengual, C.M.; et al. 2013. Relative incidence, spatial distribution and genetic diversity of cucurbit viruses in eastern Spain. Ann. Appl. Biol. 162, 362–370. [CrossRef]
- Juliana, P.; Singh, R.P.; Singh, P.K.; et al. 2017. Comparison of models and whole-genome profiling approaches for genomic-enabled prediction of Septoria tritici blotch, Stagonospora nodorum blotch, and tan spot resistance in wheat. Plant Genome 10, 1–16. [CrossRef] [PubMed]
- Lorenz, A.J.; Smith, K.P.; Jannink, J.L. 2012. Potential and optimization of genomic selection for Fusarium head blight resistance in six-row barley. Crop Sci. 52, 1609–1621. [CrossRef]
- Meuwissen, T.H.E.; Hayes, B.J.; Goddard, M.E. 2001. Prediction of total genetic value using genome-wide dense marker maps. Genetics 157, 1819–1829. [CrossRef] [PubMed]
- Mirdita, V.; He, S.; Zhao, Y.; et al. 2015. Potential and limits of whole genome prediction of resistance to Fusarium head blight and Septoria tritici blotch in a vast Central European elite winter wheat population. Theor. Appl. Genet. 128, 2471–2481. [CrossRef]
- Pérez, P.; de los Campos, G. 2014. Genome-Wide Regression and Prediction with the BGLR Statistical Package. Genetics 198, 483–495. [CrossRef]
- Roorkiwal, M.; Rathore, A.; Das, R.R.; et al. 2016. Genome-enabled prediction models for yield-related traits in chickpea. Front. Plant Sci. 7, 1666. [CrossRef]
- Rutkoski, J.; Poland, J.; Mondal, S.; et al. 2016. Canopy temperature and vegetation indices from high-throughput phenotyping improve accuracy of pedigree and genomic selection for grain yield in wheat. G3 Genes Genom. Genet. 6, 2799–2808. [CrossRef]
- Sallam, A.H.; Smith, K.P. 2016. Genomic selection performs similarly to phenotypic selection in barley. Crop Sci. 56, 2871–2881. [CrossRef]
- Sarinelli, J.M.; Murphy, J.P.; Tyagi, P.; et al. 2019. Training population selection and use of fixed effects to optimize genomic predictions in a historical USA winter wheat panel. Theor. Appl. Genet. 132, 1247–1261. [CrossRef] [PubMed]
- Smith, A.B.; Ganesalingam, A.; Kuchel, H.; Cullis, B.R. 2015. Factor analytic mixed models for the provision of grower information from national crop variety testing programs. Theor. Appl. Genet. 128, 55–72. [CrossRef] [PubMed]
- Soller, M.; Plotkin-Hazan, J. 1997. The use of marker alleles for the introgression of linked quantitative alleles. Theor. Appl. Genet. 51, 133–137. [CrossRef]
- Tadesse, W.; Sanchez-Garcia, M.; Assefa, S.G.; et al. 2019. Genetic gains in wheat breeding and its role in feeding the world. Crop Breed. Genet. Genom. 1, e190005.
- Tibbs Cortes, L.; Zhang, Z.; Yu, J. 2021. Status and prospects of genome-wide association studies in plants. Plant Genome 14, e20077. [CrossRef]
- Varshney, R.K.; Bohra, A.; Yu, J.; et al. 2021. Designing future crops: Genomics-assisted breeding comes of age. Trends Plant Sci. 26, 631–649. [CrossRef]
- Xu, Y.; Liu, X.; Fu, J.; et al. 2020. Enhancing genetic gain through genomic selection: From livestock to plants. Plant Commun. 1, 100005. [CrossRef]
- Zhu, C.; Gore, M.; Buckler, E.S.; Yu, J. 2008. Status and prospects of association mapping in plants. Plant Genome 1, 5–20. [CrossRef]
Figure 1.
Observed vs. Predicted Stripe Rust Resistance in F7 using RR-BLUP (F6 Training, F7 Testing). This scatter plot shows the prediction performance of the RR-BLUP model trained on 2018 (F6) phenotypic and genotypic data and tested on 2023 (F7) lines. The red dashed line represents the best-fit linear regression line showing the relationship between observed infection types and predicted genomic estimated breeding values (GEBVs). The model achieved a moderate prediction accuracy (r = 0.489), suggesting reliable cross-generational prediction for stripe rust infection type.
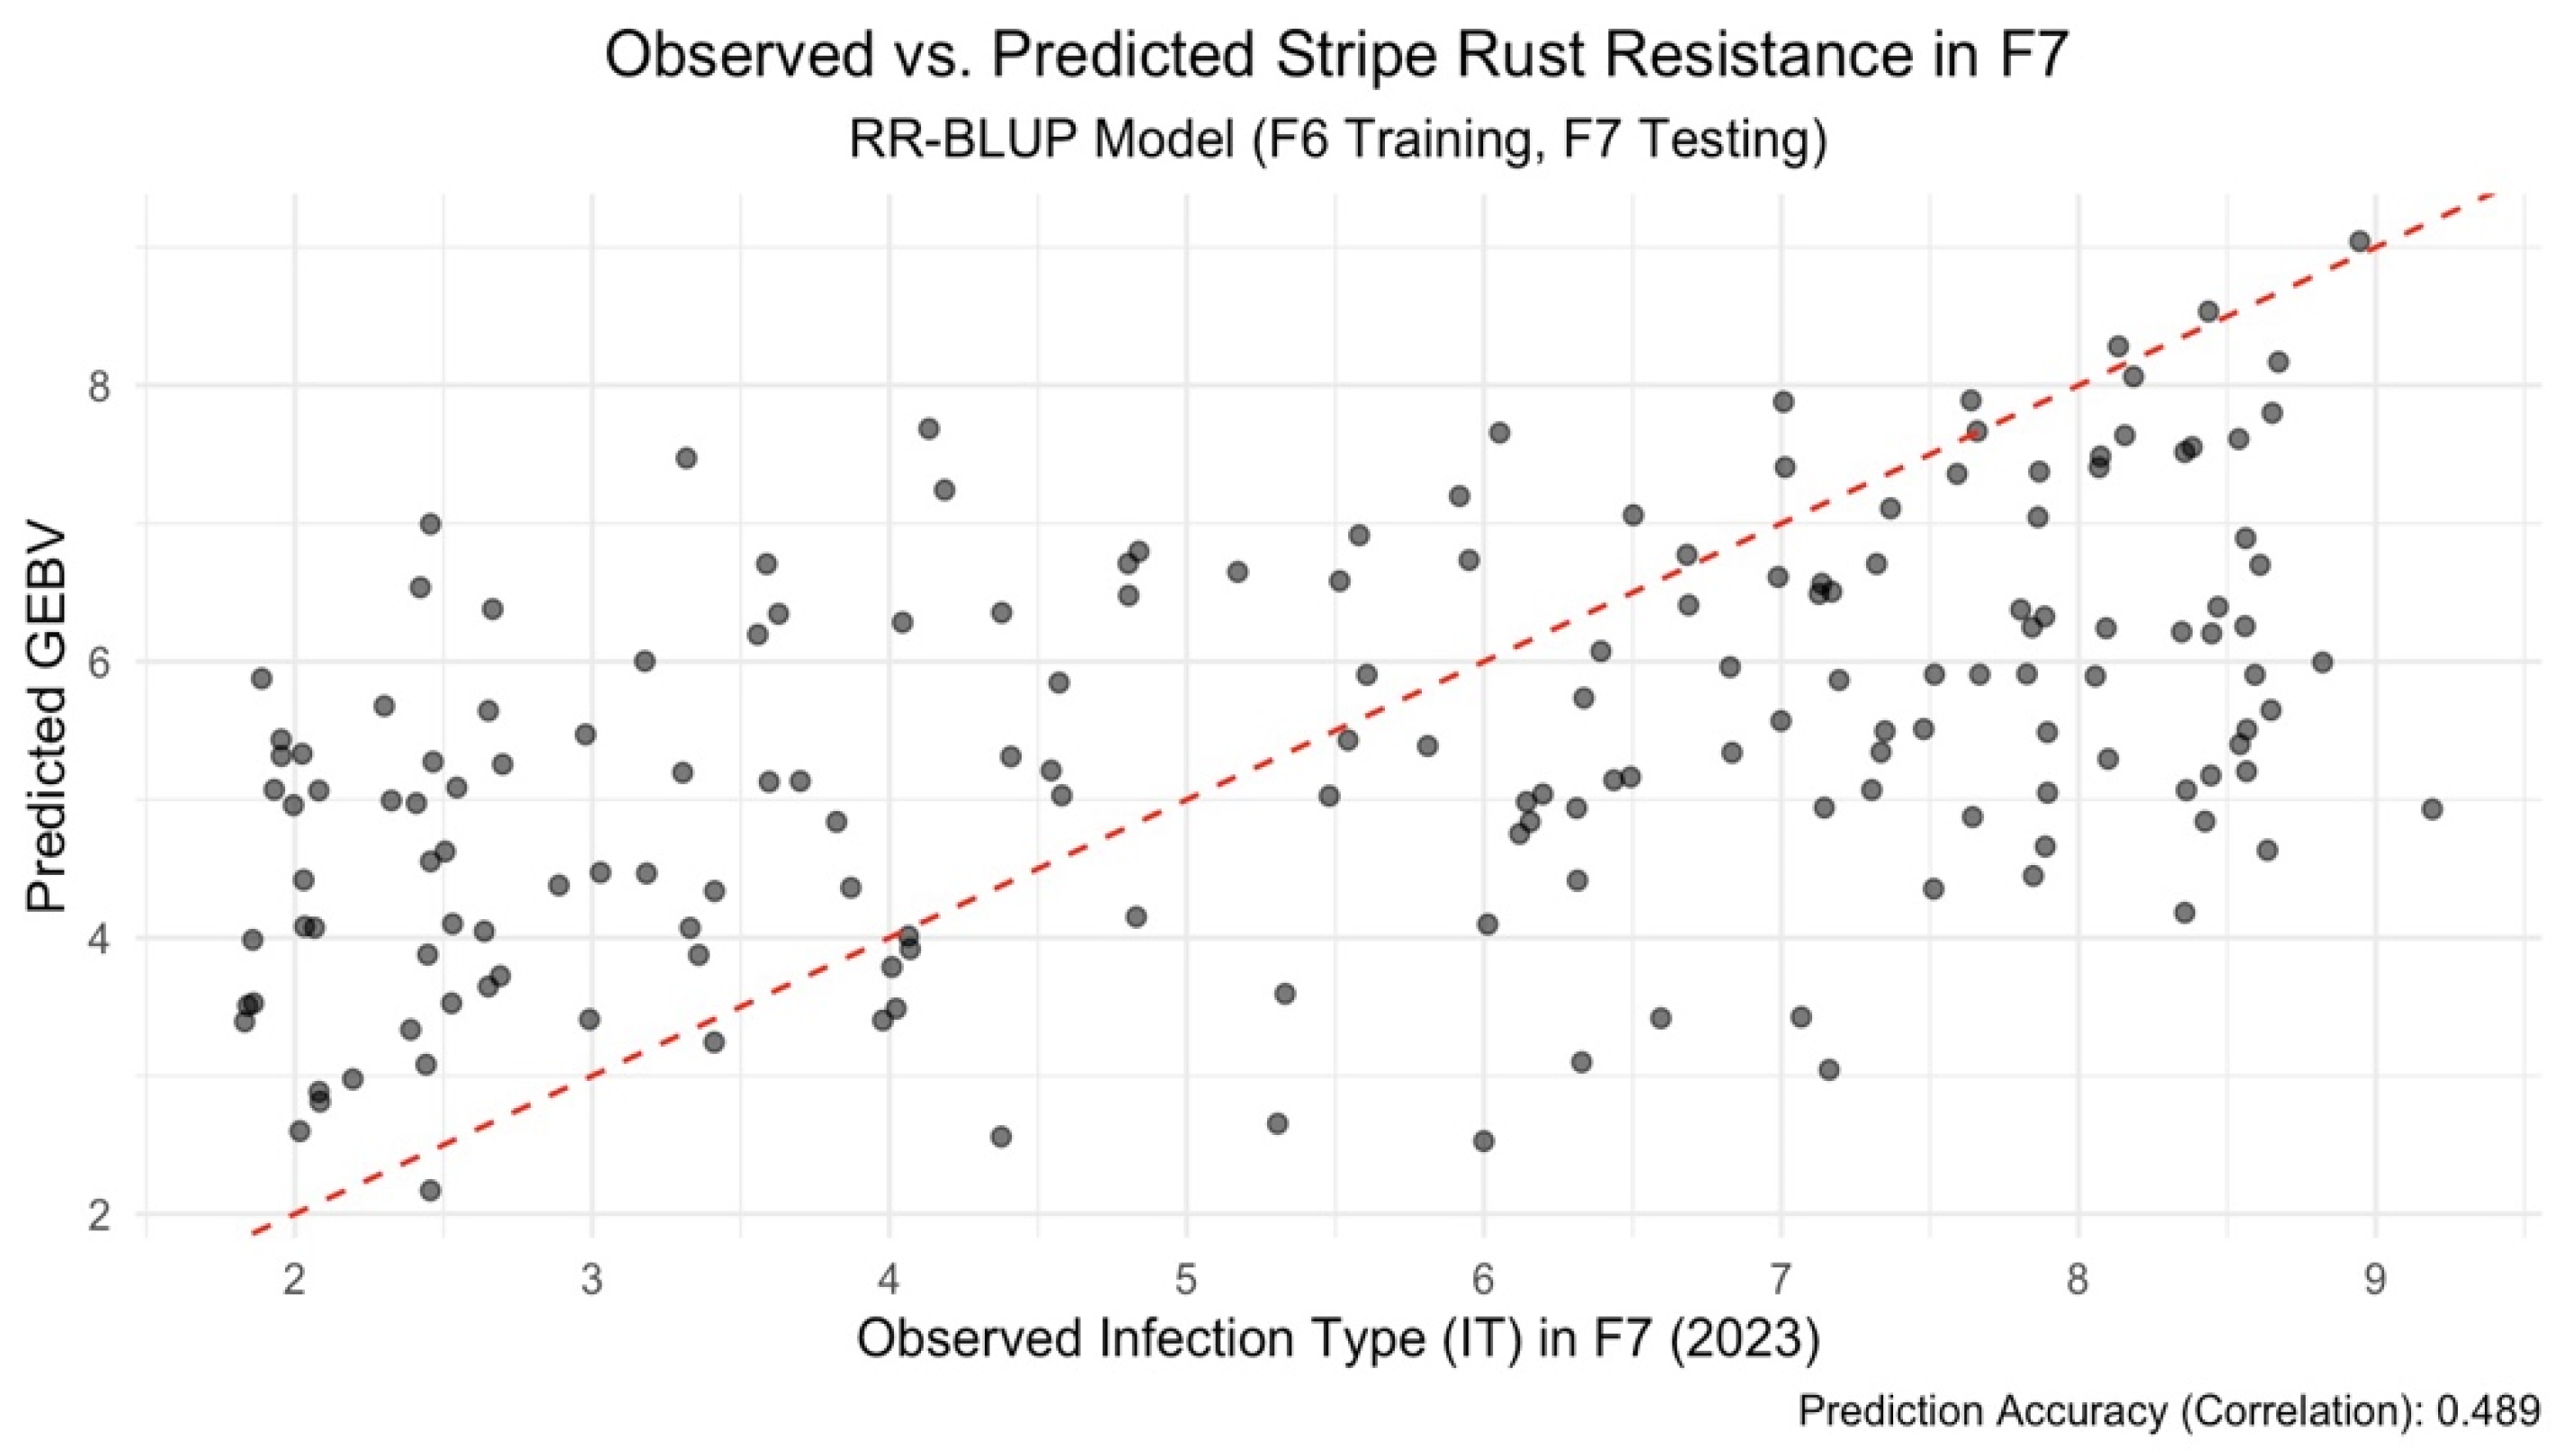
Figure 2.
Observed vs. Predicted Stripe Rust Resistance in F7 using Bayesian Model (F6 Training, F7 Testing). Bayesian genomic prediction model trained on F6 (2018) data and applied to F7 (2023) lines. The red dashed line is the best-fit linear regression line showing the trend between observed infection types and predicted genomic estimated breeding values (GEBVs). Although the predicted values showed less variability, the model attained the highest prediction accuracy among tested models (r = 0.585), indicating improved predictive stability across generations.
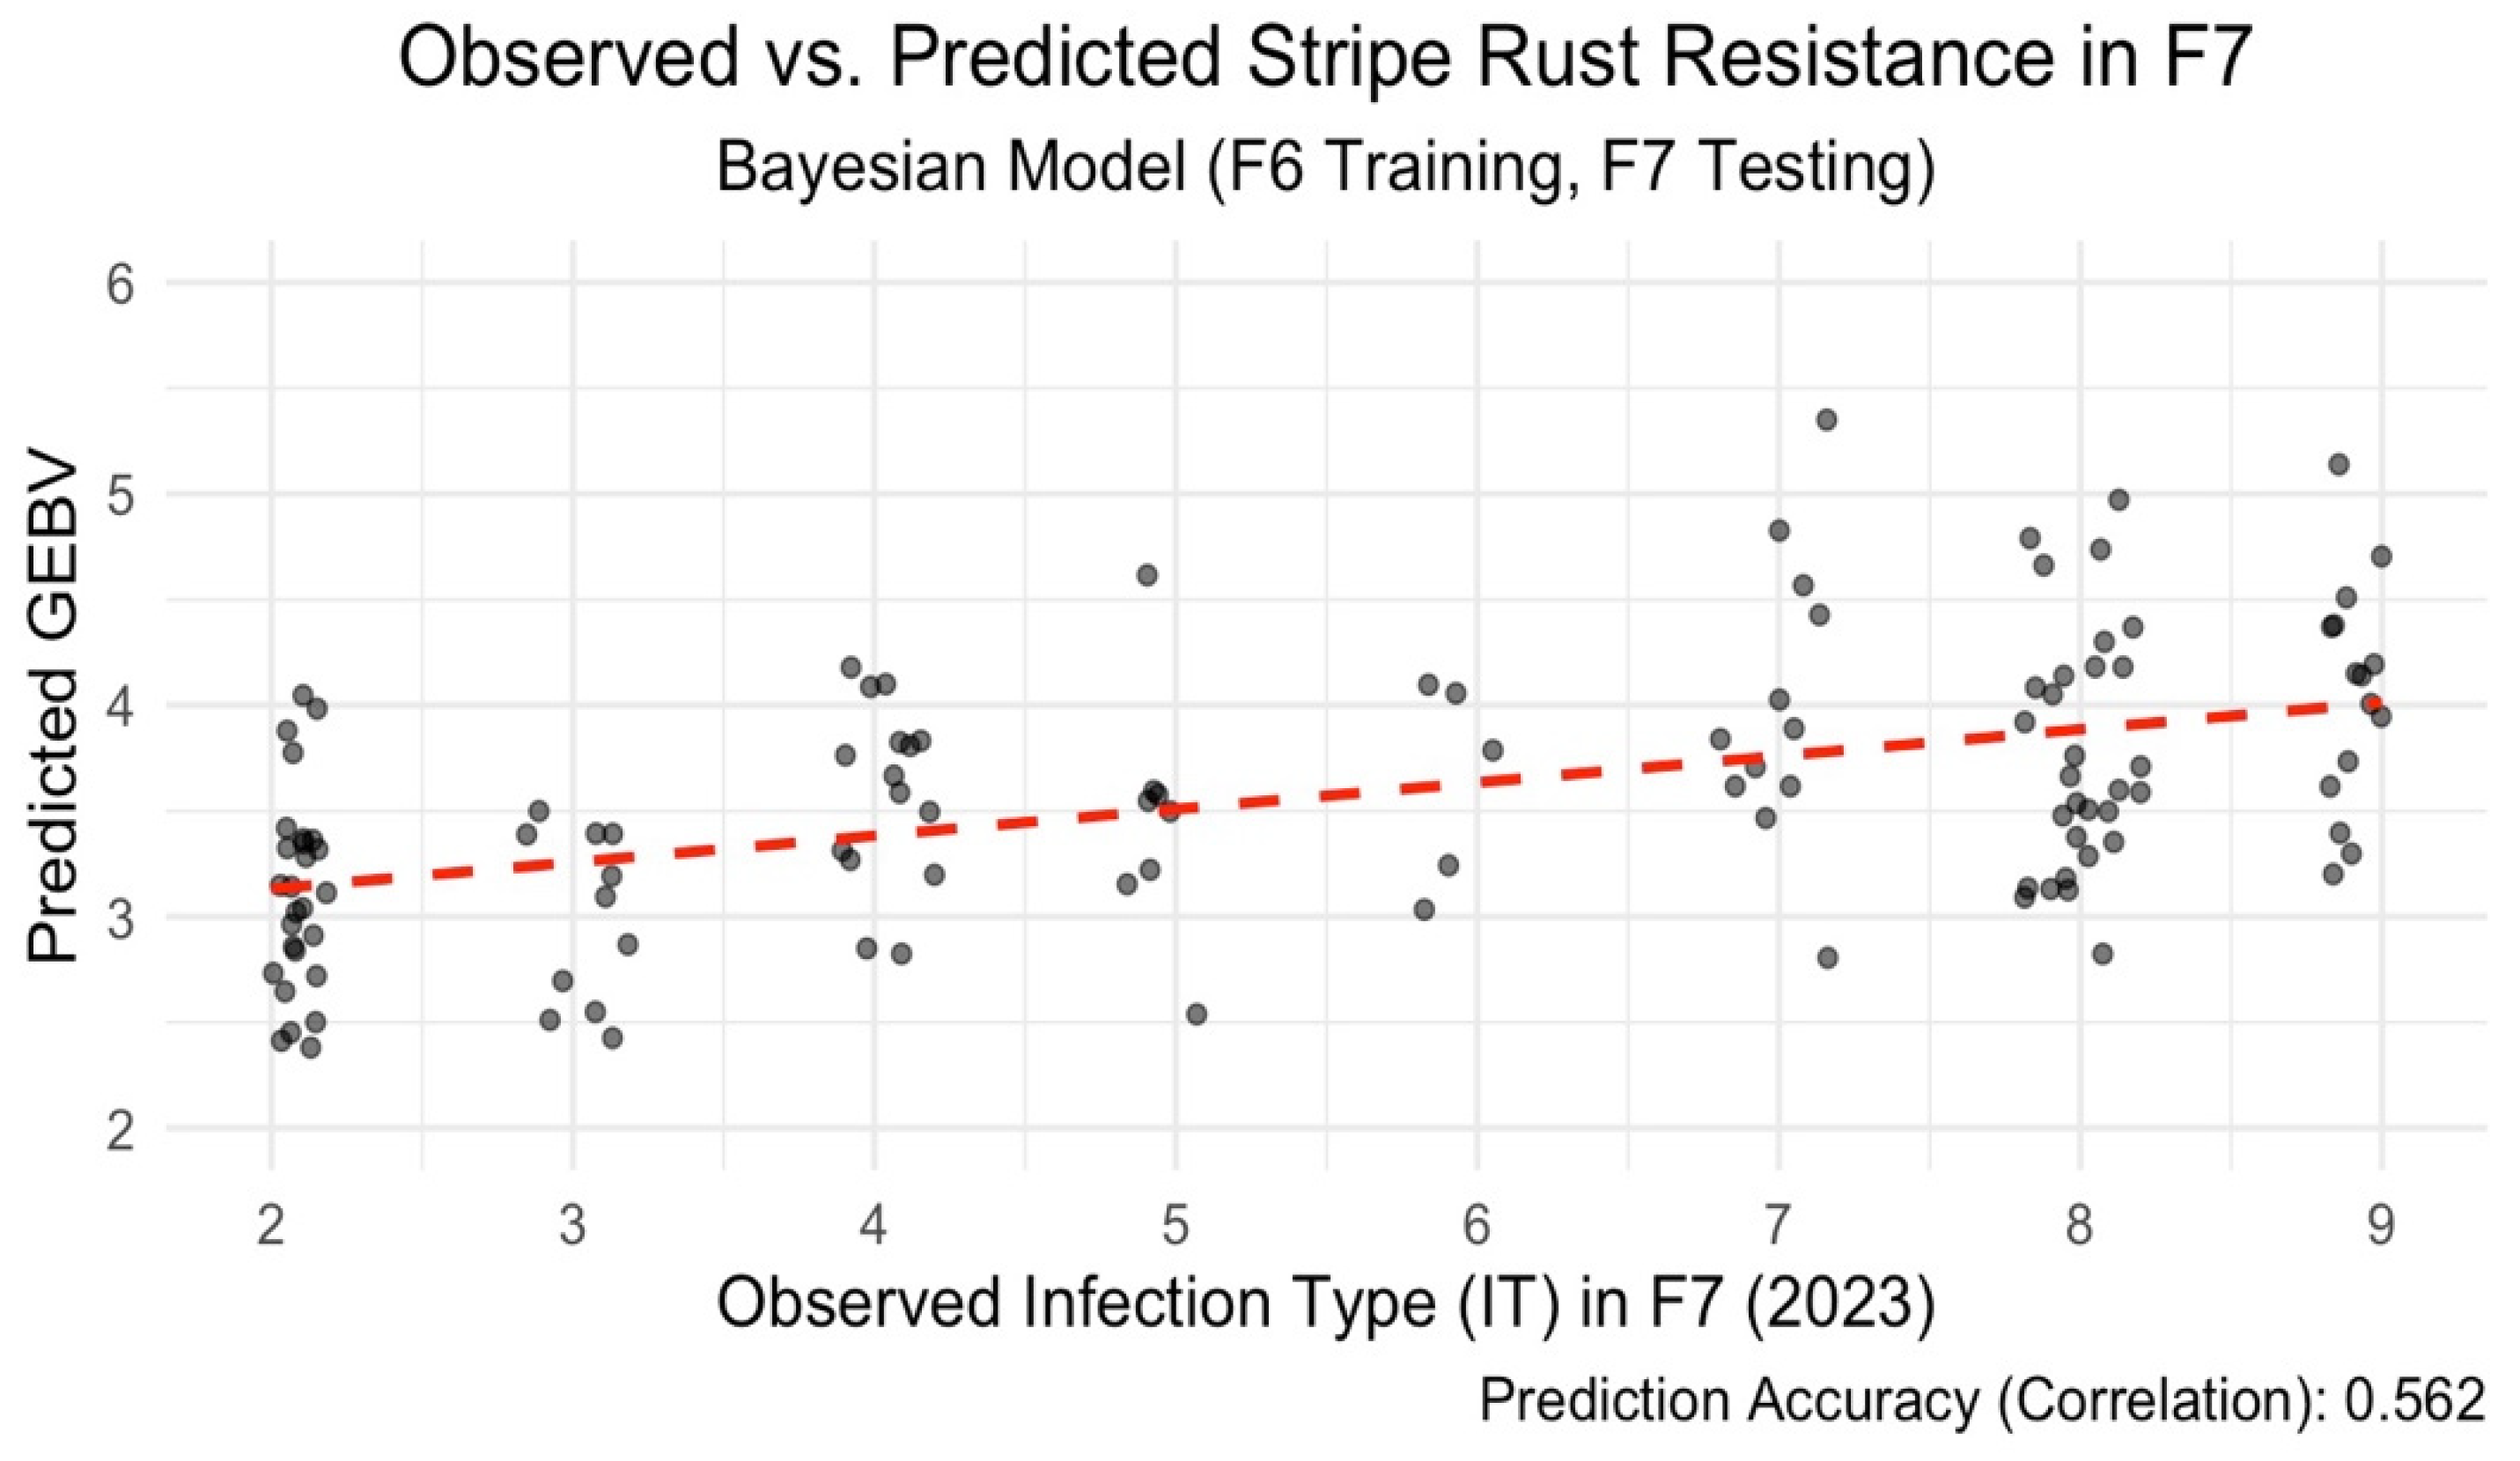
Figure 3.
Observed vs. Predicted Stripe Rust Resistance in F7 using RR-BLUP (Pullman to Mount Vernon, 2018). The red dashed line represents the regression line between observed and predicted values. Genomic prediction performance of an environment-specific RR-BLUP model trained on 2018 data from Pullman and tested on Mount Vernon lines from the same year. The correlation between predicted and observed IT was 0.369, showing reduced transferability across environments.
Disclaimer/Publisher’s Note: The statements, opinions and data contained in all publications are solely those of the individual author(s) and contributor(s) and not of MDPI and/or the editor(s). MDPI and/or the editor(s) disclaim responsibility for any injury to people or property resulting from any ideas, methods, instructions or products referred to in the content. |
© 2025 by the authors. Licensee MDPI, Basel, Switzerland. This article is an open access article distributed under the terms and conditions of the Creative Commons Attribution (CC BY) license (http://creativecommons.org/licenses/by/4.0/).
Copyright: This open access article is published under a Creative Commons CC BY 4.0 license, which permit the free download, distribution, and reuse, provided that the author and preprint are cited in any reuse.


