Submitted:
02 May 2025
Posted:
06 May 2025
You are already at the latest version
Abstract
Sepsis without direct therapeutic drugs is a serious infectious syndrome that presents strong challenges in innovatively reducing mortality and long-term disabilities/fragilities. Immediate intensive actions at the beginning of sepsis are critical for improving prognosis and preventing multiorgan dysfunctions or complications. However, there is an urgent need to introduce alternative options for patients who are refractory to exhaustive resuscitation based on the survival of sepsis campaigns. Natural killer (NK) cells are the core cellular components of the innate immune system, and balanced NK cell activity (NKA) may play a crucial role in hindering the fatal exacerbation of sepsis. Based on conflicting data on whether NKA is harmful or helpful in the course of sepsis, we evaluated NKA following mortality in a murine intra-abdominal sepsis model by measuring the activating/inhibitory NK receptor (NKR) and CD11b/CD27 subpopulations in the peripheral blood, bone marrow, lymph nodes, spleen, and liver. Several experiments have consistently revealed that NKA, which had been reduced immediately after mild-grade sepsis, surviving until day 7 after cecal ligation and puncture, was significantly restored (upregulation of activating NKR, downregulation of inhibitory NKR, further increment of fully mature cytotoxic NK subsets [CD11bhigh/CD27low] or total NK cells, and higher concentration of granzyme B). However, NKA in high-grade sepsis with early entire mortality after cecal ligation and puncture was continuously suppressed. No sustained post-sepsis surge in interferon-γ was observed in the mild-grade sepsis group. In conclusion, persistent repression of NK cell function is associated with a lethal outcome of sepsis.
Keywords:
cecal ligation and puncture
; granzyme B
; immunophenotype
; mortality
; NK cell
; NK cell activity
; NK receptors
; sepsis
1. Introduction
Sepsis syndrome, for which direct and specific drugs are currently unavailable, is a serious infectious condition leading to high mortality and long-term disabilities, irrespective of immediate intensive resuscitation, appropriate antimicrobial treatment, and immunomodulation with corticosteroids or immunoglobulins (Igs) [1,2,3,4]. The initial intricate pathophysiological alterations of sepsis-induced devastating multiorgan dysfunction are associated with exaggerated upregulation of the innate immune system, resulting in an overwhelming release of inflammatory mediators called cytokine storm [1,3,5,6,7]. Therefore, maintaining homeostasis of immune responses plays an important role in adequately controlling infection and inflammation and improving prognosis [6].
Natural killer (NK) cells are crucial cellular components of the rapid and nonspecific host defense mechanisms during early sepsis caused by various bacterial and viral pathogens [7,8,9,10,11,12,13,14,15]. Several human studies have shown that absolute NK cell counts or percentages of total lymphocytes in the early stage of sepsis are associated with gravity or short-term outcomes with conflicting (positive or negative) correlations [16,17,18,19,20]. In a mouse model of severe acute pneumonia caused by Pseudomonas aeruginosa, an apoptotic deficiency of spleen-resident NK cells resulted in earlier death without a change in the bacterial load in the lungs [21]. The gradually increasing number of liver- and spleen-resident NK cells after cecal ligation and puncture (CLP) produced higher serum anti-inflammatory interleukin (IL)-10 levels through the decreased IL-18 receptor, which ultimately caused mortality in a polymicrobial murine sepsis model [22]. In addition, NK cell-depleted mice had improved survival rates through lowering pro-inflammatory cytokines (e.g., interferon-γ [IFN-γ], IL-6) in the septic shock induced by Streptococcus pyogenes [14]. These data suggest that NK cells are significantly involved in the complex immunological mechanisms of incipient sepsis with close interactions with diverse inflammatory mediators; however, it is still not clear whether NK cell activity (NKA) could be comprehensively beneficial or harmful to the outcome of universal sepsis syndrome or sepsis in particular situations (e.g., basic host immune status and old age) or by specific microbes [9,19,23,24,25,26,27].
NKA is systematically regulated by an overall balance between signals delivered through many activating and inhibitory NK cell receptors (NKR), which are classified into Ig and C-type lectin superfamilies [28,29]. In a human study of intensive care unit participants, the killer cell Ig-like receptor-3DL1 (CD158e), an inhibitory NKR, was significantly higher in the sepsis group than in the systemic inflammatory response syndrome group; however, other activating or inhibitory NKRs, including NKp30, NKp46, and NKG2A/C/D, were similar between the two groups [20]. Little is known about NKA alterations based on the dynamic changes in NK cell subpopulations and NKRs in the blood and lymphoid organs during the initial stages of sepsis according to mortality. We conducted this study to identify the distinct features of NKA that cause early sepsis-attributable death by comparing time-specific differences in surface antigens and receptors between surviving and deceased groups in a murine sepsis model.
2. Results
2.1. Changes in NK-1.1 Expression and Total NK Cell Counts
NK-1.1-encoding mRNA in PB compared with that in BM and tissues was expressed most strongly in the sham, MGS, and HGS groups, regardless of the time points after sepsis. The levels of NK-1.1 mRNA in the PB samples of all mice after MGS and HGS were significantly lower than those in the sham control (all P < 0.001). NK-1.1-encoding mRNA in the PB of the MGS group was significantly upregulated on days 3 (P < 0.001) and 7 (P = 0.02) compared with day 1, but NK-1.1-encoding mRNA on day 3 after HGS was significantly downregulated compared with day 1 (P < 0.001). The suppressed NK1.1-encoding mRNA in the BM-, LN-, liver-, and spleen-resident lymphocytes on the first day after MGS compared with that in the sham group (all P < 0.001) gradually recovered over time (all P < 0.001). The levels of NK-1.1-encoding mRNA on the 7th day were significantly higher than those in the sham group (all P < 0.001). However, the BM-, LN-, liver-, and spleen-resident lymphocytes in the HGS group had significantly lower NK1.1-encoding mRNA levels on day 3 than on day 1 (all P < 0.001) (Figure S1).
The changing patterns of total NK cell (CD3-/NK-1.1+) percentages in flow cytometry were similar to the results of RT-PCR in all samples and time points in the MGS and HGS groups (Figure 1 and Figure S2). Flow cytometry showed that the ratios of total NK cells in the PB, LN, BM, spleen, and liver on day 1 after MGS and HGS were substantially reduced compared with those in the sham group. The proportion of NK cells in the MGS group gradually increased on the 3rd and 7th days after MGS, but the total NK cell percentage decreased on the 3rd day in the HGS group. Shrinkage of NK cells at day 3 was more clearly observed in the PB and LN (Figure 1).
2.2. Differences of CD11b- or CD27-Expressing NK cell Subpopulations According to Sepsis Lethality
CD11b expression in PB-, LN-, spleen-, and liver-resident NK cells of the MGS group was considerably increased on days 1, 3, and 7 compared to that in the sham group, and the percentage of CD11bhigh/CD27low NK cells continued to expand over time after MGS. BM-resident NK cells on the first day after MGS had a similar proportion of CD11bhigh/CD27low as the sham but had significantly higher ratios of CD11bhigh/CD27low subpopulations on days 3 and 7, as with other types of samples. In contrast to the MGS group, CD11bhigh/CD27low NK cells on day 3 after HGS in the PB, BM, LN, spleen, and liver were substantially suppressed compared with those on day 1 after HGS, even though CD11bhigh/CD27low NK cells on day 1 after HGS in all samples, except the BM, had a higher percentage than those in the sham group (Figure 2).
Alterations in the percentage of CD11blow/CD27high NK cells in both MGS and HGS showed opposite characteristics to those of the CD11bhigh/CD27low subpopulations. CD27 expression in all samples except the BM increased after MGS and HGS compared with that in the sham group. The proportions of CD11blow/CD27high NK cells on days 3 and 7 after MGS were greatly reduced compared with that on day 1, with a gradual decline over time; however, CD11blow/CD27high subpopulations on day 3 in the HGS group were higher than those on day 1 (Figure 2).
2.3. Dynamic Alteration of NK Receptors in the MGS and HGS
The mRNAs encoding Ly-40C and Ly-49G2 NKR in PB-, LN-, and BM-resident NK cells of the MGS group were significantly upregulated on day 1 after MGS compared with those in the sham group (all P < 0.001). However, the mRNA levels of Ly-40C and Ly-49G2 on days 3 and 7 in these NK cells continued to gradually decrease compared with those on day 1 after MGS (all P < 0.001, except P = 0.02 between days 3 and 7 in PB). In contrast to MGS, the mRNA expression levels of Ly-40C and Ly-49G2 on day 1 after HGS in PB-, LN-, and BM-resident NK cells were significantly higher than those in the sham group (all P < 0.001) and increased further on day 3 (all P < 0.001). The mRNAs encoding the Ly-40C and Ly-49G2 receptors in spleen- and liver-resident NK cells showed no significant differences in either MGS or HGS or at all time points after sepsis (Figure 3A,B).
The amount of mRNA encoding Ly-49H NKR expressed in BM-resident NK cells, which was significantly upregulated on day 1 or 3 after HGS compared with that in the sham group (all P < 0.001), was significantly reduced on day 3 compared with that on day 1 (P < 0.001). However, the mRNA levels of Ly-49H in samples, except for BM or Ly-49D in PB and all tissues, were similar between days 1 and 3 after HGS. The PB-, LN-, and BM-resident NK cells on days 3 and 7 after MGS highly expressed mRNA encoding Ly-40D and Ly-49H NKRs compared with the levels on day 1, as well as in the sham group, with a large upregulation over time after MGS (all P < 0.001) (Figure 3C,D). Overall, mRNAs encoding Ly-40C/G2 or Ly-40D/H were the most downregulated or upregulated, respectively, in PB-, LN-, and BM-resident NK cells on day 7 after MGS (Figure 3A–D).
2.4. Expression of Granzyme B and IFN-γ
Plasma GzmB concentrations after sepsis in both the MGS and HGS groups were significantly higher than those in the sham group (all P < 0.001). The levels of GzmB in the HGS group were not different on days 1 and 3, but GzmB levels in the MGS group gradually and significantly increased on days 1, 3, and 7 (P < 0.001 between days 1 and 3 or between days 1 and 7, and P = 0.01 between day 3 and 7) (Figure 5A).
GzmB-encoding mRNA expression normalized to that of the sham mice as 1 showed a significant and gradual increase (from 2-fold to 7-fold) in the PB and LN of the MGS group over time after sepsis (all P < 0.001). The mRNA expression of GzmB in the spleen, which was upregulated on day 1 after MGS, was significantly downregulated to a value lower than that in the sham group on days 3 and 7 (P < 0.001). The BM and liver showed no changes in GzmB-encoding mRNA after MGS, with normalized values of less than 1. The normalized mRNA levels of GzmB in the PB, LN, BM, liver, and spleen did not differ between days 1 and 3 after HGS, with a fold change > 1 only in the PB (Figure 5B).
The IFN-γ concentration, which was greatly increased on day 1 after HGS, did not decrease and remained high on day 3. However, the high level of IFN-γ on day 1 after MGS was significantly reduced on days 3 and 7 (all P < 0.001) (Figure 5C).
3. Discussion
Our results present the following findings about NKA after sepsis in the PB, BM, and lymphoid organs: (1) regardless of the gravity, the proportion of total NK cells among mononuclear cells is reduced immediately after sepsis; (2) the declined total NK cells are gradually restored in the surviving MGS but not in the lethal HGS; (3) the terminally mature lytic NK cells (CD11bhigh/CD27low) continue to increase over time after MGS [30,31,32,33]; (4) the immediate expansion of lytic NK cells rapidly disappears by day 3 after the HGS; (5) the cytokine-producing NK cells (CD11blow/CD27high) show the opposite characteristics of the lytic NK cell subpopulations (gradually suppression after MGS and increase after HGS) [33]; (6) the activating NKRs in the PB, LN, and BM are significantly induced gradually after MGS but not after HGS. On the contrary, the inhibitory NKRs are continuously downregulated over time after a surge immediately after MGS, but it increases sharply in the lethal HGS; and (7) consistent with the dynamic alterations of lytic NK subpopulations, the plasma GzmB increases continuously after MGS but not in the HGS.
Together with these coherent data from diverse examinations, changes in GzmB with cytotoxicity against cells invaded by pathogens may collectively imply dynamic changes in comprehensive NKA during the early stage according to the lethality of sepsis as follows [13,27,34]: (1) NKA is restrained immediately after non-lethal sepsis but recovers over time; (2) NKA in sepsis with short-term mortality continues to be substantially repressed; and (3) restored NKA in less critical sepsis does not result in excessive production of cytokines. The diametrical relationship between NKA and early fatality of sepsis suggests that the measurement of NKA (e.g., proportions of NK subpopulations by the standardized flow cytometry or levels of specific activating/inhibitory NKRs or concentration of GzmB after NK cell sorting) could be clinically utilized as an initial indicator to predict a poor prognosis of sepsis and that the infusion of functionally matured NK effector cells at certain time or situation (e.g., unrecoverable NKA) might be used as an alternative therapy in the detrimental sepsis that is refractory to standard management [9,13,15,27]. Clinical studies have been conducted on adoptive NK cell-based immunotherapies for treating infectious diseases [9,15,27].
Previous human and animal studies could not establish whether total NK cells or subpopulations and NKA ultimately contribute to the worsening of the complicated pathophysiology leading to the immune-paralytic status or result in a balanced recovery in the course of sepsis, which are strongly related to the moderation of cytotoxic or apoptotic effects, as well as pro- or anti-inflammatory cytokines/chemokines [9,19,25,26,27]. Nevertheless, recent studies suggest that appropriate NK cells, specific NKA, and proper GzmB inhibition are associated with good sepsis prognoses and can be employed as promising therapeutic targets [9,34,35,36,37,38]. This study is the first to evaluate the dynamic variation in the functional subsets of NK cells at early time points after the onset of sepsis and to compare several NKA parameters between surviving and fatal sepsis.
Our study has the following limitations: (1) results from polymicrobial and intra-abdominal murine sepsis model by CLP might not be identical to sepsis caused by specific microorganisms in other infection sites and therefore could not be perfectly generalized to all situations of sepsis syndrome despite the beneficial roles of NK cells in Escherichia coli and S. pyogenes sepsis; (2) because the experiments did not measure all types of extremely diverse NKRs and various pro-/anti-inflammatory cytokines as well as not investigate the interactions of the NKRs to the host ligand, it might be not possible to perfectly uncover complex implications of NKA on sepsis lethality; (3) there might not be consensus in defining the comprehensive functions of NK cells with the expression of CD11b/CD27, some NKRs or GzmB.
Regardless of the animal model, we exhaustively induced sepsis by distinguishing between MGS and HGS and elaborately analyzing NK subpopulations and NKRs present in various immune organs and PB. Because it is difficult to objectively recognize the onset of sepsis when the patient is admitted to the hospital, we could not compare the dynamics over time. Unlike clinical settings, animal sepsis models can evaluate dynamic NKA according to the exact time point after sepsis occurrence.
In conclusion, the upregulation of inhibitory NKRs and downregulation of activating NKRs continued, and the cytotoxic capacity of total NK cells was significantly suppressed in fatal sepsis. Ongoing research on the association between NK cell function and sepsis fatality originating from various pathogens and sites may help provide alternatives to refractory sepsis treatment without direct drugs and discover new prognostic biomarkers for the initial awareness of patients requiring strong countermeasures.
4. Materials and Methods
4.1. Polymicrobial Sepsis Model in Mice
Murine experimental procedures were approved by the Institutional Animal Care and Use Committee of the Yonsei University College of Medicine (Approval No. 2020-0076). The intra-abdominal polymicrobial sepsis was induced using CLP [39]. The male C57BL/6 mice aged 8 to 10 weeks (Junbiotech Inc., Gyeonggi-do, South Korea) were randomly divided into three groups: (1) sham control (N = 28), (2) mid-grade sepsis (MGS) with 30–40% survival (N = 45), and (3) high-grade sepsis (HGS) with 100% lethality a week after CLP (N = 45) (Figure S3). The cecum in MGS was ligated at half the distance between the distal pole and the base of the cecum (immediately below the ileocecal valve), and the proximal 75% of the entire cecum was ligated in HGS. The midway point in the ligated cecum was perforated by single-hole through-and-through puncture with a 21-gauge needle three times from the mesenteric toward the antimesenteric direction and then gently compressed to extrude a small amount of feces [39]. The sham group was operated identically except for ligation and punctuation. All mice were subcutaneously administered pre-warmed normal saline and tramadol (Aju Pharm Co., Ltd., Seoul, South Korea).
Live mice (27 after seven days in the sham group; nine each after one, three, and seven days in the MGS group; and nine each after one or three days in the HGS group) were euthanized with CO2. Because all the mice died within one week of HGS, no samples were obtained after seven days. After blood collection, the mice were transcardially perfused with ice-cold phosphate-buffered saline (PBS) to remove intravascular blood cells, and the bone, lymph node (LN), spleen, and liver were harvested with aseptic handling.
4.2. Isolation of Mononuclear Cells from the Blood, Bone Marrow, LN, Liver, and Spleen
Whole peripheral blood (PB) was collected by cardiac puncture, and supernatant plasma (200 µL) after immediate centrifugation was stored at −80°C until the enzyme-linked immunosorbent assay was performed. Bone marrow (BM) cells were obtained from the femur and tibia. A microcentrifuge tube with a hole at the bottom containing small pieces of bone epiphysis was placed inside another tube filled with ice-cold PBS and 2% fetal bovine serum. The nested tubes were centrifuged for 3 min, and the flushed BM cell suspension was passed through the 70-µm nylon mesh (Falcon® Cell Strainers, Corning Inc., NY, USA) to remove tissue debris [40].
The axillary/inguinal LNs, spleen, and liver were mashed with the 200-µm nylon mesh and pestles. Cell suspensions from the crushed pieces were passed through a 70-µm nylon mesh. The pelleted cells were resuspended in 40% isotonic PercollTM PLUS (GE Healthcare Biosciences AB, Uppsala, Sweden), and the suspension was layered on 70% PercollTM PLUS and then centrifuged for 30 min. Mononuclear cells in the interlayer were collected using a syringe and washed [22,41].
Live cells isolated from PB, BM, LNs, spleen, and liver were resuspended in RBC lysis buffer (BioLegend Inc., San Diego, CA, USA) and incubated on ice. After centrifugation, the pellet was repeatedly washed with ice-cold PBS until erythrocytes were visually depleted. All types of cells were checked as mononuclear cells through the mean diameter (5–8 μm) measurements using the cell viability analyzer (Cellometer® Auto 2000, Nexcelom Bioscience, Lawrence, MA, USA), and then fixed in 4% paraformaldehyde (BioLegend). The mononuclear cells were cryopreserved at −80°C in 90% fetal bovine serum (Welgene Inc., Gyeongsangbuk-do, South Korea) with 10% dimethyl sulfoxide for flow cytometry.
4.3. Flow Cytometry Analyses
The cryopreserved cells were resuspended in PBS and incubated with a fluorochrome-conjugated monoclonal antibodies cocktail (Table 1) in 100 µL of stain buffer (BD Biosciences, San Jose, CA, USA) at 4°C for 30 min in the dark. Flow cytometry experiments were performed on the BD LSRFortessa™ X-20 (BD Biosciences), and results were analyzed using FlowJoTM software (version 10.10, Ashland, OR, USA). The gating strategy was implemented as follows: (1) identification of the total NK population defined as NK-1.1 (CD161)+ and CD3- among lymphocytes, (2) compartmentalization of NK cell subsets in accordance with the fluorescent intensities (low or high) of CD11b (integrin α-M or Mac-1) and CD27, corresponding to CD16 and CD56 in humans, respectively [30,31,32,42,43], and (3) measurement of NKR expression in total NK cells for lymphocyte antigen (Ly)-49D (killer cell C-type lectin-like receptor [KLRA]-4) or Ly-49H (KLRA-8) and Ly-49C/I (KLRA-3/9) or Ly-49G2 (KLRA-7) corresponding to activating and inhibitory NKR, respectively (Figure S4) [44,45,46,47,48]. Individual isotype controls for all monoclonal antibodies were used to exclude nonspecific antigen-antibody binding. Flow cytometry measurements were repeated three times for each sample.
4.4. Quantitative Real-Time Polymerase Chain Reaction (RT-PCR)
All tissues were homogenized using the grinder (KIMBLE® KONTES® Dounce, DWK Life Sciences, NJ, USA). Total RNA from tissues, PB, and BM was immediately extracted using the guanidinium thiocyanate-phenol-chloroform extraction method (TRIzol®, Invitrogen, Thermo Fisher Scientific, MA, USA). Reverse transcription was performed using a RevertAidTM First Strand cDNA Synthesis Kit (Thermo Fisher Scientific). The RT-PCR was implemented with a LightCycler® 480 SYBR Green I Master qPCR mix kit (Roche Life Science, Penzberg, Germany) on LightCycler® 480 system (Roche Life Science) at 95°C for 5 min followed by 45 cycles at 95°C for 10 s and 60°C for 30 s. Forward and reverse primers for NK-1.1, Ly-49C, Ly-49D, Ly-49G2, Ly-49H, granzyme B, and glyceraldehyde-3-phosphate dehydrogenase (GAPDH) were designed by Cosmo Genetech, Inc. (Seoul, South Korea) (Table 2). The quantitation of the messenger RNA (mRNA) expression was determined using the comparative method (2−ΔΔCt) with the normalization of a housekeeping gene (GAPDH). RT-PCR was performed twice for each sample, and the average values were used in the final analysis.
Supplementary Materials
The following supporting information can be downloaded at the website of this paper posted on Preprints.org, Figure S1: Comparisons of NK-1.1 (CD161) mRNA expression according to sepsis lethality and the time elapsed after the induction of sepsis in peripheral blood, bone marrow cells, and lymphoid tissues; Figure S2: Changes in the number of cells expressing inhibitory or activating NK receptors in various tissues and the bone marrow; Figure S3: Survival curve of mice that underwent mild- or high-grade cecal ligation and puncture operation and sham procedure; Figure S4: Gating strategy for identifying NK cells and CD11b- or CD27-single positive NK subpopulations and determination of the number of cells expressing NK receptors on the surface.
Author Contributions
Conceptualization, S.H.H., Y-M.H. and E.H.L.; methodology, S.H.H. and Y-M.H.; formal analysis, S.H.H.; investigation, Y-M.H.; resources, S.H.H..; data curation, S.H.H., Y-M.H.; writing—original draft preparation, S.H.H. and Y-M.H.; writing—review and editing, S.H.H., Y-M.H., E.H.L. D.K. E.H.L. and H.S.; visualization, S.H.H. and Y-M.H.; supervision, S.H.H.; project administration, S.H.H.; funding acquisition, S.H.H. All authors have read and agreed to the published version of the manuscript.
Funding
This work was supported by a National Research Foundation of Korea (NRF) grant funded by the Korean government (Ministry of Science and ICT) (Grant No. 2019R1C1C1007558) and a faculty research grant from the Yonsei University College of Medicine (Grant No. 6-2016-0037).
Institutional Review Board Statement
The animal study protocol was approved by the Institutional Animal Care and Use Committee of the Yonsei University College of Medicine (Approval No. 2020-0076).
Informed Consent Statement
Not applicable.
Data Availability Statement
The data that support the findings of this study are available from the corresponding author.
Acknowledgments
We did not use generative artificial intelligence (GenAI) in this paper. The authors have reviewed and edited the output and take full responsibility for the content of this publication.
Conflicts of Interest
The authors declare that the research was conducted in the absence of any commercial or financial relationships that could be construed as a potential conflict of interest.
Abbreviations
The following abbreviations are used in this manuscript:
| BM | Bone marrow |
| CD | Cluster of differentiation |
| CLP | Cecal ligation and puncture |
| HGS | High-grade sepsis |
| GAPDH | Glyceraldehyde 3-phosphate dehydrogenase |
| Ig | Immunoglobulin |
| IFN-γ | Interferon-γ |
| IL | Interleukin |
| LN | Lymph node |
| MGS | Mid-grade sepsis |
| NK | Natural killer |
| NKA | Natural killer cell activity |
| NKR | Natural killer cell receptor |
| PB | Peripheral blood |
References
- Singer, M.; Deutschman, C.S.; Seymour, C.W.; Shankar-Hari, M.; Annane, D.; Bauer, M.; Bellomo, R.; Bernard, G.R.; Chiche, J.D.; Coopersmith, C.M.; et al. The third international consensus definitions for sepsis and septic shock (sepsis-3). JAMA 2016, 315, 801–810. [Google Scholar] [CrossRef]
- Fleischmann, C.; Scherag, A.; Adhikari, N.K.; Hartog, C.S.; Tsaganos, T.; Schlattmann, P.; Angus, D.C.; Reinhart, K. Assessment of global incidence and mortality of hospital-treated sepsis. Current estimates and limitations. Am. J. Respir. Crit. Care Med. 2016, 193, 259–272. [Google Scholar] [CrossRef] [PubMed]
- Cecconi, M.; Evans, L.; Levy, M.; Rhodes, A. Sepsis and septic shock. Lancet 2018, 392, 75–87. [Google Scholar] [CrossRef] [PubMed]
- Bauer, M.; Gerlach, H.; Vogelmann, T.; Preissing, F.; Stiefel, J.; Adam, D. Mortality in sepsis and septic shock in europe, north america and australia between 2009 and 2019- results from a systematic review and meta-analysis. Crit. Care 2020, 24, 239. [Google Scholar] [CrossRef]
- Chousterman, B.G.; Swirski, F.K.; Weber, G.F. Cytokine storm and sepsis disease pathogenesis. Semin. Immunopathol. 2017, 39, 517–528. [Google Scholar] [CrossRef] [PubMed]
- van der Poll, T.; van de Veerdonk, F.L.; Scicluna, B.P.; Netea, M.G. The immunopathology of sepsis and potential therapeutic targets. Nat. Rev. Immunol. 2017, 17, 407–420. [Google Scholar] [CrossRef]
- Rimmelé, T.; Payen, D.; Cantaluppi, V.; Marshall, J.; Gomez, H.; Gomez, A.; Murray, P.; Kellum, J.A. Immune cell phenotype and function in sepsis. Shock 2016, 45, 282–291. [Google Scholar] [CrossRef]
- Spits, H.; Bernink, J.H.; Lanier, L. Nk cells and type 1 innate lymphoid cells: Partners in host defense. Nat. Immunol. 2016, 17, 758–764. [Google Scholar] [CrossRef]
- Kumar, V. Natural killer cells in sepsis: Underprivileged innate immune cells. Eur. J. Cell Biol. 2019, 98, 81–93. [Google Scholar] [CrossRef]
- Jost, S.; Altfeld, M. Control of human viral infections by natural killer cells. Annu. Rev. Immunol. 2013, 31, 163–194. [Google Scholar] [CrossRef]
- Athié-Morales, V.; O’Connor, G.M.; Gardiner, C.M. Activation of human nk cells by the bacterial pathogen-associated molecular pattern muramyl dipeptide. J. Immunol. 2008, 180, 4082–4089. [Google Scholar] [CrossRef] [PubMed]
- Souza-Fonseca-Guimaraes, F.; Parlato, M.; Philippart, F.; Misset, B.; Cavaillon, J.M.; Adib-Conquy, M. Toll-like receptors expression and interferon-γ production by nk cells in human sepsis. Crit. Care 2012, 16, R206. [Google Scholar] [CrossRef]
- Guo, Y.; Patil, N.K.; Luan, L.; Bohannon, J.K.; Sherwood, E.R. The biology of natural killer cells during sepsis. Immunology 2018, 153, 190–202. [Google Scholar] [CrossRef] [PubMed]
- Goldmann, O.; Chhatwal, G.S.; Medina, E. Contribution of natural killer cells to the pathogenesis of septic shock induced by streptococcus pyogenes in mice. J. Infect. Dis. 2005, 191, 1280–1286. [Google Scholar] [CrossRef]
- Ma, L.; Li, Q.; Cai, S.; Peng, H.; Huyan, T.; Yang, H. The role of nk cells in fighting the virus infection and sepsis. Int. J. Med. Sci. 2021, 18, 3236–3248. [Google Scholar] [CrossRef] [PubMed]
- Andaluz-Ojeda, D.; Iglesias, V.; Bobillo, F.; Almansa, R.; Rico, L.; Gandía, F.; Loma, A.M.; Nieto, C.; Diego, R.; Ramos, E.; et al. Early natural killer cell counts in blood predict mortality in severe sepsis. Crit. Care 2011, 15, R243. [Google Scholar] [CrossRef]
- Giamarellos-Bourboulis, E.J.; Tsaganos, T.; Spyridaki, E.; Mouktaroudi, M.; Plachouras, D.; Vaki, I.; Karagianni, V.; Antonopoulou, A.; Veloni, V.; Giamarellou, H. Early changes of cd4-positive lymphocytes and nk cells in patients with severe gram-negative sepsis. Crit. Care 2006, 10, R166. [Google Scholar] [CrossRef]
- Gogos, C.; Kotsaki, A.; Pelekanou, A.; Giannikopoulos, G.; Vaki, I.; Maravitsa, P.; Adamis, S.; Alexiou, Z.; Andrianopoulos, G.; Antonopoulou, A.; et al. Early alterations of the innate and adaptive immune statuses in sepsis according to the type of underlying infection. Crit. Care 2010, 14, R96. [Google Scholar] [CrossRef]
- Giamarellos-Bourboulis, E.J. Natural killer cells in sepsis: Detrimental role for final outcome. Crit. Care Med. 2014, 42, 1579–1580. [Google Scholar] [CrossRef]
- Forel, J.M.; Chiche, L.; Thomas, G.; Mancini, J.; Farnarier, C.; Cognet, C.; Guervilly, C.; Daumas, A.; Vély, F.; Xéridat, F.; et al. Phenotype and functions of natural killer cells in critically-ill septic patients. PLoS One 2012, 7, e50446. [Google Scholar] [CrossRef]
- Broquet, A.; Roquilly, A.; Jacqueline, C.; Potel, G.; Caillon, J.; Asehnoune, K. Depletion of natural killer cells increases mice susceptibility in a pseudomonas aeruginosa pneumonia model. Crit. Care Med. 2014, 42, e441–450. [Google Scholar] [CrossRef]
- Hiraki, S.; Ono, S.; Kinoshita, M.; Tsujimoto, H.; Takahata, R.; Miyazaki, H.; Saitoh, D.; Seki, S.; Hase, K. Neutralization of il-10 restores the downregulation of il-18 receptor on natural killer cells and interferon-γ production in septic mice, thus leading to an improved survival. Shock 2012, 37, 177–182. [Google Scholar] [CrossRef]
- Horowitz, A.; Stegmann, K.A.; Riley, E.M. Activation of natural killer cells during microbial infections. Front. Immunol. 2011, 2, 88. [Google Scholar] [CrossRef] [PubMed]
- Souza-Fonseca-Guimaraes, F.; Adib-Conquy, M.; Cavaillon, J.M. Natural killer (nk) cells in antibacterial innate immunity: Angels or devils? Mol. Med. 2012, 18, 270–285. [Google Scholar] [CrossRef]
- Souza-Fonseca-Guimaraes, F.; Cavaillon, J.M.; Adib-Conquy, M. Bench-to-bedside review: Natural killer cells in sepsis - guilty or not guilty? Crit. Care 2013, 17, 235. [Google Scholar] [CrossRef] [PubMed]
- Bohannon, J.; Guo, Y.; Sherwood, E.R. The role of natural killer cells in the pathogenesis of sepsis: The ongoing enigma. Crit. Care 2012, 16, 185. [Google Scholar] [CrossRef] [PubMed]
- Wang, F.; Cui, Y.; He, D.; Gong, L.; Liang, H. Natural killer cells in sepsis: Friends or foes? Front. Immunol. 2023, 14, 1101918. [Google Scholar] [CrossRef] [PubMed]
- Martinet, L.; Smyth, M.J. Balancing natural killer cell activation through paired receptors. Nat. Rev. Immunol. 2015, 15, 243–254. [Google Scholar] [CrossRef]
- Chen, Y.; Lu, D.; Churov, A.; Fu, R. Research progress on nk cell receptors and their signaling pathways. Mediators Inflamm. 2020, 2020, 6437057. [Google Scholar] [CrossRef]
- Sungur, C.M.; Murphy, W.J. Utilization of mouse models to decipher natural killer cell biology and potential clinical applications. Hematology Am. Soc. Hematol. Educ. Program 2013, 2013, 227–233. [Google Scholar] [CrossRef]
- Abel, A.M.; Yang, C.; Thakar, M.S.; Malarkannan, S. Natural killer cells: Development, maturation, and clinical utilization. Front. Immunol. 2018, 9, 1869. [Google Scholar] [CrossRef]
- Crinier, A.; Narni-Mancinelli, E.; Ugolini, S.; Vivier, E. Snapshot: Natural killer cells. Cell 2020, 180, 1280–1280.e1281. [Google Scholar] [CrossRef]
- Hayakawa, Y.; Huntington, N.D.; Nutt, S.L.; Smyth, M.J. Functional subsets of mouse natural killer cells. Immunol. Rev. 2006, 214, 47–55. [Google Scholar] [CrossRef]
- Garzón-Tituaña, M.; Sierra-Monzón, J.L.; Comas, L.; Santiago, L.; Khaliulina-Ushakova, T.; Uranga-Murillo, I.; Ramirez-Labrada, A.; Tapia, E.; Morte-Romea, E.; Algarate, S.; et al. Granzyme a inhibition reduces inflammation and increases survival during abdominal sepsis. Theranostics 2021, 11, 3781–3795. [Google Scholar] [CrossRef] [PubMed]
- Zhang, Y.; Wang, J.; Hu, L.; Xuan, J.; Qu, Y.; Li, Y.; Ye, X.; Yang, L.; Yang, J.; Zhang, X.; et al. Predictive value of immune cell subsets for mortality risk in patients with sepsis. Clin. Appl. Thromb. Hemost. 2021, 27, 10760296211059498. [Google Scholar] [CrossRef] [PubMed]
- Feng, Y.; Wu, Q.; Zhang, T.; Chen, J.; Wu, X. Natural killer cell deficiency experiences higher risk of sepsis after critical intracerebral hemorrhage. Int. J. Immunopathol. Pharmacol. 2021, 35, 20587384211056495. [Google Scholar] [CrossRef] [PubMed]
- Lan, J.; Zhang, H.; Zhao, H.; Liu, L.; Shi, Q.; Li, D.; Ju, X. Cord blood natural killer cells inhibit sepsis caused by feces-induced acute peritonitis via increasing endothelium integrity. Cell Transplant. 2022, 31, 9636897221090257. [Google Scholar] [CrossRef]
- Jensen, I.J.; McGonagill, P.W.; Butler, N.S.; Harty, J.T.; Griffith, T.S.; Badovinac, V.P. Nk cell-derived il-10 supports host survival during sepsis. J. Immunol. 2021, 206, 1171–1180. [Google Scholar] [CrossRef]
- Rittirsch, D.; Huber-Lang, M.S.; Flierl, M.A.; Ward, P.A. Immunodesign of experimental sepsis by cecal ligation and puncture. Nat. Protoc. 2009, 4, 31–36. [Google Scholar] [CrossRef]
- Liu, X.; Quan, N. Immune cell isolation from mouse femur bone marrow. Bio Protoc. 2015, 5. [Google Scholar] [CrossRef]
- Wang, J.; Sun, R.; Wei, H.; Dong, Z.; Gao, B.; Tian, Z. Poly i:C prevents t cell-mediated hepatitis via an nk-dependent mechanism. J. Hepatol. 2006, 44, 446–454. [Google Scholar] [CrossRef]
- Chiossone, L.; Chaix, J.; Fuseri, N.; Roth, C.; Vivier, E.; Walzer, T. Maturation of mouse nk cells is a 4-stage developmental program. Blood 2009, 113, 5488–5496. [Google Scholar] [CrossRef] [PubMed]
- Kim, S.; Iizuka, K.; Kang, H.S.; Dokun, A.; French, A.R.; Greco, S.; Yokoyama, W.M. In vivo developmental stages in murine natural killer cell maturation. Nat. Immunol. 2002, 3, 523–528. [Google Scholar] [CrossRef] [PubMed]
- Rahim, M.M.; Tu, M.M.; Mahmoud, A.B.; Wight, A.; Abou-Samra, E.; Lima, P.D.; Makrigiannis, A.P. Ly49 receptors: Innate and adaptive immune paradigms. Front. Immunol. 2014, 5, 145. [Google Scholar] [CrossRef]
- Zhang, X.; Feng, J.; Chen, S.; Yang, H.; Dong, Z. Synergized regulation of nk cell education by nkg2a and specific ly49 family members. Nat. Commun. 2019, 10, 5010. [Google Scholar] [CrossRef] [PubMed]
- Berry, R.; Rossjohn, J.; Brooks, A.G. The ly49 natural killer cell receptors: A versatile tool for viral self-discrimination. Immunol. Cell Biol. 2014, 92, 214–220. [Google Scholar] [CrossRef]
- Moussa, P.; Marton, J.; Vidal, S.M.; Fodil-Cornu, N. Genetic dissection of nk cell responses. Front. Immunol. 2012, 3, 425. [Google Scholar] [CrossRef]
- Yokoyama, W.M.; Plougastel, B.F. Immune functions encoded by the natural killer gene complex. Nat. Rev. Immunol. 2003, 3, 304–316. [Google Scholar] [CrossRef]
Figure 1.
Changes in total NK cell proportions among the lymphocytes after mid- and high-grade sepsis. The light-gray area in the upper left quarter indicates the total NK cells (CD3-/NK-1.1+ lymphocytes). All numbers displayed in the four quarters represent the percentages of cell counts. Abbreviations: BM, bone marrow; HGS, high-grade sepsis; LN, lymph node; MGS, mid-grade sepsis; NK, natural killer.
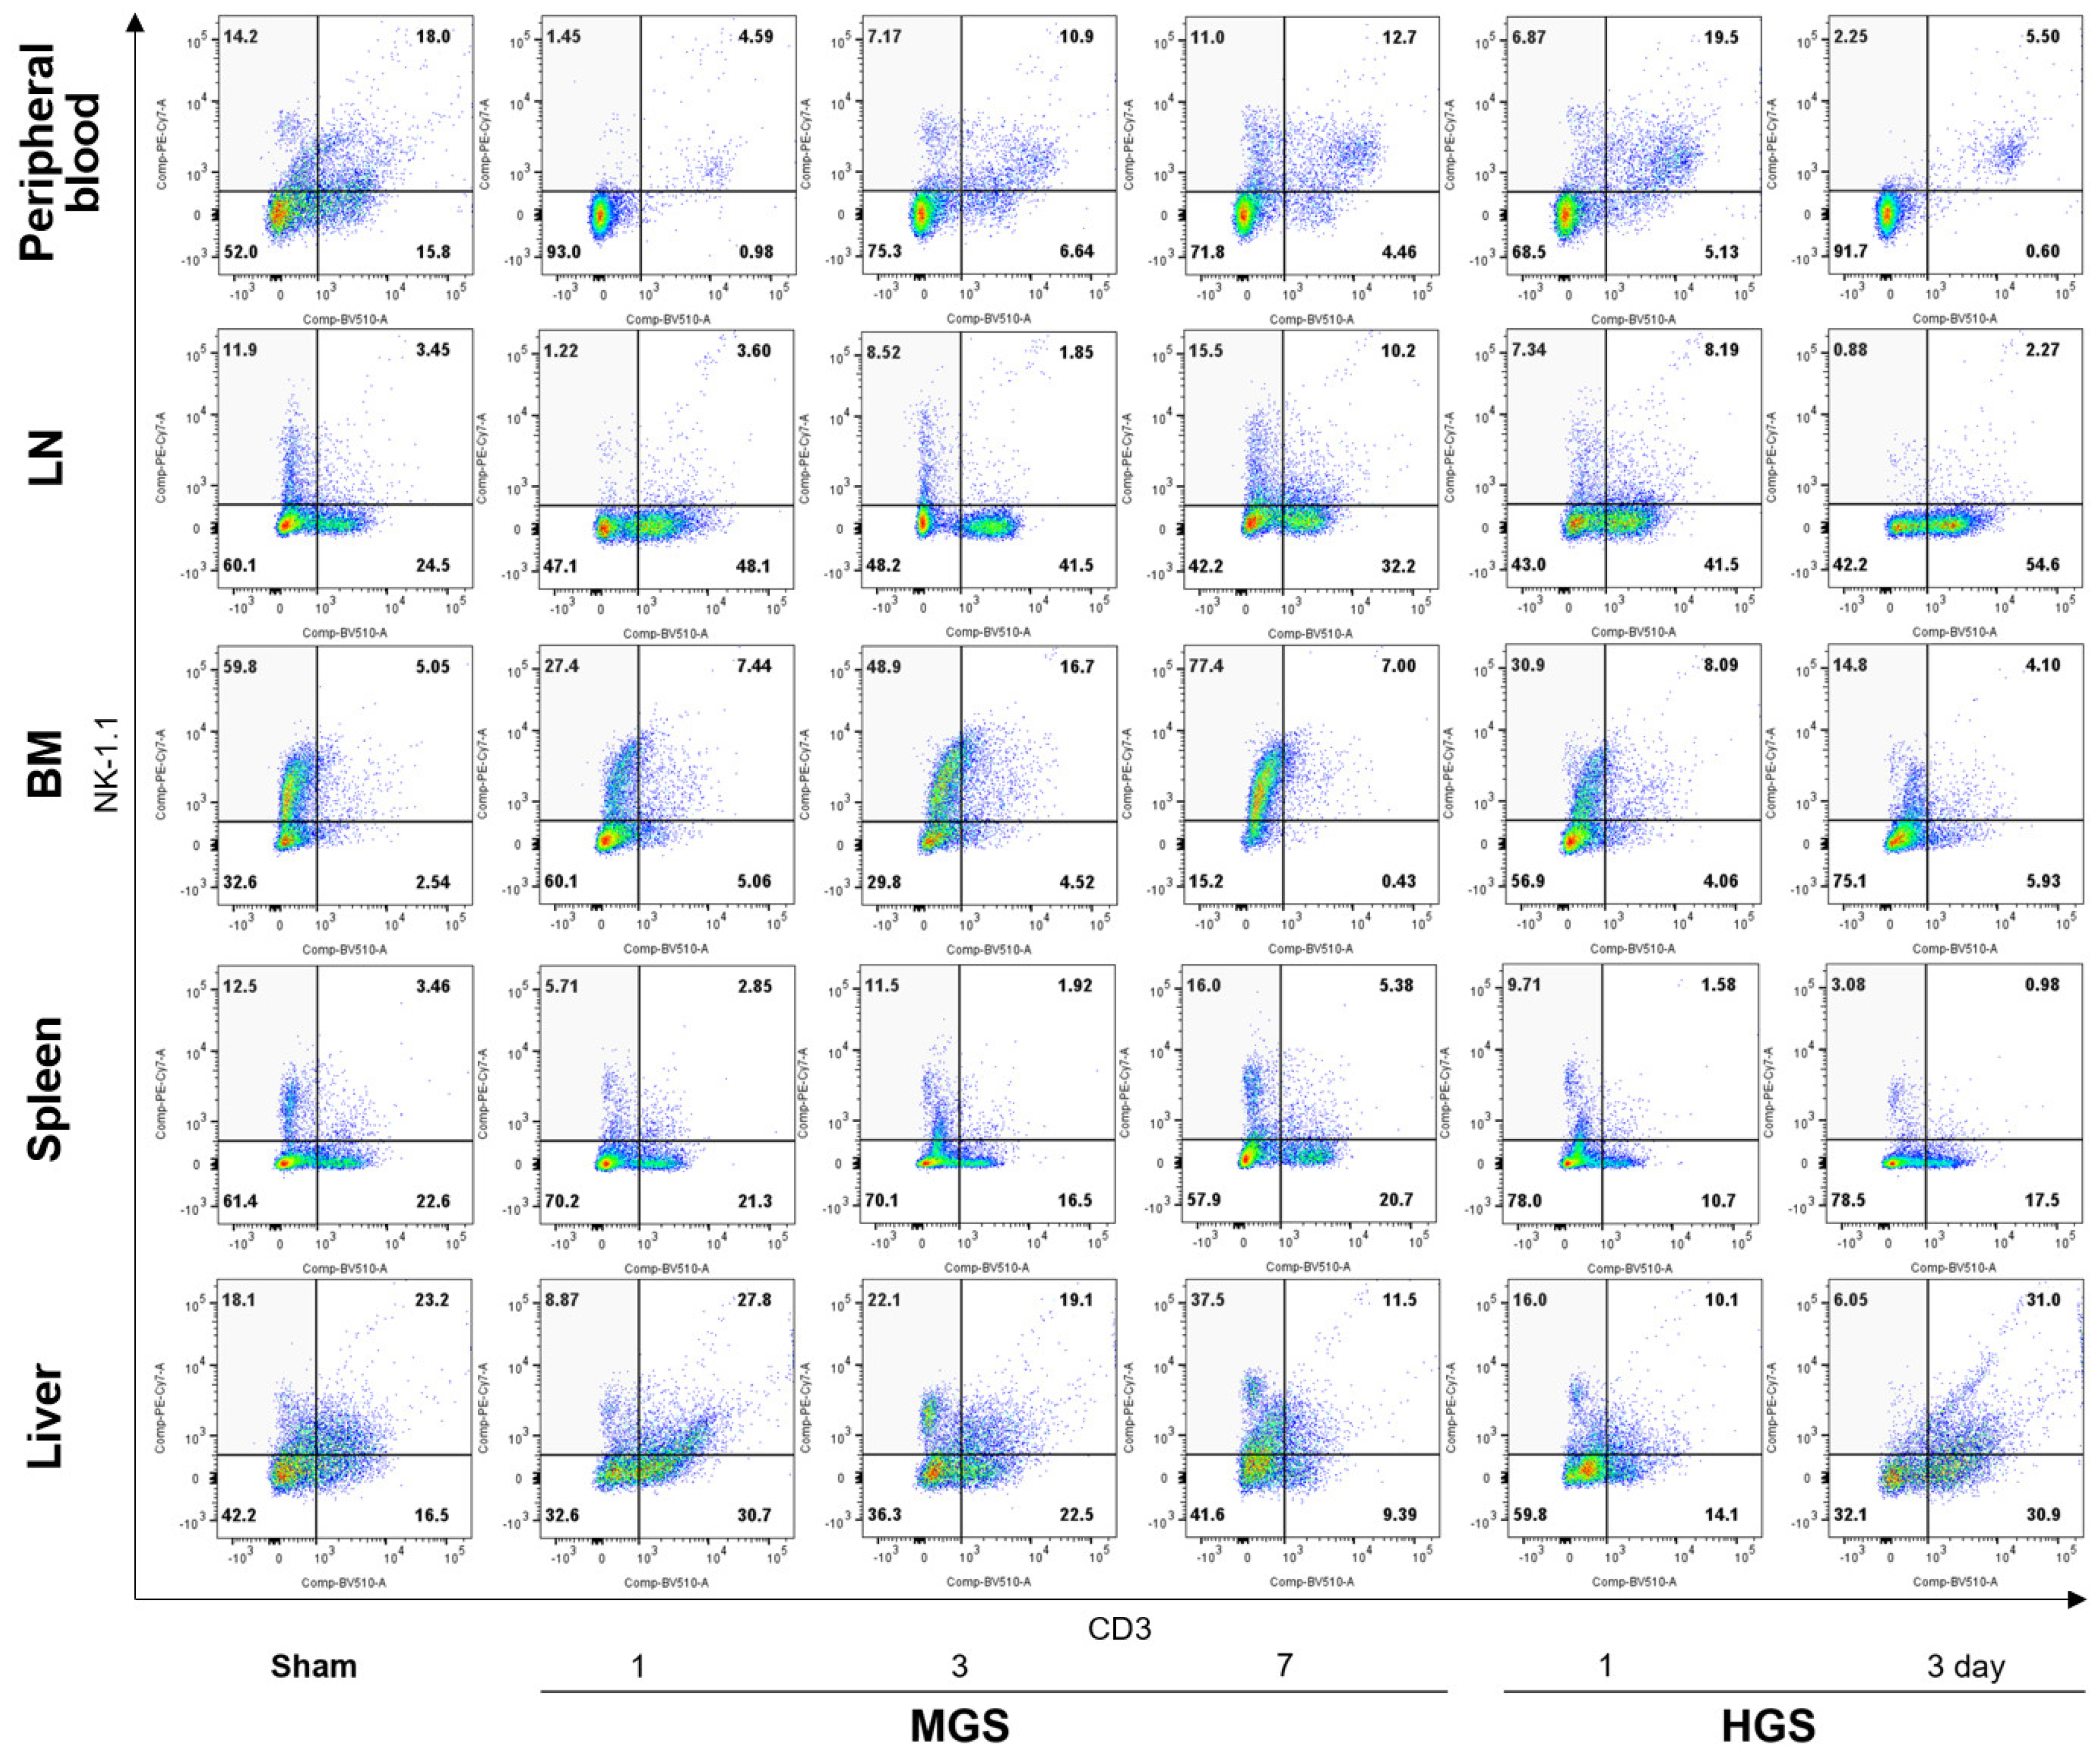
Figure 2.
Comparison of dynamic alterations of CD11b- or CD27-positive NK cell subpopulations between mid- and high-grade sepsis. The green boxes indicate that the CD11bhigh/CD27low and CD11blow/CD27high subpopulations increased on day 1 of MGS and HGS compared with the sham group. The blue and red arrows represent significantly increased and decreased subpopulations, respectively, compared with the first day after sepsis within each MGS or HGS group. Abbreviations: BM, bone marrow; HGS, high-grade sepsis; LN, lymph node; MGS, mid-grade sepsis.
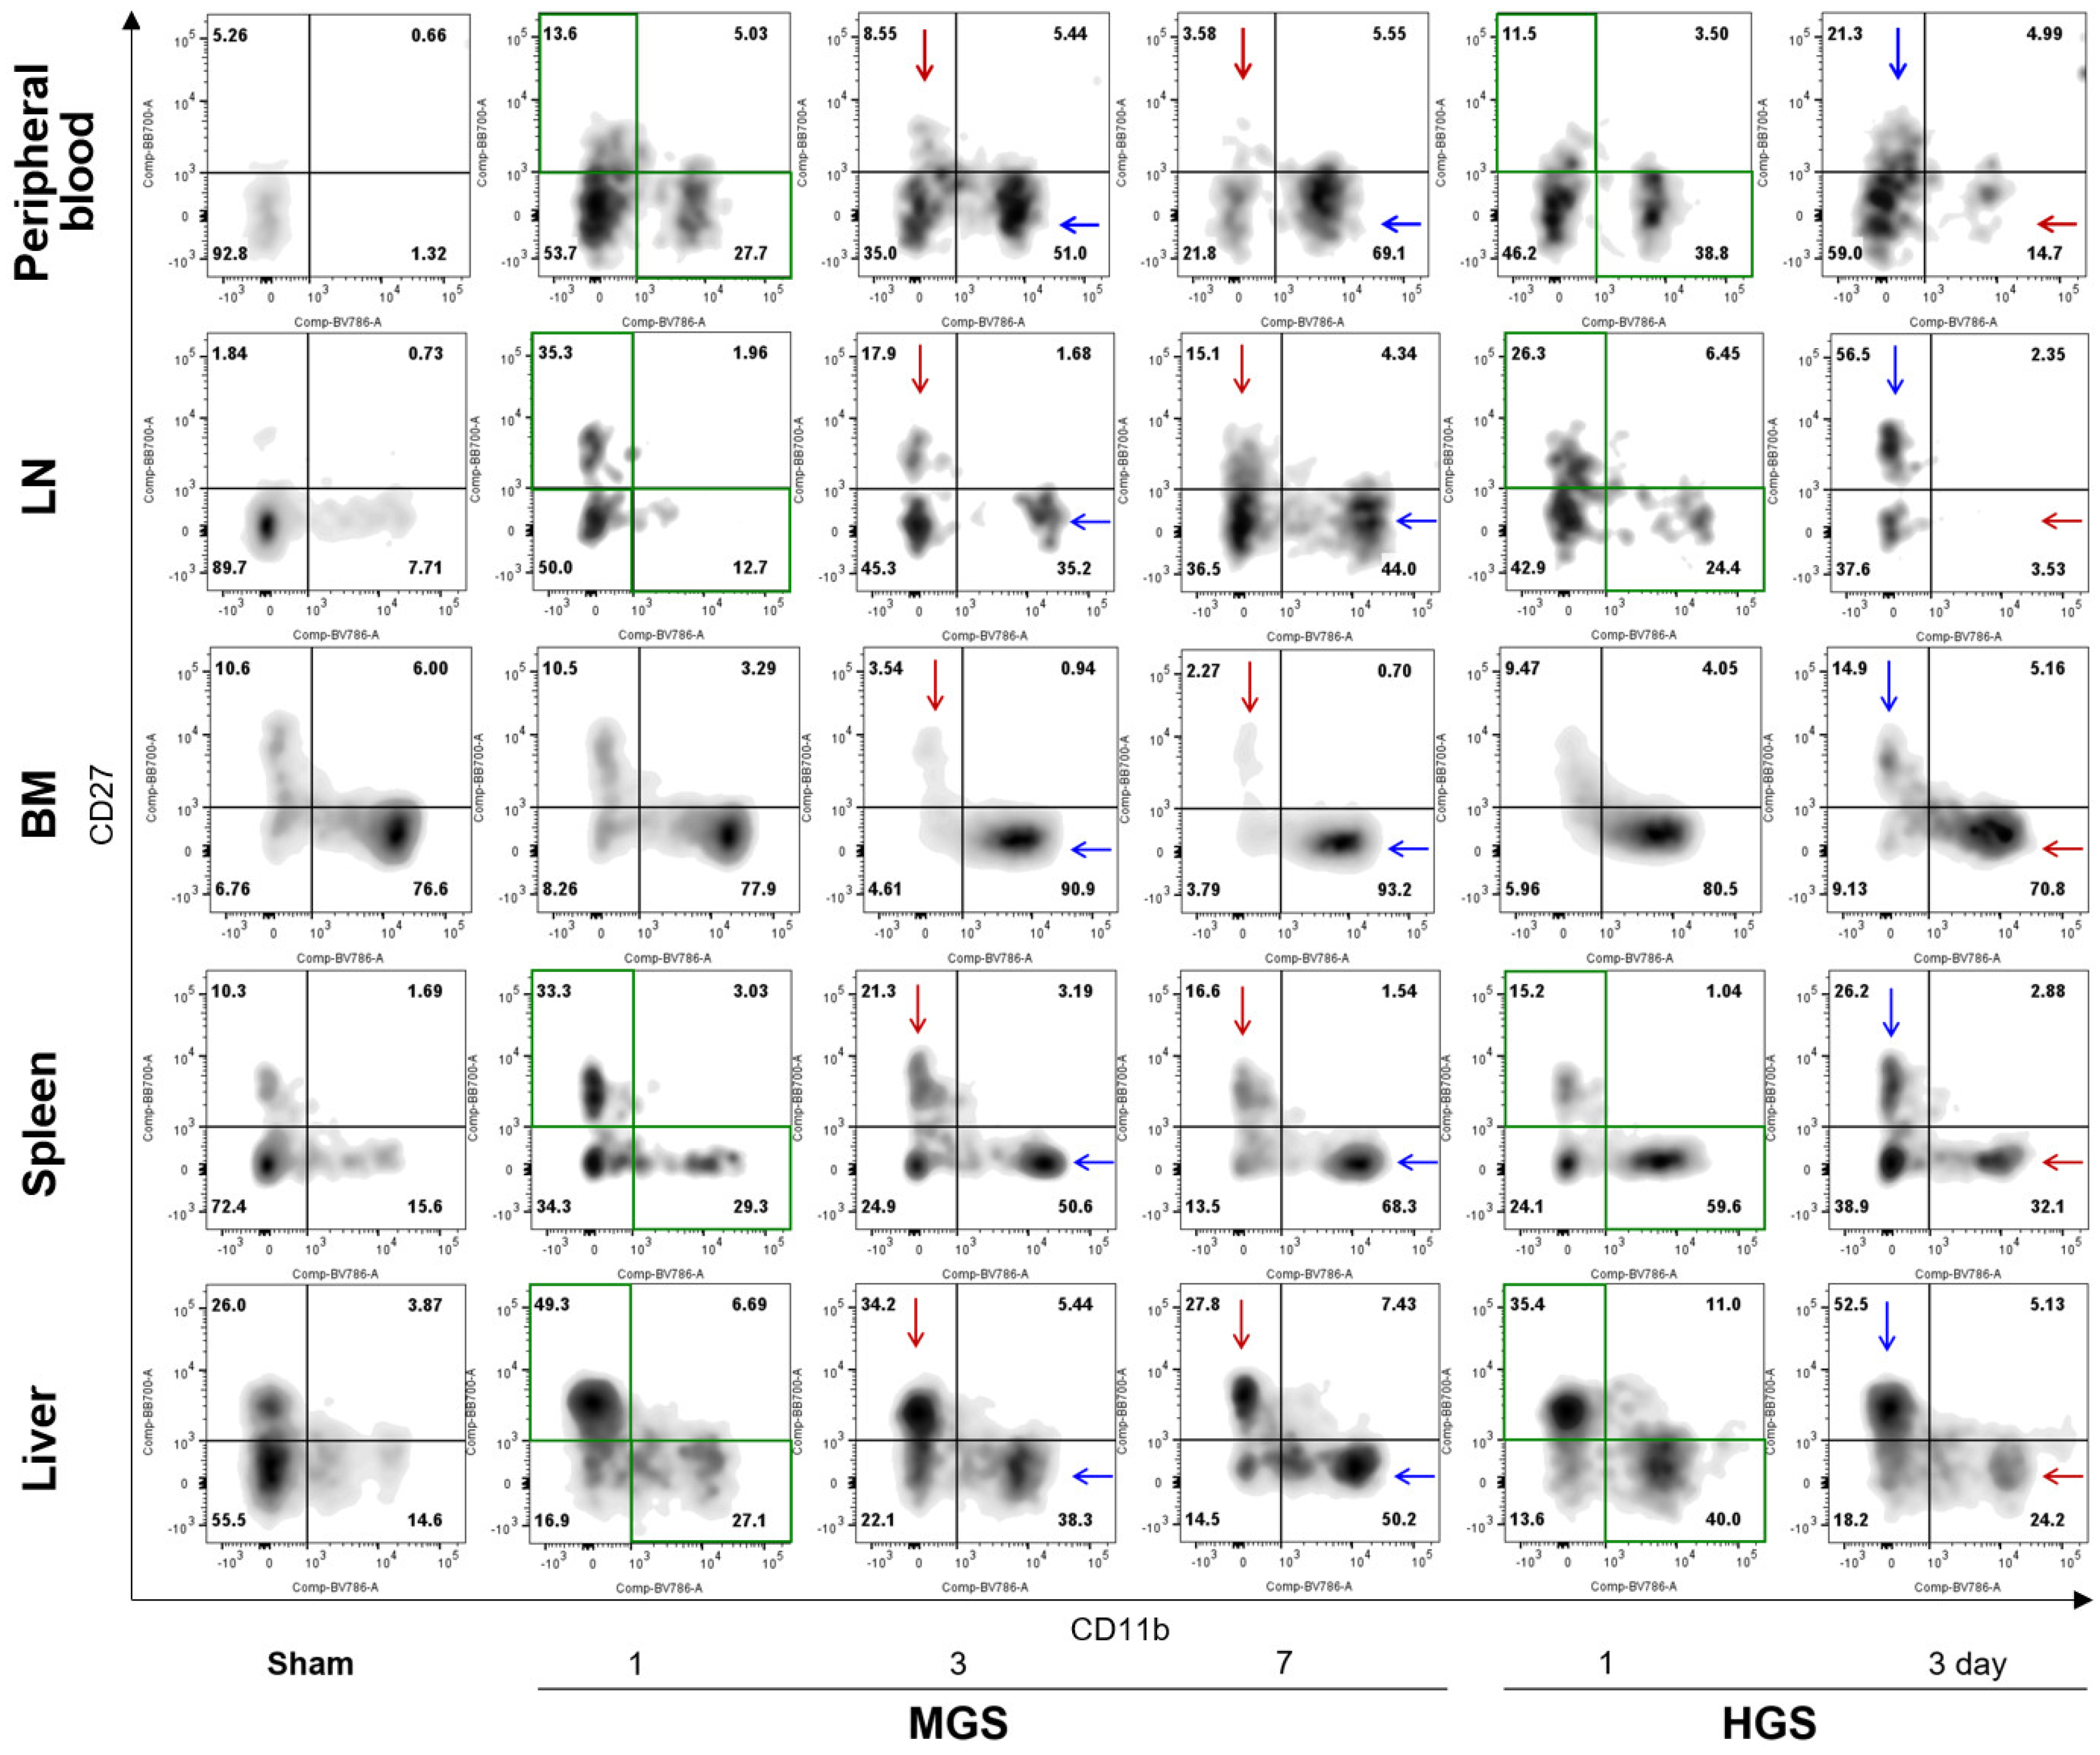
Figure 3.
Difference in mRNA expression of inhibitory and activating NK receptors in mid- and high-grade sepsis. *P<0.05, **P<0.001. BM, bone marrow; HGS, high-grade sepsis; LN, lymph node; MGS, mid-grade sepsis; NKR, NK receptor.
Figure 3.
Difference in mRNA expression of inhibitory and activating NK receptors in mid- and high-grade sepsis. *P<0.05, **P<0.001. BM, bone marrow; HGS, high-grade sepsis; LN, lymph node; MGS, mid-grade sepsis; NKR, NK receptor.
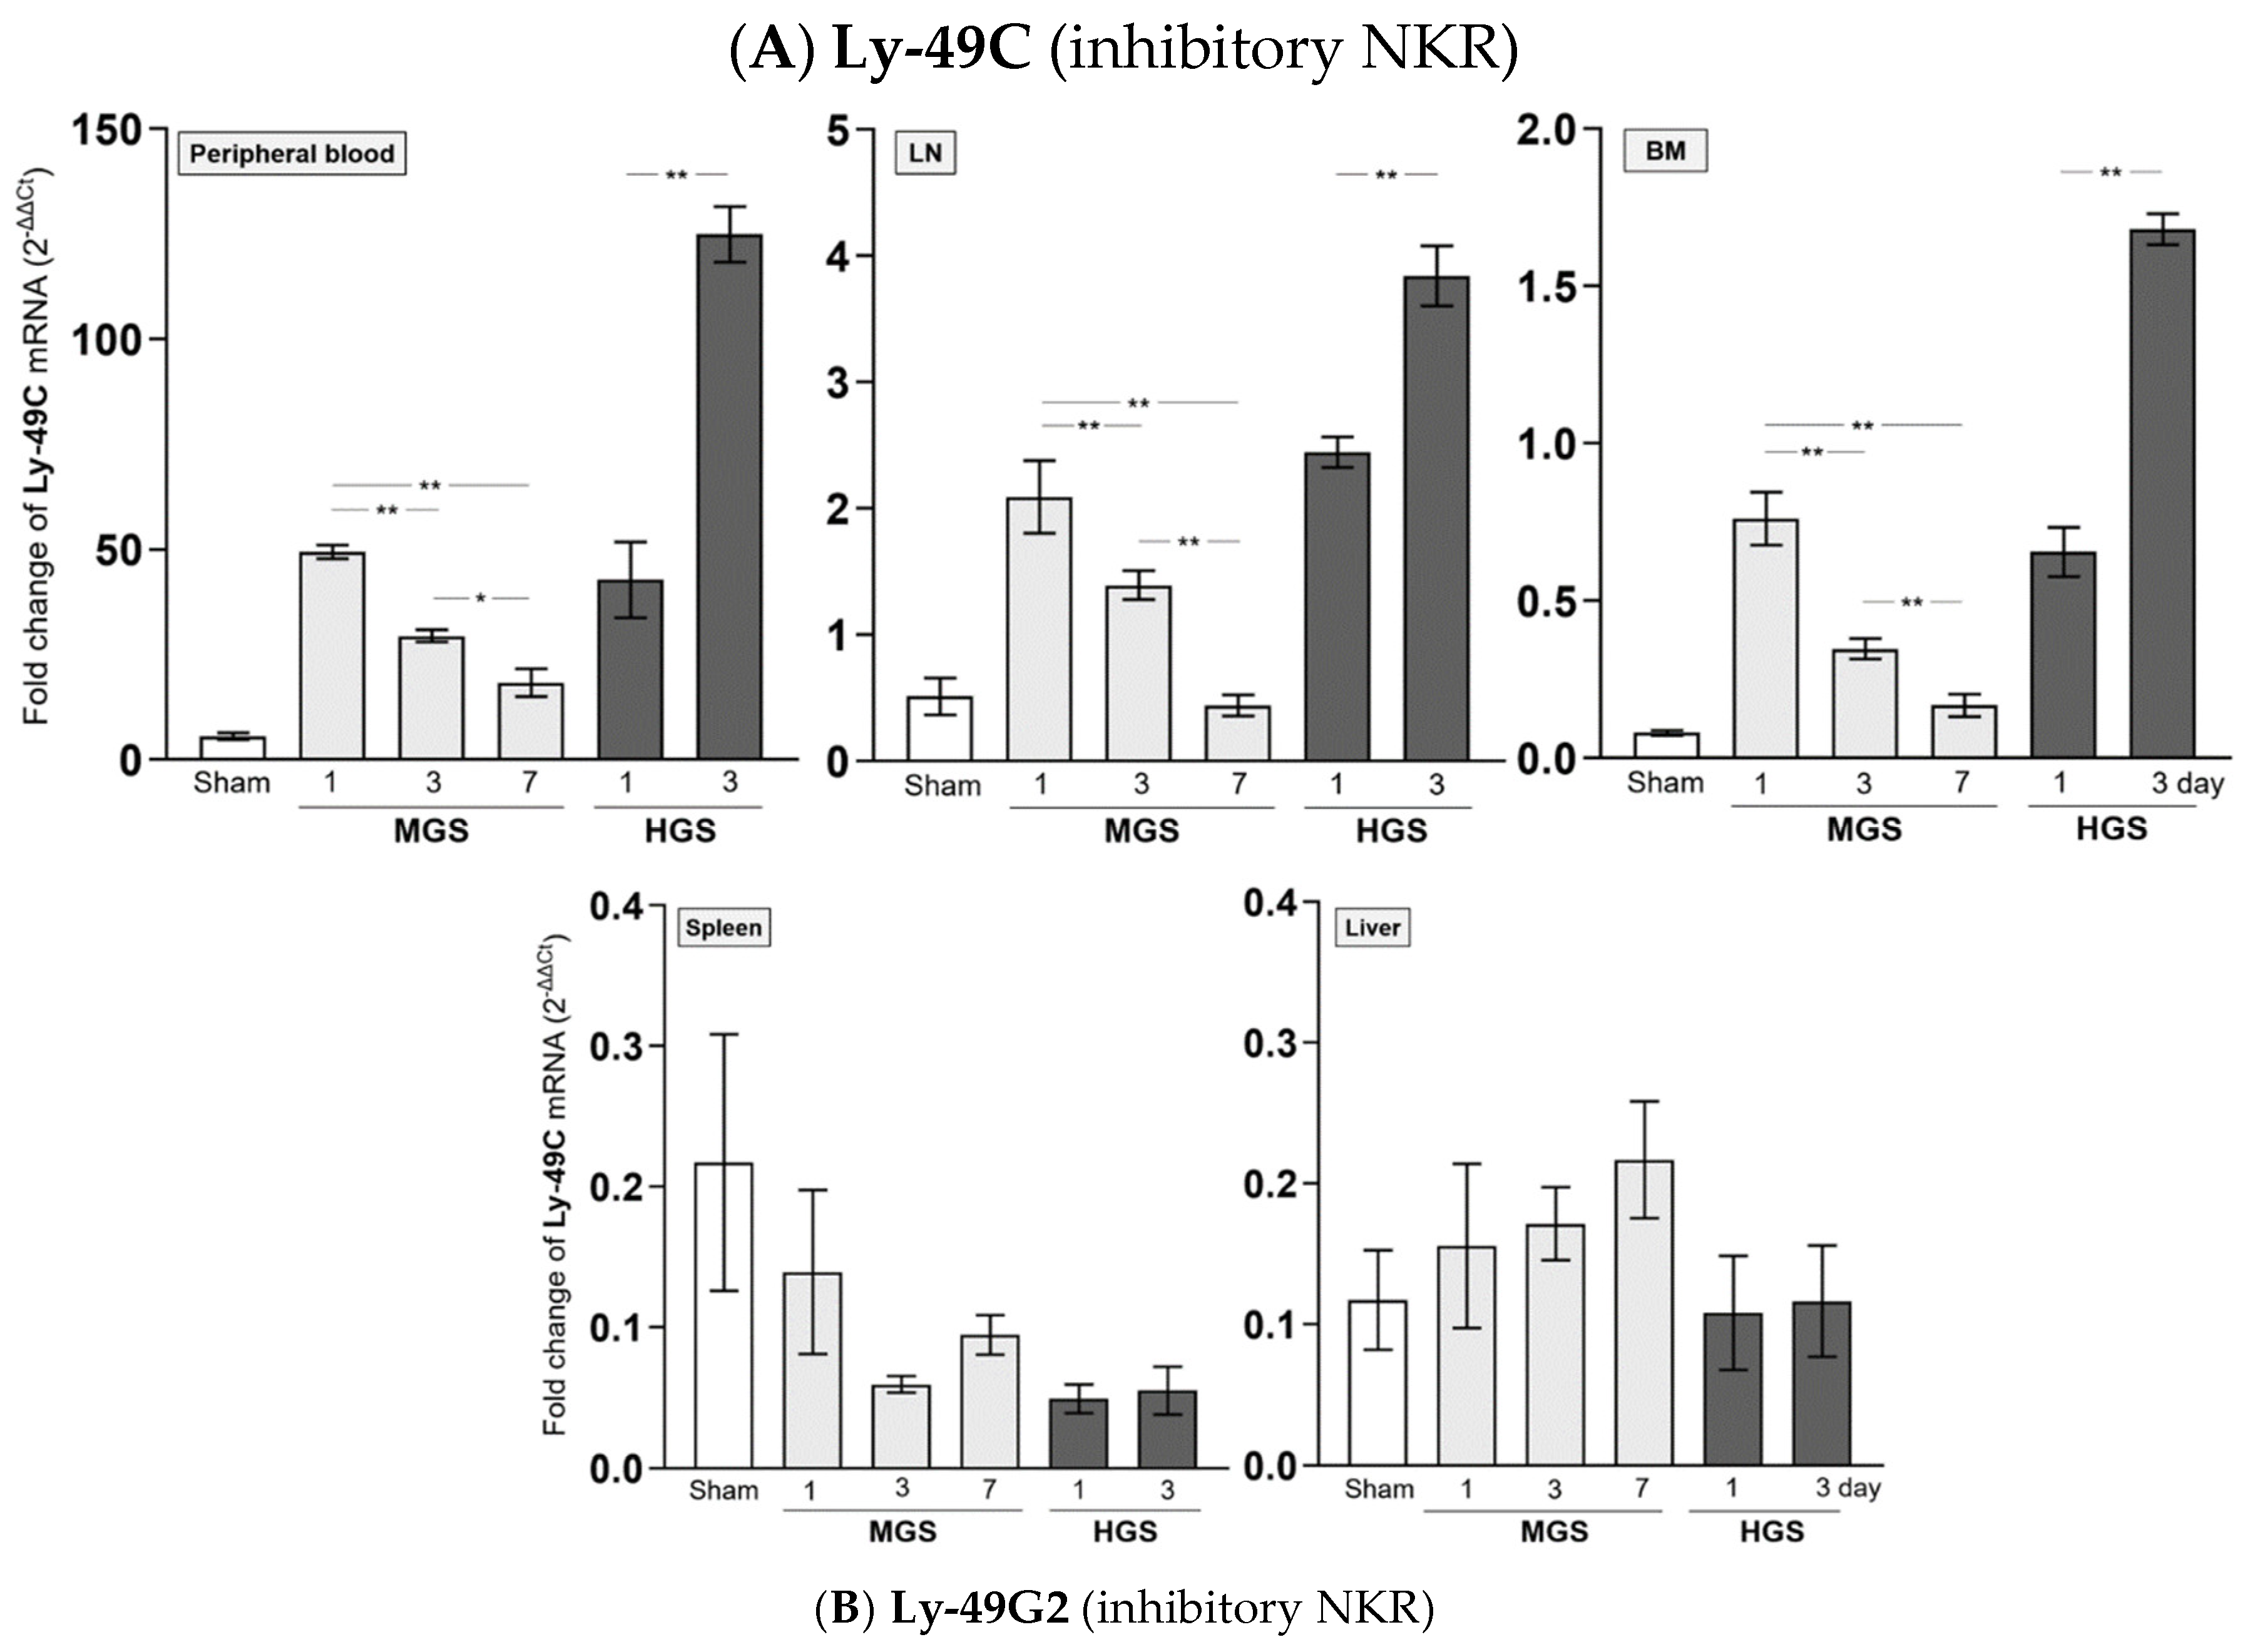
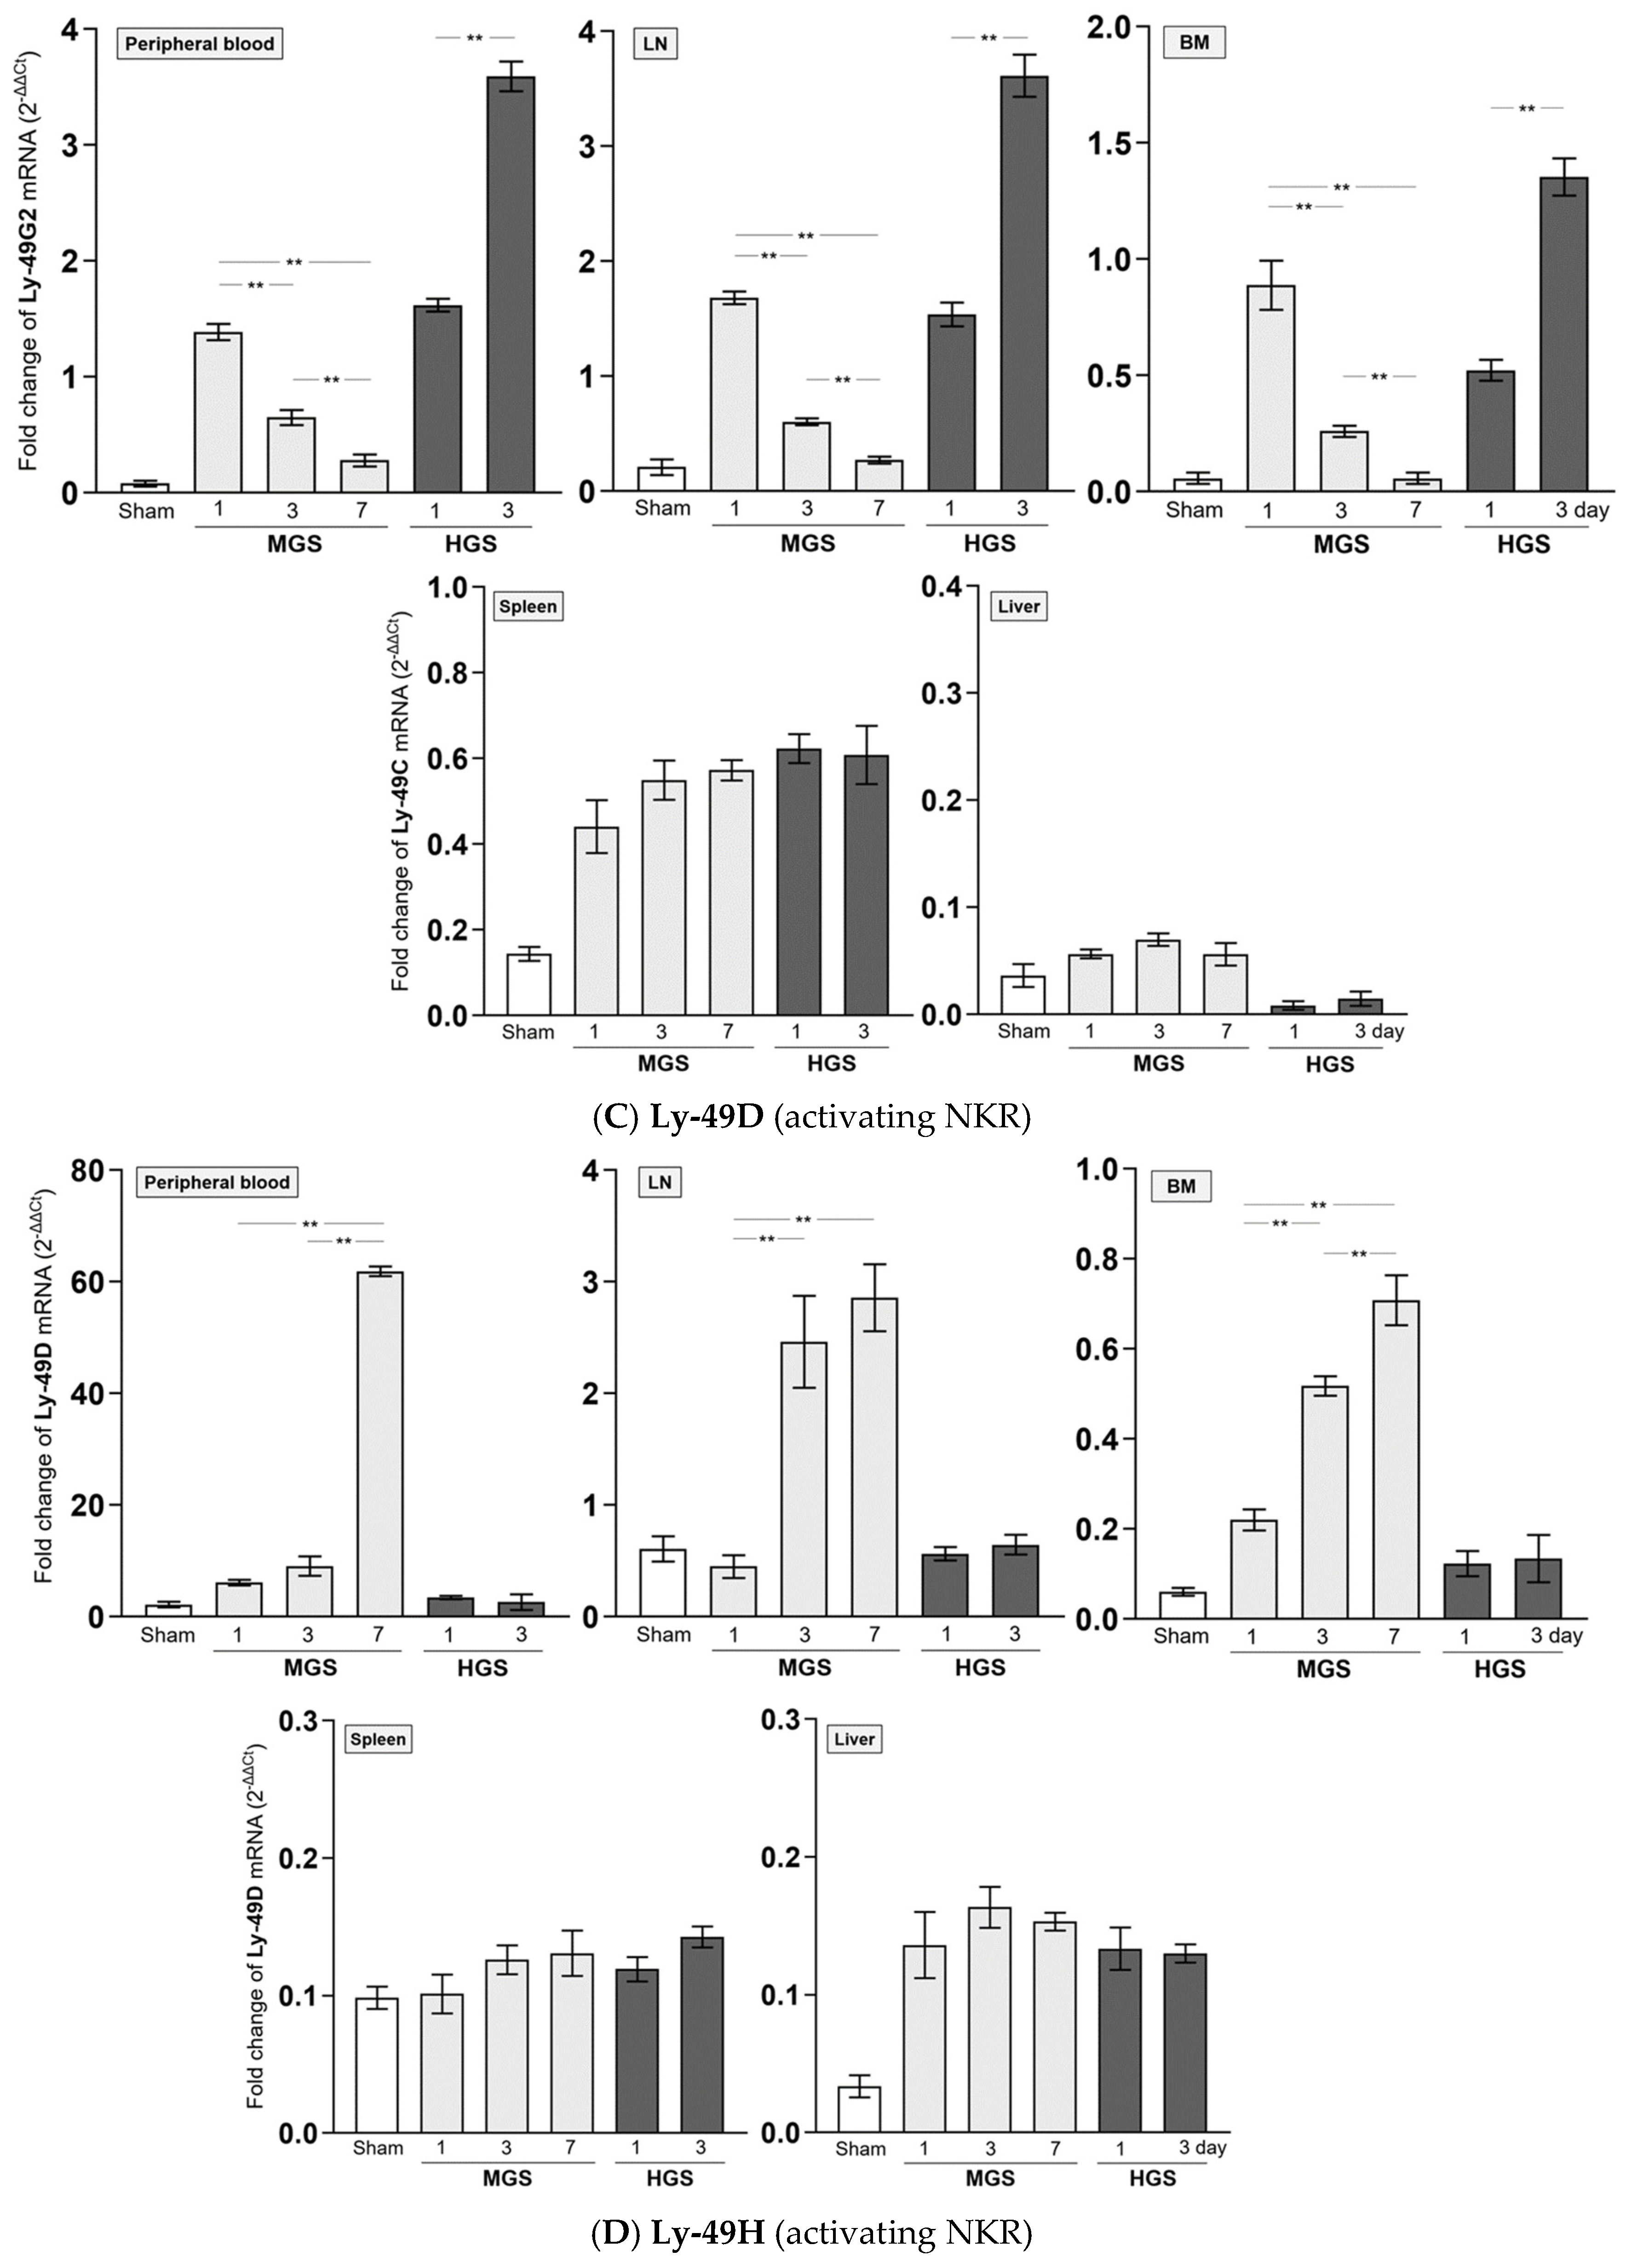
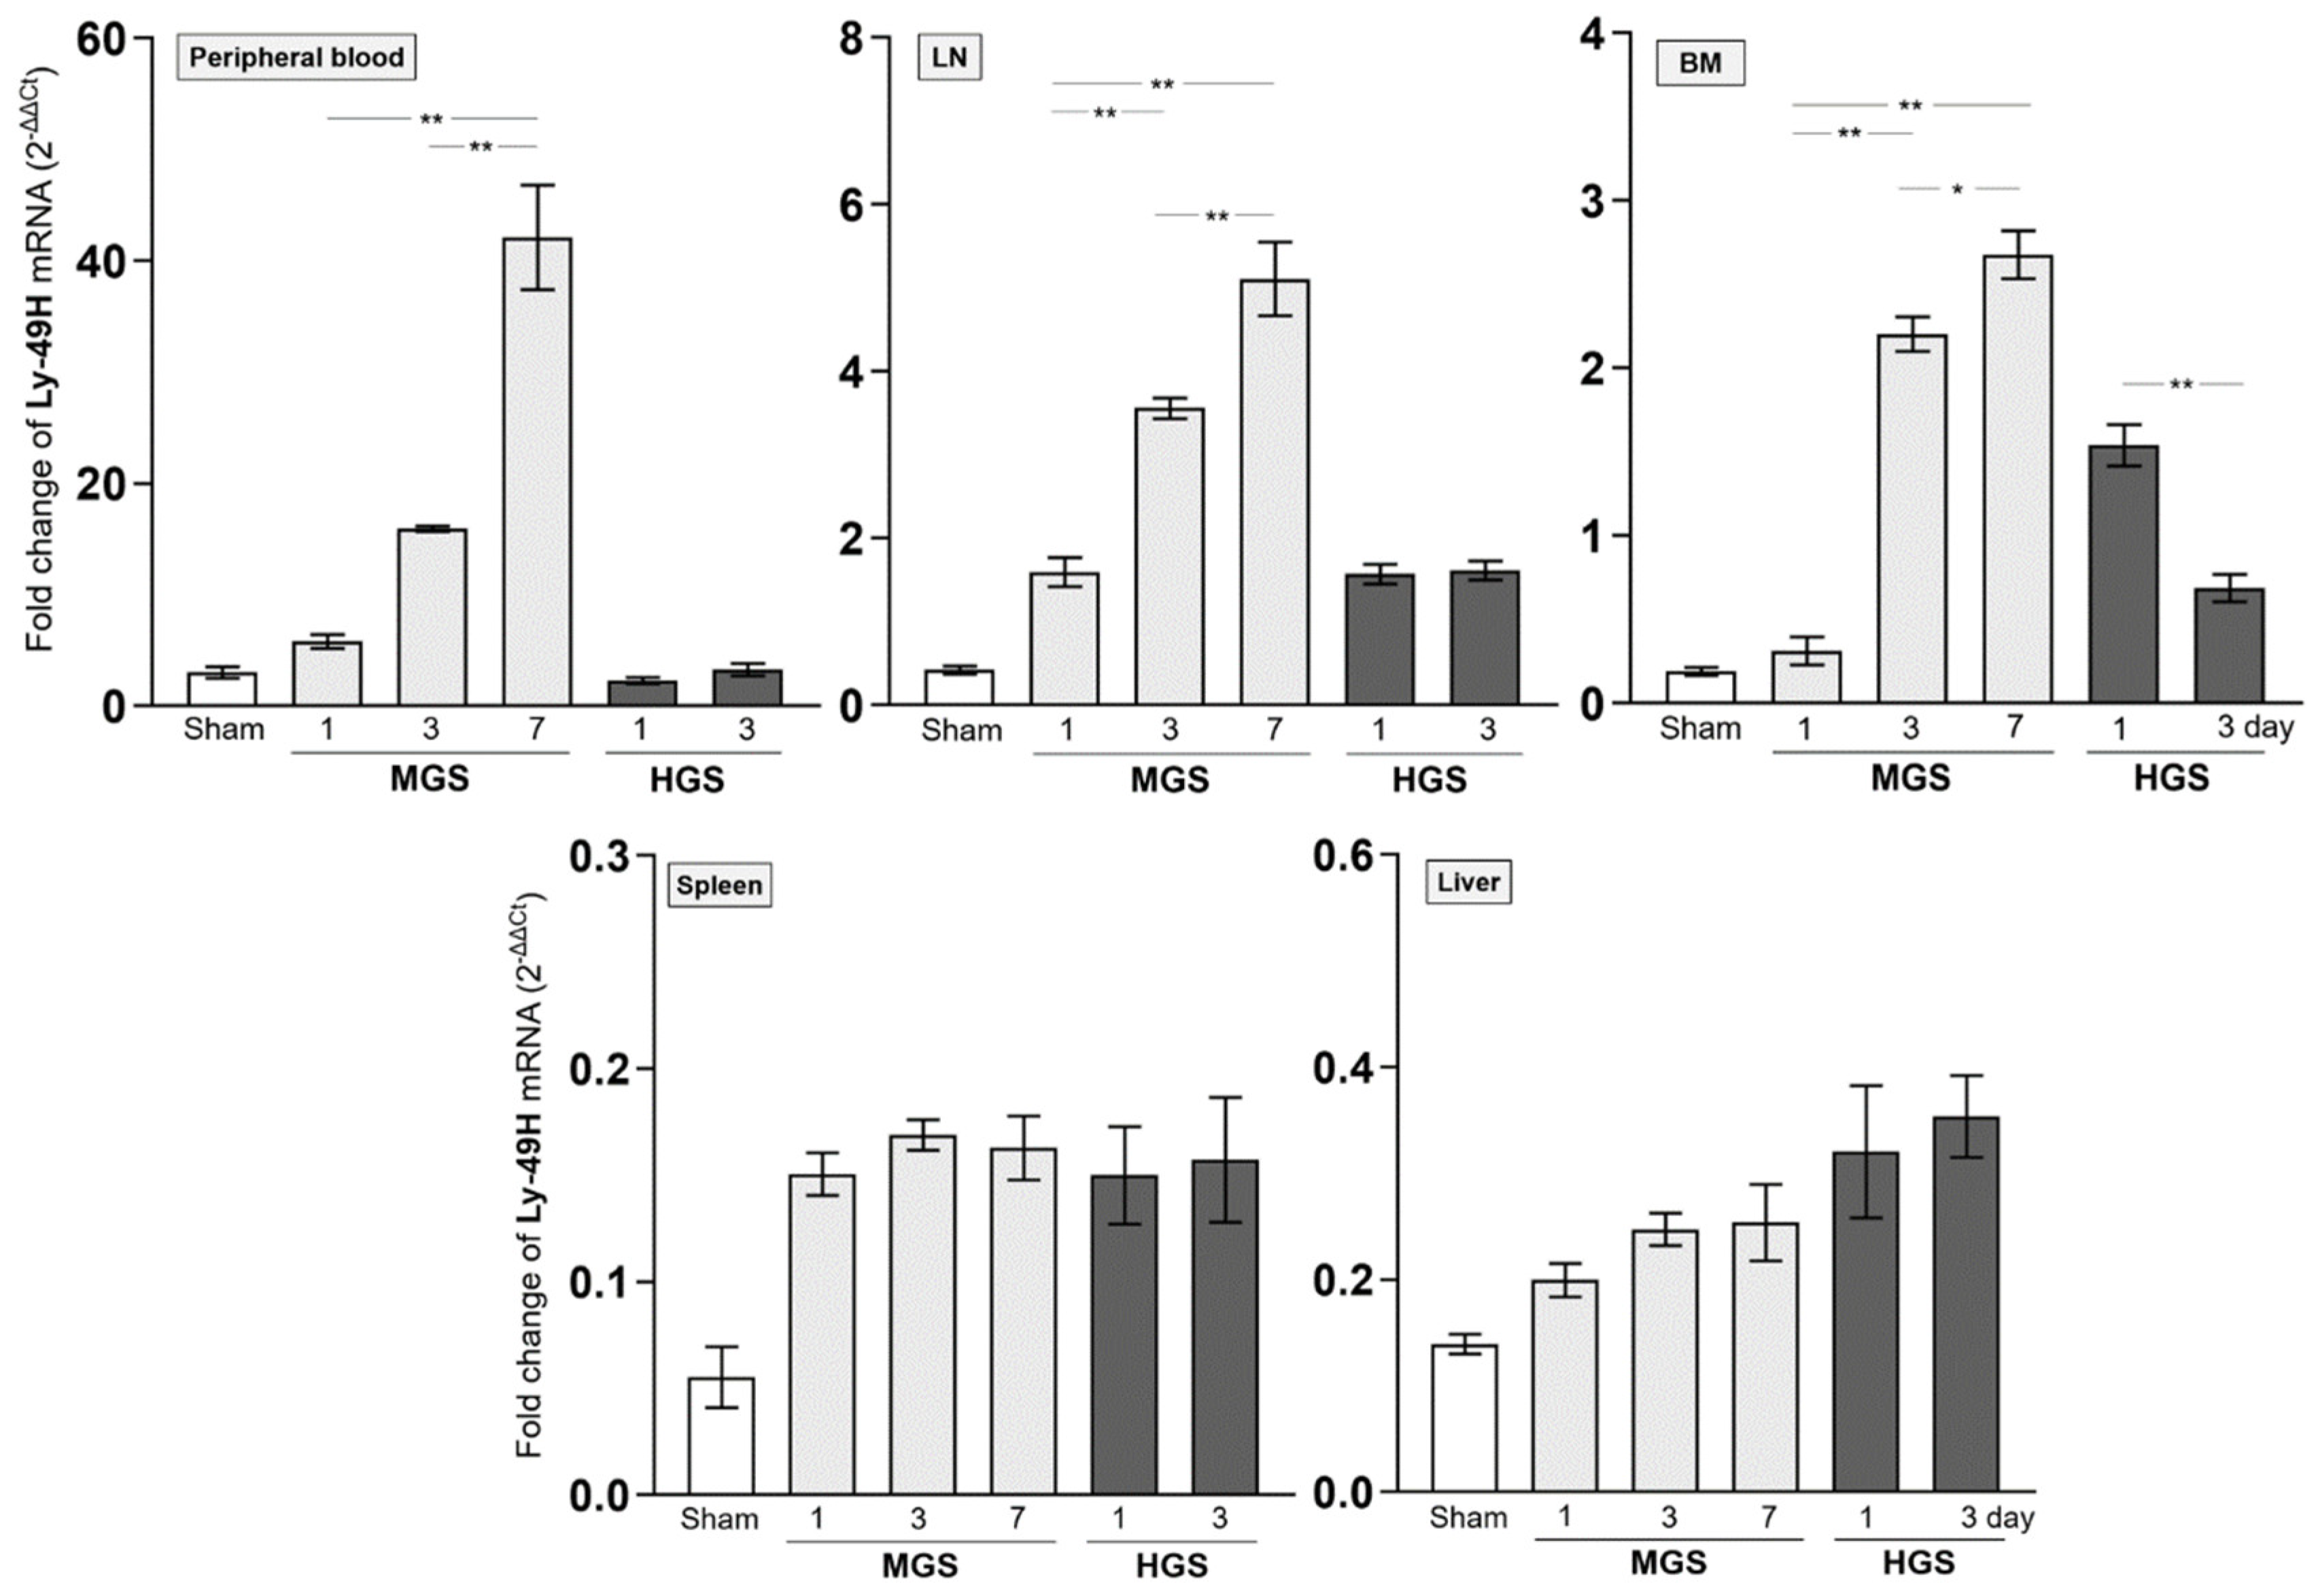
Figure 4.
Alteration of various NK receptor-expressing NK cell counts in the peripheral blood. HGS, high-grade sepsis; Ly, lymphocyte antigen; MGS, mid-grade sepsis.
Figure 4.
Alteration of various NK receptor-expressing NK cell counts in the peripheral blood. HGS, high-grade sepsis; Ly, lymphocyte antigen; MGS, mid-grade sepsis.
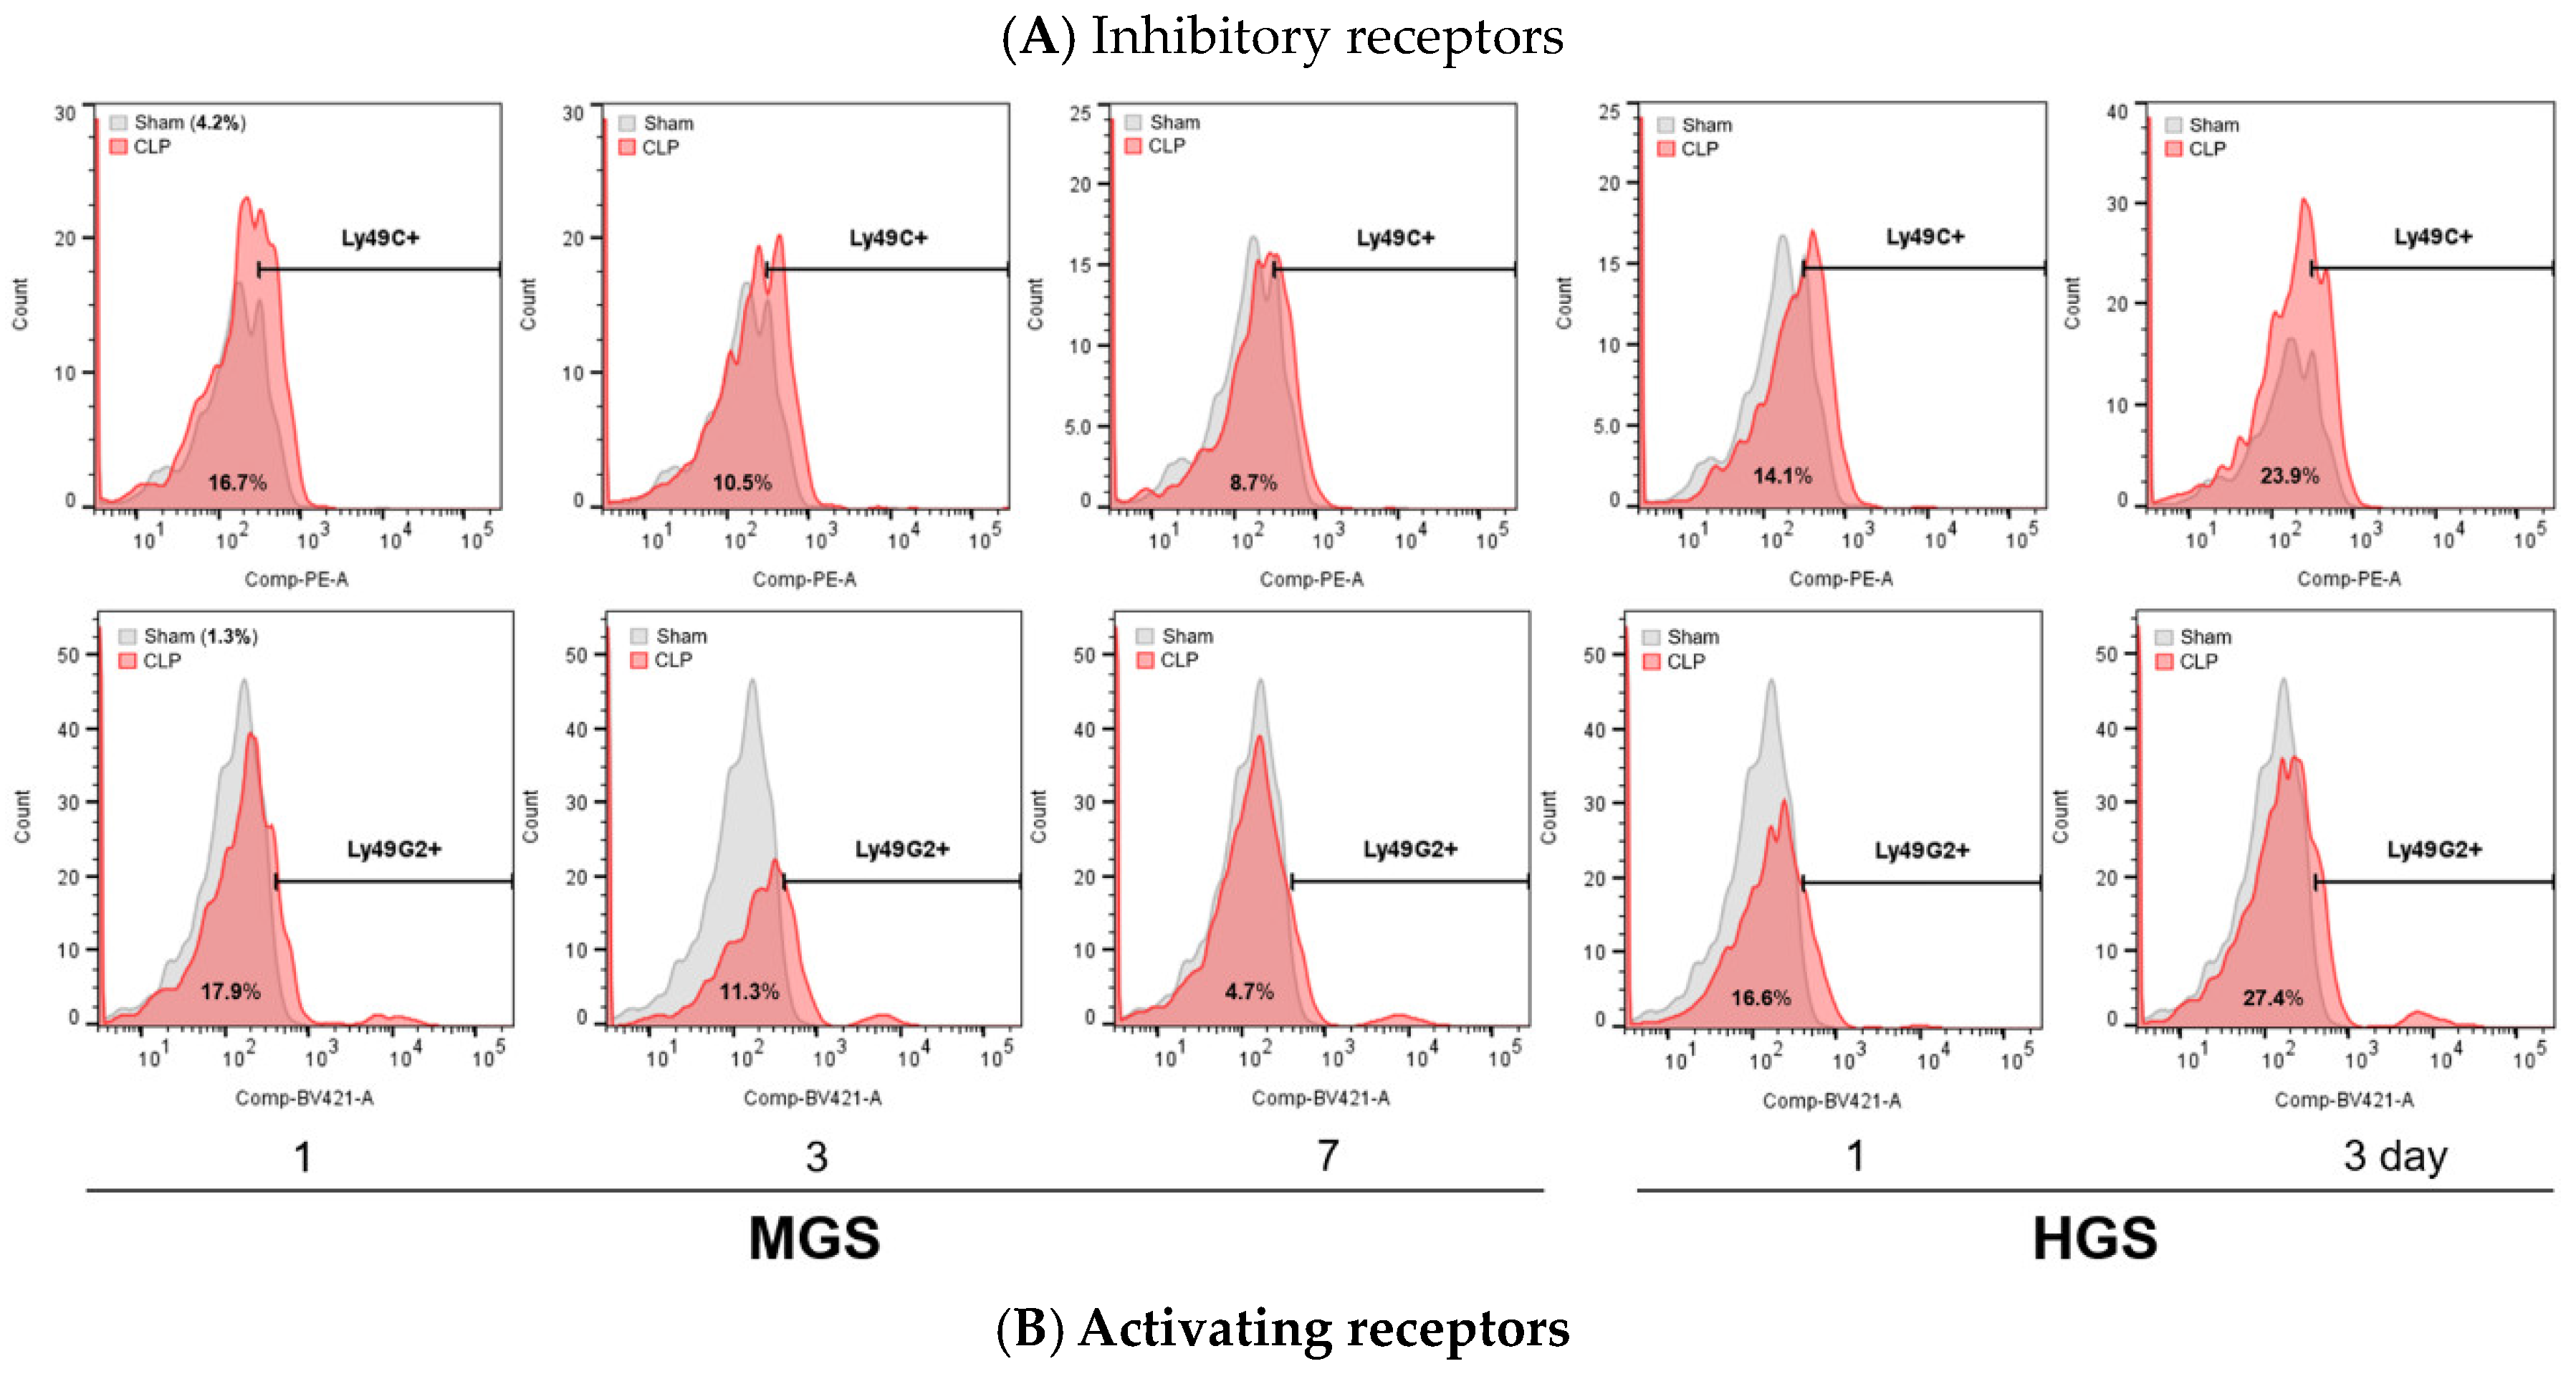
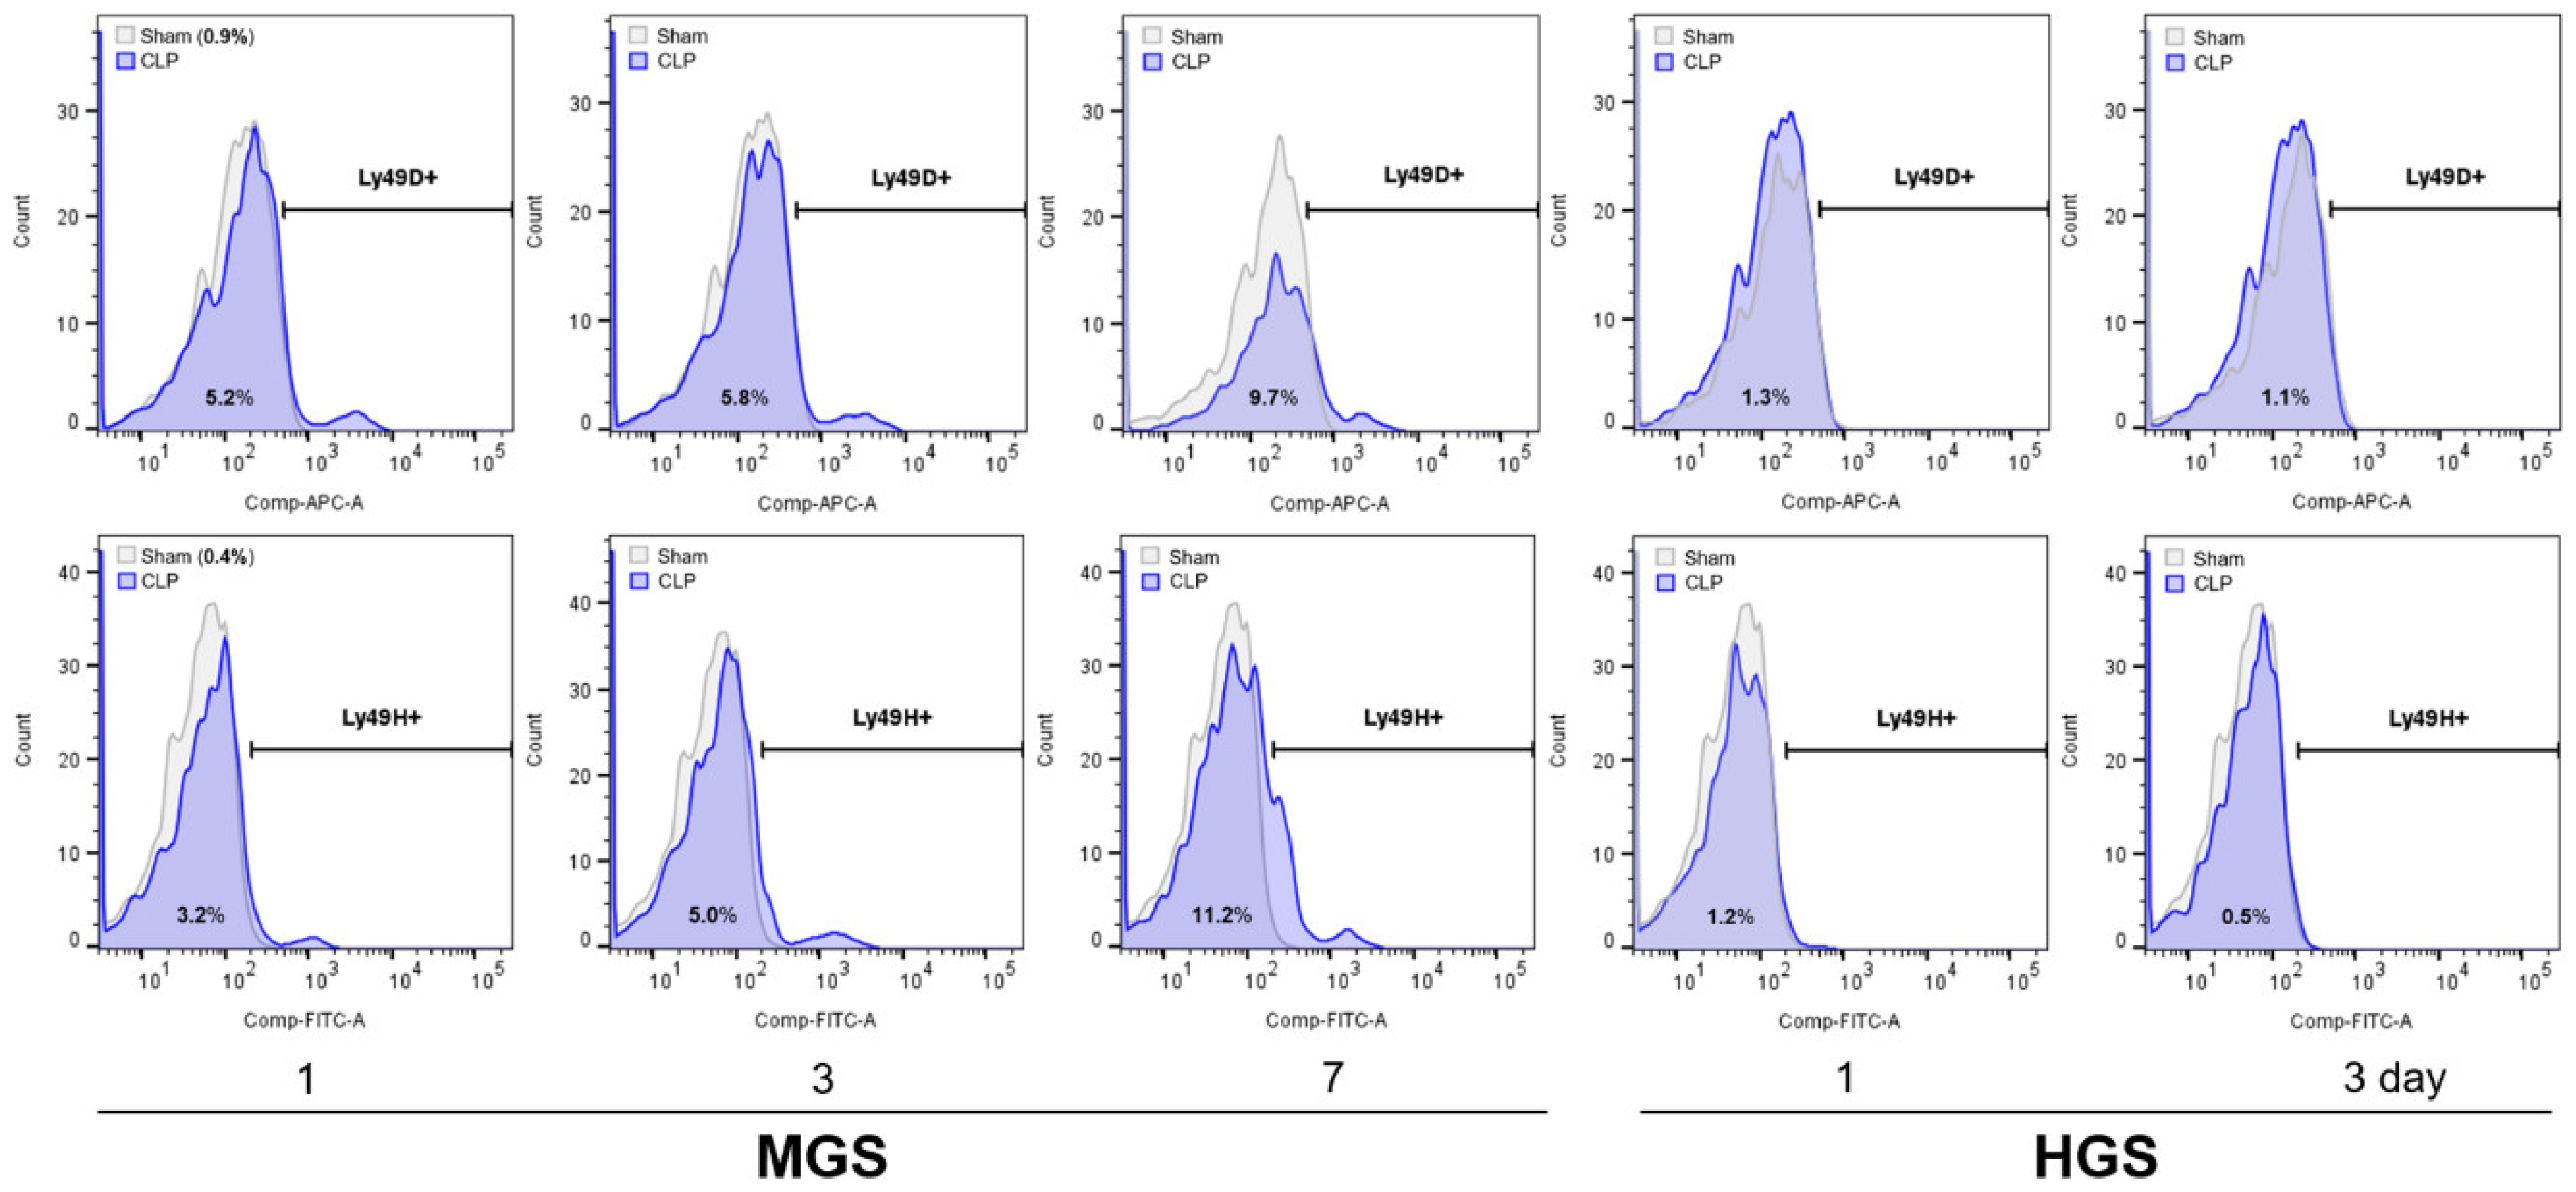
Figure 5.
Change in granzyme B concentration in the peripheral blood and mRNA expression encoding granzyme B in various organs. In the sham group, 27 samples were measured twice, and all were below the measurement limit. Each column in the MGS and HGS groups was calculated from the values measured in duplicate for the nine samples. mRNA expression levels obtained from real-time RT-PCR were normalized to the relative ratio based on the values in sham mice. The heights in the bars (A, C) and dots (B) represent the mean values, and all error bars represent the standard error of the mean. **P <0.001. Abbreviations: BM, bone marrow; Ct, cycle threshold value; HGS, high-grade sepsis; IFN-γ, interferon-gamma; LN, lymph node; MGS, mid-grade sepsis; PB, peripheral blood.
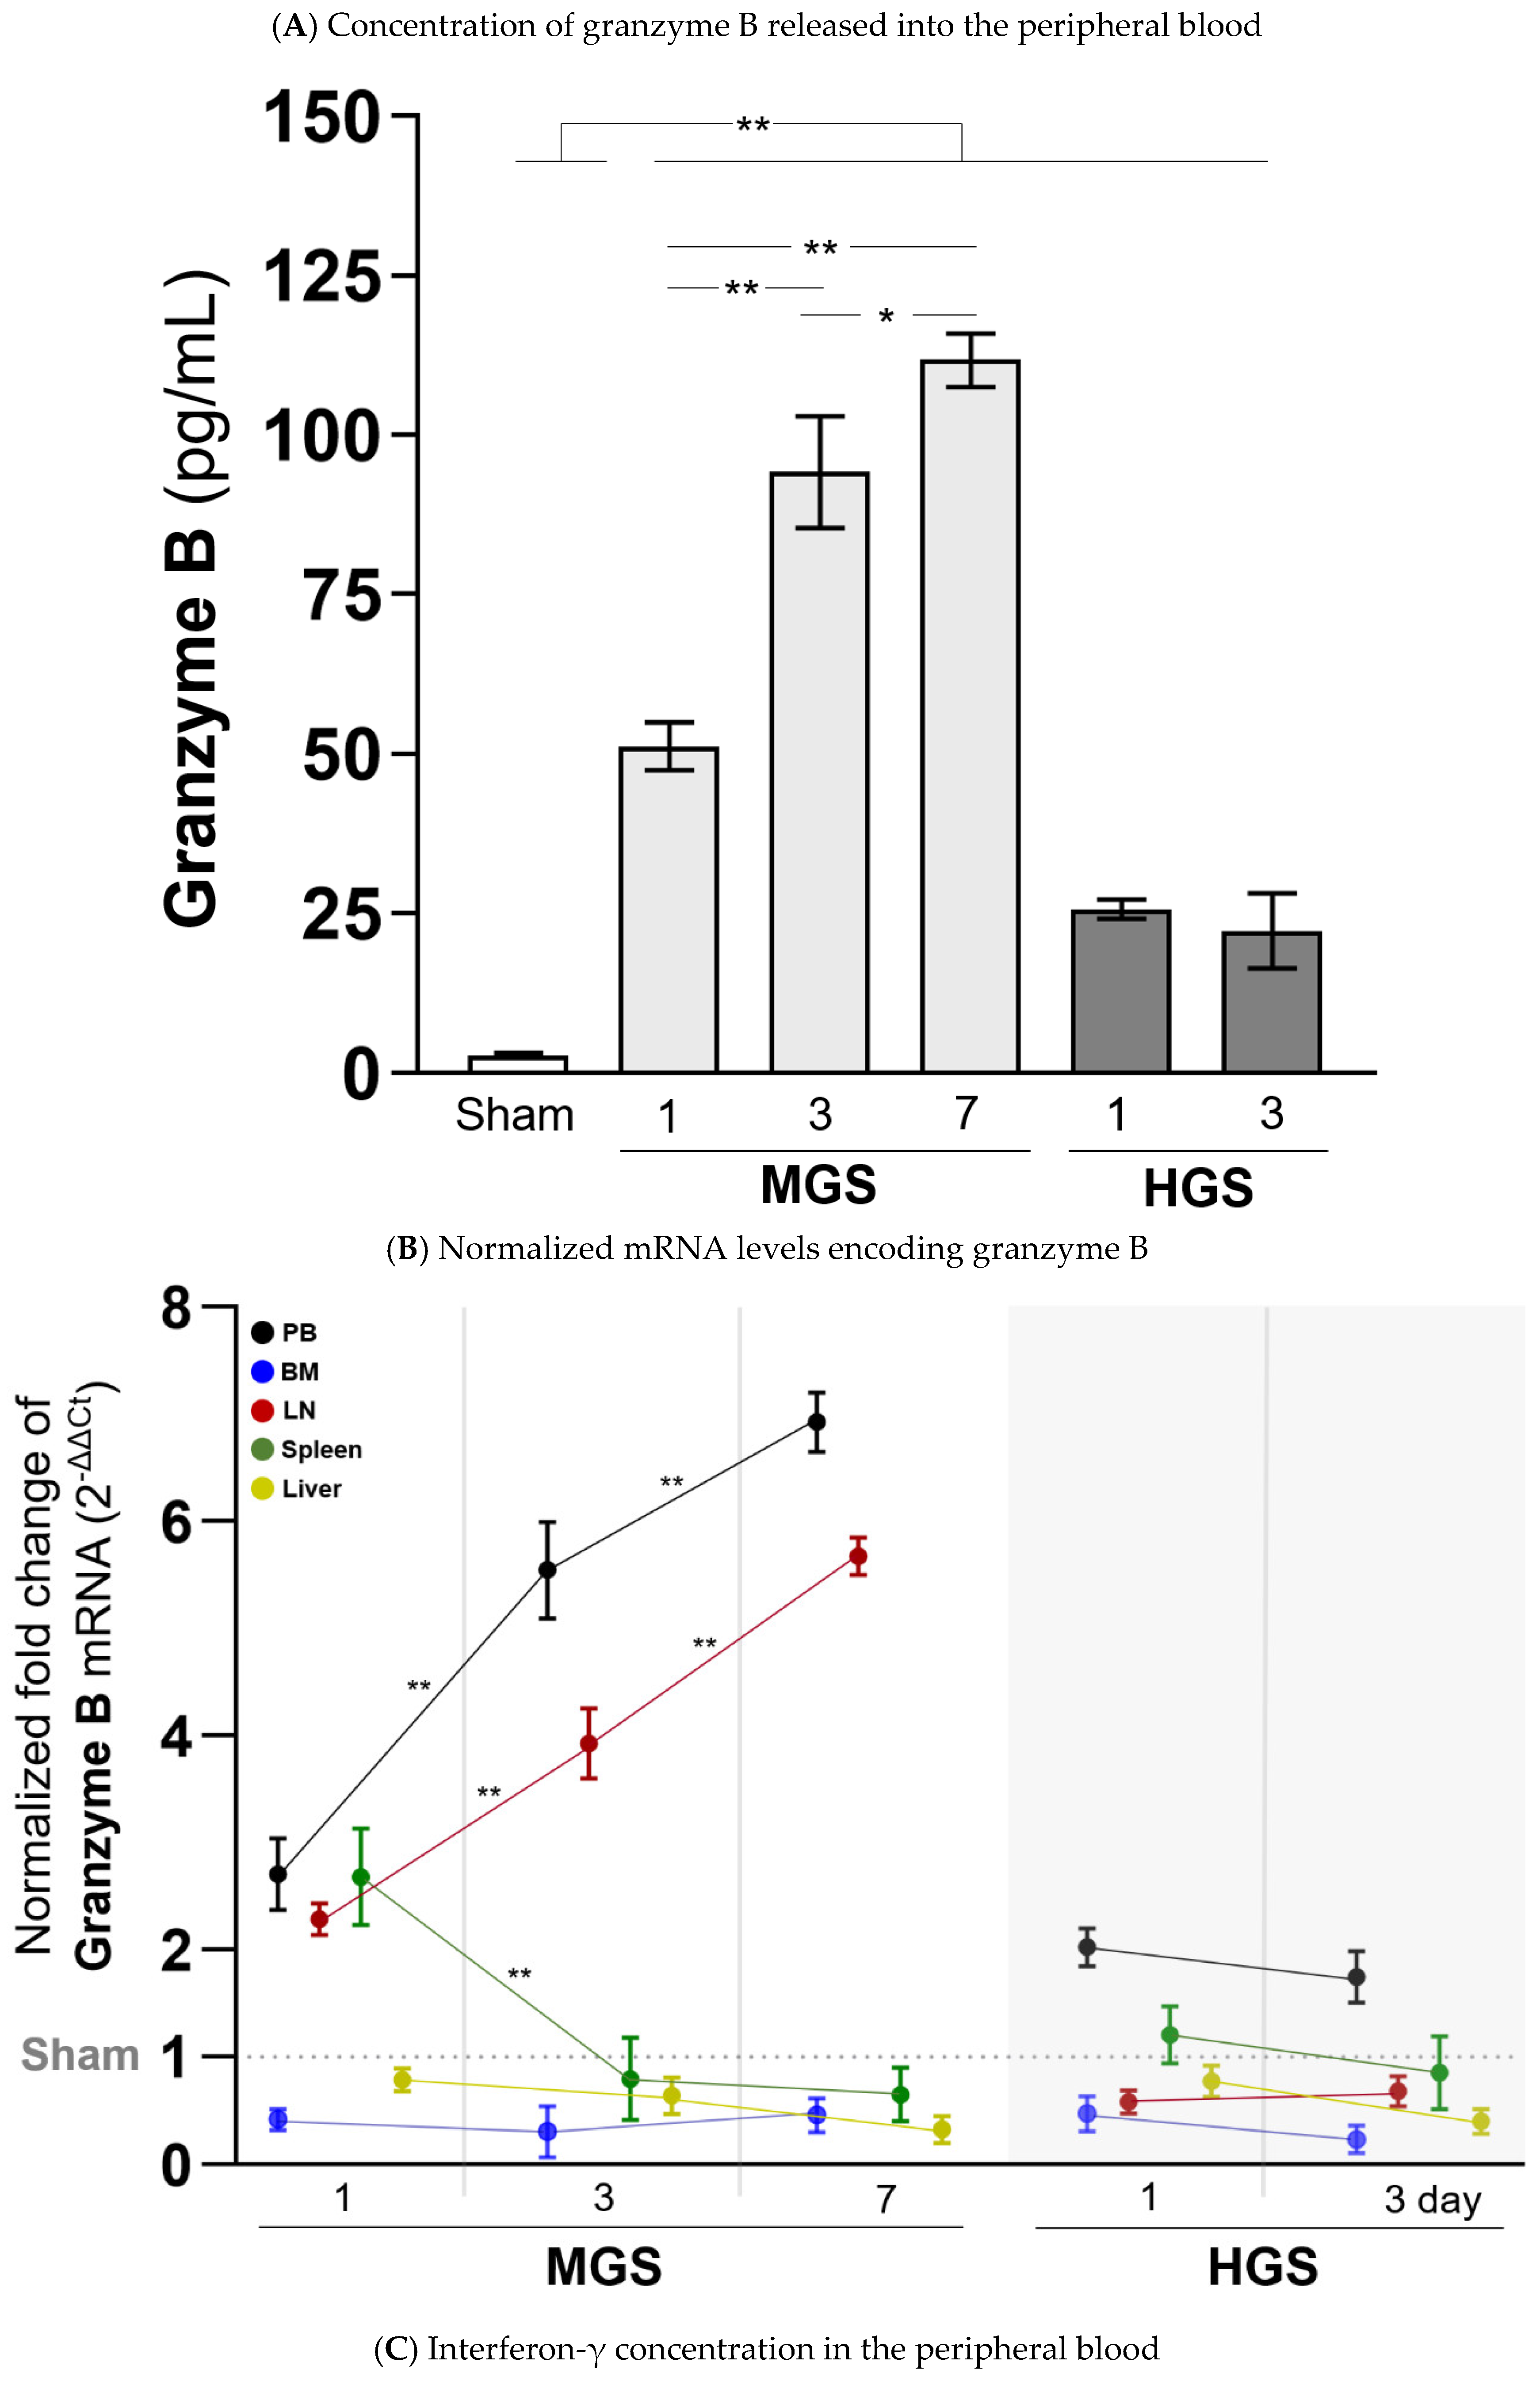
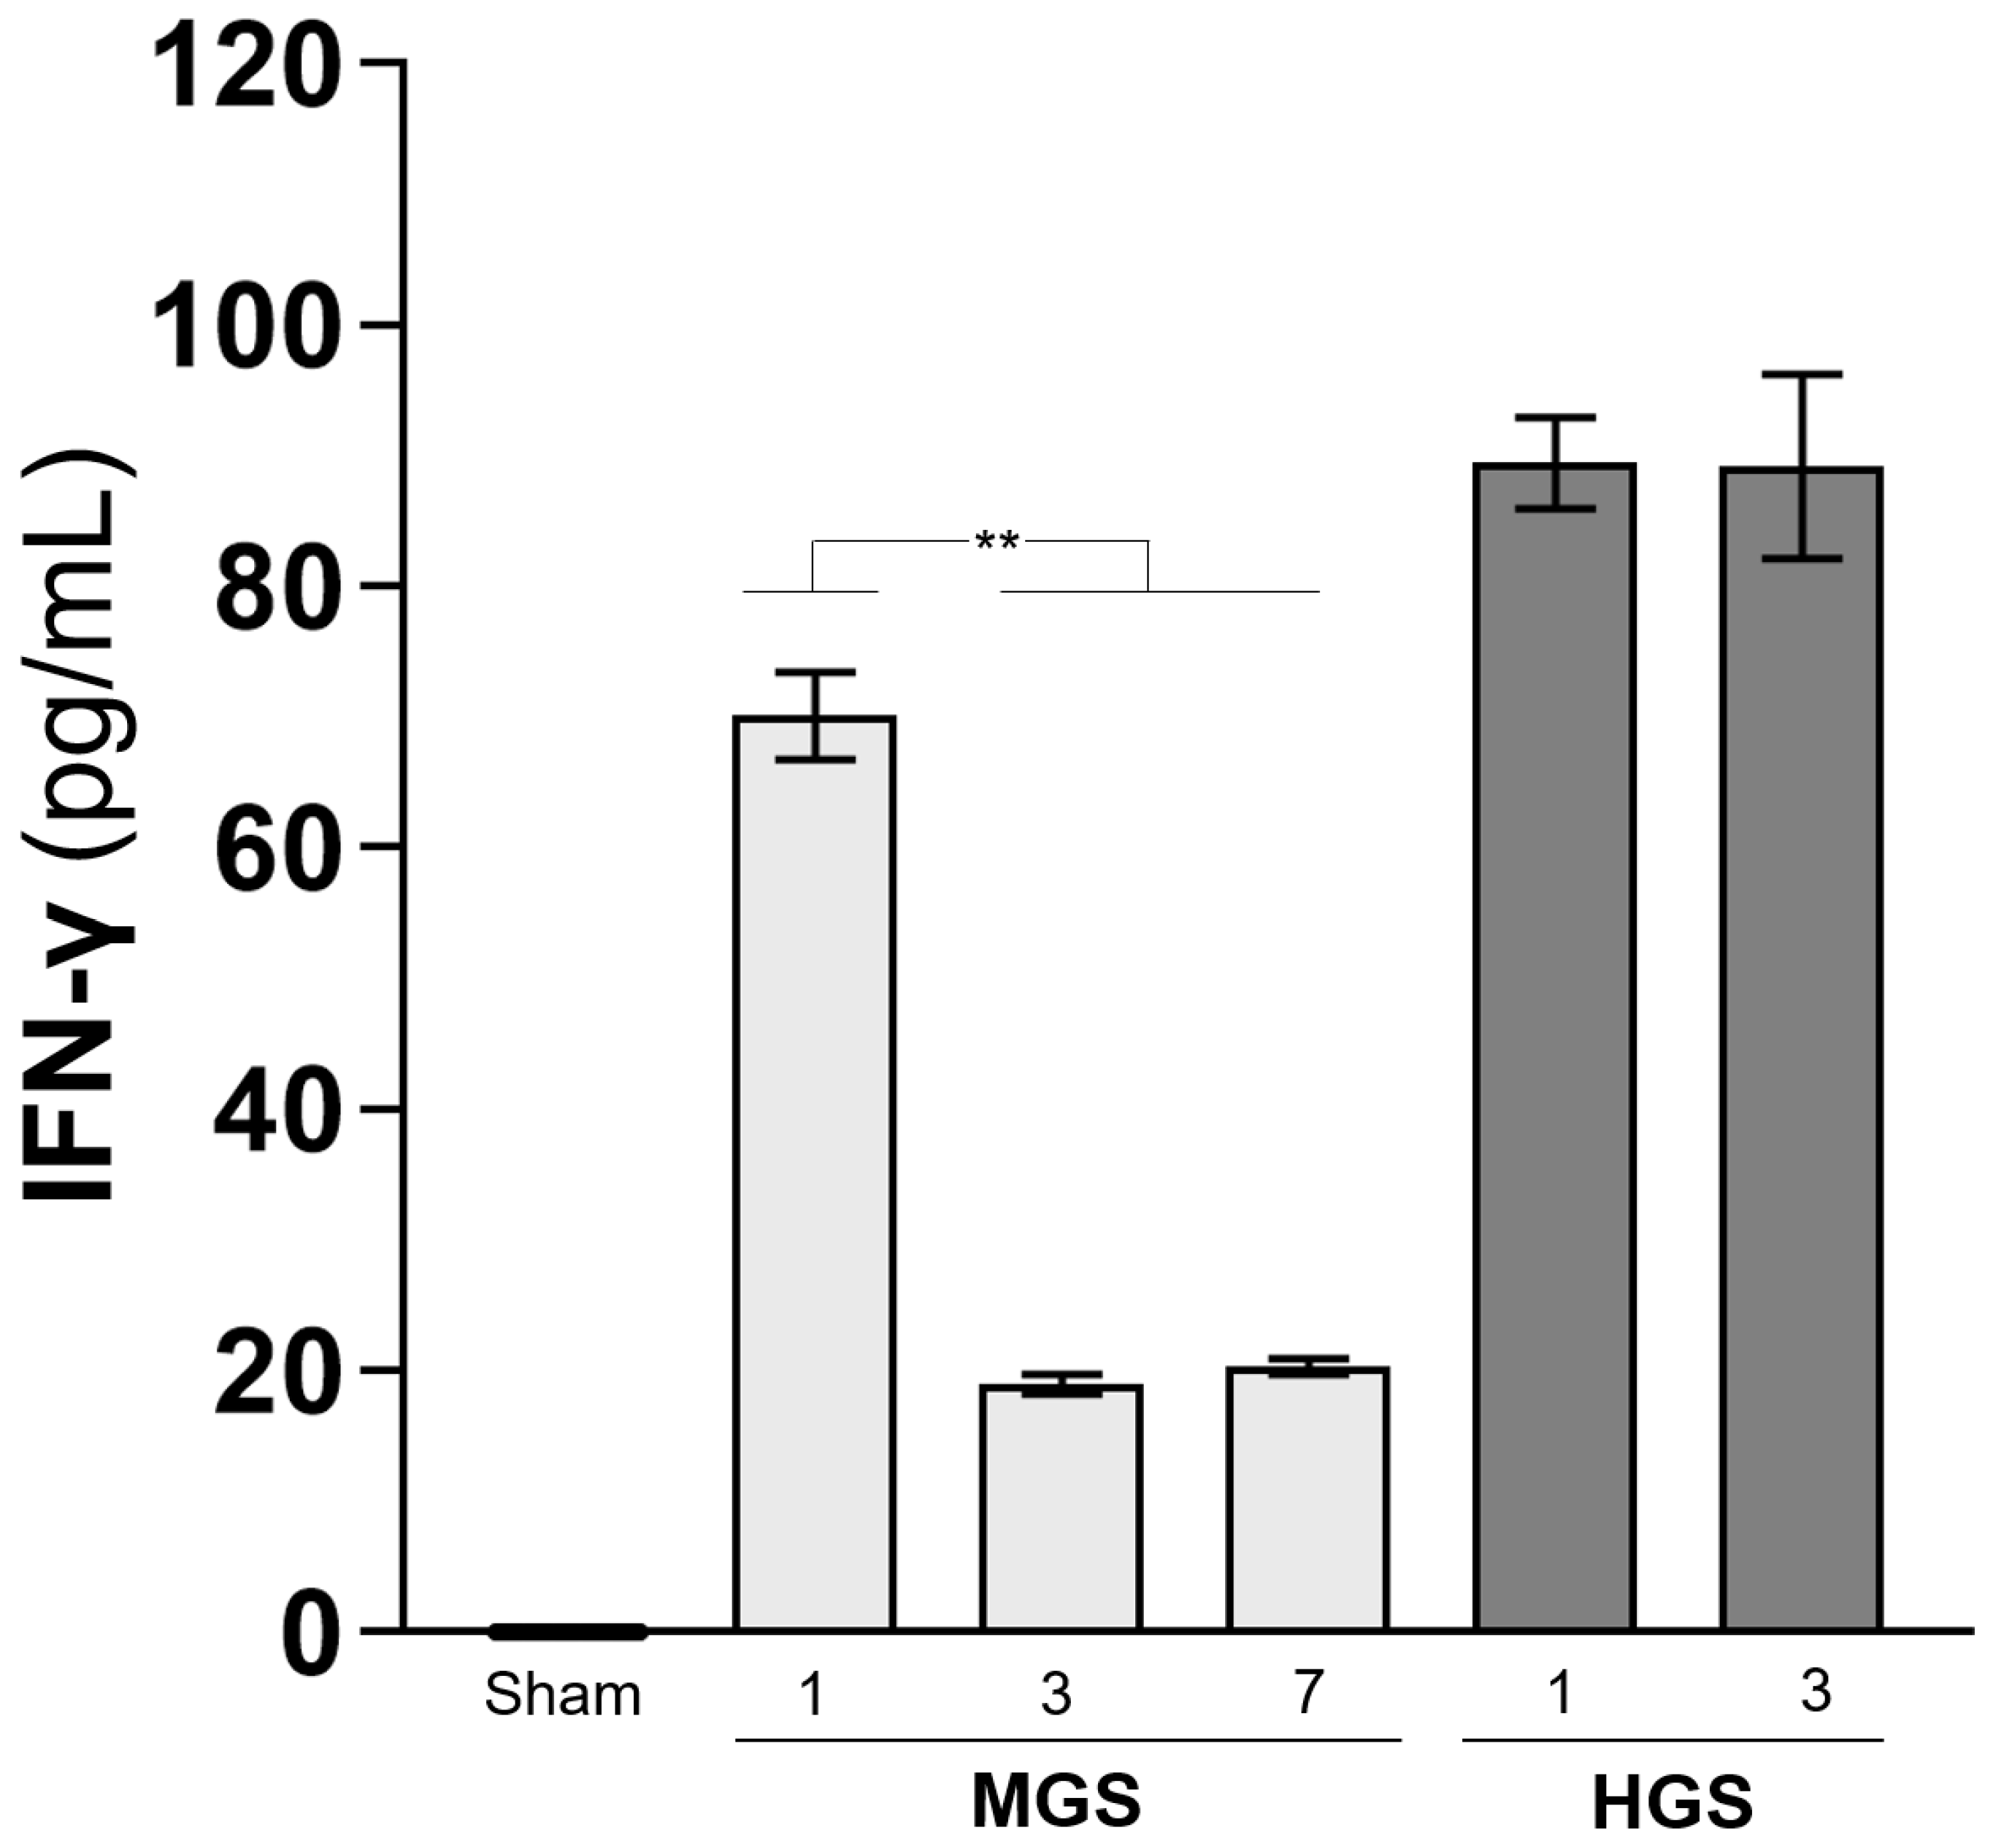

Table 1.
Fluorochrome-conjugated monoclonal antibodies used for flow cytometry.
| Category | Fluorochrome | Clone | Cat. No. | Supplies |
|---|---|---|---|---|
| Monoclonal antibodies | ||||
| Mouse anti-mouse NK-1.1 (CD161) | PE-Cy7 | PK136 | 552878 | BD |
| Hamster anti-mouse CD3 epsilon | BV510 | 145-2C11 | 563024 | BD |
| Rat anti-mouse CD11b (Ly-40) | BV786 | M1/70 | 740861 | BD |
| Hamster anti-mouse CD27 | BB700 | LG.3A10 | 742135 | BD |
| Mouse anti-mouse Ly-49C and Ly-49I | PE | 5E6 | 553277 | BD |
| Rat anti-mouse Ly-49D | APC | eBio4E5 (4E5) | 17-5782-82 | Invitrogen |
| Rat anti-mouse Ly-49G2 | BV421 | 4D11 | 742879 | BD |
| Mouse anti-mouse Ly-49H | FITC | 3D10 | 562536 | BD |
| Isotype controls | ||||
| Mouse C3H x BALB/c IgG2a, κ | PE-Cy7 | G155-178 | 557907 | BD |
| Armenian hamster IgG1, κ | BV510 | A19-3 | 563197 | BD |
| Rat DA/HA IgG2b, κ | BV786 | R35-38 | 563334 | BD |
| Armenian hamster IgG1, κ | BB700 | A19-3 | 566421 | BD |
| Mouse 129/SvJ IgG2a, κ | PE | G155-178 | 553457 | BD |
| Rat/IgG2a, κ | APC | eBR2a | 17-4321-81 | BD |
| Rat Fischer, CDF IgG2a, κ | BV421 | R35-95 | 562602 | BD |
| Mouse BALB/c IgG1, κ | FITC | X40 | 349041 | BD |
Abbreviations: APC, allophycocyanin; BB, BD Horizon Brilliant Blue; BV, BD Horizon BrilliantTM Violet; Cat., catalog; Cy, cyanine; FITC, fluorescein isothiocyanate; Ig, immunoglobulin; Ly, lymphocyte antigen; PE, phycoerythrin.
Table 2.
Primers used for real-time polymerase chain reaction.
| Genes | Sequence (5′ → 3′) | |
|---|---|---|
| Forward | Reverse | |
| NK-1.1 | GACACAGCAAGTATCTACCTCGG | TCAGAGCCAACCTGTGTGAACG |
| Ly-49C | GAGAACAGGACAGATGGGACAG | GCAGTTCGCTTTACATCCACTCC |
| Ly-49D | AGATGAGGCTCAAGGAGACACG | TGTCATAAGCACTGCAACAGTTAC |
| Ly-49H | GAATCCTCTGTTCCCTTCGGCT | GCAGTTATGGCGGTGGTTGAGA |
| Ly-49G2 | CACAAAAGACCCATCTCCAAGGC | GCAGGTCTGTTTACATCCACTCC |
| Granzyme B | ACTTTCGATCAAGGATCAGCA | GGCCCCCAAAGTGACATTTAT |
| GAPDH | CATCACTGCCACCCAGAAGACTG | ATGCCAGTGAGCTTCCCGTTCAG |
Abbreviations: GAPDH, glyceraldehyde-3-phosphate dehydrogenase; Ly, lymphocyte antigen; NK, natural killer.
Disclaimer/Publisher’s Note: The statements, opinions and data contained in all publications are solely those of the individual author(s) and contributor(s) and not of MDPI and/or the editor(s). MDPI and/or the editor(s) disclaim responsibility for any injury to people or property resulting from any ideas, methods, instructions or products referred to in the content. |
© 2025 by the authors. Licensee MDPI, Basel, Switzerland. This article is an open access article distributed under the terms and conditions of the Creative Commons Attribution (CC BY) license (http://creativecommons.org/licenses/by/4.0/).
Copyright: This open access article is published under a Creative Commons CC BY 4.0 license, which permit the free download, distribution, and reuse, provided that the author and preprint are cited in any reuse.


