
Submitted:
30 April 2025
Posted:
02 May 2025
You are already at the latest version
Abstract
Phosphomannomutase 2 (PMM2) catalyzes the interconversion of mannose-6-phosphate and mannose-1-phosphate, a key step in the biosynthesis of GDP-mannose for N-glycosylation. Its deficiency is the most common cause of congenital disorders of glycosylation (CDG), accounting for the subtype known as PMM2-CDG. PMM2-CDG is a rare autosomal recessive disease characterized by multisystemic dysfunction. Dimerization of PMM2 is considered essential for enzymatic activity, although it remains unclear whether this supports structural stability alone, or whether both subunits are catalytically active — a distinction that may affect how mutations in each monomer contribute to overall enzyme function and disease phenotype. PMM2 has a paralog, PMM1, which shares substantial structural similarity — including obligate dimerization — and displays mutase activity in vitro, but does not compensate for PMM2 deficiency in vivo. To investigate potential heterodimerization between PMM1 and PMM2, and the effect of interface mutations over PMM2 dimer stability, we first assessed the likelihood of their co-expression using data from GTEx and the Human Protein Atlas. Building on this expression evidence, we modeled all possible dimeric combinations between the two paralogs using AlphaFold3. Models of the PMM2 and PMM1 homodimers were used as internal controls and aligned closely with their respective reference biological assemblies (RMSD < 1 Å). In contrast, the PMM2/PMM1 heterodimer model, the primary result of interest, showed high overall confidence (pLDDT > 90), low inter-chain predicted alignment error (PAE ∼1 Å), and robust interface confidence scores (iPTM = 0.80). Then we applied PISA, PRODIGY, and mmCSM-PPI to assess interface energetics and evaluate the impact of missense variants specifically at the dimerization interface. Structural modeling suggests that PMM2/PMM1 heterodimers are energetically viable, although slightly less stable than PMM2 homodimers. Interface mutations were predicted to reduce dimer stability, potentially contributing to the destabilizing effects of disease-associated variants. These findings offer a structural framework for understanding PMM2 dimerization, highlighting the role of interface stability, paralogs co-expression, and sensitivity to disease-associated mutations.
Keywords:
structural bioinformatics
; PMM2-CDG
; human PMMs
; PPI
1. Introduction
Phosphomannomutases (PMMs, EC:5.4.2.8, InterPro: IPR005002) catalyze the isomerisation of mannose-6-phosphate to mannose-1-phosphate (Man-1-P). In humans, this activity is potentially carried out by two paralogous enzymes, PMM1 and PMM2 [1], which share more than 60% sequence identity [2,3] and exhibit a conserved overall fold (RMSD Å on crystallographic structures 2FUC/PMM1 and 7O4G/PMM2) (Figure 1). The formation of Man-1-P is a pivotal step in the biosynthesis of GDP-mannose and dolichol-phosphate-mannose, two sugar donors required for the formation of lipid-linked oligosaccharides [1,4].
The loss of PMM2 function leads to PMM2-CDG (OMIM: 212065; ORPHA: 793180) a congenital disorder of glycosylation (CDG) characterized by defective glycosylation. [1,5,6]. PMM2-CDG is the most prevalent CDG subtype, with a reported prevalence as high as 1:20000 [5]. The phenotypic spectrum of PMM2-CDG is highly variable, with predominant neurological manifestations, and disease severity ranges from severe neonatal-onset forms, which can be lethal (infant mortality rate of within the first year of life), to milder phenotypes observed in adulthood [4,6,7]. Such variability is influenced by the diversity of pathogenic variants, which differentially affect protein folding, stability, and enzymatic activity, ultimately modulating disease progression and clinical outcomes [8]. Furthermore, the complete loss of PMM2 activity is incompatible with life, and pathogenic mutations are typically hypomorphic, thus preserving some residual function [9]. Most patients are compound heterozygotes, carrying one or more alleles that retain partial enzymatic activity [1,10]
Structurally, PMM2 functions as an obligate homodimer [1,11]. This suggests that in vivo, mixed dimers composed of different PMM2 variants may form, potentially influencing residual enzymatic activity depending on the specific mutational combination. These residual activities are modulated by various factors, including protein stability, folding efficiency, and integrity of the dimer interface. Indeed, disruption of the dimeric assembly is increasingly recognized as a contribute factor to loss-of-function phenotypes. The most common genotype in Western Europe is p.Arg141His/p.Phe119Leu. While p.Arg141His is a mutation targeting the catalytic residue that impairs enzymatic activity, p.Phe119Leu disrupts homodimer formation, leading to protein destabilization and degradation [8,12].
PMM1, the closest paralog of PMM2, also forms an obligate homodimer and displays in vitro phosphomannomutase activity. Despite its structural similarity and enzymatic competence, PMM1 is not associated with any disease and it is unable to compensate for PMM2 deficiency in vivo [13].
The interconnection between PMM1 and PMM2 remains largely unexplored. In this work, we combined co-expression analysis of transcriptomic data, variant data mining, and structural modeling to investigate this relationship. Our findings provide new insights into the molecular features underlying PMM2 dimerization and heterodimer formation, with potential implications for understanding the biochemical basis of PMM2-CDG and its clinical variability.
2. Materials and Methods
2.1. Tissue Expression Analysis
TPM values for PMM1 (ENSG00000100417.12) and PMM2 (ENSG00000140650.13) were extracted from the GTEx [14] v10 dataset (https://gtexportal.org/home/downloads/adult-gtex/bulk_tissue_expression) and merged with the sample metadata (https://gtexportal.org/home/downloads/adult-gtex/metadata) to generate a sample-by-gene expression matrix. For each tissue, median TPM values were computed for both genes. Tissues were considered to support co-expression when both genes had median TPM > 10. Additionally, Spearman correlation coefficients were calculated between PMM1 and PMM2 across individual samples within each tissue. P-values were adjusted for multiple testing using the Benjamini-Hochberg method, and tissues with adjusted p-values and correlation coefficients were considered to exhibit significant co-expression. To assess protein-level co-occurrence, immunihistochemistry-based protein data for PMM1 and PMM2 were retrieved from the Human Protein Atlas (HPA, [15]) (https://www.proteinatlas.org/humanproteome/tissue/data#normal_tissues_ihc). Data were filtered to include only samples with detection levels classified as "Medium" or "High". Co-occurrence was defined as the presence of both proteins in the same tissue and cell type. Due to the prevalence of "Uncertain" reliability scores for PMM1, and the use of HPA primarily as a source of supporting evidence for GTEx, both "Uncertain" and "Approved" entries were retained. A manual mapping was performed to align HPA and GTEx tissue nomenclature, allowing GTEx tissues to be flagged for confirmed protein-level co-detection based on this mapping. To visualize the results, we produced a scatter plot of median TPM values for PMM1 and PMM2 per tissue and annotated it with HPA co-detection status. All analyses were conducted in R (v4.4.3) using packages from the tidyverse [16], along with data.table [17], ggrepel [18], and ggforce [19] for visualization and annotation.
2.2. Structural Modeling of Dimeric Complexes
Three dimeric configurations were modeled: PMM2 homodimer, PMM1 homodimer, and PMM2/PMM1 heterodimer. Full-length amino acid sequences of human PMM1 (UniProt ID: Q92871) and PMM2 (UniProt ID: O15305) were retrieved from UniProt [20]. Structural models were generated using the AlphaFold3 (AF3) server [21] using the aforementioned sequences, without any ion or cofactor. Model confidence was evaluated using inter-chain predicted TM-scores (iPTM), per-chain predicted TM-scores (pTM), and minimum predicted aligned error (PAE) between chains, extracted from the model summary output. Interface quality was primarily assessed through chain-pair iPTM values and inter-chain PAE, with iPTM > 0.8 and PAE < 1 Å considered indicative of high-confidence interfaces. All models were inspected for stereochemical quality and interface plausibility using ChimeraX [22] for visualization and comparison with available crystal structures (PDB: 7O4G for PMM2, 2FUC for PMM1).
2.3. Dimer Interface Analysis
The energetic and structural properties of the dimer interfaces were assessed using the Protein Interfaces, Surfaces and Assemblies (PISA) tool from the European Bioinformatics Institute ’Protein interfaces, surfaces and assemblies’ service PISA at the European Bioinformatics Institute (http://www.ebi.ac.uk/pdbe/prot_int/pistart.html [23]). We used the AF3 outputs as coordinate files after mmcif -> pdb conversion through the pdbj conversion service (https://mmcif.pdbj.org/converter/). For each model, PISA calculated interface area, number of interacting residues, solvation free energy gain (), hydrogen bonds, and salt bridges. These parameters were used to compare the relative stability of the homodimers and the heterodimer. Complementary to PISA, the PRODIGY web server ([24], https://rascar.science.uu.nl/prodigy/)was employed to estimate binding free energies () and dissociation constants (Kd) for each complex, based on empirical inter-residue contact models. Calculations were performed at 25 °C using default settings, and results were used to benchmark relative interface stability across the homodimers and the heterodimer. To assess the conservation of the dimer interface, we generated residue–residue interaction networks for PMM1, PMM2, and PMM2/PMM1 heterodimers using ChimeraX. Intermolecular contacts were identified using the command contacts ifaces intramol false sel true reveal true, selecting only hydrogen bonds (O–N or N–O atom pairs within 3.5 Å), hydrophobic contacts (C–C atom pairs), and salt bridges (specific charged side-chain interactions). The resulting interaction networks were constructed in R using the tidygraph [25], ggraph [26], and tidyverse[16] packages, with residues as nodes and contacts as edges. Conservation scores were mapped onto the networks based on ConSurf ( [27] https://consurfdb.tau.ac.il/index.php) analyses, using the 2FUC structure for PMM1 and the 7O4G structure for PMM2. Visualization emphasized chain identity and residue conservation using customized layouts.
2.4. Variant Curation and Annotation
The reference amino acid sequence for human PMM2 (UniProt ID: O15305) was retrieved and converted into a residue-by-residue table using R and the tidyverse package. Structural annotations were extracted from the UniProt GFF file, and only single-residue entries (where start and end positions are the same) were included. A list of interface residues was created using ChimeraX based on AlphaFold and PDB structural models (PDBs 2AMY, 7O0C, 7O1B, 7O4G) and integrated in the residue-by-residue table.
ClinVar data were used to identify missense variants associated with PMM2 and integrated in the table by matching position and reference aa. Variants labeled as "uncertain significance" or with "conflicting interpretations" were excluded from pathogenicity-focused analyses, including those comparing interface residue effects and evaluating predictive model performance. Population variant data for PMM2 (ENSG00000140650) were collected from gnomAD 4.1.0. The variant list was filtered to include only missense variants (based on the VEP_annotation column). ProtVar data associated with the PMM2 UniProt ID (O15305) were retrieved and used to obtain population-level variant observations along with predictive scores from FoldX () and conservation. These scores were extracted and parsed from the structured ProtVar output files.
2.5. Effect of Interface Variants on Dimer Stability
Variants located at structurally mapped interface positions were extracted and reformatted into the required input syntax (e.g., A:p.Phe119Leu) using the results of the structural annotation pipeline. To assess the effect of interface variants on dimer stability, the mmCSM-PPI web server ( [28] https://biosig.lab.uq.edu.au/mmcsm_ppi/predict) was used. For each variant, the change in binding free energy (, kcal/mol) was computed for the PMM2 homodimer with both subunits mutated (mut/mut) and the PMM2 homodimer with one mutated subunit and one wild-type subunit (mut/wt). Negative values were interpreted as destabilizing, with values below -2.0 kcal/mol considered extremely destabilizing [29]. Mutations were then categorized based on their predicted impact and discussed in the context of known pathogenicity. Visualizations were created in R using ggplot2. Violin plots were used to compare the distribution of conservation and computational scores across unclassified variants. Scatter plots were generated to compare mmCSM-PPI predictions between homodimeric (mut/mut) and heterodimeric (mut/wt) contexts. Points were color-coded by clinical classification and shaped according to whether the variant was observed in the gnomAD dataset.
3. Results
3.1. Tissue-Specific Expression of PMM Paralogs
PMM1 and PMM2 are known paralogs each capable of forming homodimers. Dual proteom-scale networks suggest they interact via co-immunoprecipitation [30], hinting at the potential to form heterodimers. To evaluate the likelihood of such interactions occurring in vivo, we explored their co-expression and co-localization using GTEx (transcriptomics) and the Human Protein Atlas (HPA, proteomics) ( Figure 2).
Analysis of GTEx transcriptomics data showed that co-expression at potentially functional levels (TPM > 10 for both genes) occurs in multiple tissues (Figure 2). Notably, esophagus mucosa, cultured fibroblasts and tibial nerve tissues showed median expression values in the top quartile for both PMM1 and PMM2. In stomach, bladder and thyroid, HPA protein data confirmed GTEx expression patterns, indicating the presence of both proteins in the same tissues. Brain regions showed a distinct expression pattern: PMM1 was consistently highly expressed (TPM > 25), while PMM2 expression was below significance (TPM < 10). Despite this, statistically significant sample-level co-expression (Spearman ) was observed in seven out of the thirteen brain subregions.
3.2. Structure Evaluation
Structural models of PMM1 homodimer, PMM2 homodimer, and PMM2/PMM1 herodimer were generated using AlphaFold3 in multimer mode (Figure 3). All three dimers showed highly similar overall fold and dimer architecture, consistent with known crystal structures of PMM2 (PDB: 7O4G) and PMM1 (PDB: 2FUC) (Figure 4). The modeled dimers preserved the canonical "head-to-head" configuration typical of phosphomannomutases, and no major steric clashes or abnormal backbone conformations were observed upon inspection in ChimeraX.
Structural alignment between AlphaFold3 homodimer models and their respective crystal structures were good (PMM1 to 2FUC: 0.188 Å; PMM2 to 7O4G: 1.391 Å, RMSD based on structural alignment over interaction CAP domain), confirming that the predicted dimer interface architecture closely matches experimentally determined assemblies.
AlphaFold3 confidence metrics confirmed the robustness of the predicted interfaces. The PMM2 homodimer displayed high chain iPTM scores (0.81) and chain-pair iPTM value (0.81), indicative of a well-resolved interface. The PMM1 homodimer showed slightly lower chain iPTM (0.78) and marginally higher PAE ( Å), suggesting a somewhat less confident interface, though overall fold confidence remained high (chain pTM = 0.82). The PMM2/PMM1 heterodimer exhibited intermediate confidence, with chain iPTM values of 0.80, chain-pair iPTM of 0.77–0.80, and inter-chain PAE around 0.9 Å. These data suggest that all three dimers are structurally plausible, with minor differences in predicted interface stability.
3.3. Interface Analysis and Energetic Comparison
To benchmark the AlphaFold3-predicted complexes, we compared their interface features against available crystal structures of PMM1 (PDB: 2FUC) and PMM2 (PDB: 7O4G). The comparison between the AlphaFold3 model and the PMM2/7O4G crystal structure revealed the same number of interface residues (26), with a modest ( Å2) difference in interface area. Both models display a solvation free energy gain compatible with stable dimer formation kcal/mol). Similarly, the comparison between the AlphaFold3 model and the PMM1/2FUC crystal structure revealed the same number of residues (26), with an abysmal ( Å2) difference in interface area. Despite the low ( kcal/mol, stable across other avaliable crystals (2fuc, 6cfv)) reported by PISA for crystallographic PMM1 dimers, literature consensus supports its obligate dimeric state based on symmetry, conservation, and biochemical evidence. In contrast, AlphaFold3 models reconstruct a complete interface with kcal/mol values consistent with stable dimer formation. The kcal/mol difference in between the crystallographic and AlphaFold-predicted dimers for PMM2/7o4g falls within the expected variability of PISA estimates and is not, by itself, indicative of a meaningful difference in interface stability.
Moving to the in silico analysis, the predicted PMM1 homodimer exhibited the largest interface area (1090.6 Å2), followed by the PMM2/PMM1 heterodimer (1062.4 Å2), and the PMM2 homodimer (998.9 Å2). As in the case of crystal structures, the interface region is rich in hydrophobic and polar contacts: PISA analysis identified 14 hydrogen bonds and 10 salt bridges for the PMM2 homodimer, 18 hydrogen bonds and 12 salt bridges for the PMM1 homodimer, and 16 hydrogen bonds and 11 salt bridges for the PMM2/PMM1 heterodimer. PISA analysis reported values ranging from –5.1 kcal/mol for the PMM2 homodimer to –5.8 kcal/mol for the PMM1 homodimer, with the PMM2/PMM1 heterodimer showing an intermediate of –5.2 kcal/mol.
PRODIGY, used as an independent estimate of binding free energy, returned values of –11.6 kcal/mol for PMM2 homodimer, –12.5 kcal/mol for PMM1 homodimer, and –12.1 kcal/mol for PMM2/PMM1. The predicted dissociation constants were in the low nanomolar range (Kd = M, M, and M, respectively), suggesting tight binding. Both tools consistently ranked the PMM1 homodimer as slightly more stable, but the differences across the three configurations were modest. These results support the structural viability of PMM2/PMM1 heterodimers and suggest that they may form under physiological conditions.
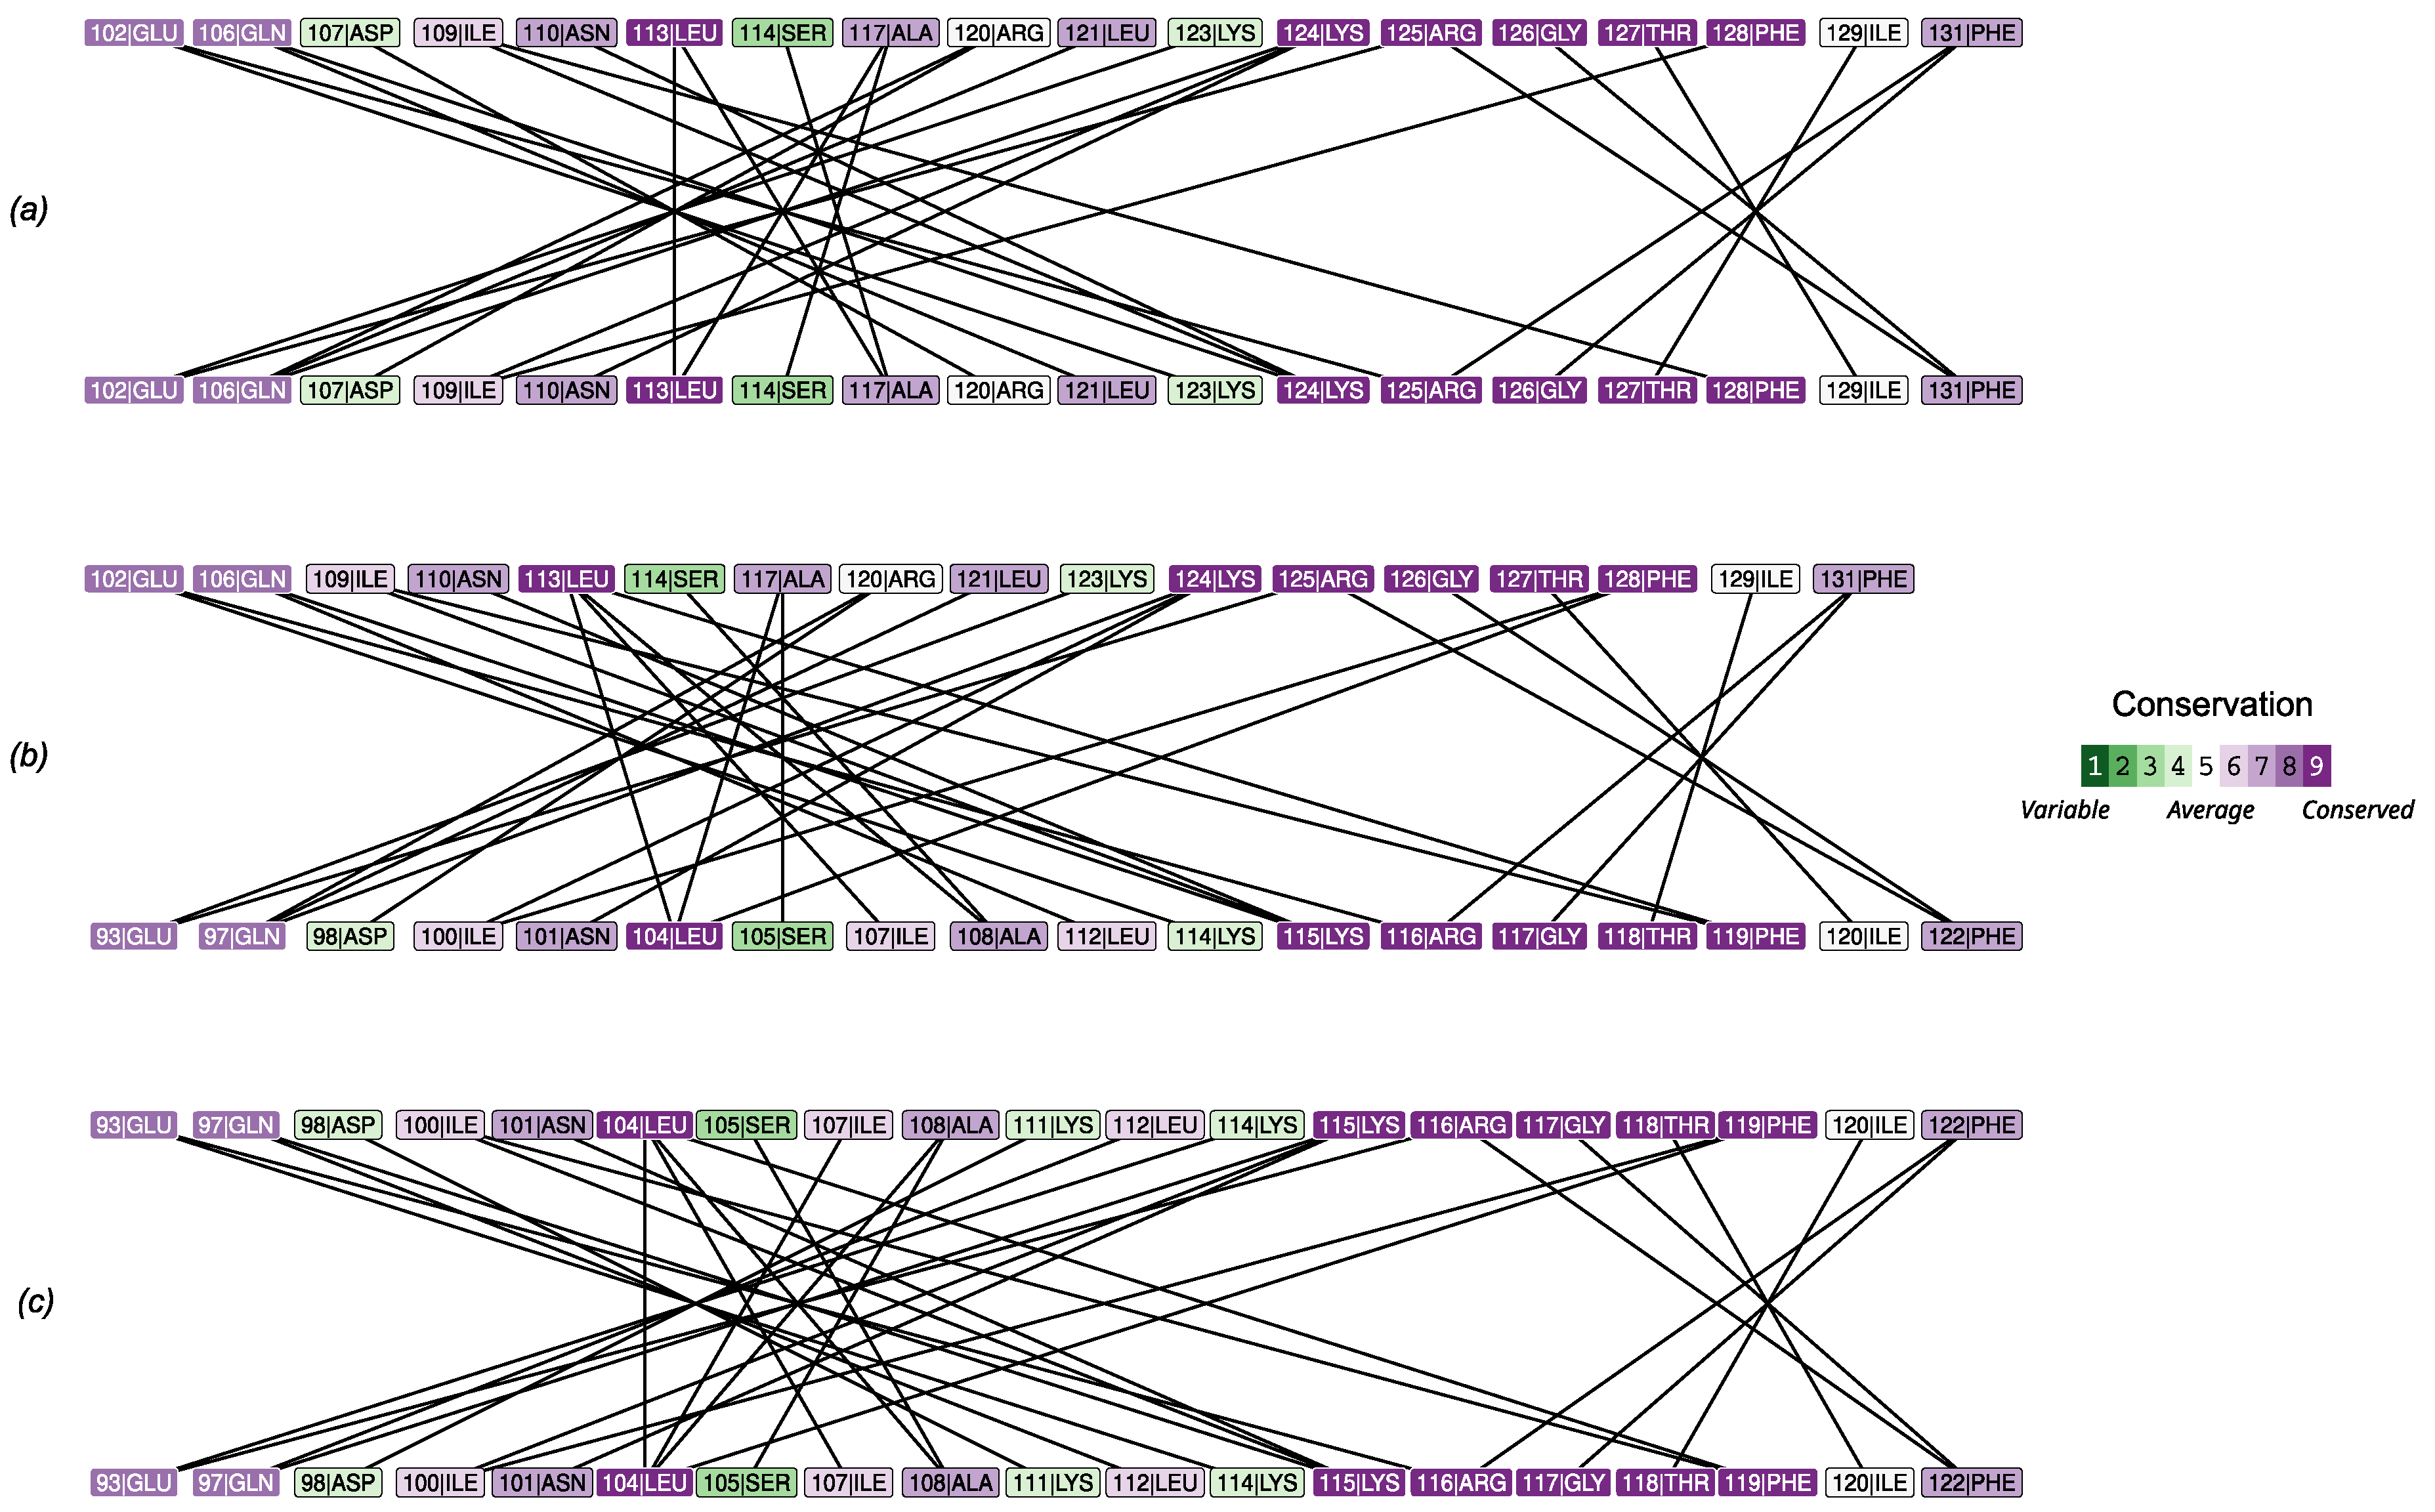
The analysis of amino acids interactions in homo- and heterodimers highlighted the quantitative strength of the interactions and the uniformity of bond distribution across the interface (Figure 5), in line with the results described above. In particular, two interaction clusters forms in all cases: a major (i.e. more extended) one involving an -helix (102-128 in PMM1 and 93-119 in PMM2) and a minor (i.e. less extended one) involving the interaction of a more conserved stretch (five of six residues with conservation higher than seven) -strand from a subunit and a coil from the other (125-131 in PMM1 and 116-122 in PMM2).
3.4. Impact of Interface Mutations on PMM2 Dimer Stability
Missense variants of PMM2 mapping to the dimer interface were retrieved from ClinVar and gnomAD, and mapped onto the structural model. Notably, several well-characterized pathogenic variants (e.g., p.Phe119Leu) fell within or near the interface region.
We used mmCSM-PPI to evaluate the impact of interface mutations found in gnomAD (Additional Table A1). The predicted change in binding free energy () upon mutation was calculated for the PMM2 homodimer with both subunits mutated (mut/mut) and the PMM2 homodimer with one mutated subunit and one wild-type subunit (mut/wt). p.Gly117Arg showed the most destabilizing effect (Predicted binding = –4.87 kcal/mol), followed by p.Ile120Asn (-4.1) and p.Lys115Thr (-4.03). The destabilizing trend was conserved in both (mut/mut) and (mut/wt) configurations, although never exceeded 2 kcal/mol. Predictive modeling also identified potentially pathogenic variants not yet annotated in clinical databases. Notably, these variants are extremely rare in the general population (. For example, p.Lys115Thr — reported in gnomAD but absent from ClinVar — exhibited a comparable to known disease-associated mutations, suggesting a destabilizing impact on the dimer interface. Interestingly, p.Lys115THr was the only mutation exhibiting a significant destabilization in the wt/mut dimer, a condition that does not usally results in a clinical phenotype, not even in the presence of active site mutations — as it is in the case of p.Arg141His, slightly widespread in the common population in heterozygosis with the wt allele frequency of Comparison of predicted with the conservation in the amino acids involved in contact at the interface (Figure 6) revealed a lower in the most conserved amino acids.
These results highlight how structural prediction tools can uncover overlooked variants with possible clinical relevance. These findings support the hypothesis that interface integrity is critical for proper dimerization and that pathogenic mutations may disrupt complex stability as a mechanism of disease.
4. Discussion
The aim of this study was to evaluate the structural plausibility and relative stability of PMM2/PMM1 heterodimers compared to the PMM2 and PMM1 homodimers. The dimerization of PMMs is tightly linked to their catalytic function, stability, and regulation. The formation of the dimer is required for full enzymatic activity [6]. Since PMM2 functions as an obligate dimer and its deficiency is the primary cause of PMM2-CDG [1], understanding the stability and compatibility of possible of different dimeric configurations is relevant to exploring disease mechanisms. In particular, the inability of PMM1 to compensate for PMM2 loss in patients with PMM2-CDG raises questions about the physiological role of PMM1, and the potential interactions between the two paralogs, especially in compound heterozygous contexts[31]. To better understand the regulatory and functional mechanisms of PMM1 and PMM2, we explored the hypothesis that these proteins could form heterodimers under physiological conditions. Dimerization specificity is likely influenced by structural differences at the dimer interface, where key residues may favor the recognition and assembly of identical subunits rather than heterologous ones. To investigate this, we analyzed the stability and binding affinity of different dimeric combinations (PMM1 homodimer, PMM2 homodimer, and PMM1/PMM2 heterodimer) using structural modeling and interface analysis.
The co-expression analysis of PMM2 and PMM1 in multiple human tissues, including brain tissues — the most impacted by PMM2-CDG — supports the hypothesis that heterodimers could form in vivo. According to GTEx data, PMM1 is generally more expressed, but PMM2 levels are not negligible in relevant tissues. These observations are in contrast with the inability of PMM1 to compensate for PMM2 deficiency in PMM2-CDG patients and point at a PMM1 major role in different pathways. Recently, a PMM1 knock-out performed in PMM2-CDG fibroblasts led to phenotypical improvement, strenghtening this hypothesis [32]. The rationale behind this evidence is not yet fully understood, and it involves the bisphosphatase activity of PMM1. An interesting additional interpretation would be that the relative abundance and stoichiometry of the two monomers could govern the shift between homo- and hetero-dimers. Notably, GTEx data show that PMM1 expression in regions such as the cortex, frontal cortex, amygdala, substantia nigra, cerebellar hemisphere, and cerebellum does not significantly correlate with PMM2, suggesting a spatial or cell-type specificity in their potential co-regulation.
Overall, AlphaFold3-predicted dimers displayed well-packed, symmetrical interfaces with extensive residue engagement and hydrogen bonding, supporting their use as structurally plausible models for homodimer and heterodimer analysis. It is worth noting that the weaker for the crystallographic model may reflect incomplete biological assembly deposition or crystal packing artifacts. In contrast, AlphaFold3 predicts idealized symmetric dimers optimized for interface packing. These results suggest the structural viability and energetic plausibility of the PMM2/PMM1 heterodimer, supporting the idea that it can exist under physiological conditions. All of the three complexes showed extensive interface areas and a comparable number of hydrogen bonds and salt bridges, suggesting that heterodimer formation is energetically and geometrically plausible. Structural alignment of the AlphaFold3-predicted models with experimentally resolved crystal structures yielded RMSD values below 1.5 Å, validating the reliability of the predicted complexes. This high degree of structural similarity underscores the accuracy of the AlphaFold3 multimer predictions, providing confidence in their use to infer interface properties for the PMM2/PMM1 heterodimer in the absence of experimental structural data.
Interface analysis using PISA and PRODIGY produced consistent and complementary results. The differences in predicted binding energies across the three dimers were modest, suggesting that the heterodimer is energetically comparable to both homodimers. While PISA estimated a slightly higher for the PMM1 homodimer, PRODIGY ranked it as the most stable configuration, followed closely by the PMM2/PMM1 heterodimer. Despite slight methodological differences, both approaches converged on the idea that PMM2/PMM1 complexes are structurally and energetically viable.
The analysis of missense variants provided further insight into the structural determinants of dimer stability. Several pathogenic variants associated with PMM2-CDG were located at or near the dimer interface and were predicted to destabilize dimer formation. Notably, the p.Phe119Leu variant — among the most frequent pathogenic mutations — exhibited a strongly destabilizing effect in the mut/mut context, consistent with previous findings linking this variant to defective dimerization and destabilization in homozygous or commpound heterozygous patients[1]. Predictive modeling using mmCSM-PPI revealed additional variants from population datasets (e.g., gnomAD) with values comparable to or more negative than known PMM2-CDG mutations. Notably, these variants are extremely rare in the general population. Among these, p.Lys115Thr emerged as a potentially pathogenic variant not yet reported in clinical databases (e.g., ClinVar). These findings reinforce the hypothesis that compromised dimer stability is a key molecular mechanism underlying PMM2-CDG. These findings suggest that some destabilizing variants may be underrepresented in clinical annotations and support the hypothesis that impaired dimer stability is a key molecular mechanism in PMM2-CDG.
Taken together, the results support a model in which dimer interface integrity is crucial for maintaining PMM2 enzymatic function. The formation of heterodimers with PMM1 appears structurally feasible, and may contribute in the but may not be sufficient to restore activity in a pathological context. Although this study is limited to computational analyses and does not provide functional validation, the convergence of structural modeling, energetic binding estimation, and mutational impact analysis highlights the potential biological relevance of these findings. Given the use of predicted structures, the values reported here should be interpreted as relative estimates of interaction strength. The agreement between PISA and PRODIGY rankings supports the robustness of the observed trend, although experimental validation would be needed to confirm the binding affinity and functional implications of these interactions in vivo. While the absolute differences in predicted binding energies between dimer configurations are modest, they are consistent across independent tools (PISA and PRODIGY), with PMM1 homodimer consistently ranked as the most stable. Given the method-inherent variability ( kcal/mol), these differences may not indicate drastic functional divergence, but they do support the energetic plausibility of heterodimer formation.
5. Conclusions
This study provides a computational assessment of the structural and energetic properties of PMM2 and PMM1 dimerization, with a focus on the plausibility and stability of PMM2/PMM1 heterodimers. Structural modeling with AlphaFold3, combined with interface analysis using PISA and PRODIGY, suggests that heterodimers are energetically viable and display interface features comparable to those of the homodimers. Expression data further support the potential for heterodimer formation in physiologically relevant tissues, including fibroblasts. Moreover, the analysis of pathogenic variants at the PMM2 dimer interface highlights the role of interface integrity in modulating dimer stability and potentially contributing to disease severity.
While structural modeling supports the energetic viability of PMM2/PMM1 heterodimers, additional biochemical or cell-based studies are needed to confirm whether such complexes form or function under physiological conditions. While experimental validation remains necessary to confirm functional outcomes of these findings, the consistency of results across structural, energetic, and mutational analyses strengthens the hypothesis that altered dimerization represents a key mechanism in the pathogenesis of PMM2-CDG. These findings contribute to a better understanding of PMM2 paralog interaction and may inform future studies on protein complex stability and targeted therapeutic strategies.
Author Contributions
Conceptualization: BHM, MM; Data curation: BHM, JB; Formal analysis: BHM, JB; Funding acquisition: BHM, MVC; Investigation: BHM, JB; Methodology: BHM; Project administration: BHM; Software: BHM; Supervision: BHM, GA, MVC; Visualization: BHM, JB, MM; Writing – original draft: BHM; Writing – review & editing: BHM, GA, MVC, MM.
Funding
Italian Ministry of University and Research PRIN 2022B2N2BY
Institutional Review Board Statement
In this section, you should add the Institutional Review Board Statement and approval number, if relevant to your study. You might choose to exclude this statement if the study did not require ethical approval. Please note that the Editorial Office might ask you for further information. Please add “The study was conducted in accordance with the Declaration of Helsinki, and approved by the Institutional Review Board (or Ethics Committee) of NAME OF INSTITUTE (protocol code XXX and date of approval).” for studies involving humans. OR “The animal study protocol was approved by the Institutional Review Board (or Ethics Committee) of NAME OF INSTITUTE (protocol code XXX and date of approval).” for studies involving animals. OR “Ethical review and approval were waived for this study due to REASON (please provide a detailed justification).” OR “Not applicable” for studies not involving humans or animals.
Informed Consent Statement
Any research article describing a study involving humans should contain this statement. Please add “Informed consent was obtained from all subjects involved in the study.” OR “Patient consent was waived due to REASON (please provide a detailed justification).” OR “Not applicable” for studies not involving humans. You might also choose to exclude this statement if the study did not involve humans.
Written informed consent for publication must be obtained from participating patients who can be identified (including by the patients themselves). Please state “Written informed consent has been obtained from the patient(s) to publish this paper” if applicable
Data Availability Statement
We encourage all authors of articles published in MDPI journals to share their research data. In this section, please provide details regarding where data supporting reported results can be found, including links to publicly archived datasets analyzed or generated during the study. Where no new data were created, or where data is unavailable due to privacy or ethical restrictions, a statement is still required. Suggested Data Availability Statements are available in section “MDPI Research Data Policies” at https://www.mdpi.com/ethics.
Acknowledgments
We acknowledge the National Research Council of Italy, Joint Bilateral Agreement CNR/Slovak Academy of Sciences, Biennial program 2023-24
Conflicts of Interest
Declare conflicts of interest or state “The authors declare no conflicts of interest.” Authors must identify and declare any personal circumstances or interest that may be perceived as inappropriately influencing the representation or interpretation of reported research results. Any role of the funders in the design of the study; in the collection, analyses or interpretation of data; in the writing of the manuscript; or in the decision to publish the results must be declared in this section. If there is no role, please state “The funders had no role in the design of the study; in the collection, analyses, or interpretation of data; in the writing of the manuscript; or in the decision to publish the results”.
Appendix A

Table A1.
Summary of PMM2 interface amino acid variants present in gnomad and/or ClinVar, their classifications, allele frequencies, and homozygote counts from gnomAD (general population).
Table A1.
Summary of PMM2 interface amino acid variants present in gnomad and/or ClinVar, their classifications, allele frequencies, and homozygote counts from gnomAD (general population).
| wt | Position | mut | Classification | Allele Frequency | Homozygote Count |
|---|---|---|---|---|---|
| Q | 88 | H | Uncertain | 3.75e-06 | 0 |
| E | 93 | D | Uncertain | 3.11e-06 | 0 |
| N | 101 | K | Pathogenic | 1.24e-06 | 0 |
| L | 104 | V | Pathogenic | 1.86e-06 | 0 |
| A | 108 | V | Pathogenic | 4.84e-05 | 0 |
| L | 112 | V | Uncertain | 4.97e-06 | 0 |
| P | 113 | T | Pathogenic | 6.21e-07 | 0 |
| P | 113 | S | Uncertain | 0 | 0 |
| P | 113 | L | Pathogenic | 1.80e-05 | 0 |
| G | 117 | R | Pathogenic | 0 | 0 |
| G | 117 | C | Conflicting | 0 | 0 |
| T | 118 | A | Uncertain | 1.29e-06 | 0 |
| T | 118 | S | Conflicting | 1.93e-06 | 0 |
| F | 119 | L | Pathogenic | 3.52e-05 | 0 |
| F | 119 | S | Pathogenic | 6.40e-07 | 0 |
| I | 120 | N | Uncertain | 6.39e-07 | 0 |
| I | 120 | T | Pathogenic | 4.41e-05 | 0 |
| I | 120 | M | Pathogenic | 5.11e-06 | 0 |
| F | 122 | L | Uncertain | 4.46e-06 | 0 |
| S | 135 | R | Uncertain | 8.87e-06 | 0 |
| A | 108 | E | Never associated | 1.24e-06 | 0 |
| A | 108 | S | Never associated | 6.20e-07 | 0 |
| E | 93 | K | Never associated | 6.22e-07 | 0 |
| F | 122 | V | Never associated | 1.28e-06 | 0 |
| G | 117 | S | Never associated | 1.29e-06 | 0 |
| I | 120 | L | Never associated | 6.40e-07 | 0 |
| K | 111 | N | Never associated | 1.24e-06 | 0 |
| K | 114 | E | Never associated | 1.86e-06 | 0 |
| K | 114 | R | Never associated | 6.21e-07 | 0 |
| K | 115 | T | Never associated | 6.22e-07 | 0 |
| N | 101 | D | Never associated | 6.20e-07 | 0 |
| N | 101 | S | Never associated | 6.20e-07 | 0 |
| P | 113 | R | Never associated | 6.21e-07 | 0 |
| R | 116 | K | Never associated | 1.24e-06 | 0 |
| R | 116 | M | Never associated | 6.22e-07 | 0 |
| R | 116 | T | Never associated | 6.22e-07 | 0 |
| S | 105 | G | Never associated | 6.20e-07 | 0 |
| S | 105 | N | Never associated | 3.10e-06 | 0 |
| S | 105 | R | Never associated | 1.24e-06 | 0 |
| S | 135 | N | Never associated | 1.90e-06 | 0 |
| S | 135 | T | Never associated | 6.34e-07 | 0 |
References
- Andreotti, G.; Pedone, E.; Giordano, A.; Cubellis, M.V. Biochemical phenotype of a common disease-causing mutation and a possible therapeutic approach for the phosphomannomutase 2-associated disorder of glycosylation. Molecular Genetics & Genomic Medicine 2013, 1, 32–44. [https://onlinelibrary.wiley.com/doi/pdf/10.1002/mgg3.3]. [CrossRef]
- Sharma, V.; Freeze, H. Phosphomannomutase 1,2 (PMM1,2). In Handbook of Glycosyltransferases and Related Genes; Taniguchi, N., Honke, K., Fukuda, M., Narimatsu, H., Yamaguchi, Y., Angata, T., Eds.; Springer Japan: Tokyo, 2014; pp. 1591–1598. [Google Scholar] [CrossRef]
- Schollen, E.; Pardon, E.; Heykants, L.; Renard, J.; Doggett, N.A.; Callen, D.F.; Cassiman, J.J.; Matthijs, G. Comparative Analysis of the Phosphomannomutase Genes PMM1, PMM2 and PMM2psi: The Sequence Variation in the Processed Pseudogene is a Reflection of the Mutations Found in the Functional Gene. Hum. Mol. Genet. 1998, 7, 157–164. [Google Scholar] [CrossRef] [PubMed]
- Lam, C.; Krasnewich, D.M. PMM2-CDG. In GeneReviews® [Internet]; University of Washington: Seattle, 2021. [Google Scholar]
- Jaeken, J.; Lefeber, D.; Matthijs, G. Clinical utility gene card for: Phosphomannomutase 2 deficiency. European Journal of Human Genetics 2014, 22, 1054. [Google Scholar] [CrossRef] [PubMed]
- Pajusalu, S.; Vals, M.A.; Serrano, M.; Witters, P.; Cechova, A.; Honzik, T.; Edmondson, A.C.; Ficicioglu, C.; Barone, R.; De Lonlay, P.; et al. Genotype/Phenotype Relationship: Lessons From 137 Patients With PMM2-CDG. Human Mutation 2024, 2024, 8813121. [https://onlinelibrary.wiley.com/doi/pdf/10.1155/2024/8813121]. [CrossRef]
- Gámez, A.; Serrano, M.; Gallego, D.; Vilas, A.; Pérez, B. New and potential strategies for the treatment of PMM2-CDG. Biochim. Biophys. Acta Gen. Subj. 2020, 1864, 129686. [Google Scholar] [CrossRef]
- Yuste-Checa, P.; Gámez, A.; Brasil, S.; Desviat, L.R.; Ugarte, M.; Pérez-Cerdá, C.; Pérez, B. The Effects of PMM2-CDG-Causing Mutations on the Folding, Activity, and Stability of the PMM2 Protein. Hum. Mutat. 2015, 36, 851–860. [Google Scholar] [CrossRef]
- Vaes, L.; Rymen, D.; Cassiman, D.; Ligezka, A.; Vanhoutvin, N.; Quelhas, D.; Morava, E.; Witters, P. Genotype-Phenotype Correlations in PMM2-CDG. Genes 2021, 12, 1658. [Google Scholar] [CrossRef]
- Kjaergaard, S.; Skovby, F.; Schwartz, M. Absence of homozygosity for predominant mutations in PMM2 in Danish patients with carbohydrate-deficient glycoprotein syndrome type 1. European Journal of Human Genetics 1998, 6, 331–336. [Google Scholar] [CrossRef]
- Quental, R.; Moleirinho, A.; Azevedo, L.; Amorim, A. Evolutionary History and Functional Diversification of Phosphomannomutase Genes. J Mol Evol 2010, 71, 119–127. [Google Scholar] [CrossRef]
- Andreotti, G.; Cabeza de Vaca, I.; Poziello, A.; Monti, M.C.; Guallar, V.; Cubellis, M.V. Conformational Response to Ligand Binding in Phosphomannomutase2: INSIGHTS INTO INBORN GLYCOSYLATION DISORDER*. J. Biol. Chem. 2014, 289, 34900–34910. [Google Scholar] [CrossRef]
- Ji, T.; Zhang, C.; Zheng, L.; Dunaway-Mariano, D.; Allen, K.N. Structural Basis of the Molecular Switch between Phosphatase and Mutase Functions of Human Phosphomannomutase 1 under Ischemic Conditions. Biochemistry 2018, 57, 3480–3492. [Google Scholar] [CrossRef]
- Carithers, L.J.; Moore, H.M. The genotype-tissue expression (GTEx) project. Biopreservation and biobanking 2015, 13, 307. [Google Scholar] [CrossRef] [PubMed]
- Thul, P.J.; Lindskog, C. The human protein atlas: a spatial map of the human proteome. Protein Science 2018, 27, 233–244. [Google Scholar] [CrossRef] [PubMed]
- Wickham, H.; Averick, M.; Bryan, J.; Chang, W.; McGowan, L.D.; François, R.; Grolemund, G.; Hayes, A.; Henry, L.; Hester, J.; et al. Welcome to the tidyverse. Journal of Open Source Software 2019, 4, 1686. [Google Scholar] [CrossRef]
- Barrett, T.; Dowle, M.; Srinivasan, A.; Gorecki, J.; Chirico, M.; Hocking, T.; Schwendinger, B.; Krylov, I. data.table: Extension of `data.frame`, R package version 1.17.0; 2025. [Google Scholar] [CrossRef]
- Slowikowski, K. ggrepel: Automatically Position Non-Overlapping Text Labels with ’ggplot2’, R package version 0.9.6; 2024. [Google Scholar] [CrossRef]
- Pedersen, T.L. ggforce: Accelerating ’ggplot2’, R package version 0.4.2; 2024. [Google Scholar] [CrossRef]
- Consortium, U. UniProt: a worldwide hub of protein knowledge. Nucleic acids research 2019, 47, D506–D515. [Google Scholar] [CrossRef]
- Krokidis, M.G.; Koumadorakis, D.E.; Lazaros, K.; Ivantsik, O.; Exarchos, T.P.; Vrahatis, A.G.; Kotsiantis, S.; Vlamos, P. AlphaFold3: An Overview of Applications and Performance Insights. International Journal of Molecular Sciences 2025, 26, 3671. [Google Scholar] [CrossRef]
- Meng, E.C.; Goddard, T.D.; Pettersen, E.F.; Couch, G.S.; Pearson, Z.J.; Morris, J.H.; Ferrin, T.E. UCSF ChimeraX: Tools for structure building and analysis. Protein Science 2023, 32, e4792. [https://onlinelibrary.wiley.com/doi/pdf/10.1002/pro.4792]. [CrossRef]
- Krissinel, E.; Henrick, K. Inference of macromolecular assemblies from crystalline state. Journal of molecular biology 2007, 372, 774–797. [Google Scholar] [CrossRef]
- Xue, L.C.; Rodrigues, J.P.; Kastritis, P.L.; Bonvin, A.M.; Vangone, A. PRODIGY: a web server for predicting the binding affinity of protein–protein complexes. Bioinformatics 2016, 32, 3676–3678. [Google Scholar] [CrossRef]
- Pedersen, T.L. tidygraph: A Tidy API for Graph Manipulation; R package version 1.3.1, 2024. [Google Scholar] [CrossRef]
- Pedersen, T.L. ggraph: An Implementation of Grammar of Graphics for Graphs and Networks, R package version 2.2.1; 2024. [Google Scholar] [CrossRef]
- Ben Chorin, A.; Masrati, G.; Kessel, A.; Narunsky, A.; Sprinzak, J.; Lahav, S.; Ashkenazy, H.; Ben-Tal, N. ConSurf-DB: An accessible repository for the evolutionary conservation patterns of the majority of PDB proteins. Protein Science 2020, 29, 258–267. [Google Scholar] [CrossRef]
- Pires, D.E.; Ascher, D.B. mCSM-AB: a web server for predicting antibody–antigen affinity changes upon mutation with graph-based signatures. Nucleic acids research 2016, 44, W469–W473. [Google Scholar] [CrossRef] [PubMed]
- Rodrigues, C.H.M.; Pires, D.E.V.; Ascher, D.B. mmCSM-PPI: predicting the effects of multiple point mutations on protein–protein interactions. Nucleic Acids Res 2021, 49, W417–W424. [Google Scholar] [CrossRef] [PubMed]
- Huttlin, E.L.; Bruckner, R.J.; Navarrete-Perea, J.; Cannon, J.R.; Baltier, K.; Gebreab, F.; Gygi, M.P.; Thornock, A.; Zarraga, G.; Tam, S.; et al. Dual proteome-scale networks reveal cell-specific remodeling of the human interactome. Cell 2021, 184, 3022–3040. [Google Scholar] [CrossRef] [PubMed]
- Citro, V.; Cimmaruta, C.; Liguori, L.; Viscido, G.; Cubellis, M.V.; Andreotti, G. A mutant of phosphomannomutase1 retains full enzymatic activity, but is not activated by IMP: Possible implications for the disease PMM2-CDG. PLOS ONE 2017, 12, e0189629. [Google Scholar] [CrossRef]
- Monticelli, M.; Paris, D.; Monti, M.C.; Morretta, E.; Pakanova, Z.; Nemcovic, M.; Kodrikova, R.; Cubellis, M.V.; Andreotti, G. Beneficial effects of Glc-1, 6-P2 modulation on mutant phosphomannomutase-2. Biochimica et Biophysica Acta (BBA)-Molecular Cell Research 2025, 119948. [Google Scholar] [CrossRef]
Figure 1.
Human Phosphomannomutase 1 (PMM1, tan, UniprotID: Q92871) and 2 (PMM2, gold, UniprotID: O15305). a) Global pairwise alignment of the two paralogs using Needleman-Wunsch algorithm. (b) Structural overimposition of subunit crystal structures (2FUC for PMM1 and 7O4G for PMM2).
Figure 1.
Human Phosphomannomutase 1 (PMM1, tan, UniprotID: Q92871) and 2 (PMM2, gold, UniprotID: O15305). a) Global pairwise alignment of the two paralogs using Needleman-Wunsch algorithm. (b) Structural overimposition of subunit crystal structures (2FUC for PMM1 and 7O4G for PMM2).
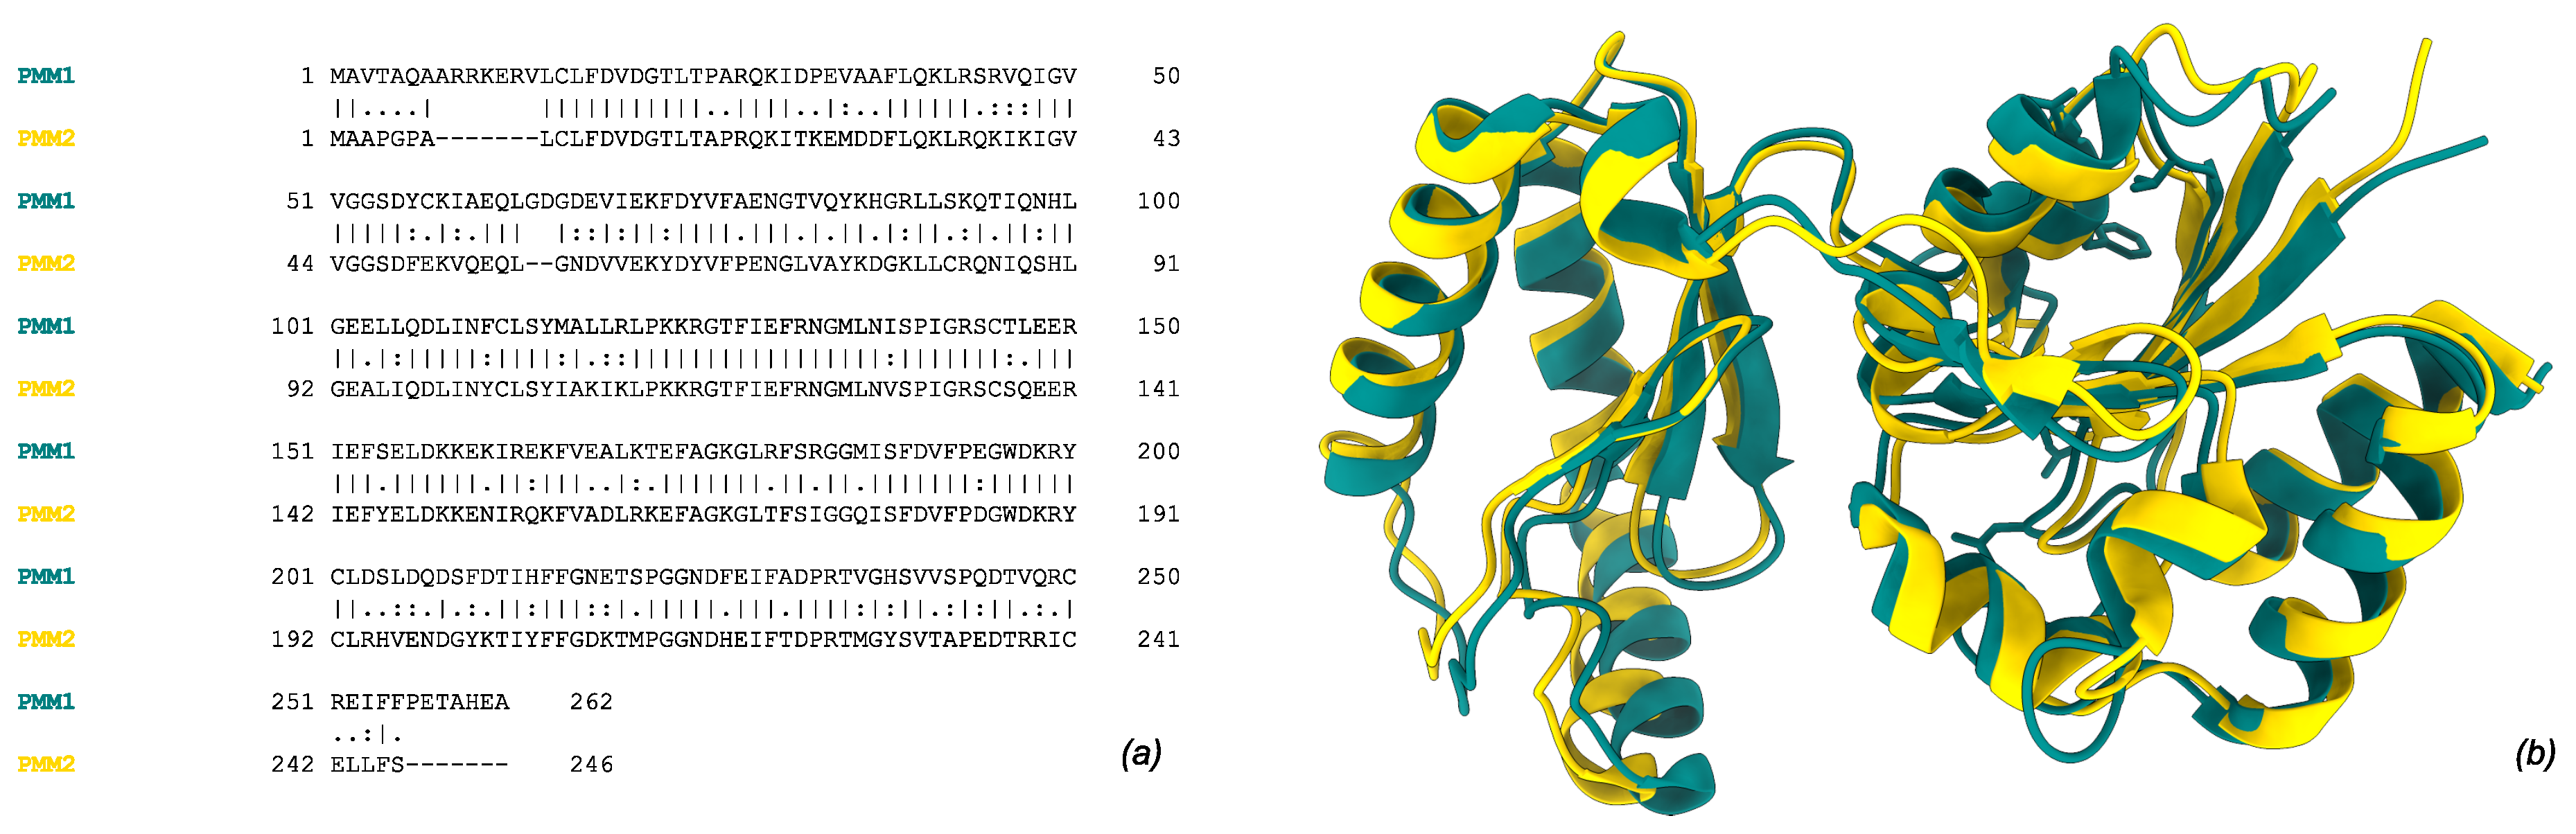
Figure 2.
PMMs expression levels across tissues. (a) Scatter plot of PMM1 vs PMM2 median transcript abundance (TPM) across GTEx tissues. Points associated to protein co-detection in the Human Protein Atlas (HPA) immunihistochemistry data are coloured in light blue. The red dashed line marks the TPM threshold used to define robust transcript-level expression. Brain tissues cluster is marked with a convex hull. Tissues with TPM > 10 for both genes and/or confirmed protein co-detection were labeled. (b) Violin plots of PMMs expressions across tissues.
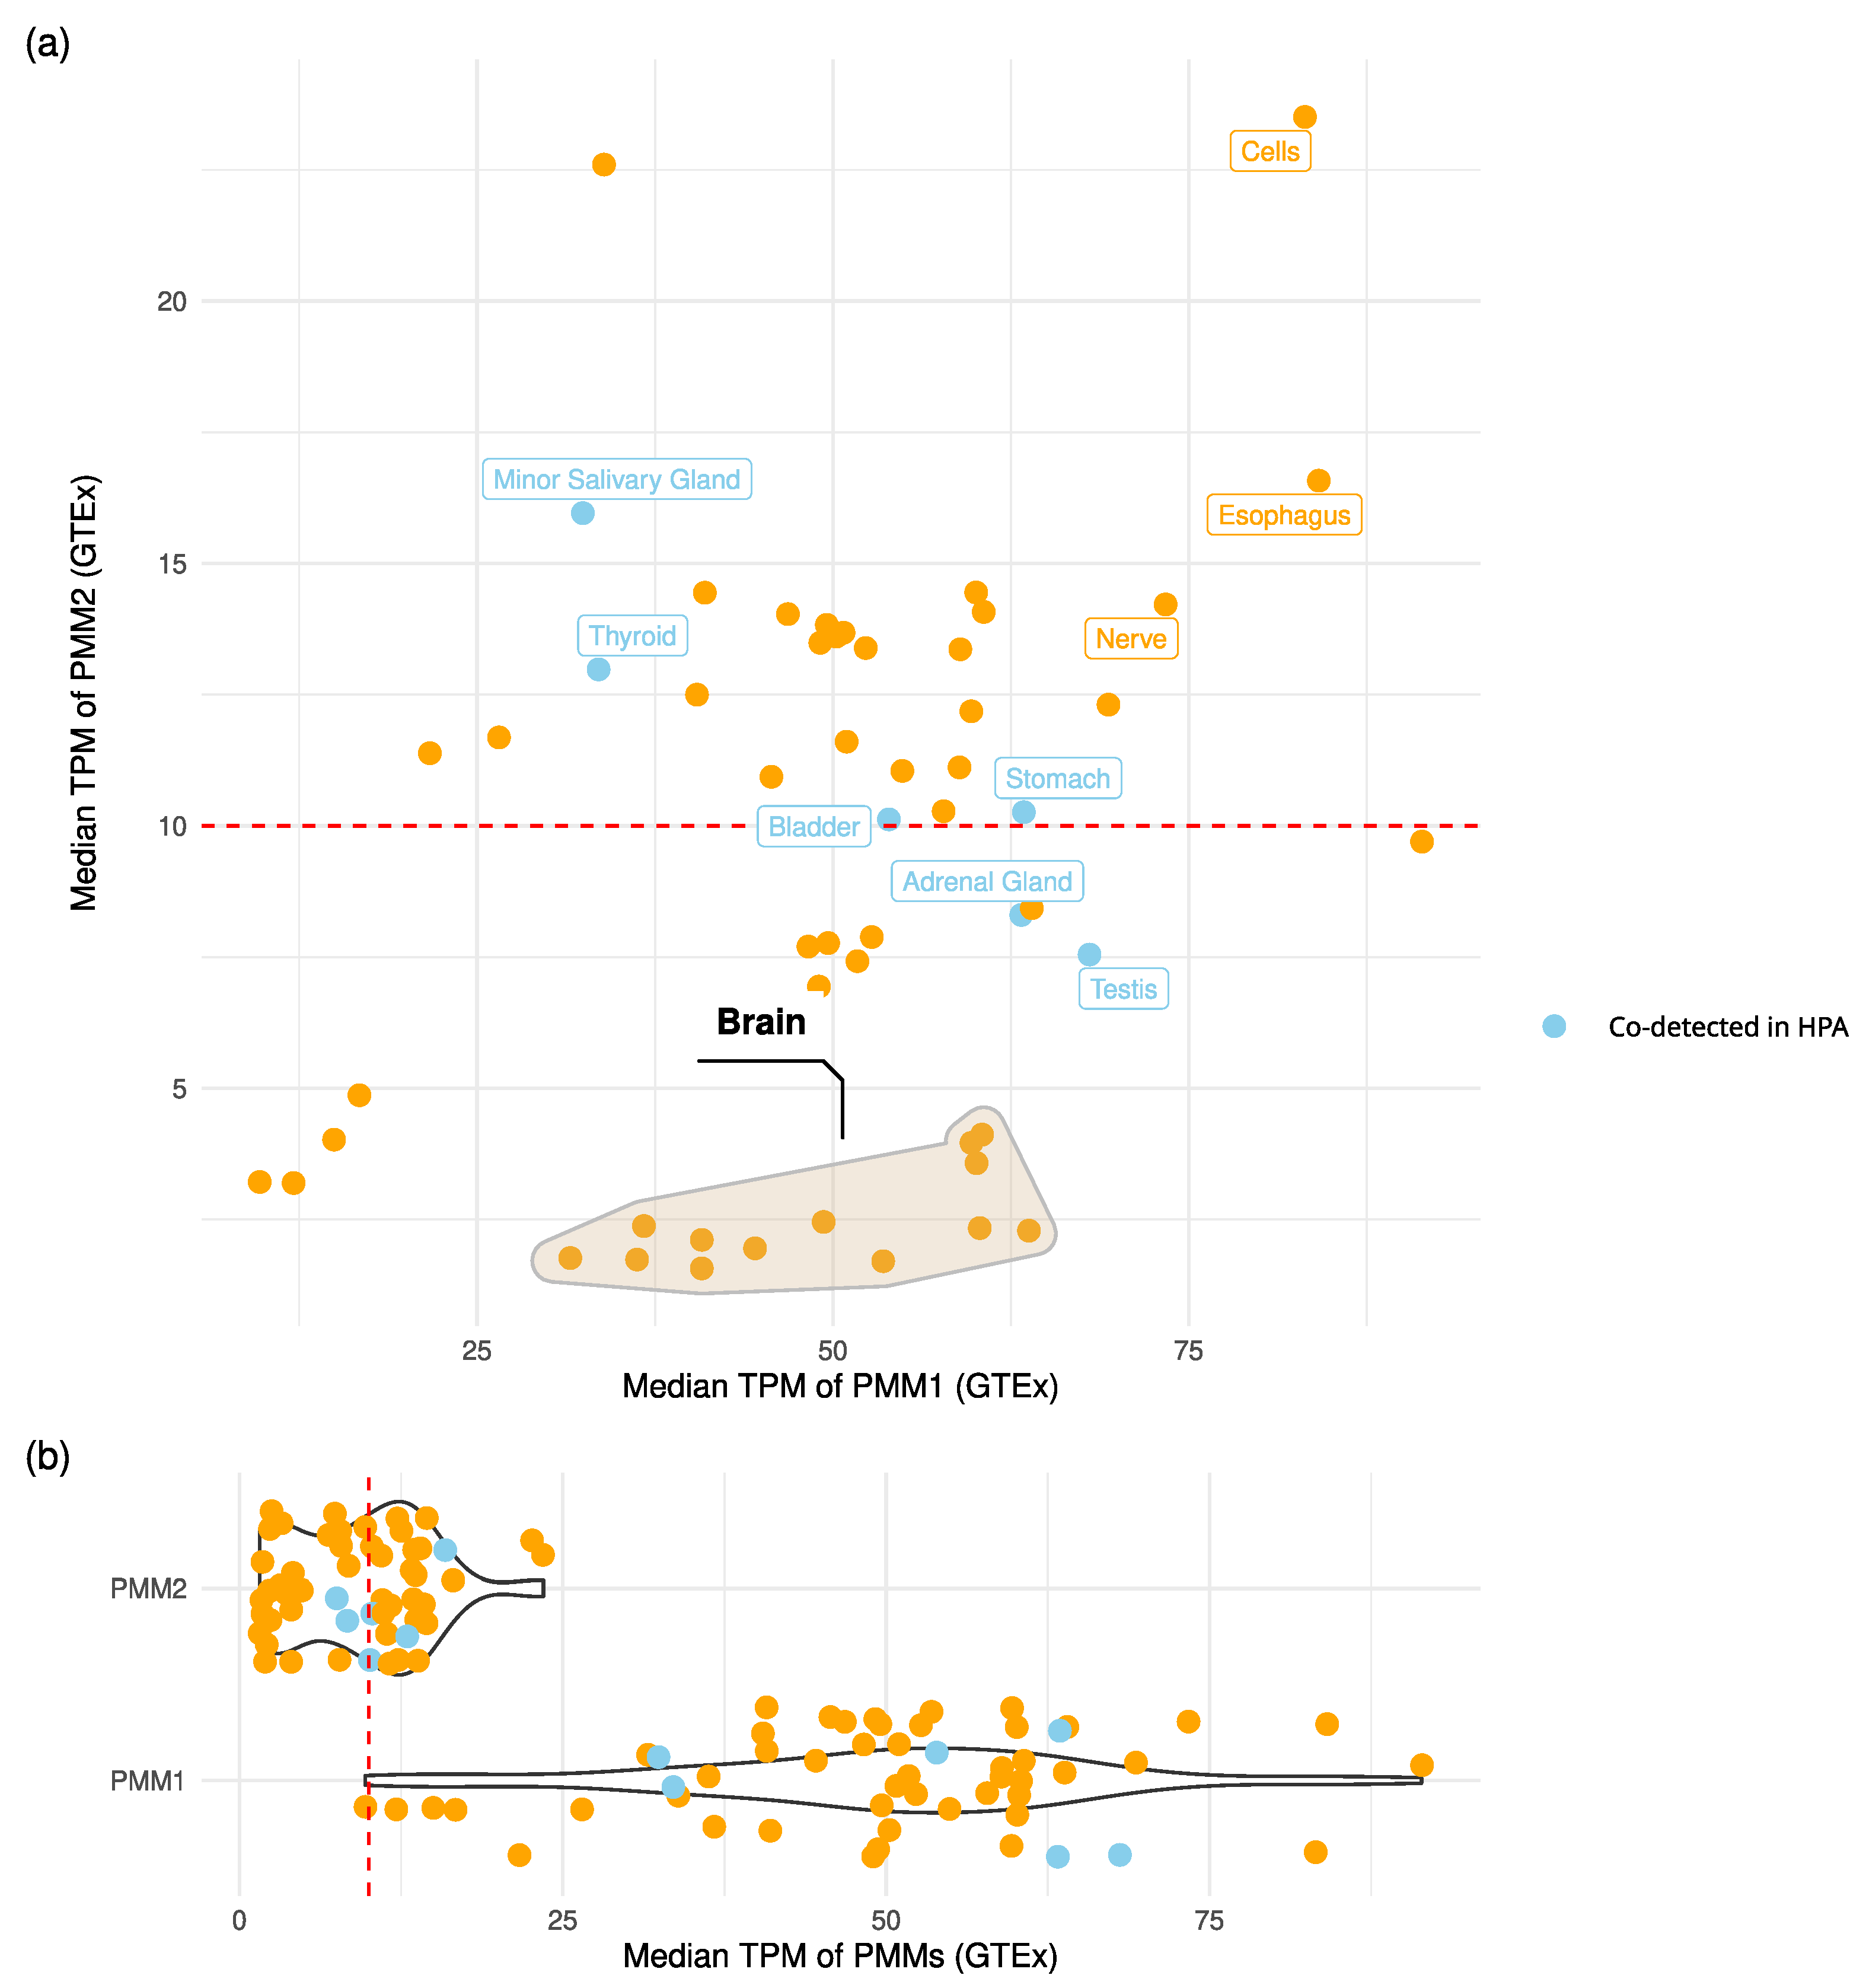
Figure 3.
Models of dimer structure produced by AlphaFold3 server. Each model is associated to its PAE matrix (blue: low PAE, yellow: high PAE) and to the detail of interacting residues spanning Å with predicted aligned error Å (interactions marked by thick red pseudobonds). (a) PMM1 homodimer, (b) PMM2 homodimer, (c) PMM1/PMM2 heterodimer.
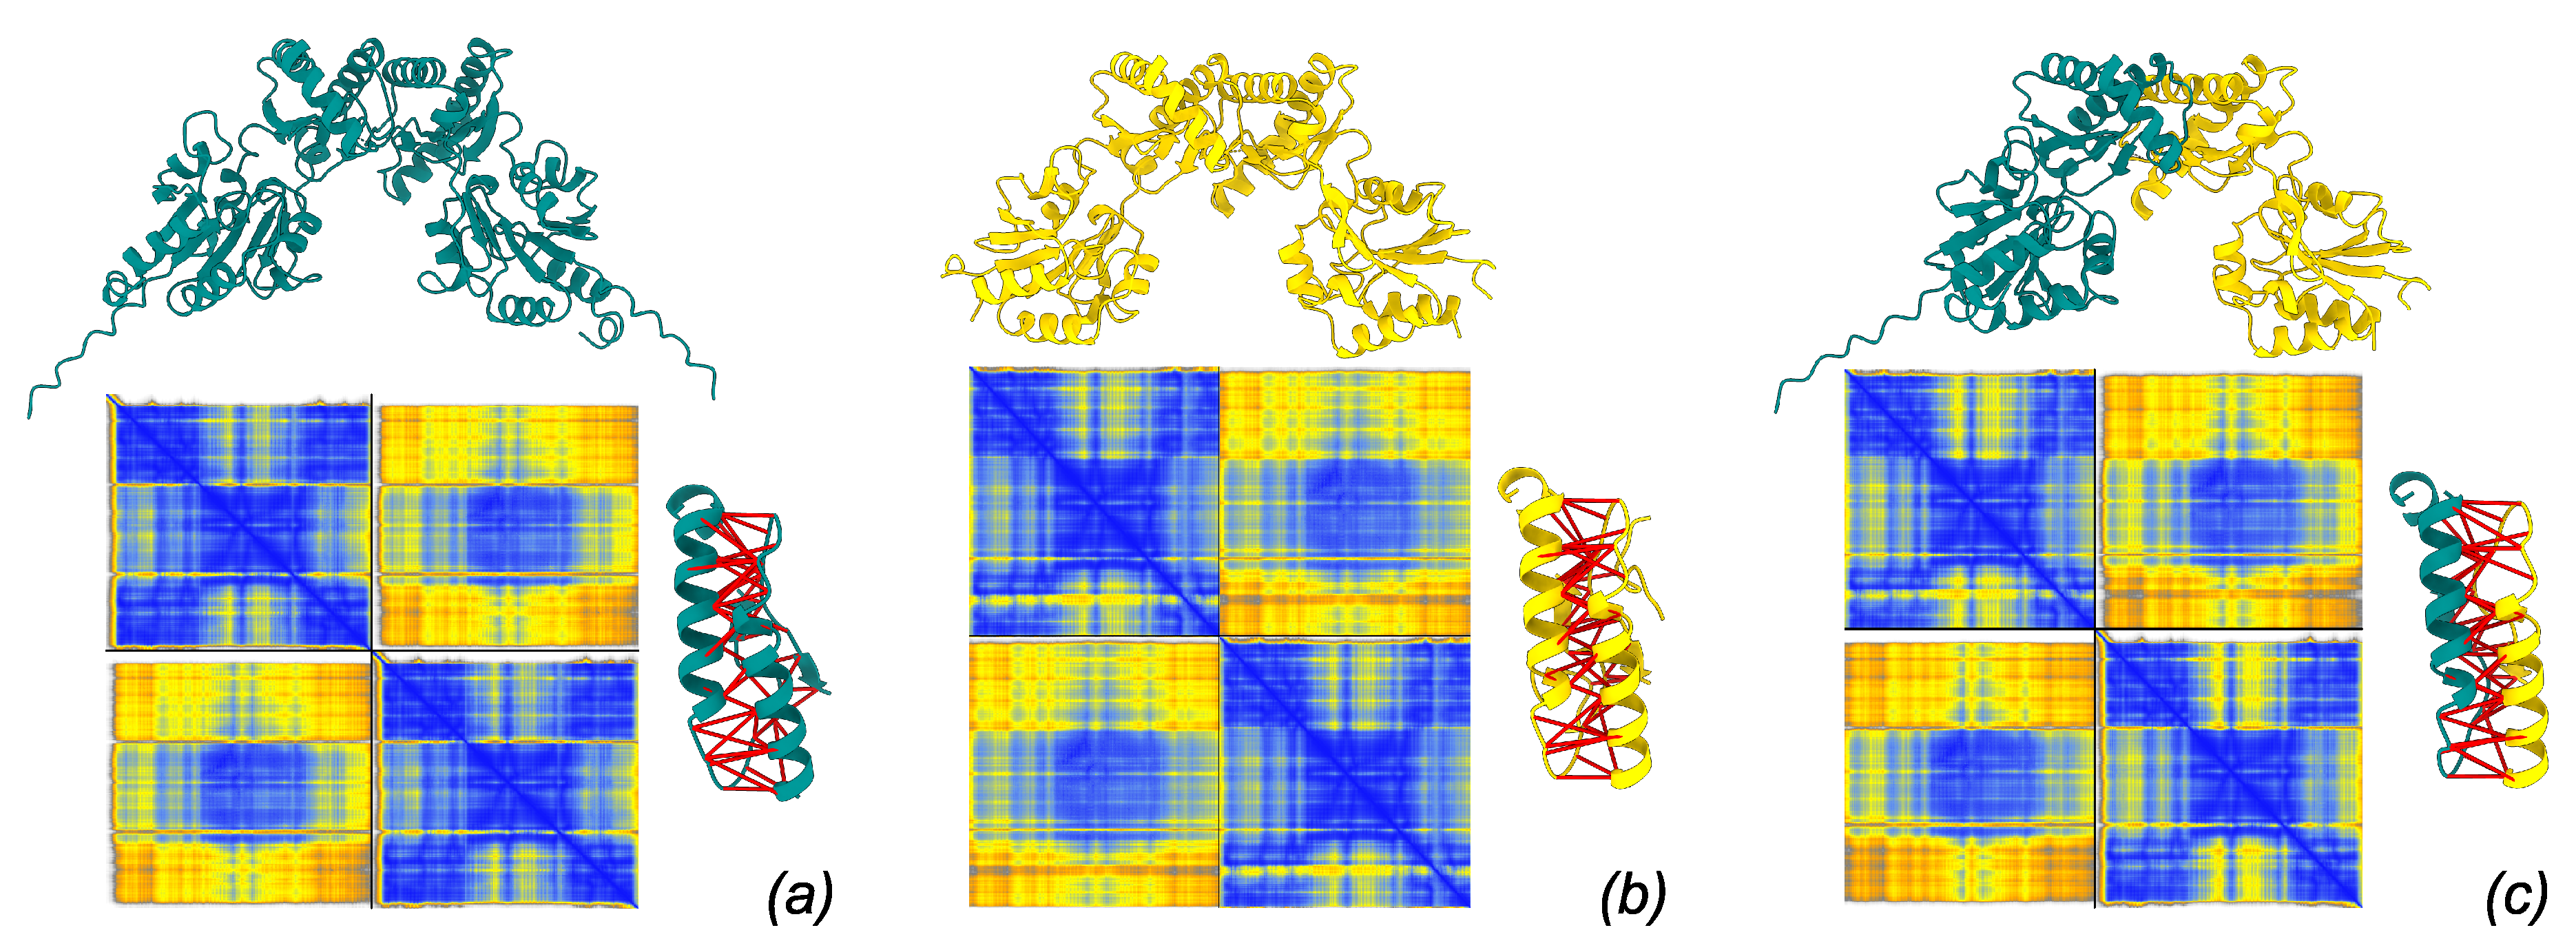
Figure 4.
Comparison of interface composition and stability across the possible PMM dimers. For each dimer, the interface is shown as cartoon and residues involved in the formation of most prominent salt bridges are displayed as sticks. Data from PISA analysis are reported in figure.
Figure 4.
Comparison of interface composition and stability across the possible PMM dimers. For each dimer, the interface is shown as cartoon and residues involved in the formation of most prominent salt bridges are displayed as sticks. Data from PISA analysis are reported in figure.
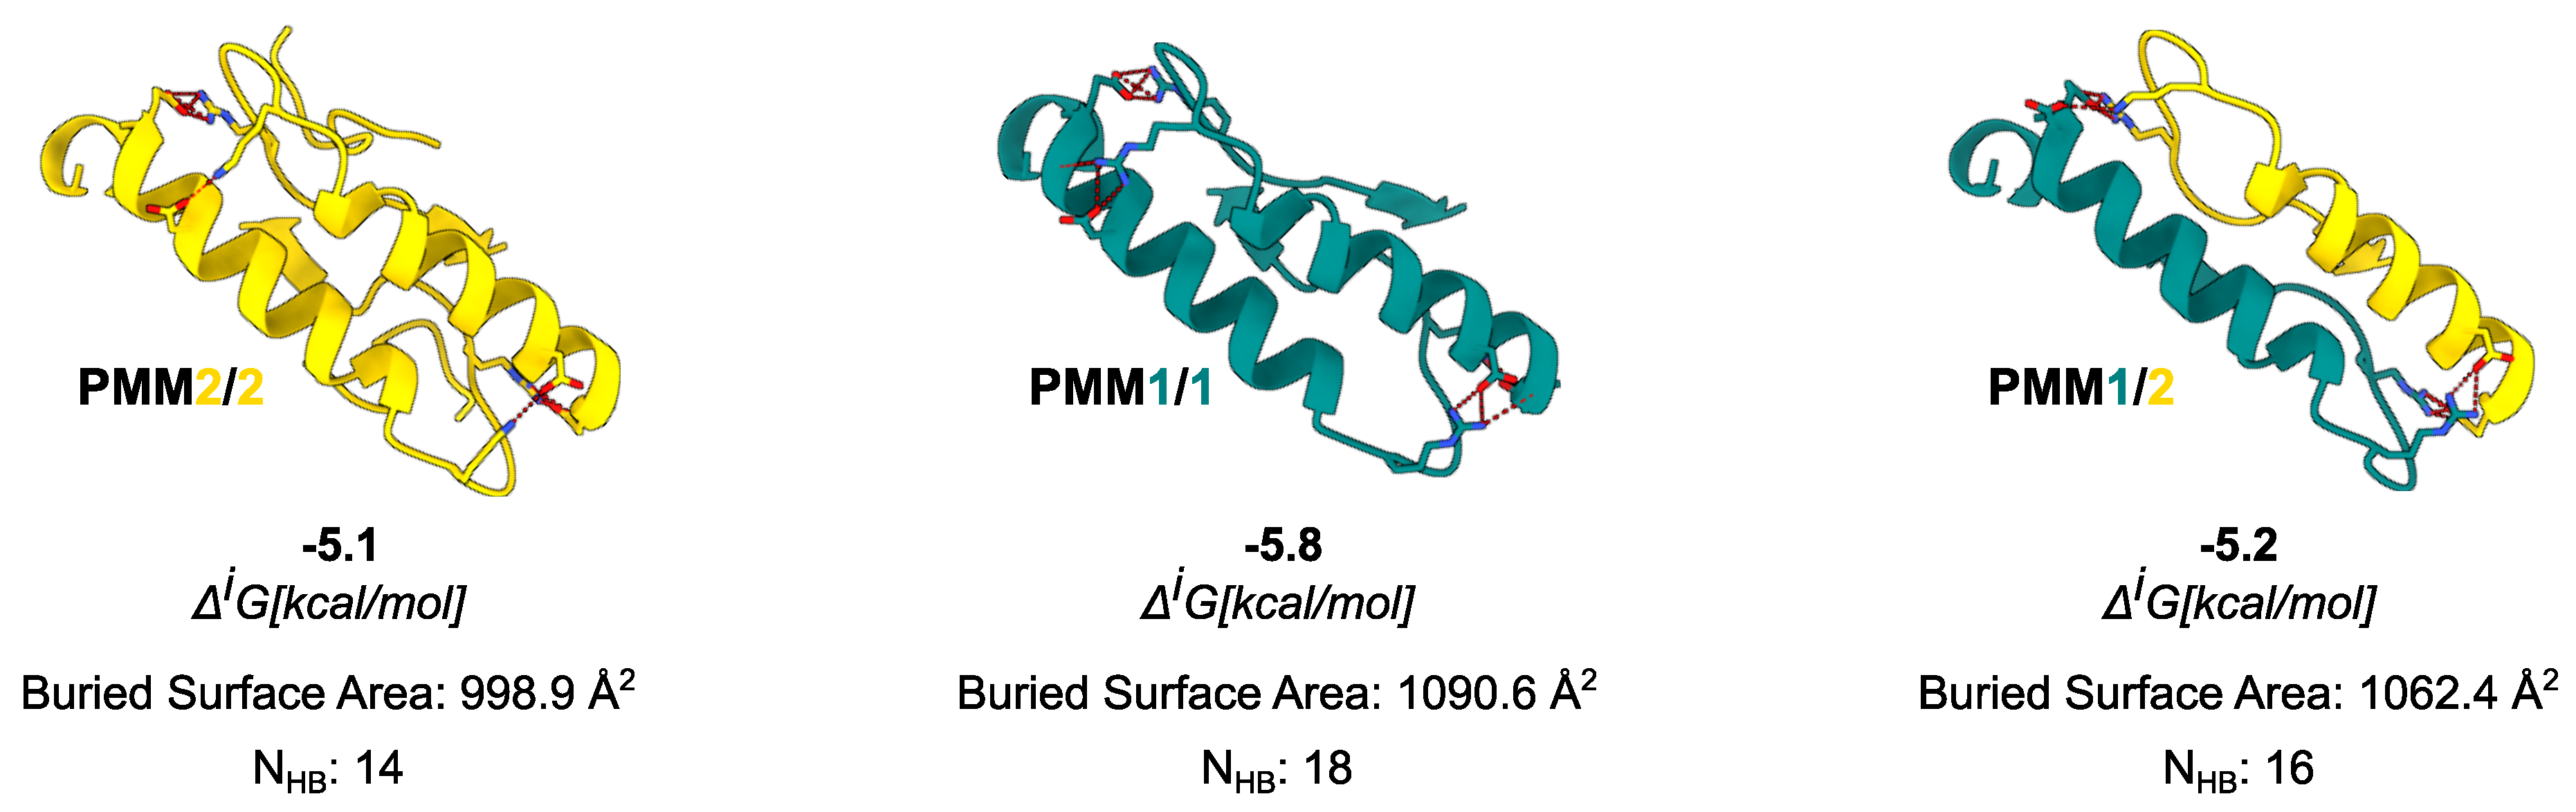
Figure 5.
Left: Comparison of predicted values calculated using mmCSM-PPI. Colors indicate mutation classification while marker shape denotes presence (×) or absence (∘) of each variant in population datasets (gnomAD). Muted red shading marks the region of significant destabilization ( > 2 kcal/mol). Right: Structural representation of the PMM2 dimer interface. Interface residues are shown as surfaces and colored according to their clinical annotation status in ClinVar, and labeled based on UniProt residue numbering. Residues are classified as follows: never associated (not reported in ClinVar), pathogenic (at least one variant at that position is labeled pathogenic), and uncertain (only variants of uncertain significance reported). Coloring reflects these categories as described in the legend.
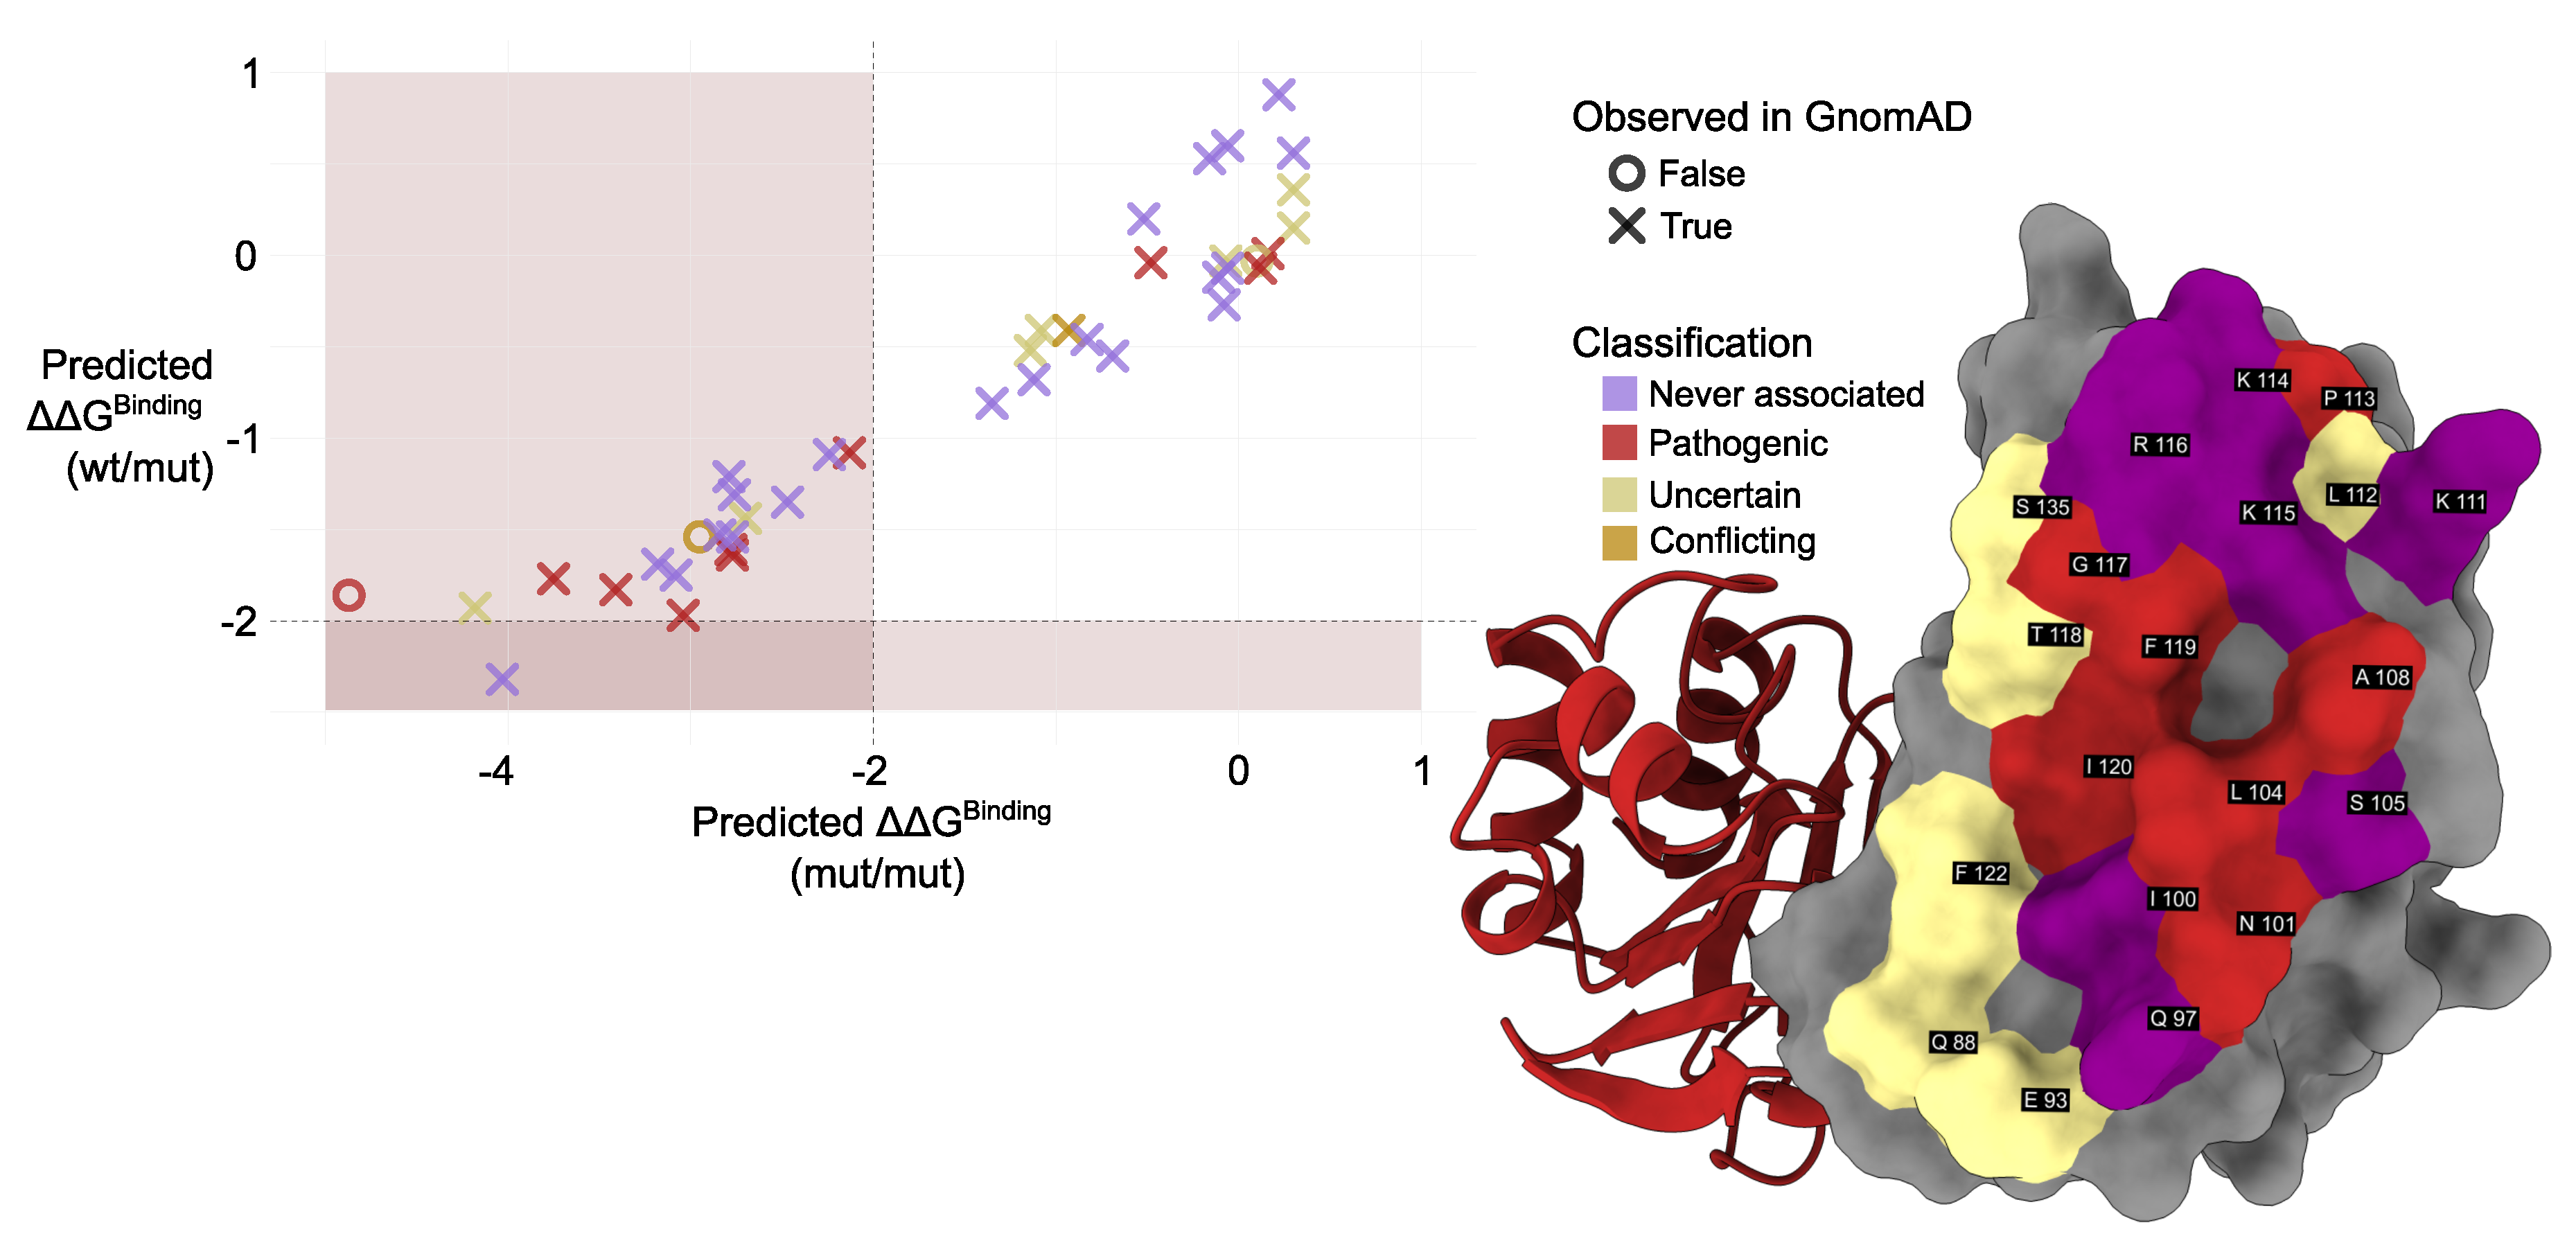
Figure 6.
Analysis of contacts at the interface for the PMM1 homodimer (a), the PMM1/PMM2 heterodimer (b), and the PMM2 homodimer (c).
Figure 6.
Analysis of contacts at the interface for the PMM1 homodimer (a), the PMM1/PMM2 heterodimer (b), and the PMM2 homodimer (c).
Disclaimer/Publisher’s Note: The statements, opinions and data contained in all publications are solely those of the individual author(s) and contributor(s) and not of MDPI and/or the editor(s). MDPI and/or the editor(s) disclaim responsibility for any injury to people or property resulting from any ideas, methods, instructions or products referred to in the content. |
© 2025 by the authors. Licensee MDPI, Basel, Switzerland. This article is an open access article distributed under the terms and conditions of the Creative Commons Attribution (CC BY) license (http://creativecommons.org/licenses/by/4.0/).
Copyright: This open access article is published under a Creative Commons CC BY 4.0 license, which permit the free download, distribution, and reuse, provided that the author and preprint are cited in any reuse.


