Submitted:
01 May 2025
Posted:
02 May 2025
You are already at the latest version
Abstract
Southwest China, a global biodiversity hotspot, plays a vital role in carbon sequestration and ecological restoration through its forest ecosystems. This study systematically evaluated changes in carbon stocks and their driving factors in Pinus kesiya forests in southwestern Yunnan Province, before and after the implementation of the Grain for Green Programme (GFGP) from 1999 to 2016. The research combined remote sensing technology, geographic information systems (GIS), and field surveys to achieve a comprehensive analysis. The results indicated that the GFGP significantly increased both the area and carbon stocks of Pinus kesiya forests, adding 15.97 TgC to the carbon stock, with an error margin of 4.84 TgC. This increase was primarily driven by the conversion of shrubland and farmland. Forest age emerged as a key factor influencing carbon density, which increased significantly at a rate of 4.24 Mg/ha per year. Furthermore, carbon stock distribution varied notably across different slopes and elevations, with the greatest increases observed on slopes greater than 6° and at elevations between 1000 and 1600 meters. This study innovatively integrated forest age data into land use and cover change analyses, improving the accuracy of regional carbon stock estimates. The findings highlight the GFGP’s effectiveness in promoting regional carbon sequestration and enhancing ecosystem services. However, future policies should focus on planting mixed-species forests to further enhance biodiversity. This research provides valuable scientific evidence for optimizing ecological restoration policies and offers a reference for similar restoration projects worldwide.
Keywords:
Pinus kesiya
; carbon stock
; grain for green programme
; forest age
1. Introduction
Forest ecosystems cover approximately 30% of the Earth’s land surface [1]. Global forest carbon stocks, including live biomass, soil, dead wood, and litter, amount to about 861 ± 66 petagrams (Pg), representing 45% of carbon in terrestrial ecosystems [2,3]. Forest ecosystems act as vital carbon sinks in terrestrial ecosystems, playing a key role in stabilizing the global carbon cycle [4]. Reforestation and afforestation are two effective strategies for mitigating the impacts of climate change and enhancing global carbon sequestration [5,6]. However, the potential of afforestation and reforestation to significantly reduce greenhouse gases remains uncertain [7,8]. Accurately estimating the carbon sequestration potential of afforestation and reforestation is essential. Estimating regional carbon stocks remains highly uncertain. While afforestation and reforestation capture carbon dioxide and store it in biomass and soil, deforestation and forest degradation—caused by land use changes and forest fires—are major sources of carbon emissions [9,10,11]. The complex interaction between reforestation and deforestation creates significant uncertainty in estimating regional forest carbon stocks. Currently, three main approaches are used to calculate these stocks [12].
(i) Field data on forest types and ages are used as model inputs to estimate carbon stocks at national and regional scales [4,13].
(ii) Regional carbon stock is calculated by multiplying forest area by the average carbon density of the forest types, as demonstrated by the Forest Identity Concept [14].
(ii) Empirical field data and remote sensing data are combined at the pixel scale to estimate carbon stocks from regional to global scales [15].
Although land use and land cover data are commonly used to assess regional carbon stocks, studies have highlighted significant limitations in this approach [16]. The main limitation of this approach is the frequent lack of forest age data [17]. Little research has focused on integrating forest age data into land use and land cover maps to estimate regional carbon stocks. Launched in 1999, China’s Grain for Green Programme (GFGP) is the world’s largest ecological restoration initiative [18]. From 1999 to 2013, the program converted 9.27 million hectares of cultivated land with slopes over 15 degrees into forest or grassland [19]. China’s Grain for Green Programme (GFGP) has greatly reduced soil erosion and increased vegetation cover, while enhancing ecosystem services such as carbon sequestration, flood control, sandstorm prevention, water retention, and food production [20]. However, the Grain for Green Programme (GFGP) has posed challenges to habitat quality, particularly by planting non-native or monoculture tree species on former croplands. The impact of these practices on carbon stocks in secondary forest regrowth remains largely unknown, highlighting a significant knowledge gap in fully assessing the program’s ecological impact [21].Pinus kesiya, a key species in warm coniferous forests, is widely distributed across the Indochina Peninsula, the Philippines, northeastern India, and southern Yunnan Province, China [12,22,23]. Pinus kesiya was widely planted in Yunnan Province under the GFGP for ecological and economic benefits, including biodiversity protection, carbon sequestration, and water and soil conservation [24,25]. However, Pinus kesiya forests face challenges such as low productivity, as well as threats from diseases and pests, which reduce biomass production. In Puer, Yunnan Province, the average biomass production of Pinus kesiya forests is only 51.06 Mg/ha/yr [26]. Some previous studies have used satellite images to map the carbon density distribution of Pinus kesiya forest [27]. However, those studies focused on improving algorithms, and their study areas were too small to represent the regional carbon stock of Pinus kesiya forests. Research on the temporal and spatial changes in carbon stocks of Pinus kesiya forests remains limited. South-western Yunnan is one of the main biodiversity hotspots in the world [28], and the main distribution area of tropical flora and Pinus kesiya forest in China [29]. Therefore, SW Yunnan is selected as the study area for the present analysis. The first phase of GFGP ran for 1999 to 2010 [24], Some farmland was also converted to forest between 2010 and 2015. In this study, we used Landsat satellite data to map land use in southwest Yunnan for 1999, 2009, and 2016. These maps were then used to evaluate changes in the carbon stock of planted Pinus kesiya forests during the first phase of the GFGP (1999–2009) and the subsequent period (2009–2016). The study aimed to estimate carbon stock accumulation in Pinus kesiya forests in southwest Yunnan under the GFGP. The specific objectives were to:
(i) Map the distribution of Pinus kesiya forests since the implementation of the GFGP in 1999;
(ii) Conduct a field survey to assess changes in carbon density of Pinus kesiya forests with increasing age;
(iii) Combine forest age data of Pinus kesiya planted under the GFGP, inferred using GIS technology, with forest distribution data to estimate carbon stock accumulation since the program’s introduction.
This study utilizes GIS to overlay multi-temporal Landsat land-use maps, which allows us to generate reforestation time-series data and reconstruct the spatial distribution of forest age. By incorporating in-situ carbon density measurements, we develop a model that links forest age to carbon density growth, quantifying the linear growth pattern of carbon density over time.
Using Landsat imagery from TM/OLI sensors, we produce 30-meter resolution land-use maps (Kappa coefficient > 0.84) to accurately monitor the expansion of Simao pine forests. We apply the Teillet topographic correction method to eliminate interference from mountain shadows, and integrate GDEMV2 data to investigate how slope and elevation jointly affect carbon storage. Allometric growth equations for Simao pine components—trunk, branches, leaves, and roots—are established using standard tree measurements, thus avoiding errors that may arise from using parameters specific to other regions.
Importantly, we integrate forest age dynamics and spatial heterogeneity to create a “time-space-attribute” 3D carbon storage estimation framework. This approach addresses the limitations of static assumptions found in traditional methods, which often overlook the impact of forest age. Moreover, it offers a reusable methodological paradigm for assessing carbon sinks in similar ecological projects, such as the GFGP.
2. Material and Methods
2.1. Study Area
The study area is located in southwestern Yunnan Province, China (Figure 1), covering coordinates from 21°08′N to 25°02′N and 98°40′E to 102°19′E. It includes 21 counties and three cities: Lincang, Puer, and Xishuangbanna. The region borders Myanmar, Laos, and Vietnam to the south, and is bounded to the north by the Ailao, Wuliang, and southern Nushan Mountains. The Lancang River runs through the center, while the Amo River flows eastward into Vietnam, and the Nanding River flows westward into Myanmar. The climate is influenced by the southwest monsoon from the Indian Ocean, resulting in two distinct seasons: a rainy season (May–October) and a dry season (November–April). The mean annual temperature ranges from 17.5°C to 22.9°C, and annual precipitation varies from 620 mm to 1917 mm The region hosts three main vegetation ty. pes: tropical rainforests at lower elevations in the south, subtropical evergreen broadleaf forests across the middle, and warm-hot coniferous forests at higher elevations.
2.2. Mapping Pinus kesiya Forest
We acquired Landsat images and GDEMV2 data with 30 m spatial resolution from the USGS website (https://www.usgs.gov/). Landsat TM images from 1999 and 2009 were used to analyze forest cover changes during the first phase of the GFGP, while a Landsat OLI image from 2016 was used to assess changes after the first phase. A total of 10 Landsat image scenes were used for each period (Table 1). Image preprocessing was conducted in ENVI 5.3 using the FLAASH module and Teillet topographic correction to minimize atmospheric effects and topographic shadows. The images were classified into six land use types: other forest, coniferous forest, shrubland, farmland, construction land, and water, using the maximum likelihood classification algorithm. Field survey data and visual interpretation were applied to evaluate the accuracy of the land use maps. In June 2016, 426 GPS points of land use types were collected through field surveys. Additionally, we randomly generated 971, 849, and 756 points for visual interpretation in 1999, 2009, and 2016, respectively. The Kappa coefficients for the land use maps were 0.84 (1999), 0.87 (2009), and 0.88 (2016), indicating high classification accuracy.
2.3. Carbon Density of Pinus kesiya Forest
A total of 44 Pinus kesiya forest plots of varying ages were sampled in the cities of Puer and Lincang. Each plot measured 20 m × 50 m. For each plot, geographical coordinates, elevation, slope, aspect, forest age, and successional stage were recorded. Additionally, the diameter at breast height (DBH) and species were measured for all trees with a DBH > 5 cm.
We applied a power function (Equation (1)) to calculate total biomass per plot and the biomass of individual tree components, including stems, branches, leaves, and roots. To establish the power function, we selected 17 standard Pinus kesiya trees of varying ages. The ages of these trees were primarily obtained from statistics provided by the local forestry bureau, as well as through coring methods that count tree rings. For each standard tree, the fresh weight of its components was measured, portions of fresh components were weighed, and samples were taken to the laboratory to determine dry weight. The fresh and dry weights were then used to calculate the tree component biomass ratio as: [30,31]
where W is biomass, D is diameter at breast height, and a and b are scaling coefficients for tree component i (Table 1).
We used the optimum regression model to estimate the tree component biomass of evergreen broadleaf forest. For instance, studies have shown that the biomass of various components of Pinus kesiya var. langbianensis can be effectively estimated using optimal regression models. These models better capture the complexity of tree species across different ecological environments and growing conditions [32].
In each tree plot, three shrub subplots (2 m × 2 m) and three herbage subplots (1 m × 1 m) were randomly selected to estimate understory plant biomass. For each plant in the subplots, we recorded species, plant count, height, and coverage. Using the destructive harvesting method, we collected fresh weight samples of shrub components (branches, leaves, and roots) and herbaceous components (aboveground and belowground parts). These samples were then transported to the laboratory for biomass determination. In each sample plot, a litter subplot (1 m × 1 m) was randomly selected. All litter in the subplot was weighed and transported to the laboratory for biomass determination. Additionally, coarse woody debris (CWD) with a diameter ≥ 5 cm and a length ≥ 1 m was weighed in the sample plots, and samples were taken to the laboratory for CWD biomass estimation. The carbon content variation among different parts of trees is not significant, as detailed in Table 2. In the plots in this study, the carbon content rates of stems was 0.52, branches 0.50, leaves 0.51, roots 0.53, shrubs 0.50, herbage 0.50, litter 0.50, CWD 0.5, and broadleaf trees 0.45 [30]. The carbon density of different components was calculated from the biomass of the component and its carbon content:
where Ci is carbon density of tree component i, W is biomass of component i, and R is the carbon content.

Table 2.
Biomass model developed for Pinus kesiya.
| Biomass component | Biomass model | Carbon conversion coefficient |
| Stem | WS=0.0808 D2.5374 | 0.52 |
| Branches | WB=0.0007 D3.4663 | 0.50 |
| Leaves | WL=0.0015 D2.504 | 0.51 |
| Roots | WR=0.0023 D3.0644 | 0.53 |
Here, C represents the carbon stock in each Pinus kesiya forest sample plot, while Ci denotes the carbon density of component ii within these plots, including stems, branches, leaves, roots, shrubs, herbaceous plants, litter, coarse woody debris (CWD), and broadleaf trees.
2.4. Estimating Carbon Stock in Pinus kesiya Forest
The Forest Identity Concept is widely used to estimate regional carbon stock (M). It consists of two independent variables, forest area (A) and carbon density (C):
Because forest area and carbon density change over time, modified Equation (4) to: [4]
The change in forest carbon stock over time is then:
Since the aim in this study was to estimate carbon stock accumulation after GFGP, only ΔAt and ∆Ct in the context of growth will lead to carbon stock accumulation. The distribution and area growth change were estimated by land use maps, which were overlapped by land use/land cover maps in different periods using ArcGIS10.3. The planted growth forest age range was then inferred from the difference over time in land use layers. Therefore forest age range, area, and distribution were inferred by GIS technology. Carbon density values measured in the field survey were classified on the basis of the forest age.
2.5. Correlation Between Carbon Stock and Topography
In order to analyze the impact of topographical factors on carbon stocks, slope and elevation were selected as variables. Differences in slope and elevation at county level were analyzed by paired T test (using R) for three periods (1999-2009, 2009-2016, and 1999-2016). The increase in carbon stock at county scale was calculated from the increase in area of Pinus kesiya forest between two periods and the carbon density. The slope and elevation in two periods were divided into five and seven classes, respectively, based on the GDEMV2 data (30 m × 30 m). The slope (S) classes were: < 2° (S1), 2° - 6° (S2), 6° - 15° (S3), 15° - 25° (S4), and > 25° (S5) (Sun et al. 2006). Because the elevation range 850 - 1850 m is best suited for Pinus kesiya forest growth (Wu et al. 1987), the elevation (E) classes were < 800 m (E1), 800 - 1000 m (E2), 1000 - 1200 m (E3), 1200 - 1400 m (E4), 1400 - 1600m (E5), 1600 - 1800 m (E6), and 1800 - 2000 m (E7). We used forest age and carbon density to estimate the carbon stock for the five slope classes and seven elevation classes at county level.
3. Results
3.1. Pinus kesiya Forest MAPPING
Pinus kesiya forest areas expanded following the implementation of the GFGP. The land use transformation matrix (Table 3) indicates that shrubland and farmland were the primary land types converted to forest. Between 1999 and 2009, shrubland was the predominant type transformed into Pinus kesiya forests and other forest types, with increases of 3050.93 km² and 1742.12 km², respectively. From 2009 to 2016, both shrubland and farmland continued to be the main sources for conversion, leading to an increase of 521.27 km² in Pinus kesiya forests and 2018.64 km² in other forests.
Forests established under the GFGP were primarily located in the mountainous regions of Puer City, eastern Lincang City, and northern Xishuangbanna City. Pinus kesiya forests planted between 1999 and 2009 were situated east of the Lancang River, extending toward the Ailao Mountains. In contrast, forests established from 2009 to 2016 were mainly concentrated in the central area, between the Nushan and Ailao Mountains (Figure 2).
3.2. Carbon Density at Different Forest Ages
The carbon density of Pinus kesiya forests increased significantly with advancing forest age (p < 0.01), at a rate of 4.24 Mg/ha/year. Both the tree and litter layers showed increasing trends in carbon density, while the shrub layer (p = 0.0696) and herbage layer (p < 0.01) exhibited significant decreases with forest age. The carbon density varied among different tree components. Stems accounted for 70.67% of the increase, contributing 2.99 Mg/ha/year out of a total of 4.06 Mg/ha/year (p < 0.01). Branches and roots contributed 13.32% (0.51 Mg/ha/year) and 2.73% (0.55 Mg/ha/year), respectively (p < 0.01). Leaves, which contributed 13.28% to the overall carbon density increase, showed no significant relationship with forest age (p > 0.1; Figure 3).
3.3. Carbon Stock Changes in Pinus kesiya Forest Planted Under GFGP
The area of Pinus kesiya forest increased by 3767.19 km² between 1999 and 2016, accumulating an additional 15.97 ± 4.84 TgC (Figure 4). From 1999 to 2009, 2878.79 km² of shrubland and farmland were converted to Pinus kesiya forest, contributing 6.99 ± 2.66 TgC to the carbon stock. From 2009 to 2016, 2031.63 km² of shrubland and farmland were converted, adding 4.45 ± 1.94 TgC, along with an additional 11.52 ± 2.90 TgC from the growth of 1735.57 km² of forests planted between 1999 and 2009. As a result, Pinus kesiya forests accumulated 15.97 ± 4.84 TgC between 2009 and 2016.Hotspots of increased carbon density in Pinus kesiya forests were observed in Puer City, the mountainous areas of Lincang City, and the northern part of Xishuangbanna City (Figure 5). The carbon stock contribution of Pinus kesiya forests in Puer City was 76.01% during 1999–2009 and 77.74% during 2009–2016. For Lincang City, the contributions were 22.38% and 21.81%, respectively, while for Xishuangbanna City, they were 1.61% and 0.45%. Therefore, Puer City was the largest contributor to the increase in carbon stocks in Pinus kesiya forests in southwestern Yunnan.
3.4. Carbon Stock Accumulation in Forest on Different Slope and Elevation Classes
The distribution of carbon stock accumulation varied between the different slope and elevation classes. Carbon stock accumulation was much higher on slopes > 6° (classes S3 - S5) than on lower slopes (Table 4), and was also greater for slopes of 15 - 25° (class S4) than slopes 6 - 15° and > 25° (Figure 6). The carbon stock accumulation was also higher at elevation from 1000 to 1600 m (classes E3 - E5) than at other elevations (5), and was also greater at elevation 1200 - 1400 m (class E4) than at 1000 - 1200 m and > 1400 m (Figure 6).
If the area of planted growth Pinus kesiya forest remained unchanged after 2016, under this assumption the carbon stock in planted Pinus kesiya forests would increase to 23.5 ± 9.14 Tg in 2024 and 33.86 ± 11.25 Tg in 2032 (Figure 7). This means that the carbon storage in Pinus kesiya forests planted within GFGP will peak in 2034-2049. Therefore, the amount of carbon sequestered will be higher than the amounts estimated without considering forest age after GFGP. With increasing forest age and carbon density, there will be more carbon stocks in Pinus kesiya forest in the future.
4. Discussion
4.1. Impact of GFGP on Regional Carbon Stocks
This analysis revealed that the implementation of the Grain for Green Programme (GFGP) in southwestern Yunnan, China, resulted in a significant increase in carbon stocks within Pinus kesiya forests, amounting to 15.97 ± 4.84 Tg by 2016. Within the GFGP framework, a substantial portion of shrubland (42.78%) and farmland (24.50%) were successfully converted into forest areas, including Pinus kesiya and other forest types. The Pinus kesiya forests were able to store more carbon than the former shrubland and farmlands, which were the main land uses targeted by GFGP. Therefore, converting areas of farmland or shrubland to forest within GFGP increased regional carbon stocks [34]. An additional target of GFGP was to convert farmland on slopes > 25° to forest or grassland [19]. We found that 63.97% of Pinus kesiya forests planted during 1999 to 2016 were distributed on slopes from 15° to more than 25°. Conversion of sloping farmland and shrubland to forest, increased forest area, and development of forest community structures not only improved carbon stocks in sloping areas, but also enhanced other ecosystem services, like reduced soil erodibility [35]. However, in 2016 37.88% and 18.55% of farmland in the study region was still distributed on land with slope 15 - 25° and > 25° respectively, indicating greater potential for future GFGP. Although our results showed increased forest cover and increased regional carbon stocks, as also reported on national level for the whole of China under GFGP [20], we did not assess the quality of ecosystem services that this forest cover provides. Previous studies have found that fast-growing commercial species were mainly planted within GFGP and that these have lower biodiversity than natural or native forests, or even mixed species forests [18,21,36]. Mature Pinus kesiya forests are reported to host 27 different tree species and have a Simpson diversity index value of 0.53. In contrast, the monsoon evergreen broad-leaf forests, which are the primary vegetation in areas where Pinus kesiya forests are found, report higher values of 35 tree species and 0.85 for the Simpson index. Given the lower number of tree species and the lower Simpson index observed in Pinus kesiya forests, we recommend that future ecosystem services programs consider planting mixed-species forests with 2 to 5 dominant species. Such an approach could foster higher biodiversity compared to single-species forests [37].
4.2. Impact of Forest Age on Carbon Density and Implications of Forest Management
Forest age is an important factor for vegetation carbon stocks [38], with carbon stock accumulation increasing with forest age in all biomes [39]. We found that the carbon density of Pinus kesiya forest increased with forest age from 2 to 29 years, which is consistent with findings by Li [40]. We did not find any evidence that carbon density in Pinus kesiya forests peaked by 29 years, contradicting findings by Chen [41] that it peaks at between 20 and 50 years. Therefore, we estimated the carbon stocks in 2024 and 2032 based on the assumption that the carbon stock accumulation capacity of Pinus kesiya forest would reach a peak at 35 - 50 years.
Effective forest management could help store more carbon and also help improve other ecosystem services [42,43]. An eight - fold difference in carbon stocks between Pinus forests under different management regimes has been reported [44]. Our results indicate that the area of Pinus kesiya forests in southwestern Yunnan expanded by 2878.79 km² during the Grain for Green Programme (GFGP) period from 1999 to 2009, contributing an additional 6.99 ± 2.66 Tg of carbon stocks. Considering that carbon stock increases with forest age and growth, and that 60.29% of Pinus kesiya forests planted during 1999 to 2009 continued to grow until 2016, these forests contributed 72.13% to the carbon stock accumulation during the overall period from 1999 to 2016.
Even more carbon can be stored in the future under GFGP if the planted forests are properly managed. However, there might be other factors influencing the carbon stock in managed Pinus kesiya forest, e.g., it is an important commercial species contributing to the household income of local farmers, who collect timber, graze their animals in the forest, and tap the trees for resin [45]. Therefore, effective forest management can not only improve local ecosystem services, but also has great potential to increase local household income.
4.3. Factors Affecting Carbon Density
The carbon density of Pinus kesiya forest in the study area was lower than reported in other countries (Figure 7). For example, the carbon density of average, young (< 20 years), and mature (> 40 years) forest in the study area was lower than in the Philippines, India, and Thailand, respectively [8,37,45,46]. Wang showed that warm, moist tropical forests have higher biomass [47]. Thailand and the Philippines has a similar climate, but with higher temperatures and precipitation compared to India and Yunnan Province. Specifically, the study area in India receives 2400 mm of precipitation annually, which is significantly higher than the 800 to 1600 mm range in Yunnan. Therefore, these climate conditions may contribute to the lower carbon density observed in Pinus kesiya forests in the study area compared to other countries. In addition, the Pinus kesiya in Yunnan province is used for timber and resin, so the Pinus kesiya forests are widely distributed [30], which could be another reason for the lower carbon density.
Elevation significantly influences the distribution of Pinus kesiya forests. In our study area, these forests are predominantly found at higher elevations, ranging from 1000 to 1600 meters, which is above the species’ optimal elevation range of 850 to 1850 meters, since available sites at lower elevation are usually planted with commercial trees, e.g., rubber plantations [17,25].
Assessment of carbon stock models and uncertainly in estimates
We overlapped land use maps to infer forest ages and distributions of planted Pinus kesiya forests through GFGP, and our method added forest age information to carbon stock estimates. As shown in Figure 7, compared with the Forest Identity Concept, our method predicted 12.17% (23.5 ± 9.14 TgC) lower carbon stocks in 2024 and 26.53% higher stocks (33.86±11.25 TgC) in 2032. This indicates that previous carbon stock models like Forest Identity Concept which do not consider forest age may overestimate the carbon stock in Pinus kesiya forests younger than 20 years, and underestimate that in carbon stock Pinus kesiya forests older than 20 years. Therefore, to increase the accuracy of carbon stock estimation, we recommend including forest age in carbon stock models. However, it is difficult to calculate or infer forest age by remote sensing, since the first Earth observation satellite was only launched in 1972 [48]. In the future, remote sensing images can be used to reconstruct younger forest ages and distributions at pixel level. Forest inventory data have great potential to reconstruct the age of old forests [49], which combined with the remote sensing data can capture changes in long-term regional carbon stocks.
Several uncertainties arose when estimating carbon stocks of Pinus kesiya forest in this study. First, the carbon density of Pinus kesiya forest varies even in forest of the same age [50,51], possibly owing to canopy density, species composition, stand attributes, forest management, and human activities (Figure 3). For example, we found that human activities affected 75% of Pinus kesiya community structures in 44 sample plots, mainly due to tapping resin and timber collection for livelihood reasons. However, we did not include the carbon losses caused by human activities and other factors. which adds uncertainty in estimating forest density [52]. Therefore, we estimated the carbon stock using the average carbon density of the Pinus kesiya forest in two periods. Second, there was some uncertainty in mapping Pinus kesiya forests. The commission error rate for Pinus kesiya forests was 0.1979, 0.1739, and 0.1 in 1999, 2009, and 2016, respectively, while the omission error rate was 0.0722, 0.0828, and 0.1189 in 1999, 2009, and 2016, respectively. Higher commission than omission error means that more areas of other land use types were wrongly classified as Pinus kesiya forests, thus inflating the actual area of these forests in 1999 and 2009. However, the Kappa accuracy was 0.84, 0.87, and 0.88 in 1999, 2009, and 2016, respectively, reducing the error and decreasing the uncertainty in carbon stock estimation.
5. Conclusions
Carbon stock accumulation in Pinus kesiya forest in SW Yunnan, China, during and after GFGP was estimated using remote sensing-derived land use maps, combined with GIS information to derive forest age and distribution. The results suggested that implementation of GFGP increased the area and carbon stocks of Pinus kesiya forest in the region. The carbon stocks may continue to increase in GFGP is extended in future, since large areas with slope >15° are still under farmland. The carbon stock is also expected to increase with increasing forest age. Our method of combining remote sensing methods and GIS-based spatial analysis to derive forest distribution, age, and area should lead to higher accuracy in estimation of carbon stocks. However, the carbon density of Pinus kesiya forest in SW Yunnan is lower than in other countries, possibly due to regional climate conditions and human activities.
Funding
This research was funded by the National Natural Science Foundation of China (grant number: 32260303).
Data availability statement
The data used in this study include land use maps from 1999, 2009, and 2016, as well as carbon density data from Pinus kesiya forests. These data were used to analyze changes in carbon stocks of Pinus kesiya forests. All data are stored in the research institution’s database and can be accessed as follows: Land Use Map Data: These data are provided by the National Geospatial Information Center and can be downloaded from their official website. The dataset includes detailed information such as data format, resolution, and coverage area. Carbon Density Data: These data were collected by the research team during field surveys and have been processed for standardization. The dataset includes carbon density measurements for forests of different ages and types. For access to these data, please contact the research team leader, Qiang Zhang, at zq34011456@126.com. When providing the data, we will ensure compliance with relevant data usage agreements and privacy protection policies.
Conflict of Interest
The authors declare that they have no conflict of interest.
References
- Lucas, R.M.; Mitchell, A.L.; Armston, J. Measurement of Forest Above-Ground Biomass Using Active and Passive Remote Sensing at Large (Subnational to Global) Scales. Curr for Rep 2015, 1, 162–177. [Google Scholar] [CrossRef]
- Pan, Y.; Birdsey, R.A.; Fang, J.; Houghton, R.; Kauppi, P.E.; Kurz, W.A.; Phillips, O.L.; Shvidenko, A.; Lewis, S.L.; Canadell, J.G.; et al. A Large and Persistent Carbon Sink in the World’s Forests. Science (American Association for the Advancement of Science) 2011, 333, 988–993. [Google Scholar] [CrossRef]
- McGarvey, J.C.; Thompson, J.R.; Epstein, H.E.; Shugart, H.H. Carbon storage in old-growth forests of the Mid-Atlantic: toward better understanding the eastern forest carbon sink. Ecology (Durham) 2015, 96, 311–317. [Google Scholar] [CrossRef]
- Fang, J.; Guo, Z.; Hu, H.; Kato, T.; Muraoka, H.; Son, Y. Forest biomass carbon sinks in East Asia, with special reference to the relative contributions of forest expansion and forest growth. Global Change Biol 2014, 20, 2019–2030. [Google Scholar] [CrossRef]
- Bonan, G.B. Forests and Climate Change: Forcings, Feedbacks, and the Climate Benefits of Forests. Science (American Association for the Advancement of Science) 2008, 320, 1444–1449. [Google Scholar] [CrossRef] [PubMed]
- Arora, V.K.; Montenegro, A. Small temperature benefits provided by realistic afforestation efforts. Nat Geosci 2011, 4, 514–518. [Google Scholar] [CrossRef]
- Fuss, S.; Canadell, J.G.; Peters, G.P.; Tavoni, M.; Andrew, R.M.; Ciais, P.; Jackson, R.B.; Jones, C.D.; Kraxner, F.; Nakicenovic, N.; et al. Betting on negative emissions. Nat Clim Change 2014, 4, 850–853. [Google Scholar] [CrossRef]
- Krause, A.; Pugh, T.A.M.; Bayer, A.D.; Li, W.; Leung, F.; Bondeau, A.; Doelman, J.C.; Humpenöder, F.; Anthoni, P.; Bodirsky, B.L.; et al. Large uncertainty in carbon uptake potential of land-based climate-change mitigation efforts. Global Change Biol 2018, 24, 3025–3038. [Google Scholar] [CrossRef]
- Aragão, L.E.O.C.; Anderson, L.O.; Fonseca, M.G.; Rosan, T.M.; Vedovato, L.B.; Wagner, F.H.; Silva, C.V.J.; Silva Junior, C.H.L.; Arai, E.; Aguiar, A.P.; et al. 21st Century drought-related fires counteract the decline of Amazon deforestation carbon emissions. Nat Commun 2018, 9, 512–536. [Google Scholar] [CrossRef]
- Ometto, J.P.; Aguiar, A.P.; Assis, T.; Soler, L.; Valle, P.; Tejada, G.; Lapola, D.M.; Meir, P. Amazon forest biomass density maps: tackling the uncertainty in carbon emission estimates. Climatic Change 2014, 124, 545–560. [Google Scholar] [CrossRef]
- Arneth, A.; Sitch, S.; Pongratz, J.; Stocker, B.D.; Ciais, P.; Poulter, B.; Bayer, A.D.; Bondeau, A.; Calle, L.; Chini, L.P.; et al. Historical Carbon Dioxide Emissions Caused by Land-Use Changes are Possibly Larger than Assumed. Nat Geosci 2017, 10, 79–84. [Google Scholar] [CrossRef]
- Bradford, J.B.; Birdsey, R.A.; Joyce, L.A.; Ryan, M.G. Tree age, disturbance history, and carbon stocks and fluxes in subalpine Rocky Mountain forests. Global Change Biol 2008, 14, 2882–2897. [Google Scholar] [CrossRef]
- EGGERS, J.; LINDNER, M.; ZUDIN, S.; ZAEHLE, S.; LISKI, J. Impact of changing wood demand, climate and land use on European forest resources and carbon stocks during the 21st century. Global Change Biol 2008, 14, 2288–2303. [Google Scholar] [CrossRef]
- Waggoner, P.E. Using the Forest Identity to Grasp and Comprehend the Swelling Mass of Forest Statistics. The International Forestry Review 2008, 10, 689–694. [Google Scholar] [CrossRef]
- Avitabile, V.; Herold, M.; Heuvelink, G.B.M.; Lewis, S.L.; Phillips, O.L.; Asner, G.P.; Armston, J.; Ashton, P.S.; Banin, L.; Bayol, N.; et al. integrated pan-tropical biomass map using multiple reference datasets. Global Change Biol 2016, 22, 1406–1420. [Google Scholar] [CrossRef]
- Leite, C.C.; Costa, M.H.; Soares-Filho, B.S.; de Barros Viana Hissa, L. Historical land use change and associated carbon emissions in Brazil from 1940 to 1995. Global Biogeochem Cy 2012, 26, n/a–n/a. [Google Scholar] [CrossRef]
- Li, H.; Ma, Y.; Aide, T.M.; Liu, W. Past, present and future land-use in Xishuangbanna, China and the implications for carbon dynamics. Forest Ecol Manag 2008, 255, 16–24. [Google Scholar] [CrossRef]
- Hua, F.; Wang, X.; Zheng, X.; Fisher, B.; Wang, L.; Zhu, J.; Tang, Y.; Yu, D.W.; Wilcove, D.S. Opportunities for biodiversity gains under the world’s largest reforestation programme. Nat Commun 2016, 7, 12717. [Google Scholar] [CrossRef]
- Wang, J.; Peng, J.; Zhao, M.; Liu, Y.; Chen, Y. Significant trade-off for the impact of Grain-for-Green Programme on ecosystem services in North-western Yunnan, China. The Science of the Total Environment 2017, 574, 57–64. [Google Scholar] [CrossRef]
- Ouyang, Z.; Zheng, H.; Xiao, Y.; Polasky, S.; Liu, J.; Xu, W.; Wang, Q.; Zhang, L.; Xiao, Y.; Rao, E.; et al. Improvements in ecosystem services from investments in natural capital. Science (American Association for the Advancement of Science) 2016, 352, 1455–1459. [Google Scholar] [CrossRef]
- Xu, J. China’s new forests aren’t as green as they seem. Nature 2011, 477, 371. [Google Scholar] [CrossRef] [PubMed]
- Doyog, N.D.; Lumbres, R.I.C.; Lee, Y.J. Mapping of the spatial distribution of carbon storage of the Pinus kesiya Royle ex Gordon (Benguet pine) forest in Sagada, Mt. Province, Philippines. J Sustain Forest 2018, 37, 661–677. [Google Scholar] [CrossRef]
- Khamyong, S.; Sumanochitraporn, S. Role of a Pine (Pinus kesiya) Plantation on Water Storage in the Doi Tung Reforestation Royal Project, Chiang Rai Province, Northern Thailand. 2014.
- Chen, X.; Zhang, X.; Zhang, Y.; Wan, C. Carbon sequestration potential of the stands under the Grain for Green Program in Yunnan Province, China. Forest Ecol Manag 2009, 258, 199–206. [Google Scholar] [CrossRef]
- Li, S.; Su, J.; Lang, X.; Liu, W.; Ou, G. Positive relationship between species richness and aboveground biomass across forest strata in a primary Pinus kesiya forest. Sci Rep-Uk 2018, 8, 2227–2229. [Google Scholar] [CrossRef]
- Jiaojiao, W.U.; Guanglong, O.U.; Qingtai, S.; University, S.F. Remote sensing estimation of the biomass of Pinus kesiya var. langbianensis forest based on BP neural networks. Journal of Central South University of Forestry & Technology 2017. [Google Scholar]
- Lumbres, R.I.C.; Lee, Y.J. Aboveground biomass mapping of La Trinidad forests in Benguet, Philippines, using Landsat Thematic Mapper data and k-nearest neighbor method. Forest Science & Technology 2014, 10, 104–111. [Google Scholar]
- Myers, N.; Mittermeier, R.A.; Mittermeier, C.G.; Fonseca, G.A.B.D.; Kent, J. Biodiversity hotspots for conservation priorities. Nature 2000, 403, 853–858. [Google Scholar] [CrossRef] [PubMed]
- Liu, S.; Zhu, H.; Yang, J. A Phylogenetic Perspective on Biogeographical Divergence of the Flora in Yunnan, Southwestern China. Sci Rep-Uk 2017, 7, 43032. [Google Scholar] [CrossRef]
- CHEN, Q.; ZHENG, Z.; FENG, Z.; MA, Y.; SHA, L.; XU, H.; NONG, P.; LI, Z. Biomass and carbon storage of Pinus kesiya var. langbianensis in Puer, Yunnan. Yunnan Da Xue Hsüen Bao. Zi Ran Ke Xue Ban 2014, 36, 439–445. [Google Scholar] [CrossRef]
- Zianis, D.; Mencuccini, M. On simplifying allometric analyses of forest biomass. Forest Ecol Manag 2004, 187, 311–332. [Google Scholar] [CrossRef]
- Zhang, X.; Chen, G.; Liu, C.; Fan, Q.; Li, W.; Wu, Y.; Xu, H.; Ou, G. Spatial Effects Analysis on Individual-Tree Aboveground Biomass in a Tropical Pinus Kesiya Var. Langbianensis Natural Forest in Yunnan, Southwestern China. Forests 2023, 14. [Google Scholar] [CrossRef]
- Sierra, C.A.; Del Valle, J.I.; Orrego, S.A.; Moreno, F.H.; Harmon, M.E.; Zapata, M.; Colorado, G.J.; Herrera, M.A.; Lara, W.; Restrepo, D.E.; et al. Total carbon stocks in a tropical forest landscape of the Porce region, Colombia. Forest Ecol Manag 2007, 243, 299–309. [Google Scholar] [CrossRef]
- LIU, D.; CHEN, Y.; CAI, W.; DONG, W.; XIAO, J.; CHEN, J.; ZHANG, H.; XIA, J.; YUAN, W. in The contribution of China’s Grain to Green Program to carbon sequestration : Coupled Natural and Human Systems: A Landscape Ecology Perspective, Dordrecht, 2014/1/1, 2014; Springer: Dordrecht, 2014; pp 1675-1688.
- Carriere, A.; Le Bouteiller, C.; Tucker, G.E.; Klotz, S.; Naaim, M. Impact of vegetation on erosion; insights from the calibration and test of a landscape evolution model in alpine badland catchments. Earth Surf Proc Land 2020, 45, 1085–1099. [Google Scholar] [CrossRef]
- Zhai, D.; Xu, J.; Dai, Z.; Cannon, C.H.; Grumbine, R.E. Increasing tree cover while losing diverse natural forests in tropical Hainan, China. Reg Environ Change 2014, 14, 611–621. [Google Scholar] [CrossRef]
- Kulesza, K.; Hościło, A. Temporal Patterns of Vegetation Greenness for the Main Forest-Forming Tree Species in the European Temperate Zone. Remote Sensing (Basel, Switzerland) 2024, 16, 2844. [Google Scholar] [CrossRef]
- Mora, F.; Jaramillo, V.J.; Bhaskar, R.; Gavito, M.; Siddique, I.; Byrnes, J.E.K.; Balvanera, P. Carbon Accumulation in Neotropical Dry Secondary Forests: The Roles of Forest Age and Tree Dominance and Diversity. Ecosystems (New York) 2018, 21, 536–550. [Google Scholar] [CrossRef]
- Pregitzer, K.S.; Euskirchen, E.S. Carbon cycling and storage in world forests: biome patterns related to forest age. Global Change Biol 2004, 10, 2052–2077. [Google Scholar] [CrossRef]
- Li, S.; Su, J.; Liu, W.; Lang, X.; Huang, X.; Jia, C.; Zhang, Z.; Tong, Q.; Hui, D. Changes in Biomass Carbon and Soil Organic Carbon Stocks following the Conversion from a Secondary Coniferous Forest to a Pine Plantation. Plos One 2015, 10, e135946. [Google Scholar] [CrossRef]
- Chen, Z.; Yu, G.; Wang, Q. Effects of climate and forest age on the ecosystem carbon exchange of afforestation. J Forestry Res 2020, 31, 365–374. [Google Scholar] [CrossRef]
- Tong, X.; Brandt, M.; Yue, Y.; Ciais, P.; Rudbeck Jepsen, M.; Penuelas, J.; Wigneron, J.; Xiao, X.; Song, X.; Horion, S.; et al. Forest management in southern China generates short term extensive carbon sequestration. Nat Commun 2020, 11, 110–129. [Google Scholar] [CrossRef]
- Villa, P.M.; Martins, S.V.; de Oliveira Neto, S.N.; Rodrigues, A.C.; Martorano, L.G.; Monsanto, L.D.; Cancio, N.M.; Gastauer, M. Intensification of shifting cultivation reduces forest resilience in the northern Amazon. Forest Ecol Manag 2018, 430, 312–320. [Google Scholar] [CrossRef]
- Yu, Z.; Zhou, G.; Liu, S.; Sun, P.; Agathokleous, E. Impacts of forest management intensity on carbon accumulation of China’s forest plantations. Forest Ecol Manag 2020, 472, 118252. [Google Scholar] [CrossRef]
- Ruiwu, Z.; Wangjun, L.; Yiping, Z.; Mingchun, P.; Chongyun, W.; Liqing, S.; Yuntong, L.; Qinghai, S.; Xuehai, F.; Yanqiang, J. Responses of the Carbon Storage and Sequestration Potential of Forest Vegetation to Temperature Increases in Yunnan Province, SW China. Forests 2018, 9, 227. [Google Scholar] [CrossRef]
- Baishya, R.; Barik, S.K. Estimation of tree biomass, carbon pool and net primary production of an old-growth Pinus kesiya Royle ex. Gordon forest in north-eastern India. Annals of Forest Science. 2011, 68, 727–736. [Google Scholar] [CrossRef]
- Wang, G.; Guan, D.; Xiao, L.; Peart, M.R. Ecosystem carbon storage affected by intertidal locations and climatic factors in three estuarine mangrove forests of South China. Reg Environ Change 2019, 19, 1701–1712. [Google Scholar] [CrossRef]
- COHEN, W.B.; GOWARD, S.N. Landsat’s Role in Ecological Applications of Remote Sensing. Bioscience 2004, 54, 535–545. [Google Scholar] [CrossRef]
- Fang, J.Y.; Chen, A.P.; Peng, C.H.; Zhao, S.Q.; Ci, L. Changes in forest biomass carbon storage in China between 1949 and 1998. 2001. [CrossRef]
- Fotis, A.T.; Morin, T.H.; Fahey, R.T.; Hardiman, B.S.; Bohrer, G.; Curtis, P.S. Forest structure in space and time: Biotic and abiotic determinants of canopy complexity and their effects on net primary productivity. Agr Forest Meteorol 2018, 250-251, 181–191. [Google Scholar] [CrossRef]
- Xu, L.; Shi, Y.; Fang, H.; Zhou, G.; Xu, X.; Zhou, Y.; Tao, J.; Ji, B.; Xu, J.; Li, C.; et al. Vegetation carbon stocks driven by canopy density and forest age in subtropical forest ecosystems. The Science of the Total Environment 2018, 631-632, 619–626. [Google Scholar] [CrossRef]
- HOUGHTON, R.A. Why are estimates of the terrestrial carbon balance so different? Global Change Biol 2003, 9, 500–509. [Google Scholar] [CrossRef]
Figure 1.
Maps showing the location of the study area in south-west China and the distribution of sampling plots.
Figure 1.
Maps showing the location of the study area in south-west China and the distribution of sampling plots.
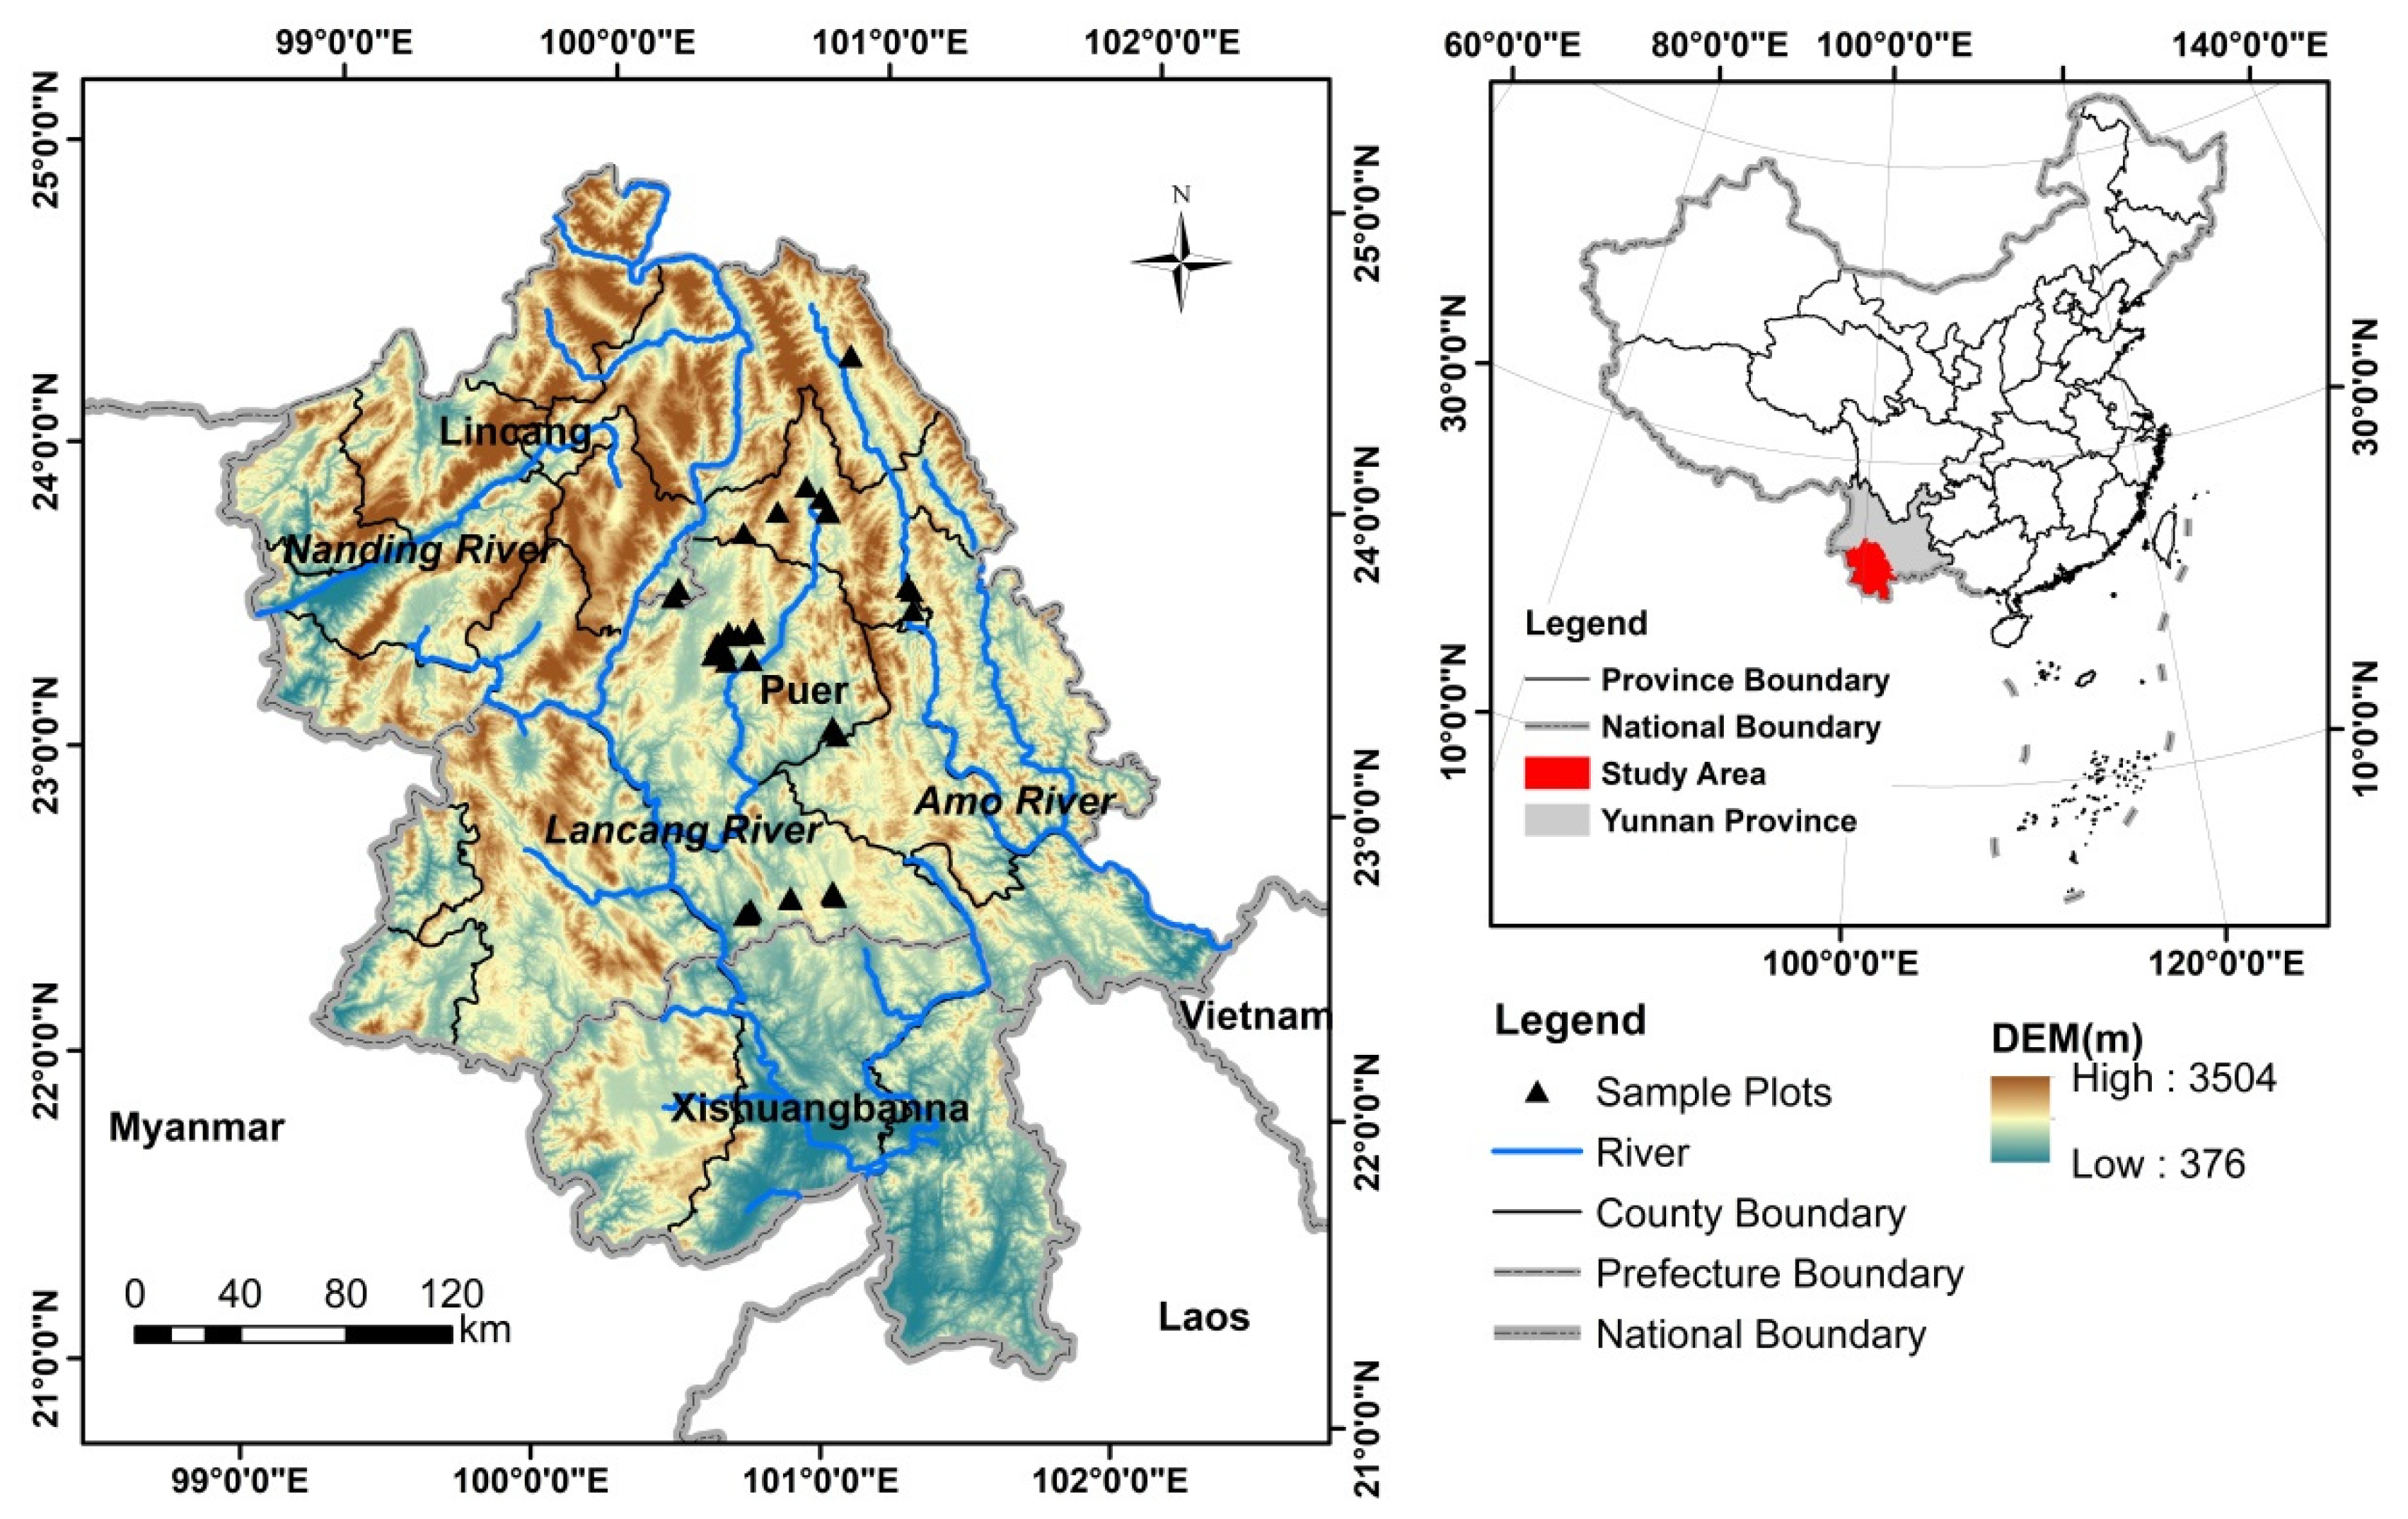
Figure 2.
Land-use change in the study area during the period.
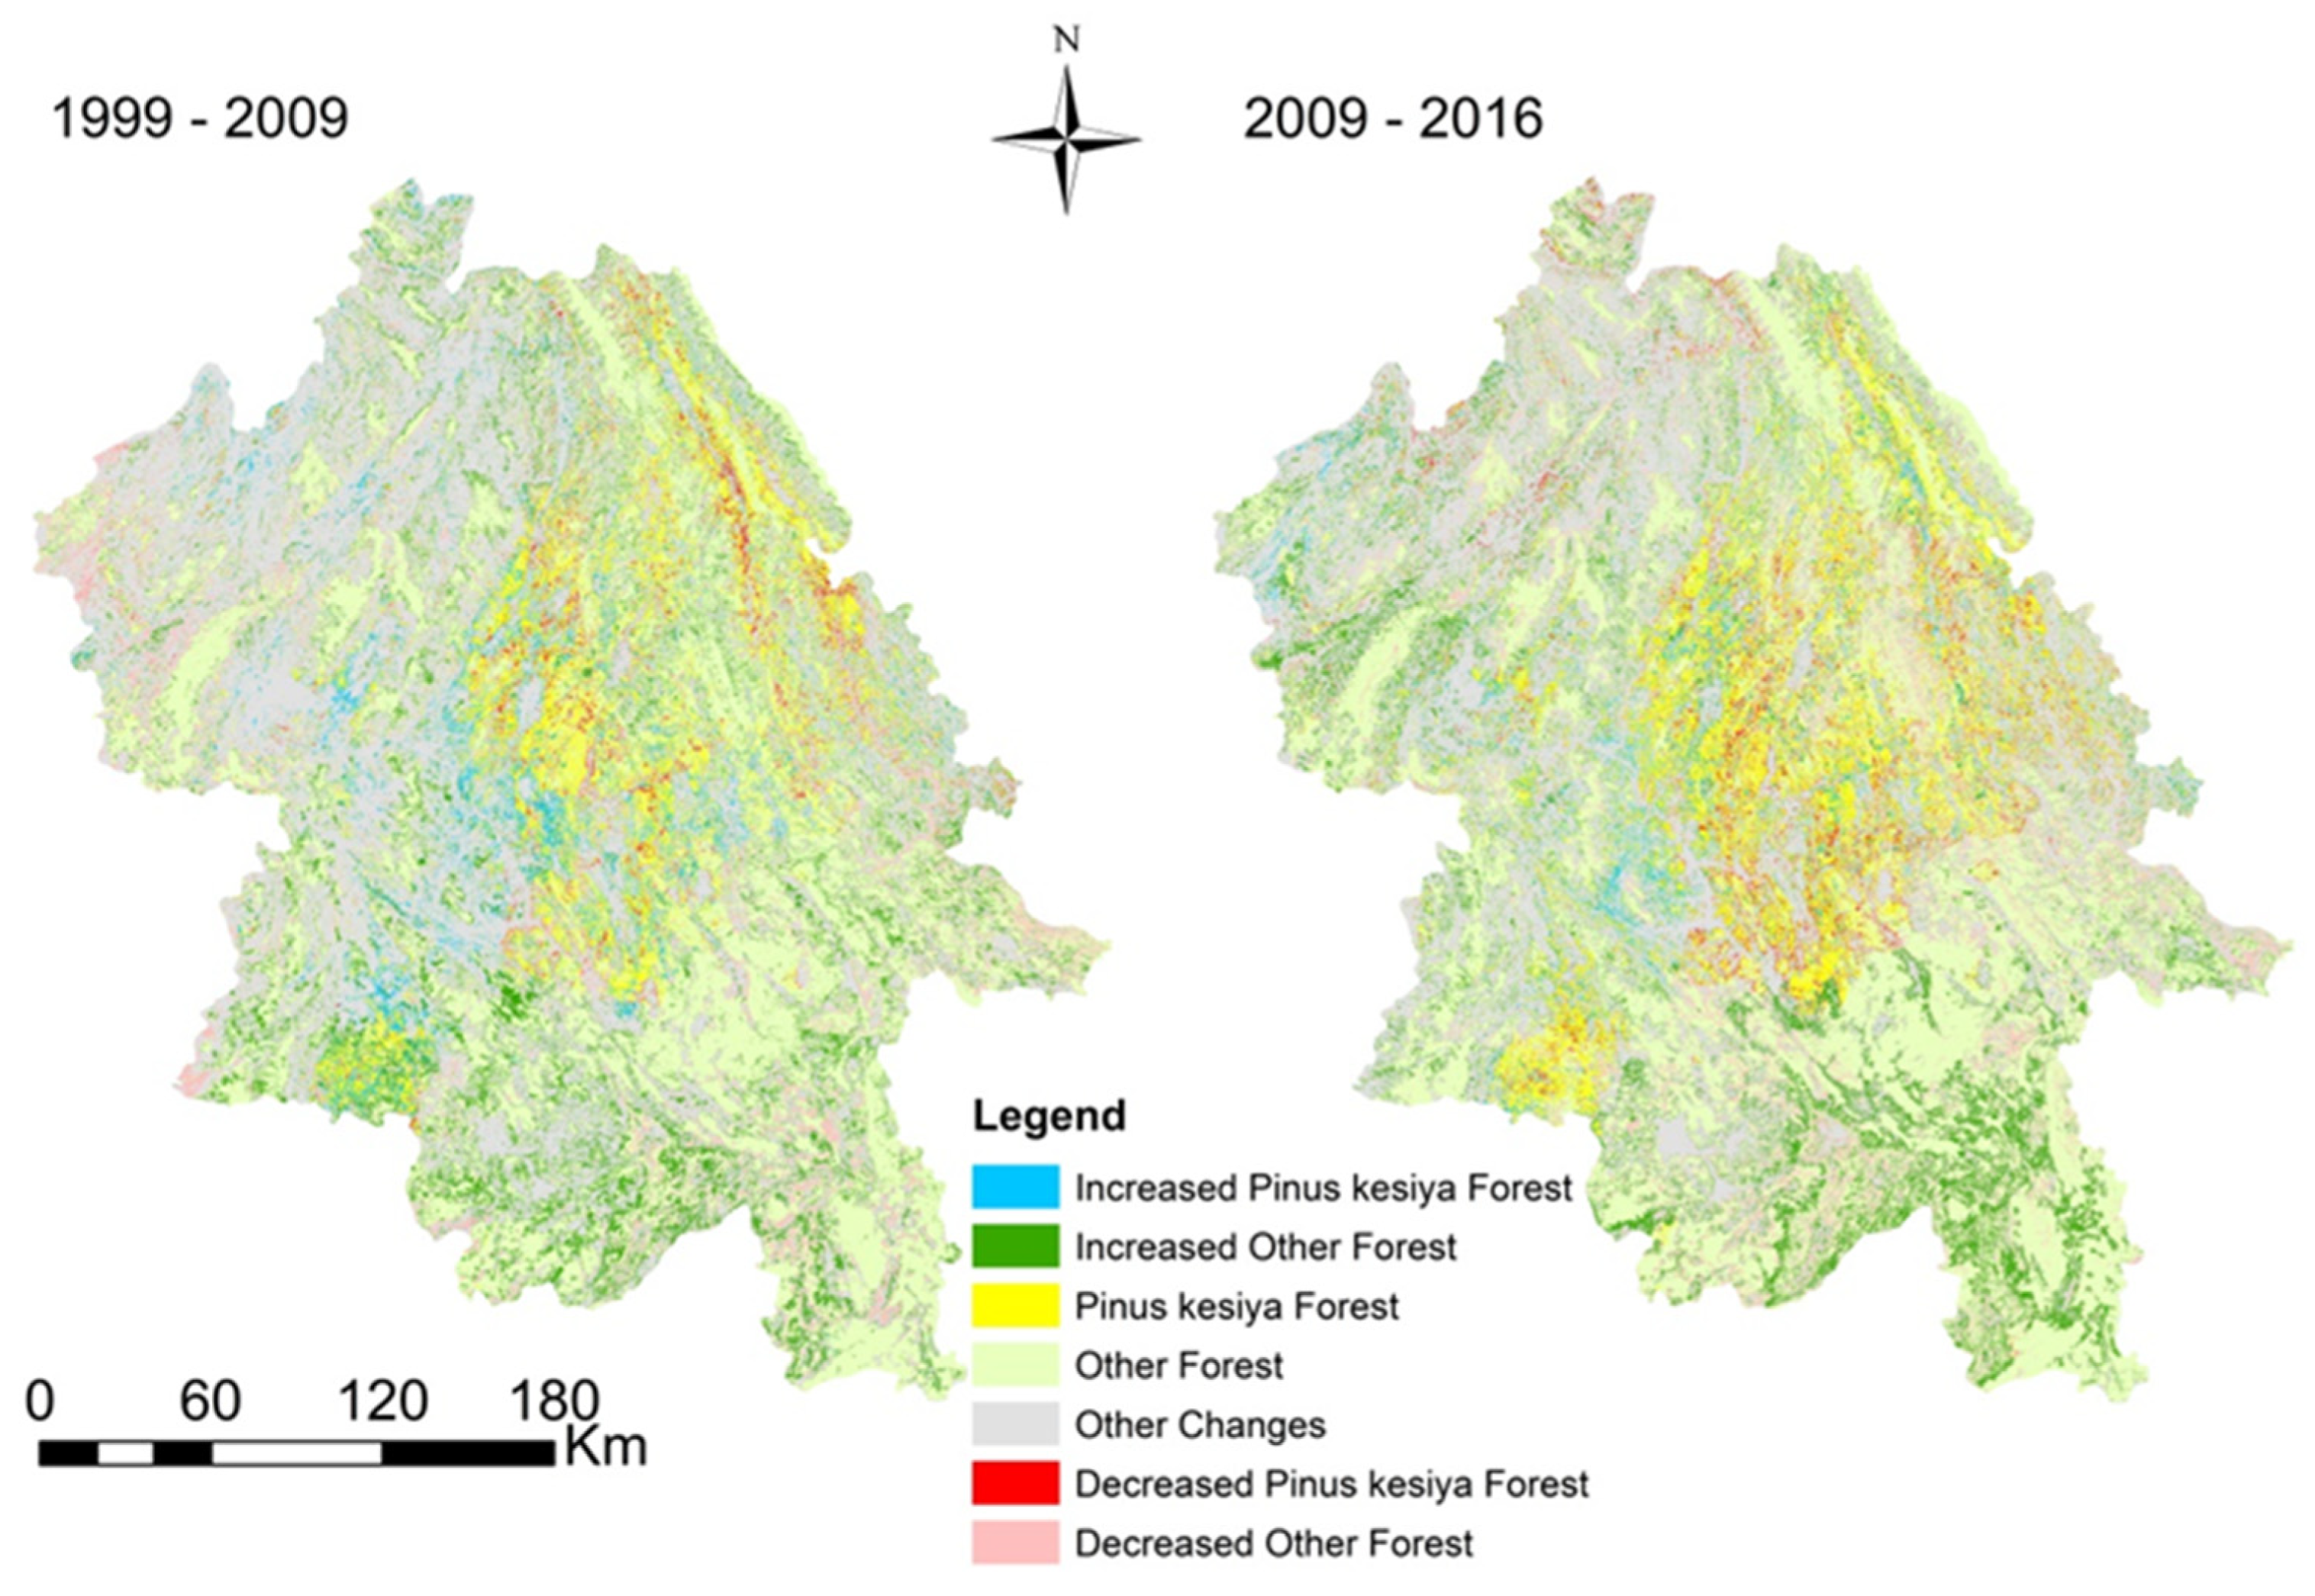
Figure 3.
The correlation between total carbon density, tree carbon density, and the carbon density of various Pinus kesiya forest components, including stems, branches, leaves, roots, shrubs, herbaceous plants, and litter, with increasing forest age.
Figure 3.
The correlation between total carbon density, tree carbon density, and the carbon density of various Pinus kesiya forest components, including stems, branches, leaves, roots, shrubs, herbaceous plants, and litter, with increasing forest age.
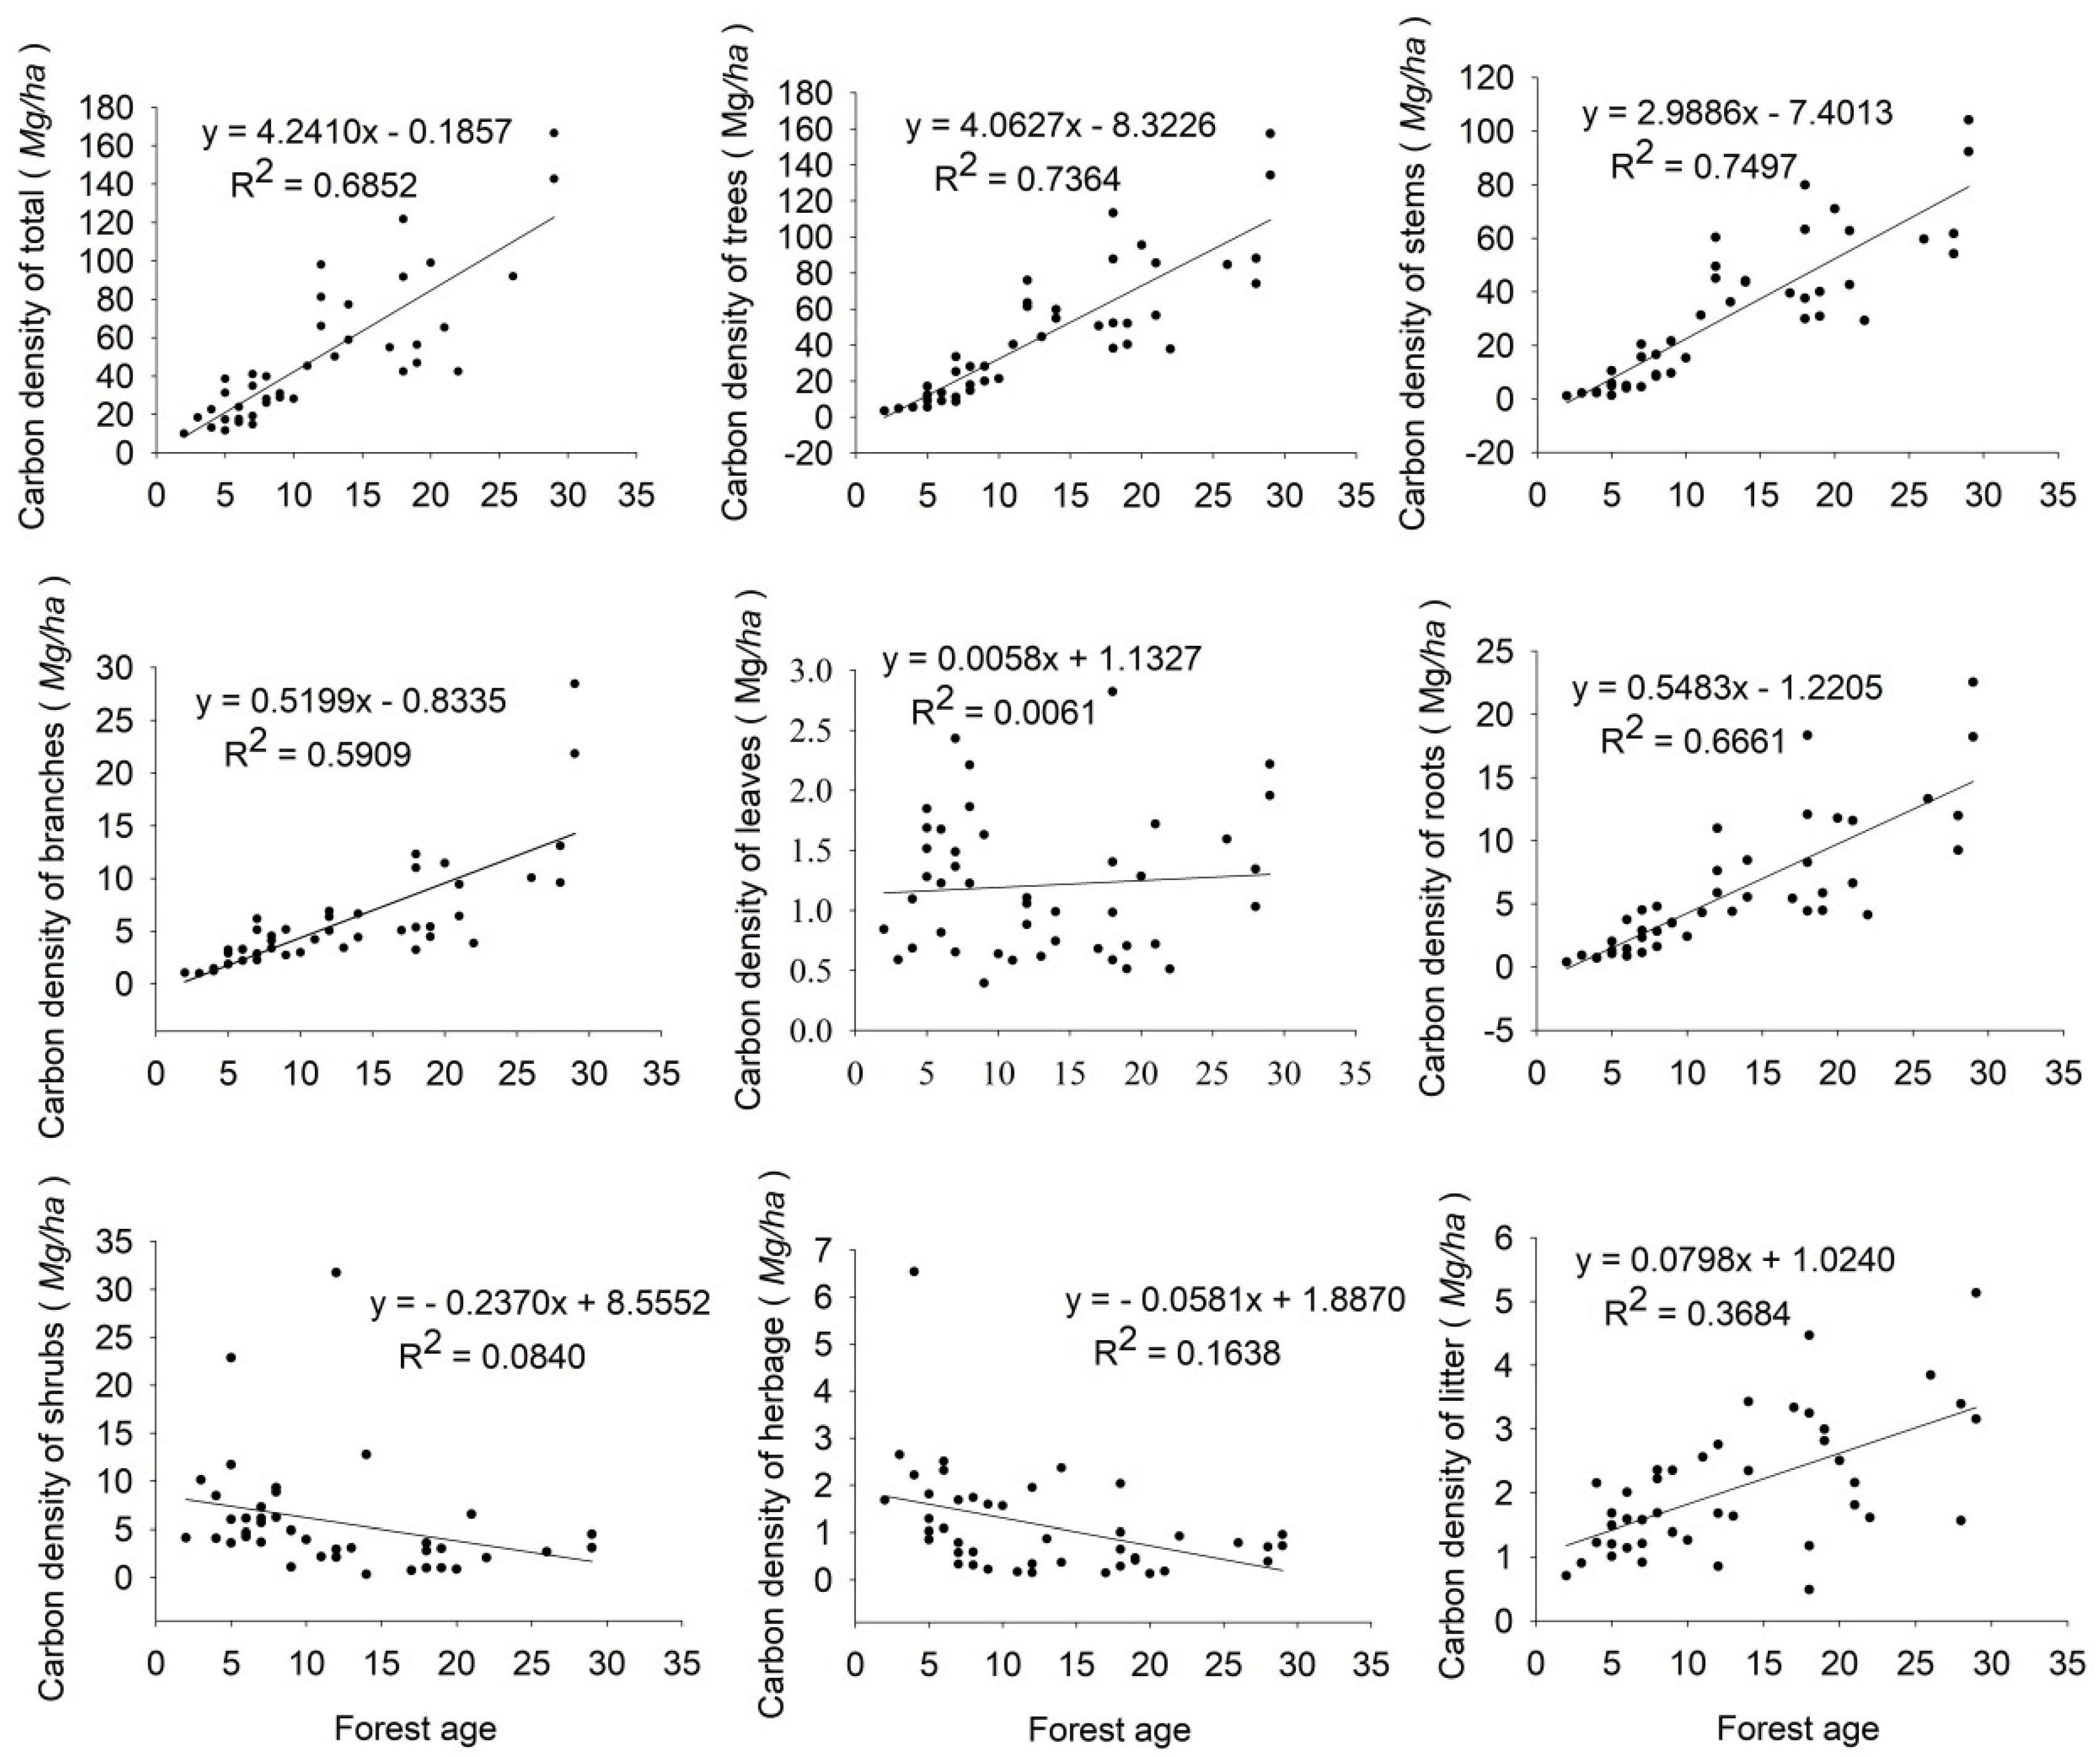
Figure 4.
Increase in area and carbon stocks in Pinus kesiya forest in SW Yunnan.
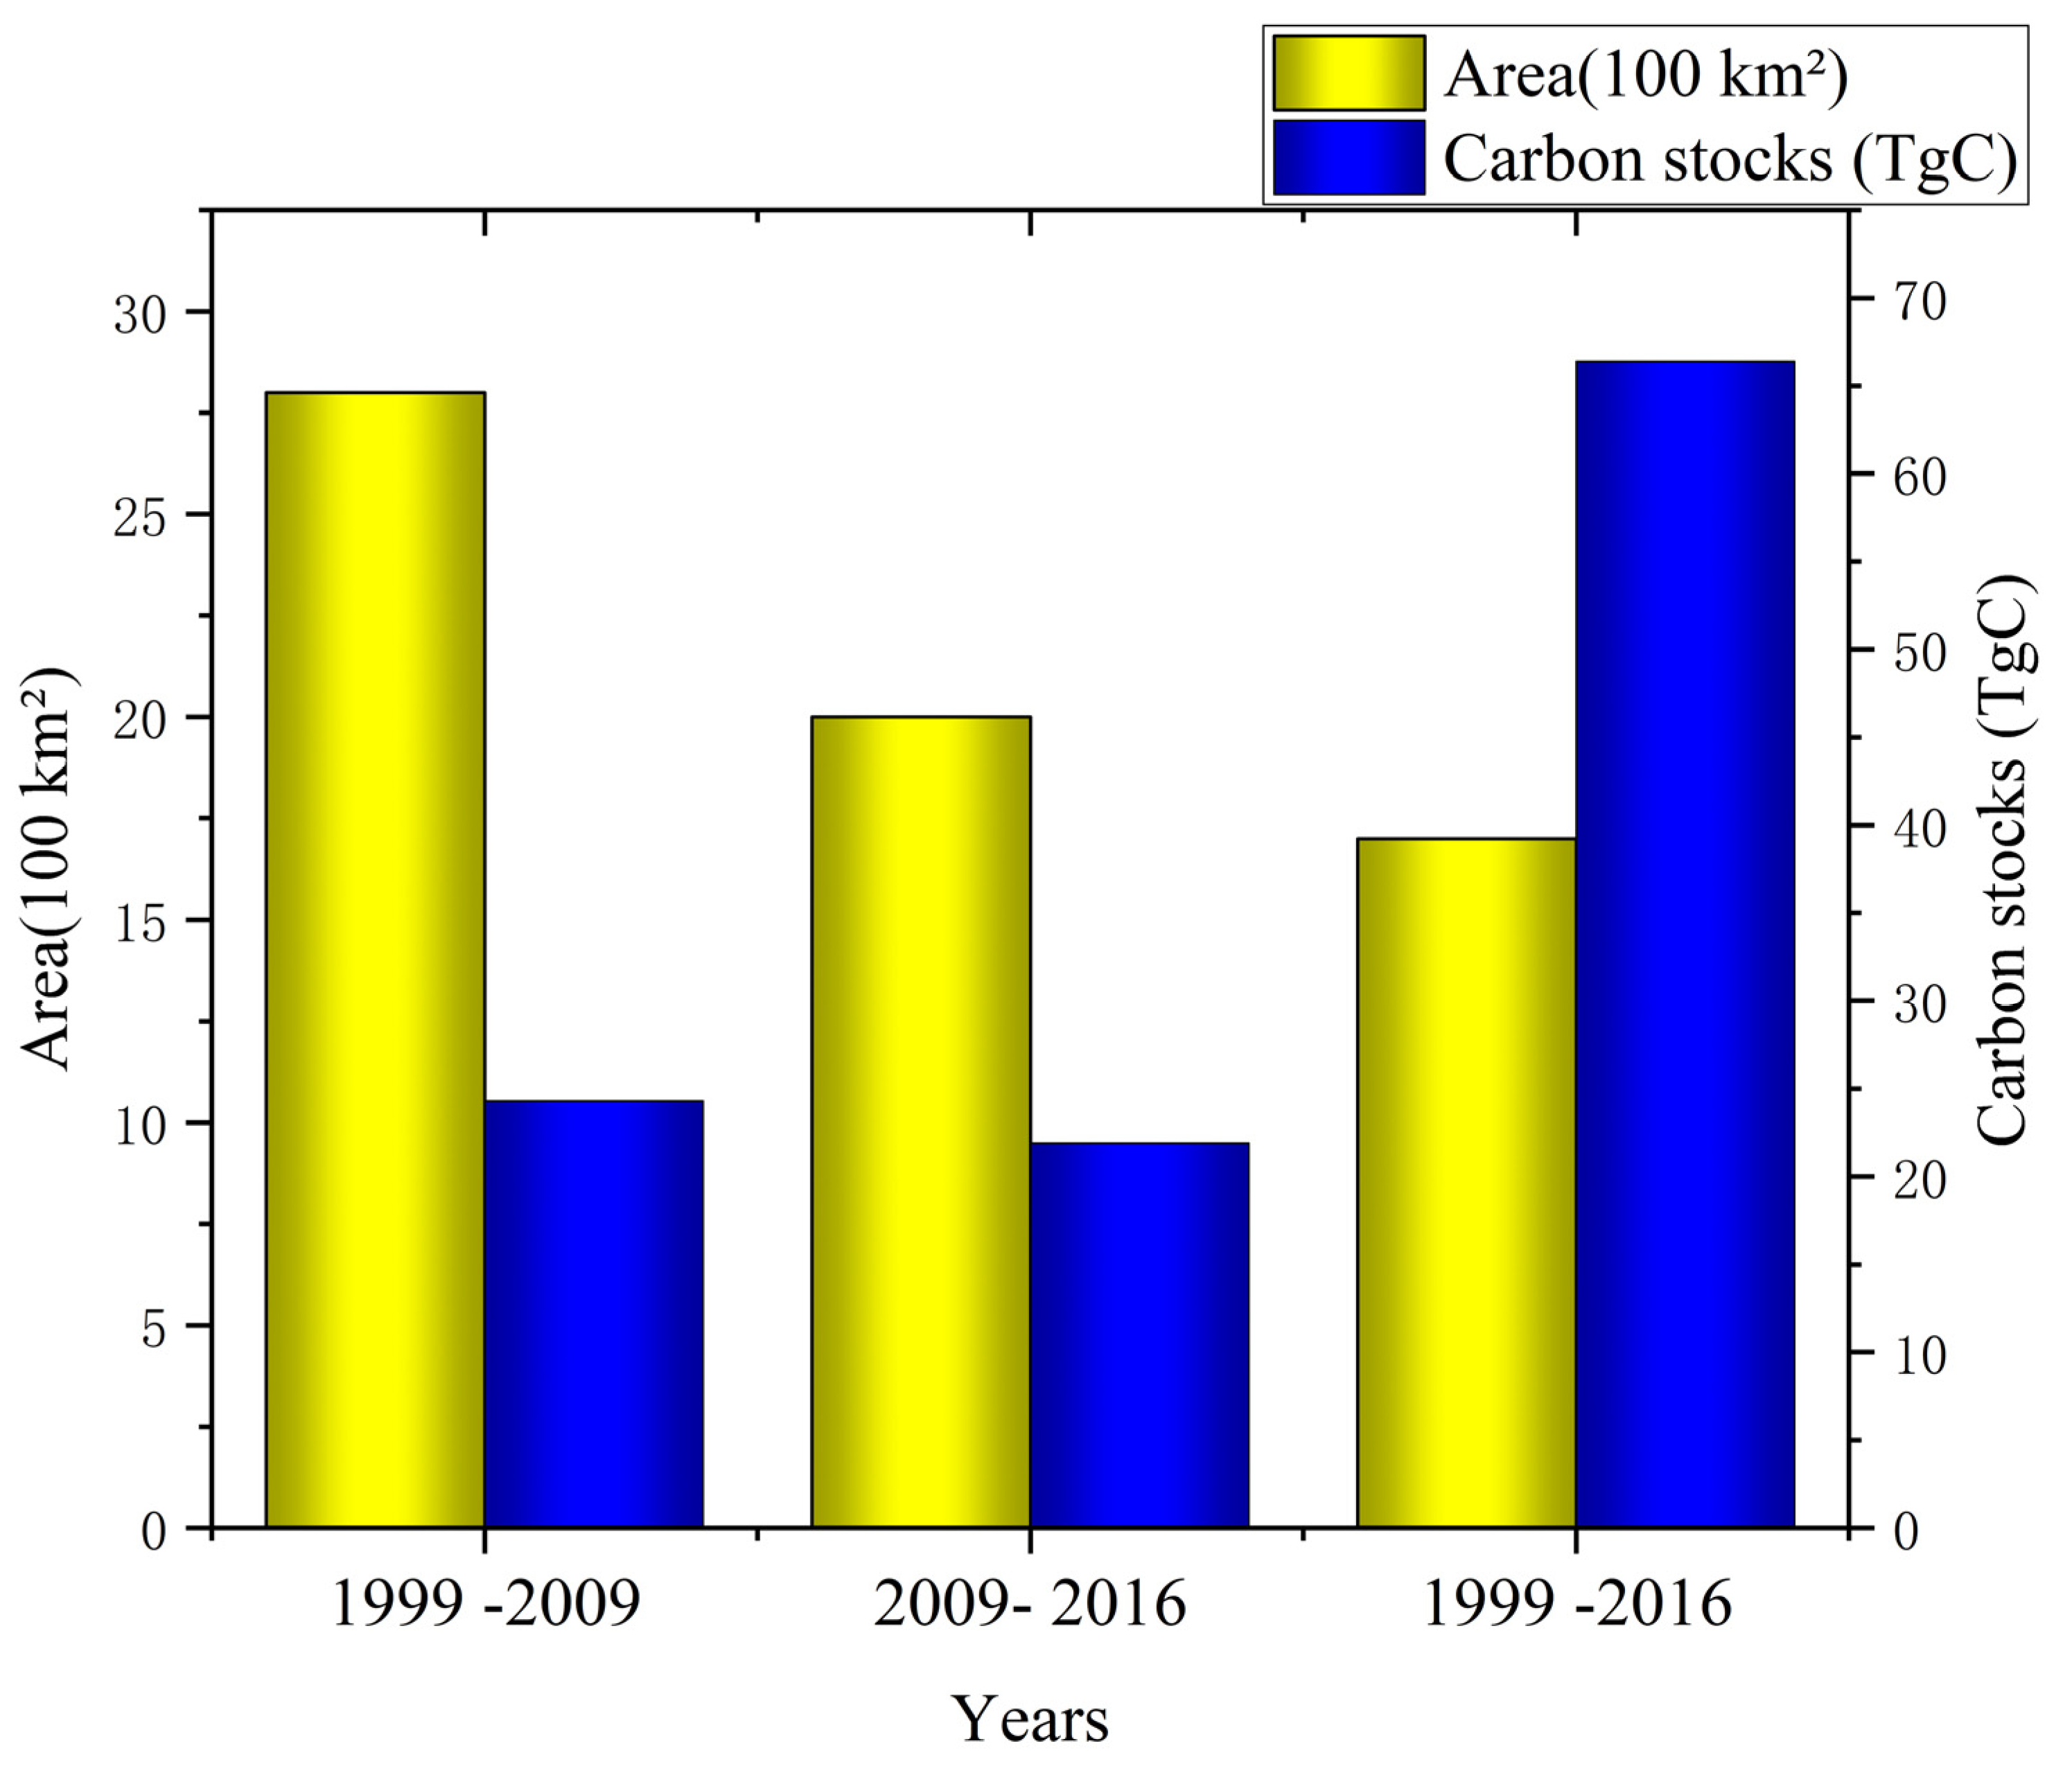
Figure 5.
Carbon density distribution of Pinus kesiya forest in SW Yunnan from 1999 to 2016.
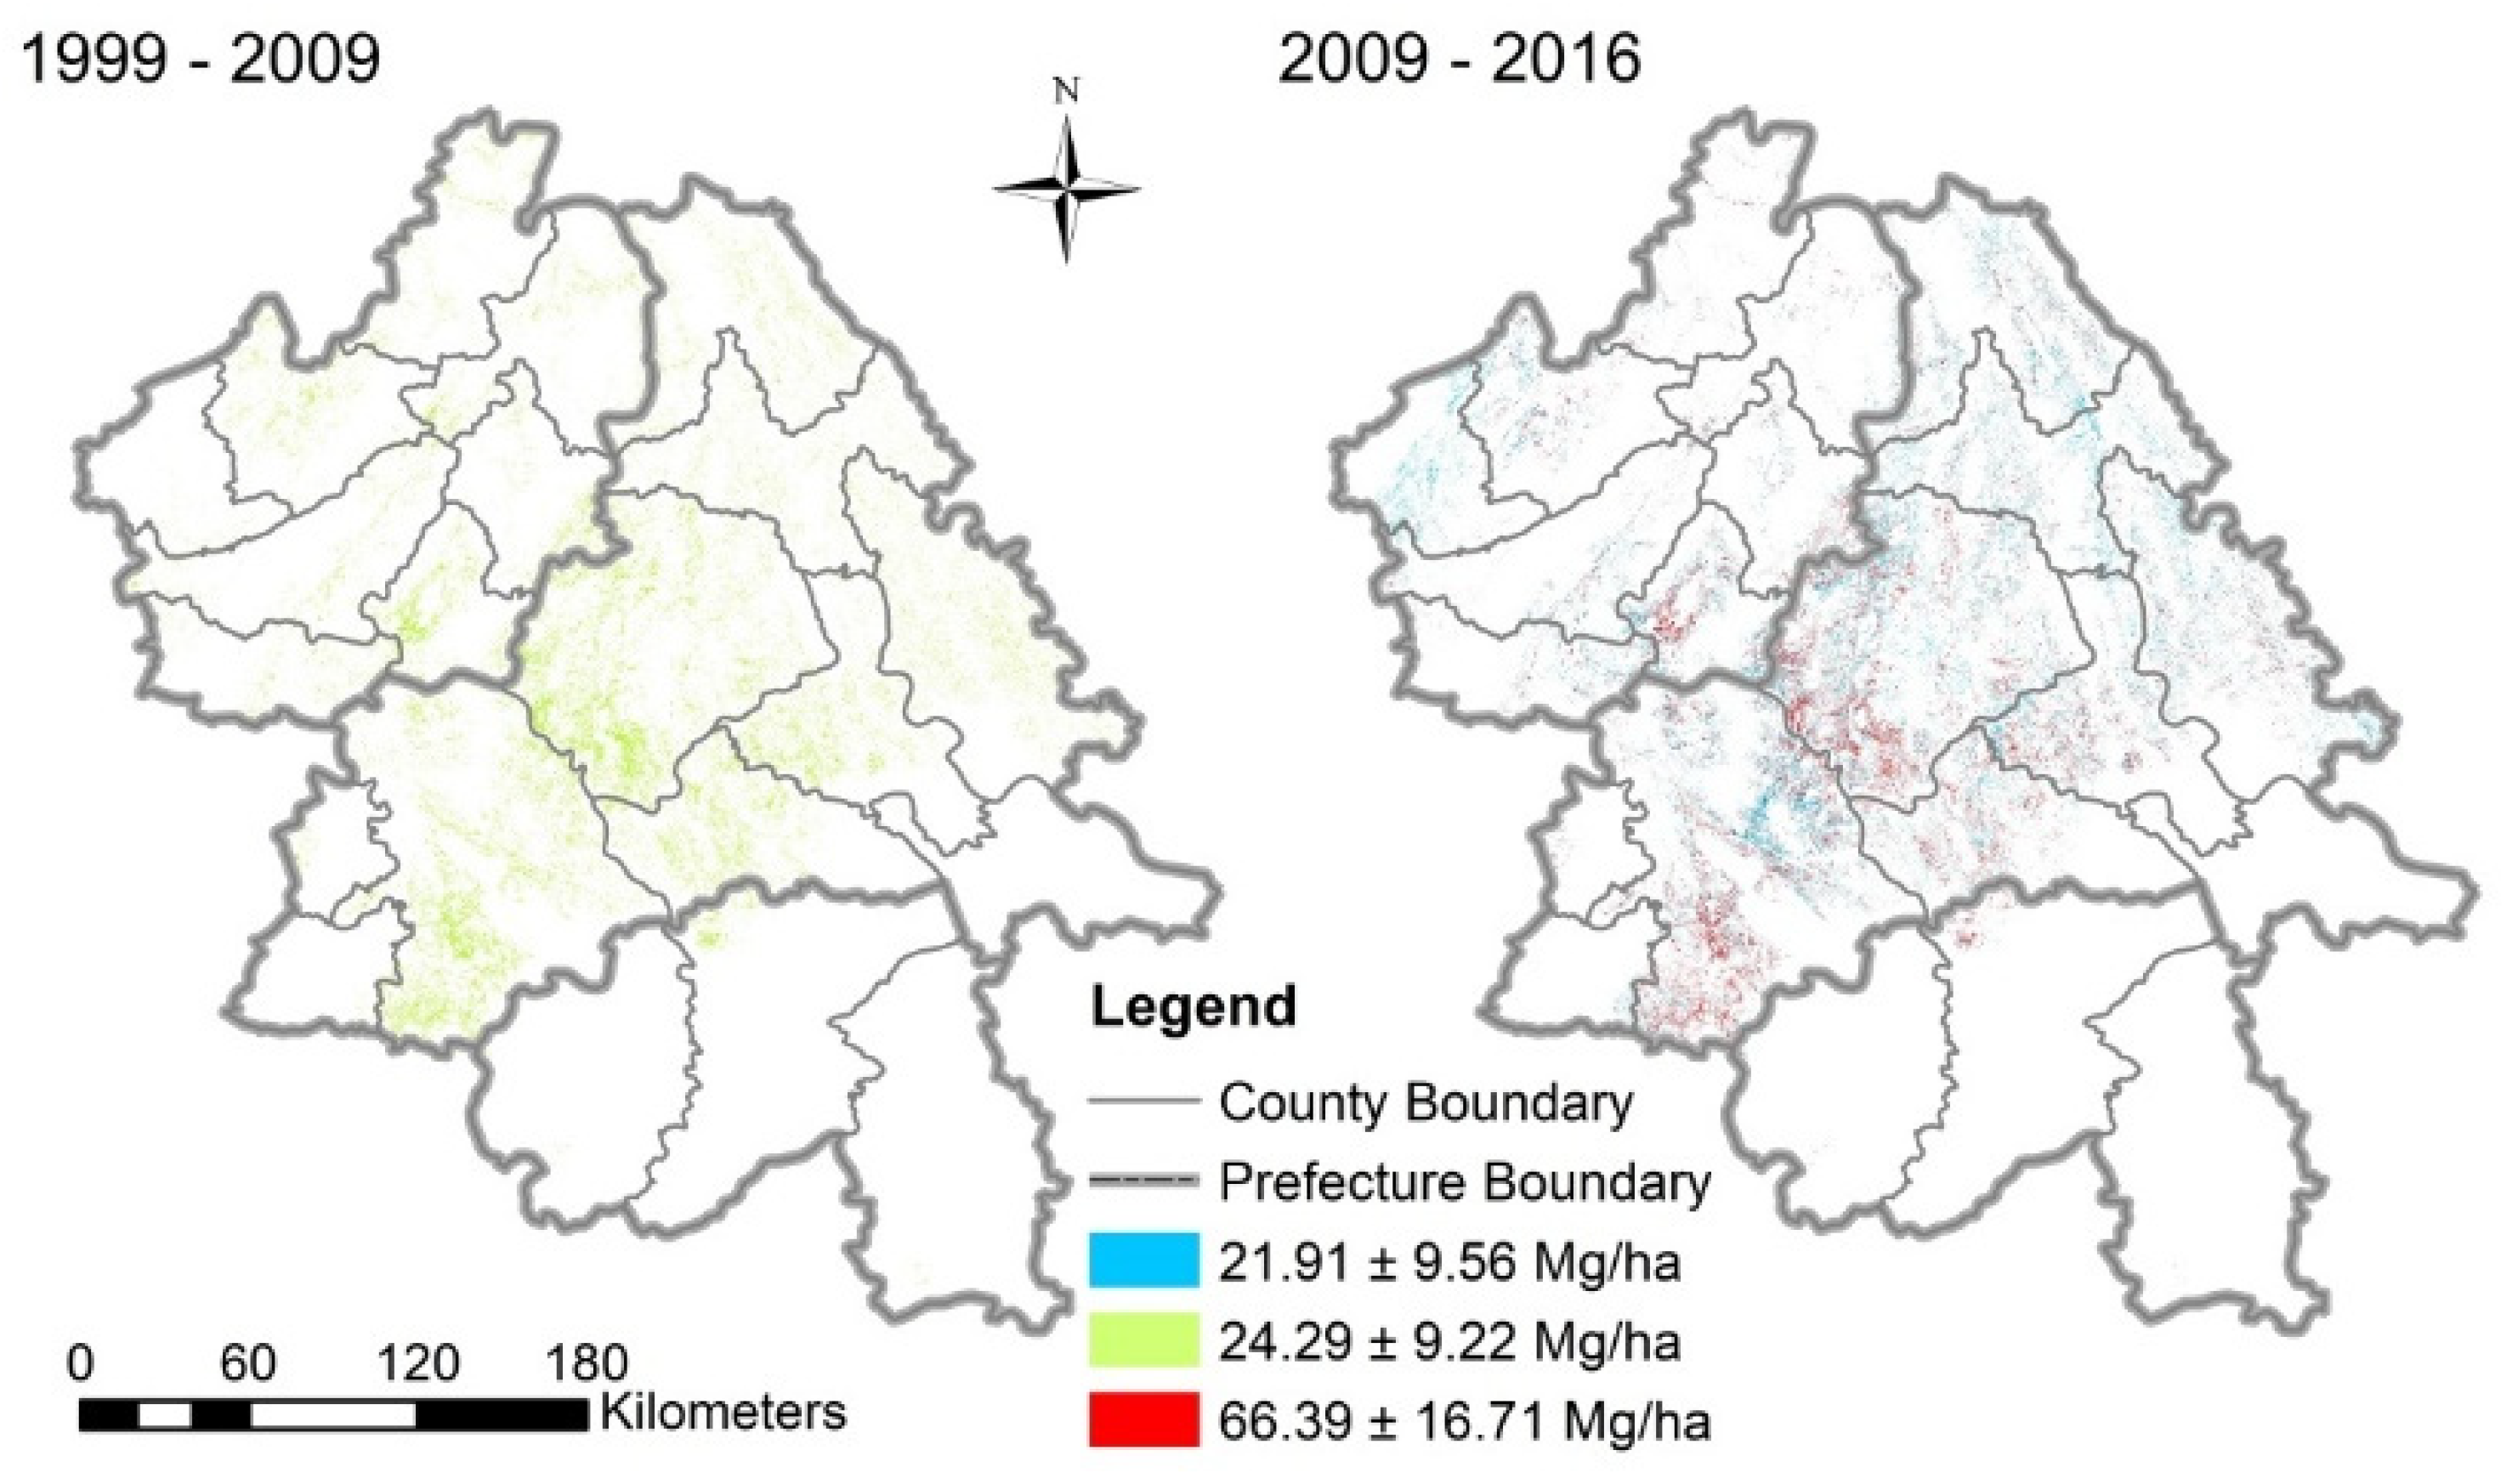
Figure 6.
Percentage change in carbon stock accumulation in different slope and elevation classes in the periods studied.
Figure 6.
Percentage change in carbon stock accumulation in different slope and elevation classes in the periods studied.
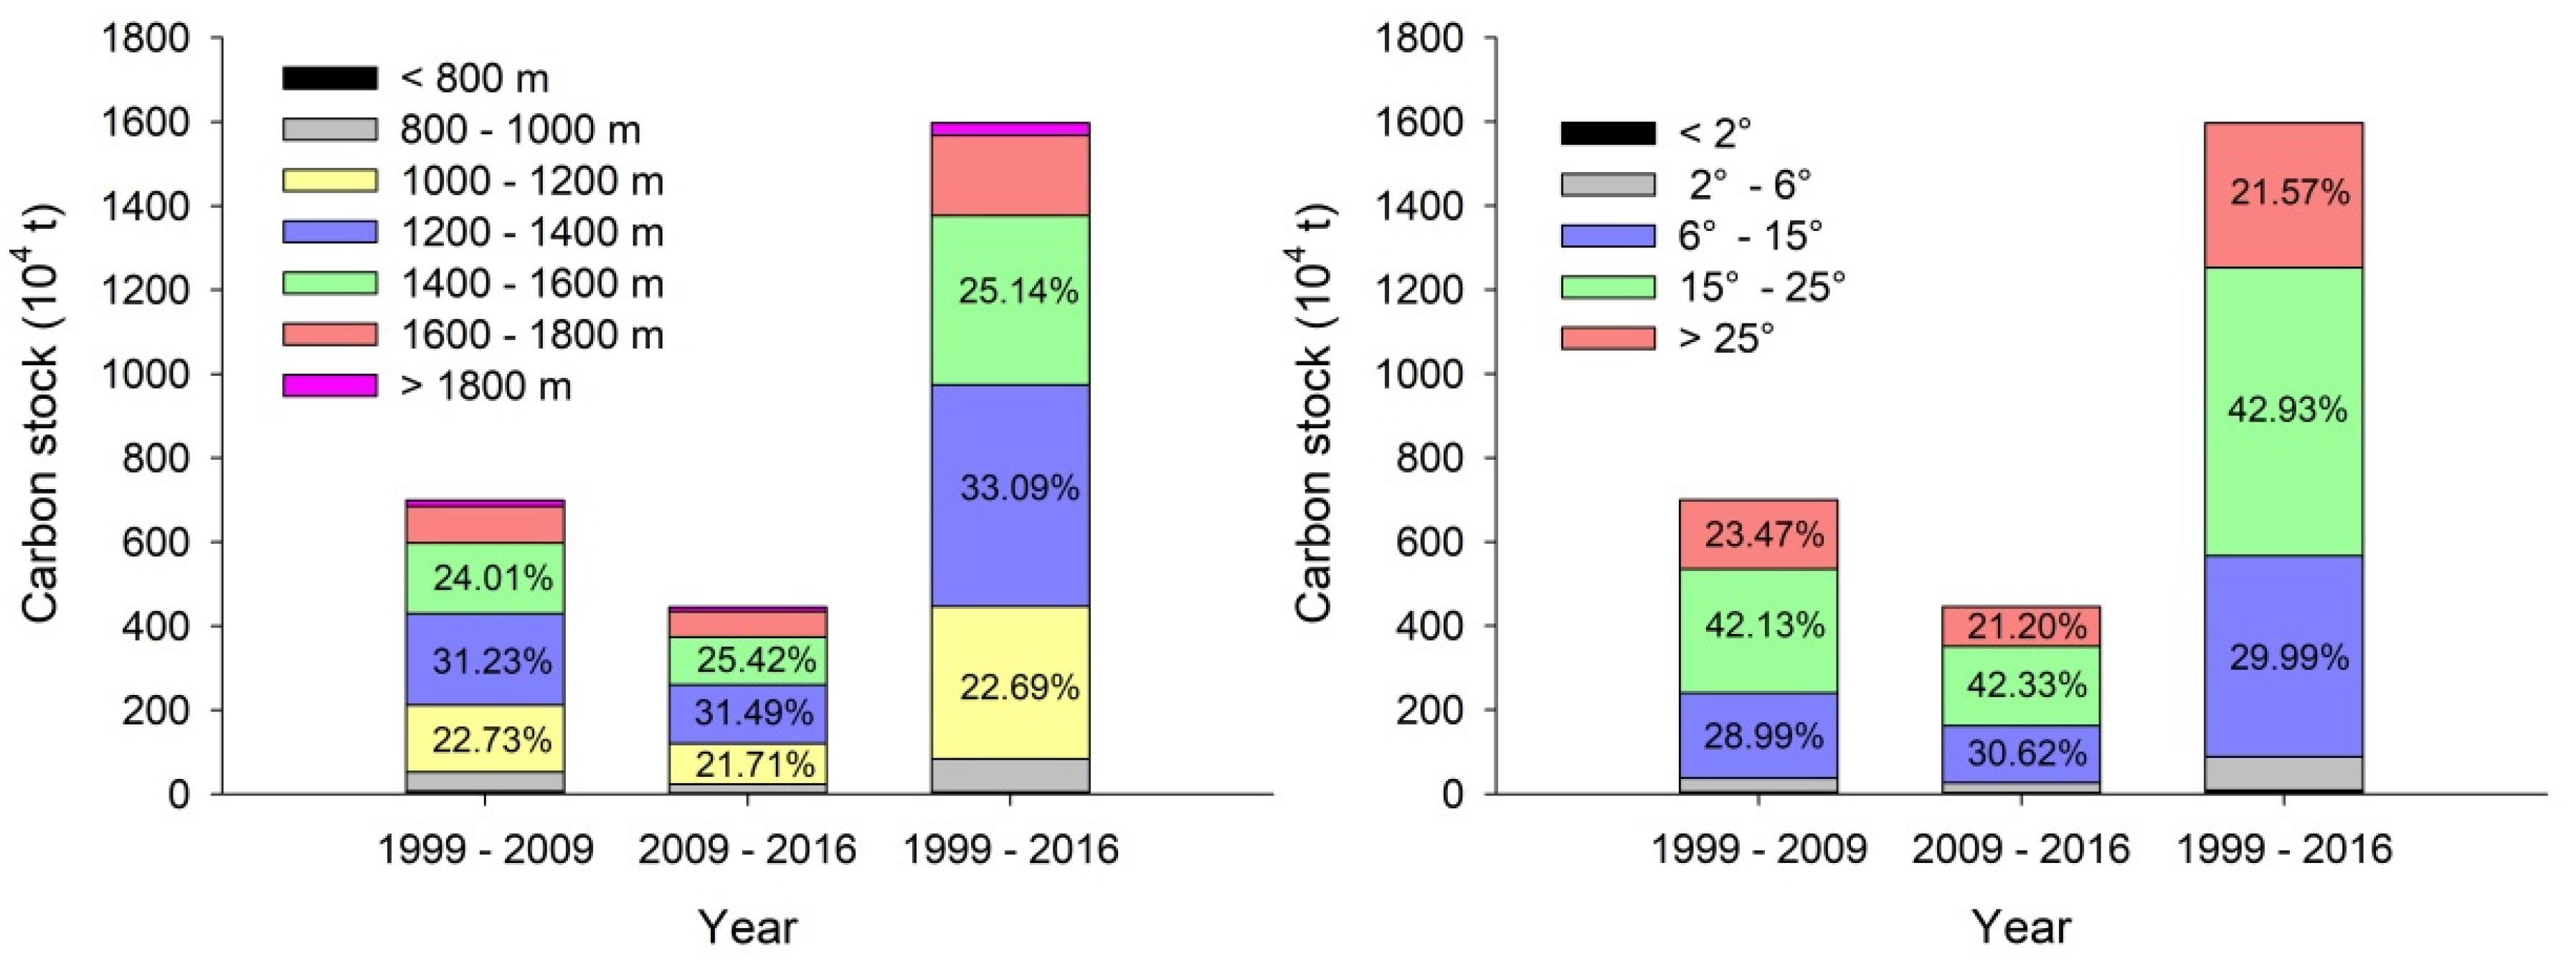
Figure 7.
Carbon stock (Tg) in Pinus kesiya forest, calculated using our STG method, which uses spatial-temporal data and GIS to infer forest age and distribution, and using Forest Identity Concept (FIC).
Figure 7.
Carbon stock (Tg) in Pinus kesiya forest, calculated using our STG method, which uses spatial-temporal data and GIS to infer forest age and distribution, and using Forest Identity Concept (FIC).
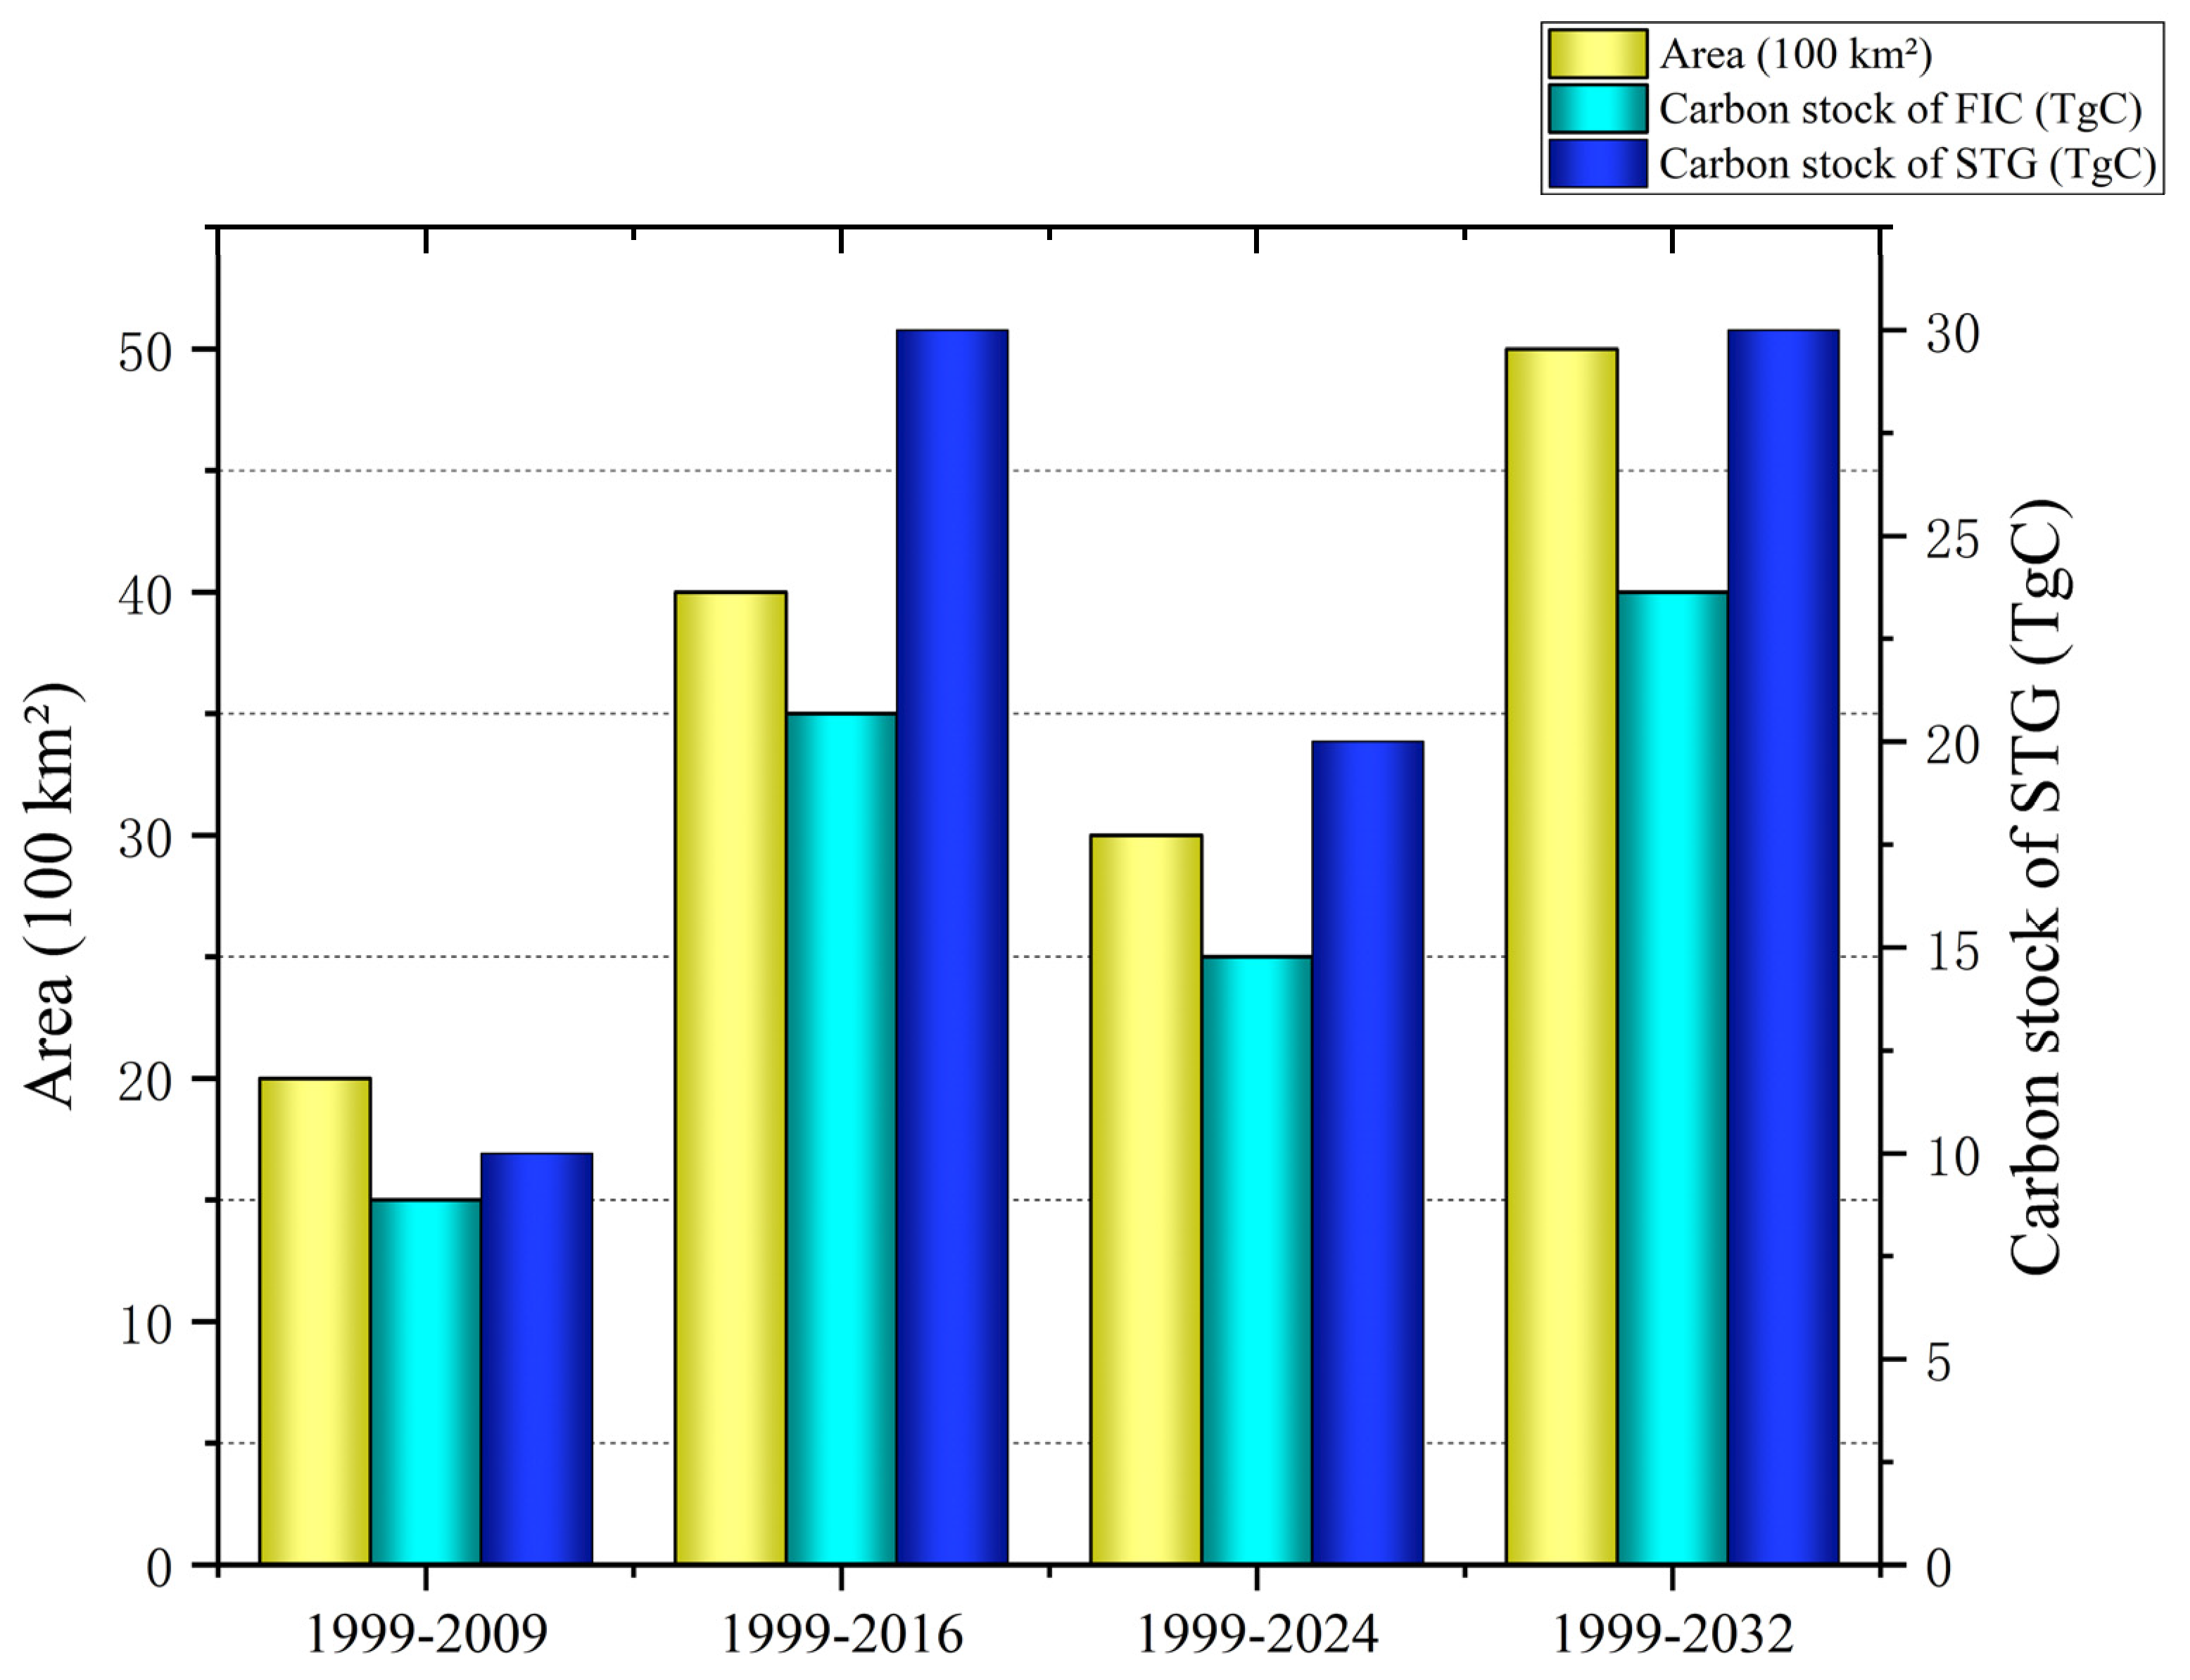
Table 1.
Path row numbers and sensors (TM/OLI) of the Landsat satellite in each selected year.
| Path row | 1999 | 2009 | 2016 |
| 129-44 | TM | TM | OLI |
| 129-45 | TM | TM | OLI |
| 130-43 | TM | TM | OLI |
| 130-44 | TM | TM | OLI |
| 130-45 | TM | TM | OLI |
| 131-43 | TM | TM | OLI |
| 131-44 | TM | TM | OLI |
| 131-45 | TM | TM | OLI |
| 132-43 | TM | TM | OLI |
| 132-44 | TM | TM | OLI |
Table 3.
Land-use transformation (km2) matrix for the period 1999 - 2009- 2016.
| 1999-2009 | 1999 | ||||||
| Pinus kesiya | Other forest | Shrubland | Farmland | Construction land | Water | ||
| Pinus kesiya | 5515.21 | 2708.89 | 2158.91 | 662.31 | 2.03 | 4.20 | |
| Other forest | 1299.43 | 24734.79 | 4746.38 | 3458.61 | 12.09 | 53.33 | |
| 2009 | Shrubland | 673.96 | 2547.54 | 4950.40 | 3407.16 | 15.40 | 5.61 |
| Farmland | 506.70 | 2442.33 | 6152.59 | 19482.85 | 148.67 | 72.55 | |
| Construction land | 3.81 | 99.33 | 111.99 | 726.44 | 136.17 | 18.40 | |
| Water | 1.50 | 29.63 | 23.85 | 89.27 | 10.70 | 174.25 | |
| 2009-2016 | 2009 | ||||||
| Pinus kesiya | Other forest | Shrubland | Farmland | Construction land | Water | ||
| Pinus kesiya | 7417.54 | 2187.67 | 1007.49 | 990.69 | 9.79 | 1.36 | |
| Other forest | 1745.18 | 26207.42 | 3742.85 | 4396.05 | 169.65 | 21.11 | |
| 2016 | Shrubland | 1244.42 | 3443.72 | 4198.67 | 4922.32 | 96.24 | 4.82 |
| Farmland | 558.38 | 2182.25 | 2475.19 | 17265.03 | 456.38 | 49.59 | |
| Construction land | 82.98 | 218.04 | 141.99 | 970.02 | 333.22 | 11.80 | |
| Water | 3.14 | 66.13 | 33.99 | 261.94 | 30.87 | 240.53 | |
Table 4.
Results of paired T test for carbon stock accumulation in different slope classes (S1-S5) in the periods studied.
Table 4.
Results of paired T test for carbon stock accumulation in different slope classes (S1-S5) in the periods studied.
| 1999-2009 | 2009-2016 | 1999-2016 | |
| Slope class | P value | P value | P value |
| S1 - S2 | - 0.0072 ** | - 0.0082 ** | - 0.0123 * |
| S1 - S3 | - 0.0051 ** | - 0.0037 ** | - 0.0088 ** |
| S1 - S4 | - 0.0033 ** | - 0.0019 ** | - 0.0065 ** |
| S1 - S5 | - 0.0006 *** | - 0.0005 *** | - 0.0024 ** |
| S2 - S3 | - 0.0049 ** | - 0.0032 ** | - 0.0084 ** |
| S2 - S4 | - 0.0032 ** | - 0.0018 ** | - 0.0063 ** |
| S2 - S5 | - 0.0005 *** | - 0.0004 *** | - 0.0019 ** |
| S3 - S4 | - 0.0034 ** | - 0.0034 ** | - 0.0070 ** |
| S3 - S5 | + 0.2342 n.s. | + 0.0746 n.s. | + 0.0871 n.s. |
| S4 - S5 | + 0.0175 * | + 0.0067 ** | + 0.0153 * |
*** = <0.001, ** = < 0.01, * = <0.05, n.s. = not significant.
Disclaimer/Publisher’s Note: The statements, opinions and data contained in all publications are solely those of the individual author(s) and contributor(s) and not of MDPI and/or the editor(s). MDPI and/or the editor(s) disclaim responsibility for any injury to people or property resulting from any ideas, methods, instructions or products referred to in the content. |
© 2025 by the authors. Licensee MDPI, Basel, Switzerland. This article is an open access article distributed under the terms and conditions of the Creative Commons Attribution (CC BY) license (http://creativecommons.org/licenses/by/4.0/).
Copyright: This open access article is published under a Creative Commons CC BY 4.0 license, which permit the free download, distribution, and reuse, provided that the author and preprint are cited in any reuse.


