Submitted:
24 June 2025
Posted:
25 June 2025
You are already at the latest version
Abstract
The performance and longevity of next-generation nuclear reactors depend on the implementation of sensing technologies able to withstand extreme conditions. This study evaluates the performance of femtosecond-inscribed Fiber Bragg Grating (fs-FBG) sensors under simulated operating conditions representative of newcleo’s Generation IV Lead-cooled Fast Reactors (LFRs). The primary goal of this preliminary test phase is to validate the suitability of fs-FBG sensors for high-temperature (300°C) and mechanical stress monitoring (1-5 kN cyclic tensile force), emphasizing their reliability and accuracy. The experimental campaign involved rigorous thermal and thermo-mechanical testing, conducted in compliance with ASTM standards, to assess key performance metrics such as linearity, repeatability, and precision. The results demonstrate that fs-FBG sensors deliver consistent and reliable measurements in extreme environments, with a temperature sensitivity of 12.62 pm/°C and a displacement sensitivity of 3.95 nm/mm. These findings provide a strong basis for the use of fs-FBG sensors in Generation IV nuclear reactors, highlighting their potential as advanced tools for structural health monitoring.
Keywords:
Fiber Bragg Grating (FBG)
; femtosecond-FBGs
; high-temperature monitoring
; stress monitoring
; nuclear reactors
; lead-cooled fast reactors
; Structural Health Monitoring (SHM)
1. Introduction
newcleo is a pioneering company that is innovating the nuclear industry to play a fundamental role in climate change mitigation and global decarbonisation. newcleo is developing new Generation IV Lead-cooled Fast Reactors (LFRs), which prioritize safety, efficiency, and sustainability. These reactors leverage the unique properties of lead as a coolant, such as superior thermal conductivity, high boiling point, and effective radiation shielding. The design minimizes the risks associated with water-cooled reactors, such as hydrogen production and core meltdown, while enabling operation at atmospheric pressure, simplifying reactor systems, and enhancing safety. Additionally, newcleo’s closed fuel cycle allows the recycling of nuclear waste, reducing environmental impact and optimizing fuel utilization.
Advanced monitoring technologies are essential to ensure the safe and efficient operation of these reactors, as they must withstand extreme operating environments characterized by high temperatures (360–550°C, for the vessel), mechanical stress, and radiation (from kGy to few MGy cumulated doses, according to the probe’s position). Currently, mechanical and electrical sensors dominate the market due to their broad measurement range, straightforward manufacturing processes, and cost efficiency [1]. However, traditional mechanical sensors often struggle with durability issues, particularly in demanding environments, where their limited displacement range and rigid structures pose challenges. Similarly, electrical sensors require intricate signal processing systems due to the complexity of their components, circuits, and connections, which can negatively impact measurement accuracy. Moreover, these sensors are highly vulnerable to external disturbances, including static electricity, electromagnetic interference (EMI), and radio frequency interference (RFI) [1,2].
To overcome these limitations, Fiber Optic Sensors (FOSs) have gained widespread adoption for detecting and analyzing various physical and chemical parameters [2,3,4]. Among these technologies, Fiber Bragg Grating (FBG) sensors [5] have emerged as a promising solution due to their compactness (external coating diameter smaller than 100 µm [6,7]), lightweight design, and ability to integrate seamlessly with reactor components [8], offering significant advantages over conventional technologies thanks to their minimal volume, flexible geometry, and non-invasive deployment [9]. Their high multiplexing capacity allows multiple sensors—up to 13-14 per fiber, and even more [10,11]—to operate on a single optical line, significantly reducing the number of cables and simplifying installation and network complexity. This feature is especially beneficial for long-distance monitoring or scenarios requiring a large number of sensors. FOSs also provide immunity to EMI, making them ideal for environments with high magnetic fields or radiation [2,4]. Additionally, they are explosion-proof, electrically isolated, and capable of safe operation in cryogenic and hazardous atmospheres. Their lightweight and compact design enables deployment in hard-to-reach locations, while remote sensing capabilities ensure reliable performance over significant distances between sensors and interrogators. Unlike traditional sensors, FBGs measure absolute parameters (e.g., Bragg wavelength) independent of power fluctuations, ensuring accuracy without requiring external references. Furthermore, FBSs exhibit remarkable sensitivity across a wide range of measurements, allowing precise detection of minute variations in temperature, strain, and pressure [8]. For instance, they demonstrate a temperature sensitivity of 13 pm/°C and a strain sensitivity of 1.2 pm/µ [8,9].
This study investigates the performance of fs-FBG sensors in high-temperature and mechanically stressed environments, replicating conditions found in Generation IV LFRs. FOSs are primarily designed to monitor the structural integrity of newcleo’s components, such as reactor vessel, control rods, and steam generator. They can provide real-time monitoring of critical parameters like temperature, stress, and structural integrity, enhancing reactor safety and reliability [12,13]. The research focuses on validating the sensors’ linearity, repeatability, and durability under these harsh conditions. To achieve this, a comprehensive testing campaign was conducted, including thermal cycles up to 300°C and thermo-mechanical tests on metallic specimens with FBGs bonded through high-temperature adhesives. This thermal upper limit is due to machine calibration limitations. However, reaching 300°C provides a strong basis for our analyses and tests. Future experiments will include additional testing loops at newcleo, specifically on molten lead test platforms, to further evaluate sensor performance and reliability.
2. Optical Fiber and FBG sensors
Optical fibers (illustrated in Figure 1) are cylindrical dielectric waveguides designed to transmit light along their axis through the mechanism of total internal reflection. They are composed of three main structural components [14]: the core, typically made of high-purity silica, sapphire or plastic materials, where light propagates; the cladding, also made of silica but with a lower refractive index to confine light within the core and allow its propagation through the principle of total internal reflection; and the coating, usually composed of polymer materials (e.g., polyimide), which provides mechanical protection and resistance to environmental stress. These fibers are widely utilized in sensing technologies due to their immunity to electromagnetic interference, compact size and multiplexing capability.
Fiber Bragg Gratings (FBGs) represent a great advancement in optical sensing technology. These gratings are inscribed within the core of an optical fiber as a periodic modulation of the refractive index. The periodic modulation creates a grating that reflects particular wavelengths of light while allowing others to pass through, thus functioning similar to a highly selective optical filter, as depicted in Figure 2. When light propagates through the fiber, the grating reflects a specific wavelength, known as the Bragg wavelength (), while other wavelengths pass through. The Bragg’s law is given by:
where is the grating period and is the effective refractive index of the fiber core.
The fundamental mechanism of FBG sensors is based on the principle of wavelength shift, where external perturbations such as strain, temperature, or pressure induce changes in the grating period () and the effective refractive index (). These variations result in a shift in the Bragg wavelength (), expressed as:
This relationship shows that the wavelength shift depends on changes in both the grating period and the effective refractive index, enabling precise measurements of external perturbations [5].
The sensitivity of FBGs to external parameters can be analyzed considering a measurand quantity X (e.g., temperature, strain, or pressure). The dependence of the Bragg wavelength on X is obtained by differentiating Eq. (2) with respect to X:
This equation shows that the measurand parameter X affects either the effective refractive index, the grating period, or both, depending on the nature of the perturbation [5].
For practical applications, this relationship can be simplified by introducing coefficients and , which represent the temperature and strain sensitivity of the sensor, respectively [16]. The simplified expression becomes:
where is the temperature change, is the strain applied to the fiber, , and . Here, is the thermal expansion coefficient, is the thermo-optic coefficient, and is the photoelastic constant.
The ability to decouple temperature and strain effects [5,8] depends on advanced sensor configurations, such as using multiple FBGs or temperature compensation techniques. These sensors are highly versatile, allowing precise monitoring of key parameters in challenging environments.
2.1. Application of Fiber Optic Sensors
In Structural Health Monitoring (SHM), FOSs enable high-resolution strain, pressure, and temperature measurements. They are used for monitoring underground infrastructure like tunnels [17], assessing landslide stress variations [18], and tracking pore pressure in geohydraulic structures [19]. Additionally, FOSs strengthen structures through fiber-based sensors integrated into carbon materials [20], and enhance leak detection in water infrastructure with active distributed temperature sensing (ADTS) [21]. FBGs can detect pipeline leaks by monitoring temperature and strain [22], while Fabry-Pérot interferometers (FPI) provide precise pressure monitoring in deep-sea oil wells [23]. Fabry-Pérot sensors are particularly valuable in extreme environments, operating at high temperatures (up to 400°C) and under intense radiation in nuclear reactors [24]. Their compact design reduces gamma heating, making them suitable for in-pile experiments [25]. These sensors maintain measurement integrity under harsh conditions, crucial for monitoring during events like Loss of Coolant Accidents (LOCA) [26] and for applications in severe nuclear accidents [27].
FOSs are widely used in the nuclear industry too, for their robustness in extreme environments. Applications include temperature monitoring ensuring safety and process control [28], and detecting pipeline leakages with distributed sensing systems [29]. FBG sensors also demonstrate high radiation tolerance and are under development for next-generation reactors [30,31]. Recent advancements in optical fiber technology have led to the development of radiation-hardened fibers capable of enduring extreme conditions, making them particularly suitable for applications in the nuclear reactors. These fibers are engineered to withstand high temperatures, with studies demonstrating their effectiveness in environments exceeding 300°C [32]. They are also designed to maintain performance under significant radiation exposure, with research highlighting their resilience against fast neutron fluences up to 1020 n/cm2s [33] and gamma doses reaching 200 kGy [34,35]. The integration of optical fibers in nuclear reactor designs allows for real-time monitoring of parameters like temperature, strain, and radiation dose rates [36,37], with FBGs proving effective for temperature and strain measurements under challenging conditions [38,39]. Furthermore, the development of sensors capable of detecting acoustic signals and vibrations in fuel assemblies enhances the ability to assess structural integrity and monitor reactor dynamics [40,41]. Studies on the effects of radiation-induced attenuation and luminescence [42,43] reveal significant insights into fiber behavior in high-radiation backgrounds, emphasizing the need for ongoing development to enhance their durability and functionality [44,45,46]. Recent advancements in optical fiber technology not only ensure reliable monitoring in nuclear facilities but also support their potential use in future reactor designs [28,30,47,48].
3. Case Study: FBGs for Gen. IV Reactors
Part of this study aims to develop an advanced platform for diagnostics and monitoring structural issues in the pre-mentioned Generation IV Nuclear Reactors. The platform will integrate innovative FOSs, specifically engineered to withstand extreme reactor environments—high temperatures (360–550°C), radiation exposure (kGy to MGy), neutron flux (approximately 1012 to 1015 n/cm2s), and mechanical constraints. In addition, it will incorporate software tools that maximize data extraction and make insights accessible to operators. Since developing innovative and effective sensing technologies for LFRs is a central focus for newcleo, FOSs have been identified as one of the most promising solutions for continuous monitoring of critical operational parameters and structural integrity. Their selection is also attributed to their high technology readiness level. FOSs are developed mainly for monitoring parameters for the reactor vessel, control rods and steam generator structures, highlighted in Figure 3. An in-depth analysis and testing about how and where to place these sensors, which are going to be integrated with the actual design of the components, is part of this project.
The Reactor Vessel (RV) hosts the core and facilitating coolant circulation. The RV consists of a cylindrical shell with a tori-spherical bottom head. It is located inside the Reactor Building and its flange rests on the support structure all around its circumference. The function is the containment of primary coolant and cover gas. The total height of the vessel is 5140 mm and the wall thickness is 30 mm. Its compact design enhances safety and operability by reducing radioactive waste and eliminating components like shielding and breeding assemblies. Optical fibers with FBG sensors are proposed to be mounted externally on the RV’s wall, avoiding in this case direct exposure to molten lead. Temperature, strain, and vibrations on the RV’s internal surface are inferred using models that correlate external FBG measurements to internal conditions via thermal conduction and elastic wave propagation [32,41]. For durability, optical fibers can be embedded in grooves machined into the RV wall and secured with high-temperature resin. This method (example shown in Figure 4) ensures robust sensor installation while shielding the fibers from mechanical and environmental stress. Radiation-hardened fibers with protective ceramic coatings are recommended for nuclear environments [40,49].
The spiral-tube Steam Generator (SG) shows newcleo’s commitment to compactness, safety, and reliability. It features a thick plate supporting the SG flange, two perforated shells, and a lower plate to support the tube bundle’s weight. The top plate allows vertical tubes to connect to the reactor roof, while the inner perforated shell directs lead flow to the tube bundle and couples with the Amphora-Shaped Inner Vessel (ASIV). The thinner outer shell directs cold lead flow outside the SG. Operating at 140 bars, the steam generator converts heat from liquid lead into superheated steam, ensuring efficient heat transfer and preventing lead-water interactions while enhancing safety and structural stability. Optical fibers can be integrated into the SG design through encapsulation into a stainless-steel housing, and tack-welded [47] onto the tubes, possibly also covered in high-temperature and radiation resistant adhesives [47,50] to ensure perfect adhesion. The methodology is explained by Birri et al., and illustrated in Figure 5. Here, direct contact with molten lead is unavoidable. Alternatively, FOSs can be embedded in grooves machined onto the tube surfaces [32,51], that provides accurate measurements while protecting against molten lead and mechanical damage. High-precision machining or laser technologies shall be used to create the grooves, with fibers secured via laser welding or encapsulated in durable materials like ceramics or metal alloys. Protective sheaths of stainless steel or ceramics [52] enhance durability, shielding fibers from extreme conditions and structural stresses. While this method improves accuracy and robustness, further research is needed to ensure the mechanical integrity of the tubes and long-term fiber protection [31].
Concluding, Control Rods (CRs) are used for both reactivity regulation and passive safety. To effectively control the system, six CRs are positioned at the core periphery to manage reactivity changes associated with the transition from cold shutdown to full power, mitigate criticality swings during irradiation cycles due to fuel depletion, and command power variations. These CRs utilize neutron moderation to influence the chain reaction, and their unique flag shape is designed to optimize this control mechanism. Optical fibers can be included into the CRs’ design following the same reasoning done for the steam generator. The most promising solutions seems to be embedding them within grooves machined onto their surfaces (Figure 6) [32]. The grooves protect the fibers from molten lead and mechanical forces while being filled with high-temperature, radiation-resistant resin to secure and shield the fibers. A stainless steel tube encases the fibers [50], offering enhanced protection against corrosion, thermal shocks, and radiation. A silica micro-capillary tube [53] between the optical fiber and the steel can be further integrated, mitigating thermal expansion mismatches and shielding the fiber from contaminants and stresses. This multi-layered setup ensures mechanical robustness, chemical stability, and accurate long-term performance.
3.1. FOSs in High Temperature Environments
In moderate temperature ranges (0°C to 200°C), FBGs exhibit stable temperature sensitivity, from 11 to 13 pm/°C, due to the thermo-optic effect and fiber thermal expansion [8,9,48]. However, beyond this range, the sensitivity becomes non-linear, requiring polynomial calibration for accurate measurements. Silica fibers, commonly used in FBGs, perform well up to 300°C but degrade at higher temperatures. Above 500°C, hydrogen ingress can destabilize silica, causing fractures on the fiber’s surface [54]. Furthermore, between 500°C and 900°C, silica fibers become prone to embrittlement, and their protective coatings, such as polyimide, degrade more rapidly at elevated temperatures [12].
At extreme temperatures, structural integrity becomes a challenge. As the temperature increases, the refractive index contrast in the fiber diminishes, which can lead to shifts in the grating period. At around 700°C, dopants such as germanium (Ge) can escape from the fiber core, erasing the gratings. At temperatures exceeding 900°C, the silica fiber itself becomes thermally unstable, leading to the complete degradation of the gratings [12]. However, this should not be newcleo’s scenario, since temperatures are expected to be in the range of 360–550°C.
3.1.1. Reinforcement strategies
FBG fabrication techniques, such as the phase-mask method [8] and femtosecond laser inscription [5,8], play a crucial role in determining the grating’s performance. Femtosecond laser inscription, in particular, enables the creation of highly stable gratings in non-photosensitive fibers, making them ideal for applications in high-temperature and radiation-intense conditions. Fs-FBGs are classified into two main types: Type I and Type II [13]. Type I gratings are formed with laser pulses below the glass damage threshold, inducing densification and a positive refractive index change. In contrast, Type II gratings are produced with laser pulses above the damage threshold, resulting in significant structural changes and enhanced thermal stability, with functionality maintained at temperatures up to 1000°C [13]. The use of femtosecond lasers enables the fabrication of gratings stable up to the glass transition temperature of the fiber material, making them ideal for high-temperature applications [12]. In contrast, UV-inscribed FBGs suffer from limitations such as lower thermal stability and the need for photosensitive fibers [8]. Unlike fs-FBGs, which remain stable up to the glass transition temperature, UV-inscribed gratings degrade at significantly lower temperatures, making them less suitable for high-temperature and radiation-intense applications [5,12].
Regeneration techniques have been shown to enhance the thermal stability of fs-FBGs [13,48]. In particular, regenerating ’seed’ FBGs is a promising approach to extending their operational lifetime in high-temperature environments [48,55,56]. This process involves annealing a fully saturated seed grating at high temperatures, up to 950°C [48,56], leading to the formation of regenerated FBGs (RFBGs) with enhanced thermal stability. Factors such as annealing protocol, fiber composition, and hydrogen sensitization determine the reflectivity and mechanical properties of the regenerated gratings [55,57]. Recent advancements have demonstrated significant improvements, with RFBGs achieving mechanical strengths up to four times greater than standard FBGs and showing operational stability even at temperatures exceeding their regeneration point by over 100°C [55,56].
RFBGs have proven capable of operating continuously at temperatures above 1000°C [58], with some demonstrating lifetimes exceeding 9000 hours at 890°C [13,56]. Their dual functionality for temperature and stress–strain monitoring has been confirmed, achieving, respectively, sensitivities of 16.50 pm/°C and 1.25 pm/µ [55]. Despite their robustness, challenges remain, including brittleness induced by the relaxation of internal stresses during regeneration and low reflectivity, which limits their dynamic range [48,55]. Future work should focus on improving annealing methods to mitigate brittleness, developing encapsulation techniques for enhanced mechanical protection, and validating long-term performance under combined thermal, mechanical, and radiative stresses [55,56].
Coatings play a fundamental role in enhancing the performance and durability of FOSs in high-temperature environments [51,52]. Polyimide coatings are widely used for their flexibility and thermal stability but degrade beyond 350°C, limiting their long-term use in extreme conditions [51]. Metal coatings, such as titanium and zinc, offer superior thermal and mechanical stability above 400°C, making them more suitable for demanding applications [59]. Titanium-coated FBGs excel in strain sensitivity, while zinc coatings show high sensitivity to temperature, with bimetallic coatings (e.g., Ti/Zn) balancing both properties [59].
For harsher environments, such as nuclear reactors or molten lead-bismuth eutectic (LBE) systems, double-tube protection (Figure 7) and ceramic coatings are preferred. Stainless steel tubular housings shield fibers from corrosion and mechanical stress, while ORMOCER coatings resist LBE-induced damage [50,60]. Additionally, advanced designs using RFBGs with dual-layer protection demonstrate exceptional thermal endurance (up to 1000°C) and enhanced strain sensitivity, making them ideal for extreme conditions [53].
3.2. FOSs in Radiative Environments
Silica-based optical fibers exhibit varying performance degradation due to radiation effects, such as Radiation-Induced Attenuation (RIA), Radiation-Induced Emission (RIE), and Radiation Induced Refractive Index Change (RIRIC) [36,42,61]. RIA occurs when radiation induces point defects within the silica matrix, increasing light absorption and signal attenuation [42,61]. Fiber composition, particularly doping elements like germanium, phosphorus, and aluminum, influences the severity of RIA, with pure-silica fibers showing superior resistance [42]. Additionally, fibers doped with elements such as germanium exhibit higher sensitivity to radiation-induced defects, while fluorine-doped fibers tend to resist radiation effects better. RIA can be somewhat mitigated through post-irradiation treatments, like hydrogen loading [42]. RIE, on the other hand, results in the generation of light within the fiber during radiation exposure, which, while useful for dosimetry, can interfere with fiber-based communication systems [42]. RIRIC occurs when radiation alters the refractive index of the fiber due to changes in its glass matrix, potentially affecting fiber performance in sensor applications [42,61]. Neutron irradiation contributes to these changes, with neutron flux inducing compaction in the silica matrix, which leads to an increase in the refractive index, affecting sensor accuracy. The signature of displacement damage typically becomes apparent at neutron fluences of 1016–1017 n/cm2s, further influencing the fiber’s optical properties [33,38,62].
When exposed to radiation, FBGs typically suffer from two primary effects [43]: radiation-induced Bragg wavelength shift (RI-BWS) and signal-to-noise ratio reduction [61], and both effects are shown in Figure 8. These effects stem from changes in the optical properties of the fiber due to radiation interactions with the material’s atomic structure. Radiation alters the refractive index of the fiber core, primarily through defect formation in the silica matrix. These defects, sometimes referred to as ’color centers’, absorb light and distort the transmission characteristics of the fiber, leading to wavelength shifts that reduce the accuracy of the sensor. The extent of damage depends on fiber composition and pre- or post-inscription treatments. Radiation-resistant fibers, such as hollow-core photonic bandgap fibers, have demonstrated greater resilience, maintaining low levels of attenuation and retaining sensor accuracy under extreme radiation conditions [63]. Notably, FBGs continue to show resilience even under prolonged radiation exposure, maintaining functionality and temperature sensitivity crucial for nuclear reactor monitoring [39,63].
The performance of optical fibers degrades when exposed to high radiation and temperatures [43,44]. RIA increases as both factors accelerate defect formation, with RIA levels varying based on radiation dose and temperature [64]. Understanding this interplay is fundamental for fiber reliability in extreme environments. Temperature’s effect on RIA is dose-dependent. Below 30 kGy, temperature helps anneal defects, but above this threshold, RIA increases with temperature up to 92°C, after which it plateaus [64]. This suggests that higher temperatures may counteract some radiation damage. Mechanical properties are also affected. Polyimide-coated fibers, which withstand temperatures up to 300°C, lose mechanical strength when exposed to high radiation doses at elevated temperatures. At 10 MGy(SiO2) and 100°C, their tensile strength drops, limiting their long-term reliability [40,64].
3.2.1. Reinforcement strategies
RIA significantly degrades the performance of optical fibers in radiative environments, necessitating the development of radiation hardened fibers [44]. These fibers, typically employing Pure Silica Cores (PSC) or Fluorine-doped cores, minimize color center formation during irradiation and exhibit RIA levels around 10 dB/km at 1550 nm for doses up to several hundred kGy, with reliable operation even at MGy dose levels and neutron fluences of 1020 n/cm2s [33]. Radiation-tolerant fibers, using Germanium-doped cores, offer a cost-effective solution for environments with lower total ionizing doses, maintaining low RIA values for applications such as short data links or lead fibers [65].
The performance of optical fibers under radiation depends heavily on core composition, dopants, and drawing conditions. While PSC fibers are ideal for telecom applications, their performance in radiative environments varies, with some exhibiting high RIA values of up to 2000 dB/km at doses as low as 2 kGy [33]. Temperature also influences RIA behavior, affecting defect kinetics and recovery, making tailored designs essential for environments with fluctuating radiation and thermal conditions [65].
Coatings are equally crucial for radiation resistance and mechanical integrity. Acrylate coatings degrade rapidly under radiation, while high-temperature acrylates perform better. Polyimide coatings, resilient up to 300°C, degrade under high radiation and temperature, while aluminum coatings offer protection at higher temperatures but increase micro-bending sensitivity [64,65]. Figure 9 shows RIA values, with polyimide demonstrating a slight reduction in RIA compared to acrylates and aluminum due to optimized drawing conditions. Polyimide-coated fibers maintain low RIA at lower radiation doses, but at doses above 10 MGy, particularly at 1625 nm, RIA increases sharply, limiting signal transmission in high-radiation environments [64]. Thermal degradation above 350°C further weakens polyimide coatings, as shown in lifetime predictions in Figure 10 [40].
Rare-earth (RE) doped optical fibers, such as those incorporating Erbium (Er) and Ytterbium (Yb), present unique challenges and opportunities for radiation hardening [66]. The inclusion of codopants like cerium in phosphosilicate-based cores has proven effective in reducing RIA, particularly by mitigating the formation of P1 defects associated with phosphorus. Hydrogen pre-loading further enhances the radiation tolerance of these fibers by suppressing defect precursors and improving RIA behavior, even at cumulative gamma-ray doses of up to 50 krad [45,66]. Hydrogen loading and fluorine doping have been employed as advanced radiation hardening techniques [45]. Hydrogen treated silica fibers have demonstrated significantly reduced RIA, attributed to the suppression of defect precursors like non-bridging oxygen hole centers. This treatment effectively converts these defects into less harmful hydroxyl groups, substantially lowering RIA levels, especially in the visible spectrum. However, challenges such as radiation-induced luminescence remain, particularly under gamma and neutron irradiation [45].
4. Materials and Methods
newcleo’s operating environment is characterized by high temperatures (360–550°C) and high cumulated radiation doses (1–10 MGy), combined with a corrosive environment due to molten lead used as coolant. This article presents a comprehensive experimental setup aimed at evaluating, in the first instance, the performance of different FBG sensors under varying thermal and structural conditions. The setup is designed to evaluate the influence of three primary factors—fiber type, wavelength, and gluing technology—on the system’s performance. Similar tests, with lower temperature thresholds, were already conducted in Politecnico di Torino by Aimasso et al. [15,16,67].
The testing setup included four single-mode optical fibers, each 1 m in length, supplied by Télefo S.p.A. The fibers had a core diameter of 9 µm and a cladding diameter of 125 µm (type SM1250SC9/125P), featuring a germanium-doped silica core and a pure silica cladding. The fibers were coated with polyimide. FBGs were inscribed directly into the fiber cores by the supplier using an infrared femtosecond laser (approximately 800 nm wavelength) through the original polyimide coating, preserving mechanical integrity. The laser operated with a pulse duration of approximately 100–300 fs and pulse energy in the range of 200–600 µJ, leading to the formation of Type II gratings, which involve permanent structural changes in the glass matrix due to nonlinear absorption effects. These gratings are known for their high thermal stability and robustness in harsh environments. Each grating was approximately 5–10 mm long, centered in the telecom band (around 1550 nm), with a reflectivity between 54–55%, a bandwidth of 0.35 nm, and a side lobe suppression ratio (SLSR) of 30 dB, indicating a clean spectral profile suitable for multiplexing. The fibers’ ID and detailed specifications are listed in Table 1.
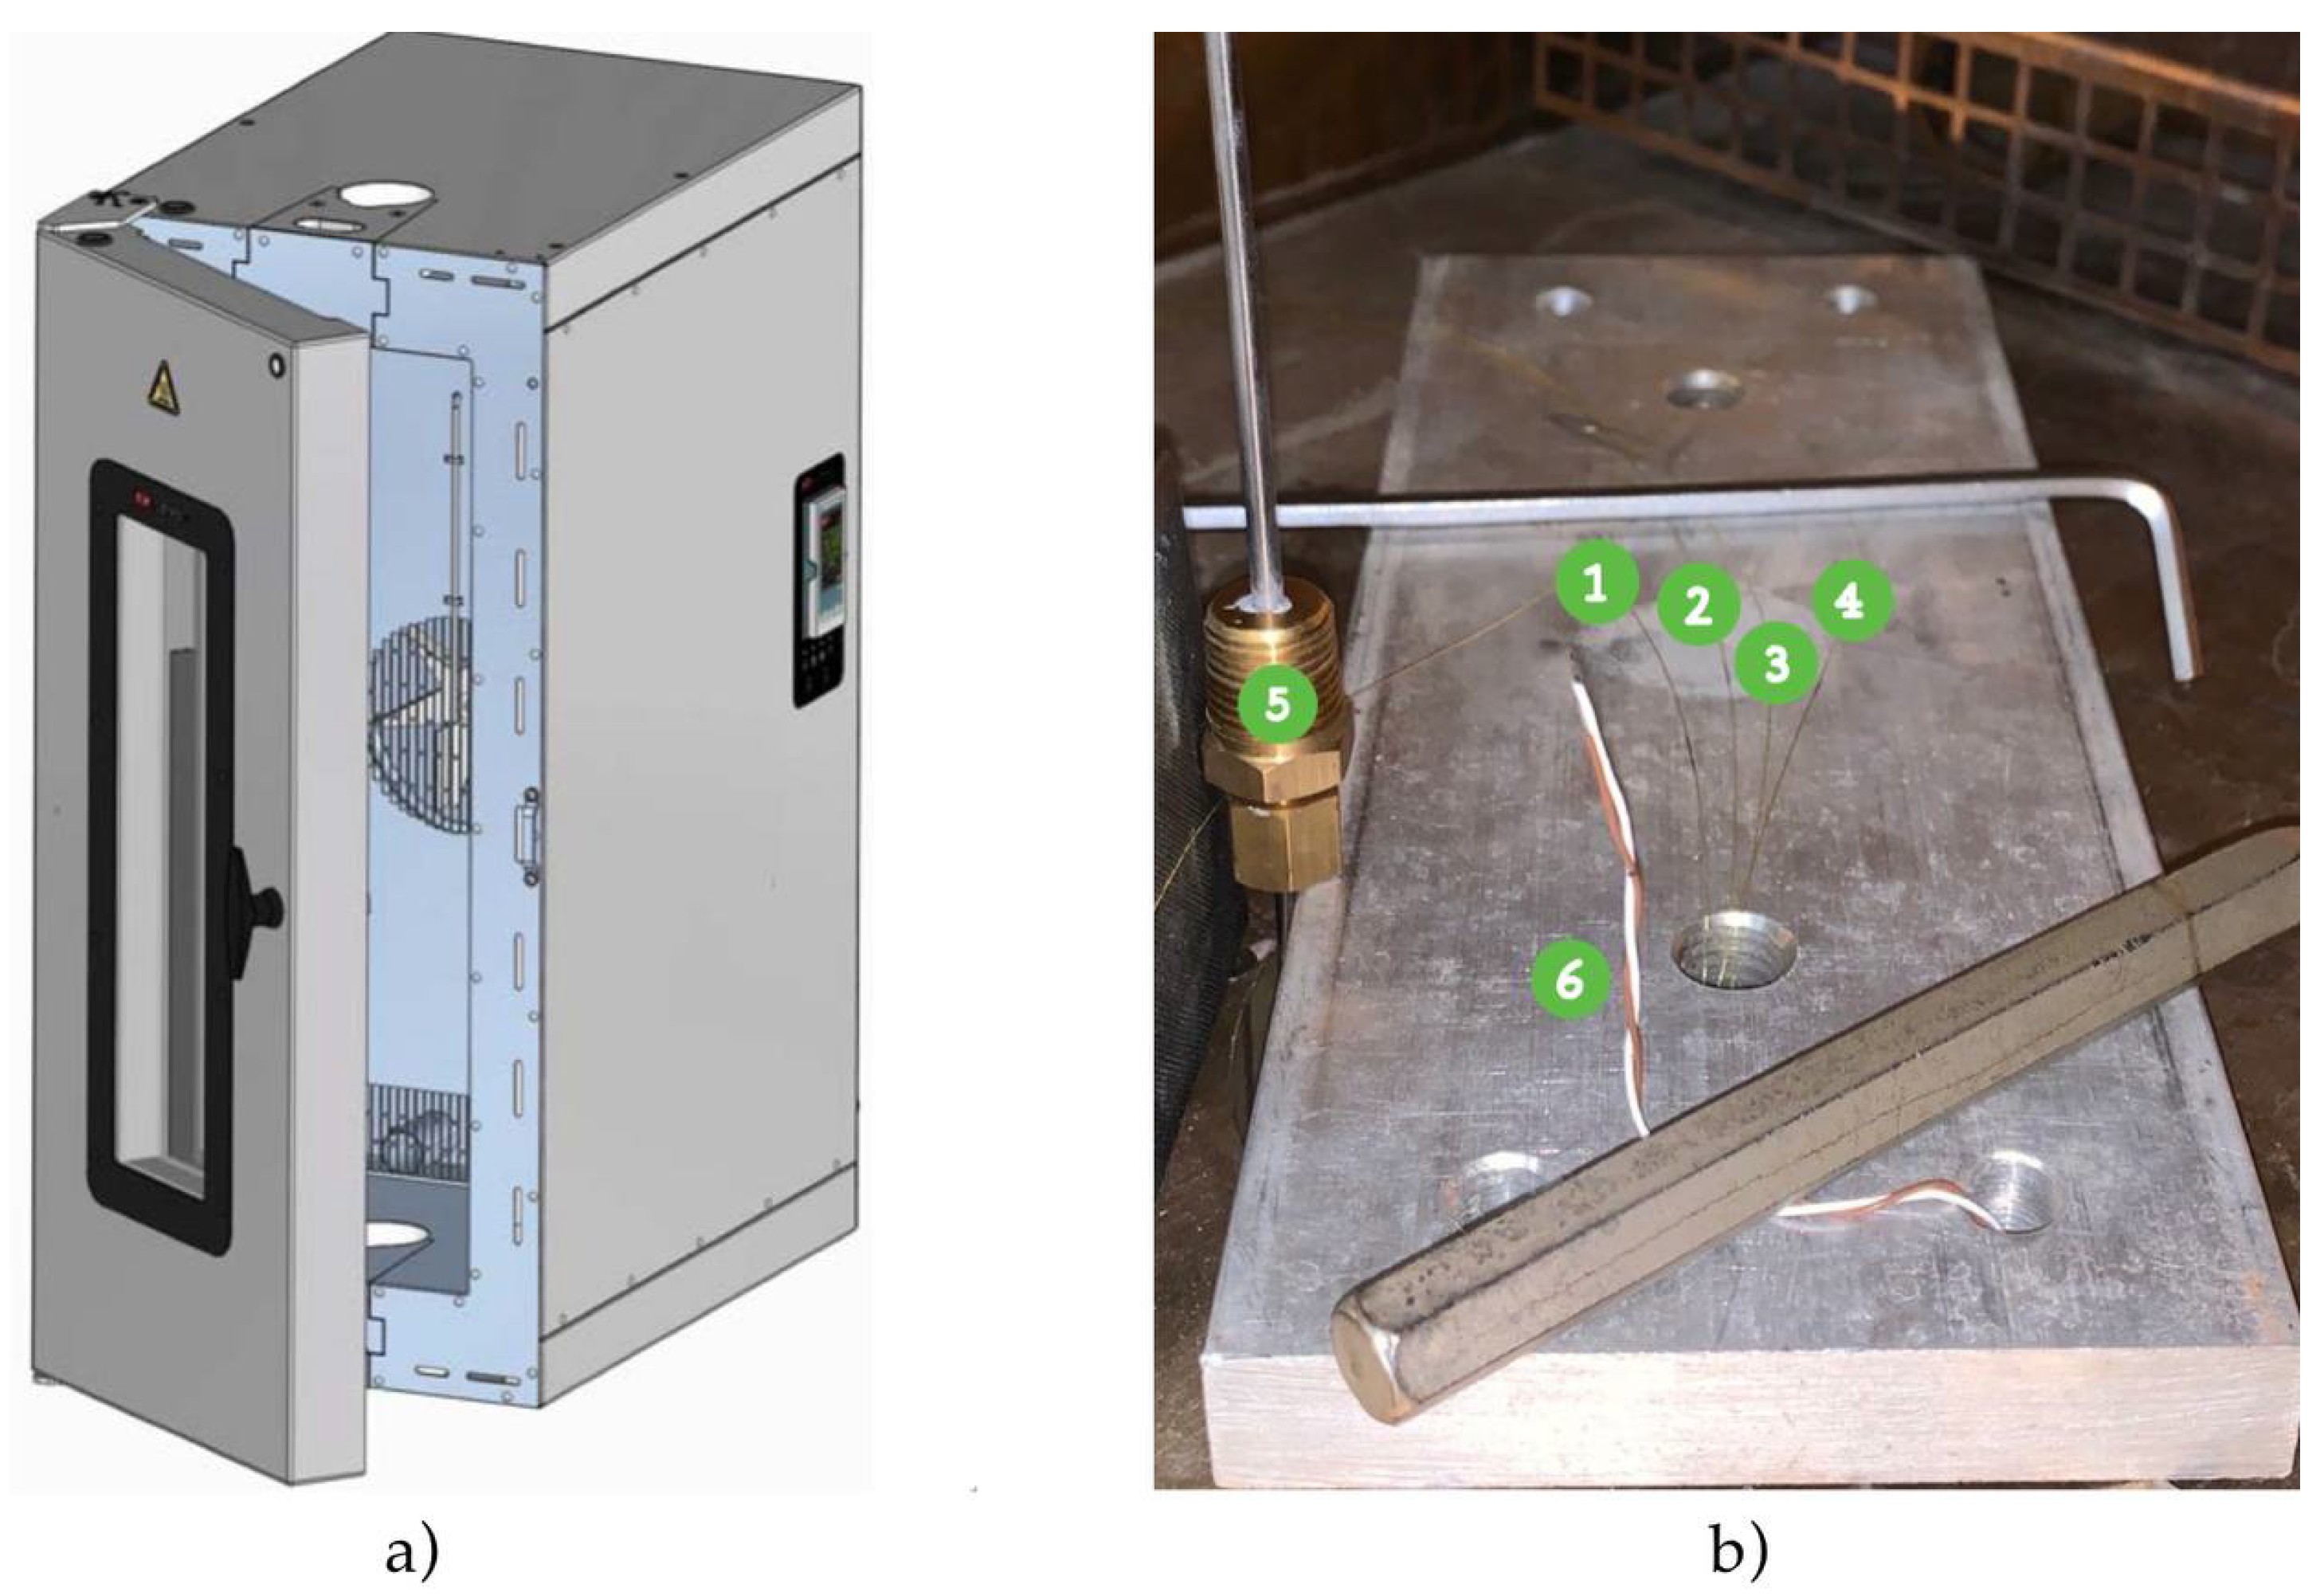
The resin utilized to bond optical fibers to the specimens, during mechanical tests, was WEICON Ceramico W, supplied by WEICON®. All the tests were executed inside the 3119-607 Temperature Controlled Instron chamber of Politecnico di Torino (Figure 13(a)).
The interrogation system comprised a SmartScan SBI laser interrogator, capable of monitoring four FBGs simultaneously, transmitting a laser beam, and analyzing the reflected wavelengths. The interrogator was developed by the Smart Fibres company (Bracknell RG12 9BG, UK). This setup minimized data misinterpretations and allowed for independent communication with each sensor. The complete laboratory configuration, illustrated in Figure 11, integrated both FBGs and thermocouples for cross-referencing temperature and strain measurements.
The experimental design involves testing up to four FBGs across multiple wavelengths and gluing methods, under controlled thermal cycling and structural loading conditions: the performance of FOSs can vary significantly depending on the type of fiber, wavelength of operation, and the gluing technology used for sensor integration. The goal is to identify the most promising fiber optic sensors for industrial applications that require high temperature and structural resistance.
Each test is conducted with two repetitions: the first one establishes a baseline for consistency, while the second serves to confirm the reliability of the results. This approach is sufficient for thermal cycles because the nature of thermal processes tends to produce consistent outcomes with minimal variation, as experienced by Madan et al. [51,52]. The relatively stable behavior of materials during thermal cycling means that two repetitions can effectively capture any significant trends or deviations without the need for additional trials. Future research and testing will be conducted, with the main focus on testing fibers in radiative environments [49,54], to evaluate the responsiveness and degradation of the sensors under gamma radiation [12,34,37] and neutron flux [39,62].
4.1. Thermal Testing of Free Fibers
Two thermal tests were conducted inside the Instron thermal chamber, capable of reaching temperatures up to 300°C. Fibers were placed on a neutral platform, as shown in Figure 13(b) and subjected to step-wise thermal cycles with heating rates of 60°C/min and holding phases of 20 minutes at every 100°C. The ideal thermal cycle to be executed is shown in Figure 12.
Figure 12.
Stepwise temperature cycle example. Here, it is proposed a thermal test with a heating rate of 60°C/min, including a holding phase of 20 minutes every 100°C. Once the maximum operating temperature is reached, the chamber will be turned off to allow it to naturally cool down to room temperature (this is an estimate close to the required time for cooling).
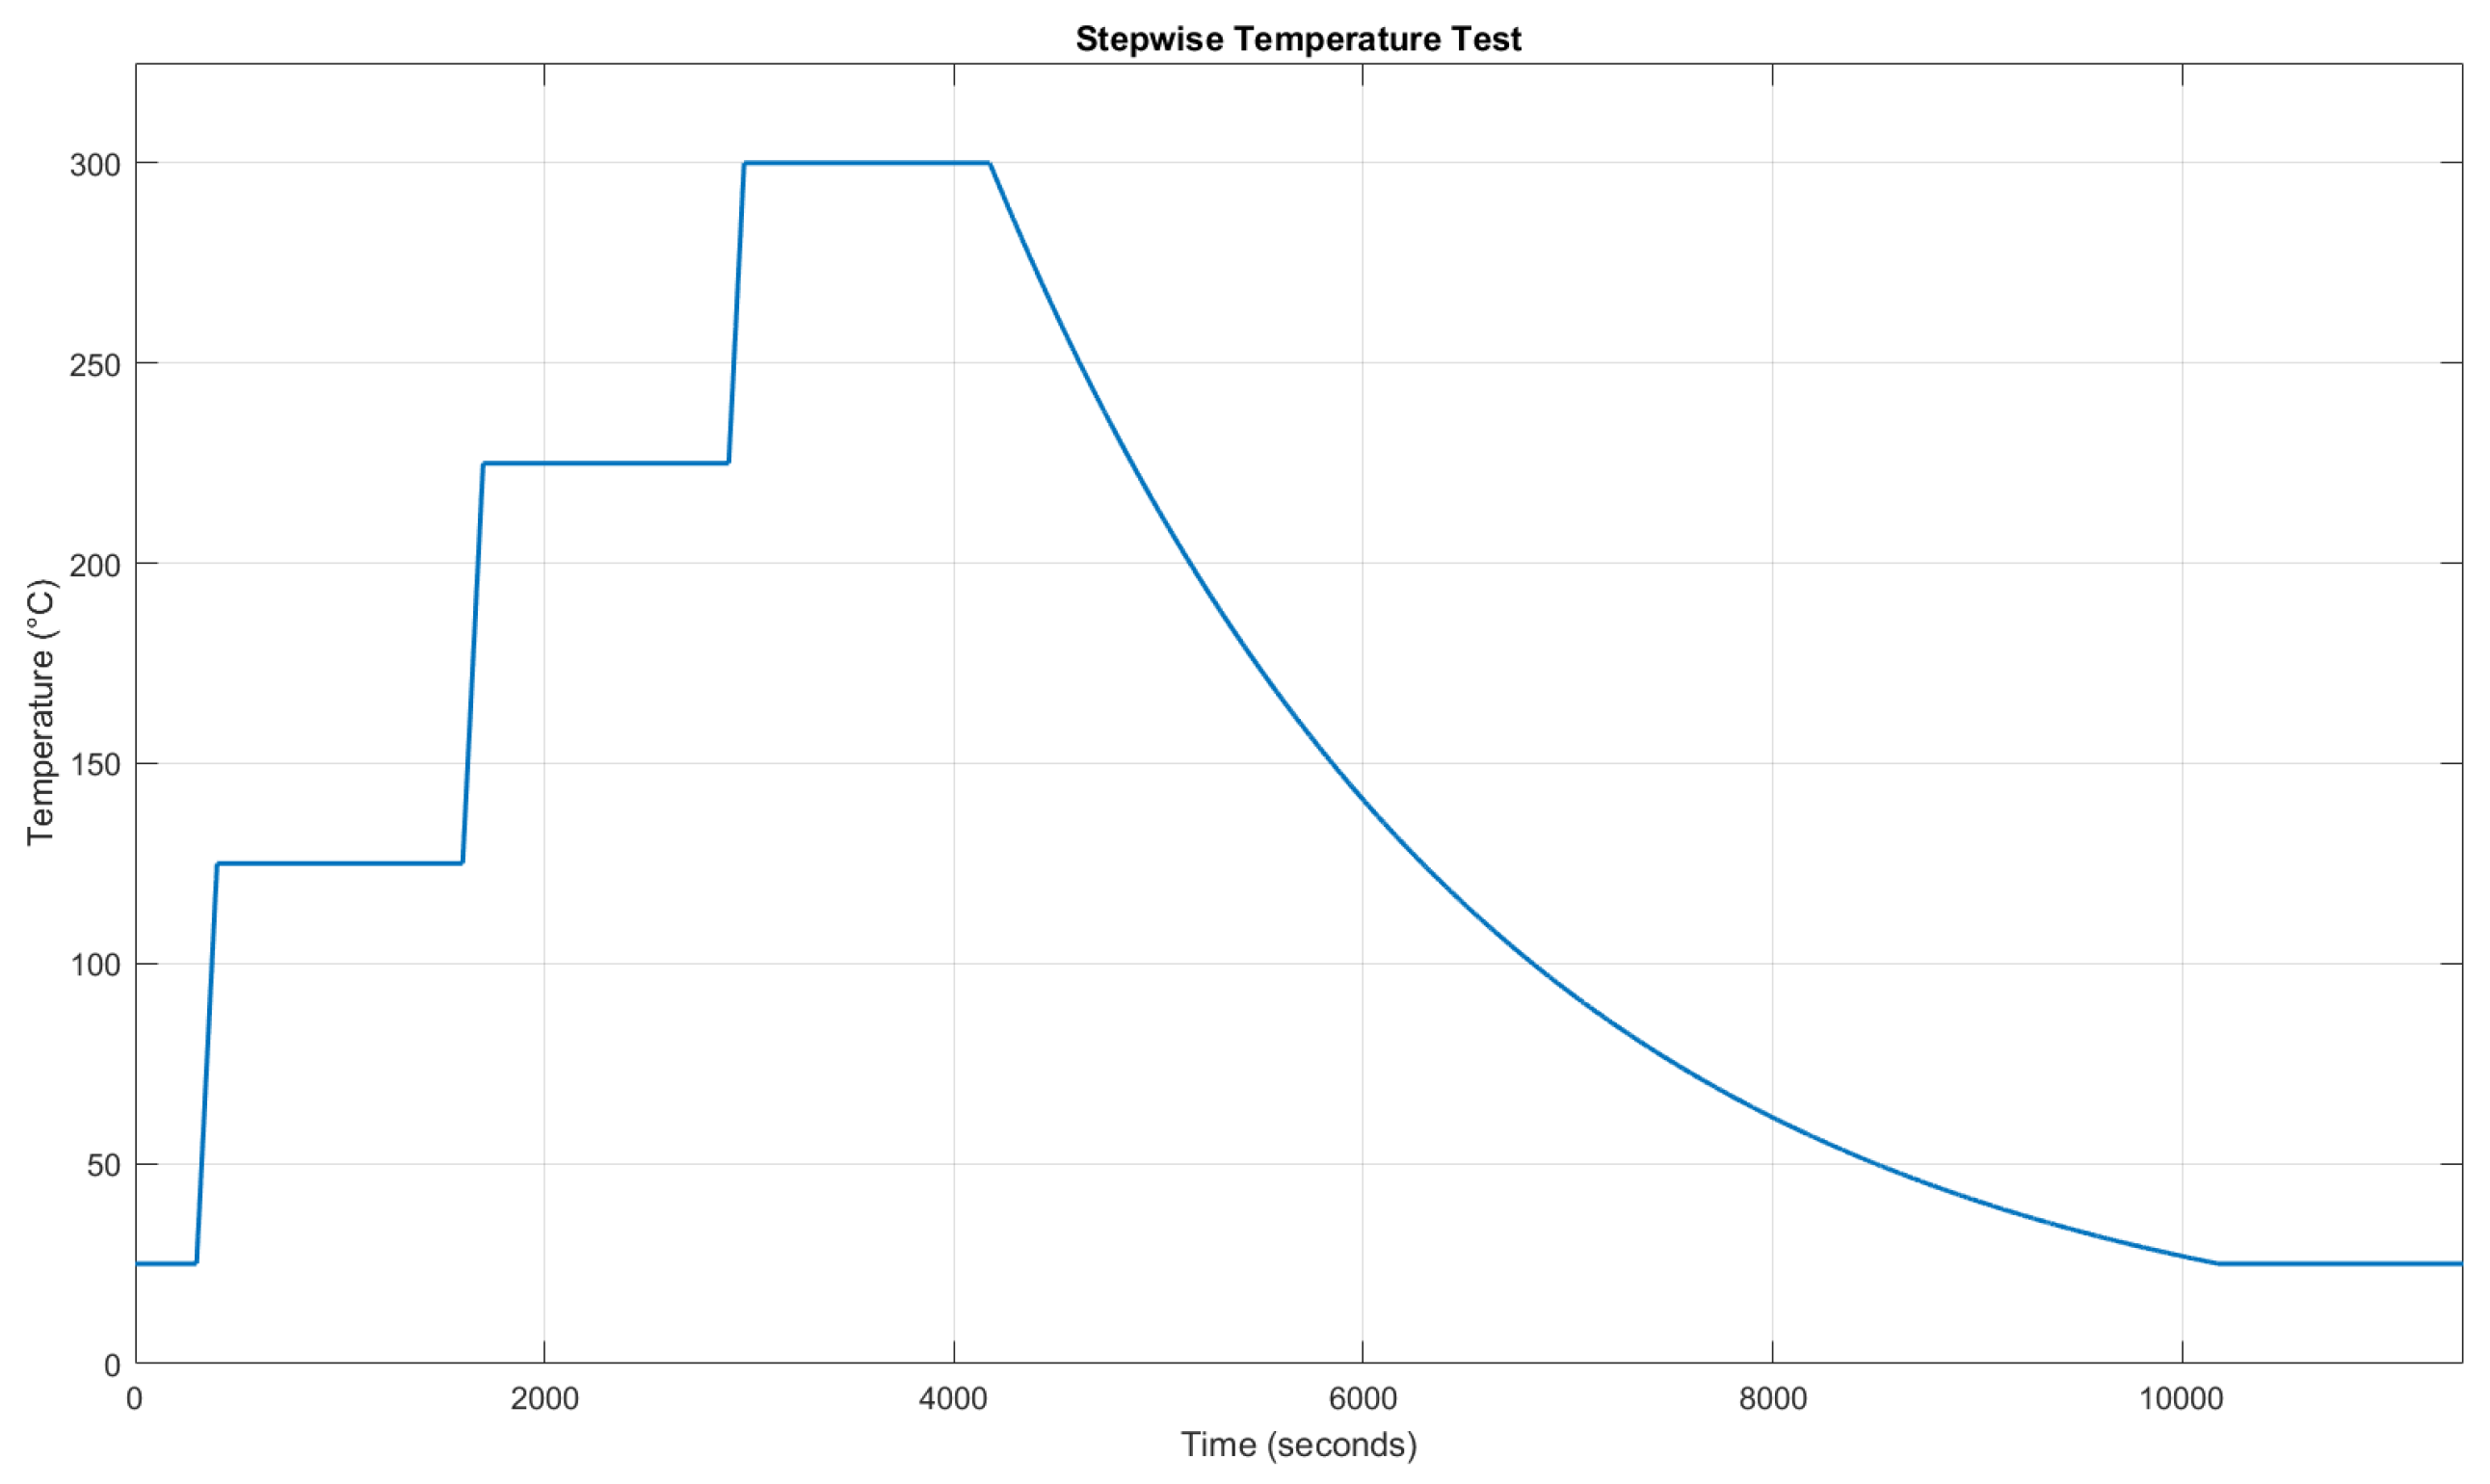
Figure 13.
(a) 3119-607 Temperature Controlled Instron Chamber. (b) Setup of the optical fibers displaced on a neutral platform, to be inserted inside the Instron chamber. 1) FBG1, 2) FBG2, 3) FBG3, 4) FBG4, 5) K-type thermocouple, 6) T-type thermocouple.
Figure 13.
(a) 3119-607 Temperature Controlled Instron Chamber. (b) Setup of the optical fibers displaced on a neutral platform, to be inserted inside the Instron chamber. 1) FBG1, 2) FBG2, 3) FBG3, 4) FBG4, 5) K-type thermocouple, 6) T-type thermocouple.
The goal is to evaluate the linearity and stability of the FBGs’ wavelength response under repeated thermal variations. Our fs-FBGs are expected to have a better linearity along a wider range of temperature [51,52]: the grating structures inscribed using femtosecond lasers have attractive annealing characteristics and may provide a long-term stable operation in high-temperature environment, compared to conventional UV laser written grating structures. K-type and T-type thermocouples were employed as temperature reference sensors. K-type thermocouple has a sensitivity of 41 µV/°C and an accuracy of ±2.5°C, while the T-type presents a sensitivity of 43 µV/°C and an accuracy of ±1.0°C. The thermocouples reader sampled data at 1 Hz, with a resolution of 0.01°C. The FBG interrogator acquired data at 2.5 Hz for enhanced precision.
4.2. Thermal-Structural Testing
The second testing phase focused on evaluating the combined effects of thermal and mechanical loads on the performance of fs-FBGs. Optical fibers were bonded to tensile test specimens through resin, and were subjected to cyclic mechanical stress both at room temperature and higher temperatures. Conducted within the Instron thermal chamber, this phase utilized a maximum temperature of 250°C (due to resin’s limitation) and tensile forces ranging from 1 kN to 5 kN, corresponding to the maximum amplitude value of applicable force inside the safety limits of the loading cell. These tests were performed under controlled load cycling, allowing us to monitor and apply precise forces, providing insights into the material behavior under specified stress levels. The positional data of the specimens were also recorded to analyze deformation patterns. These data were acquired through the Instron machine, that recorded the vertical movements of its crosshead. Thermal cycles similar to those utilized in the previous phase were employed, allowing for a controlled analysis of sensor response under simultaneous thermal and mechanical stresses.
This specific type of mechanical test was chosen to assess the FBG sensors’ ability to withstand and accurately measure mechanical stresses. During reactor operation, components are subjected to dynamic stresses and vibrations due to thermal expansion, mechanical loading, and fluid-induced forces. Simulating these conditions through cyclic mechanical tests provides a preliminary evaluation of the sensors’ durability and performance. Additionally, the test partially approximates the impact of molten lead coolant, which can generate both mechanical stress and vibrations [41,68].
Two main tests were conducted:
- Tests at room temperature: Three sessions of 3,000 cycles at 5 Hz, conducted without heating.
- Tests at elevated temperatures: Six phases, alternating between temperature ramping and stabilization. First, the temperature is gradually increased (mechanical loads consisting of 800 cycles at 1 Hz, with a heating ramp rate of 20°C/min). Once the target temperature is reached, a stabilization phase follows, maintaining the temperature for 3,000 cycles at 5 Hz. This sequence is repeated three times, reaching 100°C, 200°C, and finally 250°C, resulting in a total of three ramp phases and three stabilization phases.
While only two main tests were conducted to limit the number of sensors and specimens, additional repetitions could enhance data reliability. Resin adhesion at high temperatures was crucial to ensure sensor stability. This testing phase offers valuable insights into the long-term performance of FBG sensors under realistic thermal-mechanical loading conditions.
The test specimens, illustrated in Figure 14 and designed following the ASTM E606 Standard, were fabricated from AISI 316L(N) stainless steel, matching materials used in newcleo’s Generation IV reactor components. Optical fibers were bonded on the plane surface of the tensile test specimens using the selected high-temperature resin.
The setup for this testing phase is illustrated in Figure 15. It includes two primary specimens:
- Specimen 1 (labeled as (1) in Figure 15(a)) is equipped with an optical fiber and undergoes both thermal and mechanical cycling. This specimen is used to study the combined effects of temperature and mechanical stress on the fiber’s performance.
- Specimen 2 (labeled as (2) in Figure 15(a)) has the fiber attached to it with resin and is dedicated to thermal measurements. This specimen serves as a thermal reference, isolated from mechanical stress.
To enhance the accuracy of temperature readings, Specimen 2 is also equipped with K-type and T-type thermocouples (labeled as (4) and (5) in Figure 15(b)), which provide precise temperature reference values for the measurements from FBG2 (labeled as (3) in Figure 15(b)). The displacement data acquired from the FBG were compared to that registered from the Instron machine, that registered its crosshead vertical movements with a sensitivity of 10 µm/kN, along with a resolution of 1 µm and accuracy of ±0.03% of the reading.
4.3. Resin’s Selection
The choice of resin is critical for ensuring the reliable integration of optical fibers with the test specimens. Resins provide a robust bond capable of withstanding high-temperature and mechanical stresses while preserving the optical performance of the sensors. In this study, WEICON Ceramico W (supplied by WEICON®) was selected due to its superior thermal resistance (up to 250°C), high tensile strength (54 MPa), good Young’s modulus (9.4–10 GPa) and excellent adhesion properties. The mixture consists of an epoxy base with aluminum oxide as the filler material, mixed in a ratio of 100:25 by weight. The uniform application of the resin, as shown in Figure 16, minimized stress concentrations along the fiber, ensuring accurate and reliable wavelength measurements. The FBG’s IDs bonded to the tensile test specimens in Figure 16 are, from left to right, FBG4, FBG2, FBG1.
The deposition process was carried out manually, using a fine applicator to ensure an even distribution of the resin along the fiber. Proper resin application is essential, as any inconsistencies—such as uneven thickness, air bubbles, or excessive resin accumulation—can lead to localized stress concentrations [69]. These imperfections may distort the optical signal, reducing the accuracy of the wavelength measurements and introducing errors in temperature and displacement readings. Furthermore, improper resin deposition can compromise the adhesion between the fiber and the specimen, especially under high thermal and mechanical loads, leading to signal drift or even sensor detachment during testing.
5. Results and Discussion
In the following sections, the results from the thermal test are discussed, starting with the linear calibration of the FBG sensors, followed by an analysis of temperature estimation using these sensors. In the thermal-structural test section, the correlation between wavelength and displacement is explored, along with a compensation technique for temperature effects. Finally, the displacement estimation through FBG sensors is presented, highlighting how these sensors perform under combined thermal and mechanical stress.
These tests are important because they show how dependable and versatile FBG sensors can be. The results suggest that, with proper calibration, FBG sensors can effectively measure both temperature and strain, making them suitable for high-stress, high-temperature situations. The positive findings also open up possibilities for future studies, which could involve more complex conditions, such as working in a radiative environment.
5.1. Thermal Test Results
Two stepwise thermal tests were performed, according to Figure 17, to understand the correlation between the Bragg wavelength shifts and temperature variations. The temperature-induced shift in the Bragg wavelength () is described by Equation (1), where both and are affected by temperature through thermal expansion and the thermo-optic effect. The simplified relationship between the wavelength shift () and temperature variations () is expressed as:
where is the temperature sensitivity coefficient determined through calibration. To standardize the analysis, the wavelength data from the FBGs were normalized using min-max scaling:
where is the instantaneous Bragg wavelength, and , are the minimum and maximum values within each dataset. This normalization yields dimensionless values between 0 and 1 for a direct comparison across the four FBGs. The results of Figure 17 demonstrated a consistent linear correlation between temperature changes and wavelength shifts.
It is important to highlight the influence of the chamber’s fan on the FBG measurements. Specifically, during the cooling phase of the first test shown in Figure 17, when the fan was active, a small drift in the FBG wavelengths occurred relative to the temperature readings. In contrast, during the second test, when the fan was turned off, the alignment between the FBG wavelengths and temperature measurements was nearly perfect.
For the experiments, raw wavelength data from the FBGs were processed using a Moving Average Filter (MAF) to reduce noise and enhance data clarity. The MAF was implemented in MATLAB (version 2023a), with a window size of 150 data points used to calculate the smoothed values. Figure 18 illustrates the comparison between raw and filtered data for two thermal cycles.
5.1.1. Linear Calibration
The scope of this linear calibration is to establish a precise and reliable relationship between temperature and Bragg wavelength shifts, enabling accurate temperature measurements in high-temperature environments. This approach is based on the assumption that the relationship between the Bragg wavelength shift () and the corresponding temperature change () is linear and can be accurately described by Equation (5). Therefore, the aim of the linear calibration is also to determine the temperature sensitivity coefficient . To validate this assumption and determine , a controlled thermal environment was established where the FBG sensors and a T-type thermocouple were positioned in close proximity to ensure uniform thermal exposure and minimize spatial temperature gradients. Temperature was increased following the described stepwise thermal cycle (heating phases followed by stabilization phases) up to 300°C, with the thermocouple providing precise reference measurements while the FBG sensors concurrently recorded the corresponding Bragg wavelength shifts, . To ensure high measurement accuracy, the T-type thermocouple was selected due to its superior stability and proximity to the FBG sensors during testing, effectively minimizing discrepancies arising from spatial temperature gradients. As depicted in Figure 13, the tip of the T-type thermocouple was positioned only a few millimeters away from the FBGs, whereas the K-type thermocouple was located several centimeters away, leading to potential deviations in recorded temperature values.
The calibration procedure consisted of plotting the measured wavelength shifts against the temperature variations and performing a linear regression analysis, where the slope of the best-fit line directly provided the value of . The validity of the linear model was confirmed by a high coefficient of determination (), as illustrated in Figure 19. The precision of the fit was further substantiated by the narrow 95% confidence intervals, as shown in Figure 20, which underscore the reliability of the linear fit, even when extrapolated to higher temperature ranges. The small jumps that appear in Figure 20 at 100, 200, and 300 °C are due to the thermal stabilization steps performed during the heating cycles. During these steps, the temperature was held constant for 20 minutes to allow the system to reach thermal equilibrium, which caused small deviations in the measured sensor responses, as the materials adjusted to the stable temperature conditions. The temperature sensitivity coefficients were determined using temperature readings from the reference thermocouple. Therefore, the wavelength shift of each FBG was correlated with the temperature measured by the T-type thermocouple. This approach eliminates potential biases from the interrogator’s internal calibration, providing a direct sensitivity assessment based on the actual thermal conditions experienced by the sensors. However, this assessment does not account for potential measurement and calibration uncertainties associated with the T-type thermocouple, as these values are not known.
The temperature sensitivities of each FBG, for both First and Second Cycles, are highlighted in Table 2. These sensitivity values are in line with studies and tests for temperature monitoring through FBGs [10,48,51,52,53,55].
Additionally, the use of fs-FBGs, which are known for their enhanced thermal durability, ensured a stable and predictable relationship between temperature and wavelength shifts across the operational range. It is important to note that while the linear calibration remains valid up to approximately 350–400°C, beyond this range, the sensor response may exhibit non-linearity, necessitating the adoption of polynomial regression models to accurately characterize the temperature dependence.
5.1.2. Temperature Estimation through FBG Sensors
Using the calibrated temperature sensitivity coefficient (), FBG sensors can predict temperature values based on the measured wavelength shifts. The predicted temperature is:
Throughout the thermal tests, the predicted temperatures were computed for all FBGs and compared against the reference T-type thermocouple measurements. Figure 21 and Figure 22 show the good agreement between predicted and measured temperatures for both thermal cycles, highlighting the accuracy of the calibration process.
The alignment with thermocouple measurements confirms the calibration process and the FBG’s precision in detecting temperature-induced wavelength shifts. Minor discrepancies in some sections may be attributed to the setup, where the thermocouples and FBGs were not perfectly co-located, and to small vibrations of the fibers caused by the thermal chamber’s fan.
5.2. Thermal-Structural Test Results
The thermal-structural test evaluated the performance of fs-FBG sensors, in measuring strain and displacement, under combined thermal and mechanical loads, simulating nuclear reactor conditions. Specimens, made of AISI 316L(N) stainless steel, were subjected to cyclic mechanical stress at room and elevated temperatures (250–300°C) using forces from 1 kN to 5 kN. The tests, performed in the Instron chamber, assessed the sensors’ ability to withstand dynamic stresses, vibrations, and thermal expansion. Resin adhesion was crucial for sensor stability, and displacement data of the specimen were recorded to analyze deformation.
Two main test phases, as described in Section 4.2, were conducted: room temperature cycling (3,000 cycles at 5 Hz) and elevated temperature cycling (alternating between gradual heating, 800 cycles at 1 Hz, and constant temperature, 3,000 cycles at 5 Hz). Specimen 1, equipped with an optical fiber, was subjected to both thermal and mechanical cycling, while Specimen 2, used for thermal measurements, served as a reference with K-type and T-type thermocouples. In the first test phase, FBG4 was used for the mechanical tests and was bonded to Specimen 1. In the second test phase, FBG1 replaced FBG4 for the mechanical tests on Specimen 1. Throughout both test phases, FBG2 served as the thermal reference sensor and was bonded to Specimen 2.
5.2.1. Correlation between Wavelength and Displacement
The relationship between the FBG wavelength shift () and displacement is governed by strain () and temperature (). For purely mechanical effects, the wavelength shift is expressed as:
where is the strain sensitivity coefficient. Under combined thermal and mechanical conditions, the total shift includes both strain and temperature contributions:
where is the temperature sensitivity coefficient. The terms and represent the respective contributions of temperature and strain, both of which must be considered to ensure accurate displacement measurements.
Figure 23 and Figure 24 demonstrate the correlation between the wavelength shifts of FBG1 and the position measured by the Instron chamber. In the fifth cycle (Figure 23), the temperature increased from 200°C to 250°C under cyclic loading at 1 Hz, while the sixth cycle (Figure 24) maintained a constant temperature of 250°C with cyclic loading at 5 Hz. A static shift of 20–30 ms was observed between the FBG and Instron signals. This offset is likely due to a combination of the viscoelastic response of the embedding resin, which slightly delays strain transfer, and minor synchronization discrepancies between the FBG interrogator and the Instron acquisition system. While the dynamic trends and peak-to-peak values are consistent, this delay results in a constant offset between the curves.
5.2.2. Temperature-Effect Compensation
To isolate strain-induced wavelength shifts from temperature effects, a second FBG (FBG2) was used as a reference sensor, sensitive only to temperature changes. Positioned on a non-loaded specimen, FBG2 was calibrated using the same procedure followed during the thermal test, with the results shown in Figure 25. The temperature-induced wavelength shift () measured by FBG2 was used to eliminate the temperature effect from the total wavelength shift of the primary FBG, isolating the strain contribution ():
This compensation method ensured accurate displacement measurements, independent of thermal variations. Despite minor time delays and damping effects probably introduced by the resin, the deviation between the temperature estimated by the FBGs and the reference thermocouple measurements remained within acceptable limits, validating the robustness of this approach.
5.2.3. Displacement Estimation through FBG Sensors
The estimation of displacement using FBGs involves determining the displacement sensitivity coefficient (), which relates the strain-induced wavelength shift () to displacement variations (), as defined by:
Here, is the total wavelength shift measured by the FBG, and represents the thermal contribution, subtracted to isolate the strain-induced shift. The change in notation from (strain sensitivity coefficient) to (displacement sensitivity coefficient) was made to clearly differentiate between strain and displacement sensitivity: connects the wavelength shift () directly to the specimen’s displacement (). Once is determined, displacement variations () are calculated using:
where is the predicted thermal contribution derived from the reference sensor (FBG2). The accuracy of depends on the calibration of FBG2, ensuring reliable temperature compensation.
Since no additional stress/strain sensors (e.g., strain gauges) were available on the specimen, comparing the FBG measurements directly to the displacement values measured by the Instron crosshead, rather than stress or strain values, was considered more appropriate. This approach eliminates the risk of introducing additional error through the need to derive stress or strain analytically. The Instron crosshead displacement provided a direct and reliable measurement, ensuring that the FBG-derived displacement values were compared to an accurate reference. The results, shown in Figure 26, demonstrate a good initial agreement between the predicted and measured displacements for all six test cycles.
To refine the analysis of the wavelength-to-displacement correlation, Figure 27 and Figure 28 provides zoomed comparisons of the predicted displacement values with measured displacements for the fifth and sixth cycles. These detailed views highlight the accuracy of the prediction process, showcasing how the wavelength shifts were accurately converted into displacement measurements. The displacement sensitivity coefficients were determined using displacement readings from the Instron crosshead. The wavelength shift of each FBG was correlated with the displacement measured by the crosshead. This approach eliminates potential biases from the interrogator’s internal calibration, providing a direct sensitivity assessment based on the actual mechanical conditions experienced by the sensors. The determined values of the displacement sensitivity are highlighted in Table 3, for FBG4 and FBG1 during the First Test and the Second Test, respectively. The obtained sensitivity values are consistent with those reported in studies and tests for displacement estimation using FBGs [59,70,71]. Small variations across cycles are typical due to factors like misalignments, adhesive behavior, and temperature fluctuations. The resin’s adhesive properties and potential hysteresis may have affected strain transfer, but the overall trends and sensitivity values remain consistent.
The methodology effectively isolates the strain contribution, leveraging the reference sensor (FBG2) to compensate for temperature-induced shifts. These promising outcomes highlight the potential of FBGs as displacement sensors, with room for optimization to achieve even greater accuracy. Results from all of the six cycles also highlighted the importance of selecting a resin capable of withstanding high temperatures to ensure no loss of critical information and to maintain perfect adherence of the optical fiber to the specimen. In our case, when the tension cycles peak at 5 kN, they generate a maximum stress of 80 MPa, exceeding the tensile strength of the resin (54 MPa). This induces a plastic hysteresis behaviour of the resin itself, shifting the resin’s behavior from elastic to plastic. This can introduce minor hysteresis in the results, such as the mentioned delay of 30 ms. This effect, though minimal, underscores the need for careful selection of materials that can sustain high mechanical loads without compromising the accuracy of the measurement. A better choice of resin, combined with a better resin application, could lead to even better performances.
6. Precision Evaluation
6.1. Error Analysis in FBG-Based Temperature Estimation
The precision of the FBG temperature estimation was evaluated by comparing the calibrated FBG readings against reference values measured by a K-type thermocouple throughout the two thermal cycles. This precision was assessed using statistical metrics, specifically the coefficient of determination (R2) and the Root Mean Square Error (RMSE). These metrics quantify the goodness of fit and the average prediction error, respectively. Table 4 presents the computed R2 and RMSE values for each FBG over the first and second heating cycles. The high R2 values () and low RMSE values (generally below 5 °C) indicate excellent agreement between FBG-estimated temperatures and the reference thermocouple data, confirming the robustness of the linear calibration and the sensors’ reliability.
RMSE remained below 5°C across the full 25–300°C range, corresponding to a maximum relative error of 1.82%, and could be further reduced with an improved testing setup. These results are encouraging for a preliminary trial, showing strong potential for future applications. With additional tests and refined setups, significant improvements in accuracy and reliability can be achieved.
6.2. Error Analysis in FBG-Based Displacement Estimation
This section evaluates the accuracy of FBG sensors in predicting displacement during mechanical loading under varying thermal conditions. Since displacement estimation depends on the differential measurement of Bragg wavelength shifts between sensing and reference gratings—with temperature effects compensated—quantifying the residual error is important to assess the system’s reliability. The RMSE was selected as a simple primary metric, since it provides a direct measure of the mean deviation between the FBG-based predictions and the displacement measurements recorded by the Instron machine. Before evaluating displacement, it was necessary to assess the quality of the temperature compensation. FBG2 was used as the reference sensor for thermal correction. Table 5 compares its temperature estimation to the K-type thermocouple in the first and second mechanical tests. Slightly higher errors were observed compared to the thermal-only tests, likely due to the thermal inertia of the specimen and strain transfer effects through the resin.
Cycle-specific errors for temperature compensation are detailed in Table 6. Cycles with rapid thermal changes exhibited higher RMSE values, while those with stable conditions showed minimal errors, validating the calibration process under diverse conditions.
To better understand the compensation behavior over time, RMSE values were also computed cycle-by-cycle (Table 6). Cycles with rapid thermal transients showed higher RMSE values, which highlights the sensitivity of FBG temperature readings to sudden thermal variations. Conversely, during thermally stable periods, the error dropped. It is worth noting that the first test exhibited less consistent RMSE values compared to the second test. This discrepancy is likely attributed to the higher thermal inertia of the specimen, which may have continued to transfer heat to the embedded fiber even during thermally stable intervals. Additionally, the thermal setup in the first test may have received less attention in terms of insulation and equilibrium time, resulting in delayed stabilization of the fiber temperature and consequently larger residual errors.
Finally, Table 7 presents the RMSE values for displacement prediction across both tests. Displacement errors remained consistently low ( mm), even during cycles with rapid thermal transitions or high loading frequencies, confirming the reliability of the FBG sensors.
Following the thermal compensation, the precision of displacement prediction was evaluated by comparing the output of the FBG sensors to the actual position recorded by the Instron actuator. The RMSE values reported in Table 7 quantify the error between the predicted displacement from the FBG sensor signals and the true displacement measured by the Instron system. These errors remained consistently low across all cycles. The low RMSE values (below 0.024 mm in all cases) demonstrate that the sensors maintain accurate displacement tracking even in the presence of thermal fluctuations and rapid mechanical loading.
Despite minor errors introduced probably by the resin or residual temperature effects, the results confirm the robustness of FBG sensors for high-precision displacement monitoring under combined thermal and mechanical conditions. The consistent low RMSE values and effective temperature compensation validate the sensors’ accuracy and reliability in complex environments.
7. Conclusions
This study offers a first look at the potential of FBG-based sensors for monitoring key parameters in Generation IV Lead-cooled Fast Reactors. Through early-stage testing and theoretical analysis, the research shows that FBGs are promising candidates for environments with high temperatures and mechanical stress. While further testing, especially in radiative conditions, is needed to fully validate the technology, this work provides a solid starting point for developing durable, integrated fiber optic sensor systems for advanced nuclear reactors.
The analysis of temperature estimation reveals that while the sensors exhibit robust performance, with RMSE values under 5°C, further testing in more controlled environments, using improved setups and more precise equipment, could significantly reduce errors. As seen in the results, factors like fan-induced vibrations, resin properties and thermal inertia of the specimens contribute to some of the discrepancies observed. With a refined experimental setup, accuracy could be enhanced, making FBGs even more reliable. Displacement monitoring also showed encouraging results, with minimal errors (RMSE around 0.015 mm) in cycles with stable thermal conditions. However, the sensors’ performance was slightly affected during rapid thermal changes, likely due to the resin’s influence. These issues could be mitigated with optimized calibration processes, better material choices, and improved sensor integration techniques, ensuring more consistent performance across diverse conditions.
Future research should focus on improving high-temperature resin materials, exploring FBG performance under both radiation and thermal cycling, and carrying out more testing in complex reactor environments. It would be also useful to assess long-term operating temperatures and perform extended cycling evaluations. These steps are crucial for making real-time monitoring and automated diagnostics a reality. Overall, this study highlights how fiber optic sensors have the potential to transform reactor monitoring, improving safety, reliability, and efficiency in the process. Focusing on durability and ease of integration for these sensors represents an important step toward enabling future advancements in nuclear reactor monitoring systems.
Author Contributions
Conceptualization, Rocco Contangelo and Andrea Bagnasco; Data curation, Rocco Contangelo; Formal analysis, Rocco Contangelo; Investigation, Rocco Contangelo; Methodology, Rocco Contangelo, Carlo Ferro, Quentin Pouille and Andrea Mazza; Project administration, Rocco Contangelo, Carlo Ferro and Andrea Bagnasco; Resources, Carlo Ferro, Andrea Bagnasco, Quentin Pouille and Andrea Mazza; Software, Rocco Contangelo; Supervision, Rocco Contangelo, Carlo Ferro, Andrea Bagnasco, Quentin Pouille and Andrea Mazza; Writing – original draft, Rocco Contangelo; Writing – review & editing, Carlo Ferro and Quentin Pouille.
Funding
This research received no external funding.
Data Availability Statement
The data presented in this study are available in this article.
Acknowledgments
The authors would like to thank Politecnico di Torino for the technical support and for providing optical fibers and testing equipment. Special thanks also go to newcleo for supplying additional materials, for their availability, and for believing in the project, contributing to its realization.
Conflicts of Interest
The authors declare no conflicts of interest.
| 1 | Image from https://stl.tech/blog/types-of-optical-fiber/. |
References
- McGrath, M.J.; Scanaill, C.N. Key Sensor Technology Components: Hardware and Software Overview. In Sensor Technologies; Apress: Berkeley, CA, 2013; pp. 51–77. [CrossRef]
- Kok, S.P.; Go, Y.I.; Wang, X.; Wong, M.L.D. Advances in Fiber Bragg Grating (FBG) Sensing: A Review of Conventional and New Approaches and Novel Sensing Materials in Harsh and Emerging Industrial Sensing. IEEE Sensors Journal 2024, 24, 29485–29505. [CrossRef]
- Sabri, N.; Aljunid, S.A.; Salim, M.S.; Fouad, S. Fiber Optic Sensors: Short Review and Applications. In Recent Trends in Physics of Material Science and Technology; Gaol, F.L.; Shrivastava, K.; Akhtar, J., Eds.; Springer Singapore: Singapore, 2015; Vol. 204, pp. 299–311. [CrossRef]
- Khonina, S.N.; Kazanskiy, N.L.; Butt, M.A. Optical Fibre-Based Sensors—An Assessment of Current Innovations. Biosensors 2023, 13, 835. [CrossRef]
- Sahota, J.K.; Gupta, N.; Dhawan, D. Fiber Bragg Grating Sensors for Monitoring of Physical Parameters: A Comprehensive Review. Optical Engineering 2020, 59, 1. [CrossRef]
- Liu, R.m.; Liang, D.k.; Asundi, A. Small diameter fiber Bragg gratings and applications. Measurement 2013, 46, 3440–3448. [CrossRef]
- Hsu, K.; Csipkes, A.; Jin, T. Small-Diameter Thin FBGs Ideally Suited for Embedded Sensing in Composites.
- Othonos, A.; Kalli, K.; Pureur, D.; Mugnier, A. Fibre Bragg Gratings; In Wavelength Filters in Fibre Optics, Springer: Berlin, Heidelberg, 2006.
- Chen, J.; Liu, B.; Zhang, H. Review of Fiber Bragg Grating Sensor Technology. Frontiers of Optoelectronics in China 2011, 4, 204–212. [CrossRef]
- Li, C.; Tang, J.; Cheng, C.; Cai, L.; Yang, M. FBG Arrays for Quasi-Distributed Sensing: A Review. Photonic Sensors 2021, 11, 91–108. [CrossRef]
- Gui, X.; Li, Z.; Fu, X.; Guo, H.; Wang, Y.; Wang, C.; Wang, J.; Jiang, D. Distributed Optical Fiber Sensing and Applications Based on Large-Scale Fiber Bragg Grating Array: Review. Journal of Lightwave Technology 2023, 41, 4187–4200. [CrossRef]
- Deng, Y.; Jiang, J. Optical Fiber Sensors in Extreme Temperature and Radiation Environments: A Review. IEEE Sensors Journal 2022, 22, 13811–13834. [CrossRef]
- Cook, K.; Canning, J.; Bandyopadhyay, S.; Lancry, M.; Martelli, C.; Jin, T.; Csipkes, A. Technologies for High Temperature Fibre Bragg Grating (FBG) Sensors 2017.
- Senior, J.M.; Jamro, M.Y. Optical Fiber Communications: Principles and Practice, 3. ed ed.; Prentice Hall: Harlow Munich, 2009.
- Aimasso, A.; Ferro, C.G.; Bertone, M.; Dalla Vedova, M.D.L.; Maggiore, P. Fiber Bragg Grating Sensor Networks Enhance the In Situ Real-Time Monitoring Capabilities of MLI Thermal Blankets for Space Applications. Micromachines 2023, 14, 926. [CrossRef]
- Dalla Vedova, M.D.; Berri, P.C.; Aimasso, A. Environmental Sensitivity of Fiber Bragg Grating Sensors for Aerospace Prognostics. In Proceedings of the Proceedings of the 31st European Safety and Reliability Conference (ESREL 2021). Research Publishing Services, 2021, pp. 1561–1567. [CrossRef]
- Zhang, X.; Zhu, H.; Jiang, X.; Broere, W. Distributed Fiber Optic Sensors for Tunnel Monitoring: A State-of-the-Art Review. Journal of Rock Mechanics and Geotechnical Engineering 2024, 16, 3841–3863. [CrossRef]
- Dai, Z.Y.; Liu, Y.; Zhang, L.X.; Ou, Z.H.; Zhou, C.; Liu, Y.Z. Landslide Monitoring Based on High-Resolution Distributed Fiber Optic Stress Sensor. In Proceedings of the 2008 1st Asia-Pacific Optical Fiber Sensors Conference, Chengdu, China, 2008; pp. 1–4. [CrossRef]
- Höttges, A.; Rabaiotti, C.; Facchini, M. A Ground-Breaking Distributed Fiber-Optic Pressure Sensor for Geohydraulic Applications. Procedia Structural Integrity 2024, 64, 1613–1620. [CrossRef]
- Alwis, L.S.M.; Bremer, K.; Weigand, F.; Kuhne, M.; Helbig, R.; Roth, B. Textile Carbon Reinforcement Structures with Integrated Optical Fibre Sensors Designed for SHM Applications. In Proceedings of the 25th International Conference on Optical Fiber Sensors; Chung, Y.; Jin, W.; Lee, B.; Canning, J.; Nakamura, K.; Yuan, L., Eds., Jeju, Korea, Republic of, 2017; p. 1032376. [CrossRef]
- D’Aniello, A.; Cimorelli, L.; Pianese, D. Thermal Response to Background Leakages around an Actively Heated Fiber Optic Sensor for Leak Detection in Water Distribution Mains: Modeling the Effect of Heating Power and Time. Tunnelling and Underground Space Technology 2024, 152, 105904. [CrossRef]
- Kumar, S.; Kumar, N.; Singh, J. Design and Analysis of Oil Pipeline Leakage Detection Model Using WDM FBG Sensors through Simulation of Temperature and Strain Effects. In Proceedings of the 2022 OPJU International Technology Conference on Emerging Technologies for Sustainable Development (OTCON), Raigarh, Chhattisgarh, India, 2023; pp. 1–6. [CrossRef]
- Hu, X.; Su, D.; Qiao, X. Diaphragm-Structured Fiber-Optic Pressure Sensors for Oil Downhole Applications. IEEE Sensors Journal 2024, 24, 14270–14278. [CrossRef]
- Cheymol, G.; Verneuil, A.; Grange, P.; Maskrot, H.; Destouches, C. Report of High Temperature Measurements with a Fabry-Perot Extensometer. EPJ Web of Conferences 2020, 225, 01011. [CrossRef]
- Cheymol, G.; Verneuil, A.; Grange, P.; Maskrot, H.; Destouches, C. High-Temperature Measurements With a Fabry–Perot Extensometer. IEEE Transactions on Nuclear Science 2020, PP, 1–1. [CrossRef]
- Ladaci, A.; Cheymol, G.; Maskrot, H.; Destouches, C.; Ferry, L.; Gonnier, C. Measurement of reactor core temperature using multispectral infrared pyrometry in accidental conditions. EPJ Web of Conferences 2020, 225, 08005. [CrossRef]
- Morana, A.; Cheymol, G.; Reghioua, I.; Boukenter, A.; Schlegel, M.; Gusarov, A.; Marin, E.; Ouerdane, Y.; Destouches, C.; Girard, S. Structural and optical changes in silica-based optical fibers exposed to high neutron and gamma fluences. Journal of Non-Crystalline Solids 2021, 574, 121150. [CrossRef]
- Kumar, J.; Singh, G.; Saxena, M.K.; Prakash, O.; Dixit, S.K.; Nakhe, S.V. Development and Studies on FBG Temperature Sensor for Applications in Nuclear Fuel Cycle Facilities. IEEE Sensors Journal 2021, 21, 7613–7619. [CrossRef]
- Yang, T.; Xiao, Y.; Ran, Z.; He, X.; Shao, T.; Wang, W.; Li, K.; Sun, D.; Qin, X.; He, Z.; et al. Design of a Weak Fiber Bragg Grating Acoustic Sensing System for Pipeline Leakage Monitoring in a Nuclear Environment. IEEE Sensors Journal 2021, 21, 22703–22711. [CrossRef]
- Remy, L.; Cheymol, G.; Gusarov, A.; Morana, A.; Marin, E.; Girard, S. Compaction in Optical Fibres and Fibre Bragg Gratings Under Nuclear Reactor High Neutron and Gamma Fluence. IEEE Transactions on Nuclear Science 2016, 63, 2317–2322. [CrossRef]
- Zhao, J.; Zhao, K.; Li, Y.; Wang, Q.; Chen, K.P. Long-Term Stabilities Fiber Bragg Grating (FBG) Arrays Inscribed by Femtosecond Lasers at 910oC 2021.
- De Pauw, B.; Lamberti, A.; Ertveldt, J.; Rezayat, A.; Vanlanduit, S.; Van Tichelen, K.; Berghmans, F. Temperature Monitoring Using Fibre Optic Sensors in a Lead-Bismuth Eutectic Cooled Nuclear Fuel Assembly. Nuclear Engineering and Design 2016, 297, 54–59. [CrossRef]
- Morana, A.; Campanella, C.; Vidalot, J.; De Michele, V.; Marin, E.; Reghioua, I.; Boukenter, A.; Ouerdane, Y.; Paillet, P.; Girard, S. Extreme Radiation Sensitivity of Ultra-Low Loss Pure-Silica-Core Optical Fibers at Low Dose Levels and Infrared Wavelengths. Sensors 2020, 20, 7254. [CrossRef]
- Kuhnhenn, J.; Weinand, U.; Morana, A.; Girard, S.; Marin, E.; Perisse, J.; Genot, J.S.; Grelin, J.; Hutter, L.; Melin, G.; et al. Gamma Radiation Tests of Radiation-Hardened Fiber Bragg Grating Based Sensors for Radiation Environments. In Proceedings of the 2016 16th European Conference on Radiation and Its Effects on Components and Systems (RADECS), Bremen, Germany, 2016; pp. 1–4. [CrossRef]
- Kakuta, T.; Shikama, T.; Narui, M.; Sagawa, T. Behavior of optical fibers under heavy irradiation. Fusion Engineering and Design 1998, 41, 201–205. [CrossRef]
- Girard, S.; Kuhnhenn, J.; Gusarov, A.; Brichard, B.; Van Uffelen, M.; Ouerdane, Y.; Boukenter, A.; Marcandella, C. Radiation Effects on Silica-Based Optical Fibers: Recent Advances and Future Challenges. IEEE Transactions on Nuclear Science 2013, 60, 2015–2036. [CrossRef]
- Cheymol, G.; Maurin, L.; Remy, L.; Arounassalame, V.; Maskrot, H.; Rougeault, S.; Dauvois, V.; Le Tutour, P.; Huot, N.; Ouerdane, Y.; et al. Irradiation Tests of Optical Fibers and Cables Devoted to Corium Monitoring in Case of a Severe Accident in a Nuclear Power Plant. IEEE Transactions on Nuclear Science 2020, 67, 669–678. [CrossRef]
- Fernandez, A.; Brichard, B.; Berghmans, F.; Rabii, H.; Fokine, M.; Popov, M. Chemical Composition Fiber Gratings in a High Mixed Gamma Neutron Radiation Field. IEEE Transactions on Nuclear Science 2006, 53, 1607–1613. [CrossRef]
- Cheymol, G.; Remy, L.; Gusarov, A.; Kinet, D.; Megret, P.; Laffont, G.; Blanchet, T.; Morana, A.; Marin, E.; Girard, S. Study of Fiber Bragg Grating Samples Exposed to High Fast Neutron Fluences. IEEE Transactions on Nuclear Science 2018, 65, 2494–2501. [CrossRef]
- Melin, G.; Guitton, P.; Montron, R.; Gotter, T.; Robin, T.; Overton, B.; Morana, A.; Rizzolo, S.; Girard, S. Radiation Resistant Single-Mode Fiber With Different Coatings for Sensing in High Dose Environments. IEEE Transactions on Nuclear Science 2019, 66, 1657–1662. [CrossRef]
- De Pauw, B.; Lamberti, A.; Ertveldt, J.; Rezayat, A.; Van Tichelen, K.; Vanlanduit, S.; Berghmans, F. Vibration Monitoring Using Fiber Optic Sensors in a Lead-Bismuth Eutectic Cooled Nuclear Fuel Assembly. Sensors 2016, 16, 571. [CrossRef]
- Girard, S.; Alessi, A.; Richard, N.; Martin-Samos, L.; De Michele, V.; Giacomazzi, L.; Agnello, S.; Francesca, D.D.; Morana, A.; Winkler, B.; et al. Overview of Radiation Induced Point Defects in Silica-Based Optical Fibers. Reviews in Physics 2019, 4, 100032. [CrossRef]
- Girard, S.; Kuhnhenn, J.; Gusarov, A.; Morana, A.; Paillet, P.; Robin, T.; Weninger, L.; Fricano, F.; Roche, M.; Campanella, C.; et al. Overview of Radiation Effects on Silica-Based Optical Fibers and Fiber Sensors. IEEE Transactions on Nuclear Science 2024, pp. 1–1. [CrossRef]
- Kashaykin, P.F.; Tomashuk, A.L.; Vasiliev, S.A.; Britskiy, V.A.; Ignatyev, A.D.; Ponkratov, \.Y.V.; Kulsartov, T.V.; Samarkhanov, K.K.; Gnyrya, V.S.; Zarenbin, A.V.; et al. Radiation Resistance of Single-Mode Optical Fibers at 1.55 Micron Under Irradiation at IVG.1M Nuclear Reactor. IEEE Transactions on Nuclear Science 2020, 67, 2162–2171. [CrossRef]
- Brichard, B.; Fernandez Fernandez, A.; Ooms, H.; Berghmans, F.; Decréton, M.; Tomashuk, A.; Klyamkin, S.; Zabezhailov, M.; Nikolin, I.; Bogatyrjov, V.; et al. Radiation-Hardening Techniques of Dedicated Optical Fibres Used in Plasma Diagnostic Systems in ITER. Journal of Nuclear Materials 2004, 329–333, 1456–1460. [CrossRef]
- Girard, S.; Morana, A.; Ladaci, A.; Robin, T.; Mescia, L.; Bonnefois, J.J.; Boutillier, M.; Mekki, J.; Paveau, A.; Cadier, B.; et al. Recent advances in radiation-hardened fiber-based technologies for space applications. Journal of Optics 2018, 20, 093001. [CrossRef]
- Birri, A.; Sweeney, D.; Hyer, H.; Schreiber, B.; Petrie, C. Development of Optical Fiber-Based Sensors for Nuclear Microreactor Structural Health Monitoring. Technical Report ORNL/TM–2023/2984, 1994659, 2023. [CrossRef]
- Laffont, G.; Cotillard, R.; Roussel, N.; Desmarchelier, R.; Rougeault, S. Temperature Resistant Fiber Bragg Gratings for On-Line and Structural Health Monitoring of the Next-Generation of Nuclear Reactors. Sensors 2018, 18, 1791. [CrossRef]
- Kashaykin, P.; Tomashuk, A.; Vasiliev, S.; Ignatyev, A.; Shaimerdenov, A.; Ponkratov, \.Y.; Kulsartov, T.; Kenzhin, Y.; Kh. Gizatulin, \.S.; Zholdybayev, T.; et al. Radiation Resistance of Single-Mode Optical Fibres with View to in-Reactor Applications. Nuclear Materials and Energy 2021, 27, 100981. [CrossRef]
- Zhao, X.; Zhang, D.P.; Li, H.C.; Wang, Y.J. A Novel High-temperature Sensor Based on Fiber Bragg Grating. In Proceedings of the 2022 20th International Conference on Optical Communications and Networks (ICOCN), Shenzhen, China, 2022; pp. 1–3. [CrossRef]
- Madan, A.; Liu, O.; Jiang, W.; Wang, Y.; Shum, P.P.; Hao, J. Carbon-Steel Tube Surface Mounted FBG Sensors under High-Temperature Environment, Part I: Polyimide Coated and Femtosecond Laser Written. In Proceedings of the 2020 IEEE 5th Optoelectronics Global Conference (OGC), Shenzhen, China, 2020; pp. 125–129. [CrossRef]
- Madan, A.; Liu, O.; Lim, J.L.; Jiang, W.; Wang, Y.; Shum, P.P.; Hao, J. Carbon-Steel Tube Surface Mounted FBG Sensors under High-Temperature Environment, Part II: Gold Coated and Femtosecond Laser Written. In Proceedings of the 2020 IEEE 5th Optoelectronics Global Conference (OGC), Shenzhen, China, 2020; pp. 130–133. [CrossRef]
- Tian, Q.; Xin, G.; Lim, K.S.; Ee, Y.J.; Xue, F.; He, Y.; Zhu, J.; Ahmad, H.; Liu, X.; Yang, H. Optical Fiber Sensor With Double Tubes for Accurate Strain and Temperature Measurement Under High Temperature up to 1000°C. IEEE Sensors Journal 2022, 22, 11710–11716. [CrossRef]
- Li, J.; Chen, Q.; Zhou, J.; Cao, Z.; Li, T.; Liu, F.; Yang, Z.; Chang, S.; Zhou, K.; Ming, Y.; et al. Radiation Damage Mechanisms and Research Status of Radiation-Resistant Optical Fibers: A Review. Sensors 2024, 24, 3235. [CrossRef]
- Zheng, J.; Cao, H.; Zhang, S.; Lu, J.; Cao, S.; Li, W.; Yu, K.; Shi, F.; Wei, W. High Mechanical Strength Thermally Regenerated Fiber Bragg Gratings for High-Temperature Stress Monitoring. IEEE Transactions on Instrumentation and Measurement 2024, 73, 1–7. [CrossRef]
- Sato, K.A.; De Moura, C.C.; Filho, A.C.R.; Moreira, L.C.J.; Kalinowski, H.J.; Abe, I.; De Oliveira, V. RFBG Thermal Aging Evaluation Above Regeneration Temperature. IEEE Sensors Journal 2022, 22, 18486–18492. [CrossRef]
- Li, J.; Zhang, D.; Wen, X.; Li, L. Fabrication and Temperature Characteristics of Thermal Regenerated Fiber Bragg Grating. In Proceedings of the 2012 Symposium on Photonics and Optoelectronics, Shanghai, China, 2012; pp. 1–4. [CrossRef]
- Kumar, J.; Prakash, O.; Mahakud, R.; Agrawal, S.K.; Mokhariwale, A.; Dixit, S.K.; Nakhe, S.V. Studies on the Stability of Regenerated Fiber Bragg Gratings at 1100 °C. In Proceedings of the 2015 Workshop on Recent Advances in Photonics (WRAP), Bangalore, India, 2015; pp. 1–4. [CrossRef]
- Vimal, M.; Chalackal, A.T.; Kanakambaran, S. Performance Analysis of Metal-Coated Fiber Bragg Gratings for Strain Sensing at High Temperatures. In Proceedings of the 2021 IEEE Region 10 Symposium (TENSYMP), Jeju, Korea, Republic of, 2021; pp. 1–4. [CrossRef]
- De Pauw, B.; Lamberti, A.; Rezayat, A.; Ertveldt, J.; Vanlanduit, S.; Van Tichelen, K.; Geernaert, T.; Berghmans, F. Signal-to-Noise Ratio Evaluation of Fibre Bragg Gratings for Dynamic Strain Sensing at Elevated Temperatures in a Liquid Metal Environment. Journal of Lightwave Technology 2015, 33, 2378–2385. [CrossRef]
- Morana, A.; Marin, E.; Lablonde, L.; Blanchet, T.; Robin, T.; Cheymol, G.; Laffont, G.; Boukenter, A.; Ouerdane, Y.; Girard, S. Radiation Effects on Fiber Bragg Gratings: Vulnerability and Hardening Studies. Sensors 2022, 22, 8175. [CrossRef]
- Fernandez, A.F.; Brichard, B.; Berghmans, F. Long-Term Radiation Effects on Fiber Bragg Grating Temperature Sensors in Mixed Gamma Neutron Fields.
- Cheymol, G.; Long, H.; Villard, J.F.; Brichard, B. High Level Gamma and Neutron Irradiation of Silica Optical Fibers in CEA OSIRIS Nuclear Reactor. IEEE Transactions on Nuclear Science 2008, 55, 2252–2258. [CrossRef]
- Melin, G.; Barnini, A.; Morana, A.; Girard, S.; Guitton, P.; Montron, R. Combined Effect of Radiation and Temperature: Towards Optical Fibers Suited to Distributed Sensing in Extreme Radiation Environments. In Proceedings of the 2019 19th European Conference on Radiation and Its Effects on Components and Systems (RADECS), Montpellier, France, 2019; pp. 1–4. [CrossRef]
- Morana, A.; Campanella, C.; Aubrey, M.; Marin, E.; Boukenter, A.; Ouerdane, Y.; Girard, S. Temperature Dependence of Low-Dose Radiation-Induced Attenuation of Germanium-Doped Optical Fiber at Infrared Wavelengths. IEEE Transactions on Nuclear Science 2022, 69, 512–517. [CrossRef]
- Girard, S.; Vivona, M.; Mescia, L.; Laurent, A.; Ouerdane, Y.; Marcandella, C.; Prudenzano, F.; Boukenter, A.; Robin, T.; Cadier, B.; et al. Radiation Hardening Techniques for Rare-Earth-Based Optical Fibers and Amplifiers. In Proceedings of the SPIE LASE, San Francisco, California, USA, 2012; p. 82460Y. [CrossRef]
- Aimasso, A.; Dalla Vedova, M.D.L.; Maggiore, P. Analysis of FBG Sensors Performances When Integrated Using Different Methods for Health and Structural Monitoring in Aerospace Applications. In Proceedings of the 2022 6th International Conference on System Reliability and Safety (ICSRS), Venice, Italy, 2022; pp. 138–144. [CrossRef]
- De Pauw, B.; Vanlanduit, S.; Van Tichelen, K.; Geernaert, T.; Thienpont, H.; Berghmans, F. Fibre-optic sensor based measurements of flow-induced vibration in a liquid metal cooled nuclear reactor set-up. In Proceedings of the 2017 25th Optical Fiber Sensors Conference (OFS), 2017, pp. 1–4. [CrossRef]
- Aimasso, A.; Ferro, C.G. Proposal of a Standard Method to Define a Best Practice for Bonding FBG Sensors for Aerospace Use. In Proceedings of the 2023 IEEE 10th International Workshop on Metrology for AeroSpace (MetroAeroSpace), Milan, Italy, 2023; pp. 498–502. [CrossRef]
- Nguyen, Q.V.; Chiang, C.C.; Tsai, L. Enhanced Sensitivity of Bare Fbg Pressure Sensor Based on the Oval-Shaped 3d Printed Structure. SSRN Electronic Journal 2022. [CrossRef]
- Paloschi, D.; Polimadei, A.; Korganbayev, S.; Orsetti, V.; Mazzotta, C.; Cigada, A.; Caponero, M.A.; Saccomandi, P. Three-Dimensional-Printed Sensing Samples Embedding Fiber Bragg Gratings: Metrological Evaluation of Different Sample Materials and Fiber Coatings. IEEE Transactions on Instrumentation and Measurement 2023, 72, 1–10. [CrossRef]
Figure 1.
Structural components of an optical fiber.1
Figure 1.
Structural components of an optical fiber.1
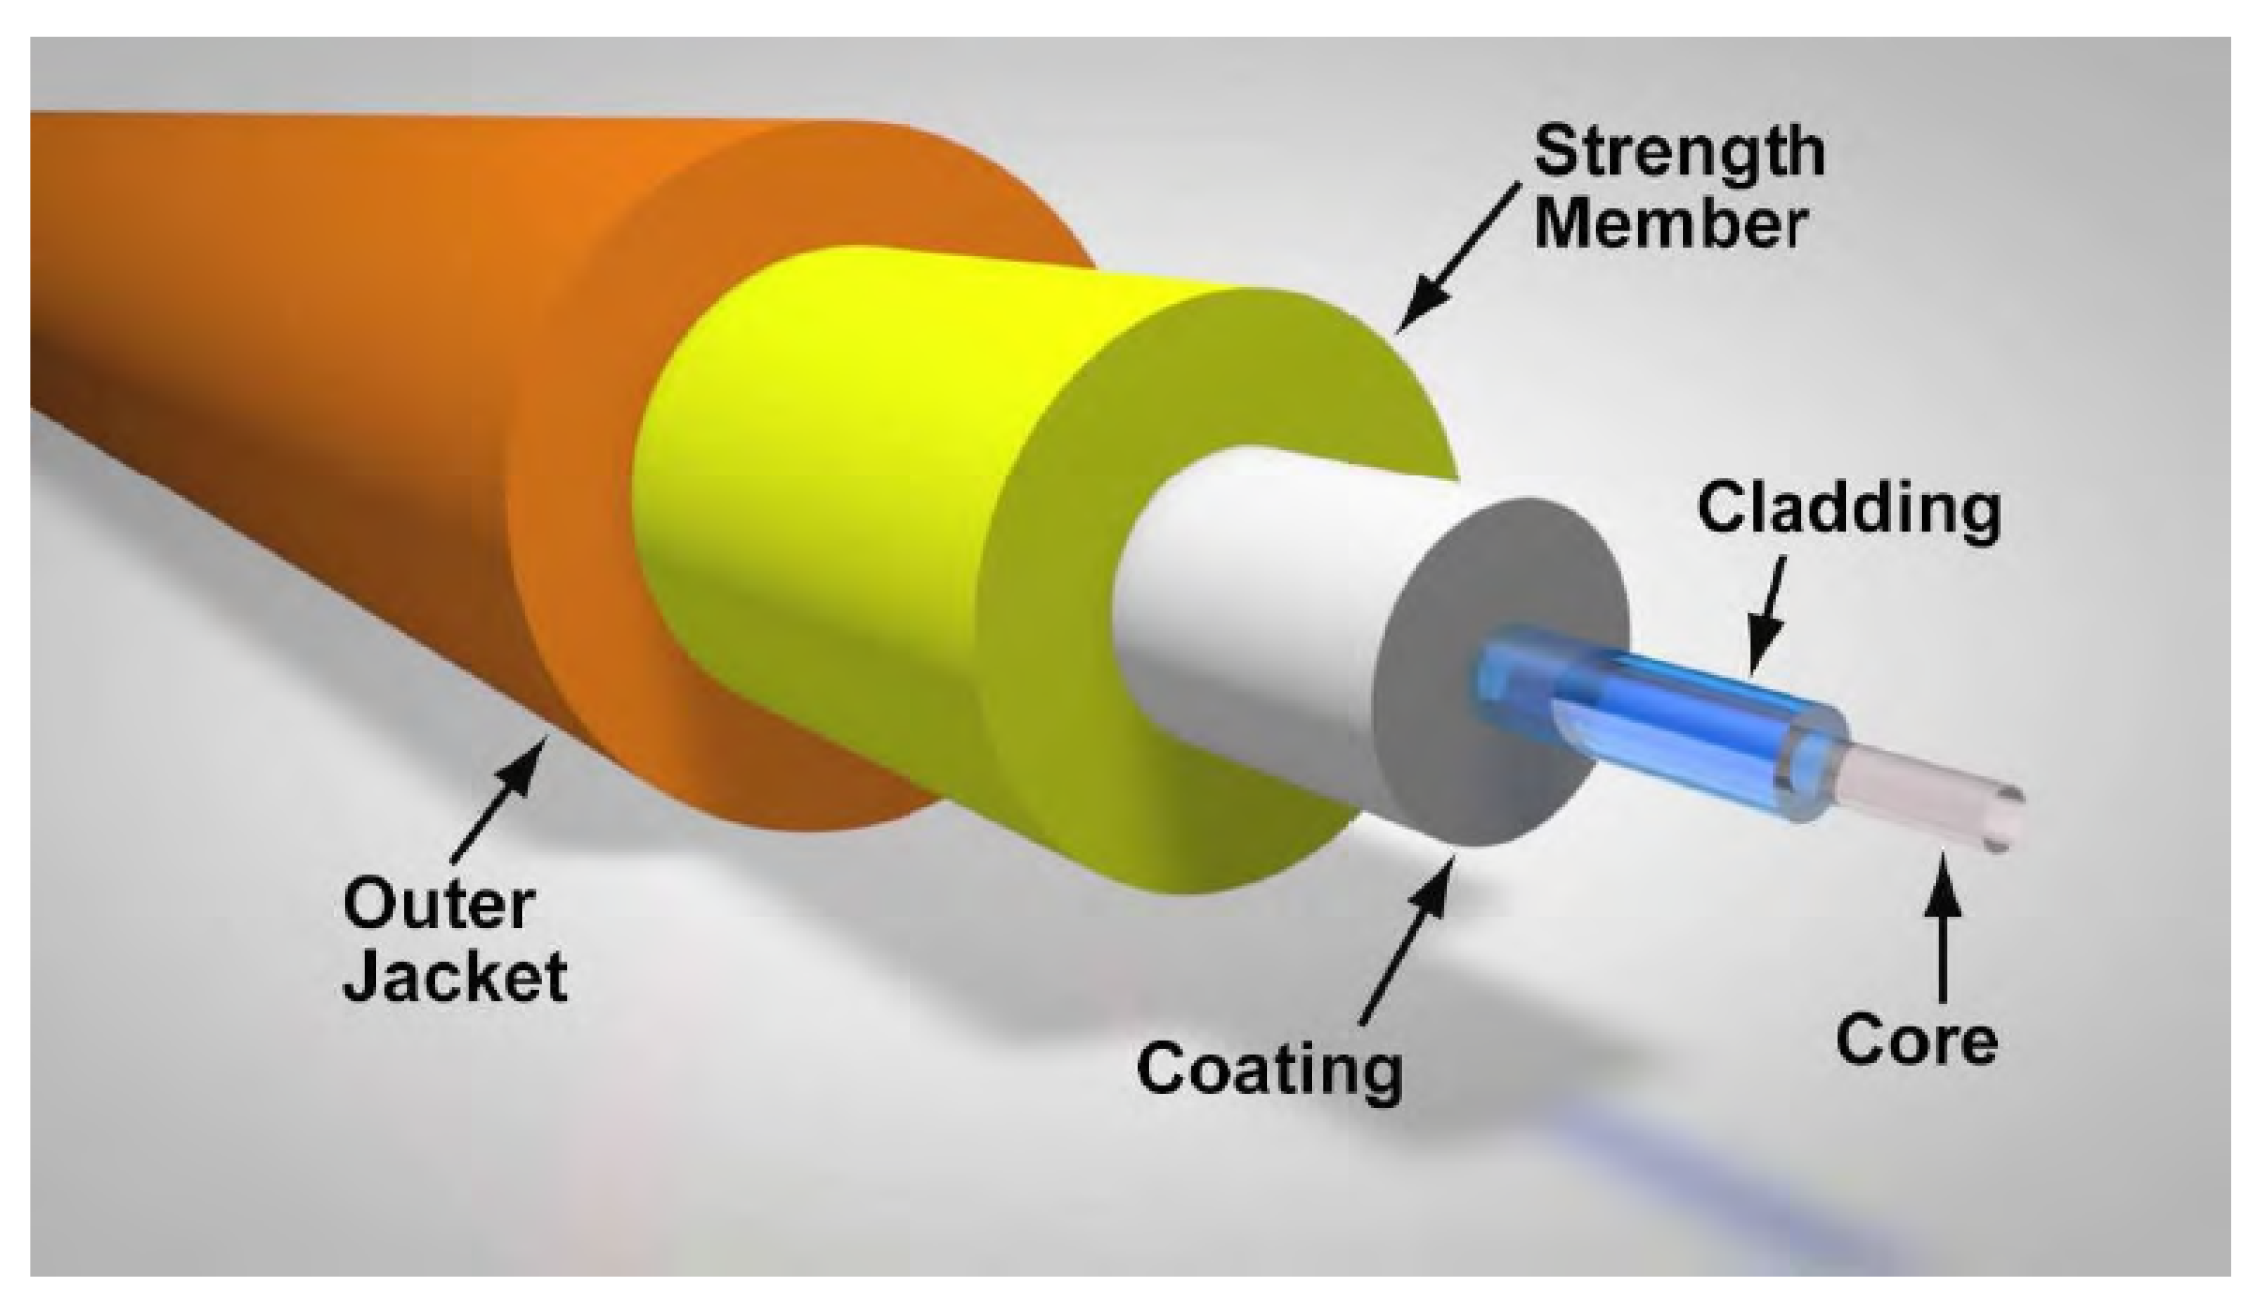
Figure 2.
Scheme of FBG working principle [15].
Figure 2.
Scheme of FBG working principle [15].
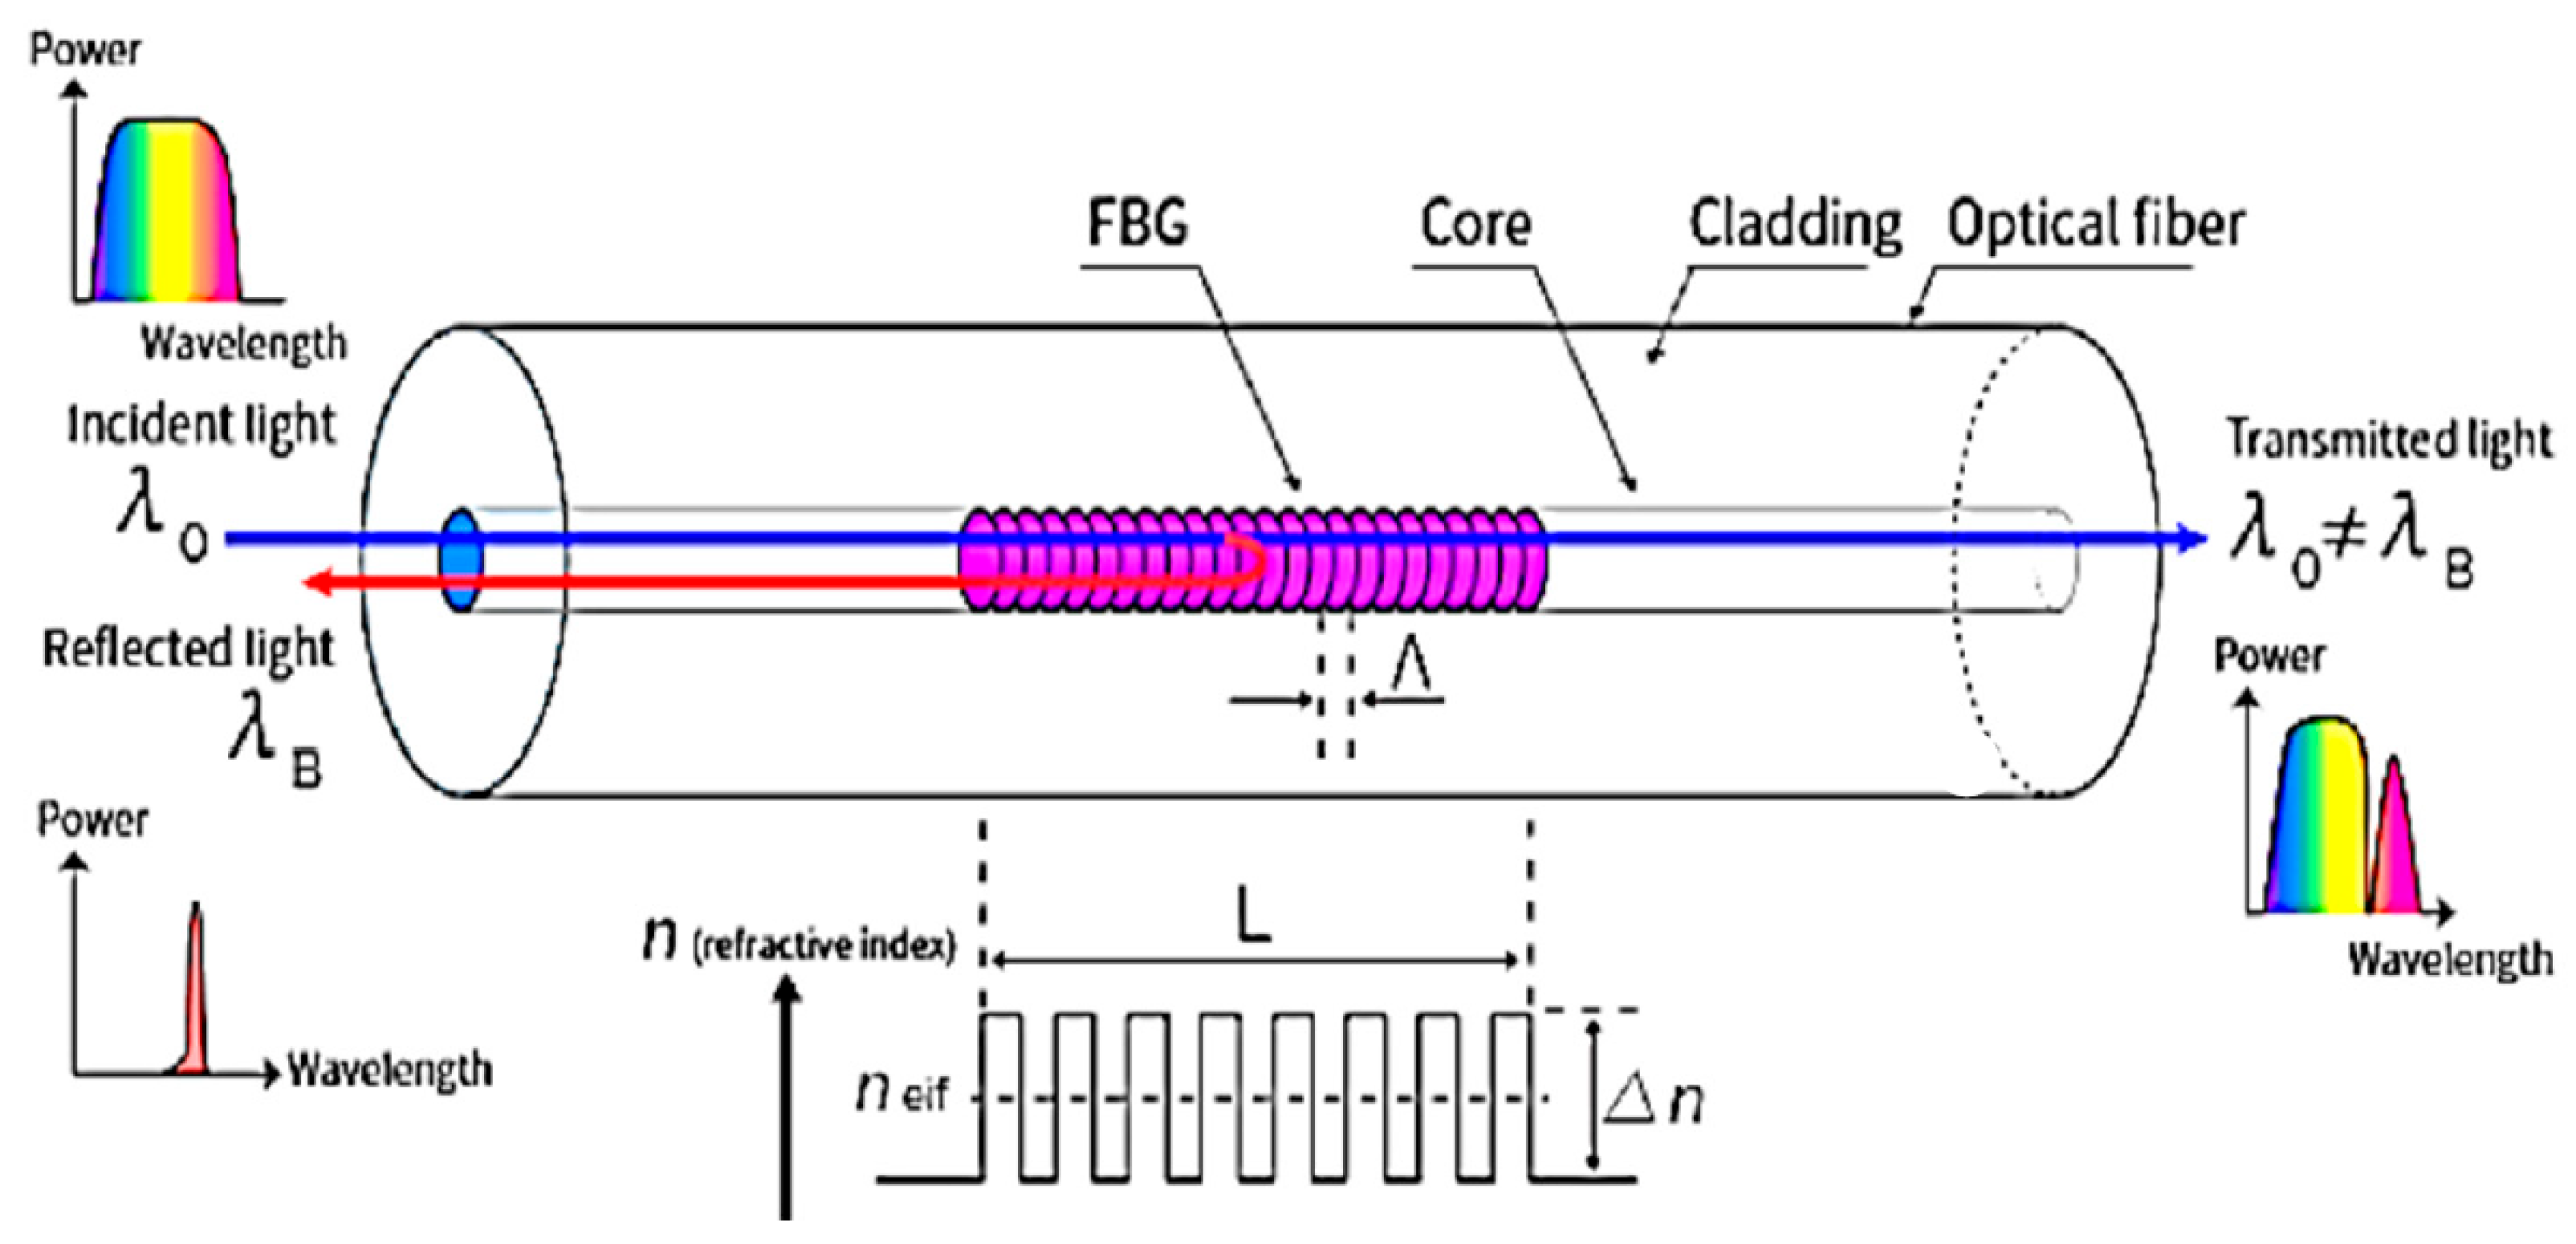
Figure 3.
Design schematic of newcleo’s reactor vessel, control rods, and steam generator, of the LFR-AS-200.
Figure 3.
Design schematic of newcleo’s reactor vessel, control rods, and steam generator, of the LFR-AS-200.
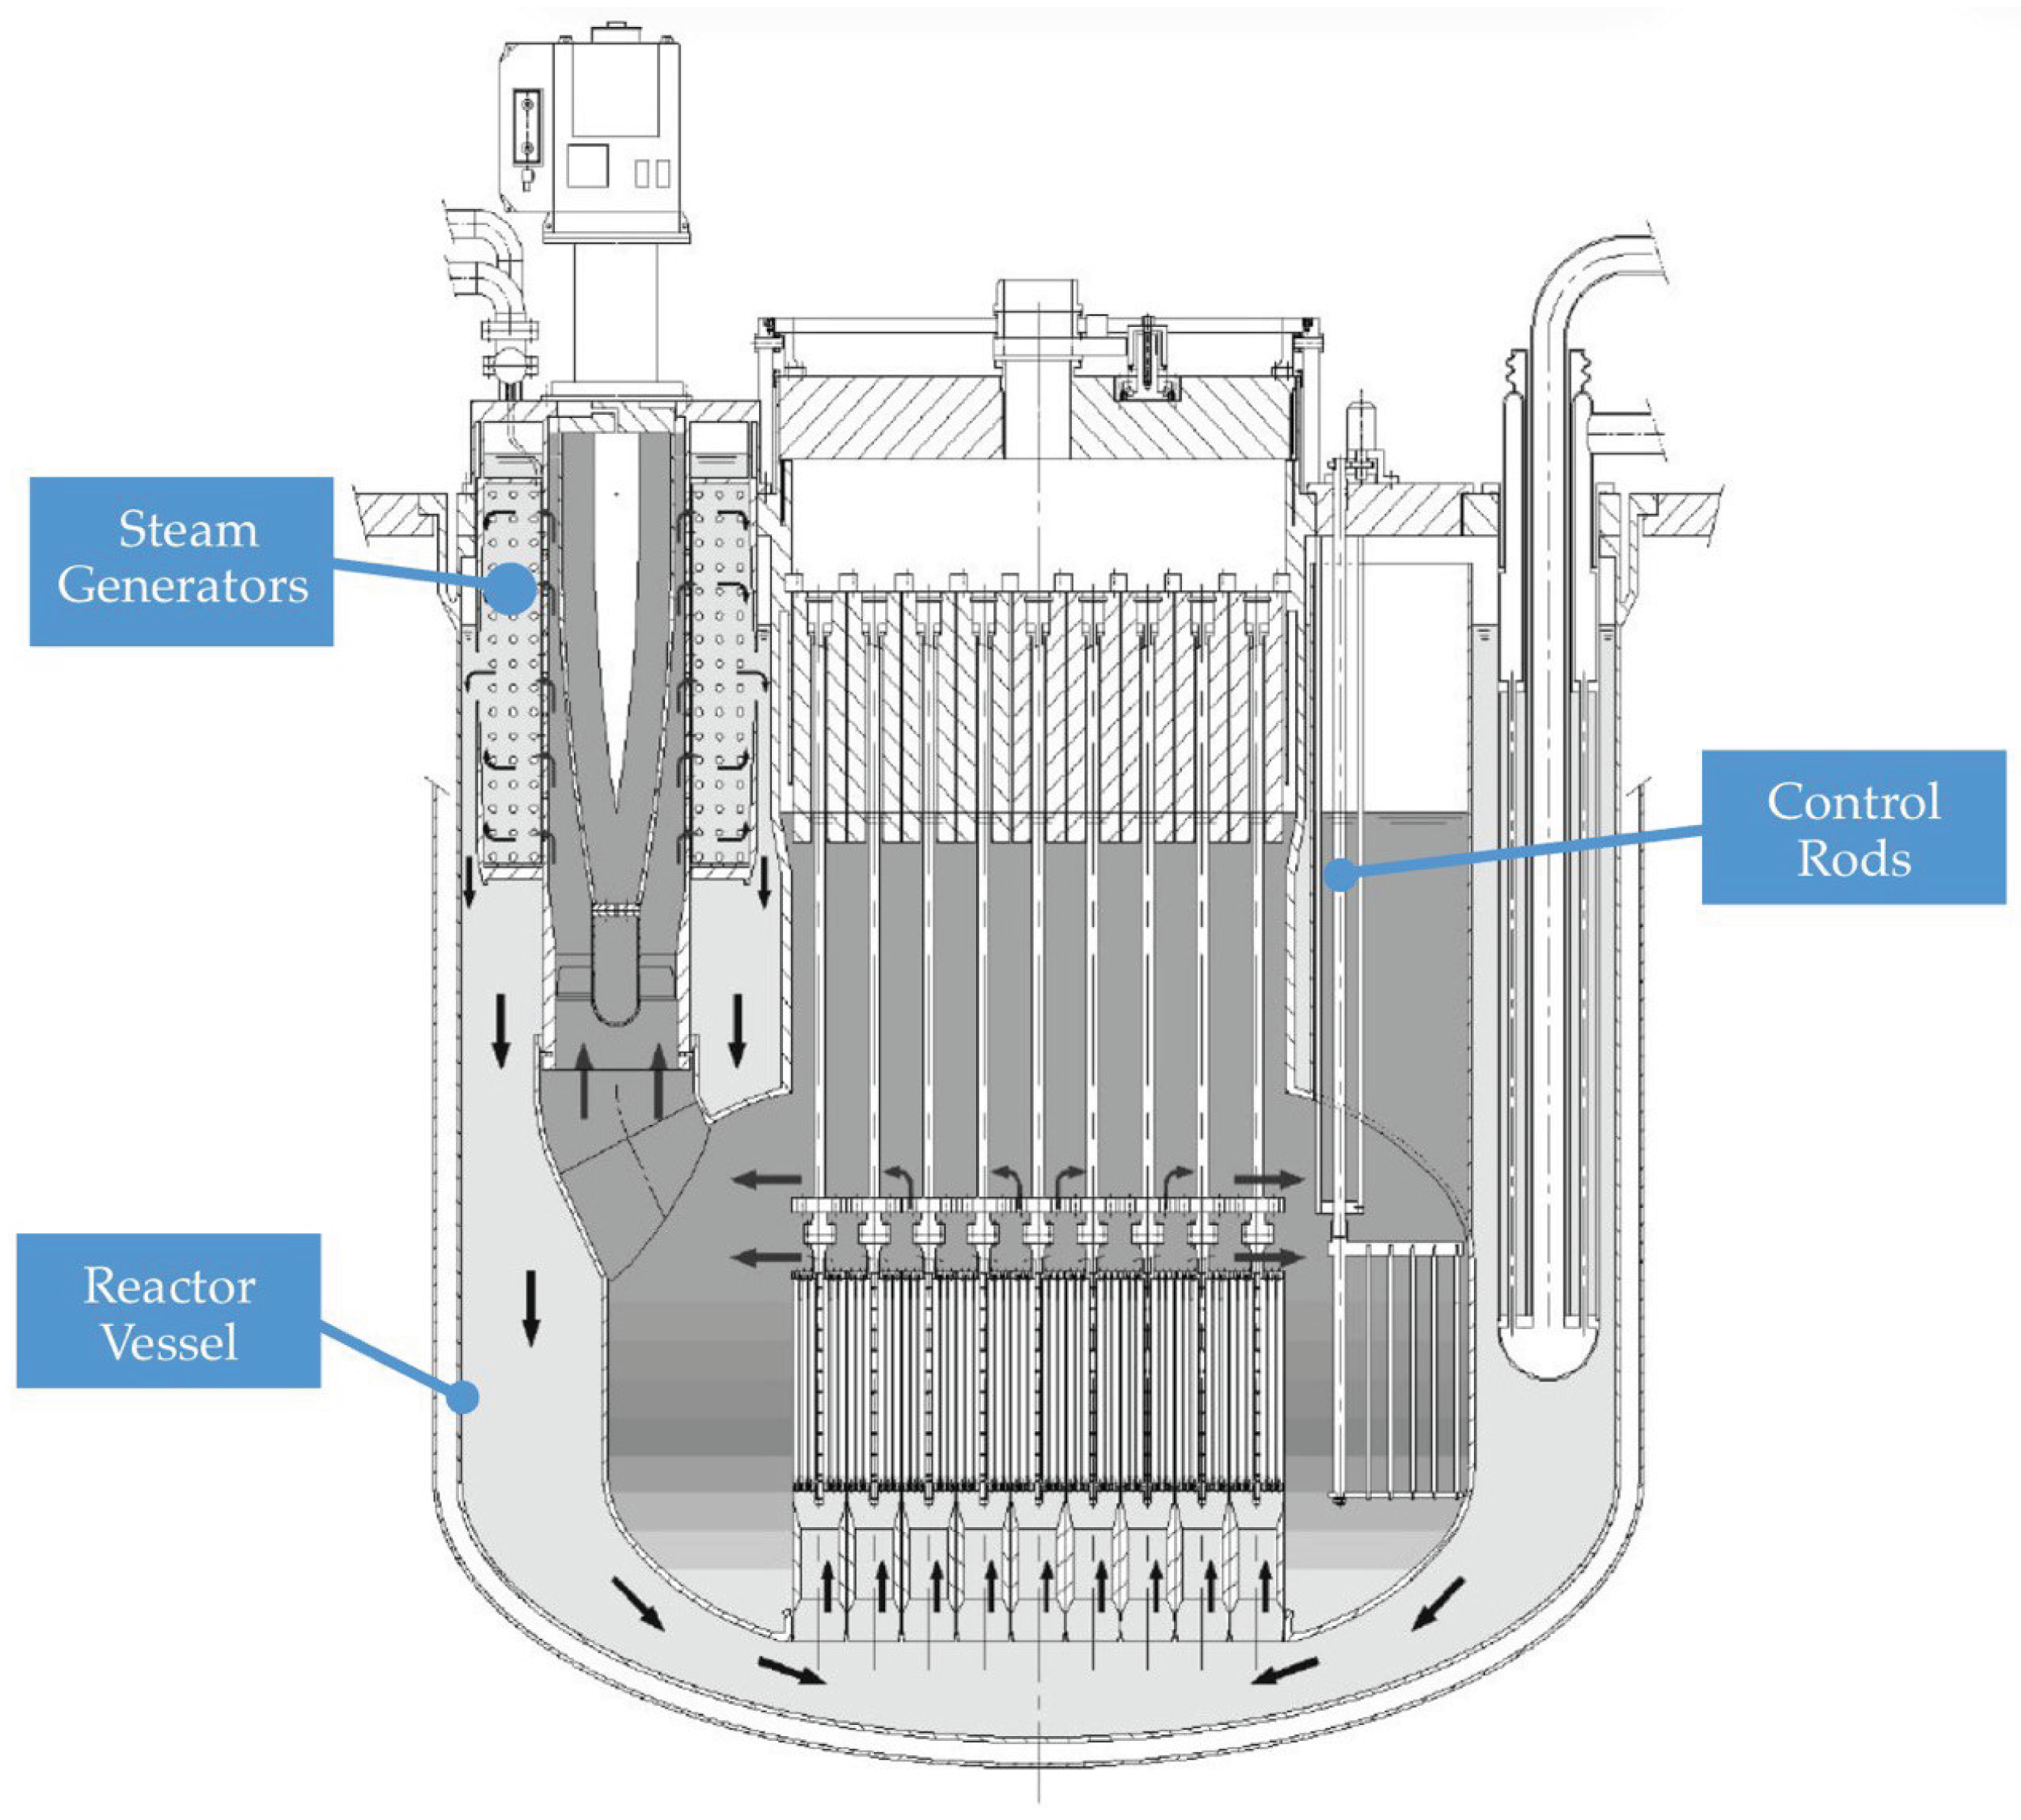
Figure 4.
Example of integration of optical fiber inside grooves etched on the RV’s external wall [49].
Figure 4.
Example of integration of optical fiber inside grooves etched on the RV’s external wall [49].
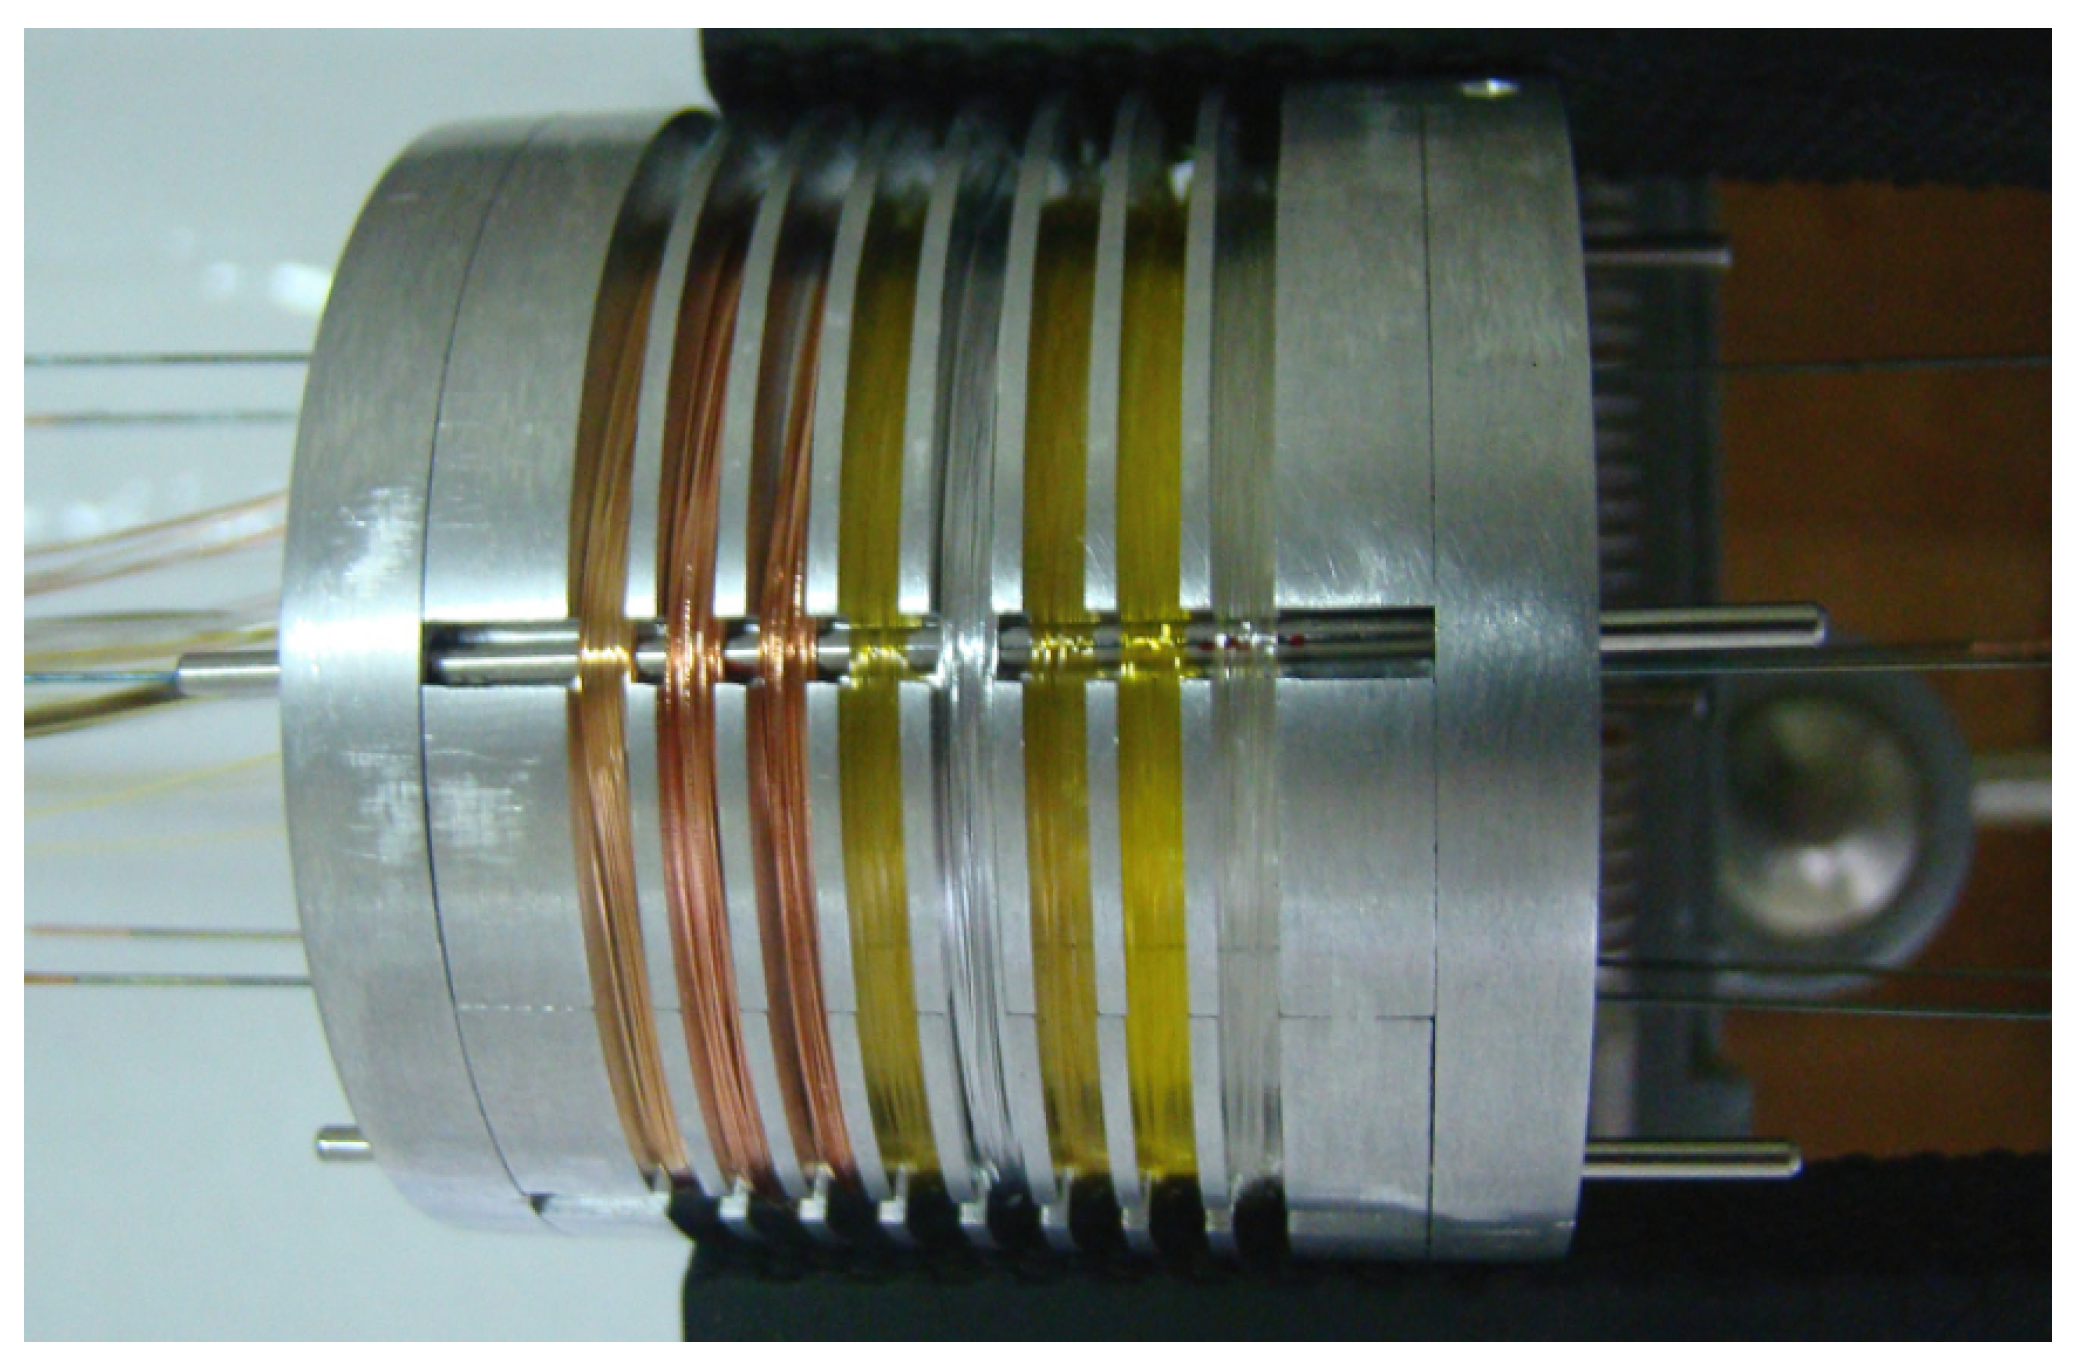
Figure 5.
Fiber fed through tack-welded capillary (left), and fiber fed through tack-welded capillary and taped along length (right) [47].
Figure 5.
Fiber fed through tack-welded capillary (left), and fiber fed through tack-welded capillary and taped along length (right) [47].
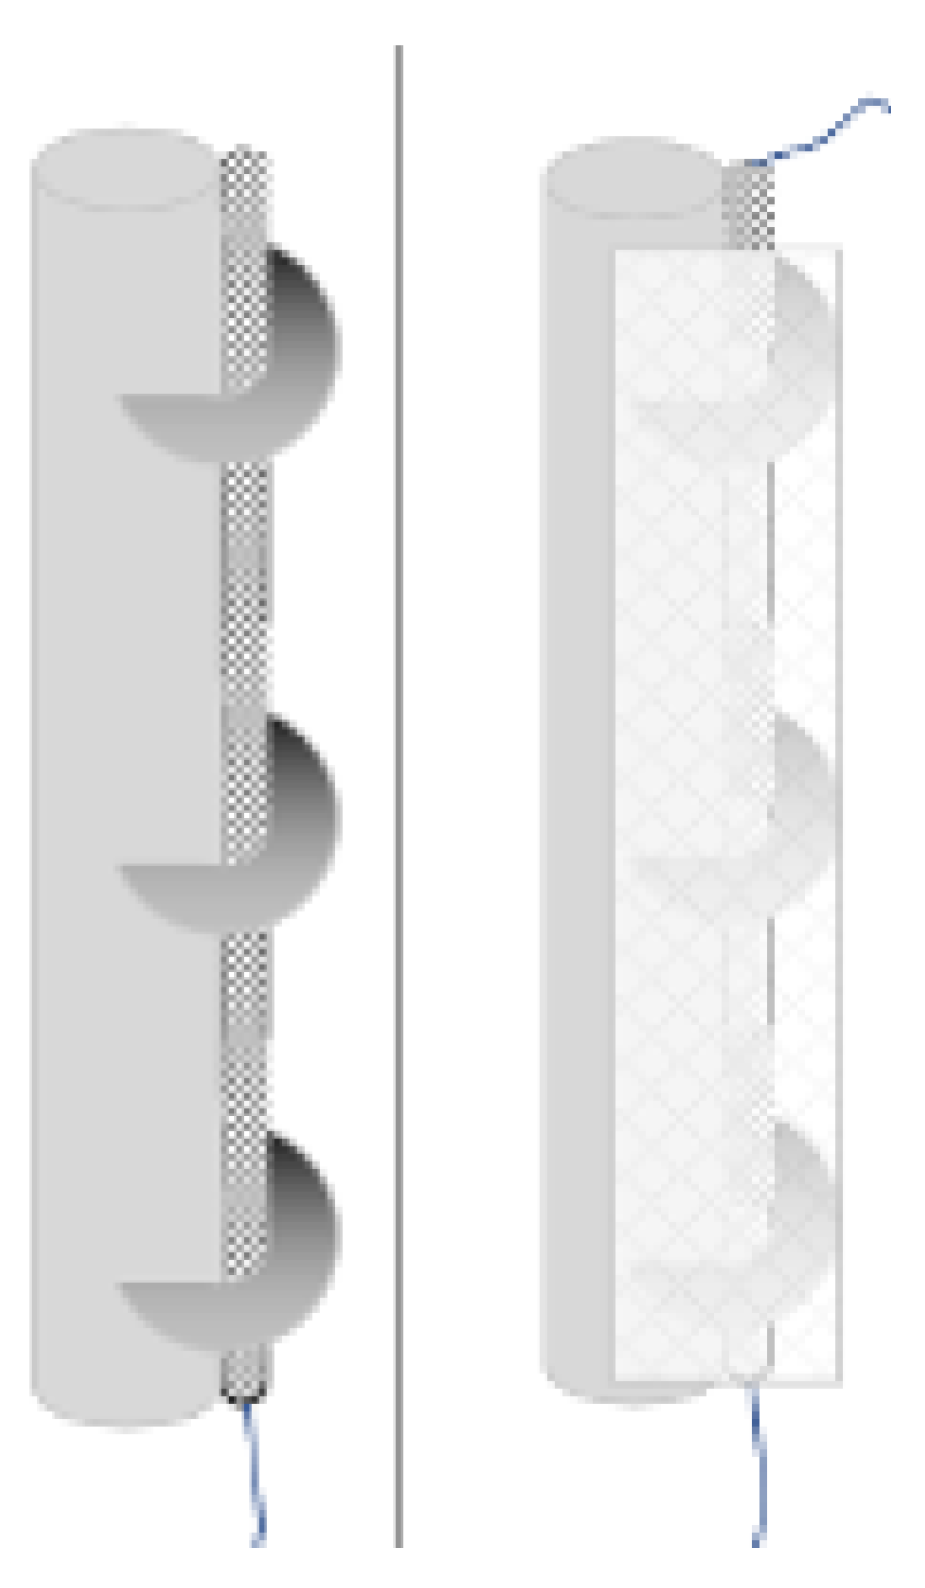
Figure 6.
Design integration of optical fibers onto the control rods. Image adapted from De Pauw et al. [32].
Figure 6.
Design integration of optical fibers onto the control rods. Image adapted from De Pauw et al. [32].
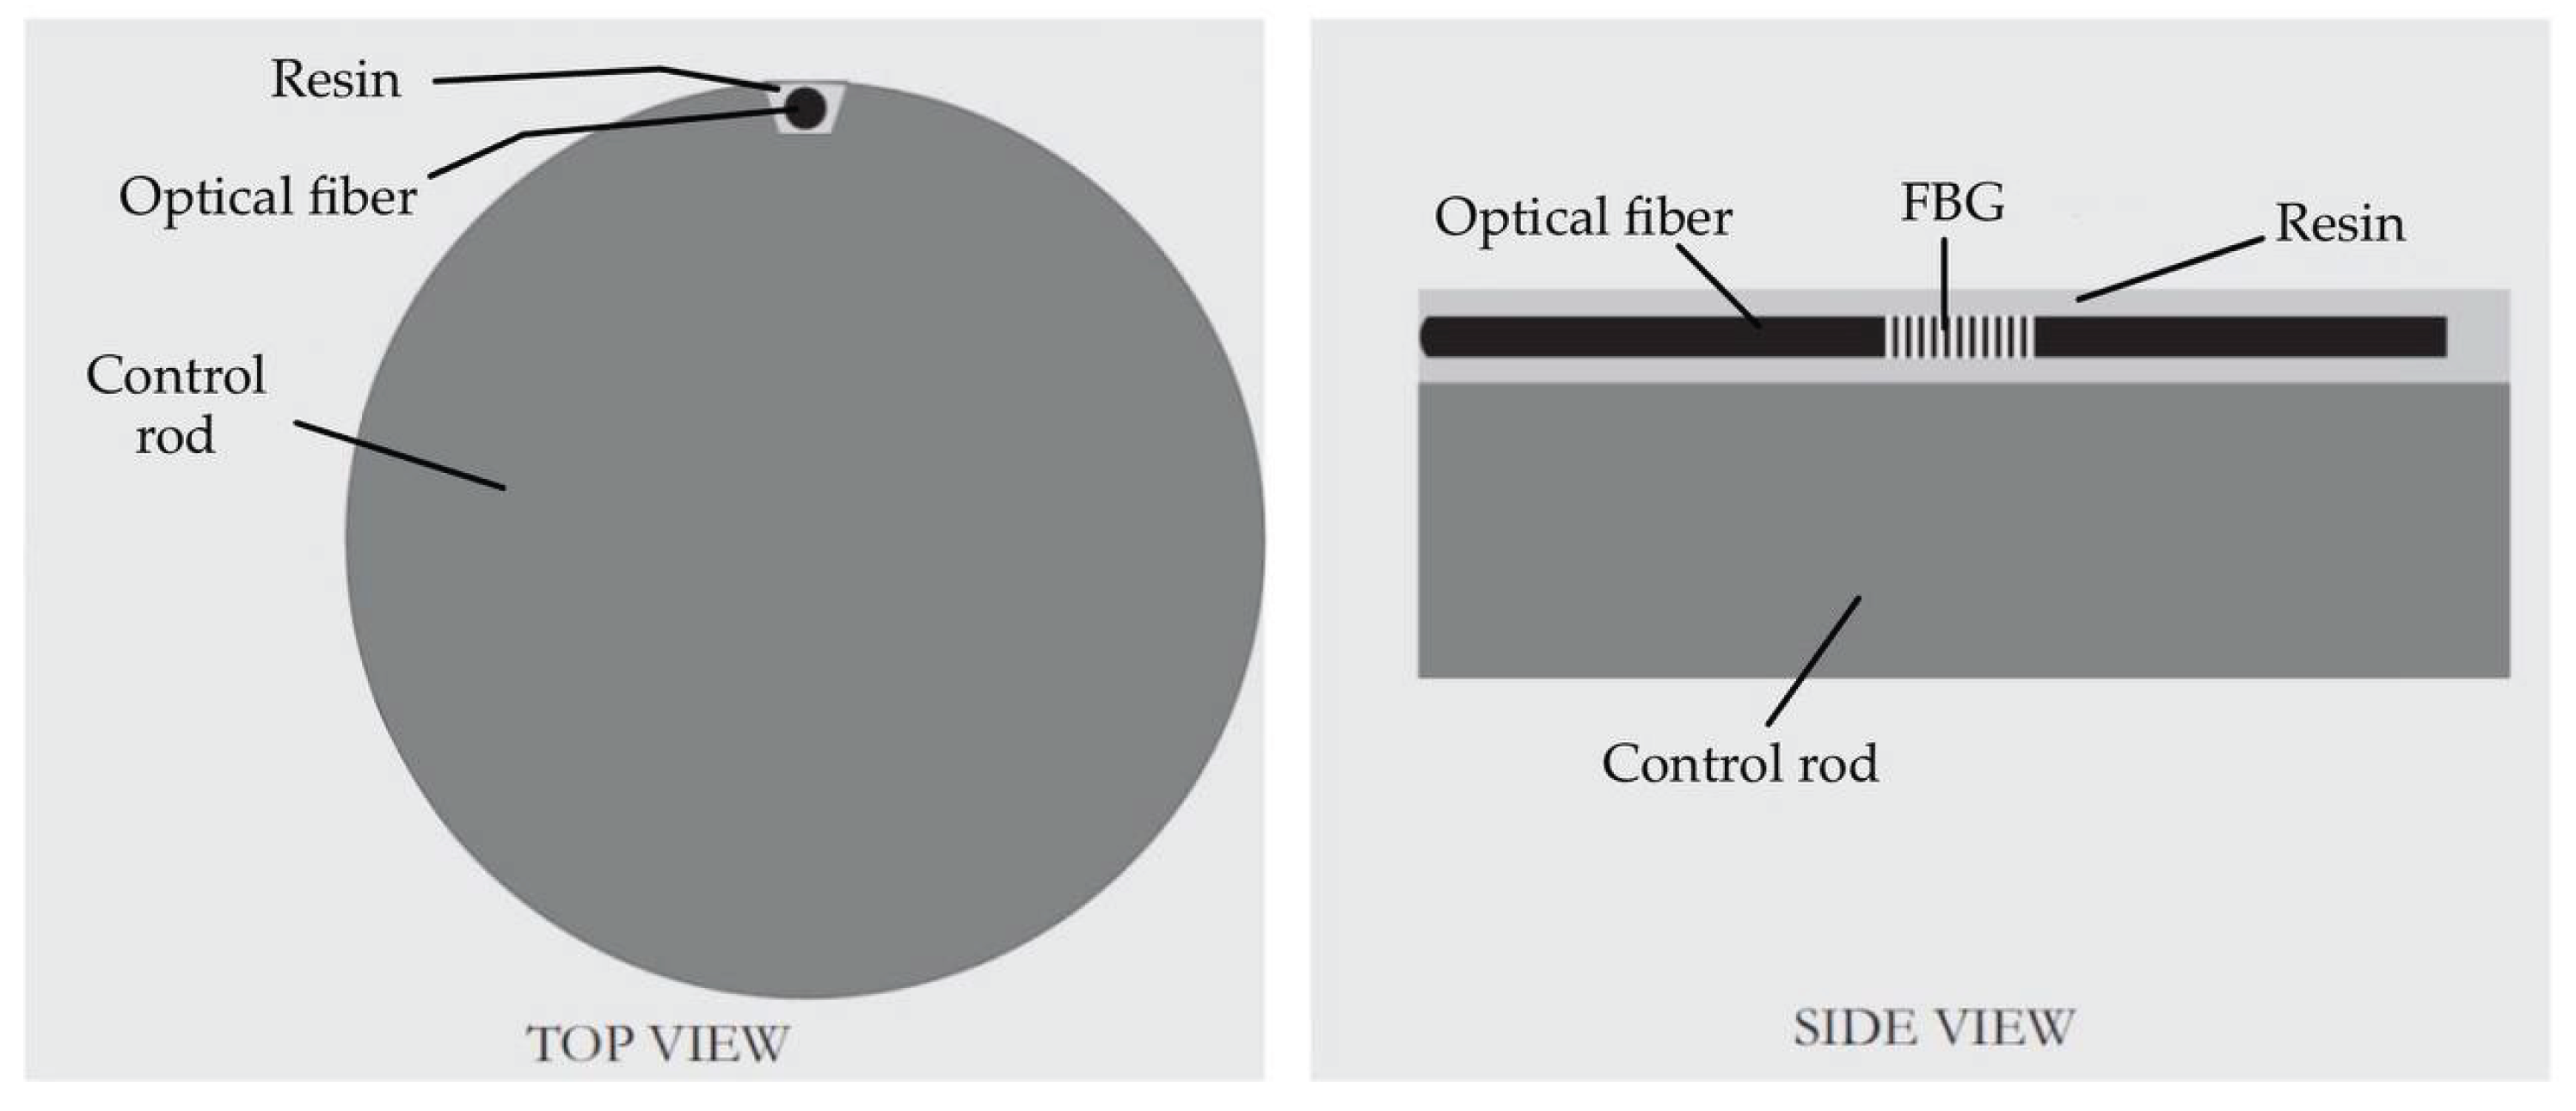
Figure 7.
Diagram structure of tube packaged fs-FBG high-temperature sensor [50].
Figure 7.
Diagram structure of tube packaged fs-FBG high-temperature sensor [50].
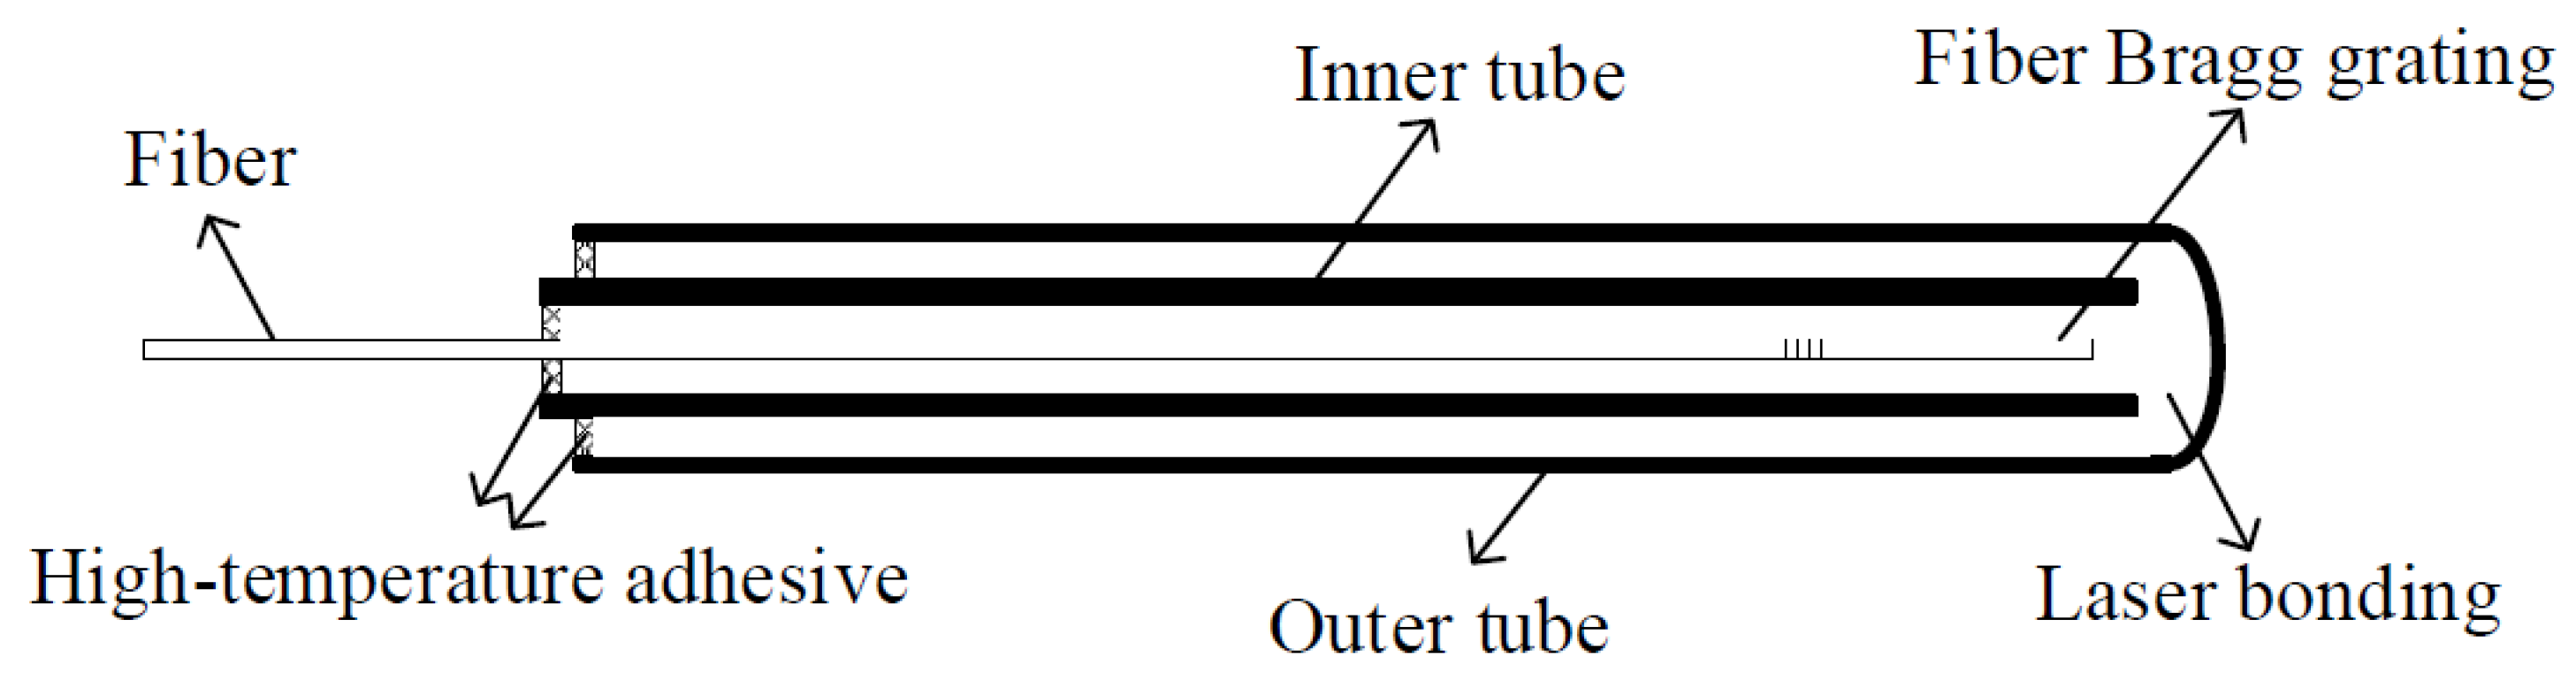
Figure 8.
An example of the radiation-induced effects on a Bragg peak reflection spectrum, before (black line) and after (red line) X-ray irradiation at 1.5 MGy at room temperature [61].
Figure 8.
An example of the radiation-induced effects on a Bragg peak reflection spectrum, before (black line) and after (red line) X-ray irradiation at 1.5 MGy at room temperature [61].
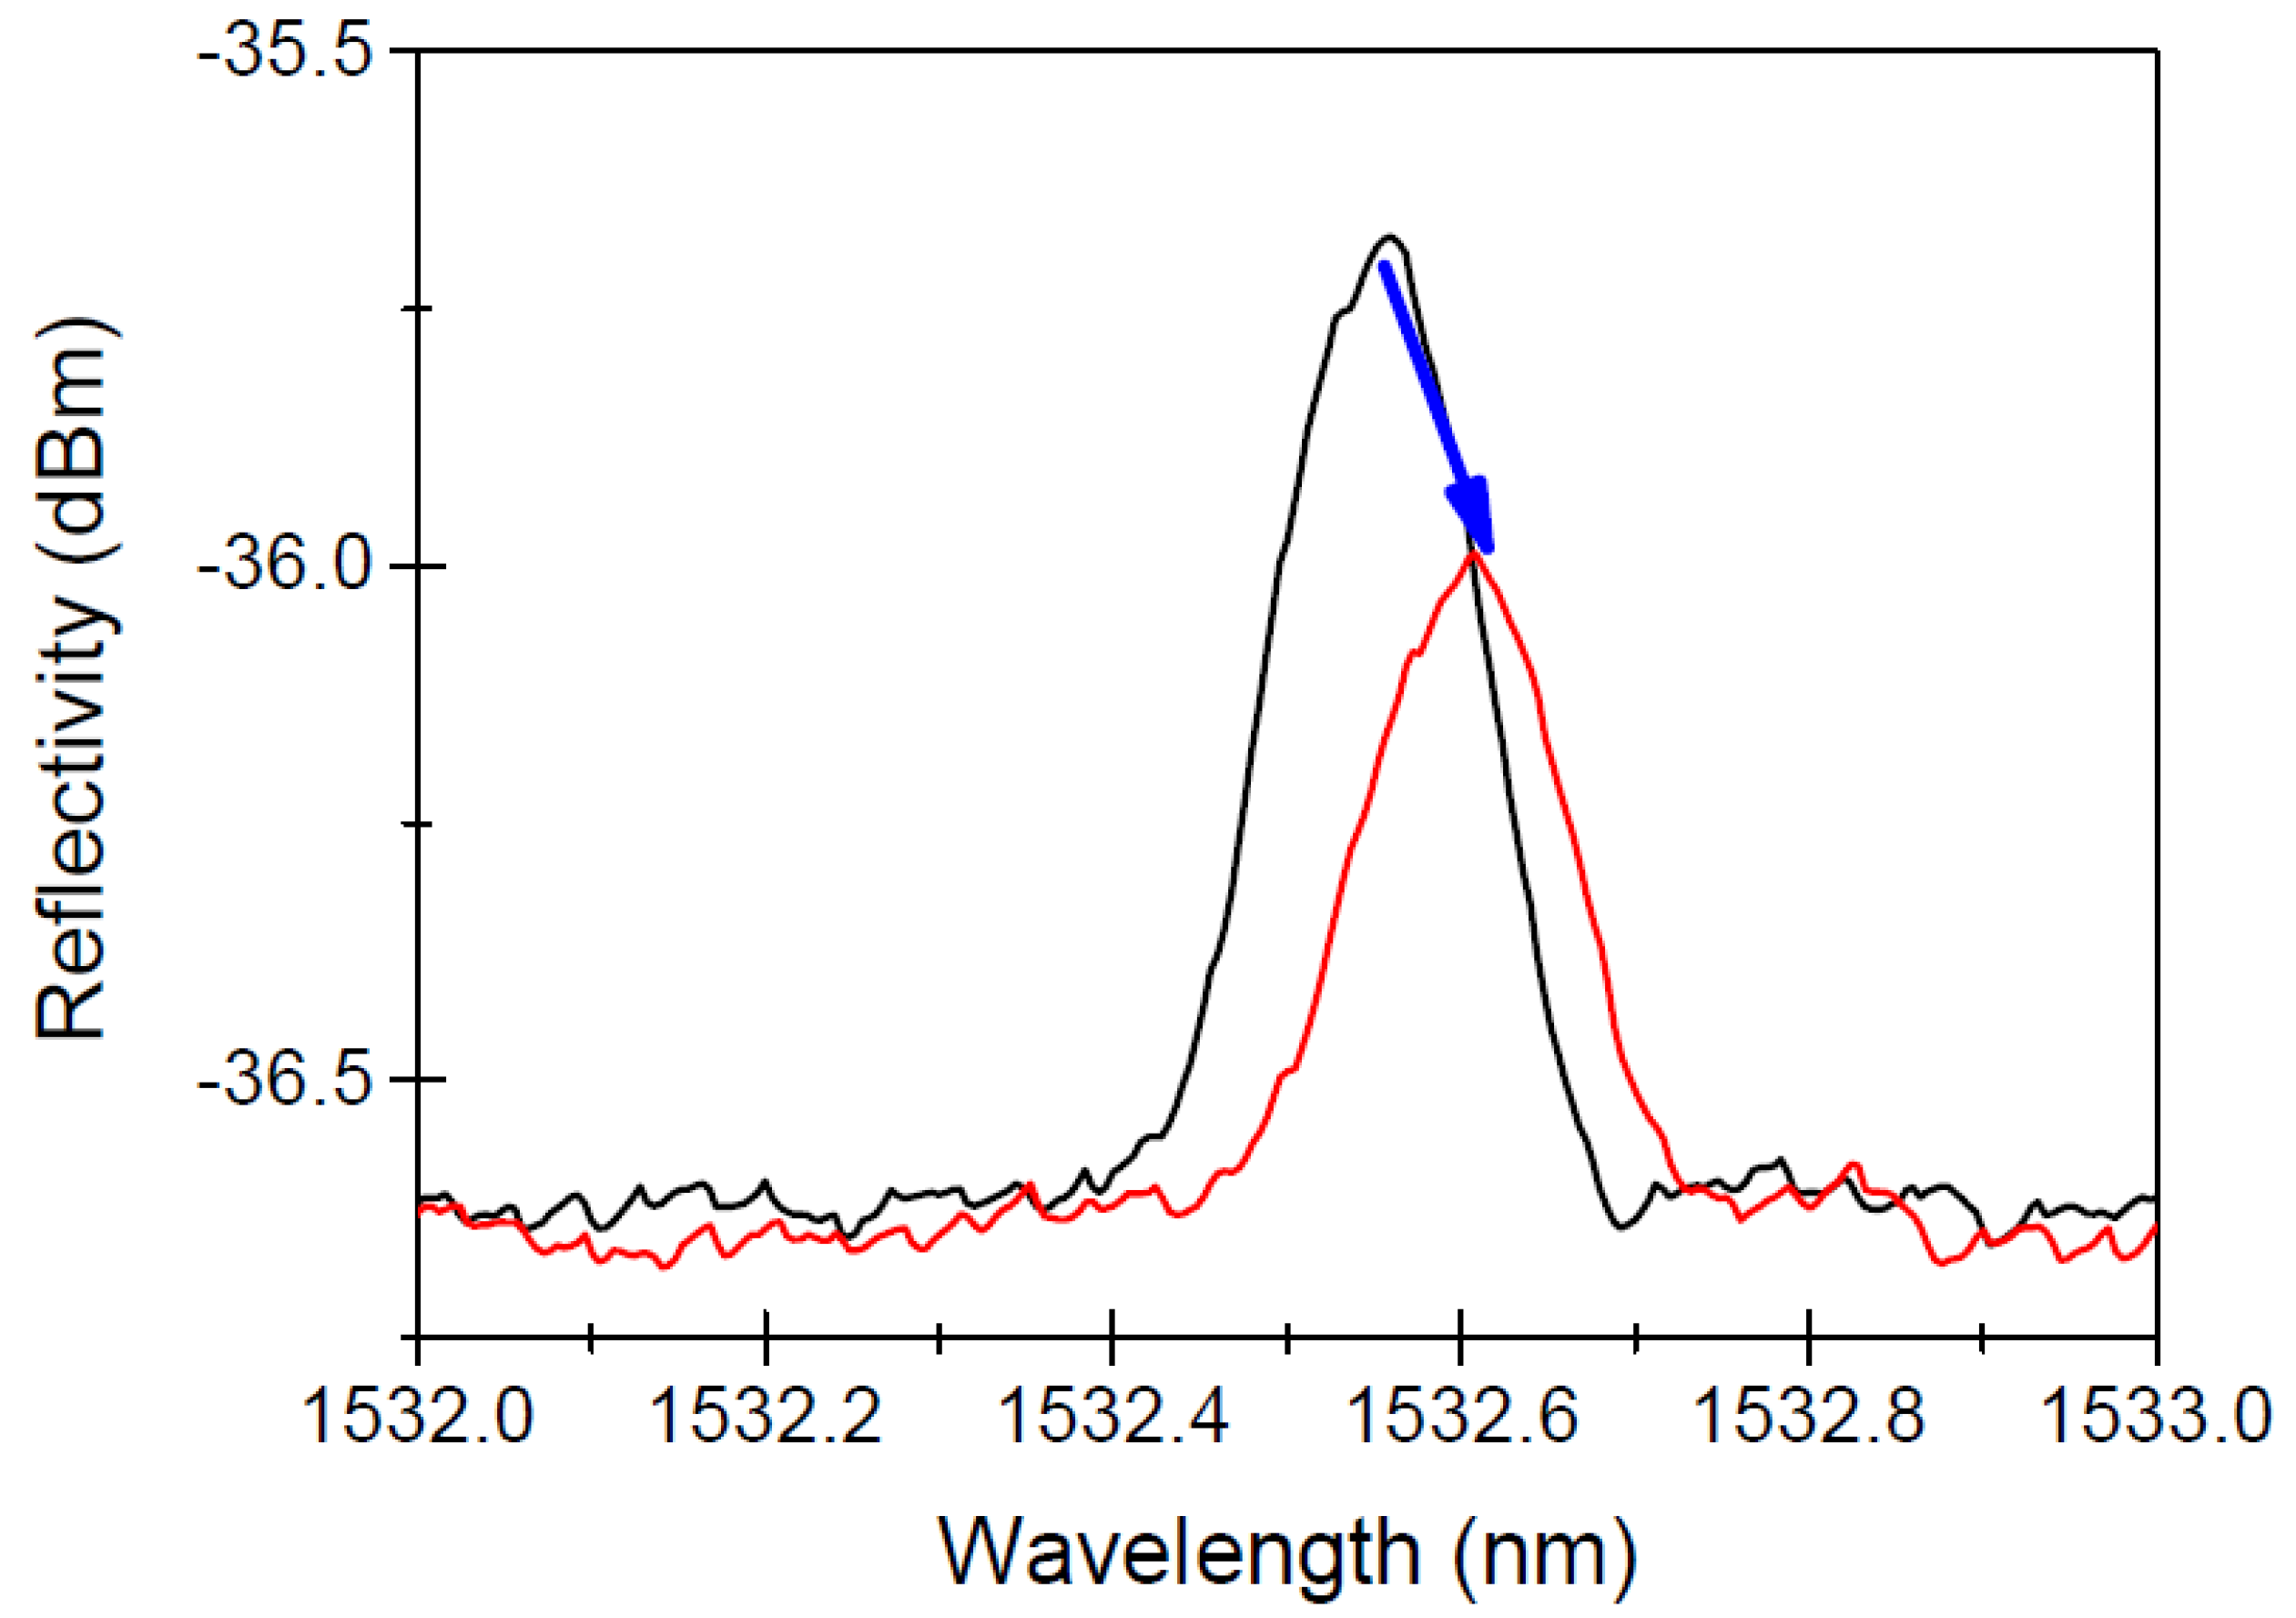
Figure 9.
Spectral RIA of the different samples after passive irradiation up to 750 kGy(SiO2) at room temperature [40].
Figure 9.
Spectral RIA of the different samples after passive irradiation up to 750 kGy(SiO2) at room temperature [40].
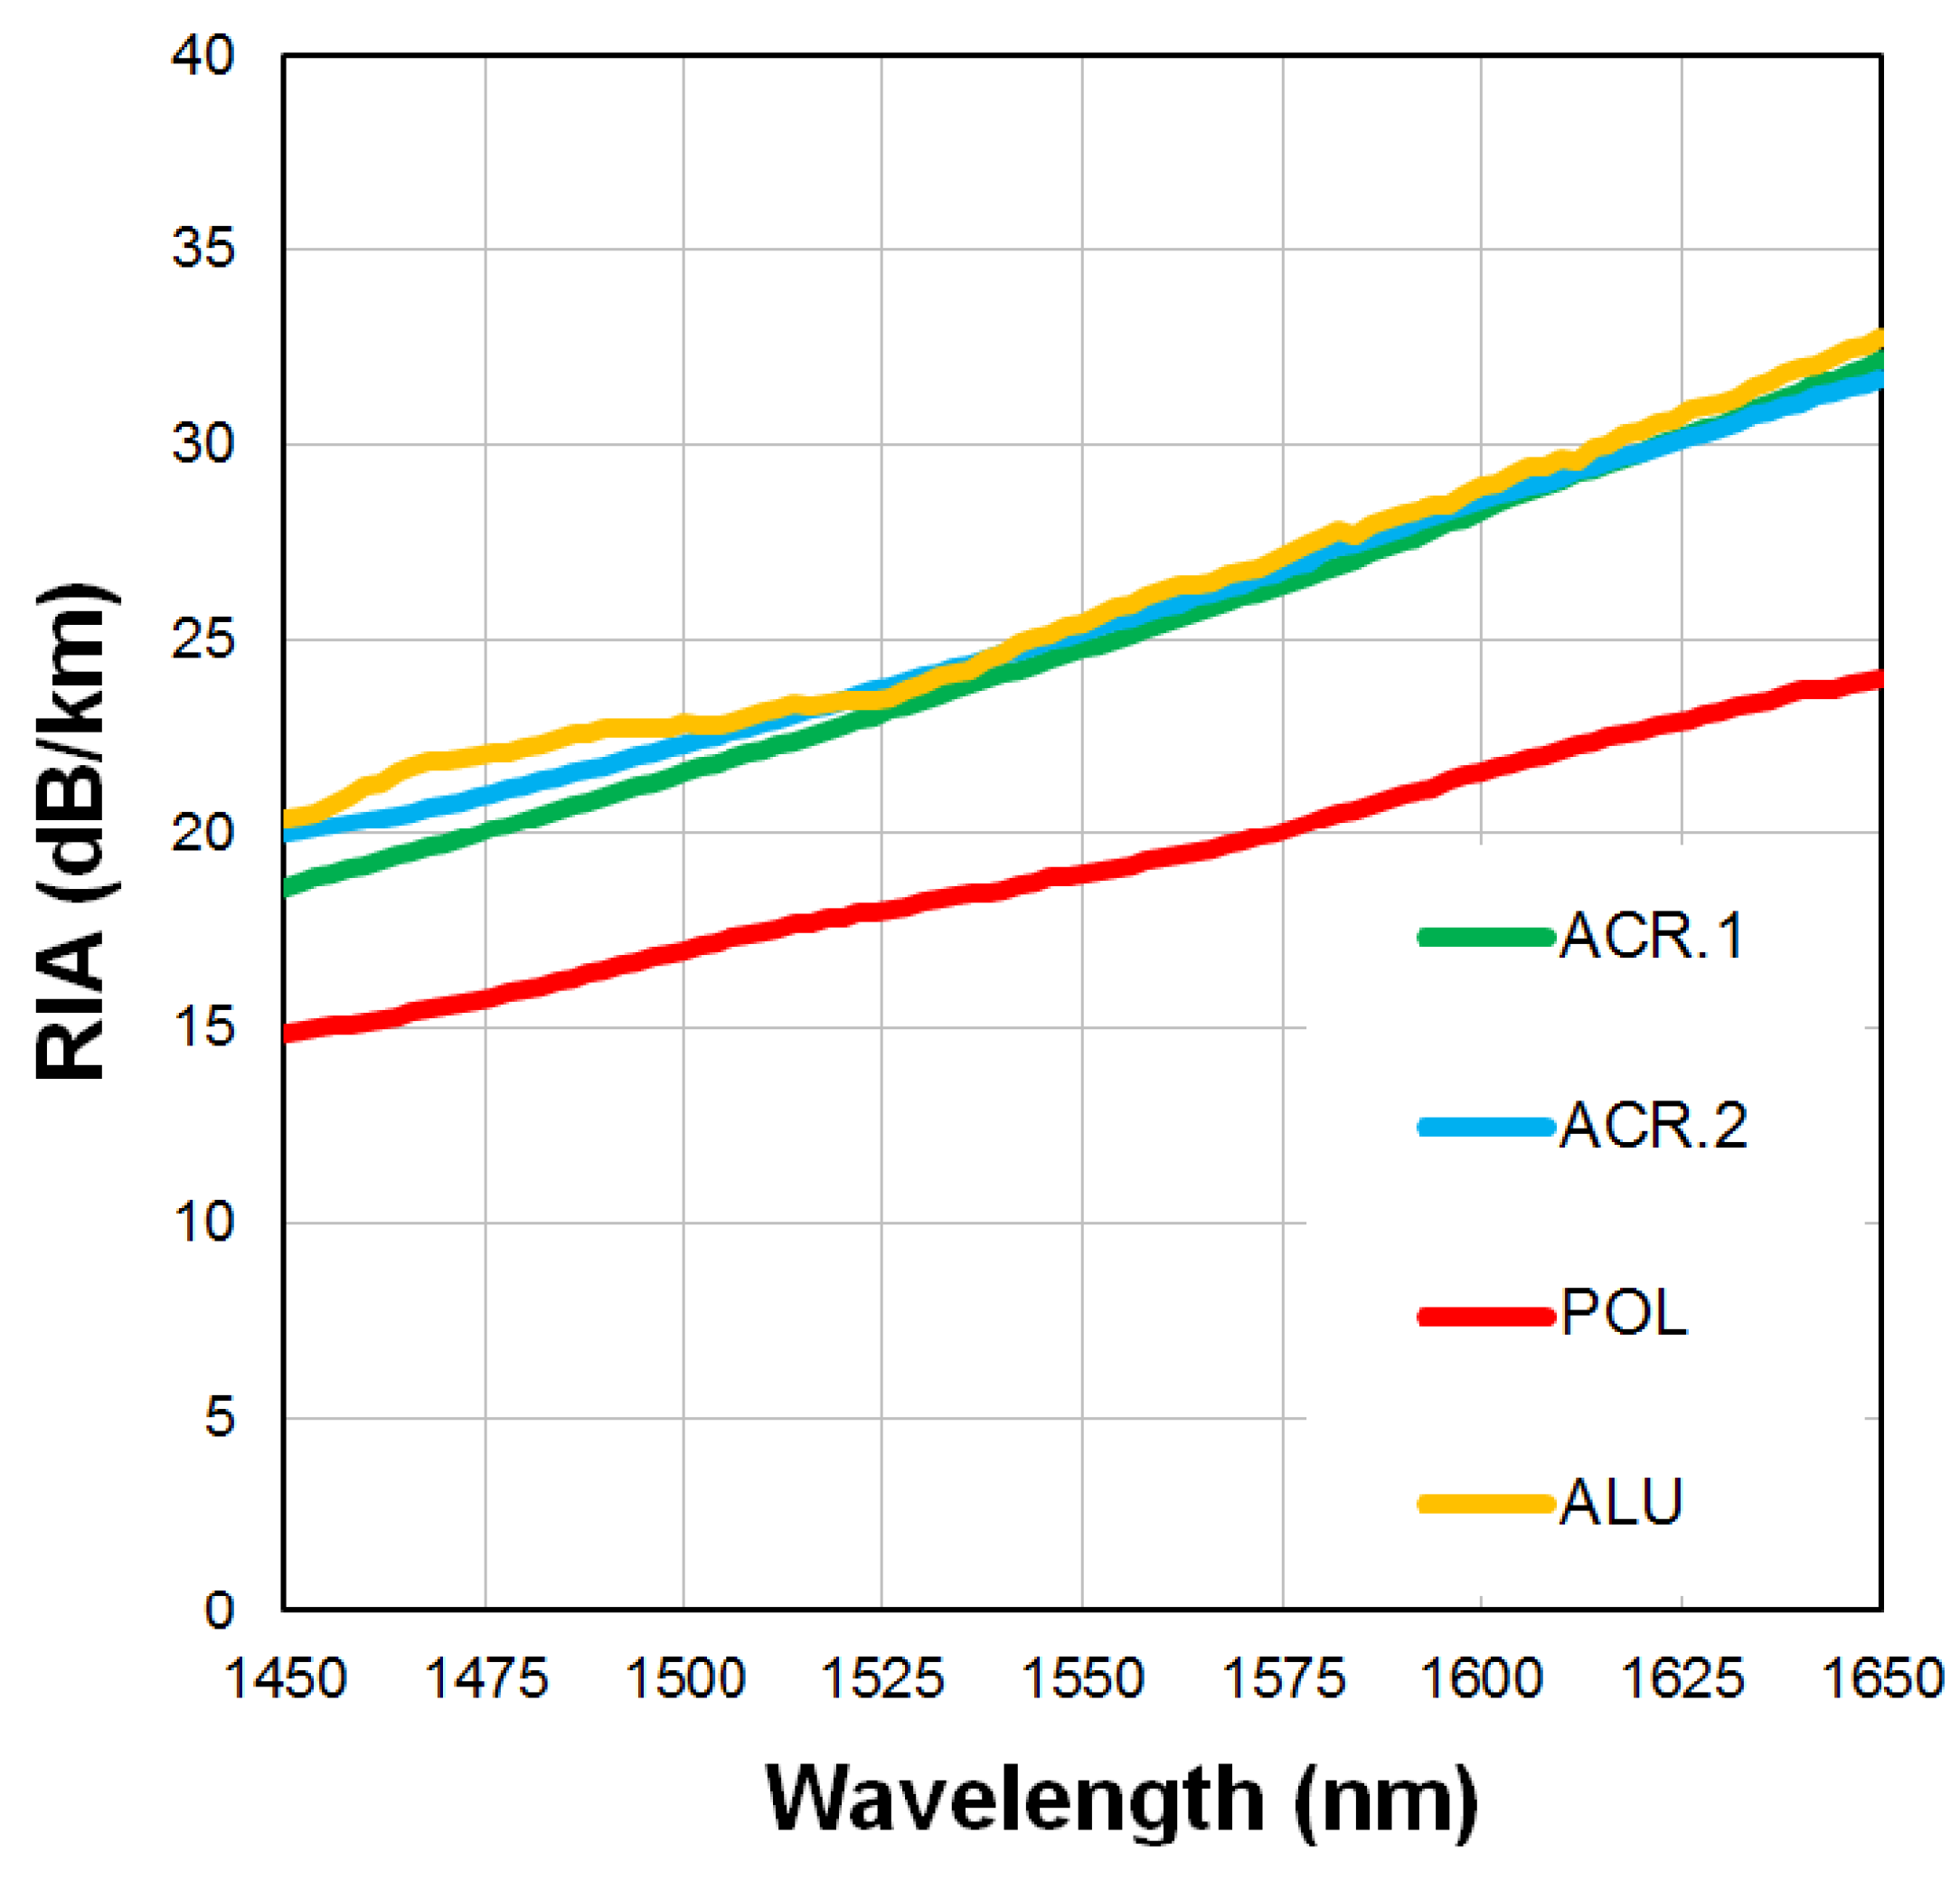
Figure 10.
(a) TGA curves of polyimide coated fiber before/after irradiation. (b) Life-time prediction of polyimide coated fiber before/after irradiation for a 20 wt% mass loss criteria [40].
Figure 10.
(a) TGA curves of polyimide coated fiber before/after irradiation. (b) Life-time prediction of polyimide coated fiber before/after irradiation for a 20 wt% mass loss criteria [40].
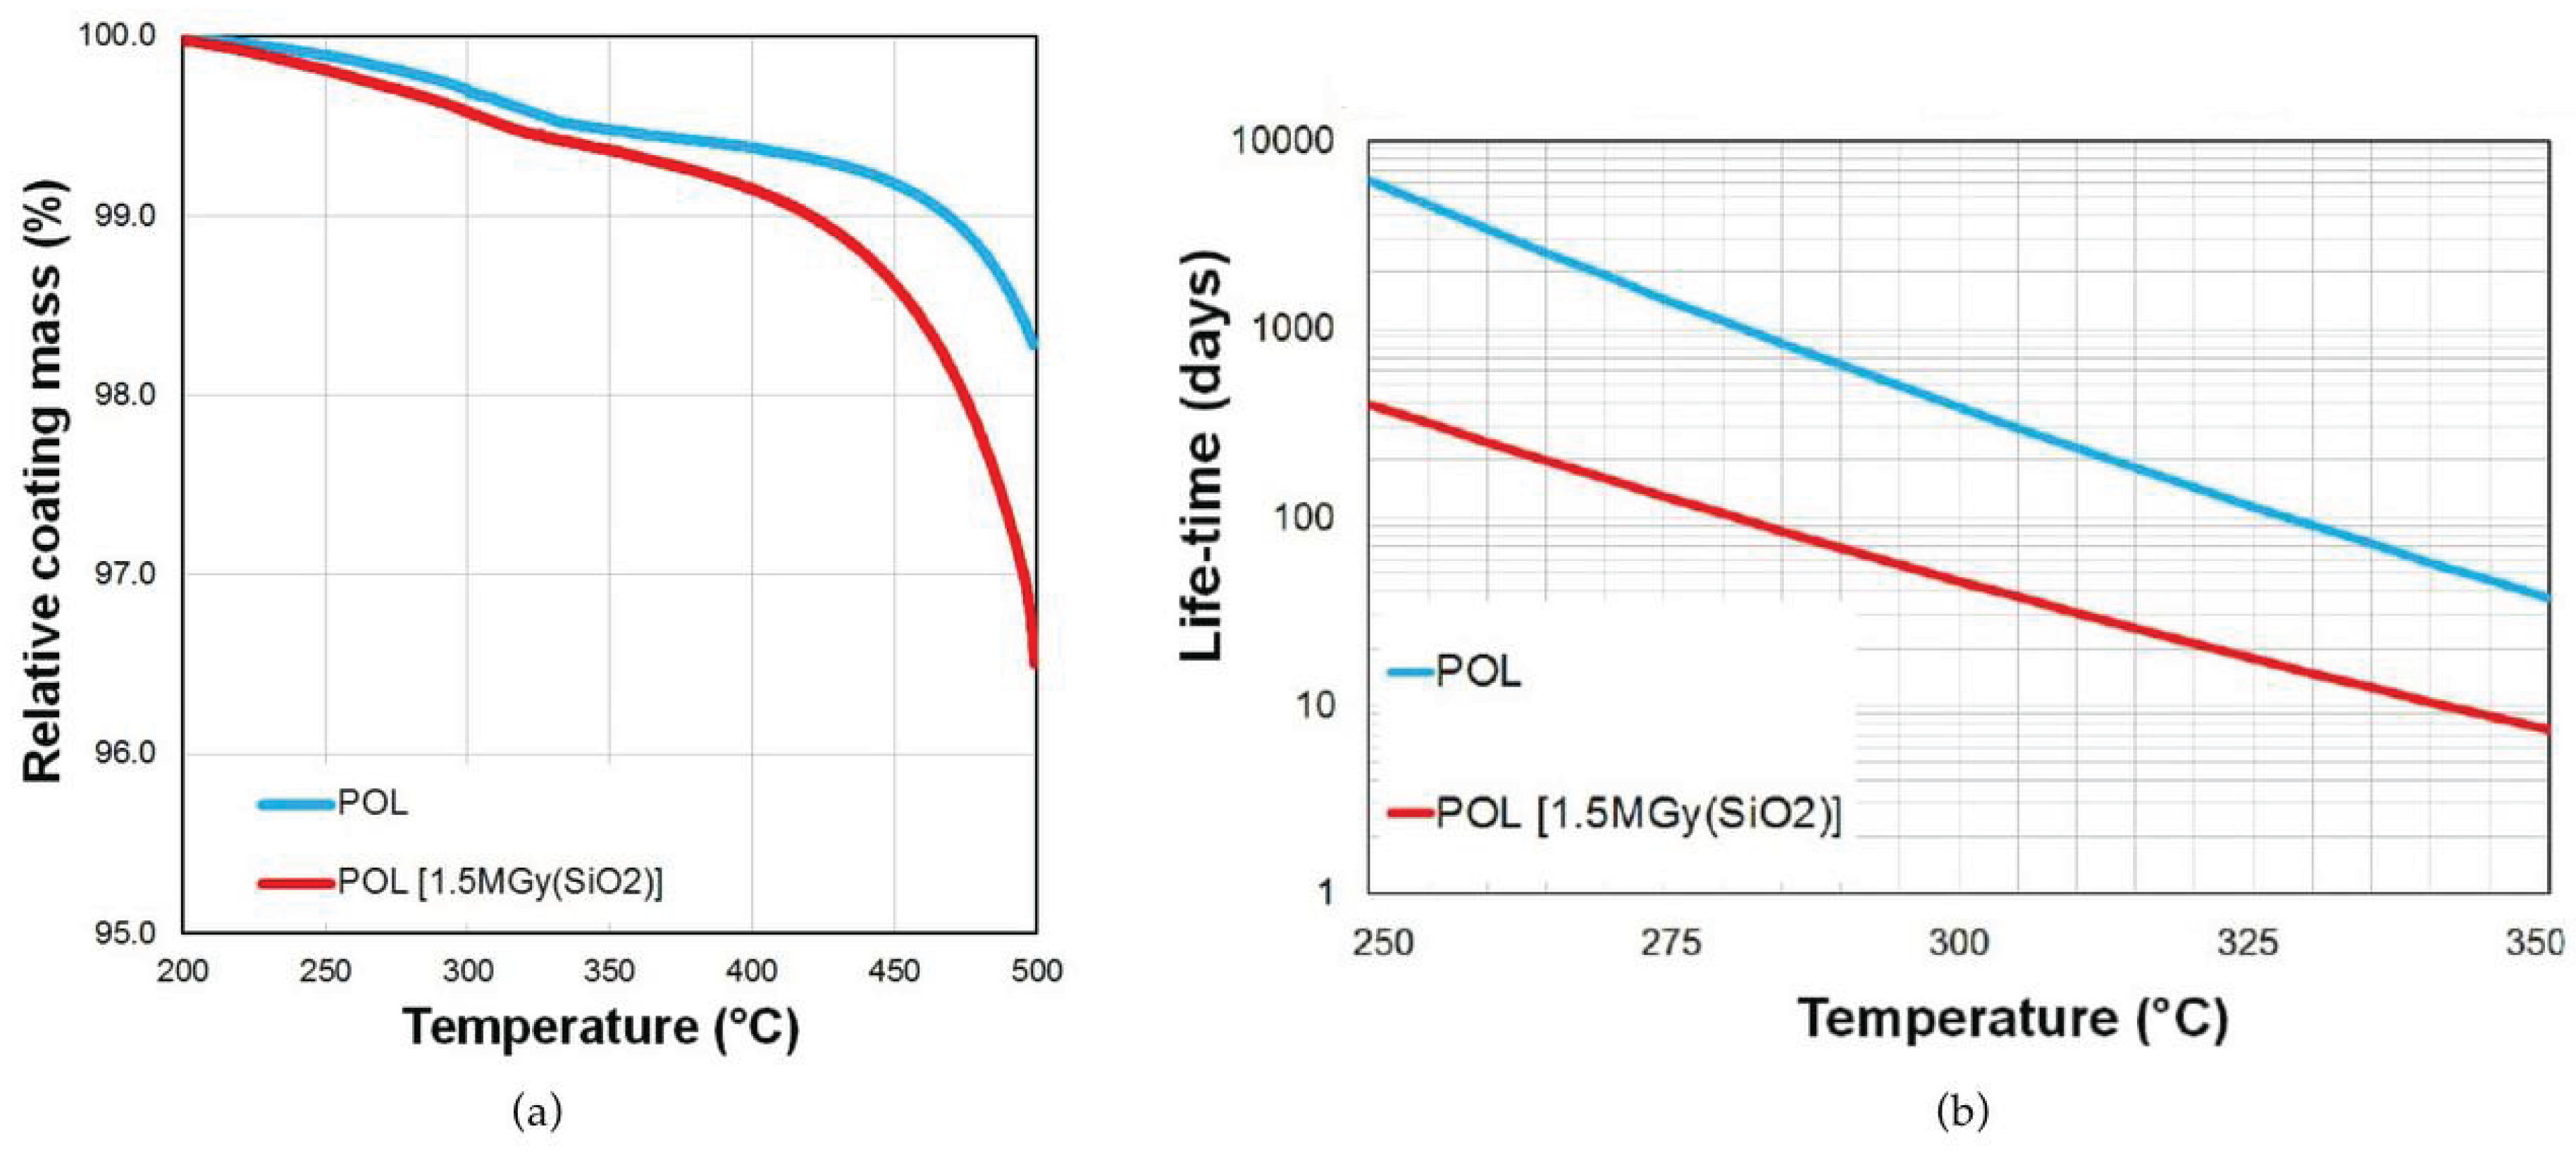
Figure 11.
Laboratory setup: (1) Thermocouple reader, (2) SmartScan SBI interrogator, (3) control PC.
Figure 11.
Laboratory setup: (1) Thermocouple reader, (2) SmartScan SBI interrogator, (3) control PC.
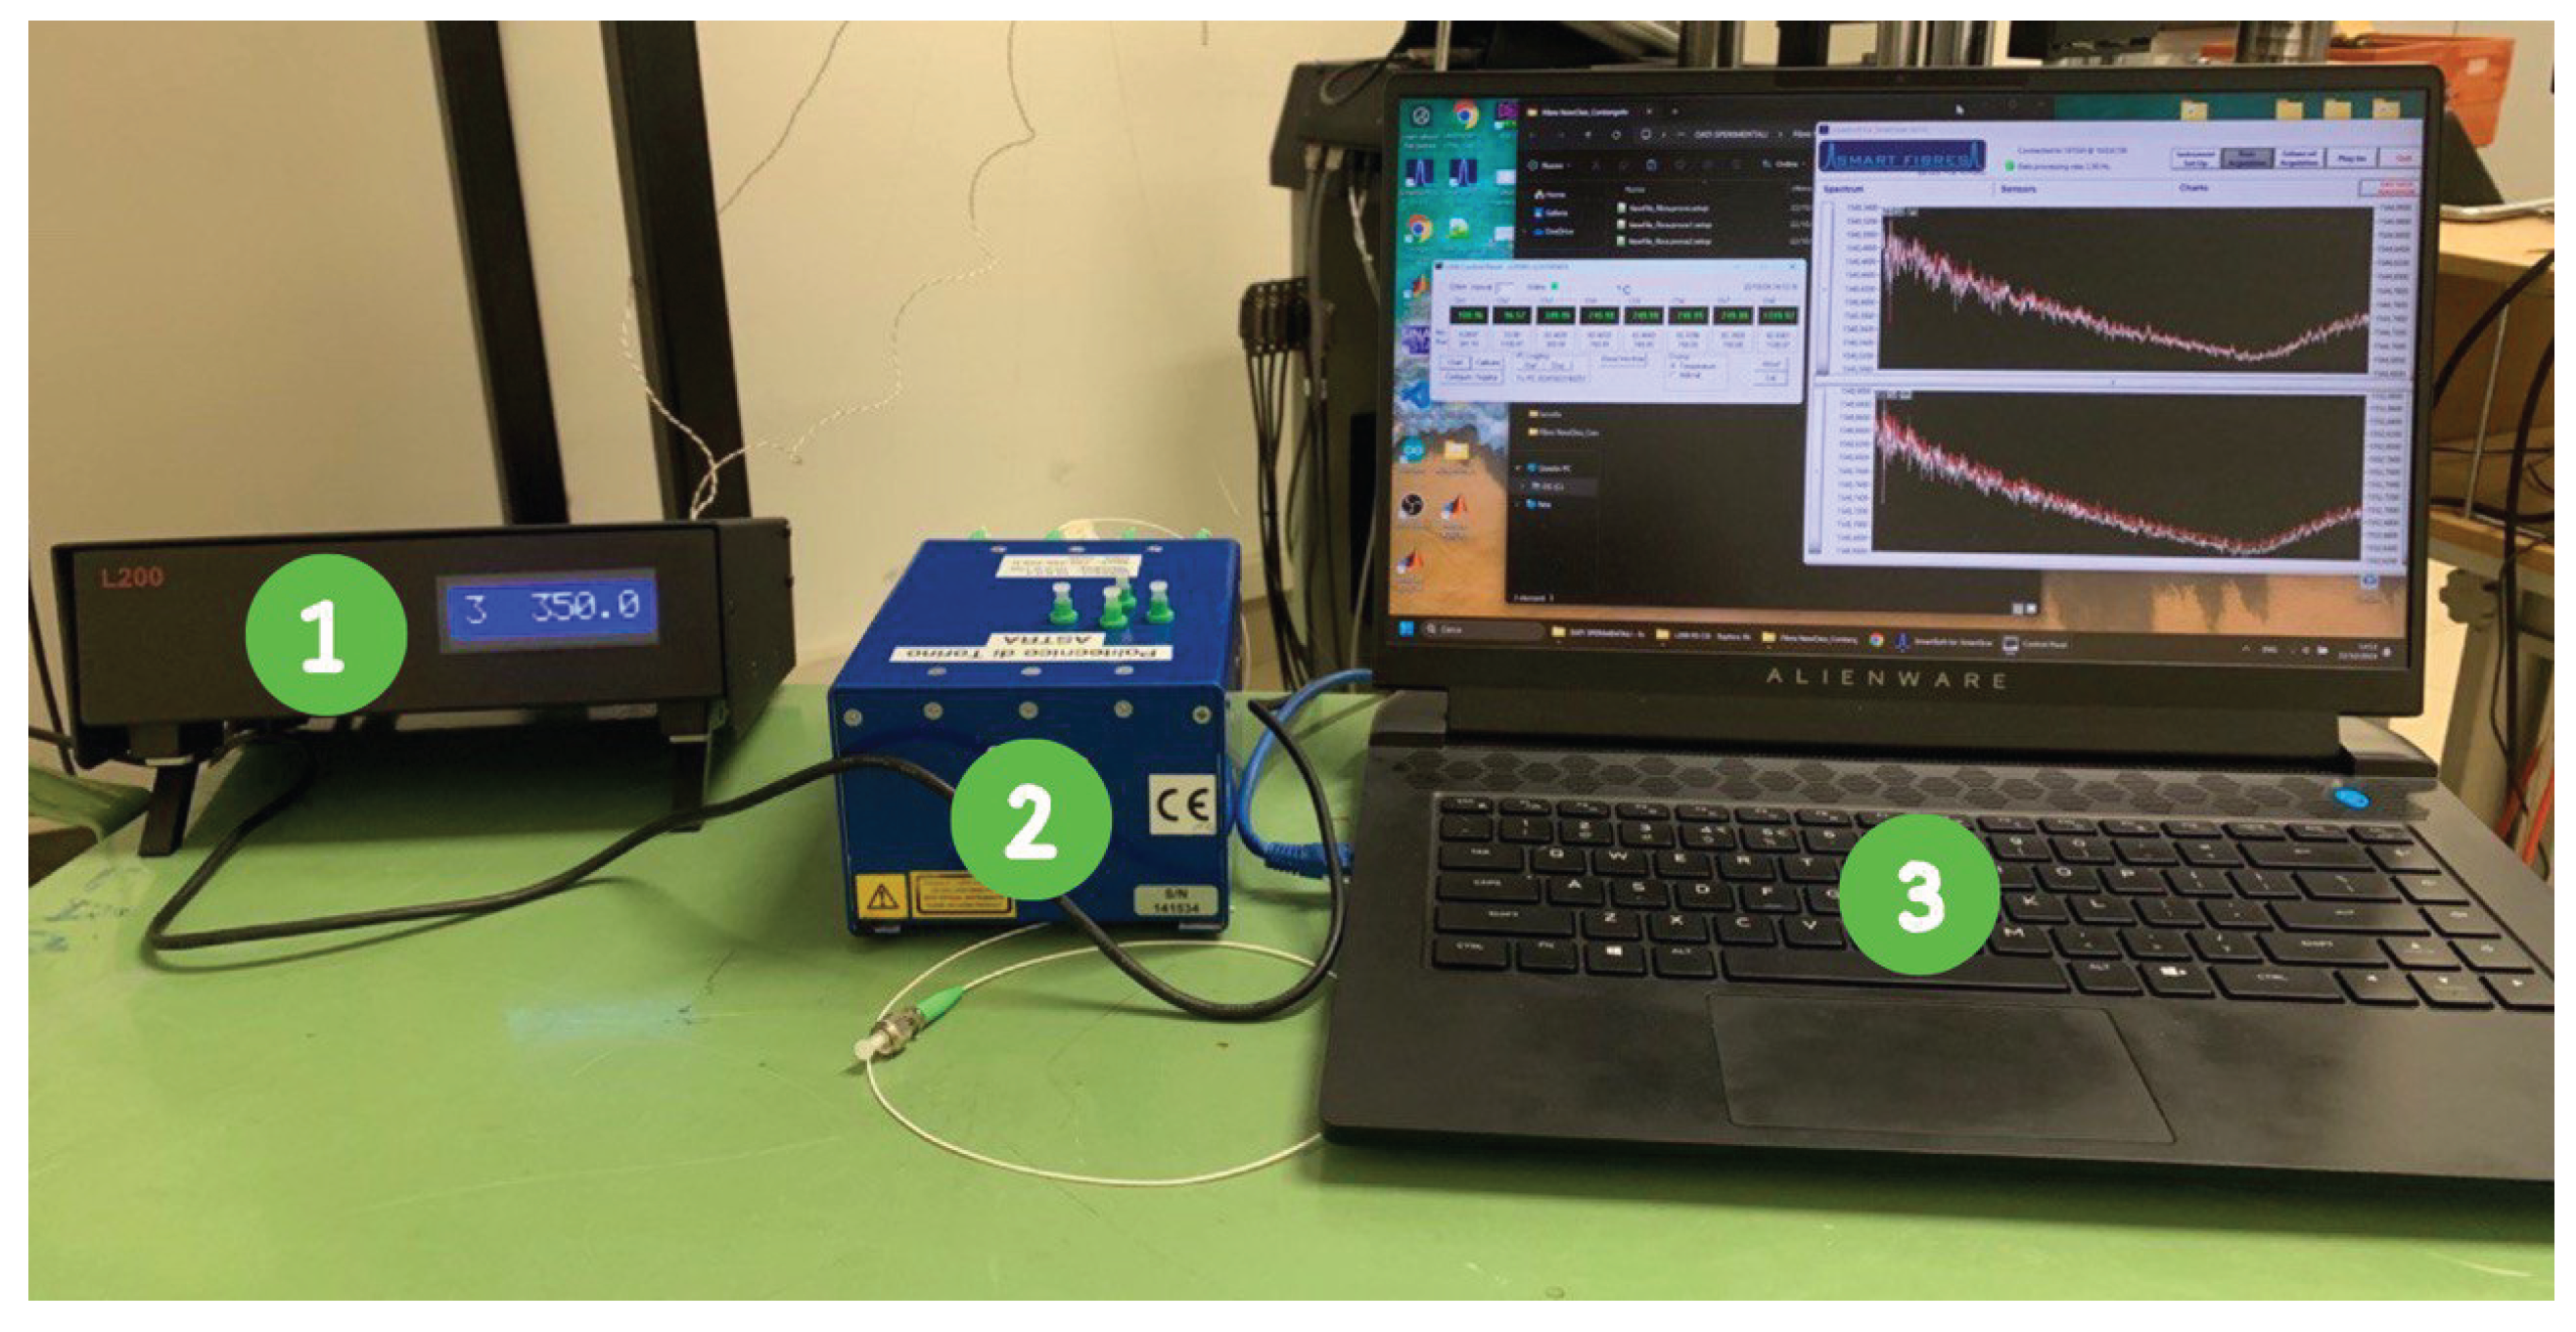
Figure 14.
Drafting of the dog bone specimen according to the dimensions outlined in the ASTM E606 Standard.
Figure 14.
Drafting of the dog bone specimen according to the dimensions outlined in the ASTM E606 Standard.
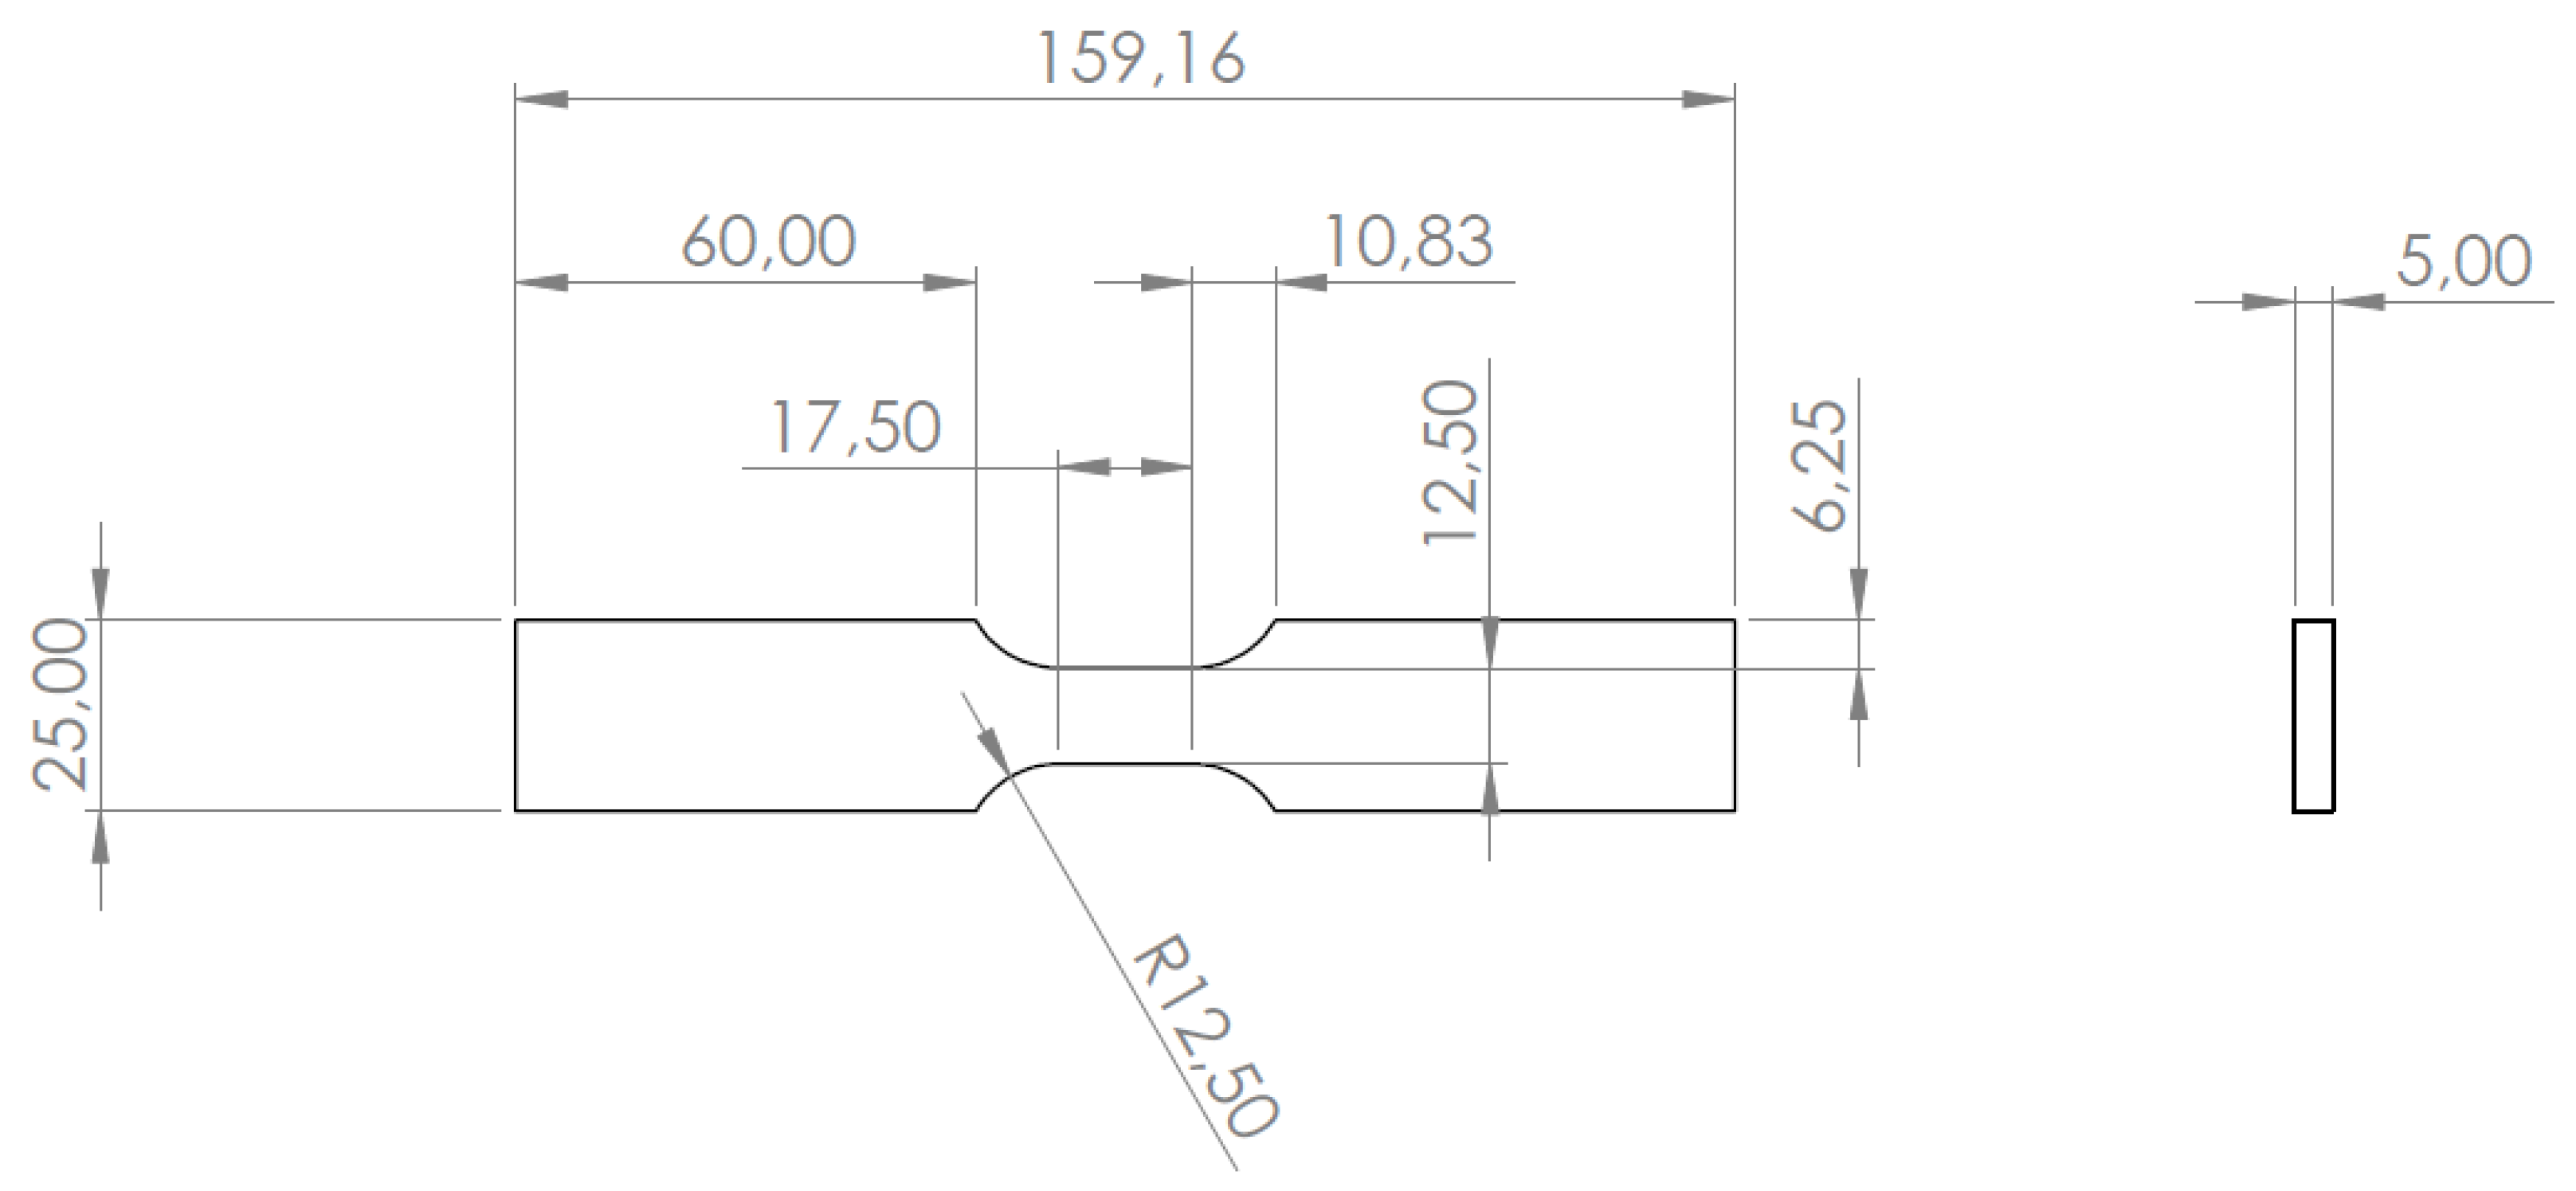
Figure 15.
Setup for the thermal-mechanical tests: (a) Specimen 1, subjected to both tensile and thermal stresses. (b) Specimen 2, used as thermal reference.
Figure 15.
Setup for the thermal-mechanical tests: (a) Specimen 1, subjected to both tensile and thermal stresses. (b) Specimen 2, used as thermal reference.
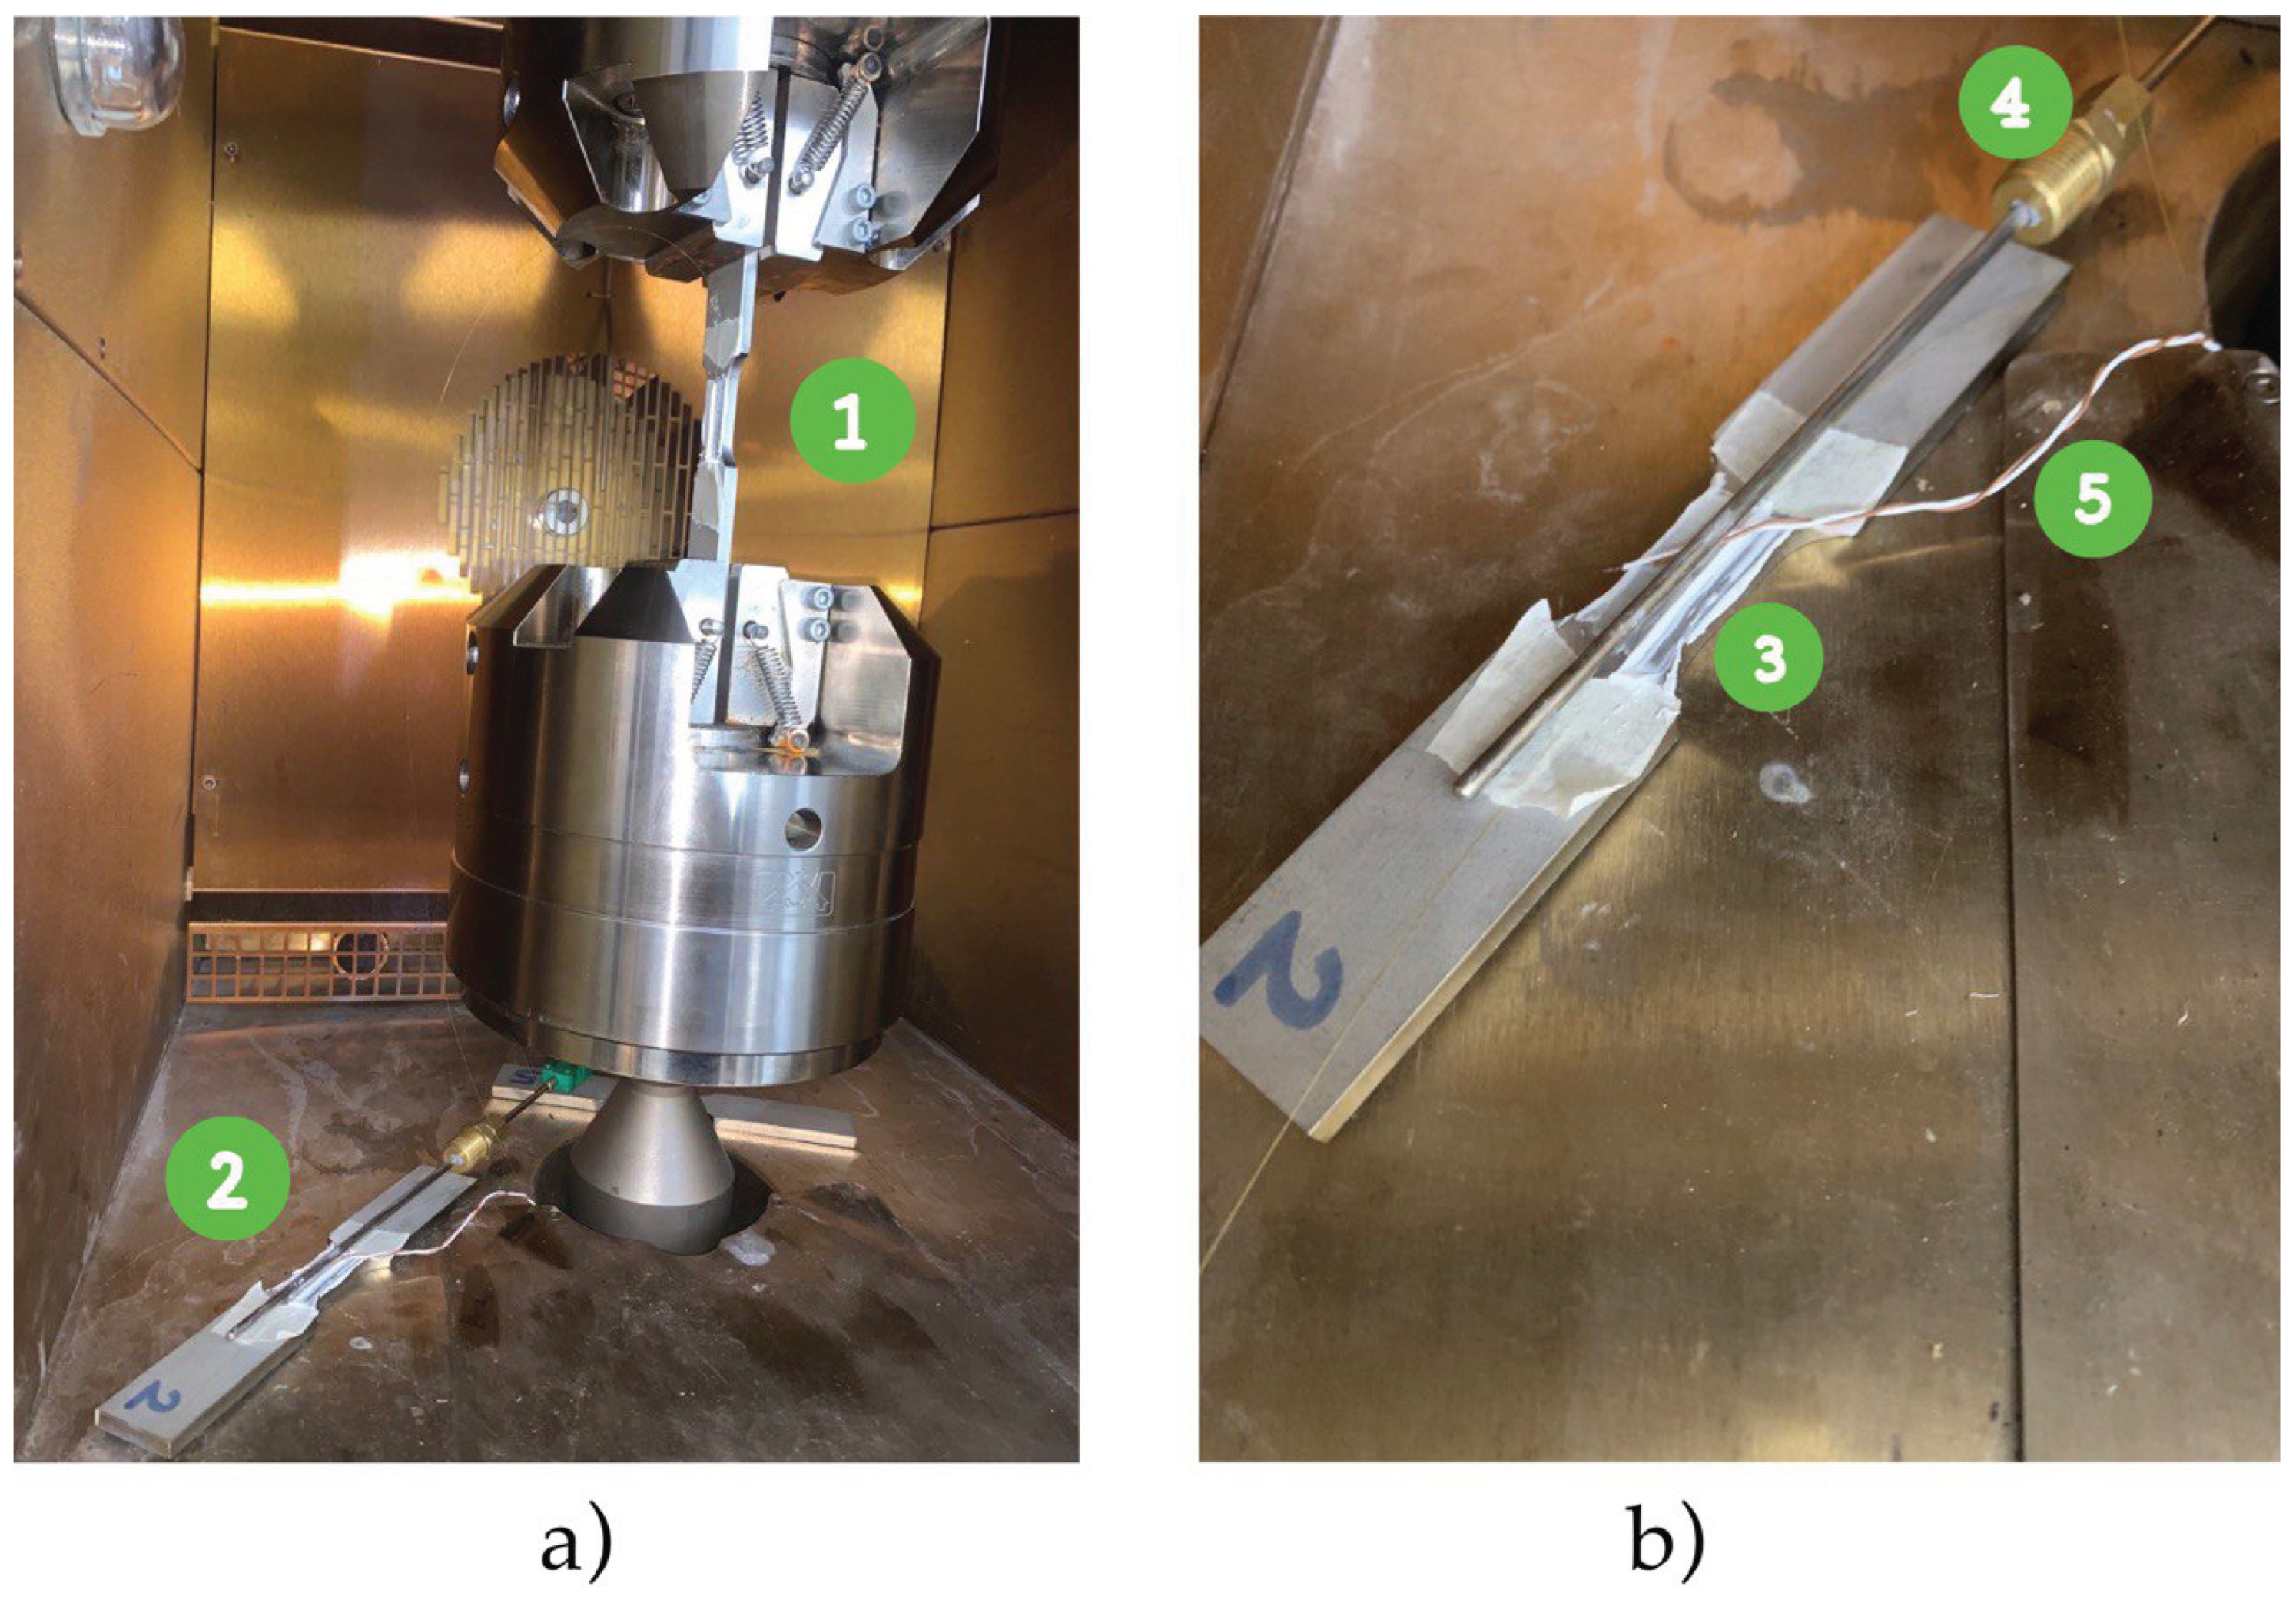
Figure 16.
Resin (WEICON Ceramico W) application on the specimens. The FBGs are located at the center of the resin-covered area.
Figure 16.
Resin (WEICON Ceramico W) application on the specimens. The FBGs are located at the center of the resin-covered area.
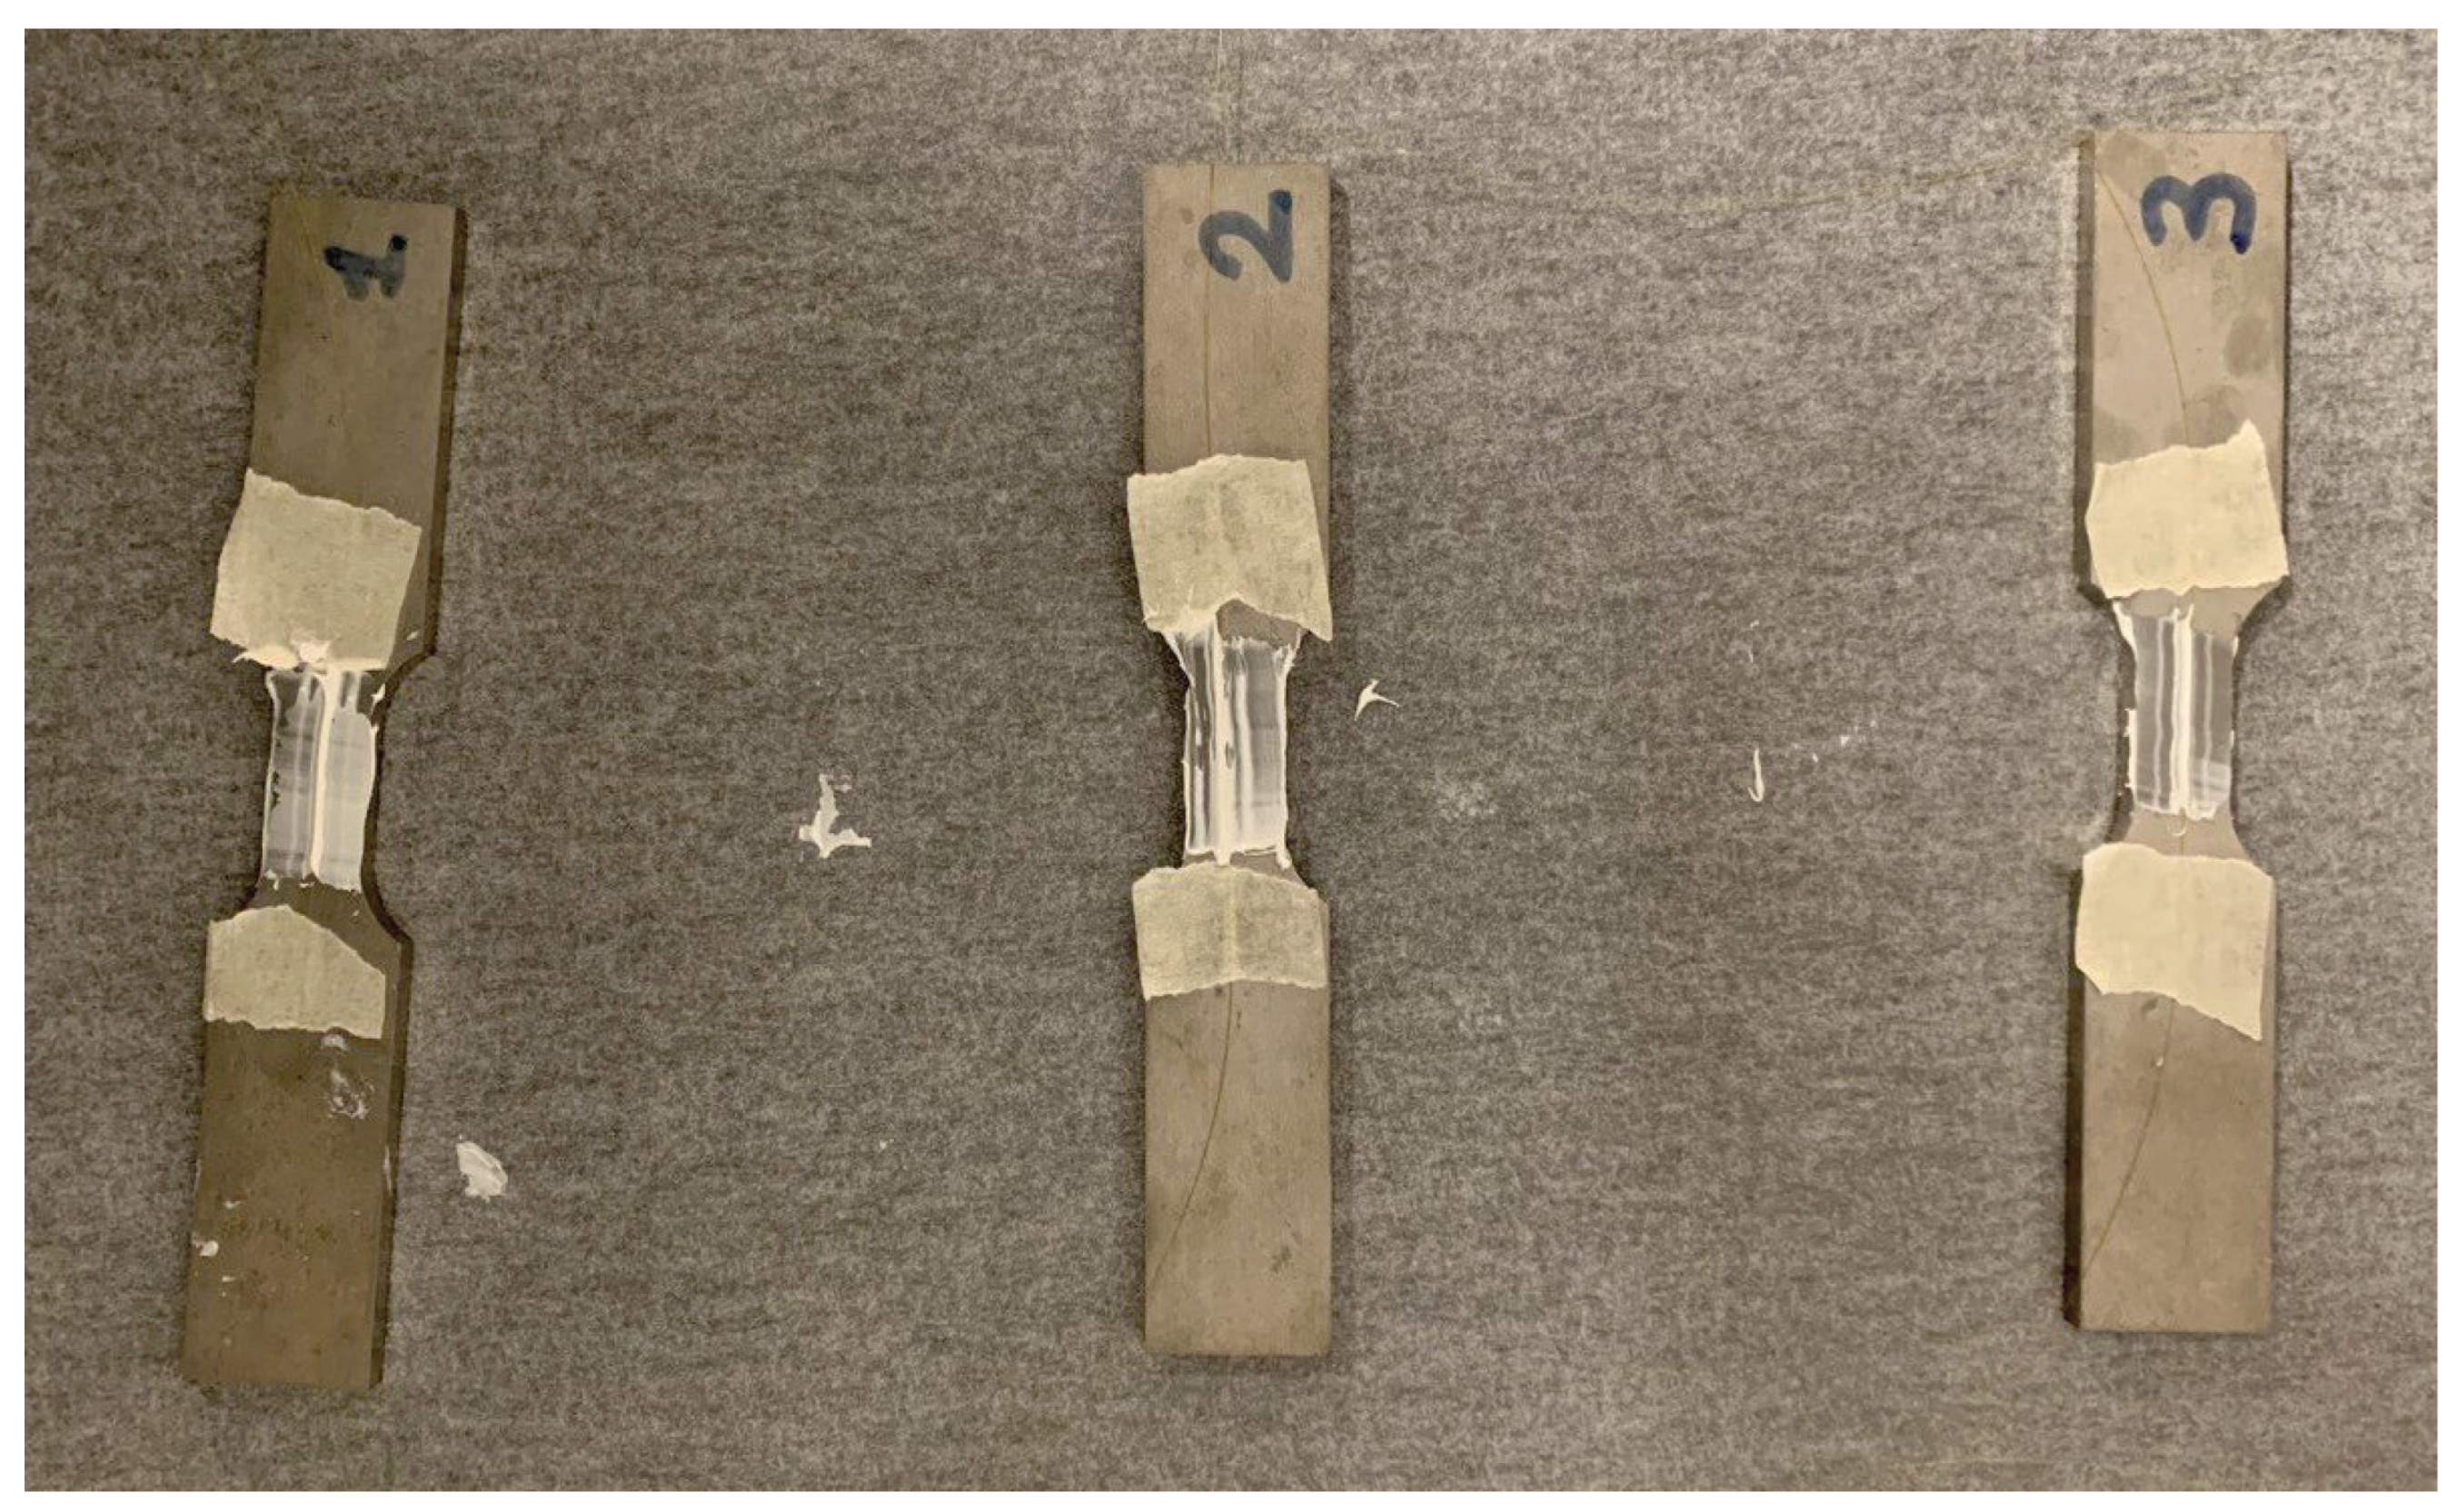
Figure 17.
Normalized correlation between temperature changes (solid lines) and wavelength shifts (dashed lines) for the two thermal cycles.
Figure 17.
Normalized correlation between temperature changes (solid lines) and wavelength shifts (dashed lines) for the two thermal cycles.
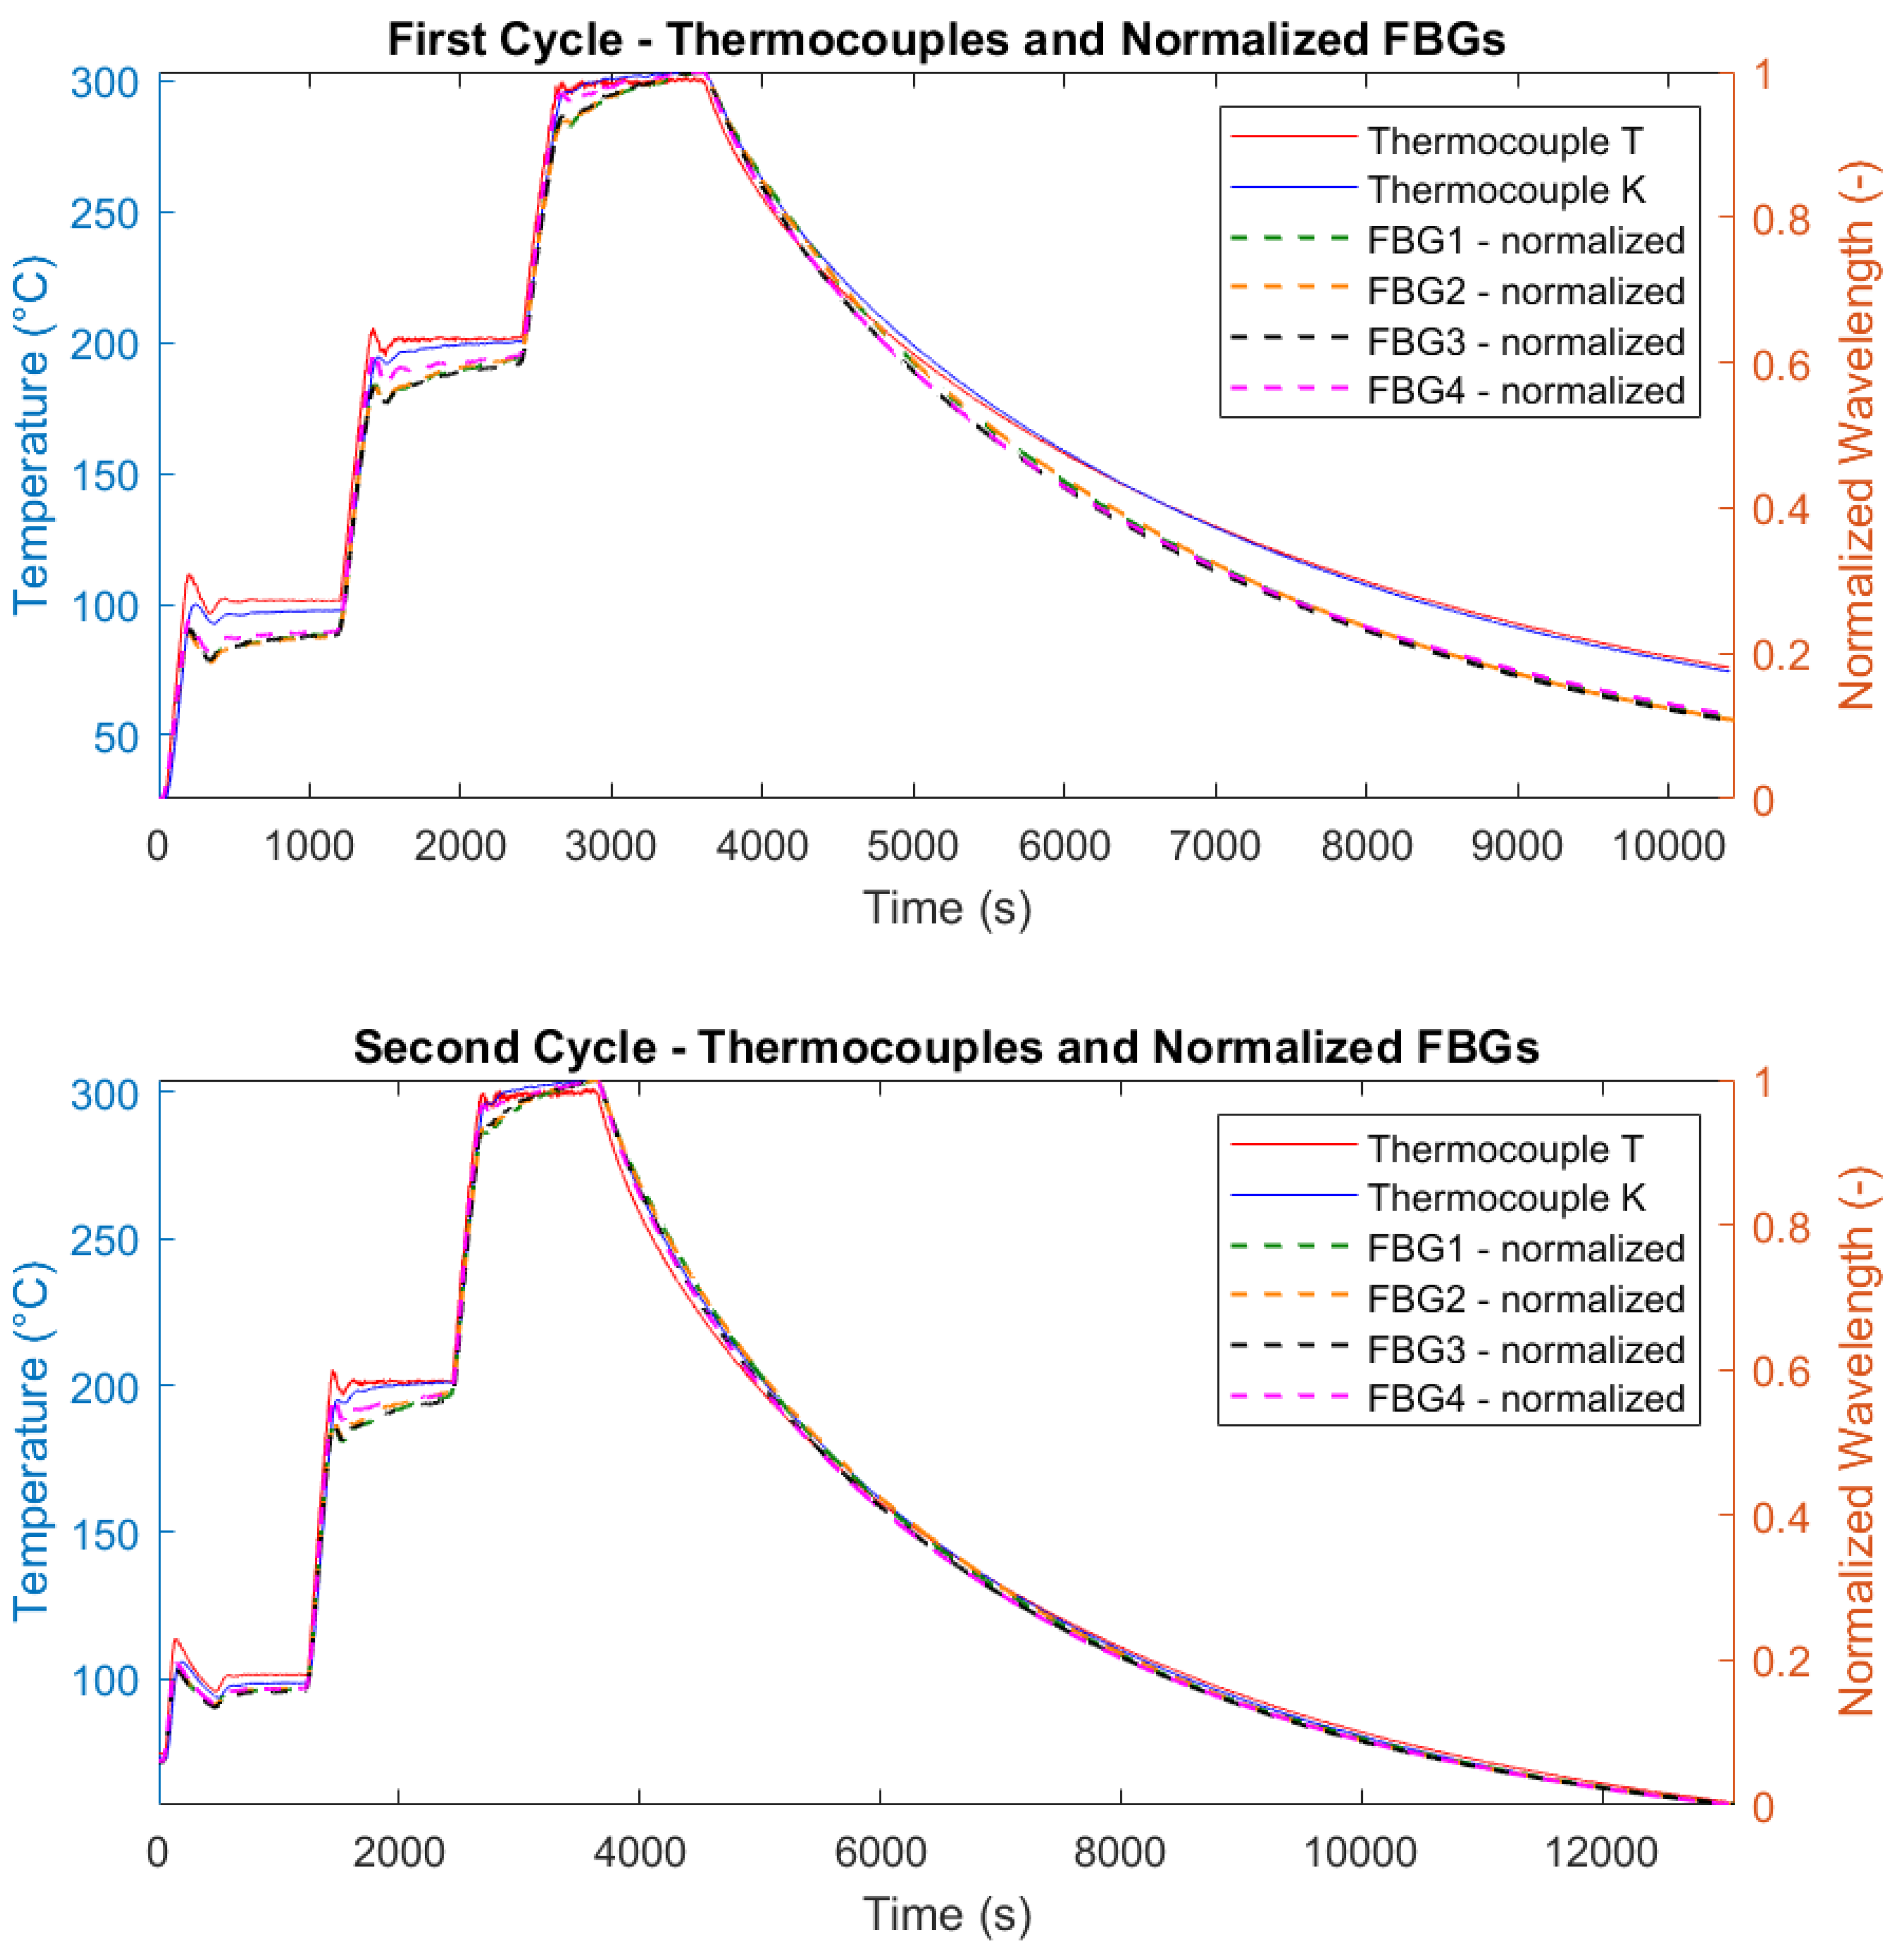
Figure 18.
Comparison of raw (red) and filtered (blue) FBG data for the first and second thermal cycles.
Figure 18.
Comparison of raw (red) and filtered (blue) FBG data for the first and second thermal cycles.
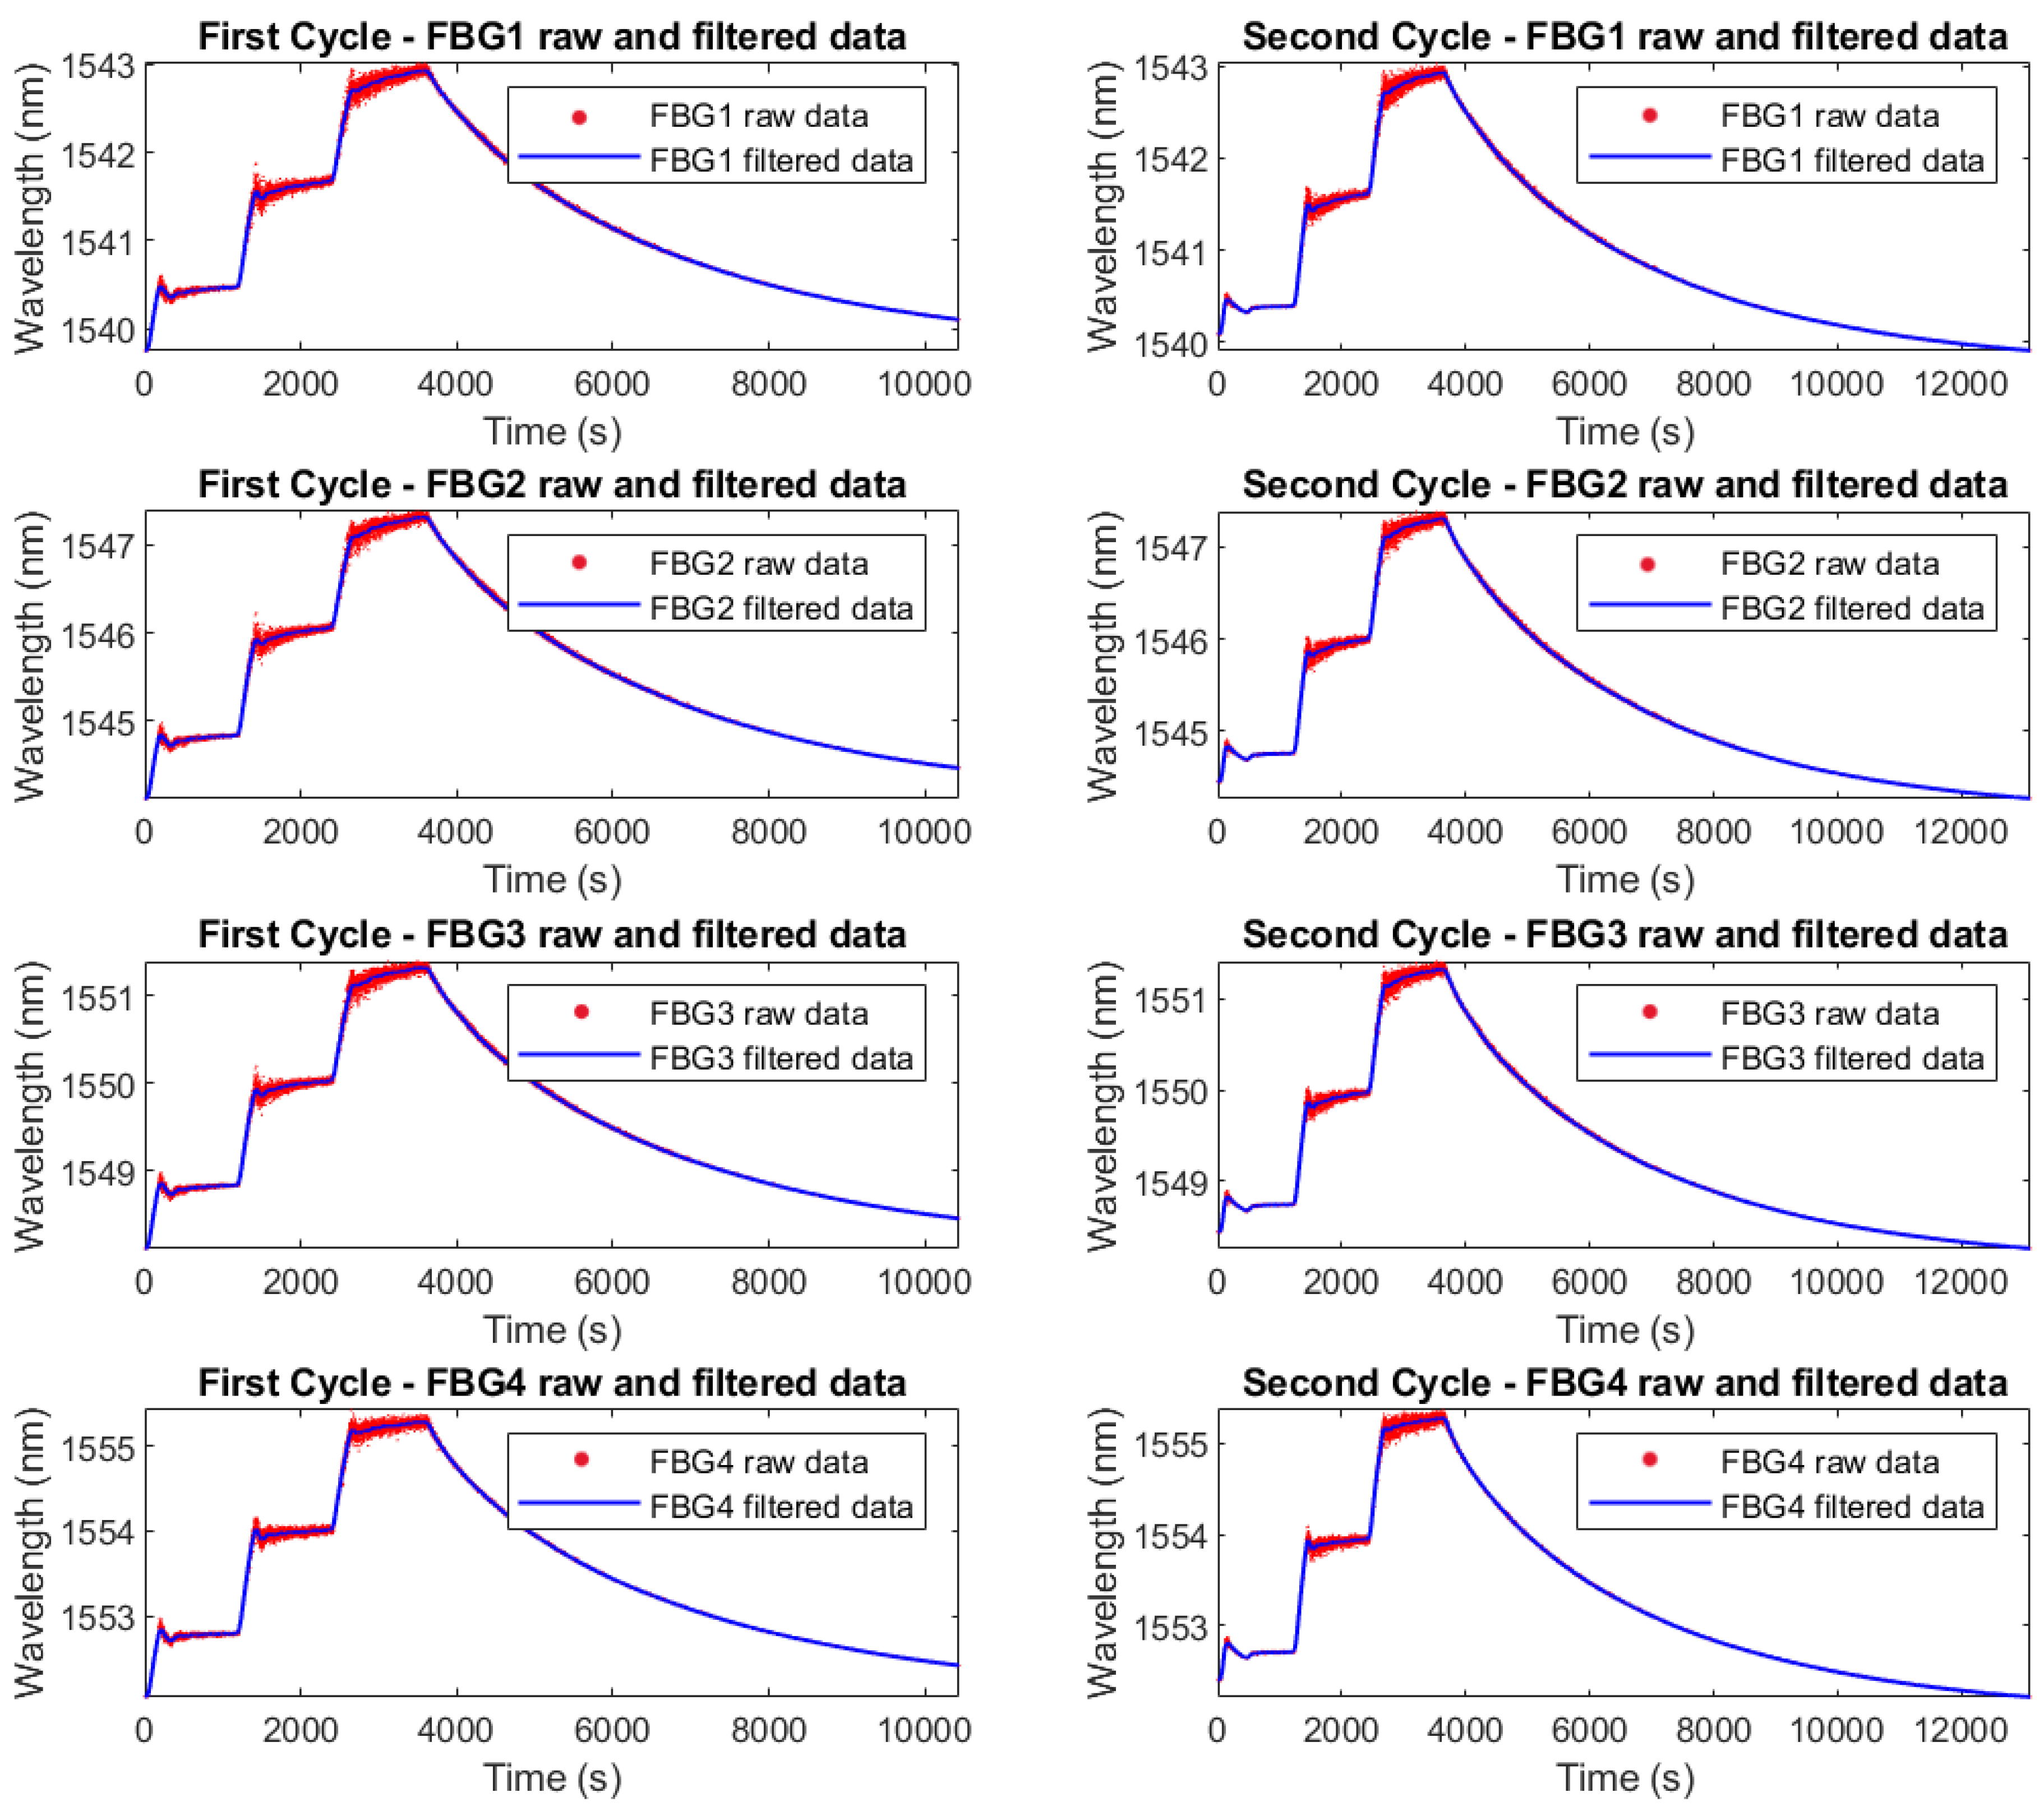
Figure 19.
Linear correlation between temperature and wavelength shift for FBG4 during thermal cycles.
Figure 19.
Linear correlation between temperature and wavelength shift for FBG4 during thermal cycles.
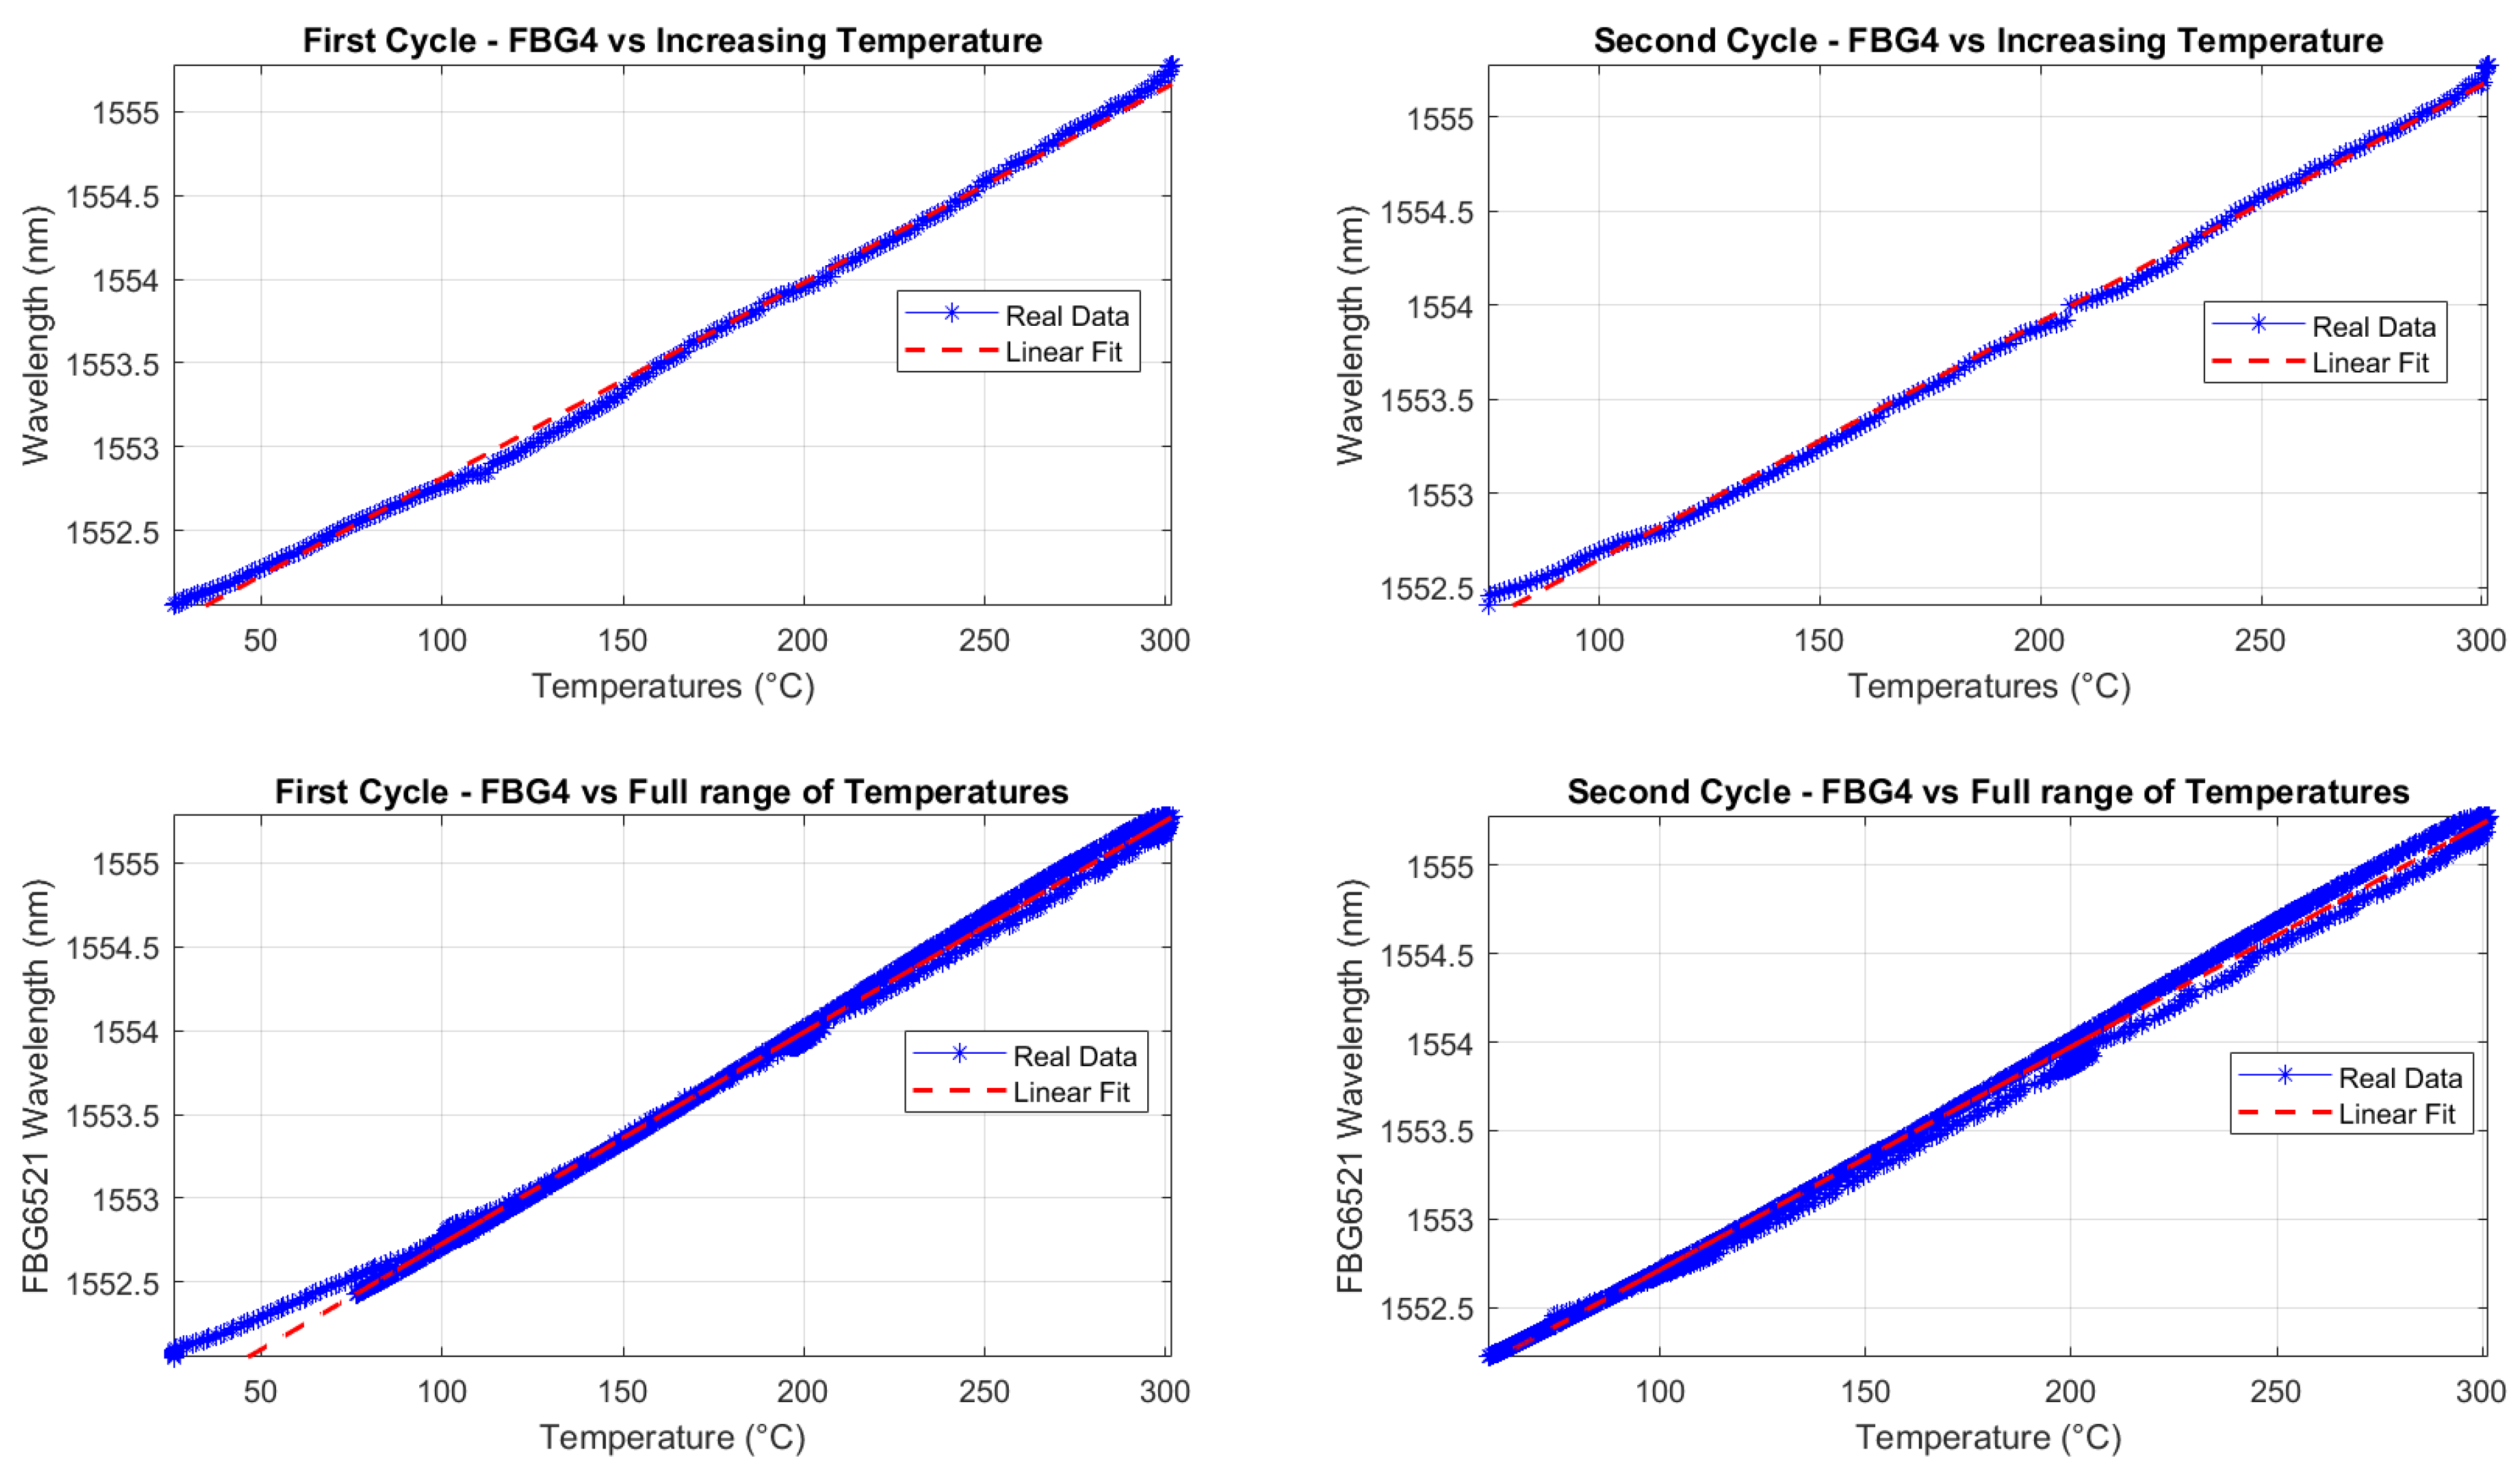
Figure 20.
Linear fit and 95% confidence interval for: (a) First Cycle. (b) Second Cycle.
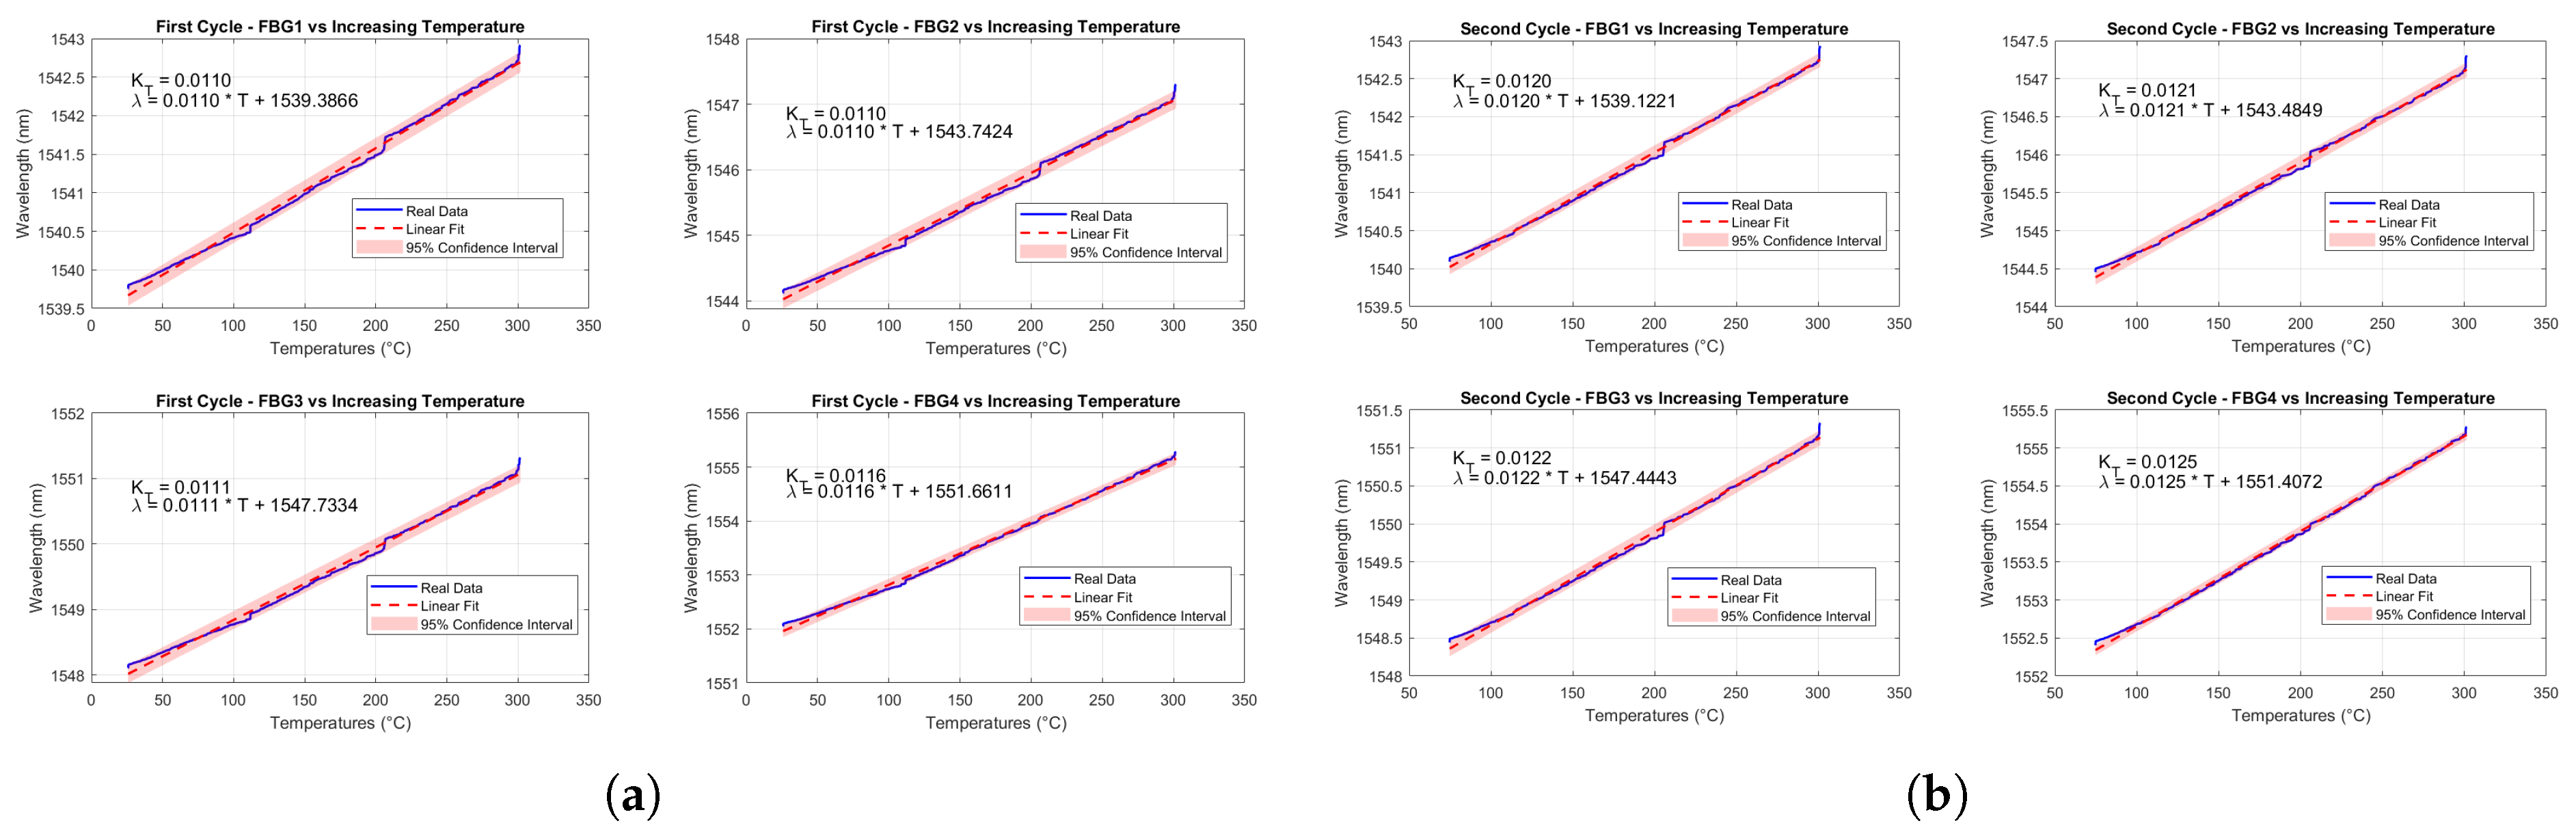
Figure 21.
Comparison between predicted temperatures (red dashed line) of the 4 FBGs and measured temperatures (blue solid line) from T-type thermocouple, for the first cycle.
Figure 21.
Comparison between predicted temperatures (red dashed line) of the 4 FBGs and measured temperatures (blue solid line) from T-type thermocouple, for the first cycle.
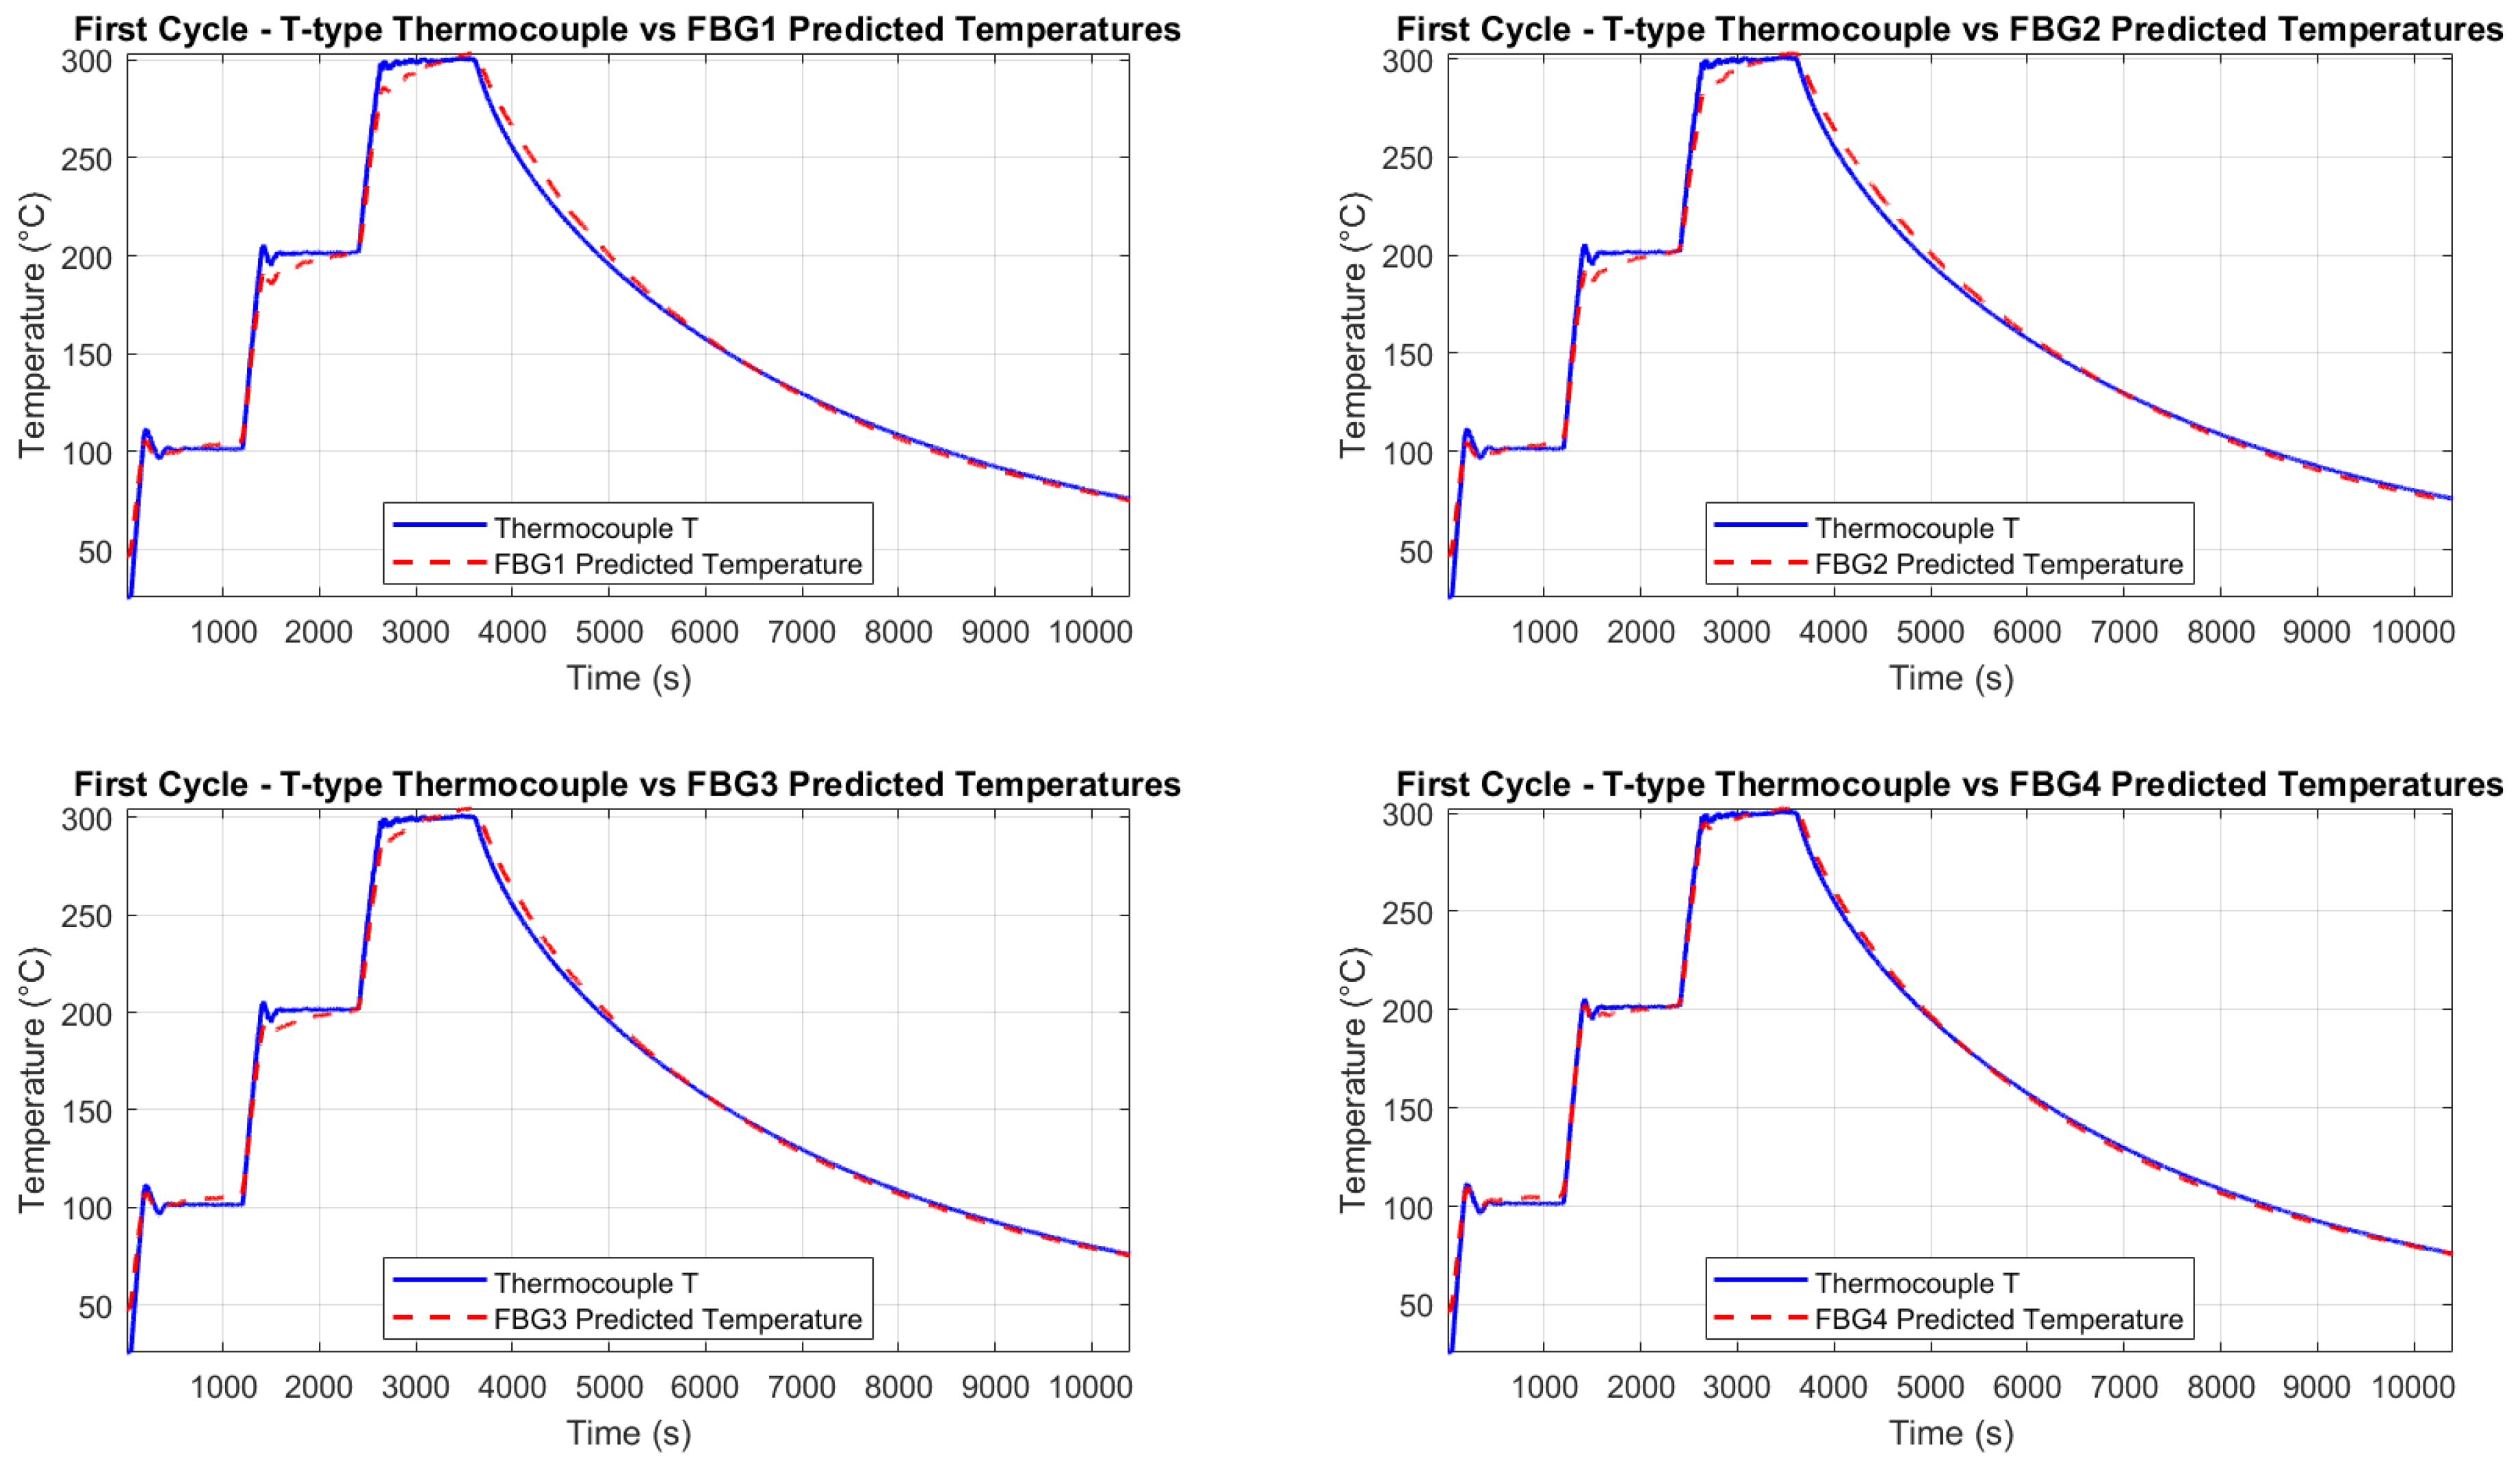
Figure 22.
Comparison between predicted temperatures (red dashed line) of the 4 FBGs and measured temperatures (blue solid line) from T-type thermocouple, for the second cycle.
Figure 22.
Comparison between predicted temperatures (red dashed line) of the 4 FBGs and measured temperatures (blue solid line) from T-type thermocouple, for the second cycle.
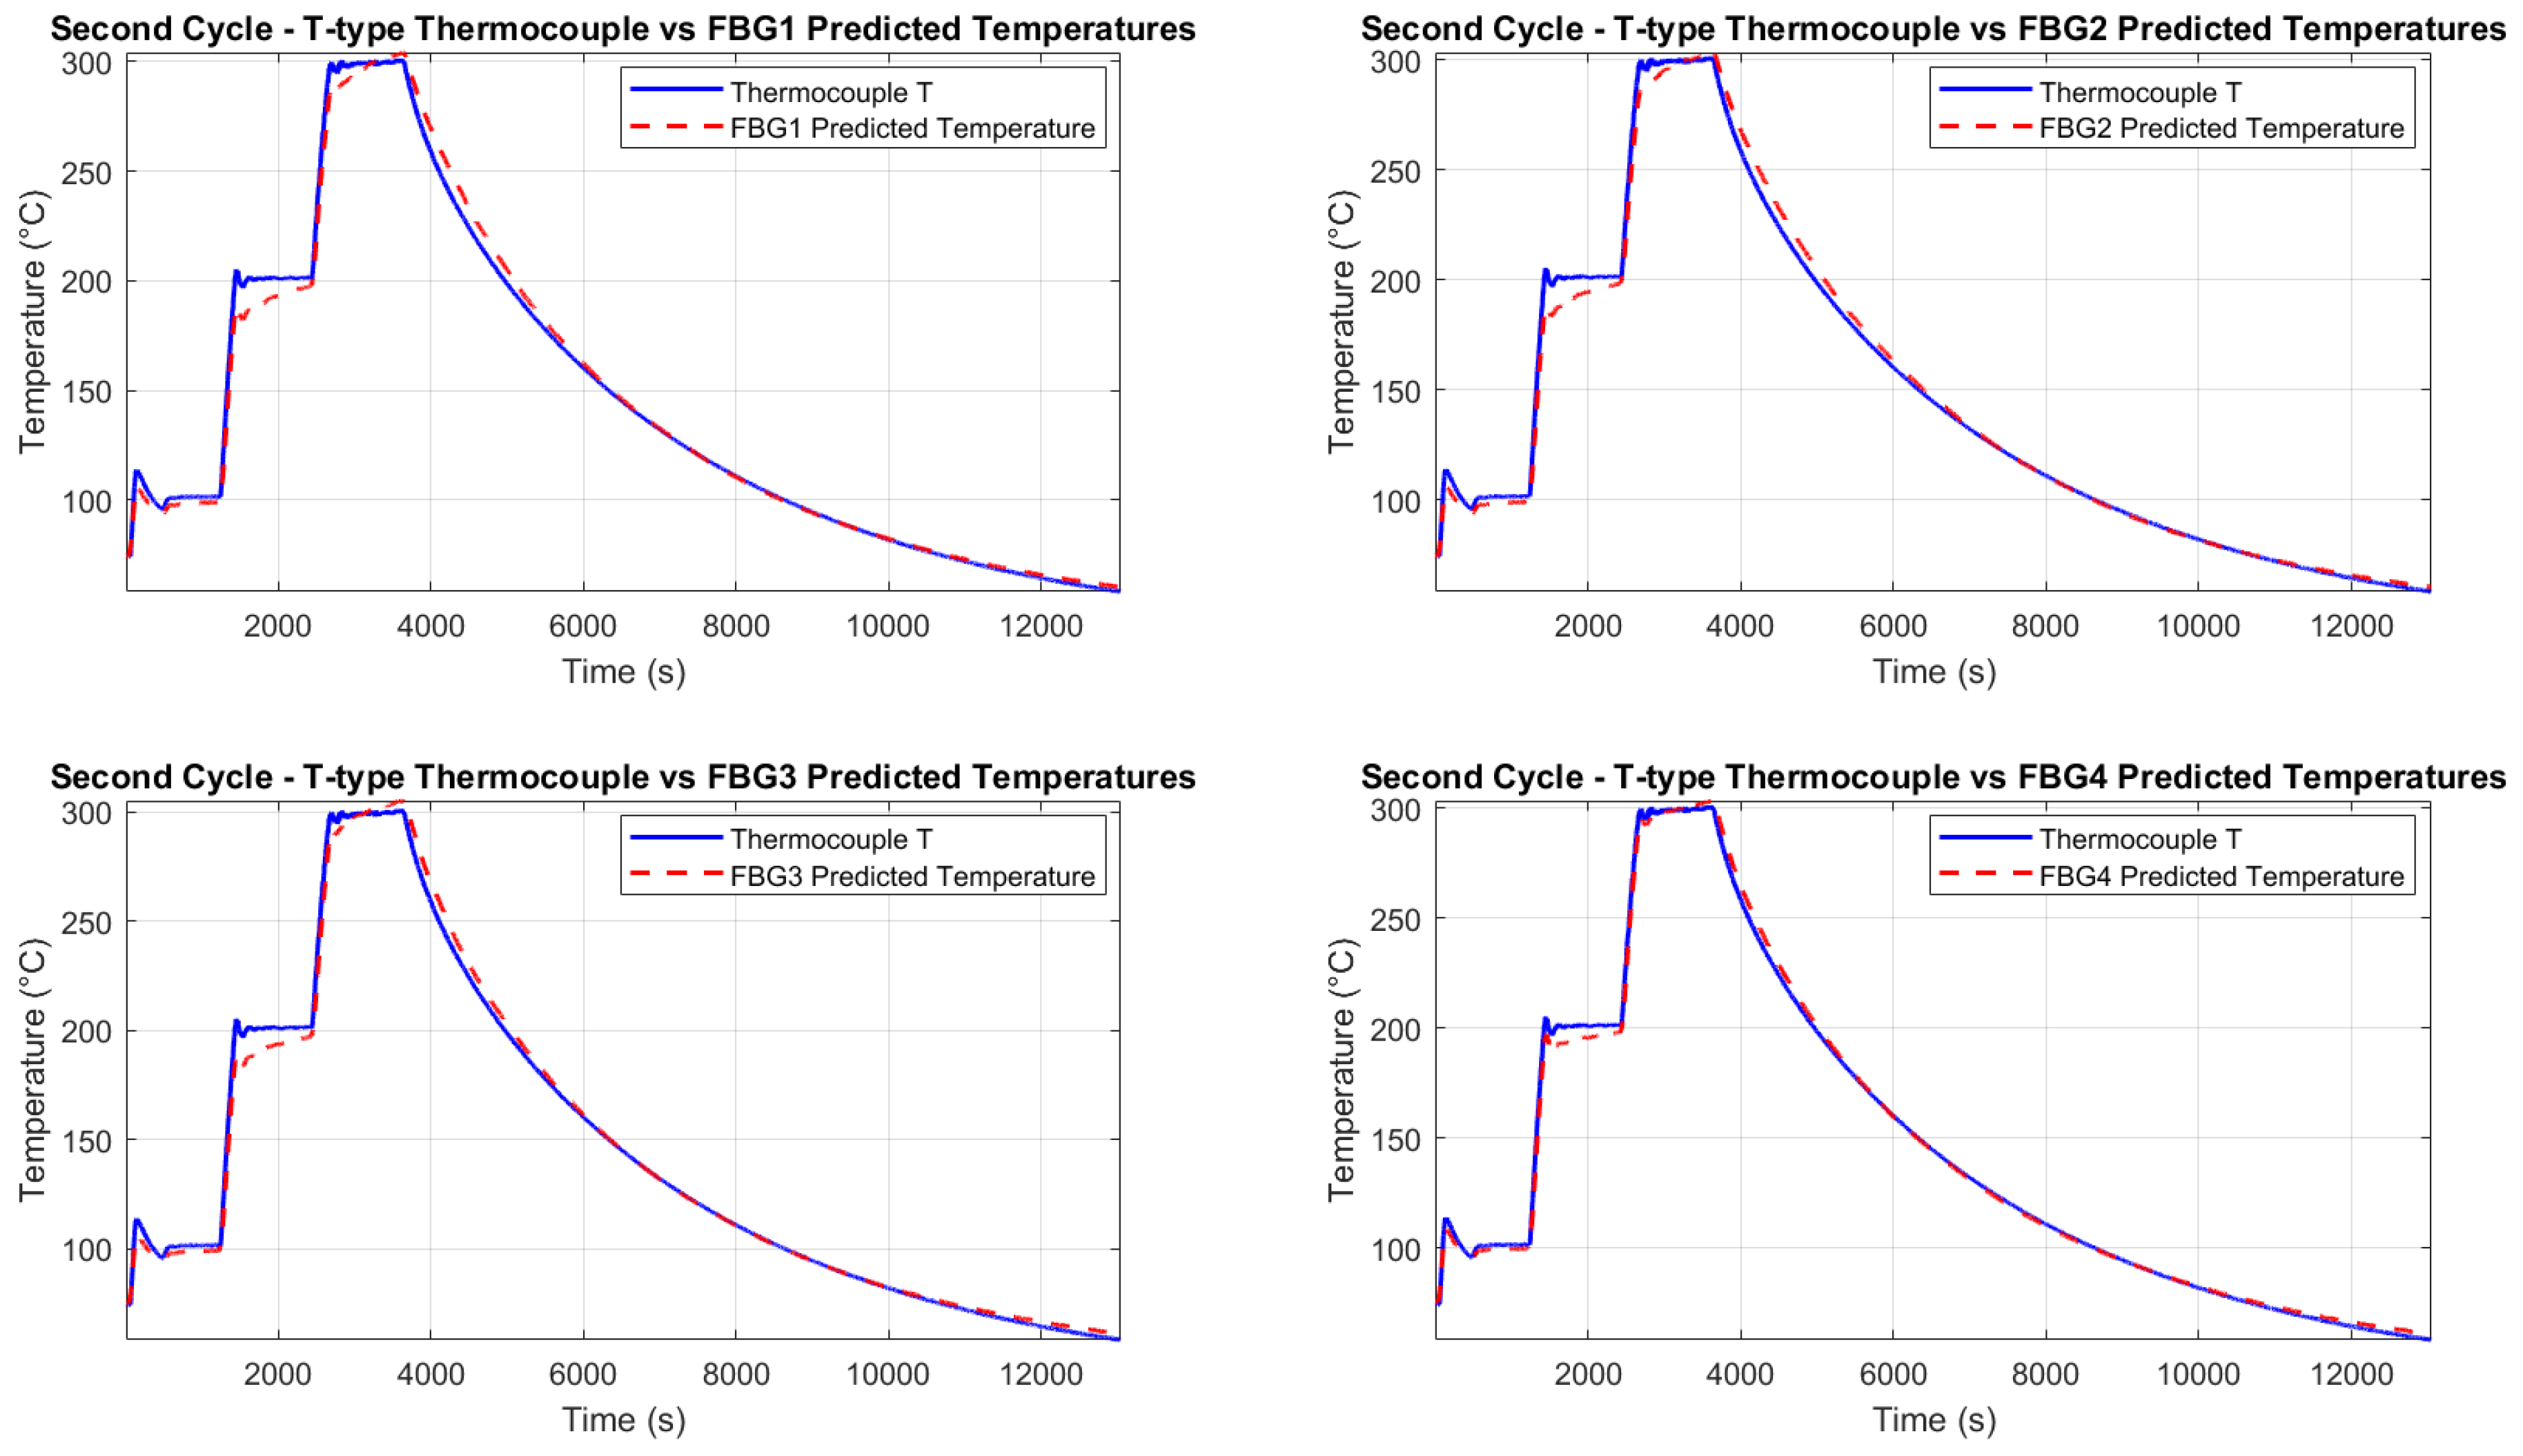
Figure 23.
Correlation between wavelength from FBG1 and displacement during the fifth cycle (200°C to 250°C) of the second test (1 Hz). A zoomed interval highlights the relationship.
Figure 23.
Correlation between wavelength from FBG1 and displacement during the fifth cycle (200°C to 250°C) of the second test (1 Hz). A zoomed interval highlights the relationship.
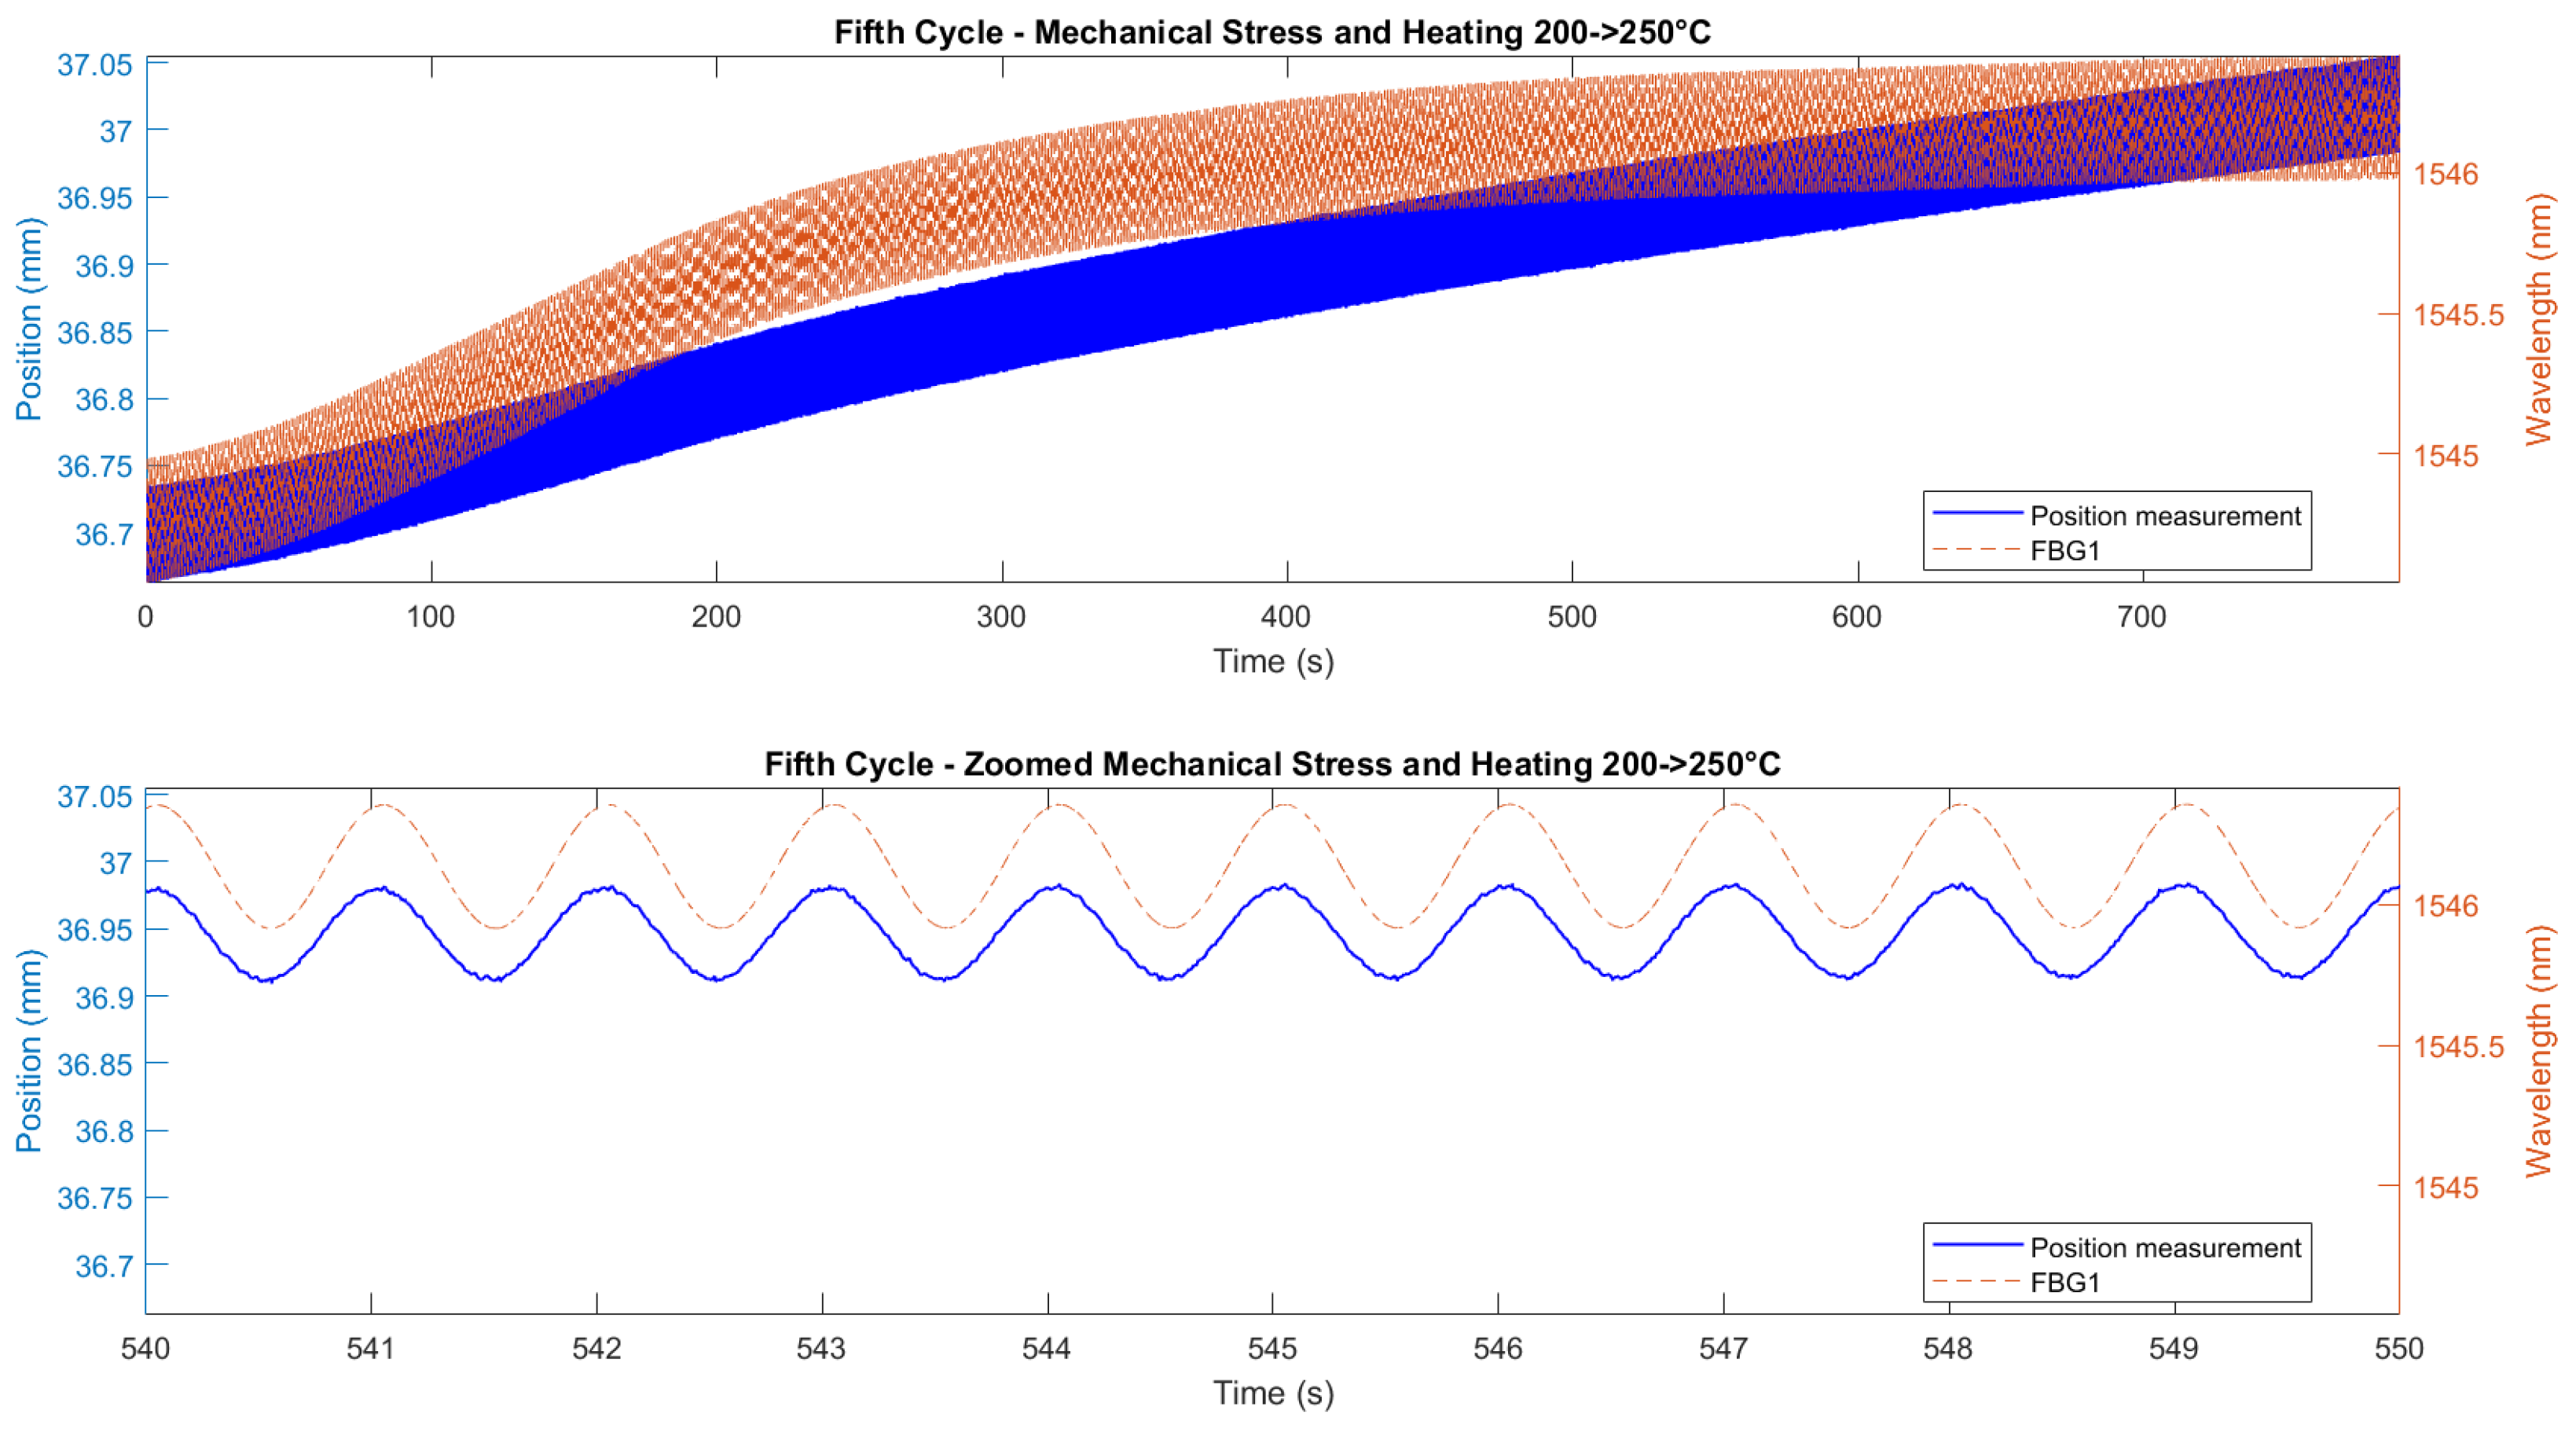
Figure 24.
Correlation between wavelength from FBG1 and displacement during the sixth cycle (constant temperature at 250°C) of the second test (5 Hz). A zoomed interval highlights the relationship.
Figure 24.
Correlation between wavelength from FBG1 and displacement during the sixth cycle (constant temperature at 250°C) of the second test (5 Hz). A zoomed interval highlights the relationship.
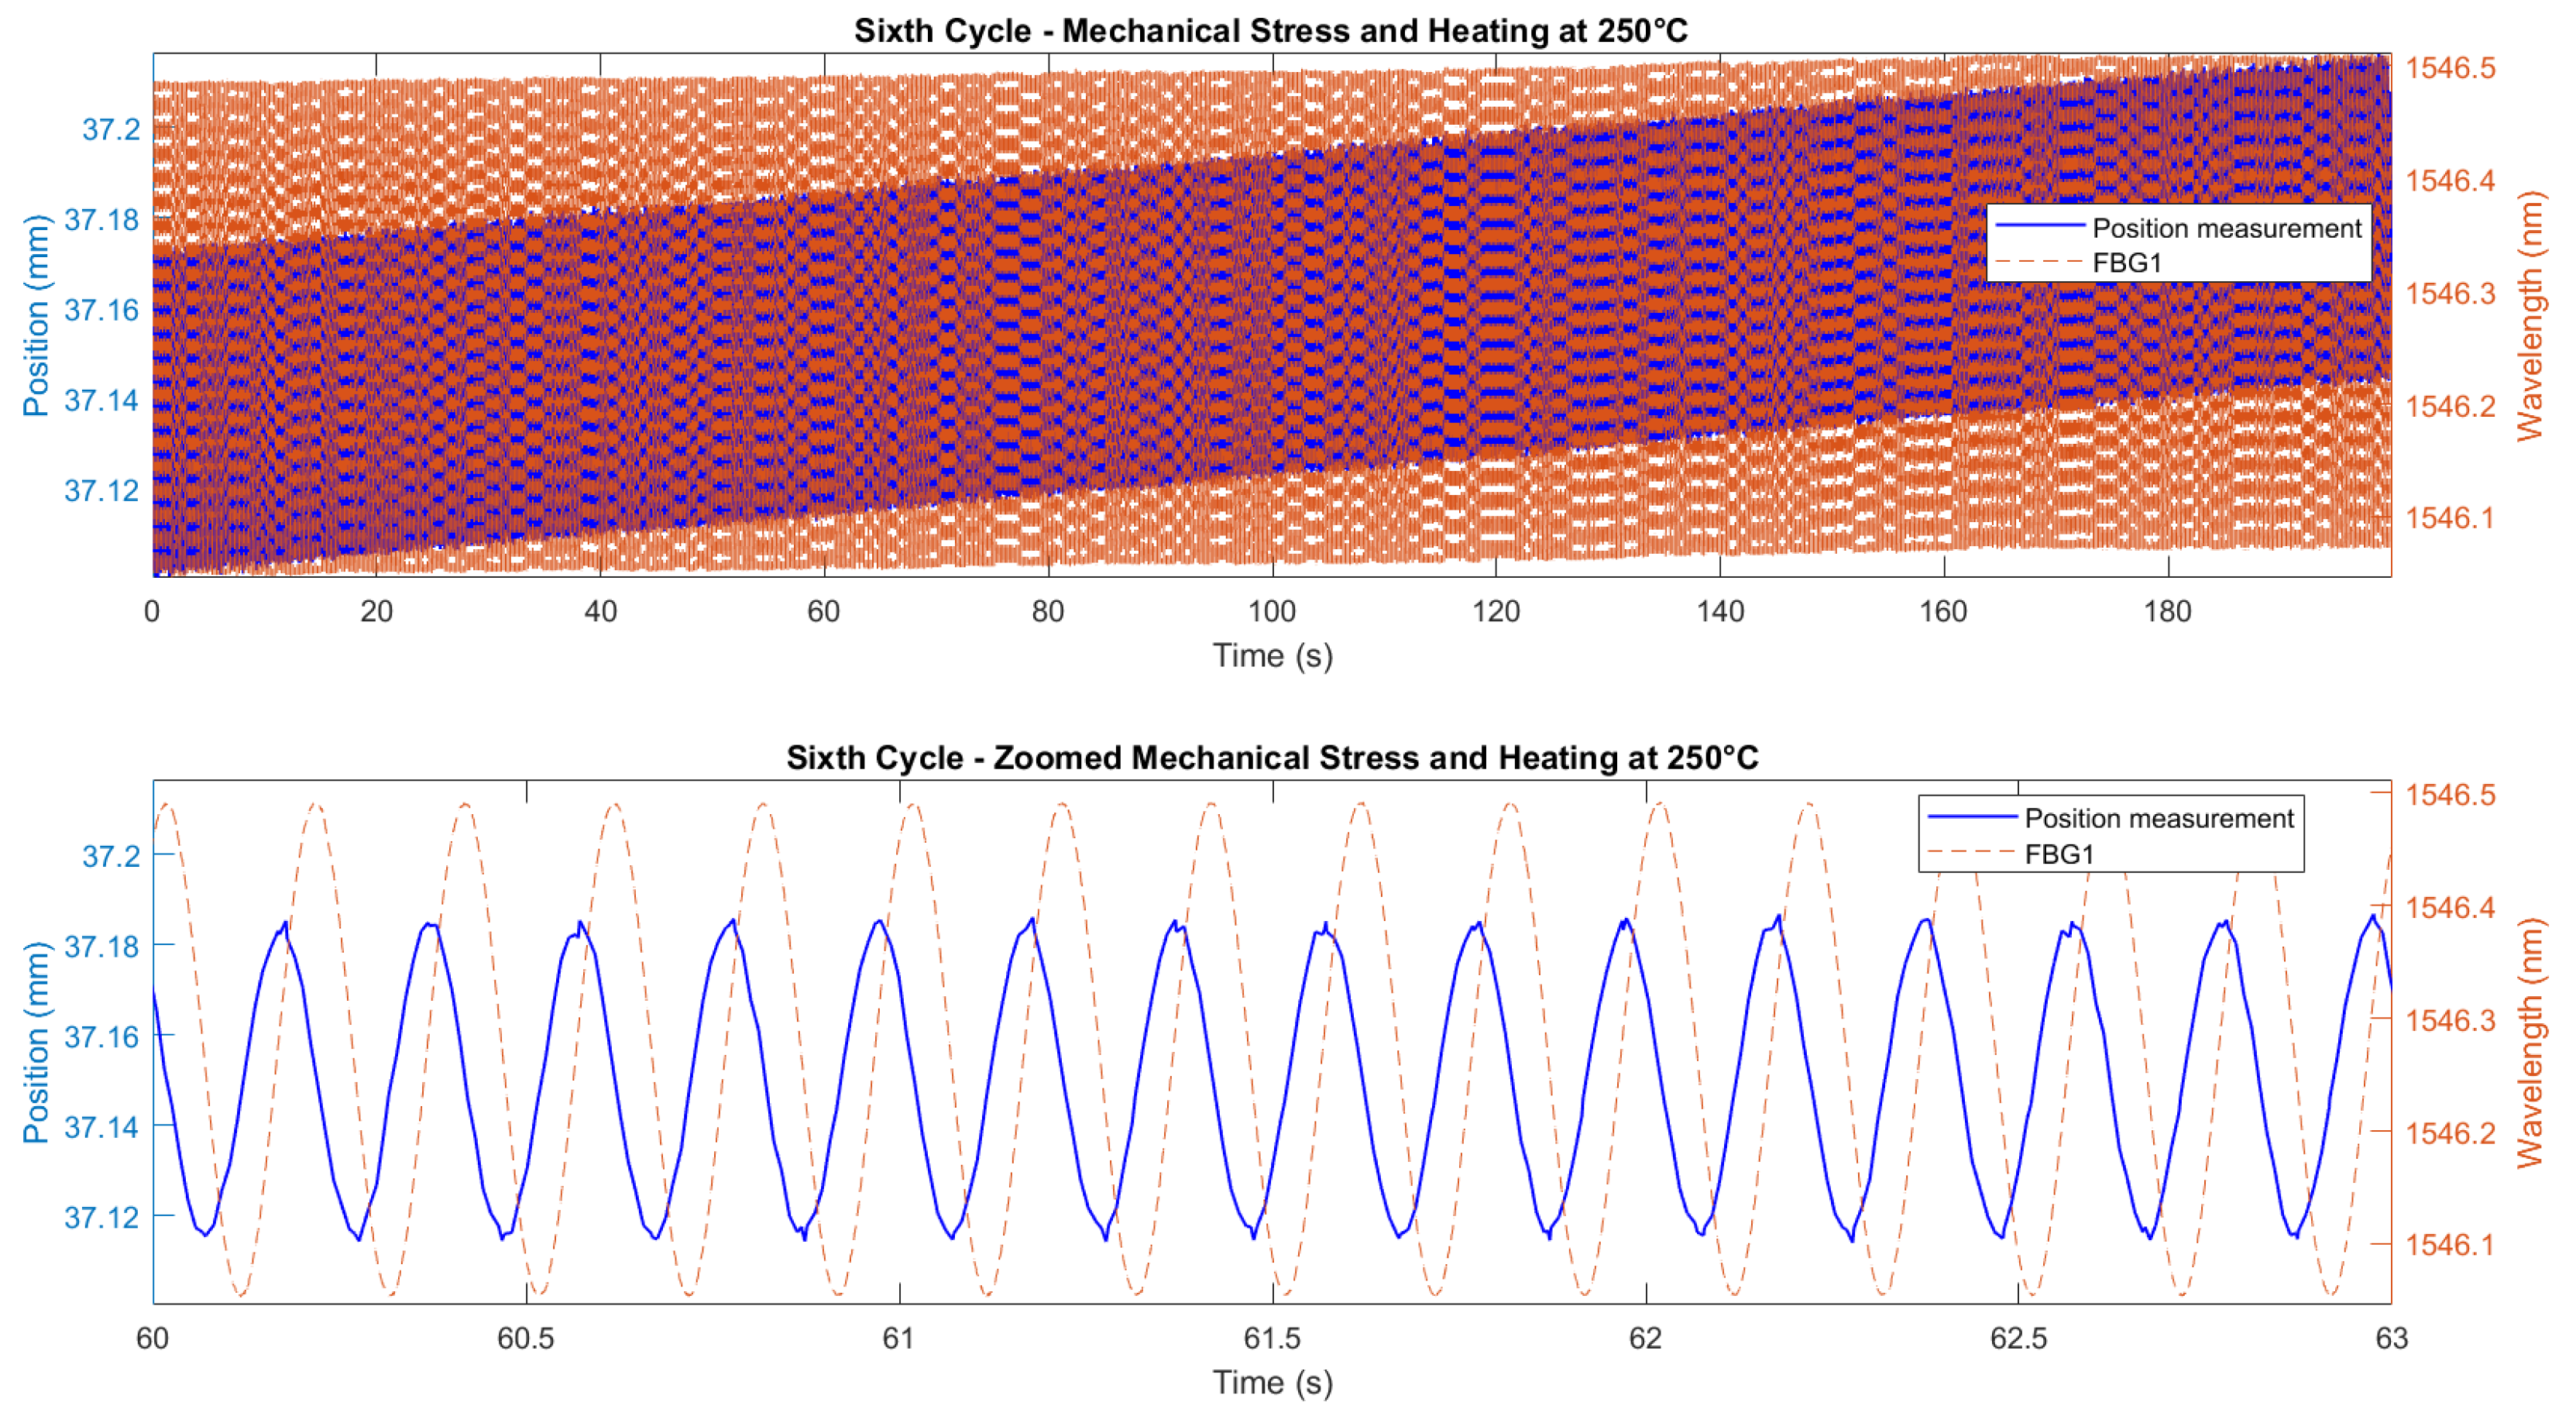
Figure 25.
Left: Correlation between temperature and wavelength shifts of FBG2. Right: Predicted temperatures from FBG2 for both tests.
Figure 25.
Left: Correlation between temperature and wavelength shifts of FBG2. Right: Predicted temperatures from FBG2 for both tests.
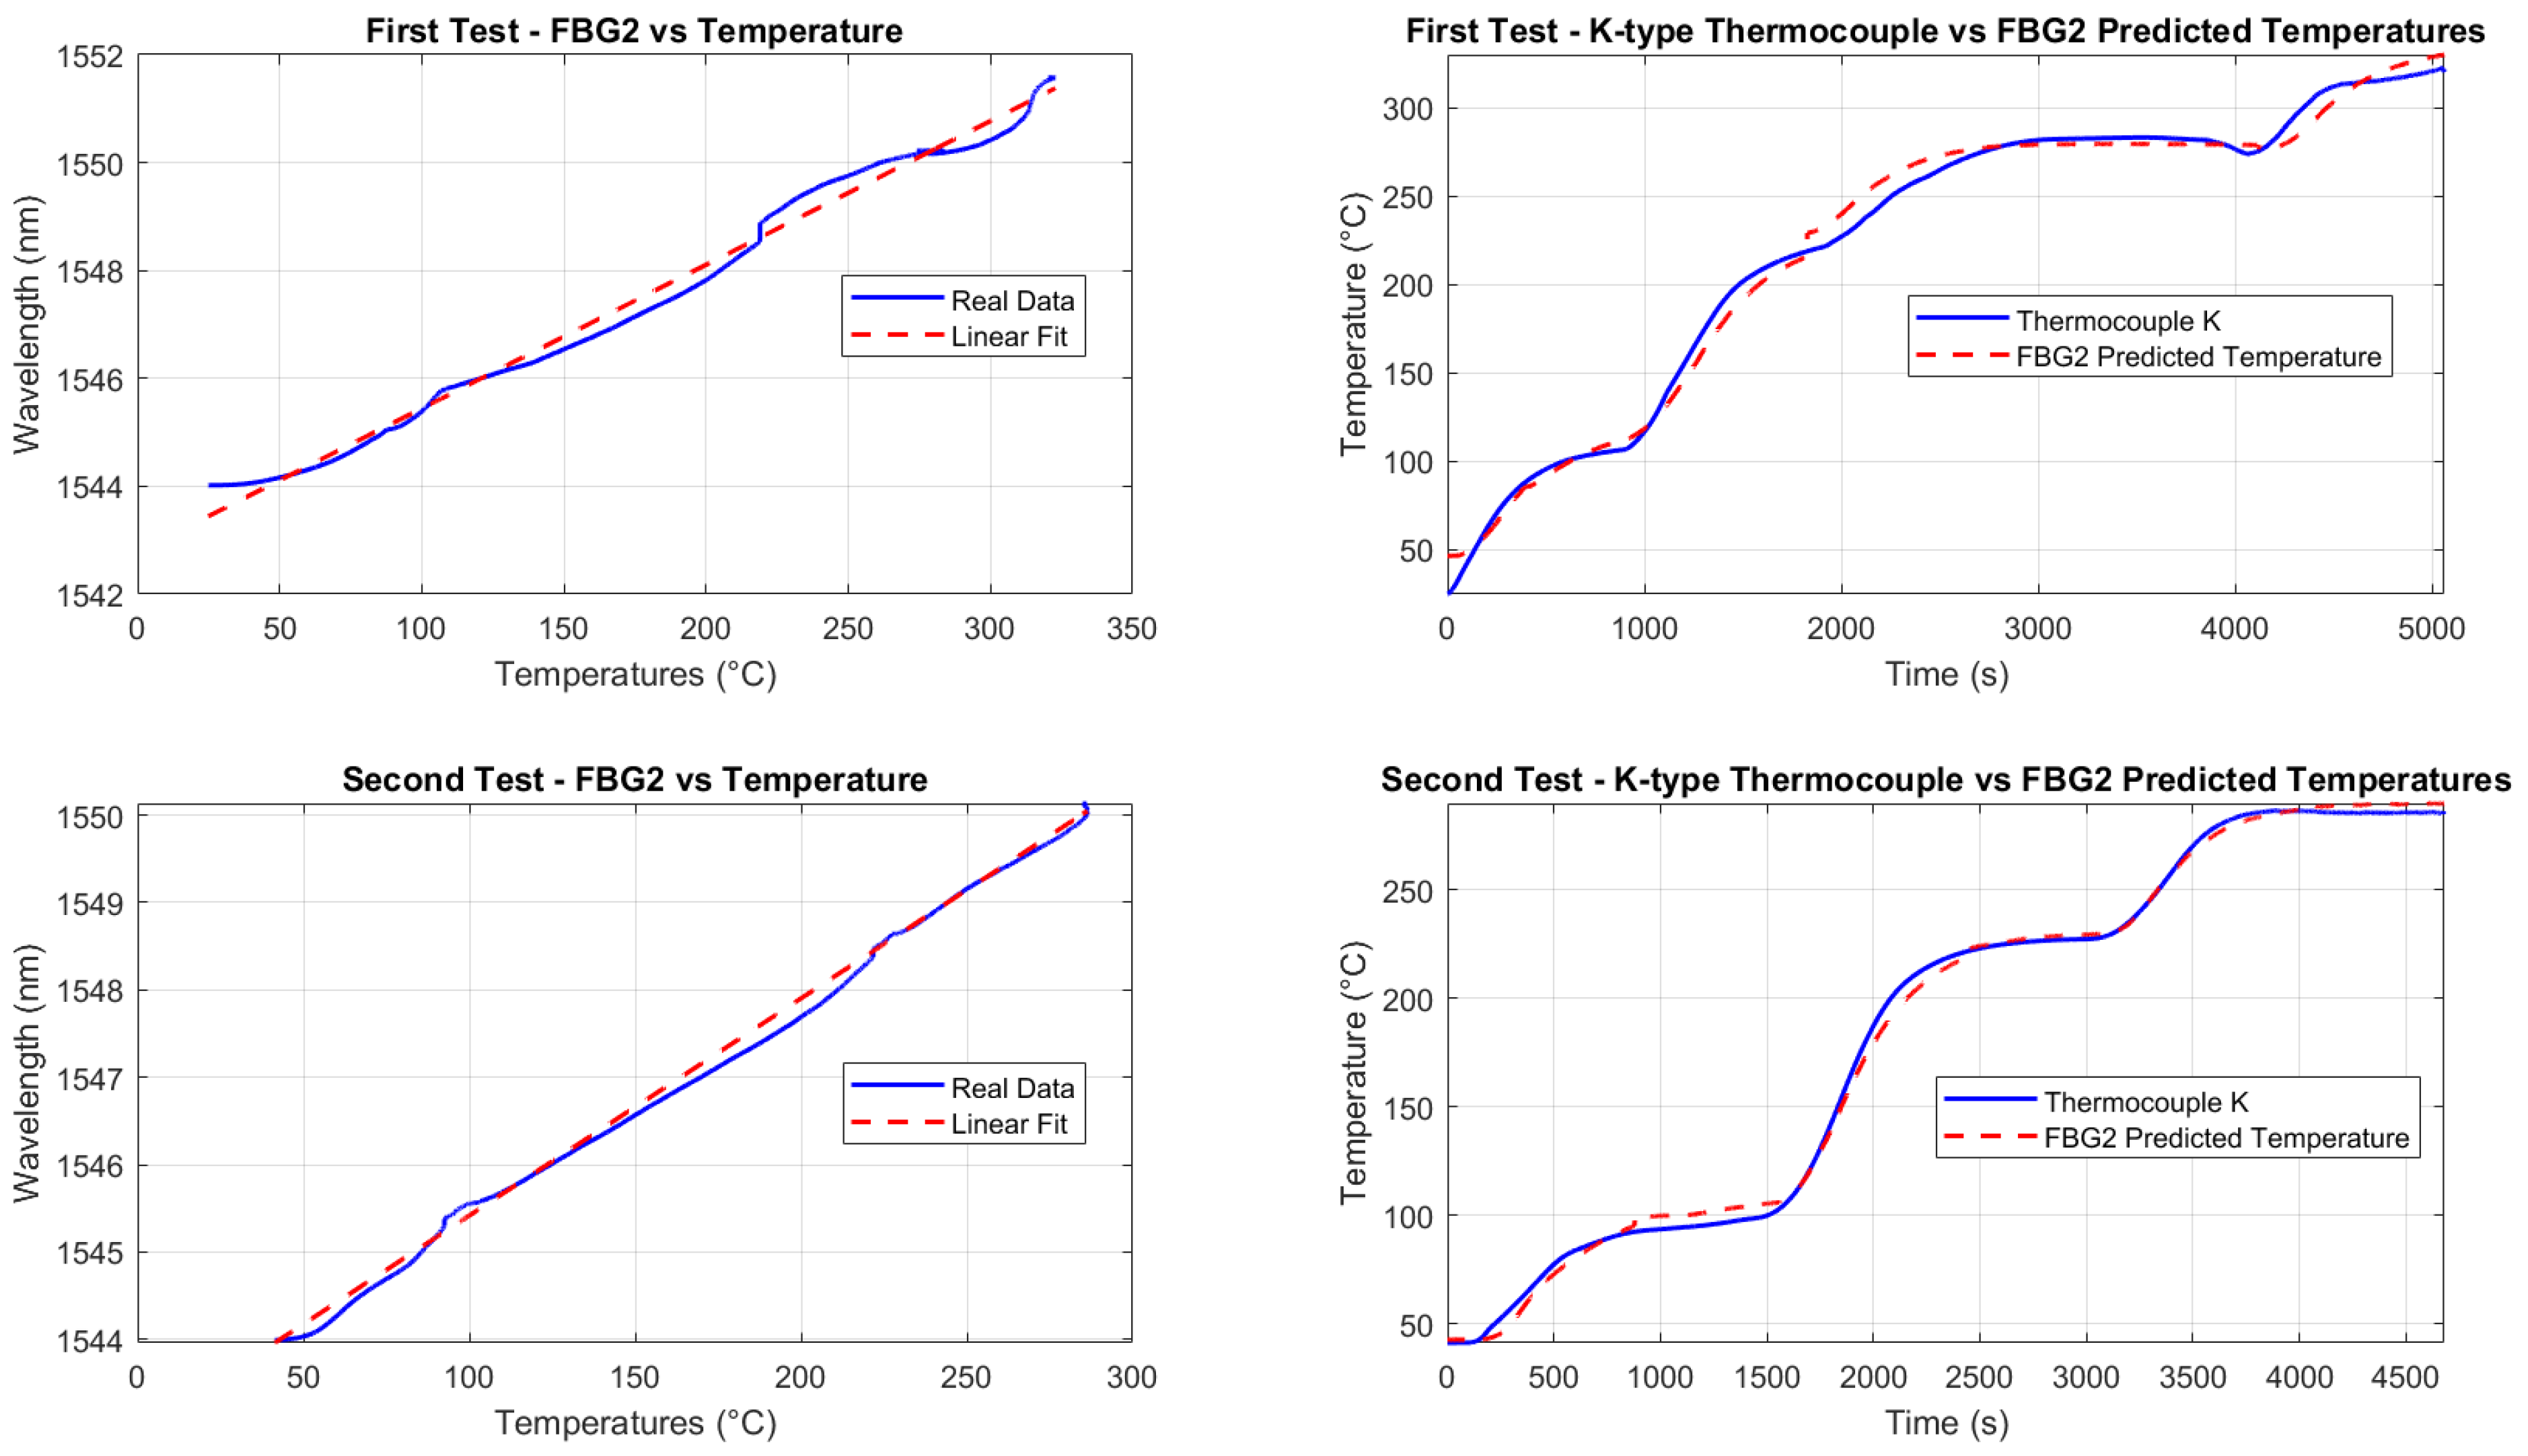
Figure 26.
Comparison between measured displacement (blue solid line) and predicted displacement (red dashed line) during the second thermo-mechanical test for all six cycles.
Figure 26.
Comparison between measured displacement (blue solid line) and predicted displacement (red dashed line) during the second thermo-mechanical test for all six cycles.

Figure 27.
Zoomed comparison between predicted displacements (red dashed line) of FBG1 and measured displacement (blue solid line) from Instron chamber, for the fifth cycle of the second test.
Figure 27.
Zoomed comparison between predicted displacements (red dashed line) of FBG1 and measured displacement (blue solid line) from Instron chamber, for the fifth cycle of the second test.
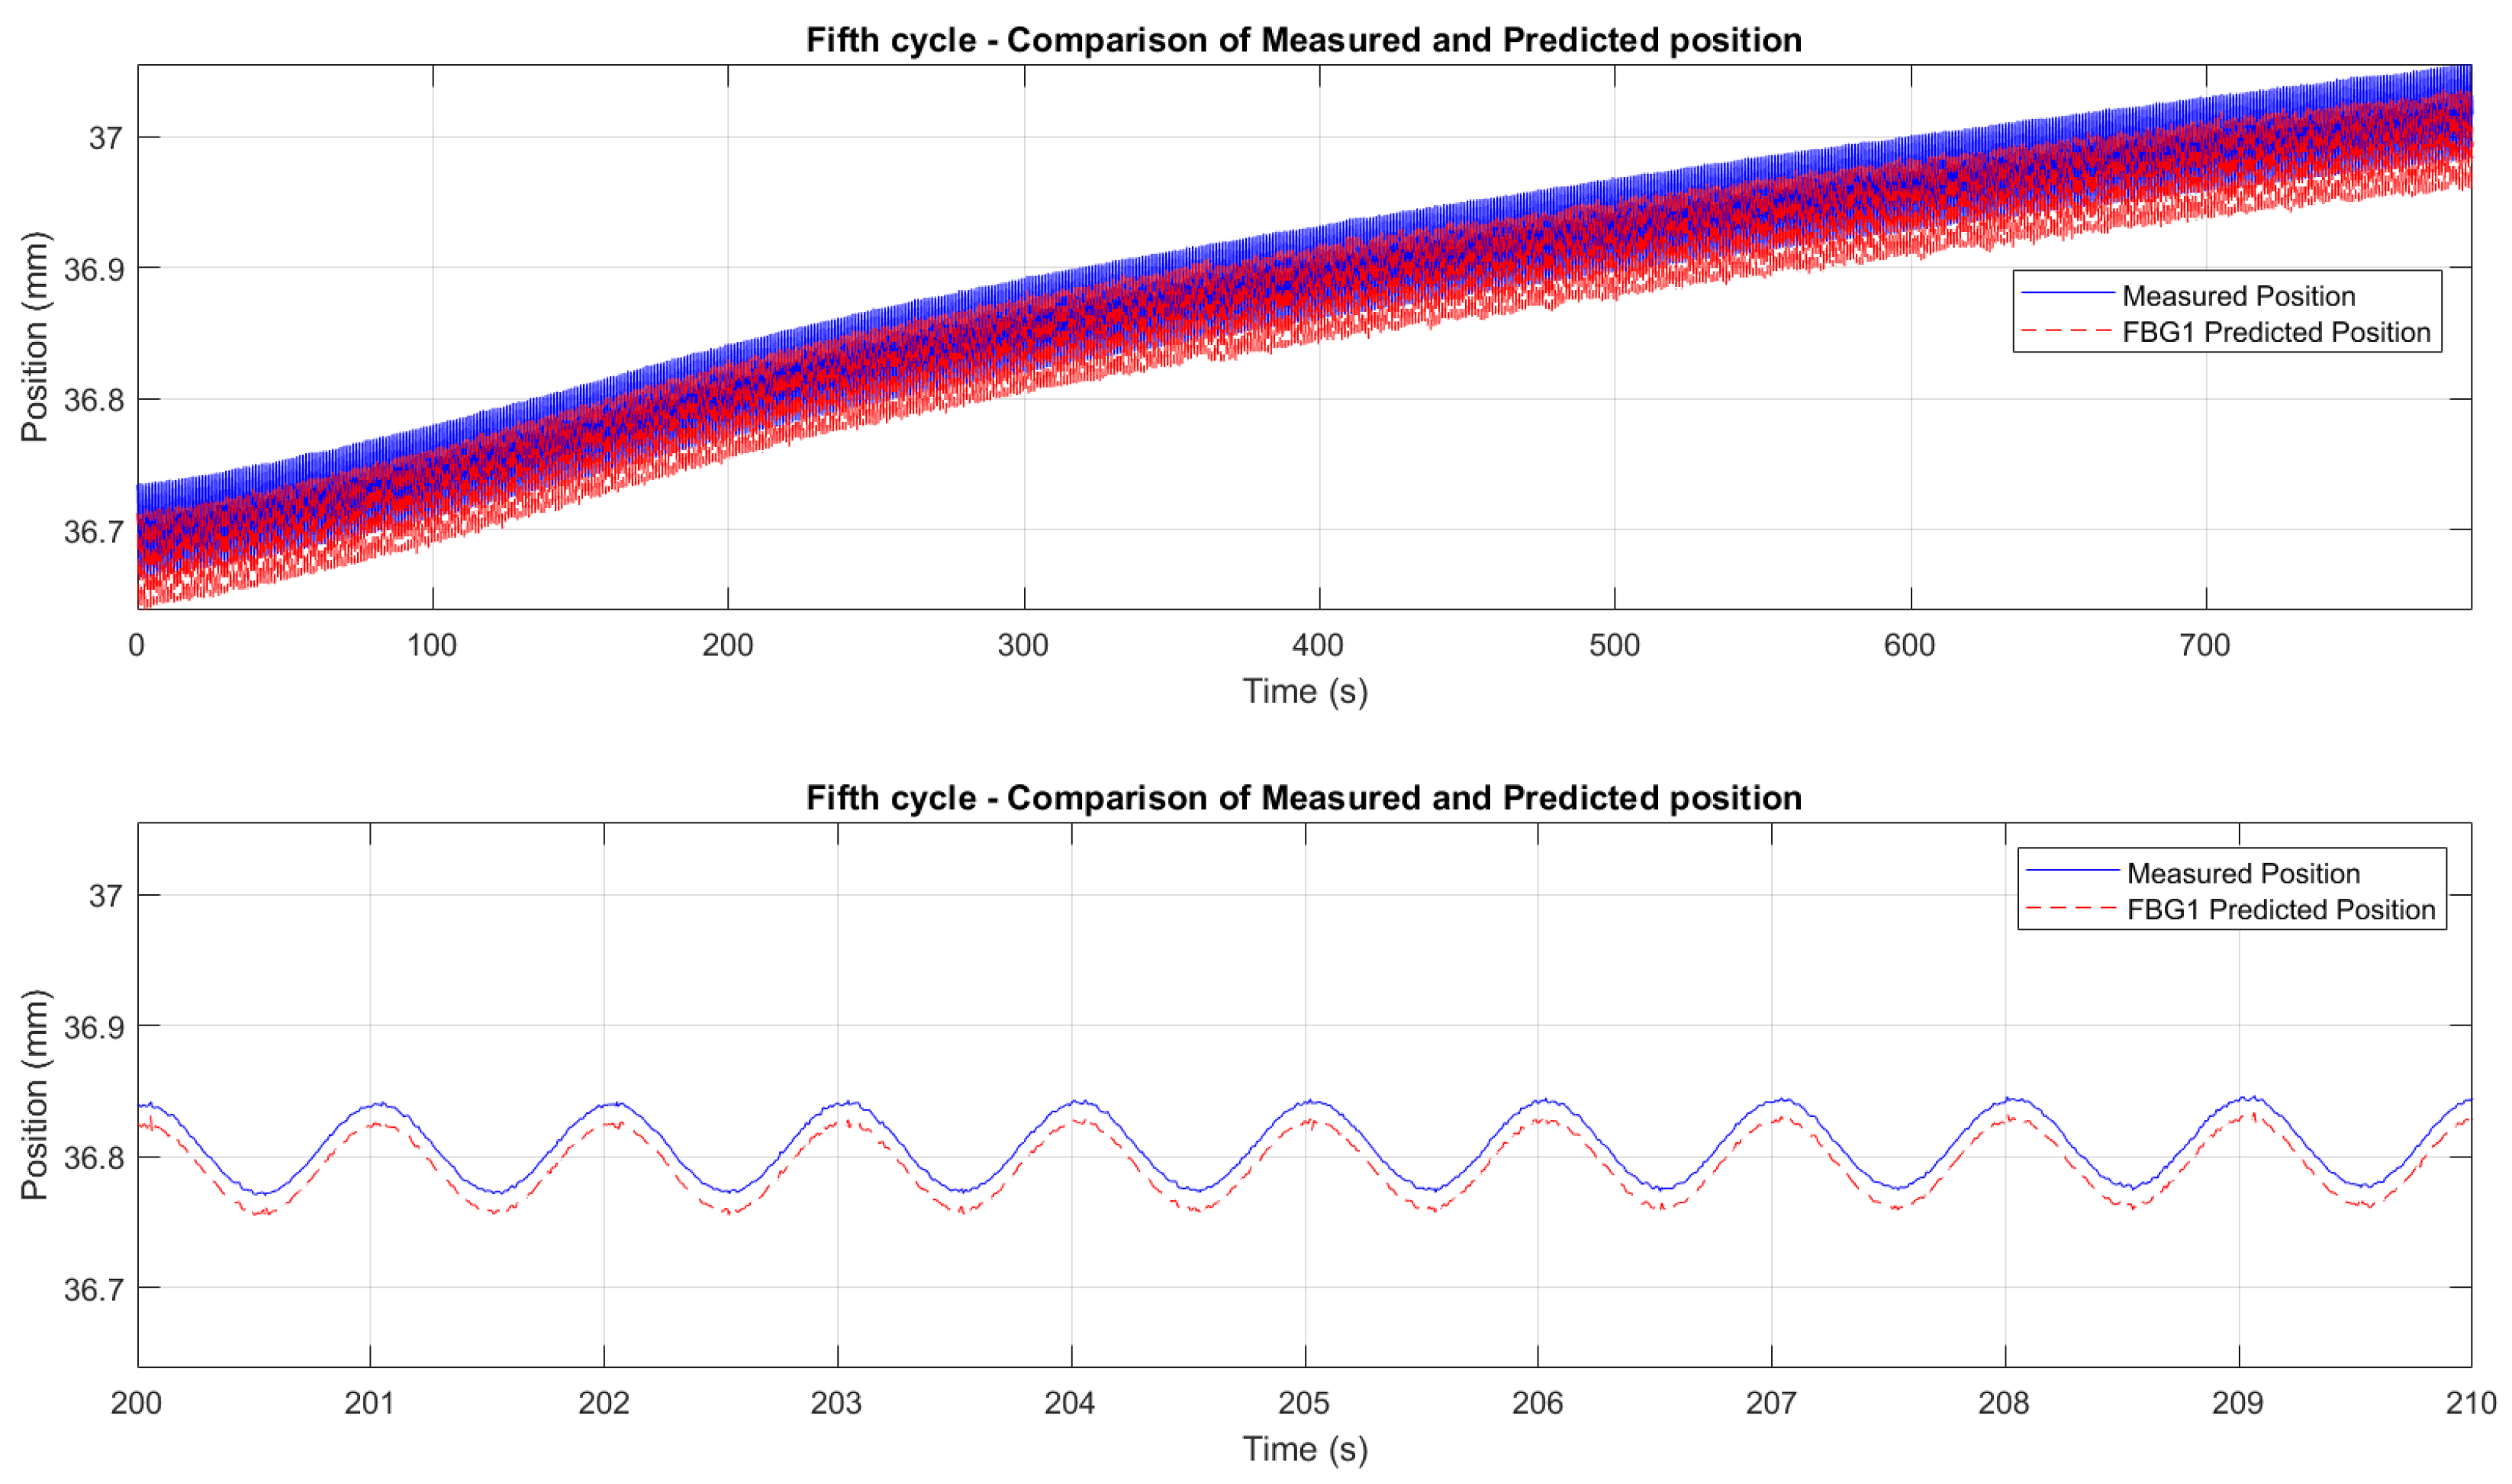
Figure 28.
Zoomed comparison between predicted displacements (red dashed line) of FBG1 and measured displacement (blue solid line) from Instron chamber, for the sixth cycle of the second test.
Figure 28.
Zoomed comparison between predicted displacements (red dashed line) of FBG1 and measured displacement (blue solid line) from Instron chamber, for the sixth cycle of the second test.
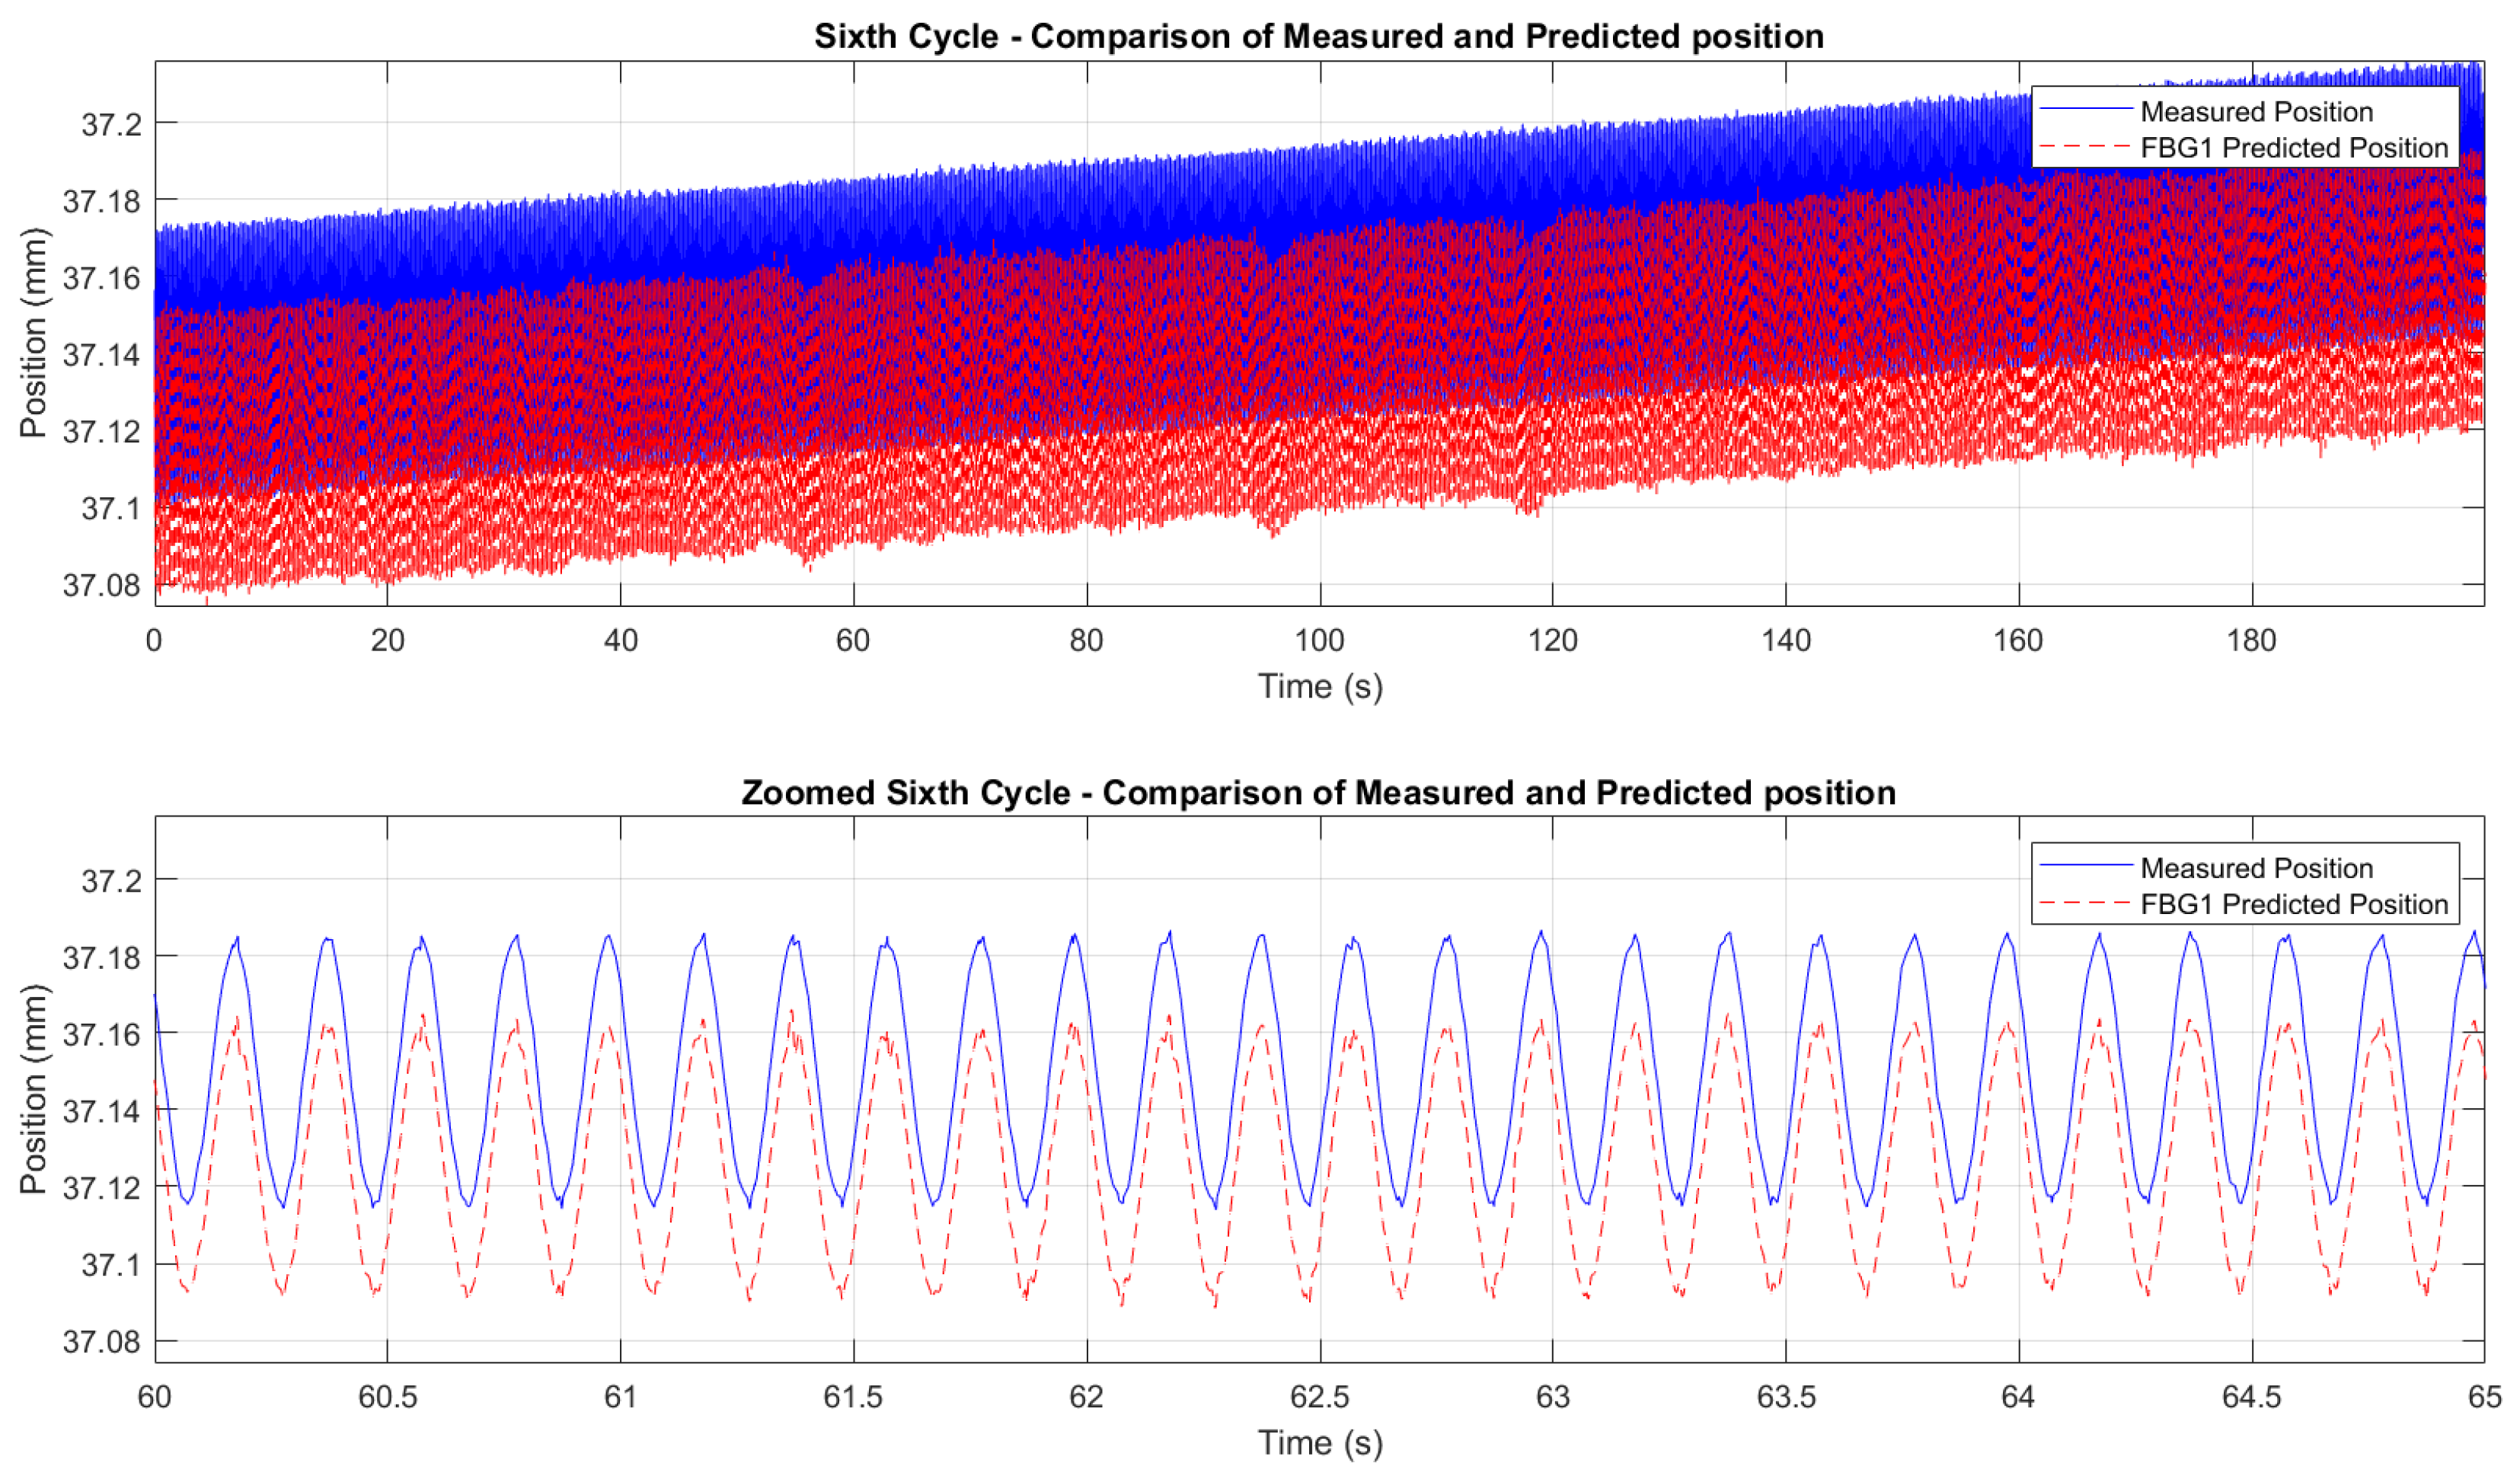

Table 1.
Femtosecond-inscribed FBG specifications for the experimental setup.
| FBG ID | Wavelength (nm) | Reflectivity (%) |
|---|---|---|
| FBG1 | 1539.64 | 54.82 |
| FBG2 | 1544.03 | 54.45 |
| FBG3 | 1548.01 | 54.02 |
| FBG4 | 1551.94 | 53.55 |
Table 2.
Temperature sensitivity coefficients for each FBG sensor.
| FBG’s ID | First Cycle | Second Cycle |
|---|---|---|
| (pm/°C) | (pm/°C) | |
| FBG1 | 12.33 | 12.37 |
| FBG2 | 12.43 | 12.48 |
| FBG3 | 12.51 | 12.56 |
| FBG4 | 12.62 | 12.61 |
Table 3.
Displacement sensitivity coefficients for each Test’s cycle.
| Cycle | First Test | Second Test |
|---|---|---|
| FBG4 (nm/mm) | FBG1 (nm/mm) | |
| 1 | 2.03 | 3.25 |
| 2 | 2.39 | 3.42 |
| 3 | 2.55 | 3.58 |
| 4 | 2.64 | 3.95 |
| 5 | 2.82 | 2.79 |
| 6 | 2.36 | 2.37 |
Table 4.
Error metrics for FBGs in the thermal test.
| Sensor | First Cycle | Second Cycle | ||
|---|---|---|---|---|
| R2 | RMSE (°C) | R2 | RMSE (°C) | |
| FBG1 | 0.9946 | 5.20 | 0.9946 | 5.06 |
| FBG2 | 0.9948 | 5.08 | 0.9948 | 4.85 |
| FBG3 | 0.9959 | 4.52 | 0.9959 | 4.44 |
| FBG4 | 0.9981 | 3.12 | 0.9981 | 2.98 |
Table 5.
Thermal compensation performance of FBG2.
| Test | RMSE (°C) | R2 |
|---|---|---|
| First Test | 7.28 | 0.9921 |
| Second Test | 4.03 | 0.9982 |
Table 6.
Cycle-specific thermal errors for FBG2.
| Cycle | First Test - RMSE (°C) | Second Test - RMSE (°C) |
|---|---|---|
| 1 | 6.35 | 10.09 |
| 2 | 11.30 | 5.91 |
| 3 | 9.79 | 14.29 |
| 4 | 1.40 | 2.07 |
| 5 | 0.73 | 5.76 |
| 6 | 1.92 | 3.98 |
Table 7.
Position error RMSE evaluation for FBG1 and FBG4 in first and second tests.
| Cycle | First Test - FBG4 | Second Test - FBG1 |
|---|---|---|
| RMSE (mm) | RMSE (mm) | |
| 1 | 0.0117 | 0.0164 |
| 2 | 0.0076 | 0.0239 |
| 3 | 0.0152 | 0.0141 |
| 4 | 0.0161 | 0.0219 |
| 5 | 0.0112 | 0.0180 |
| 6 | 0.0125 | 0.0234 |
Disclaimer/Publisher’s Note: The statements, opinions and data contained in all publications are solely those of the individual author(s) and contributor(s) and not of MDPI and/or the editor(s). MDPI and/or the editor(s) disclaim responsibility for any injury to people or property resulting from any ideas, methods, instructions or products referred to in the content. |
© 2025 by the authors. Licensee MDPI, Basel, Switzerland. This article is an open access article distributed under the terms and conditions of the Creative Commons Attribution (CC BY) license (http://creativecommons.org/licenses/by/4.0/).
Copyright: This open access article is published under a Creative Commons CC BY 4.0 license, which permit the free download, distribution, and reuse, provided that the author and preprint are cited in any reuse.


