Submitted:
29 April 2025
Posted:
30 April 2025
You are already at the latest version
Abstract
This paper investigates the impact of harmonic distortion and system unbalances on harmonic generation via simulations and measurements. The interactions between different phases, frequencies, and resonances are examined, highlighting their effects on phase and cross-frequency behavior. Amplifications and attenuations occur and are studied in a micro- grid system. The analysis focuses on the influence of background voltage distortions at the 5th, 23rd, 49th, and 103rd harmonic orders, as well as unbalances, under various simulation scenarios. Finally, comparisons are made to illustrate the relationship between background voltage distortions and the existing non- linear loads within the system.
Keywords:
harmonics
; resonance
; capacitor bank
; industrial environment
; crossed - frequency
; background distortion
I. Introduction
Harmonic distortions and unbalances are common in electric grids, often generated by devices such as frequency converters, electric furnaces, and through load imbalances [1,2]. Capacitor banks are frequently used to correct the power factor; however, this can create resonances in the electrical system, leading to attenuation or amplification of harmonic levels [3].
With the increasing presence of new types of loads and generation sources [3], ensuring power quality has become essential, requiring further studies on harmonic modeling. These studies can contribute to advancements in calculations, metering, and estimations related to power quality [4,5]. The rise of renewable energy generation, which often involves power electronic converters, also increases the need for harmonic system analysis due to the harmonic distortions these converters produce [6,7,8].
Similar experiments were conducted in [9,10,11,12], where the concept of the cross-frequency admittance matrix was introduced and validated by applying voltage harmonic distortions to the power supply, varying the phase from 0° to 180°, and analyzing harmonic measurements on a single- phase asynchronous motor.
In [13,14,15], the cross-frequency admittance matrix was further validated through experimental results, where voltage harmonic distortions were superimposed on the fundamental voltage, with phase variations between 0° and 360°. The impacts were analyzed in a small circuit consisting of a voltage generator, a non-linear load (such as a fluorescent lamp or a single-phase asynchronous motor), and data acquisition equipment.
In [16], a PSPICE simulation of a six-pulse converter, combined with an application of 5th-order voltage background distortion at phases of 0°, 30°, and 60°, demonstrated that distortions in currents and voltages exhibit a certain degree of independence.
In [17,18,19], some approach to load harmonic modeling were introduced using the cross-frequency admittance matrix instead of the traditional harmonic Norton model. However, none of these studies addressed the impact of resonances, line impedance, and unbalances on cross- frequency behavior. This is the primary focus of this paper.
This paper presents results related to the impact of resonances and background distortions on busbar harmonic distortions, amplifications, and cross-frequency effects in a model representing an industrial environment.
II. Modeling and Simulations
A. Model
Creating a model utilizing MatLab Simulink which contains common elements of an electrical industrial environment, as transformers, motors, capacitor banks and frequency drivers and resistive loads was the first step.
The model used is shown in Figure 1 and described below:
- Power Source: Contains a Three-Phase Programmable Voltage Source, which allows generate voltage waveforms with harmonic components and two Three-Phase Transformers 13.8kV/0.22kV, 60Hz which allows to configure parameters as rated power and frequency, windings rated voltages, resistances and inductances;
- Secondary Load: Contain an RC shunt load per phase, connected in “Y”. The values of resistor and capacitors are not determined in Ohms or Farads. Instead of that, the block used allow to choose rated voltage and Frequency, Active Power, and Capacitive Reactive Power, which was adjusted to reach power factor around 0.97. Without using capacitors, the power factor was around 0.71. The resistances consumption is 1kW per phase. This part is duplicated;
- Primary Load: Contain an RC shunt load per phase, connected in “Y”. The VAr compensation is twice the compensation on Secondary and the resistive load has the same power consumption of RC load on Secondary;
- AC-DC-AC Converter: This group represents a PWM Inverter which contains a Diode-based rectifier, DC Filter, IGBT DC-AC Inverter and a PWM Generator. There is a Three-Phase Induction Motor connected to the output of the inverter. This block is duplicated;
- Induction Motor: The model represents the three- phase induction motor parametrized with squirrel cage rotor type, 3HP, 220V and 60Hz. This block is duplicated;
- Current Measurement: The phase “A” current -Ia was measured and it was possible to get the followings information: Waveform, harmonics from 2nd to 109th orders (magnitude, phase and percentage from fundamental wave), THD (Total Harmonic Distortion [1]) and RMS value, in Ampere (A);
- Power Measurement: This group provides data as Active Power, Reactive Power and Power Factor; A block was created on Simulink to calculate Power Factor - PF from Active Power - AP and Reactive Power - RP measured on phase A, accordingly to equation (1).
- Voltage Measurement: The phase A Voltage - Va is measured and it was possible to get the followings information: Waveform, harmonics from 2nd to 109th orders (magnitude, phase and percentage from fundamental wave), THD (Total Harmonic Distortion [1]) and RMS value, in Volt (V);
- Impedance Measurement: This block work together PowerGui block to provide analysis of magnitude and phase;
- Cable Modeling: By using pi-equivalent model, cable impacts were considered between loads and power source and between loads and transformer windings (Primary and Secondary).
B. Harmonics Application and Variation
Four background harmonic distortions were applied to the system: 5th, 23rd, 49th and 103rd orders. Follow the reasons:
- 5th: This is the most significate distortion measured on the grid [2];
- 23rd: It corresponds to the resonance frequency on Secondary when capacitor bank was connected to the system;
- 103rd: This frequency was chosen because it is within Supraharmonics range (2kHz – 150kHz) [6] and is close to the first resonance on Primary, as will be shown ahead.
The grid measurement done in [2] shows 2.271% for 5th harmonic distortion but there was applied 1% for all frequencies in order to facilitate comparisons. 5th and 23rd harmonics are essentially negative sequences for balanced systems, so they were simulated just as negative sequences and 49th and 103rd harmonics were simulated as positive sequences due to the same reason.
The conditions simulated for harmonics application are:
- Balanced power supply with capacitor bank connected on Secondary;
- Balanced power supply with capacitor bank not connected on Secondary;
- Unbalanced power supply with capacitor bank connected on Secondary;
- Unbalanced power supply with capacitor bank not connected on Secondary.
The Reference signal to be used on Results section for comparisons was the distortion when the system was supplied by a sinusoidal waveform and all capacitors and inverters were connected.
C. Simulation Methods
Through PowerGui tool in MatLab Simulink, it is possible to get system impedance, FFT analysis and others information. This facility was used to determine impedance magnitude, resonance frequency and all harmonic data.
All results were taken just on Va. This allowed comparing the effect of an unbalanced voltage against the balanced condition. The impedance results were obtained between Phase A and Neutral line in Primary and Secondary.
III. Results
A. Impedance Analysis
Note in Figure 2 that some resonances appear due to RC loads and cable modeling on Primary. The first peak of impedance on Primary happens near 6280Hz, which is close to 103rd order. Furthermore, Figure 3 shows some resonance happening on Secondary around 1380Hz, which is the 23rd order. For comparisons, Figure 4 shows the impedance on Secondary when there are no capacitors connected and Figure 5 compare Figure 3 and Figure 4 results.
B. Harmonic Analysis Without Applying Distortions
At beginning, the Grid was providing a sinusoidal voltage, which means 0% of distortions.
The AC-DC-AC converter acts as harmonic source at the same time that it is a non-linear load. This equipment is very common on the industry and it changes completely the characteristics of the voltage signal, as can be seem on Figure 6.
C. Application of Voltage Distortions of 5th Order
In this case, it was applyed 1% of distortion on 5th order over a sinusoidal voltage supply. The results are shown on Figure 7.
- Crossed-frequency until the 33rd harmonic, but the distortions were lower than the reference;
- Zero-sequence harmonics appeared when the system was unbalanced;
- The resonances presented on the system did not cause any relevant amplification or attenuation around to the 5th order.
D. Application of Voltage Distortions of 23rd Order
Following the same procedure of topic C, 1% of distortion on 23rd order was applied over a sinusoidal voltage supply.
The results are shown on Figure 8.
- Crossed-frequency distortion between 17th and 37th order;
- 25th order showed its distortion higher than the 23rd order;
- The resonance on Secondary caused a strong amplification near its frequency;
- 23rd and 25th order had their distortions higher than 6% while 1% was applied;
- Unbalancing did not show to have any relevant impact on distortions.
E. Application of Voltage Distortions of 49th Order
Accordingly, to the purpose mentioned, 1% of distortion on 49th order was applied over a pure sinusoidal voltage supply. The results are shown on Figure 9.
- No relevant crossed-frequency was notable within the balanced system;
- Crossed-frequency happened around 23rd order when the system was unbalanced;
- Comparing results with and without capacitors to Figure 5, a relationship between harmonics distortion and impedance can be noted: after the resonance – 23rd order – as lower the impedance is, more it attenuates the distortion and crossed- frequency;
- Unbalancing caused significative distortion only on harmonics 27 and 33, which are zero- sequence.
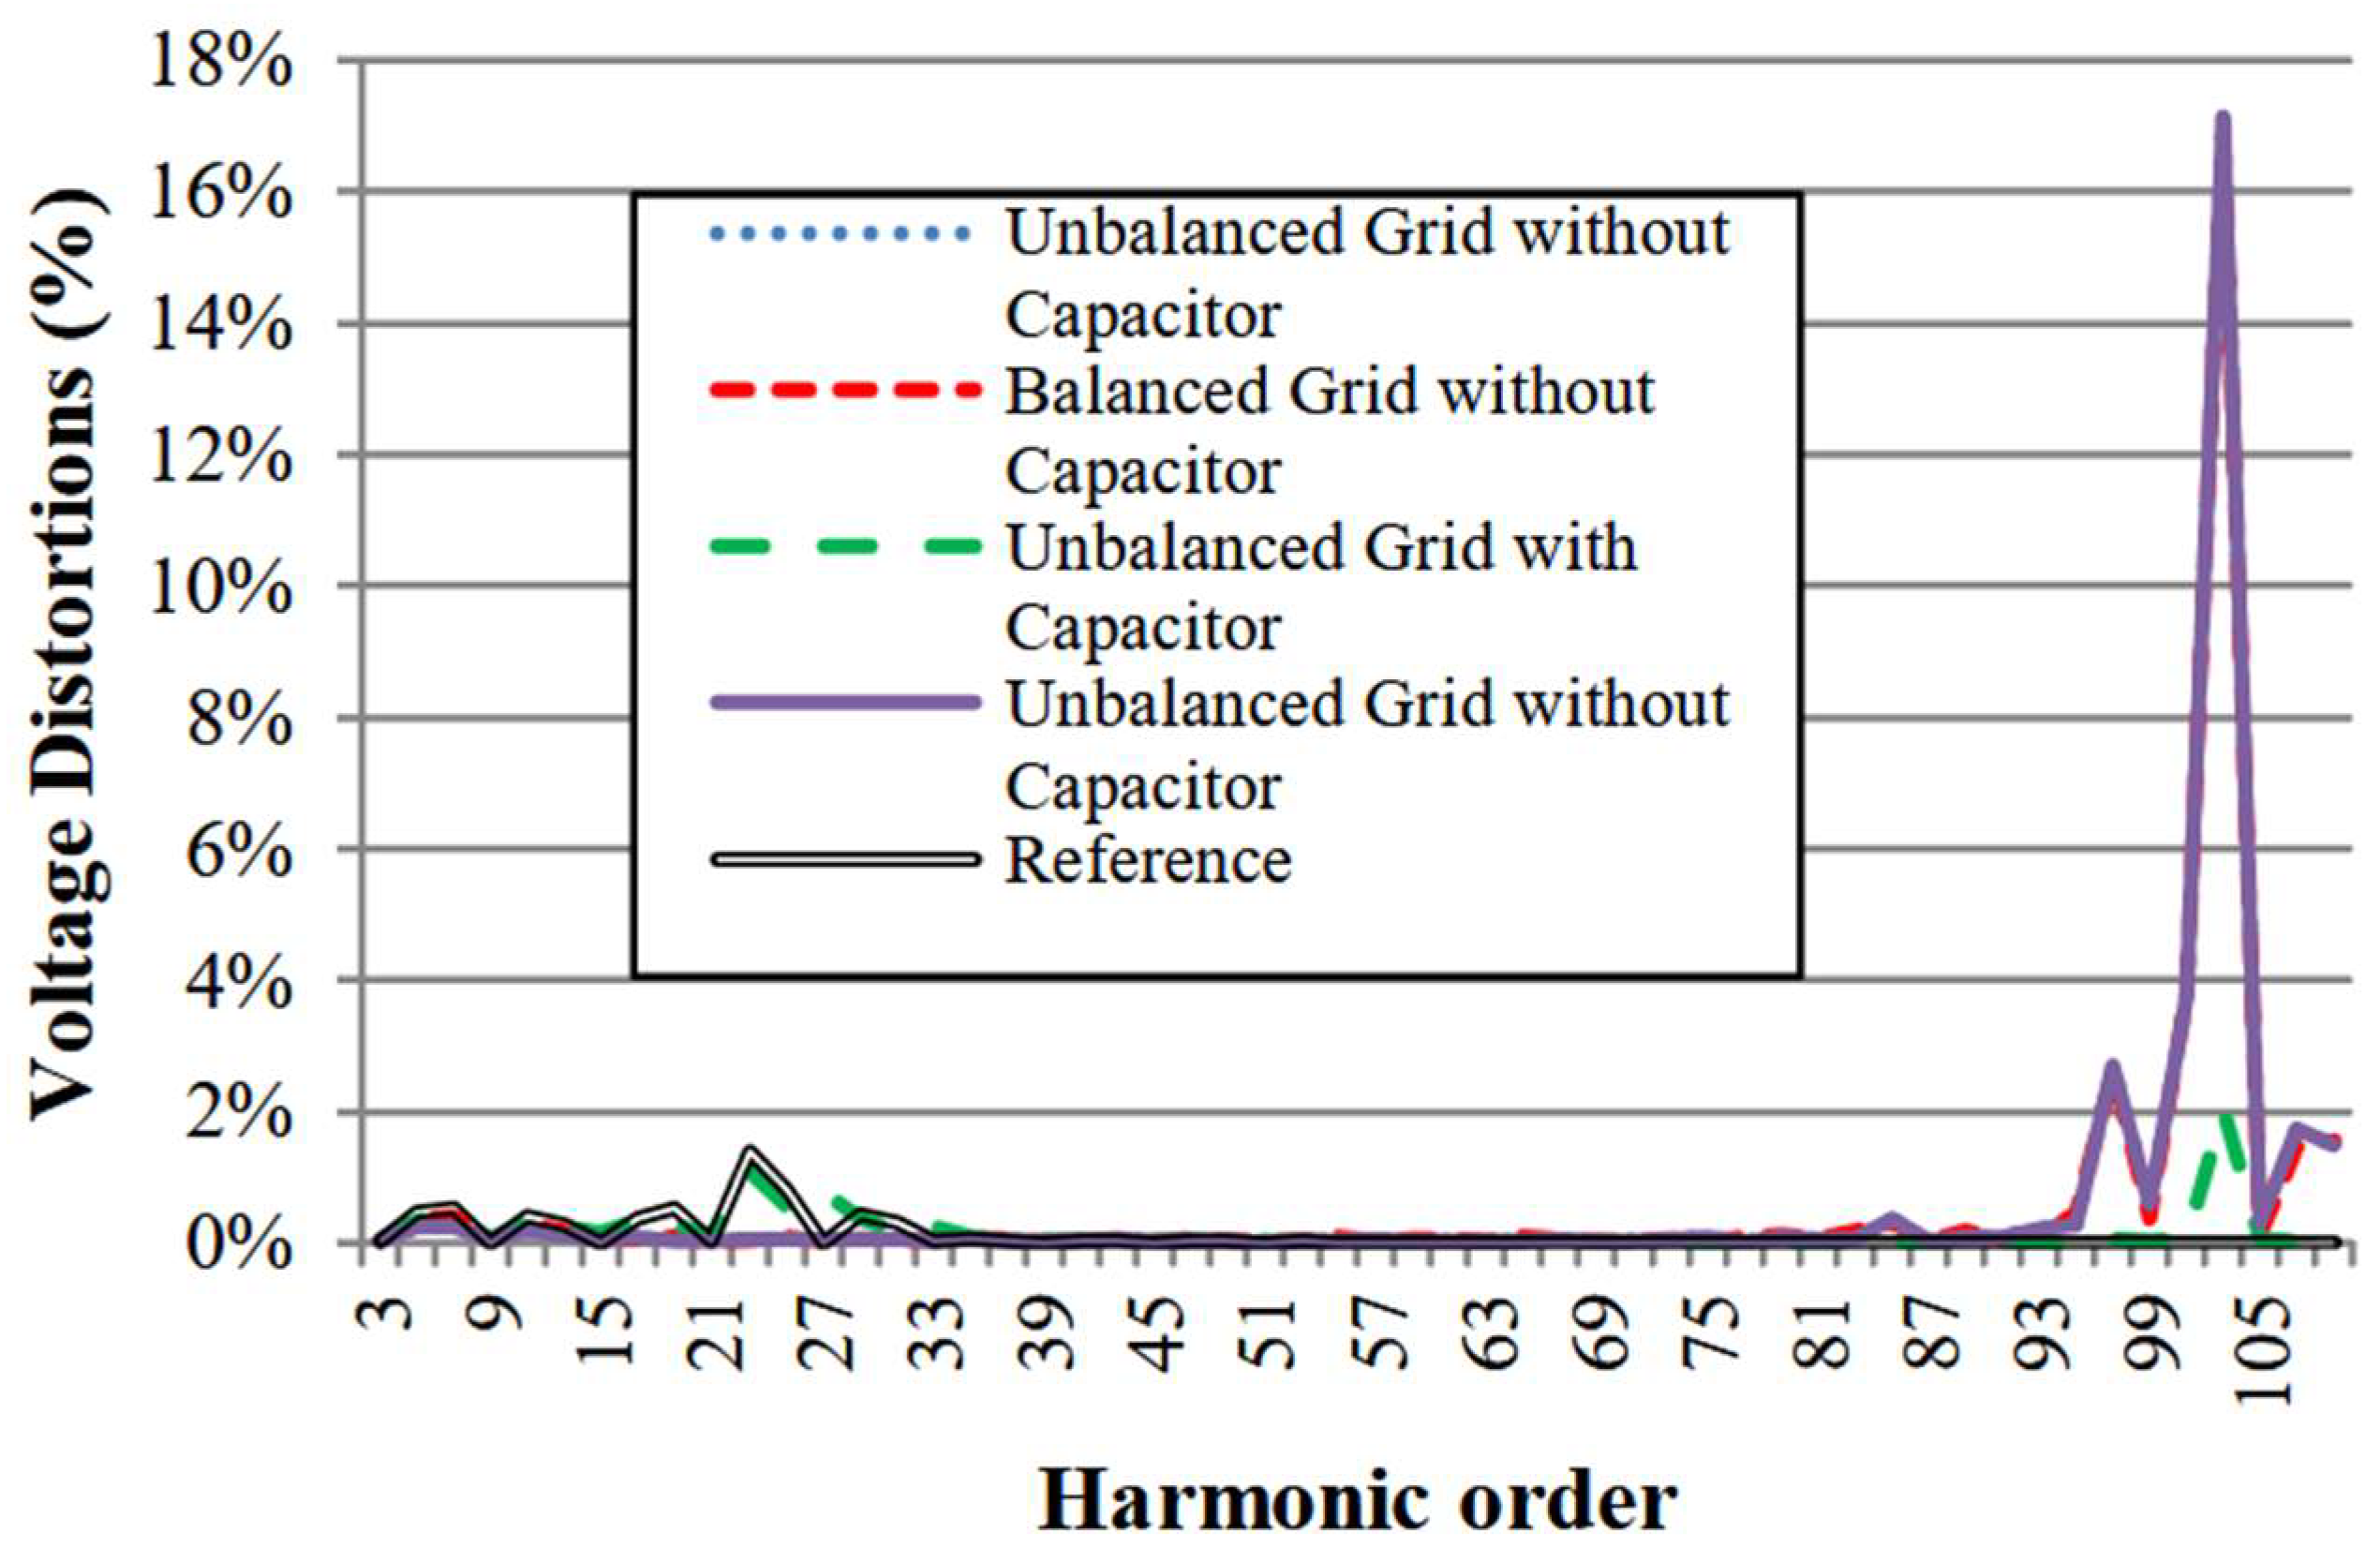
F. Application of Voltage Distortions of 103rd Order
Finally, 1% of distortion on 103rd order was applied over a sinusoidal voltage supply. The results are shown on Figure 10.
- Crossed-frequency happens near the resonance frequency;
- There is crossed-frequency around 103rd order, but it only happens where there are no capacitors on Secondary;
- The crossed-frequency happens due to the resonance on Primary;
- Voltage harmonics attenuate strongly after the resonance frequency when capacitors are connected on Secondary;
- There is amplification around 103rd order when applying 1% on 103rd order, which caused voltage distortions of 16%;
- The amplification is caused by the resonance on Primary;
- The unbalancing caused some distortion only on harmonics 27 and 33, which are zero-sequence.
IV. Conclusions
The findings of this paper can help in understanding and anticipating potential issues when connecting PV inverters or wind turbines to an existing grid that already experiences background harmonic distortion and unbalances [4,5].
Based on the results, some key observations can be made:
- Amplifications and attenuations of harmonic distortions due to resonances are evident;
- Background voltage distortion and voltage unbalance have a measurable impact on the magnitude of both self-frequency and cross-frequency harmonics.
References
- Dugan, R.C.; McGranaghan, M.F.; Santose, S.; Beaty, H.W. Electrial Power Systems Quality, 3rd ed.; McGraw-Hill, 2012. [Google Scholar]
- Y. K. Mok, C. F. T. Norman, W. H. Lau and M. C. Leung, "Experiment-based simulation for distortion behavior in LV networks for microgrid modeling," 2011 IEEE Power and Energy Society General Meeting, Detroit, MI, USA, 2011, pp. 1-6. [CrossRef]
- Rodrigues, W.B.; Prata, C.d.S. In Portuguese: Study of Frequency Inverter Harmonics Generation; National Institute of Telecommunication - INATEL, 2017. [Google Scholar]
- IEEE, "IEEE Std 519™-2022 – IEEE Standard for Harmonic Control in Electric Power Systems". Available online: https://standards.ieee.org/ieee/519/10677/.
- Sheth, K., Patel, D., & Swami, G. (2024). Strategic insights into vehicles fuel consumption patterns: Innovative approaches for predictive modeling and efficiency forecasting. International Journal of Engineering Research & Technology (IJERT), 13(6), 1-10.
- Bollen, M.; Rönnberg, S. Propagation of Supraharmonics in the Low Voltage Grid; Energiforsk: Stockholm, 2017. [Google Scholar]
- Cigre/Cired. Power Quality and EMC Issues With Future Electricity Networks, C4.24 ed.; 2018; pp. 109–113. [Google Scholar]
- Abdelaziz, A.Y.; Mekhamer, S.F.; Ismae, S.M. Sources and Mitigation of Harmonics in Industrial Electrical Power Systems: State of the Art. The Online Journal on Power and Energy Engineering (OJPEE) 2012. [Google Scholar]
- Swami, G., Sheth, K., & Patel, D. (2024). From ground to grid: The environmental footprint of minerals in renewable energy supply chains. Journal of Sustainable Energy, 12(4), 1-15. [CrossRef]
- Bollen, M.; Meyer, J.; Amaris, H.; Blanco, A.M.; de Castro, A.G.; Desmet, J.; Klatt, M.; Kocewiak, Ł.; Rönnberg, S.; Yang, K. Future Work on Harmonics – Some Expert Opinions Part II – Supraharmonics, Standards and Measurements; Stockholm.
- Fauri, M.; Ribeiro, P.F. A Novel Approach to Non Linear Load Modelling. In Proceedings of the IEEE ICHIPS VI, Bologna, 1994. [Google Scholar]
- M.Fauri, "Harmonic Modelling of Non-Linear Load by means of Crossed Frequency Admittance Matrix," IEEE Transactions on Power Systems, vol. 12, no. 4, 1997. [CrossRef]
- Souto, O.C.N.; Oliveira, J.C.; Oliveira, A. Ribeiro, P.F. A Reflection on the Subject of Conveters Internal Harmonic Impedance. In Proceedings of the IMACS, Saint Nazaire, 1996. [Google Scholar]
- Y. Li, T. Wang, S. Zhou, and G. Zhao, “Coupled harmonic admittance identification based on measurement,” in 8th International Conference on Power and Energy Systems, Institute of Electrical and Electronics Engineers, Dec. 2018. [CrossRef]
- Swami, G., Sheth, K., & Patel, D. (2024). PV capacity evaluation using ASTM E2848: Techniques for accuracy and reliability in bifacial systems. Journal of Solar Energy Engineering, 146(1), 1-10. [CrossRef]
- Sheth, K., Patel, D., & Swami, G. (2024). Reducing electrical consumption in stationary long- haul trucks. Open Journal of Energy Efficiency, 13(3), 1-10. [CrossRef]
- Y. K. Mok, C. F. T. Norman, W. H. Lau and M. Leung, "Experiment-based simulation for distortion behavior in LV networks for microgrid modeling," 2011 IEEE Power and Energy Society General Meeting, Detroit, MI, USA, 2011, pp. 1-6. [CrossRef]
- C. Debruyne, J. Desmet and L. Vandevelde, "Estimation of end user voltage quality including background distortion," 2012 IEEE Power and Energy Society General Meeting, San Diego, CA, USA, 2012, pp. 1-7. [CrossRef]
- Sheth, K., & Patel, D. (2024). Strategic placement of charging stations for enhanced electric vehicle adoption in San Diego, California. Journal of Transportation Technologies, 14(1), 1-10. [CrossRef]
Figure 1.
Circuit model of electrical industrial environment.
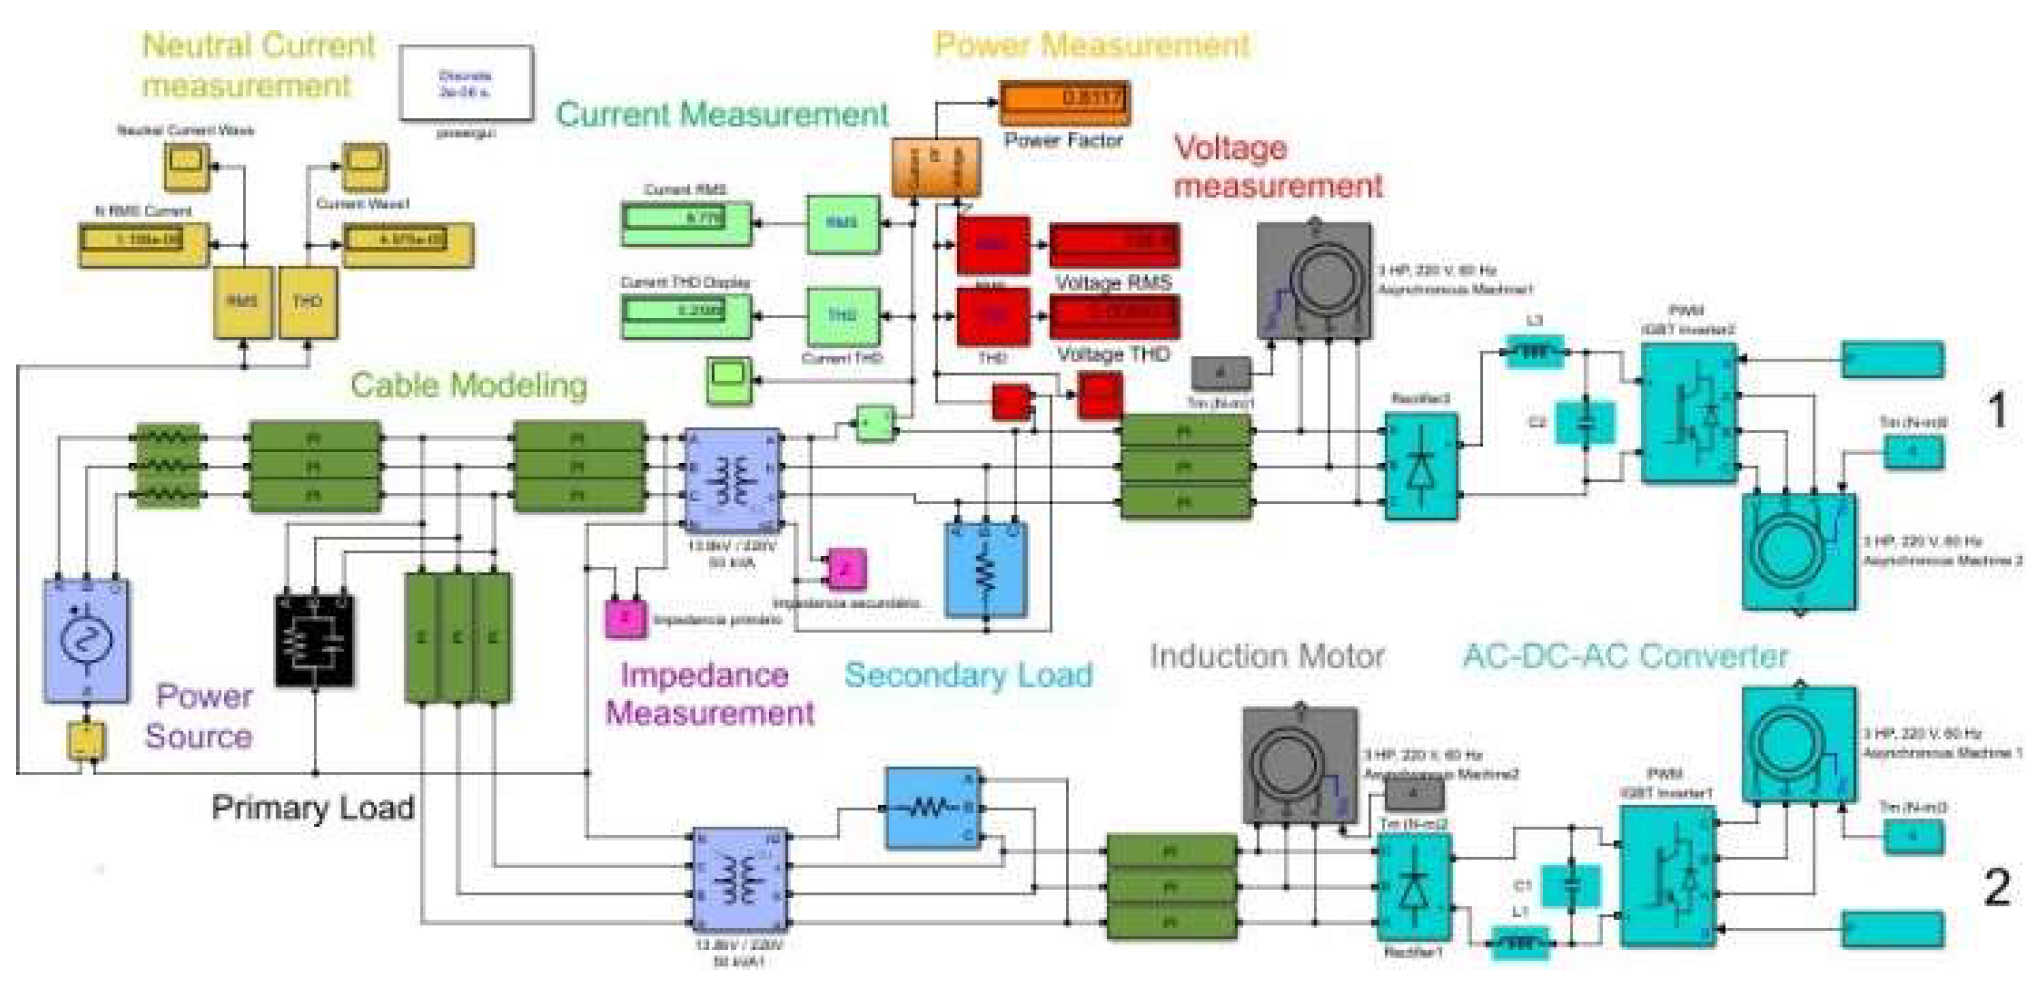
Figure 2.
Impedance on Primary.
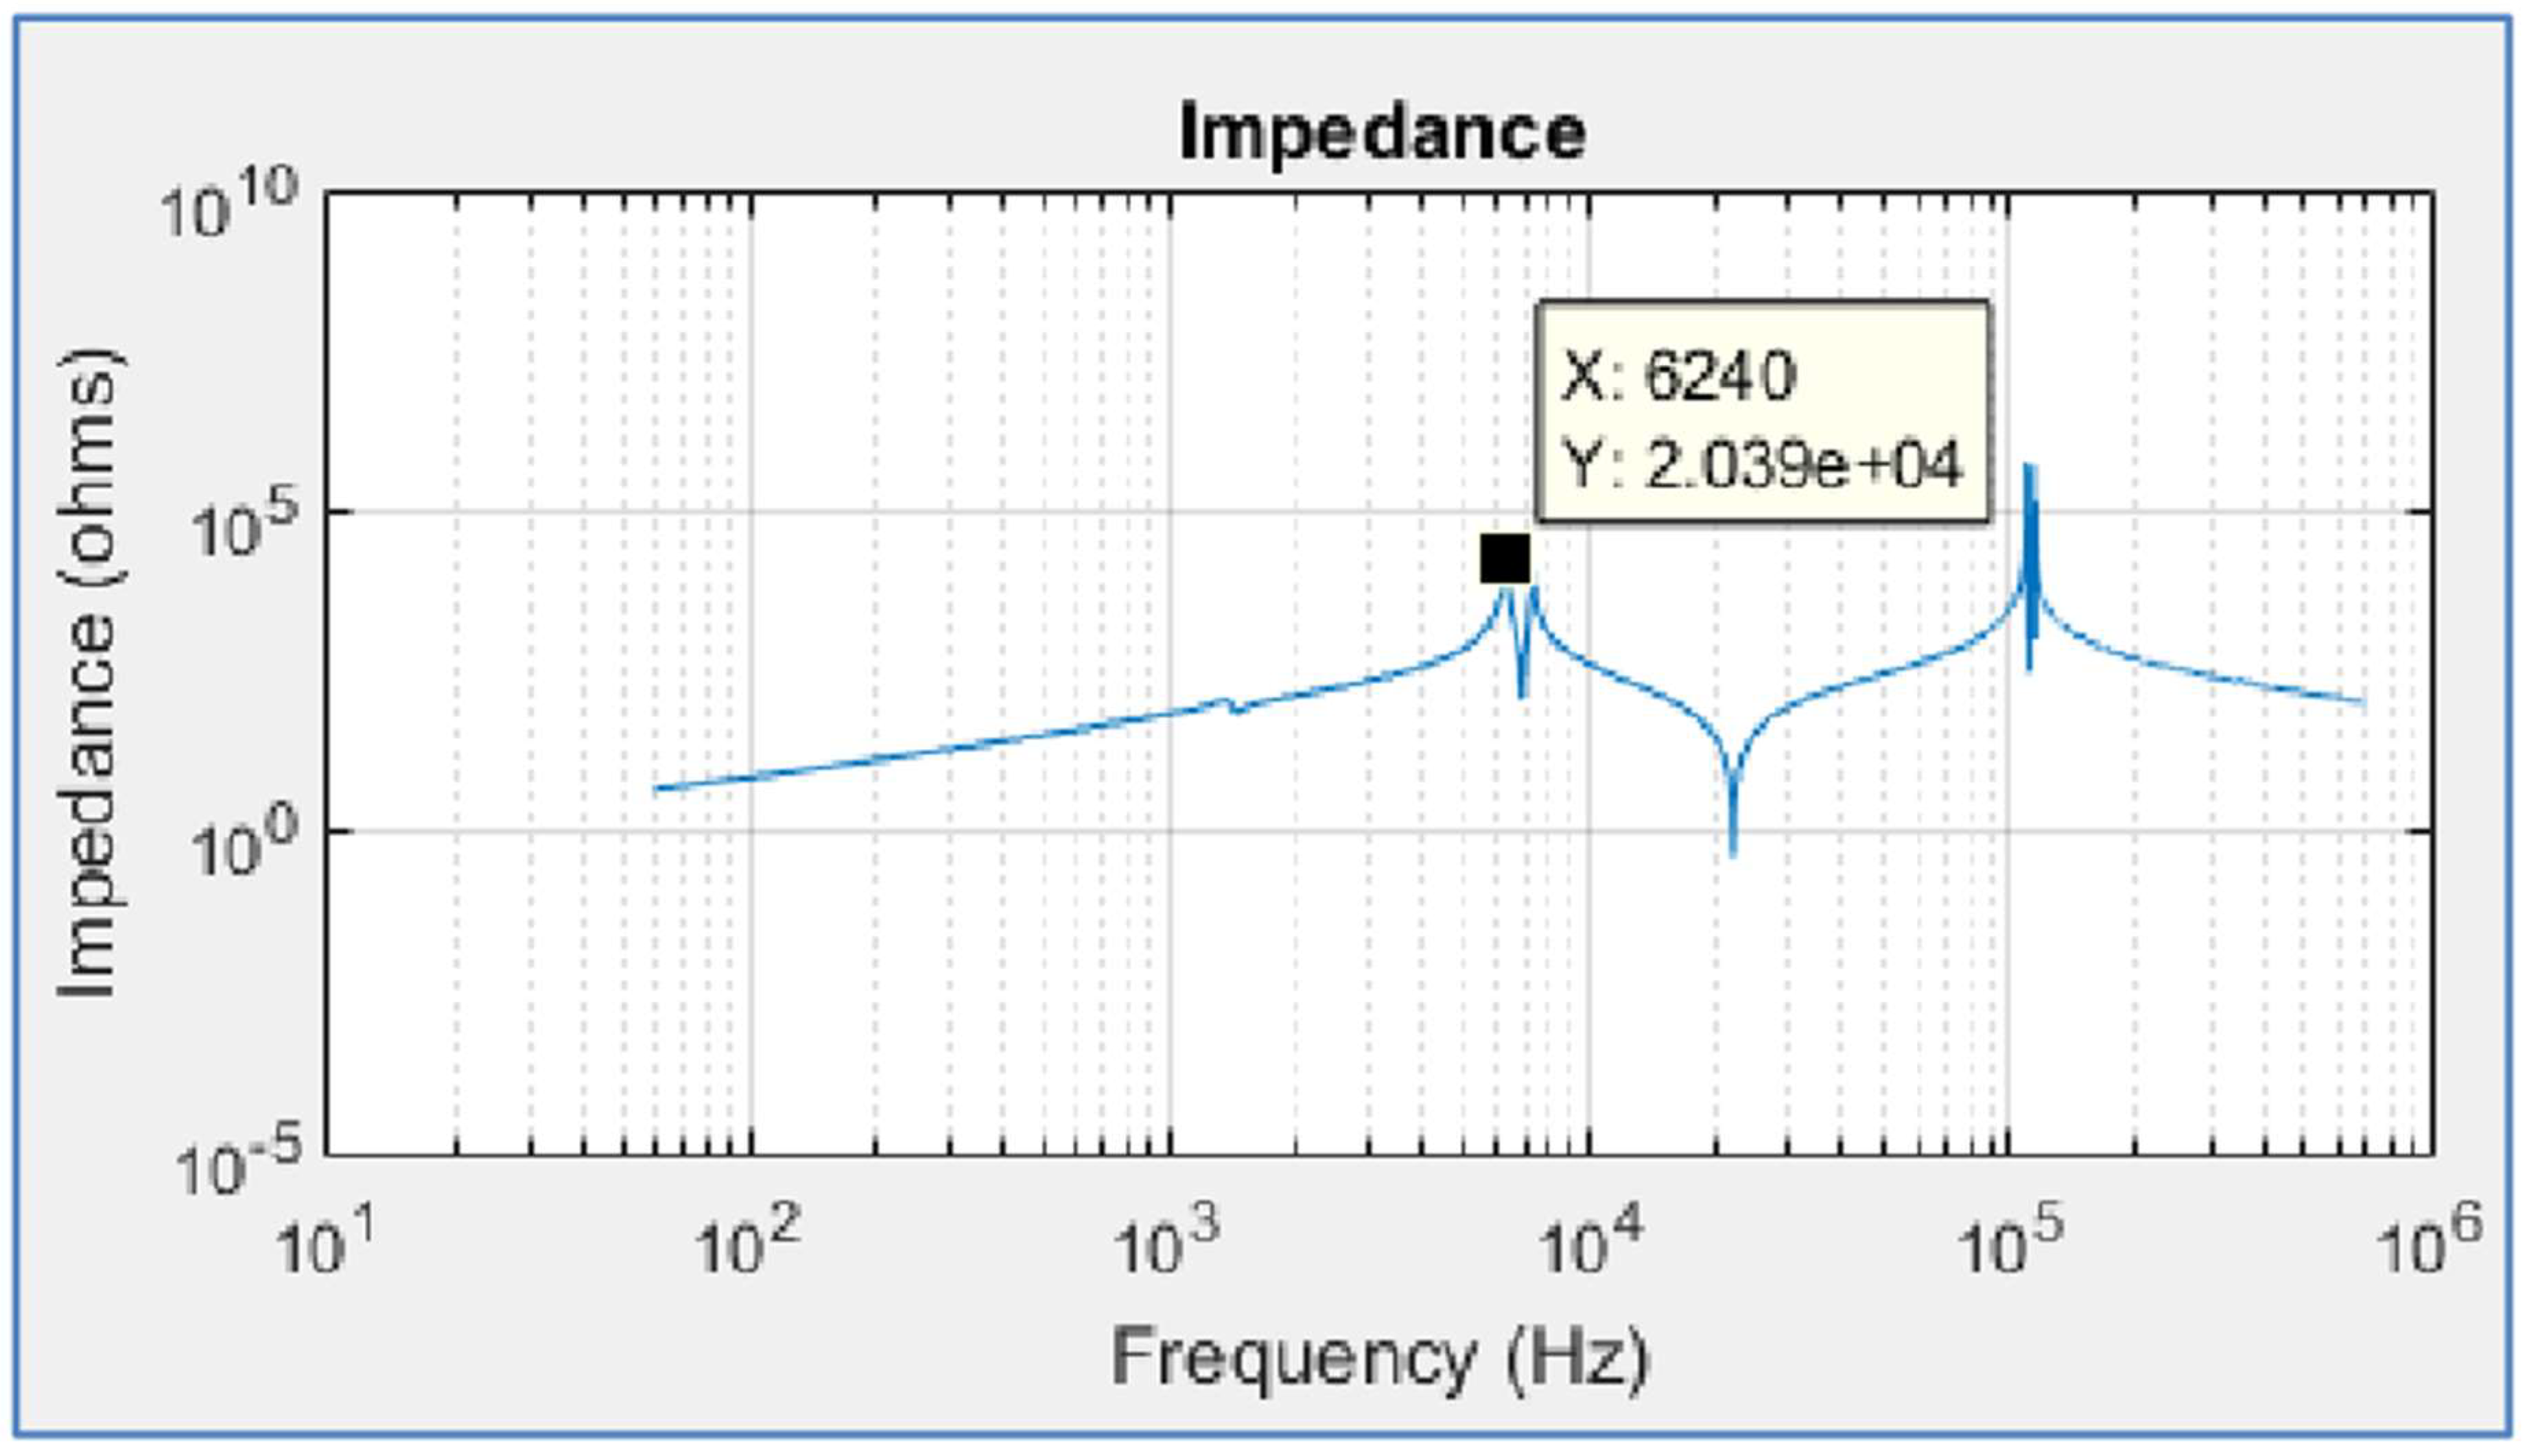
Figure 3.
Impedance on Secondary with capacitors.
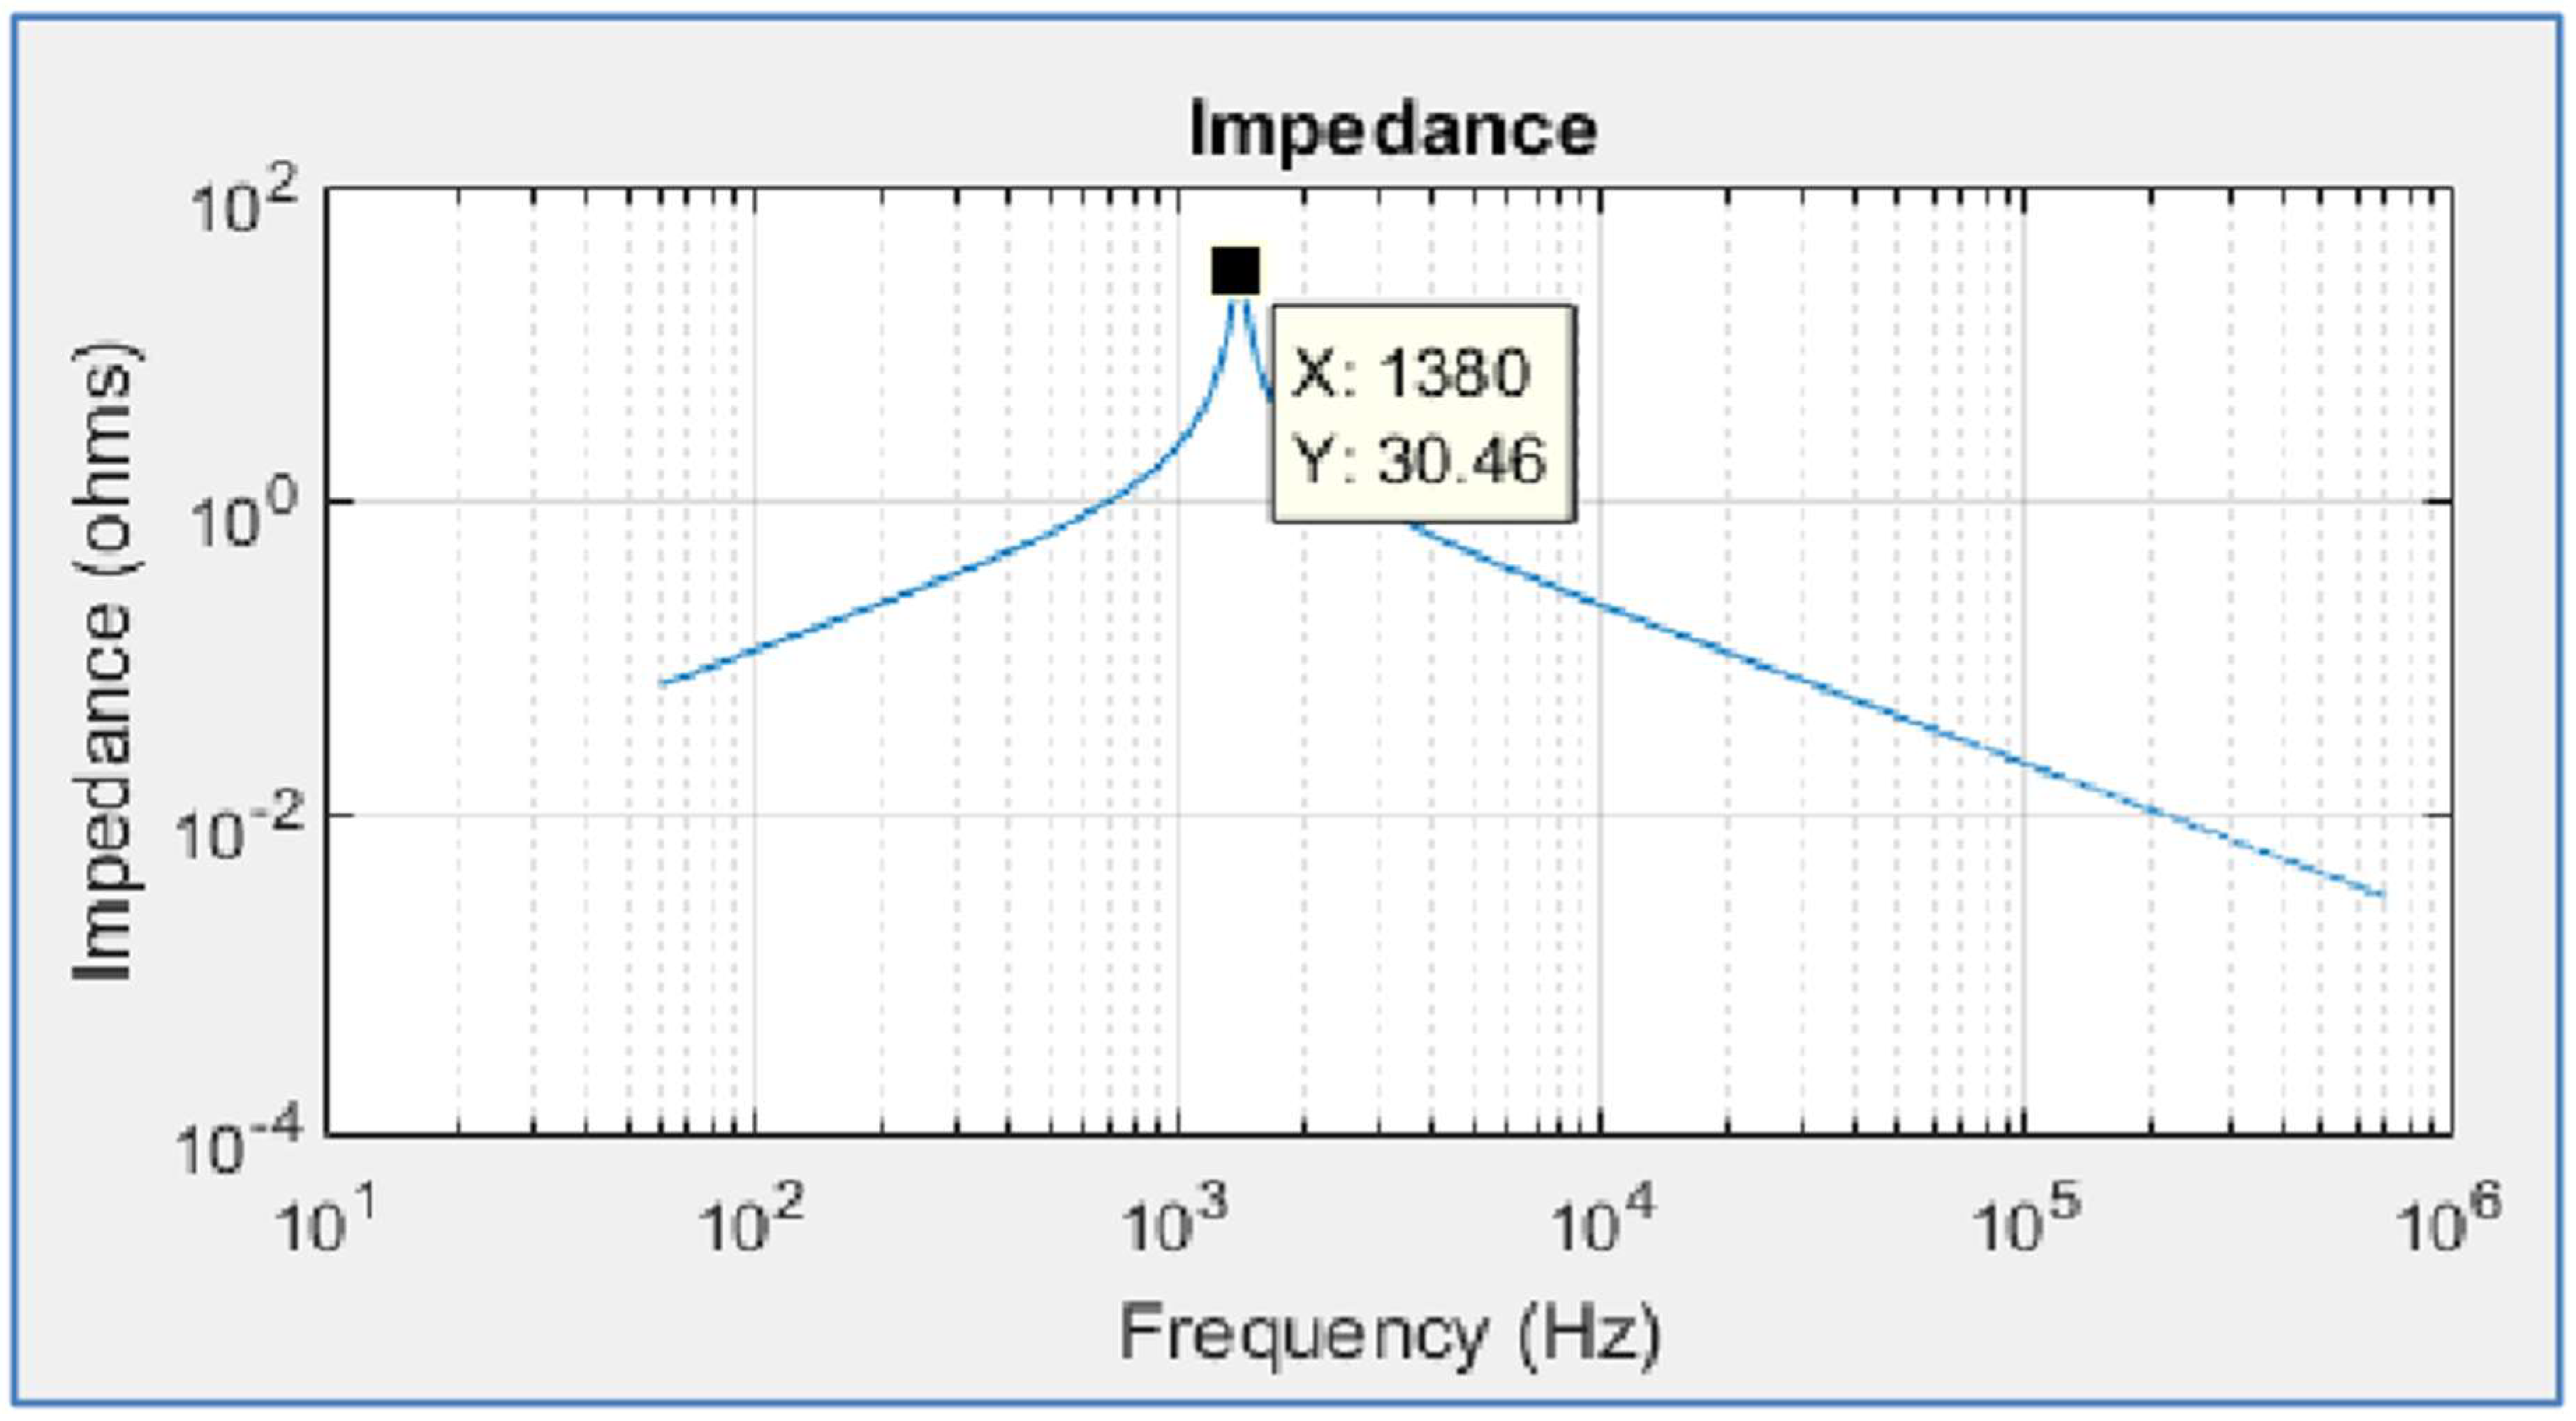
Figure 4.
Impedance on Secondary without capacitors.
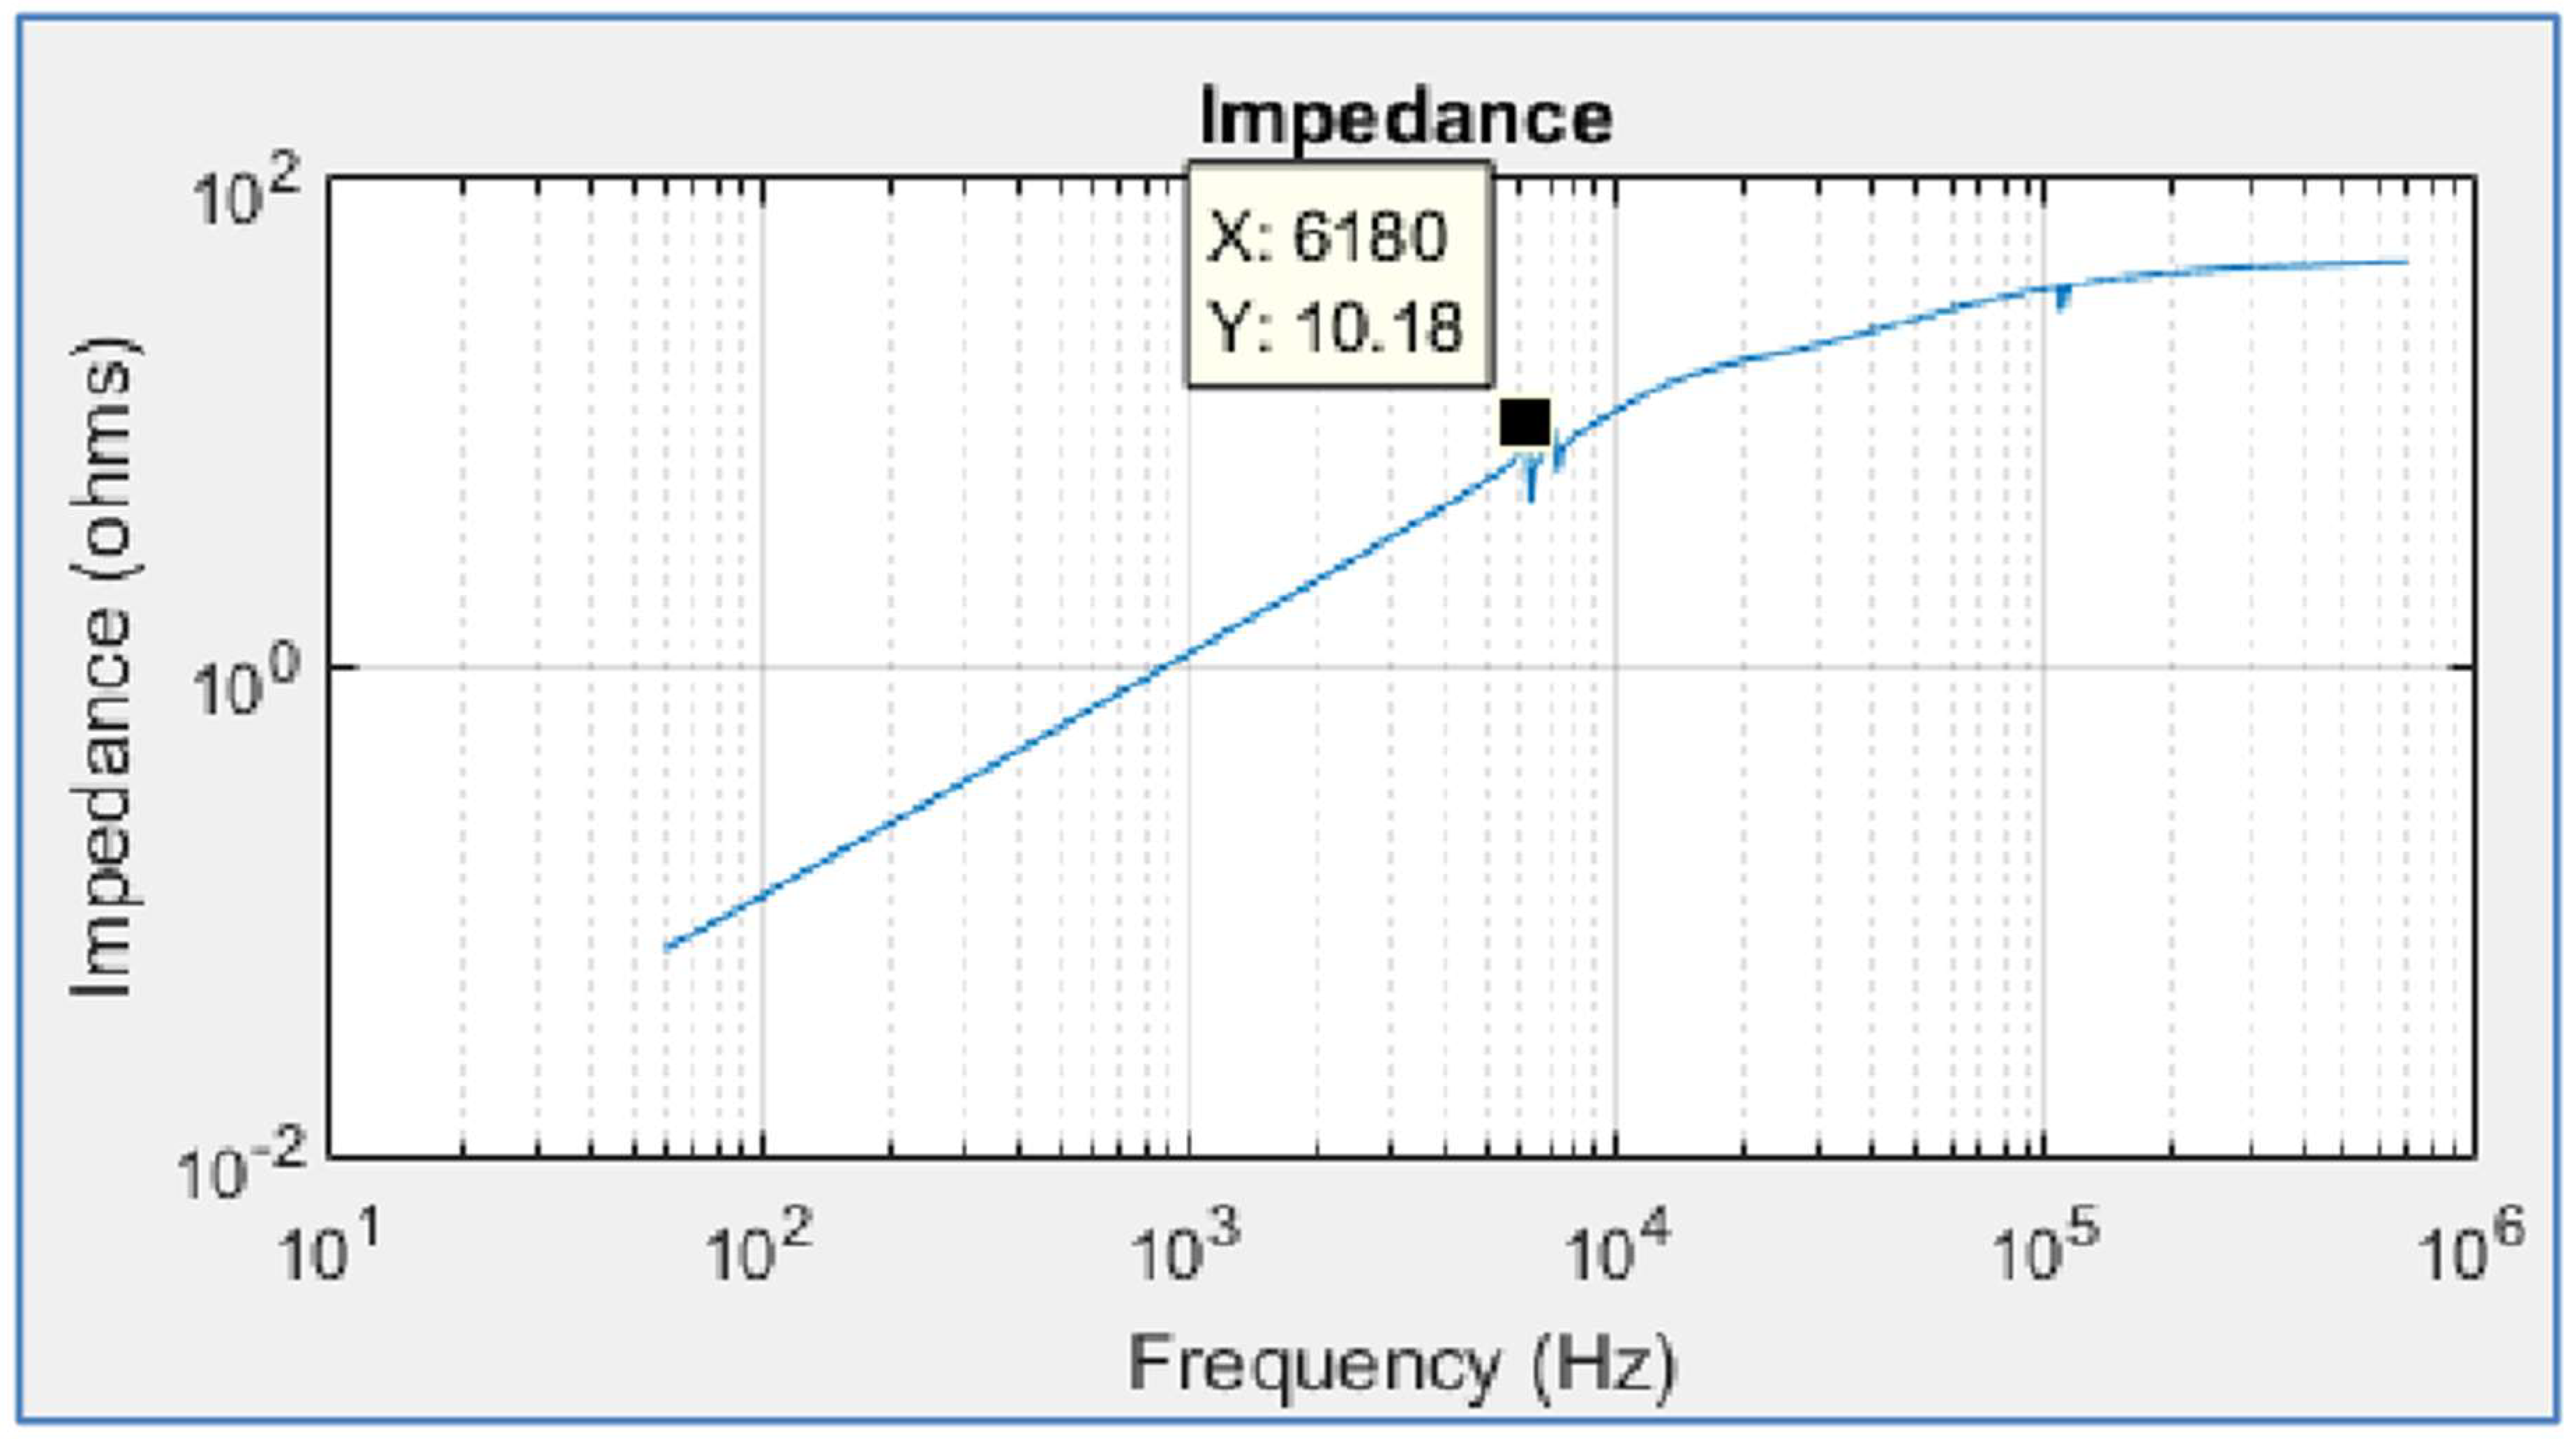
Figure 5.
Effect of capacitor bank on impedance of Secondary.
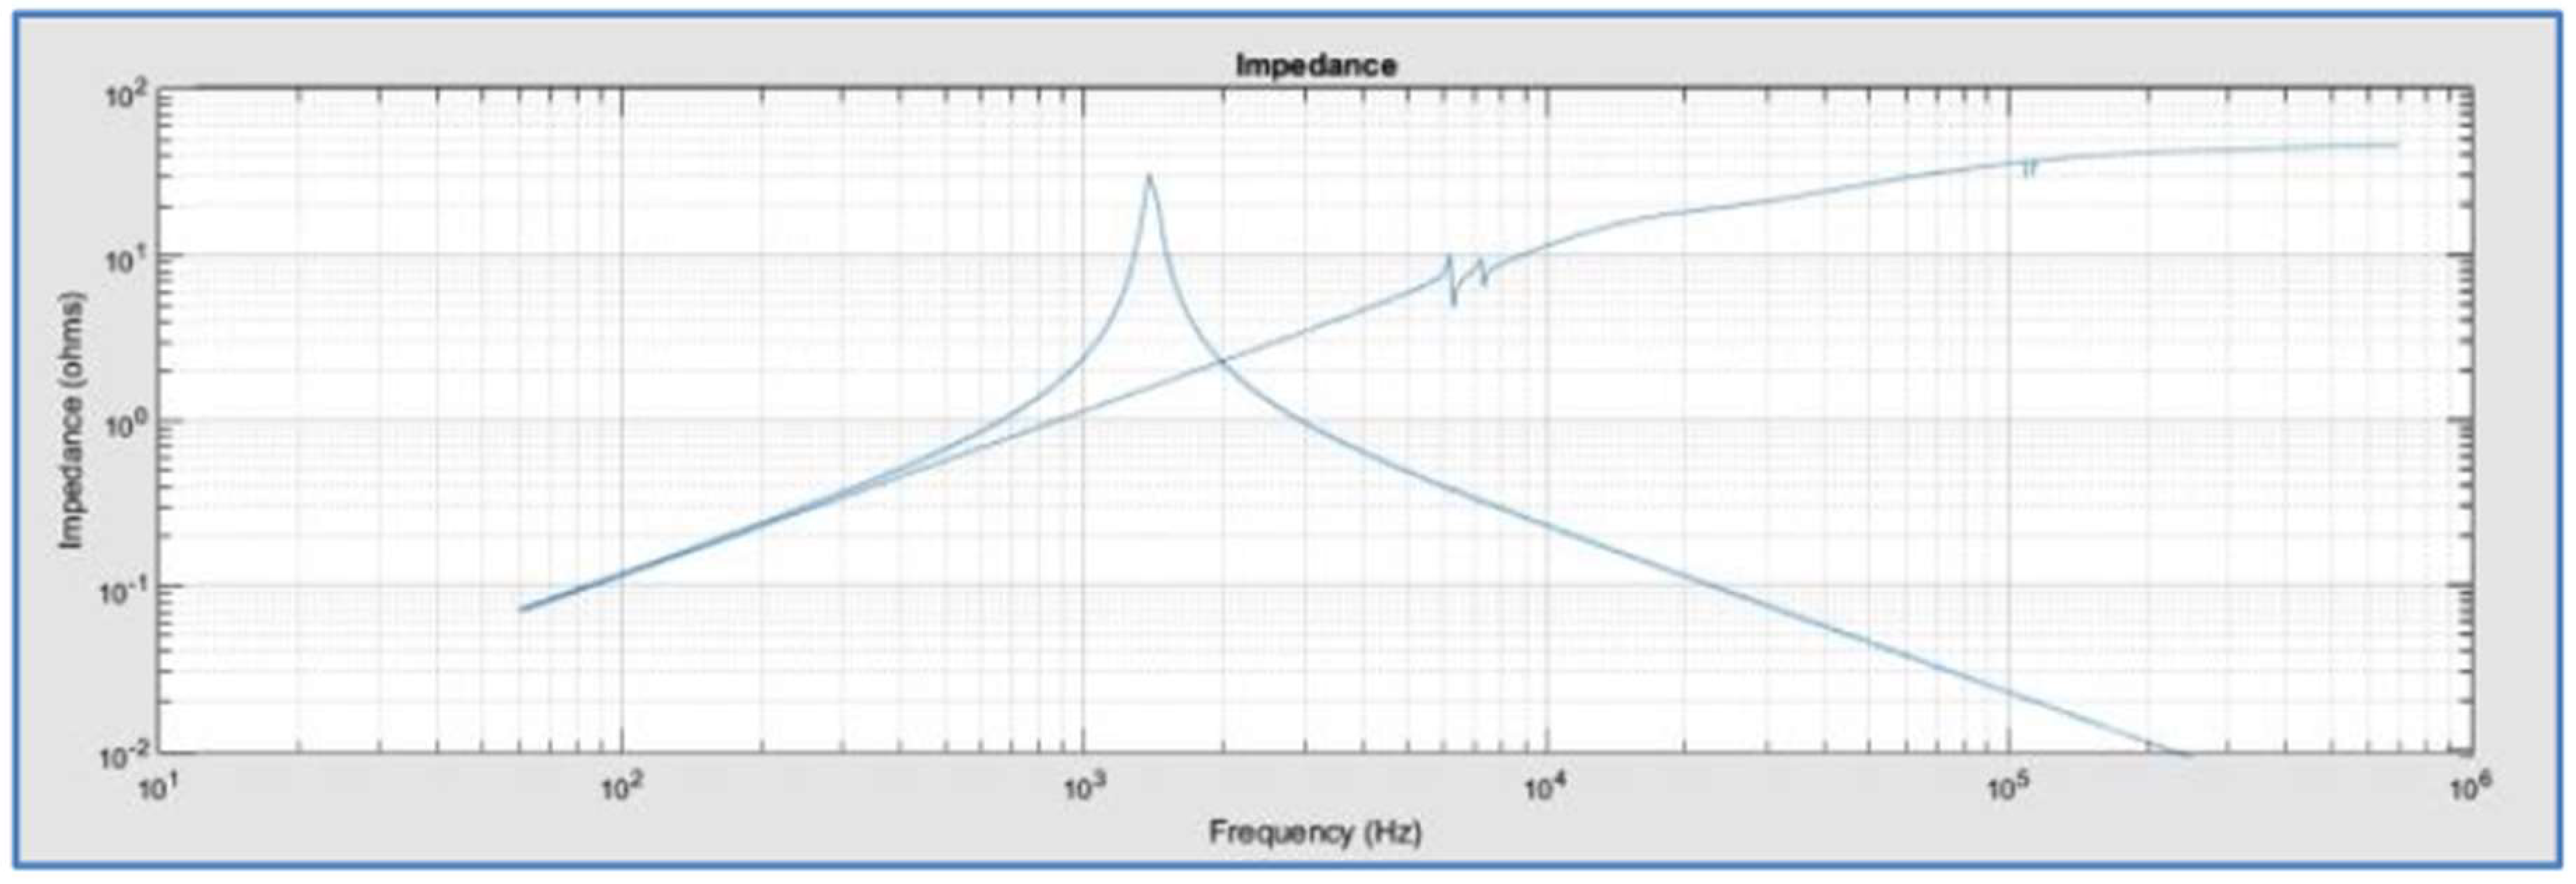
Figure 6.
Voltage Harmonic results in a pure sinusoidal voltage wave after connecting the Inverter.
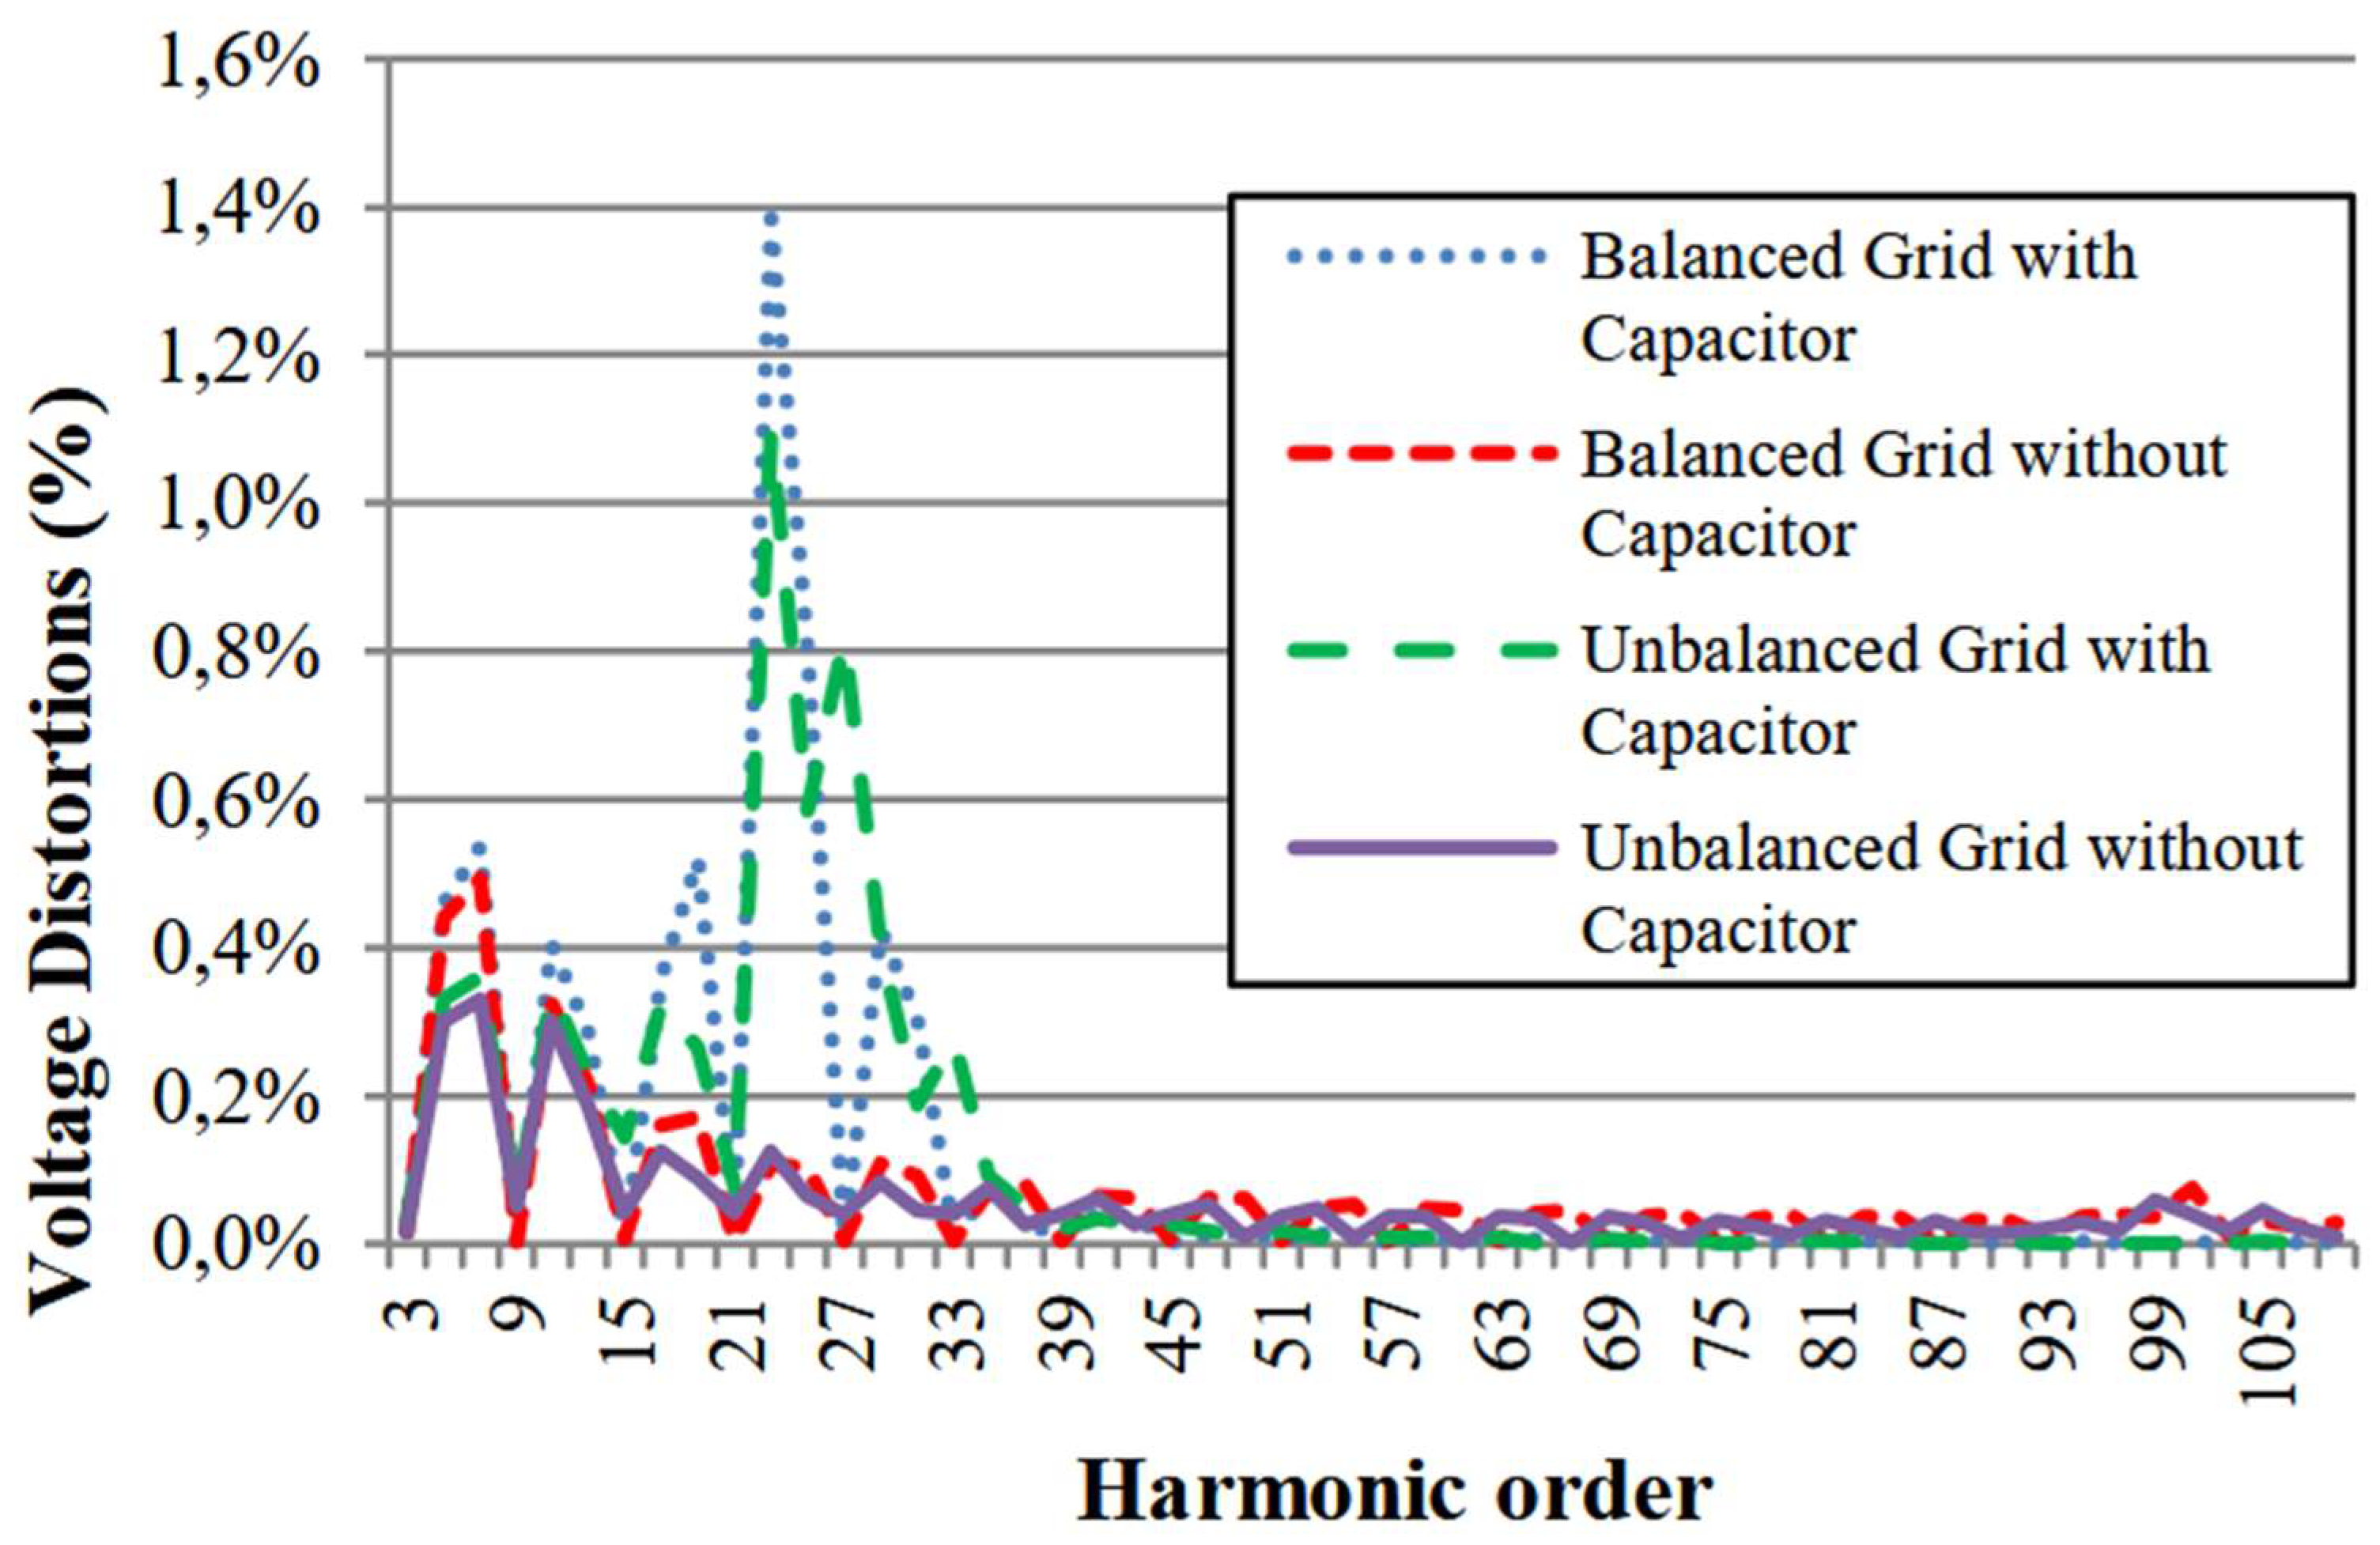
Figure 7.
Voltage harmonic results after applying 1% on 5th order.

Figure 8.
Voltage harmonic results after applying 1% on 23rd order.
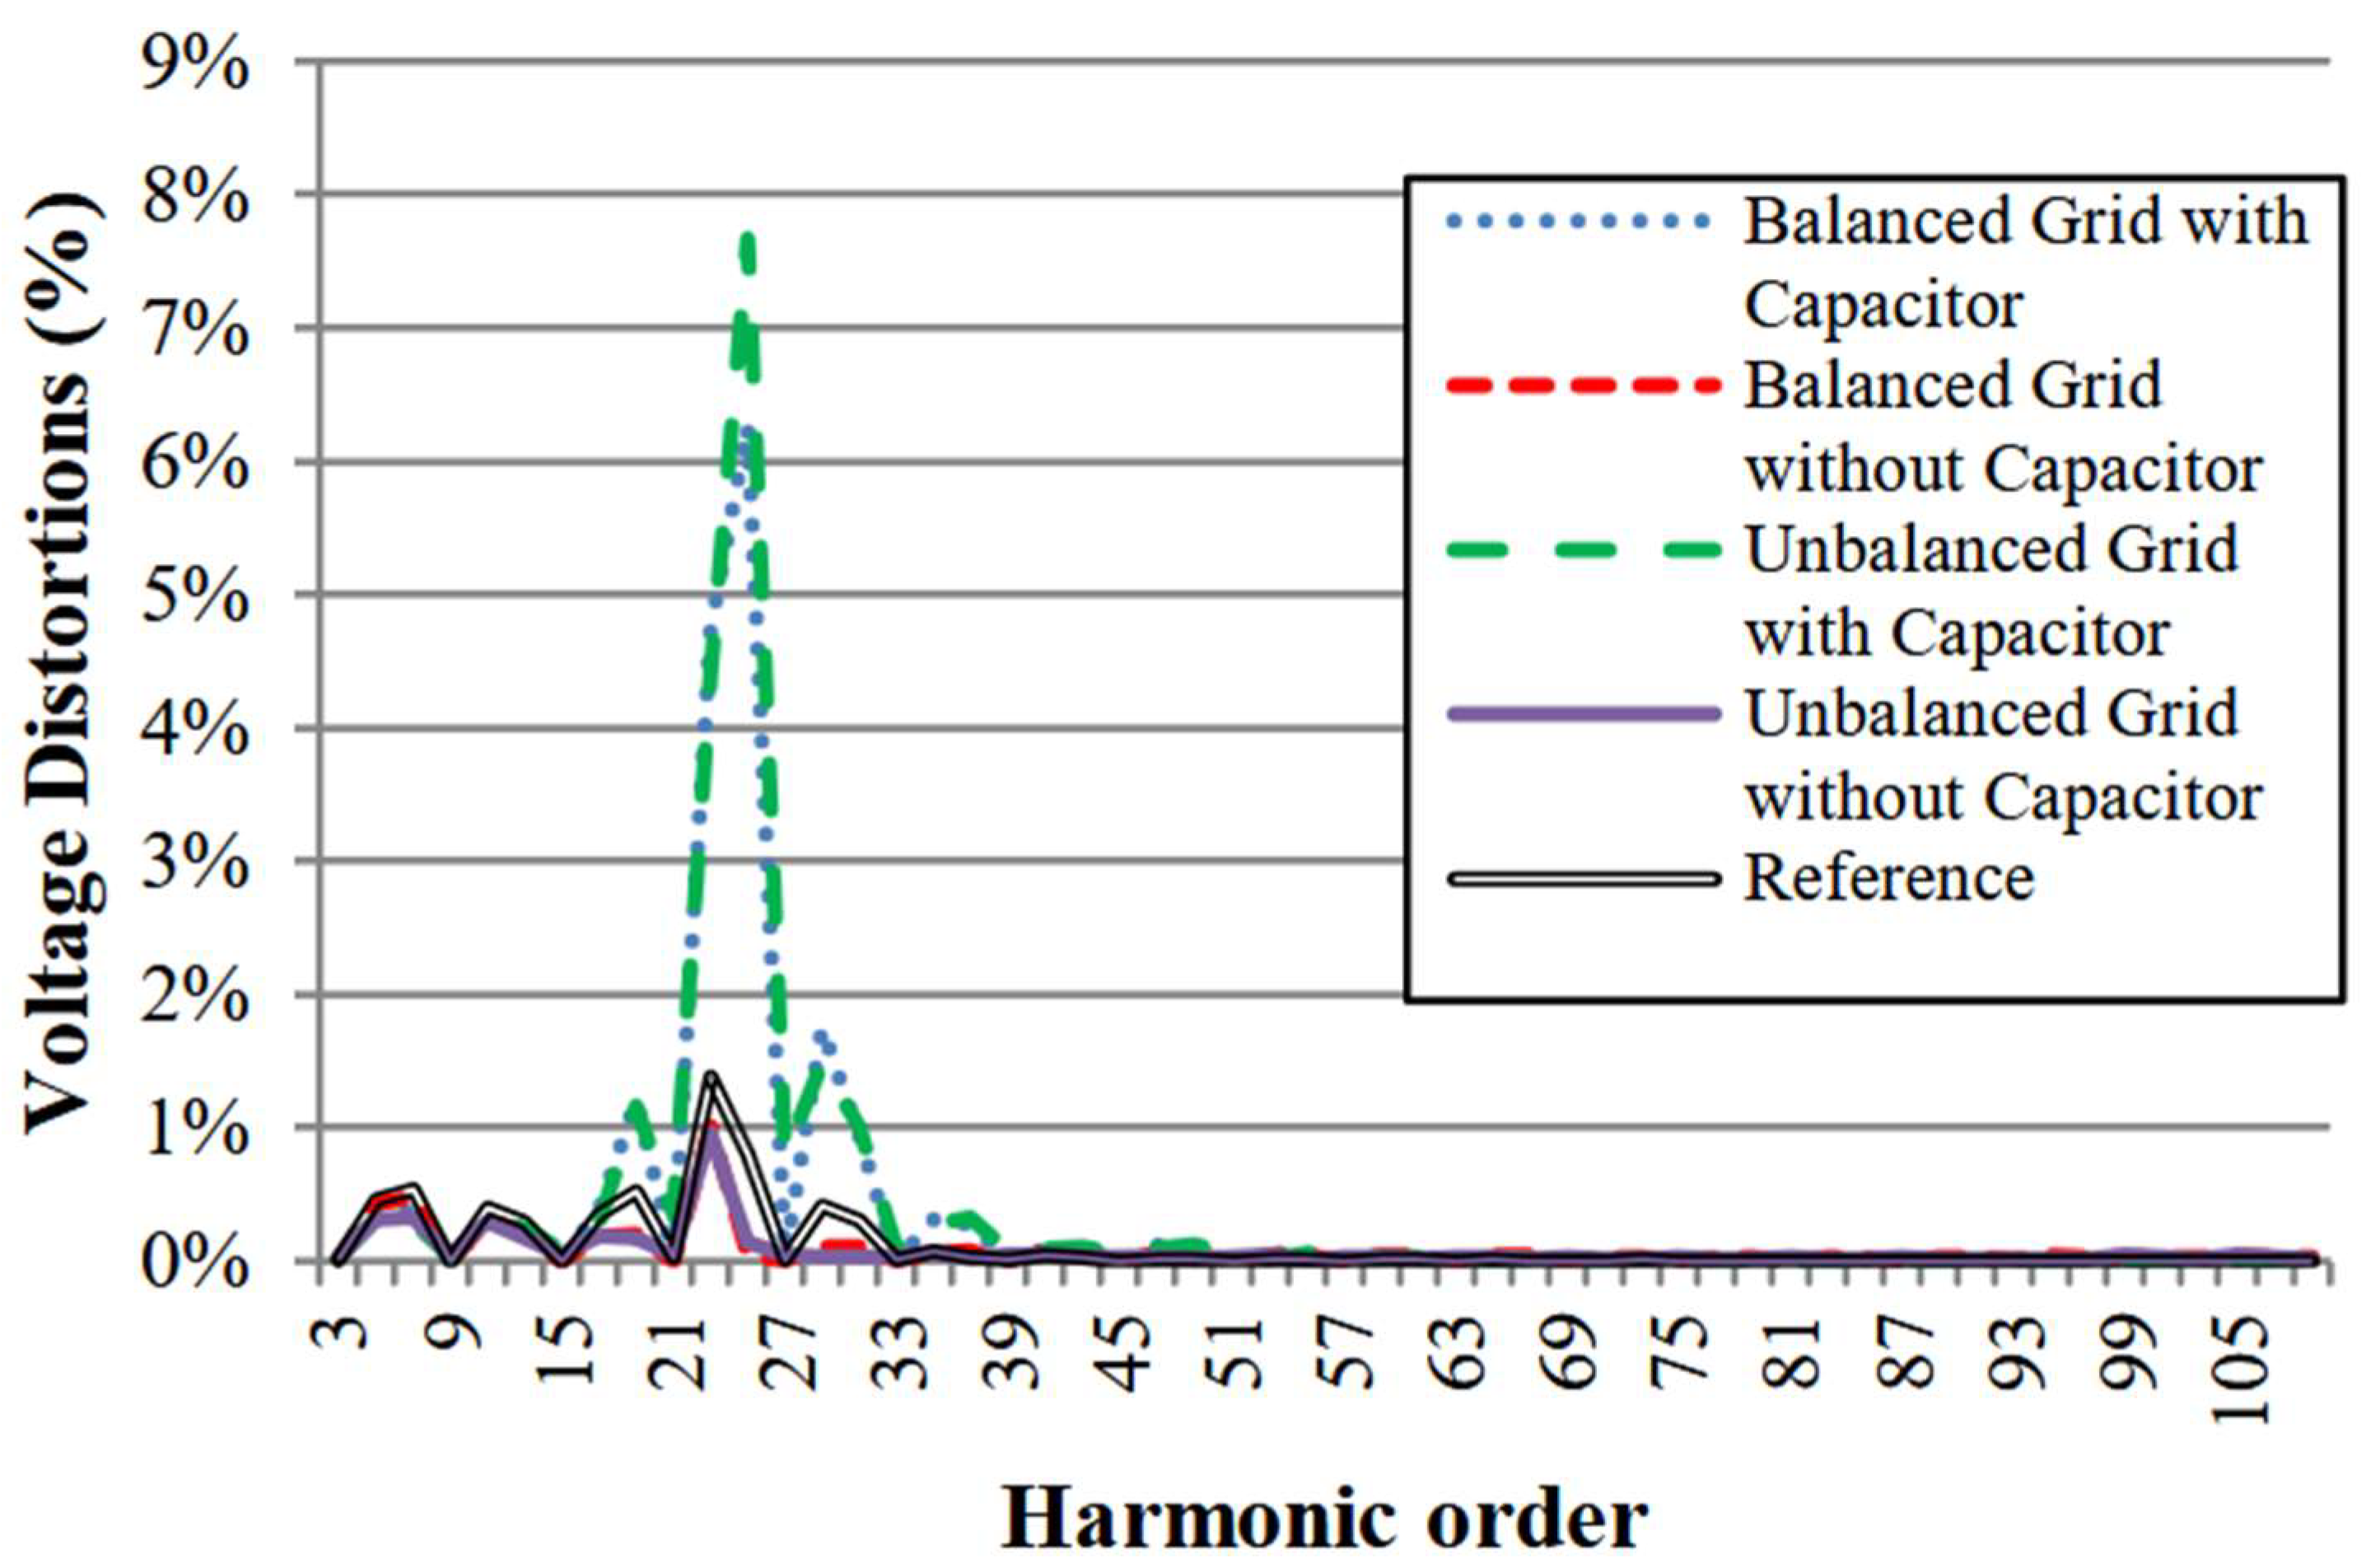
Figure 9.
Voltage harmonic results after applying 1% on 49th order.
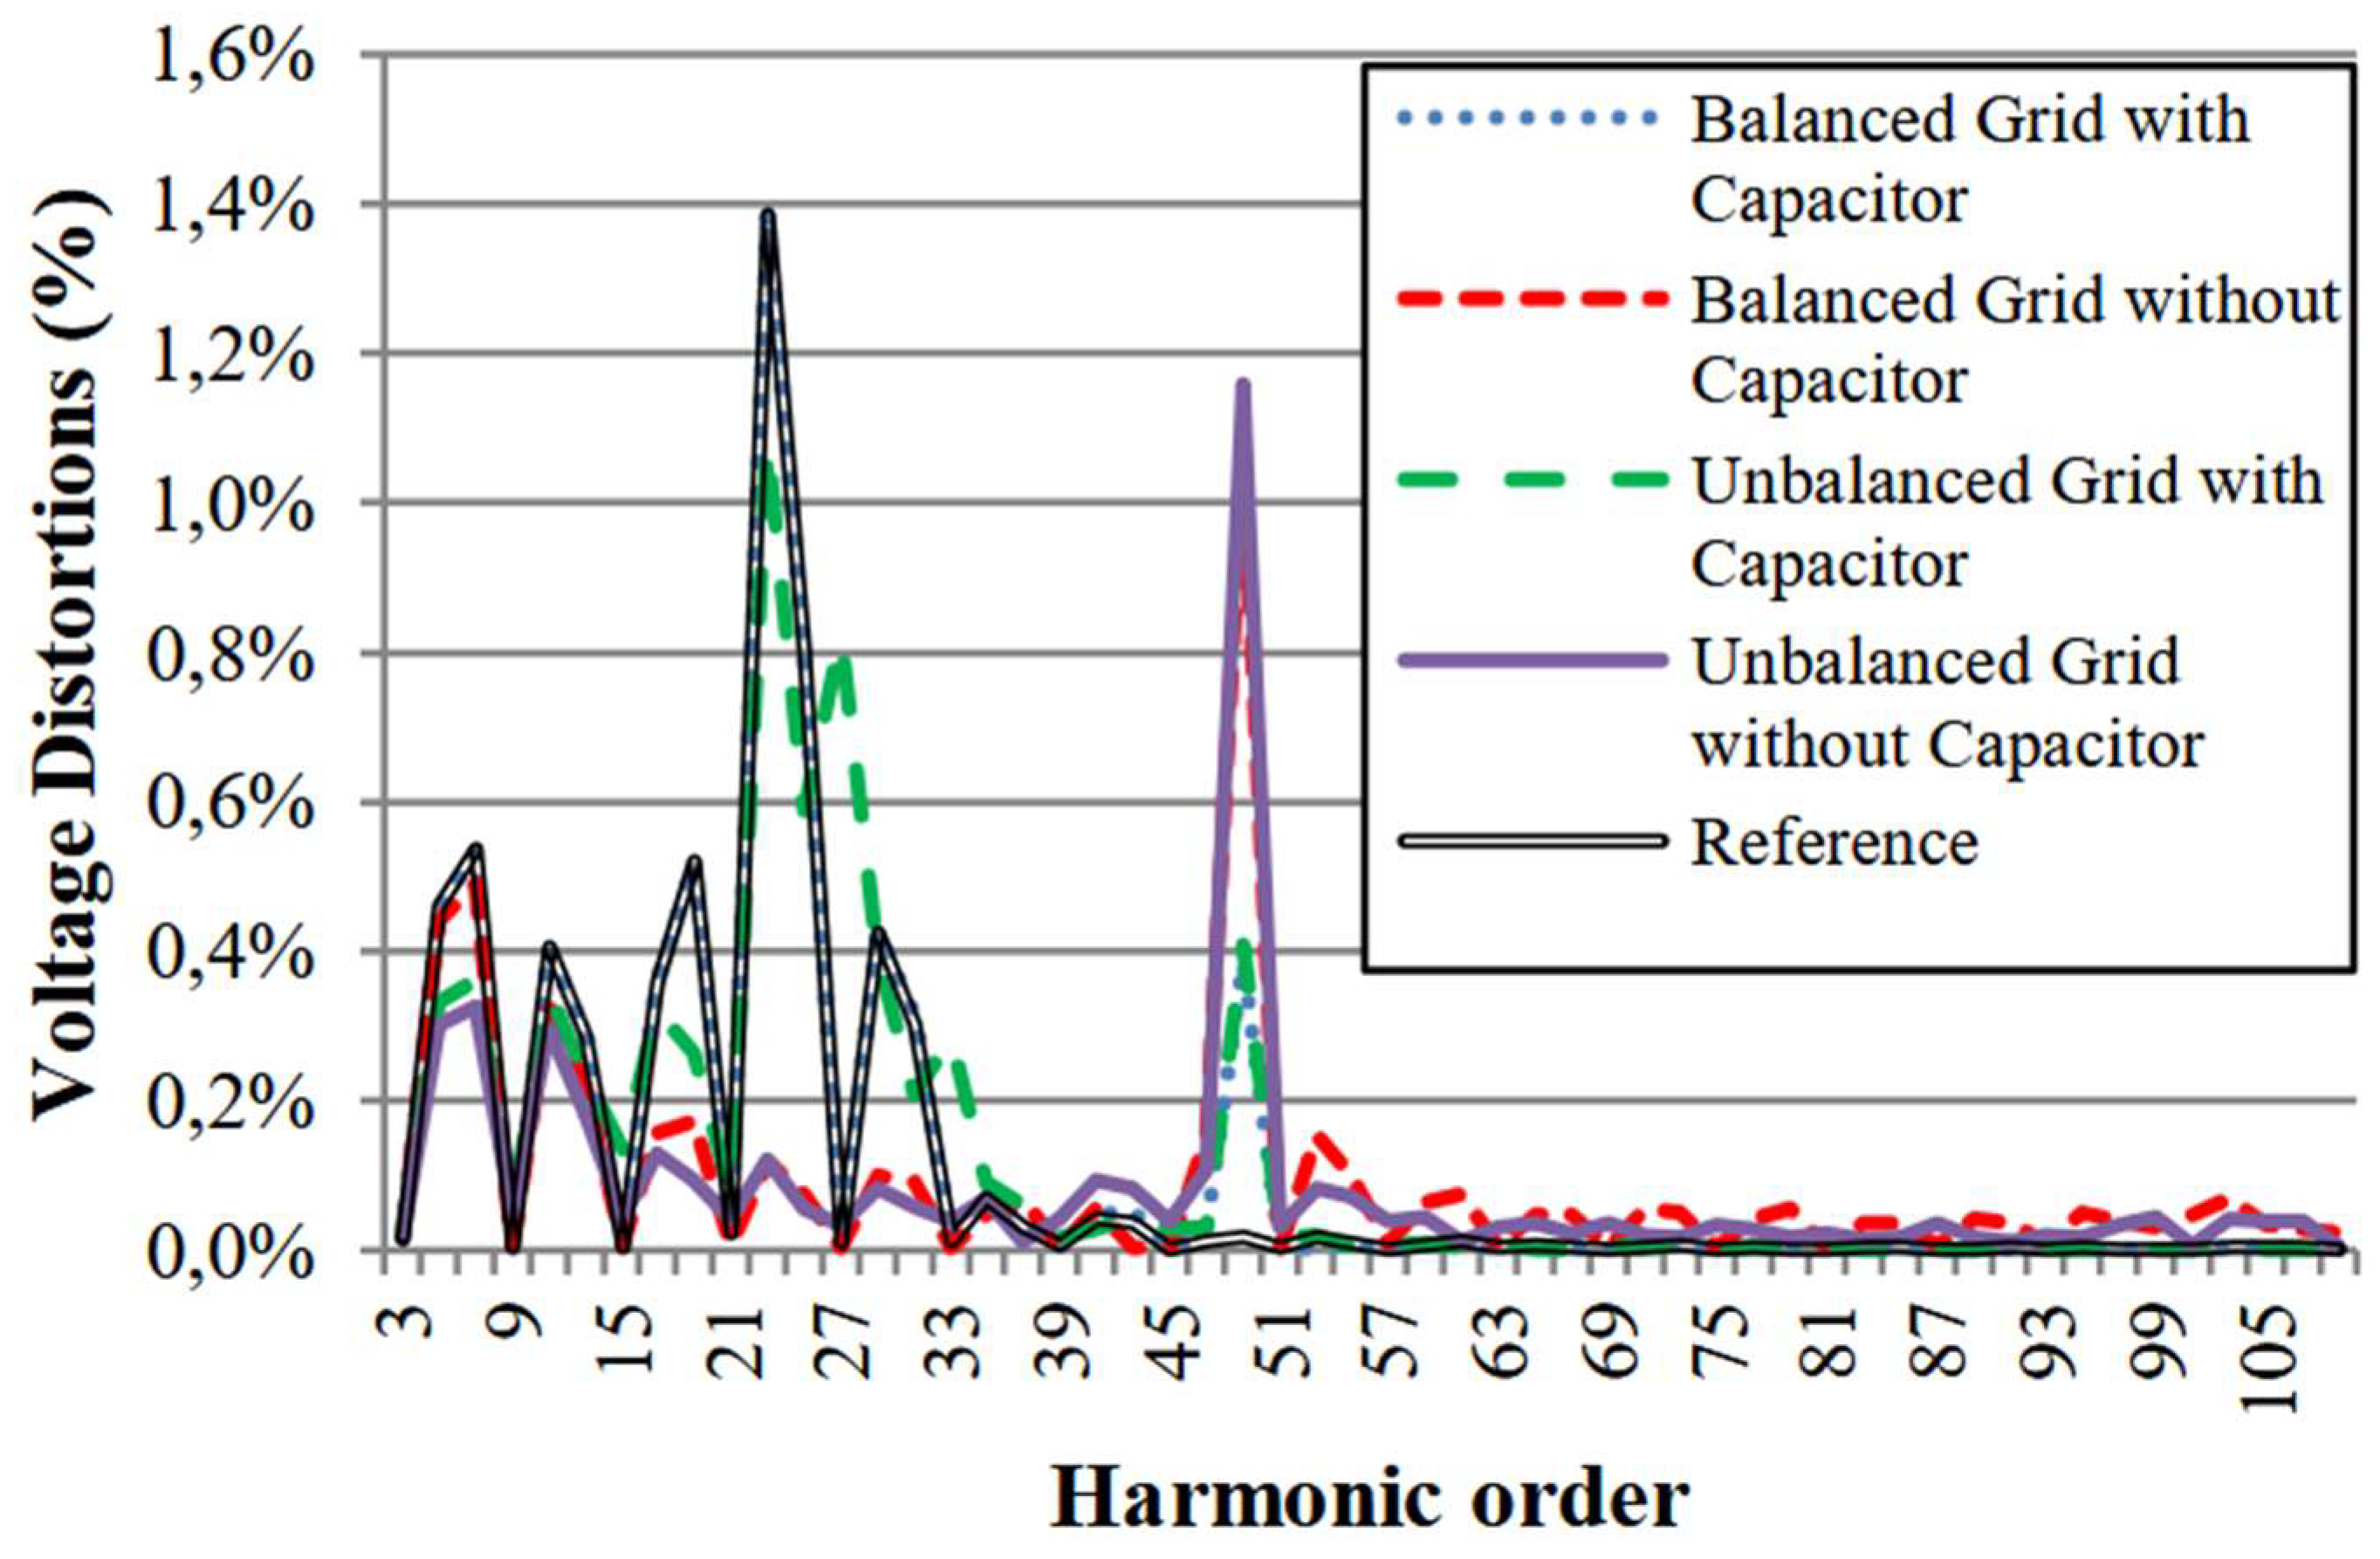
Figure 10.
Voltage Harmonic distortion after applying 1% on 103rd order.
Disclaimer/Publisher’s Note: The statements, opinions and data contained in all publications are solely those of the individual author(s) and contributor(s) and not of MDPI and/or the editor(s). MDPI and/or the editor(s) disclaim responsibility for any injury to people or property resulting from any ideas, methods, instructions or products referred to in the content. |
© 2025 by the authors. Licensee MDPI, Basel, Switzerland. This article is an open access article distributed under the terms and conditions of the Creative Commons Attribution (CC BY) license (http://creativecommons.org/licenses/by/4.0/).
Copyright: This open access article is published under a Creative Commons CC BY 4.0 license, which permit the free download, distribution, and reuse, provided that the author and preprint are cited in any reuse.


