Submitted:
30 April 2025
Posted:
06 May 2025
You are already at the latest version
Abstract
Porous PZT films offer significant potential due to tunable electromechanical properties, yet the polarization behavior remains insufficiently understood because of discontinuous morphology and domain structures. In this work we study the impact of porosity on the spontaneous polarization and electromechanical response of PZT thin films fabricated using a multilayer spin-coating technique with various concentrations (0–14%) of polyvinylpyrrolidone (PVP) as a porogen. Atomic force microscopy (AFM) and piezoresponse force microscopy (PFM) were employed to analyze the local topography, domain distribution, and polarization behavior of the films. The results indicate that increasing porosity leads to substantial changes in grain morphology, dielectric permittivity, and polarization response. Films with higher porosity exhibit a more fragmented polarization distribution and reduced piezoresponse, while certain orientations demonstrate enhanced domain mobility. Despite the decrease in overall polarization, the local coercive field remains relatively stable, suggesting structural stability during the local polarization switching. The findings highlight the crucial role of grain boundaries and local charge redistribution in determining local polarization behavior.
Keywords:
porous PZT
; piezoresponse force microscopy
; spontaneous polarization
; ferroelectric thin films
; charge lithography
; domain structure
; polarization switching
; dielectric properties
; grain boundaries
1. Introduction
Dense PZT structures offer higher mechanical strength and thermal stability, making them ideal for applications requiring durability and reliability, such as composite heterostructures [1], energy harvesting devices [2], sensor technologies[3], ultrasonic devices [4], Micro-Electro-Mechanical Systems (MEMS) [5], flexible electronics and actuators [6,7]. While BaTiO₃ was historically used in piezoelectric devices [8], PZT has become the preferred material due to its superior piezoelectric properties and higher Curie temperature, ensuring better performance in various technological applications. While the materials discussed above are typically utilized in their dense polycrystalline form, there are studies that highlight the potential applications of porous ferroelectric materials in energy technologies [9]. Porous piezoelectric ceramics [10,11], designed with controlled porosity, offer several advantages over traditional dense ceramics, including enhanced piezoelectric performance, improved mechanical flexibility, and tailored dielectric properties [12].
Local microstructural features of porous PZT piezoceramics significantly impact their mechanical performance for practical applications, but by employing a multiscale regulation strategy, a well-balanced mechanical performance in PZT piezoceramics have bee successfully achieved [13]. In particular, the gradient porous structure of PZT ceramics has been demonstrated to significantly improve both mechanical and piezoelectric properties, which are essential for energy harvesting applications [14,15]. The strategic alignment of porosity within PZT ceramics was found to enhance the pyroelectric and piezoelectric properties, thereby increasing their efficiency in various technological applications [16].To optimize these properties, the introduction of an organic polymer (or porogen) is proposed as a viable approach. During annealing, the porogen undergoes decomposition, leading to the formation of a porous structure. Various porogens, such as polyethyleneimine [17], polyvinylacetamide [18], polyethylene glycol [19], and polyvinylpyrrolidone (PVP) [20,21], have been used for this purpose. Another promising method is the fabrication of porous PZT ceramics using micro-stereolithography technology, which allows for high-precision control of the microstructure and, as a result, improves the mechanical and electrical properties of the material [22]. The resulting pores in these materials can be either open or closed. By adjusting the porogen concentration, the pore size can be controlled, which in turn affects the final properties of the functional material [23]. Currently the investigating the influence of structural porosity on the piezoelectric properties of films, as well as examining the relationship between the porogen parameters and the resulting pore characteristics in the films is an urgent and crucial task in this direction of studies. Understanding these dependencies will enable the prediction of film quality prior the fabrication. Compared to traditional dense films, porous films offer several advantages. Firstly, increased porosity enhances the surface area and film thickness [24,35]. However, depending on the geometry and number of pores, the ferroelectric properties of the material may also be altered [25-27,35]. Additionally, due to their high energy density and enhanced conversion efficiency, porous ferroelectric materials can outperform electromagnetic generators, particularly in compact and miniaturized systems [28]. Ferroelectric materials can also be used as sensors to detect force, pressure, and acceleration through the piezoelectric effect, as well as heat through the pyroelectric effect [3]. One key advantage of piezoelectric sensors is that they do not need an external power source, allowing them to function as “self-powered sensors.” In recent years, porous ferroelectric composite materials have gained significant attention in sensing applications due to their high piezoelectric voltage coefficient and excellent mechanical flexibility. These materials have shown great potential in wireless sensors [29], high-performance hydrophones [30], and strain measurement [31].
In this work, by using atomic force microscopy (AFM) and piezoresponse force microscopy (PFM) methods we investigate the performance of PZT thin films via studying the surface morphology and local piezoelectric properties in the presence of porogen polyvinylpyrrolidone (PVP).
2. Materials and Methods
The Pb(Zr0,48Ti0,52) O3 (PZT) films were deposited on Si-SiO2-TiO2-Pt substrates using a multilayer deposition method from precursor solutions with a 15% Pb excess and the addition of 0–14% polyvinylpyrrolidone (PVP) with a molecular weight of 360000. The initial data for the studied series are presented in Table 1.
For the preparation of PZT film-forming solutions, dry lead acetate was used, synthesized from PbO following the methodology described in [32]. Zirconium isopropoxide (99.9%, Aldrich) and titanium isopropoxide (99.999%, Aldrich) were used without additional purification. The Zr/Ti ratio was maintained at 48/52.
To compensate for PbO loss during annealing, an excess of 14 mol.% Pb was added to the film-forming solution relative to the stoichiometric composition. Polyvinylpyrrolidone (PVP) (C₆H₉ON)n with a molecular weight of 360,000 was used as the porogen. Various amounts of PVP, ranging from 1 to 14 wt.%, were added to the initial (matrix) PZT solution (Table 1).
The PZT films were deposited layer by layer to achieve the required thickness using a spin-coating method on platinum-coated substrates with the following structure: Si-SiO₂ (300 nm)-TiO₂ (10 nm)-Pt (150 nm) (Inostek, Korea). Each deposited layer was dried using an IR lamp at approximately 200°C for 5 minutes (soft drying) and annealed at 400°C for 10 minutes to remove organic residues. After applying the final layer, the PZT films were crystallized at 650°C for 15 minutes.
3. Results and Discussion
3.1. Analysis of Local Surface Morphology Using AFM
The effect of polymer porogen concentration on PZT film topography was analyzed using commercial atomic force microscope (Ntegra Prima, NT-MDT) equipped with NSC15/Pt (resonance frequency 325 kHz, spring constant 40 N/m, MikroMasch) and also employed in piezoresponse force microscopy (PFM) mode for the study of local piezoelectric properties [33]. For this, an external voltage in the range of ±10 V was applied to the cantilever, while the sample structure remained grounded.
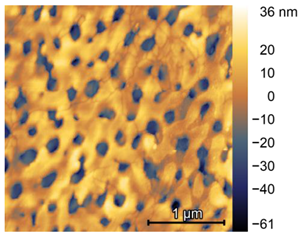
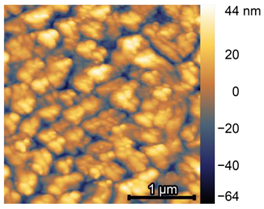
The analysis of PZT film topography with varying polyvinylpyrrolidone (PVP) concentrations revealed significant structural transformations depending on the porogen content (Table 2). The 0% PVP sample exhibited a granular surface morphology with a maximum grain height of 18 nm and an average grain boundary width of 15 nm. Porogen particles, highlighted in Table 2, ranged from 10 to 20 nm. With the addition of 1% PVP, the maximum surface height decreased to 15 nm, while the grain boundary width increased to 35 nm. Porogen particles remained present, with some reaching heights of up to 40 nm. Additionally, the formation of surface pores was observed, with an average depth of 20 nm and widths varying between 50 and 100 nm. At 3% PVP, the average grain boundary width increased to 40 nm, with a higher concentration of pores compared to the 1% PVP sample. With 6.6% PVP, the grain boundaries were almost entirely disrupted, leading to the formation of larger grains with heights ranging from 60 to 100 nm and widths reaching approximately 300 nm. Finally, at 14% PVP, the film exhibited a fine-grained structure, where grain boundaries were completely destroyed. The characteristic grain sizes varied from 30 to 70 nm in height and 100 to 300 nm in width. These findings indicate that an increasing PVP concentration leads to progressive microstructural changes, transitioning from a well-defined granular morphology to a more porous and fine-grained structure.
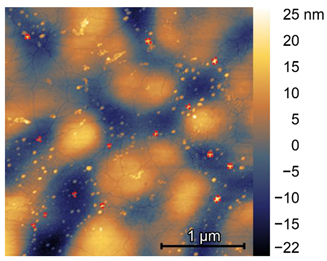
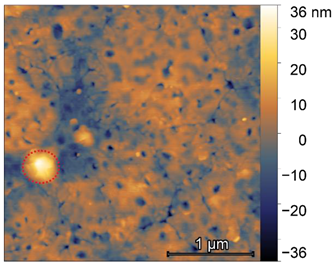
A quantitative assessment of the average topography values was then performed based on three key criteria: average roughness, root mean square (RMS) roughness, and the area occupied by pores. The average roughness (Sa) represents the arithmetic mean deviation of the surface profile, while the RMS roughness (Sq) reflects the root mean square deviation of surface heights from the mean plane. To calculate the air phase area (As) within the analyzed sample region, the average height level of the topography was first determined. Then, all areas below this level were identified, and their total surface area was measured. The results of the structural topography analysis are summarized in Table 3.
The data analysis reveals distinct trends in surface roughness and porosity as a function of PVP concentration. The average roughness (Sa) for the 0% PVP sample is 5.28 nm. With an increase in PVP concentration to 1%, Sa decreases to 4.25 nm. However, at 3% PVP, the roughness significantly rises to 10.31 nm. Further increasing the PVP concentration to 6.6% and 14% results in even higher roughness values of 16.38 nm and 16.03 nm, respectively. The root mean square roughness (Sq) follows a similar trend. For the 0% PVP sample, Sq is 6.56 nm, decreasing to 5.55 nm at 1% PVP. However, with 3% PVP, Sq sharply increases to 13.49 nm. At 6.6% and 14% PVP, it reaches its highest values of 20.10 nm and 20.05 nm, respectively. The air phase area (As) also exhibits significant changes with increasing PVP concentration. In the 0% PVP sample, As is minimal and close to the sensitivity threshold of the instrument. When the PVP concentration is increased to 1%, As expands to 0.506 μm². In the 3% PVP sample, it grows further to 1.624 μm². For 6.6% and 14% PVP, As reaches 2.619 μm² and 1.637 μm², respectively. These results clearly demonstrate how PVP concentration influences the surface topography of the films. As the polymer content increases, both average and RMS roughness rise, alongside a significant expansion in pore-covered surface area. This indicates the formation of a more porous and irregular structure, which directly affects the functional properties of the material.
In Park et al. [34] and Choi et al. [35], PZN–PZT films with a 60/40 composition were fabricated via sol–gel processes using PVP and 1,3-propanediol as additives. In both studies, an optimal Pb:diol ratio of 1:10 and a controlled pyrolysis temperature of 250 °C were employed. This approach yielded dense, crack-free films with a thickness of approximately 1 μm and a strong (100) preferred orientation (around 90%). SEM analysis in these works revealed that the optimized films possess a smooth surface with large rosette-like grains and a columnar cross-sectional structure containing only very small nanosized pores (≈5% by volume). Ferroelectric measurements (P–E hysteresis loops) and the evaluation of the effective d₃₃ coefficient (≈70 pC/N) confirmed that these films exhibit excellent ferroelectric and piezoelectric properties—comparable to or even slightly exceeding those of films prepared by conventional multilayer sol–gel methods. In Rodríguez-Aranda et al. [36], PZT films fabricated by the sol–gel acetic acid route also display a relatively uniform surface morphology. SEM and AFM studies show grain clusters with a characteristic size of approximately 400 nm and very low surface roughness (1.2–1.6 nm), reflecting excellent film densification and optimal grain growth achieved through efficient nucleation and crystallization. In contrast, our samples—with increased porosity achieved by higher PVP concentrations—exhibit a more inhomogeneous and fragmented domain structure, accompanied by higher surface roughness and larger pore areas. These microstructural modifications can adversely affect the uniformity of the piezoelectric response. Moreover, the dense, columnar films reported by Nguyen et al. [37] demonstrate a stable, preferentially oriented domain structure that ensures a more uniform distribution of electrical properties and superior performance.
3.2. Analysis of Local Piezoelectric Hysteresis Loops Using PFM
To perform PFM measurements, samples with 0%, 6.6%, and 14% PVP were selected. The 0% PVP sample was chosen as the most densely packed structure, as it was expected to exhibit the most uniform response. In contrast, the 6.6% and 14% PVP samples, due to their unique pore distribution, were anticipated to demonstrate distinct local properties compared to dense structures with the same chemical composition [38]. The PFM method was also being employed to obtain and analyze the distribution of the local piezoelectric hysteresis loops on the samples surfaces. During scanning, two signals were recorded: cantilever deflection from its initial position, which characterized piezoelectric deformation in response to the applied field (the magnitude of PFM signal), and the shift in cantilever vibration frequency relative to the lock-in detector frequency, indicating the direction of deformation (the phase of PFM signal). The phase signal was used to determine polarization, as in ferroelectric structures, there is a direct linear correlation between piezoelectric deformation and polarization. This method provided insight into the local piezoelectric properties of the samples and how they are influenced by the presence of porosity and structural heterogeneity.
Figure 1 presents the local piezoelectric hysteresis loops for the 0% PVP sample. Figure 1(a) illustrates the scanned area, where different colors indicate contact regions between the probe and the surface of the structure. To ensure experimental accuracy, various grains were selected, with their boundaries marked by white dashed lines. Figure 1(b,c) depict the piezoelectric deformation response and polarization distribution as functions of the applied electric field, respectively. The colors of the curves correspond to the colored squares in the topography image. The results indicate that the dense 0% PVP sample exhibits piezoelectric responses that are consistent within the measurement uncertainty, suggesting that the material properties remain uniform across different grains. This confirms the expected homogeneity of the dense structure, where the absence of pores minimizes local variations in electromechanical behavior.
In Figure 2(a), the surface is clearly composed of multiple grains, indicating a significant structural transformation compared to the dense 0% PVP sample. These changes in microstructure also introduce distortions in the piezoelectric response dependencies, as observed in Figure 2(b,c). Notably, the phase signal hysteresis loop at Point 1 (red line) exhibits a directional change compared to other measurements on this sample, suggesting local variations in ferroelectric behavior. Furthermore, the cantilever deflection due to piezoelectric deformation at Point 1 reaches 3 nm, the highest recorded value, whereas in other cases, the deflection remains below 1 nm.
The surface of the 14% PVP sample consists of distinct, well-defined grains, as shown in Figure 3(a). The local piezoelectric hysteresis loops results indicate that the deformation response at Points 1–3 is comparable to that of the dense 0% PVP sample, although slightly lower in magnitude. In contrast, the responses at Points 4 and 5 are more similar to those observed in the 6% PVP sample, as shown in Figure 3(b). The polarization hysteresis loops exhibit a similar trend across different measurement points, except for Point 5, where an anomalous response is detected. The change in the loop shape at this location is associated with a low piezoelectric deformation response, below 0.5 nm, which is also observed at Points 4 and 5. However, the mirrored loop reversal, previously identified in the 6% PVP sample, is only present at Point 5 in this case, as shown in Figure 3(c). These results suggest that at higher PVP concentrations, the material develops localized electromechanical variations, where some regions retain characteristics of a denser structure, while others behave similarly to more porous configurations.
Changes in the magnitude and direction of the polarization hysteresis loops under the applied field were observed exclusively in the 6.6% and 14% PVP samples. The piezoelectric deformation loops of the dense material showed significant differences compared to Points 2–5 in the 6.6% PVP sample and Point 5 in the 14% PVP sample. However, certain cases exhibited no loop reversal (e.g., Point 4 in the 14% PVP sample), yet a more than tenfold reduction in the piezoelectric deformation signal was still observed. These results suggest that at higher PVP concentrations, the structural modifications—particularly the redistribution of charge transport pathways and grain boundary effects—strongly influence the local electromechanical response.
3.3. Analysis of Spontaneous Polarization Distribution Using PFM
The mapping of spontaneous polarization distribution was performed by applying an alternating electric field to the probe. The study focused on probing the z-component of the signal, meaning only the normal polarization distribution relative to the surface was recorded (out-of-plane PFM). In Figure 5, Figure 6, Figure 7, Figure 8 and Figure 9 (a, b), the red and blue regions represent two opposite polarization states in the examined ferroelectric films. The blue color indicates a displacement directed outward from the surface, while the red color corresponds to a displacement directed into the film. The white areas in the images represent regions where the beam oscillation phase matches the frequency of the detector oscillations, suggesting minimal or no local polarization contrast.
The predominance of the blue color in the initial polarization state, observed before the polarization process, indicates that negatively polarized domains dominate over positively polarized ones. To modify the polarization distribution profiles, charge lithography was employed. During this process, voltages of opposite polarity were applied to the left and right sides of the mask. As a result, within the masked area, a red region was induced by the application of a positive voltage, while a blue region emerged due to the application of a negative voltage. This demonstrates the reversibility of polar states under the influence of an external electric field. The external areas in the images represent the initial piezoresponse of the films before polarization modification, highlighting the contrast between the pristine and electrically manipulated states.
The modification of ferroelectric materials inevitably leads to changes in their polarization characteristics. This effect was previously demonstrated in the topography analysis, where the addition of polymer altered the material's surface morphology. For further analysis of the polarization images obtained using PFM, the scanning data from the polymer-free sample are used as a reference standard. These baseline measurements serve as a benchmark for comparison and normalization of the polarization response before and after the repolarization process. By utilizing this approach, it is possible to quantify the influence of polymer-induced porosity on the local polarization states and assess how structural modifications affect the ferroelectric switching behavior.
Figure 5(a) presents the piezoresponse mapping of the polymer-free sample, showing the initial polarization state across the surface. The corresponding image in figure 5(b) demonstrates that the structure undergoes effective repolarization in accordance with the applied charge lithography mask. To further assess the polarization state before and after repolarization, a cross-sectional analysis along the entire scan width was performed (figure 5(c)). Despite the presence of surface irregularities, the results indicate that these variations do not significantly affect the polarization process. Although PFM cannot directly determine the absolute polarization vector orientation, it enables the calculation of frequency shifts in cantilever oscillations relative to the lock-in detector frequency during scanning. This provides insight into the direction of deformation—either inward or outward—relative to the surface normal. Due to the inverse relationship between piezoelectric deformation direction and the polarization vector, these measurements allow for the effective evaluation of polarization distribution. Based on the cross-sectional analysis, the maximum polarization response was determined to be 127° for the positive orientation and 33° for the negative orientation.
As previously noted, the introduction of 1% PVP results in the formation of pores on the sample surface. Figure 6(a) presents the spontaneous polarization distribution map for the 1% PVP sample, illustrating the altered domain structure compared to the dense reference sample. The piezoresponse mapping for negative segments appears fragmented, with a noticeable lack of strong alignment with the charge lithography mask (figure 6(b)). This suggests that the presence of porosity disrupts the uniformity of polarization switching, likely due to local charge trapping or altered domain wall motion. A significant reduction in the maximum polarization response is observed in this sample. The maximum response for positive polarization is measured at 51°, which is 2.5 times lower than in the reference (polymer-free) sample. Similarly, the response for negative domains also decreases, reaching only 13°, as shown in figure 6(c). These findings indicate that even a small concentration of PVP (1%) significantly affects the polarization behavior, weakening the piezoresponse and reducing the effectiveness of domain reorientation under an external electric field.
The total porosity of the 3% PVP sample increased by 4.2% compared to the previous (1% PVP) sample. This difference significantly impacts the formation of domains and the distribution of spontaneous polarization, as illustrated in figure 7(a). A noticeable increase in pore concentration on the surface further alters the material’s electromechanical response. The increased porosity likely enhances conductivity, leading to a more chaotic polarization process, as seen in Figure 7(b). This disruption is attributed to the presence of additional grain boundaries and charge accumulation effects, which interfere with uniform domain switching. The maximum piezoresponse for positive domains was measured at 51°, while for negative domains, it increased to 26°, as shown in figure 7(c). This suggests that while polarization switching is still achievable, the overall response remains weaker and more irregular than in the denser reference samples.
The PFM image presented in figure 8(a) for 6.6% PVP sample reveals that the overall domain distribution and spatial coverage of regions polarized in the same direction resemble those observed in a dense film. A similar trend is evident in the charge lithography process, as shown in figure 8(b). Despite the structural similarities, the air-phase area (porous space) has increased by 2.6 times compared to the polymer-free sample. These findings suggest that structures with a specific grain orientation may exhibit a more efficient response to external electric stimuli, potentially due to the alignment of polarization switching pathways within the material. The maximum piezoresponse measured for positive domains was 171°, while for negative domains, it reached 45°, as shown in figure 8(c).
The air-phase area in the analyzed region of the 14% PVP sample is 1.6 μm², which is comparable to the porous area in the 3% PVP sample. This similarity can be attributed to the possibility of grains being embedded within the pores, which reduces the fragmentation of the overall polarization response, as shown in Figure 9(a). Due to the smaller grain sizes and the preferential distribution of the electric field along their edges, a misalignment with the expected polarization pattern is observed, as depicted in Figure 9(b). The maximum piezoresponse for positive domains reached 152°, while for negative domains, it was 33°, as shown in Figure 9(c). These results indicate that at higher PVP concentrations, the polarization response becomes less disrupted despite increased porosity.
We found that an increase in porosity, caused by a high PVP content, leads to fragmentation of the domain structure and a nonuniform distribution of polarization. The disruption of the grain boundaries in the porous samples results in local variations in domain distribution, which negatively affects the stability and uniformity of the piezoelectric response. In contrast, in the work by Cornelius et al. [39] the films produced by the sol–gel method exhibit a more stable and uniformly oriented domain structure, despite the presence of an imprint effect. PFM images demonstrate a consistent distribution of polarization domains, which results in high effective d₃₃,eff values. Moreover, the dependence of d₃₃,eff on the measurement direction (e.g., [100] vs. [110]) and the observed asymmetry between the values for positive and negative electric fields indicate that the optimized microstructure promotes a more reliable and uniform piezoelectric response.
4. Conclusions
The electrophysical mechanisms governing spontaneous polarization in ferroelectric materials play a crucial role in determining their functional properties. Unlike porous ferroelectric materials, where the presence of pores introduces inhomogeneities in the electric field distribution, dense ferroelectric films lack such variations, resulting in a more uniform polarization response. A key factor influencing this behavior is the relative dielectric permittivity of the air phase, which is significantly lower than that of the ferroelectric film. As a result, increasing porosity leads to a thicker film, a reduction in dielectric permittivity, and a decrease in overall polarization. Despite these changes, an important observation is that thelocal coercive field remains largely unchanged, suggesting a relative stability in the material’s resistance to polarization switching. The internal field, generated by internal charge displacement, can be oriented in both positive and negative directions, potentially leading to either polarization or depolarization effects. In the case of the studied samples, the source of this internal field is the interaction between dipole structures, which are confined by specific interfaces and geometrical constraints. These interactions dictate the local stability and switching behavior of the polarization, further emphasizing the complex role of microstructure and porosity in shaping the electromechanical properties of ferroelectric materials.
Author Contributions
Conceptualization,E.Z., A.B. and M.I.; methodology, E.Z.; software, E.Z.; validation, E.Z., A.B. and D.S.; formal analysis, A.B. and D.S.; investigation, E.Z.; resources, A.B.; data curation, D.S.; writing—original draft preparation, E.Z. and A.B.; writing—review and editing, A.B. and M.I.; visualization, E.Z. and D.S.; supervision, A.B. and M.I.; project administration, A.B. and D.S.; funding acquisition, A.B. All authors have read and agreed to the published version of the manuscript.
Funding
The experimental research using AFM and PFM methods was supported by the Russian Science Foundation, Project No.24-79-10304, https://rscf.ru/en/project/24-79-10304/. The preparation of PZT samples was supported by the Ministry of Science and Higher Education of the Russian Federation (State Task for the University #FSFZ-2023-0005).
Data Availability Statement
The research data are available upon request.
Acknowledgments
M.I. thanks “ILLIANCE” project supported by the PRR - Recovery and Resilience Plan and by NextGenerationEU, through the scheme «Agendas para a Inovação Empresarial» and CICECO-Aveiro Institute of Materials, UIDB/50011/2020 (DOI 10.54499/UIDB/50011/2020), UIDP/50011/2020 (DOI 10.54499/UIDP/50011/2020) & LA/P/0006/2020 (DOI 10.54499/LA/P/0006/2020), financed by national funds through the FCT/MCTES (PIDDAC).
Conflicts of Interest
The authors declare no conflicts of interest.
References
- Bi, K.; et al. . Interfacial Polarization Control Engineering and Ferroelectric PZT/Graphene Heterostructure Integrated Application // Nanomaterials. – 2024. – Т. 14. – №. 5. – С. 432.
- Sezer, N.; et al. . A comprehensive review on the state-of-the-art of piezoelectric energy harvesting // Nano Energy. – 2021. – Т. 80. – С. 105567.
- Li, X.; et al. . Plantar pressure measurement system based on piezoelectric sensor: a review // Sensor Review. – 2022. – Т. 42. – №. 2. – С. 241-249.
- Jung, J.; et al. . Review of piezoelectric micromachined ultrasonic transducers and their applications // Journal of Micromechanics and Microengineering. – 2017. – Т. 27. – №. 11. – С. 113001.
- Saadon, S.; et al. . A review of vibration-based MEMS piezoelectric energy harvesters // Energy Conversion and Management. – 2011. – Т. 52. – №. 1. – С. 500-504.
- Duan, S.; et al. . Innovation Strategy Selection Facilitates High-Performance Flexible Piezoelectric Sensors // Sensors. – 2020. – Т. 20. – №. 10. – С. 2820.
- Fedulov, F.A.; et al. . Magnetoelectric effects in stripe- and periodic heterostructures based on nickel–lead zirconate titanate bilayers // Russian Technological Journal. – 2022. – Т. 10. – №. 3. – С. 64-73.
- Ivanov, M.S.; et al. . Impact of compressive and tensile epitaxial strain on transport and nonlinear optical properties of magnetoelectric BaTiO3-(LaCa)MnO3 tunnel junction // Journal of Physics D: Applied Physics. – 2021. – Т. 54. – №. 27. – С. 275302.
- Yan, M.; et al. . Porous ferroelectric materials for energy technologies: current status and future perspectives // Energy & Environmental Science. – 2021. – Т. 14. – №. 12. – С. 6158-6190.
- Fei, C.; et al. . Modification of microstructure on PZT films for ultrahigh frequency transducer // Ceramics International. – 2015. – Т. 41. – С. S650-S655.
- Atanova, A.V.; et al. . Microstructure analysis of porous lead zirconate–titanate films // Journal of the American Ceramic Society. – 2021. – Т. 105. – №. 1. – С. 639-652.
- Zhang, S.; et al. . Advantages and challenges of relaxor-PbTiO3 ferroelectric crystals for electroacoustic transducers – A review // Progress in Materials Science. – 2015. – Т. 68. – С. 1-66.
- Xiao, W.; et al. . Well-balanced performance achieved in PZT piezoceramics via a multiscale regulation strategy // Materials Horizons. – 2024. – Т. 11. – №. 21. – С. 5285-5294.
- Liu, H.; et al. . Enhanced performance of piezoelectric composite nanogenerator based on gradient porous PZT ceramic structure for energy harvesting // Journal of Materials Chemistry A. – 2020. – Т. 8. – №. 37. – С. 19631-19640.
- Zhang, Y.; et al. . Porous PZT Ceramics with Aligned Pore Channels for Energy Harvesting Applications // Journal of the American Ceramic Society. – 2015. – Т. 98. – №. 10. – С. 2980-2983.
- Zhang, Y.; et al. . Enhanced pyroelectric and piezoelectric properties of PZT with aligned porosity for energy harvesting applications // Journal of Materials Chemistry A. – 2017. – Т. 5. – №. 14. – С. 6569-6580.
- Jia, Q.X.; et al. . Polymer-assisted deposition of metal-oxide films // Nature Materials. – 2004. – Т. 3. – №. 8. – С. 529-532.
- Kozuka, H.; et al. PVP-assisted sol-gel deposition of single layer ferroelectric thin films over submicron or micron in thickness // Journal of the European Ceramic Society. – 2004. – Т. 24. – №. 6. – С. 1585-1588.
- Yamano, A.; et al. . Ferroelectric domain structures of 0.4-μm-thick Pb(Zr,Ti)O3 films prepared by polyvinylpyrrolidone-assisted Sol-Gel method // Journal of Applied Physics. – 2012. – Т. 111. – №. 5.
- Stancu, V.; et al. . Effects of porosity on ferroelectric properties of Pb(Zr0.2Ti0.8)O3 films // Thin Solid Films. – 2007. – Т. 515. – №. 16. – С. 6557-6561.
- Oh, S.; et al. . Fabrication of 1㎛ Thickness Lead Zirconium Titanate Films Using Poly(N-vinylpyrrolidone) Added Sol-gel Method // Transactions on Electrical and Electronic Materials. – 2011. – Т. 12. – №. 5. – С. 222-225.
- Hu, X.; et al. . Fabrication of porous PZT ceramics using micro-stereolithography technology // Ceramics International. – 2021. – Т. 47. – №. 22. – С. 32376-32381.
- Yang, A.; et al. . Microstructure and Electrical Properties of Porous PZT Ceramics Fabricated by Different Methods // Journal of the American Ceramic Society. – 2010. – Т. 93. – №. 7. – С. 1984-1990.
- Björk, E.M. . Surface Area Determination of Particle-Based Mesoporous Films Using Krypton Physisorption // ACS Omega. – 2024. – Т. 9. – №. 5. – С. 5899-5902.
- Wang, Q.; et al. . Porous pyroelectric ceramic with carbon nanotubes for high-performance thermal to electrical energy conversion // Nano Energy. – 2022. – Т. 102. – С. 107703.
- Schultheiß, J.; et al. . Orienting anisometric pores in ferroelectrics: Piezoelectric property engineering through local electric field distributions // Physical Review Materials. – 2019. – Т. 3. – №. 8.
- Zhang, Y.; et al. . Understanding the effect of porosity on the polarisation-field response of ferroelectric materials // Acta Materialia. – 2018. – Т. 154. – С. 100-112.
- Zhang, Z.; et al. . Significantly enhanced dielectric and energy storage performance of blend polymer-based composites containing inorganic 3D–network // Materials & Design. – 2018. – Т. 142. – С. 106-113.
- Bowen, C.R.; et al. . Pyroelectric materials and devices for energy harvesting applications // Energy Environ. Sci.. – 2014. – Т. 7. – №. 12. – С. 3836-3856.
- Zhang, Y.; et al. . Performance Enhancement of Flexible Piezoelectric Nanogenerator via Doping and Rational 3D Structure Design For Self-Powered Mechanosensational System // Advanced Functional Materials. – 2019. – Т. 29. – №. 42.
- Marselli, S.; et al. . Porous piezoelectric ceramic hydrophone // The Journal of the Acoustical Society of America. – 1999. – Т. 106. – №. 2. – С. 733-738.
- Roscow, J.; et al. . Porous ferroelectrics for energy harvesting applications // The European Physical Journal Special Topics. – 2015. – Т. 224. – №. 14-15. – С. 2949-2966.
- Ivanov, M.; et al. . Nanoscale Study of the Polar and Electronic Properties of a Molecular Erbium(III) Complex Observed via Scanning Probe Microscopy // Crystals. – 2023. – Т. 13. – №. 9. – С. 1331.
- Park G., T.; et al. Piezoelectric and ferroelectric properties of 1-μm-thick lead zirconate titanate film fabricated by a double-spin-coating process //Applied physics letters. – 2004. – Т. 85. – №. 12. – С. 2322-2324.
- Choi J., J.; et al. Sol–Gel Preparation of Thick PZN–PZT Film Using a Diol-Based Solution Containing Polyvinylpyrrolidone for Piezoelectric Applications //Journal of the American Ceramic Society. – 2005. – Т. 88. – №. 11. – С. 3049-3054.
- Calderón-Piñar, F.; et al. Ferroelectric hysteresis and improved fatigue of PZT (53/47) films fabricated by a simplified sol-gel acetic-acid route //Journal of Materials Science: Materials in Electronics. – 2014. – Т. 25. – №. 11.
- Nguyen M., D. , Houwman E. P., Rijnders G. Large piezoelectric strain with ultra-low strain hysteresis in highly c-axis oriented Pb (Zr0.52Ti0.48)O3 films with columnar growth on amorphous glass substrates //Scientific reports. – 2017. – Т. 7. – №. 1. – С. 12915.
- Delimova, L.; et al. Porous PZT Films: How Can We Tune Electrical Properties? // Materials. – 2023. – Т. 16. – №. 14. – С. 5171.
- Cornelius T., W.; et al. Piezoelectric response and electrical properties of Pb(Zr1-xTix)O3 thin films: The role of imprint and composition //Journal of Applied Physics. – 2017. – Т. 122. – №. 16.
Figure 1.
Local hysteresis loops analysis for the 0% PVP sample, (a) topography of the selected region, where colored squares indicate the probe’s contact points on the surface, (b) dependence of cantilever deflection on the applied electric field, showing the local piezoelectric response, (c) frequency dependence of cantilever deflection under the applied electric field.
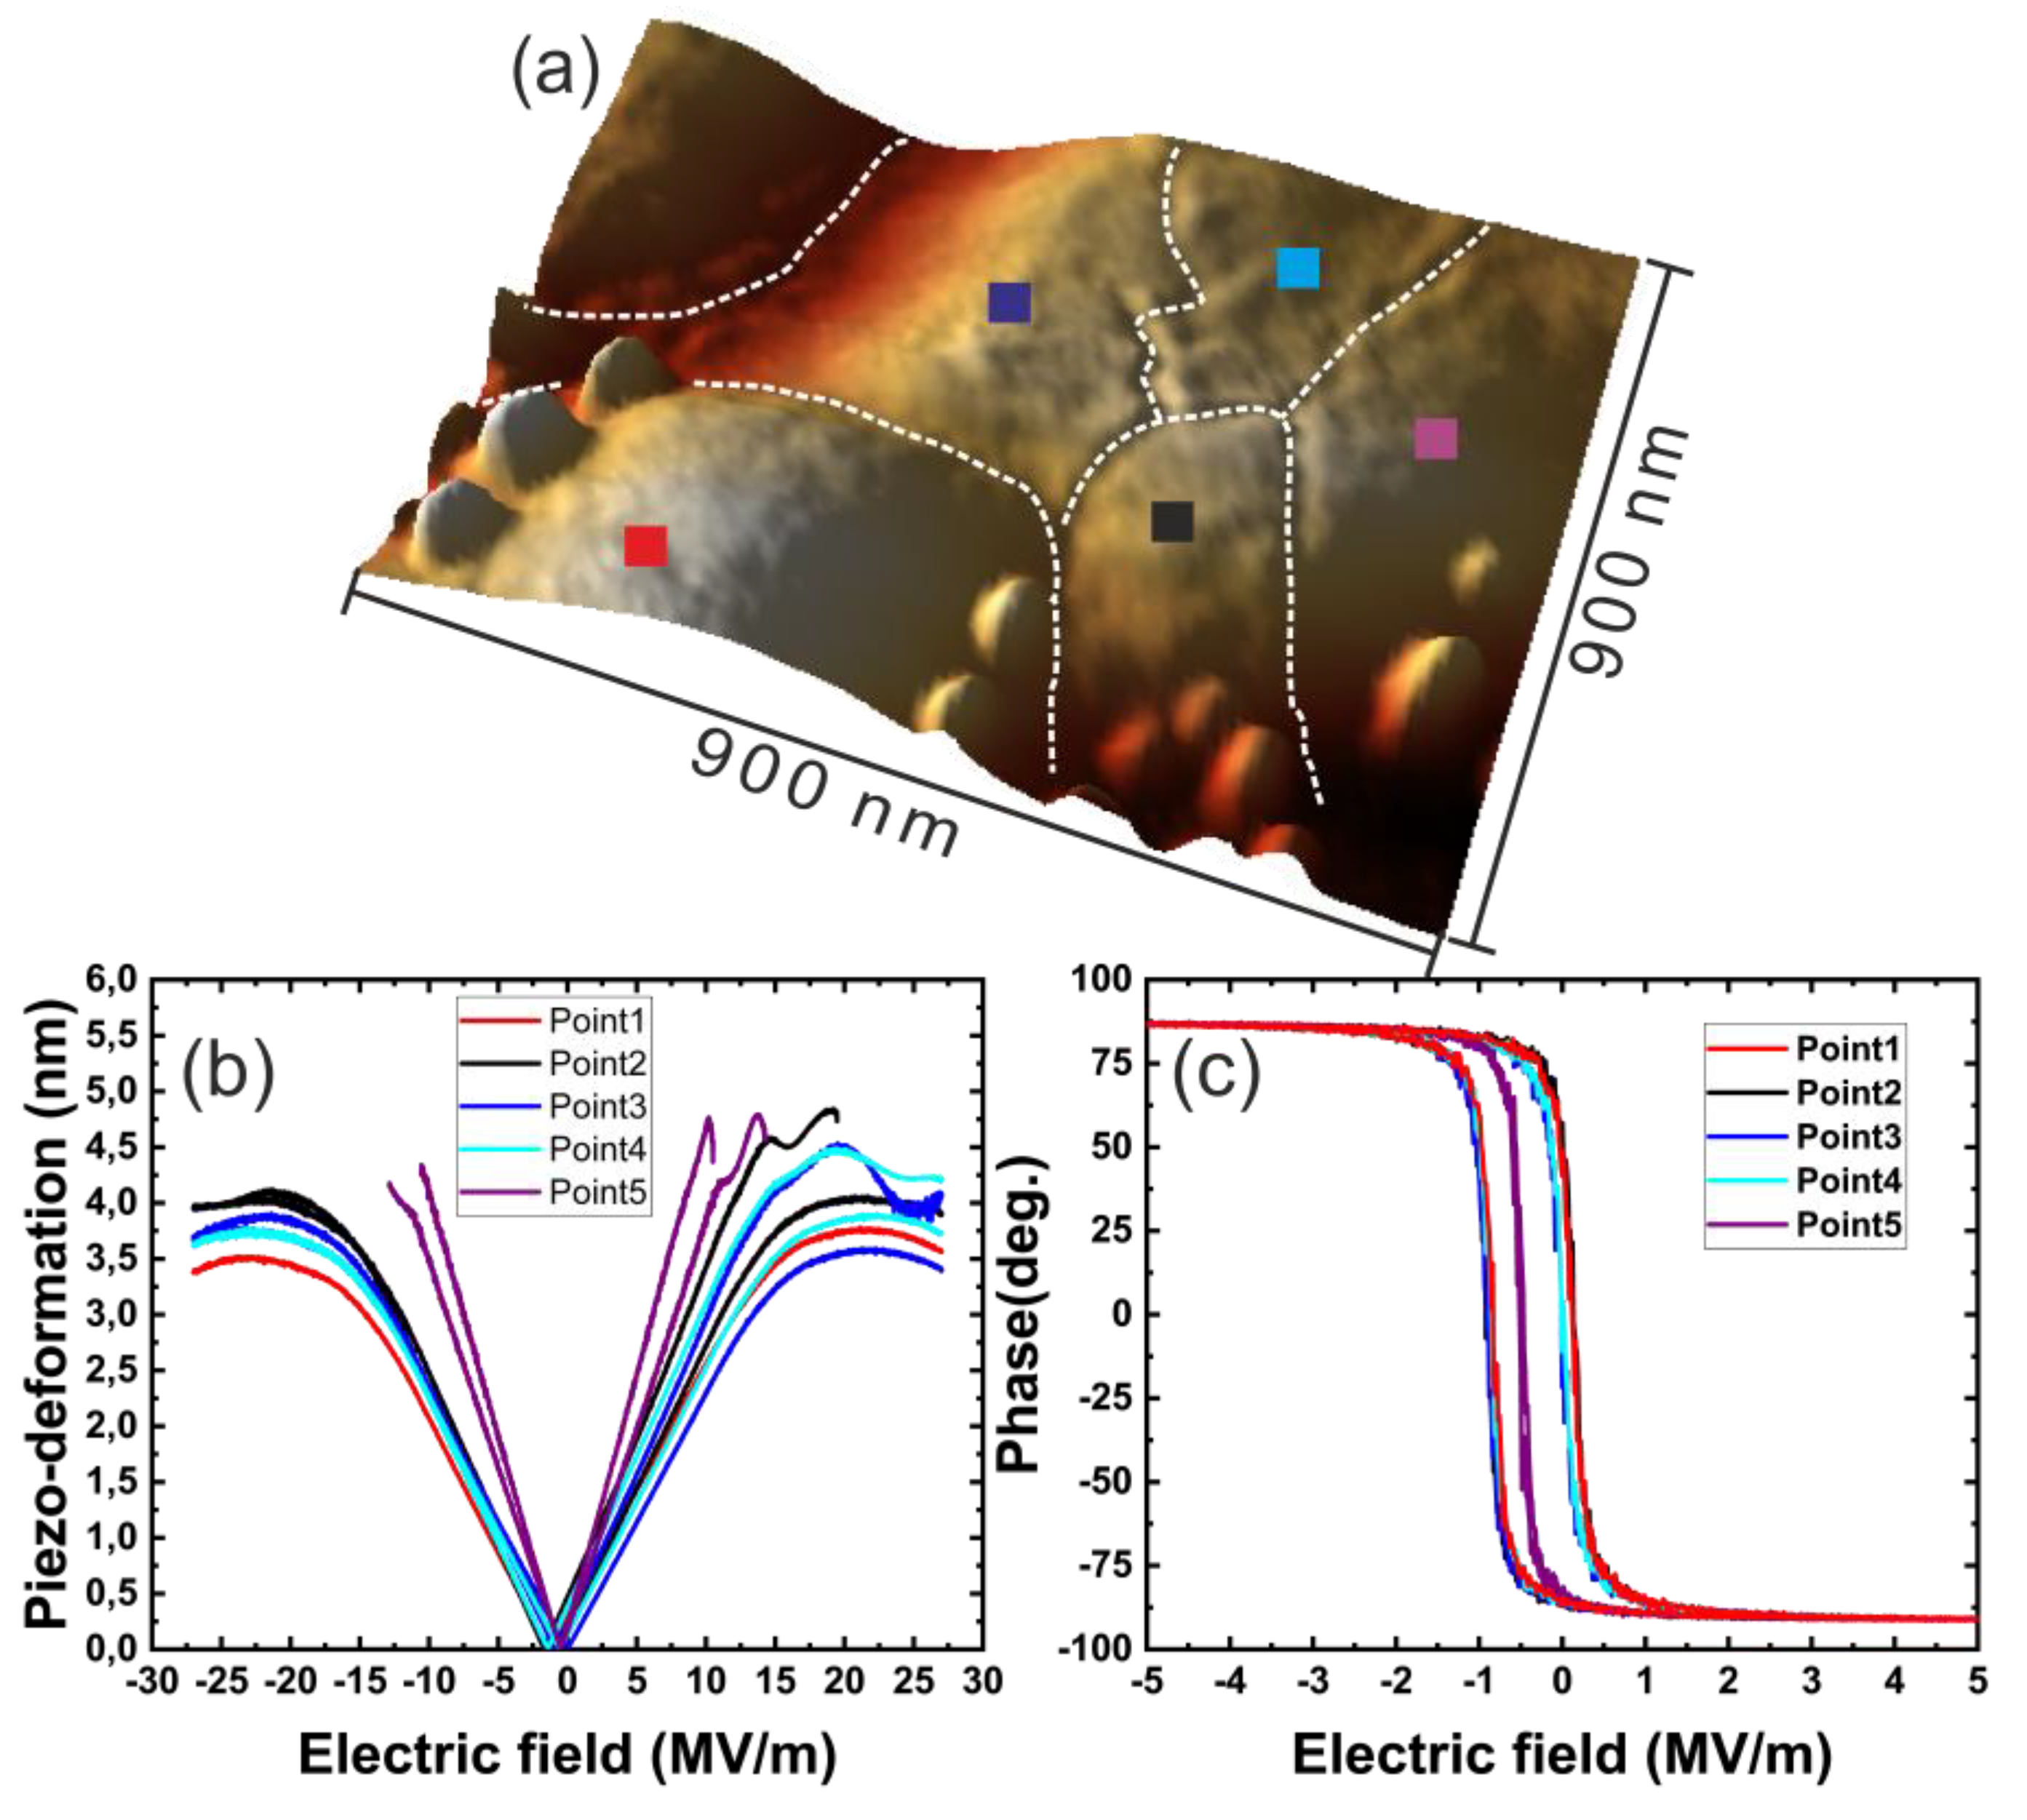
Figure 2.
Local hysteresis loop analysis for the 6% PVP sample, (a) topography of the selected region 3x3mkm, where colored squares indicate the probe’s contact points on the surface, (b) dependence of cantilever deflection on the applied electric field, illustrating local variations in the piezoelectric response, (c) frequency dependence of cantilever deflection under the applied electric field.
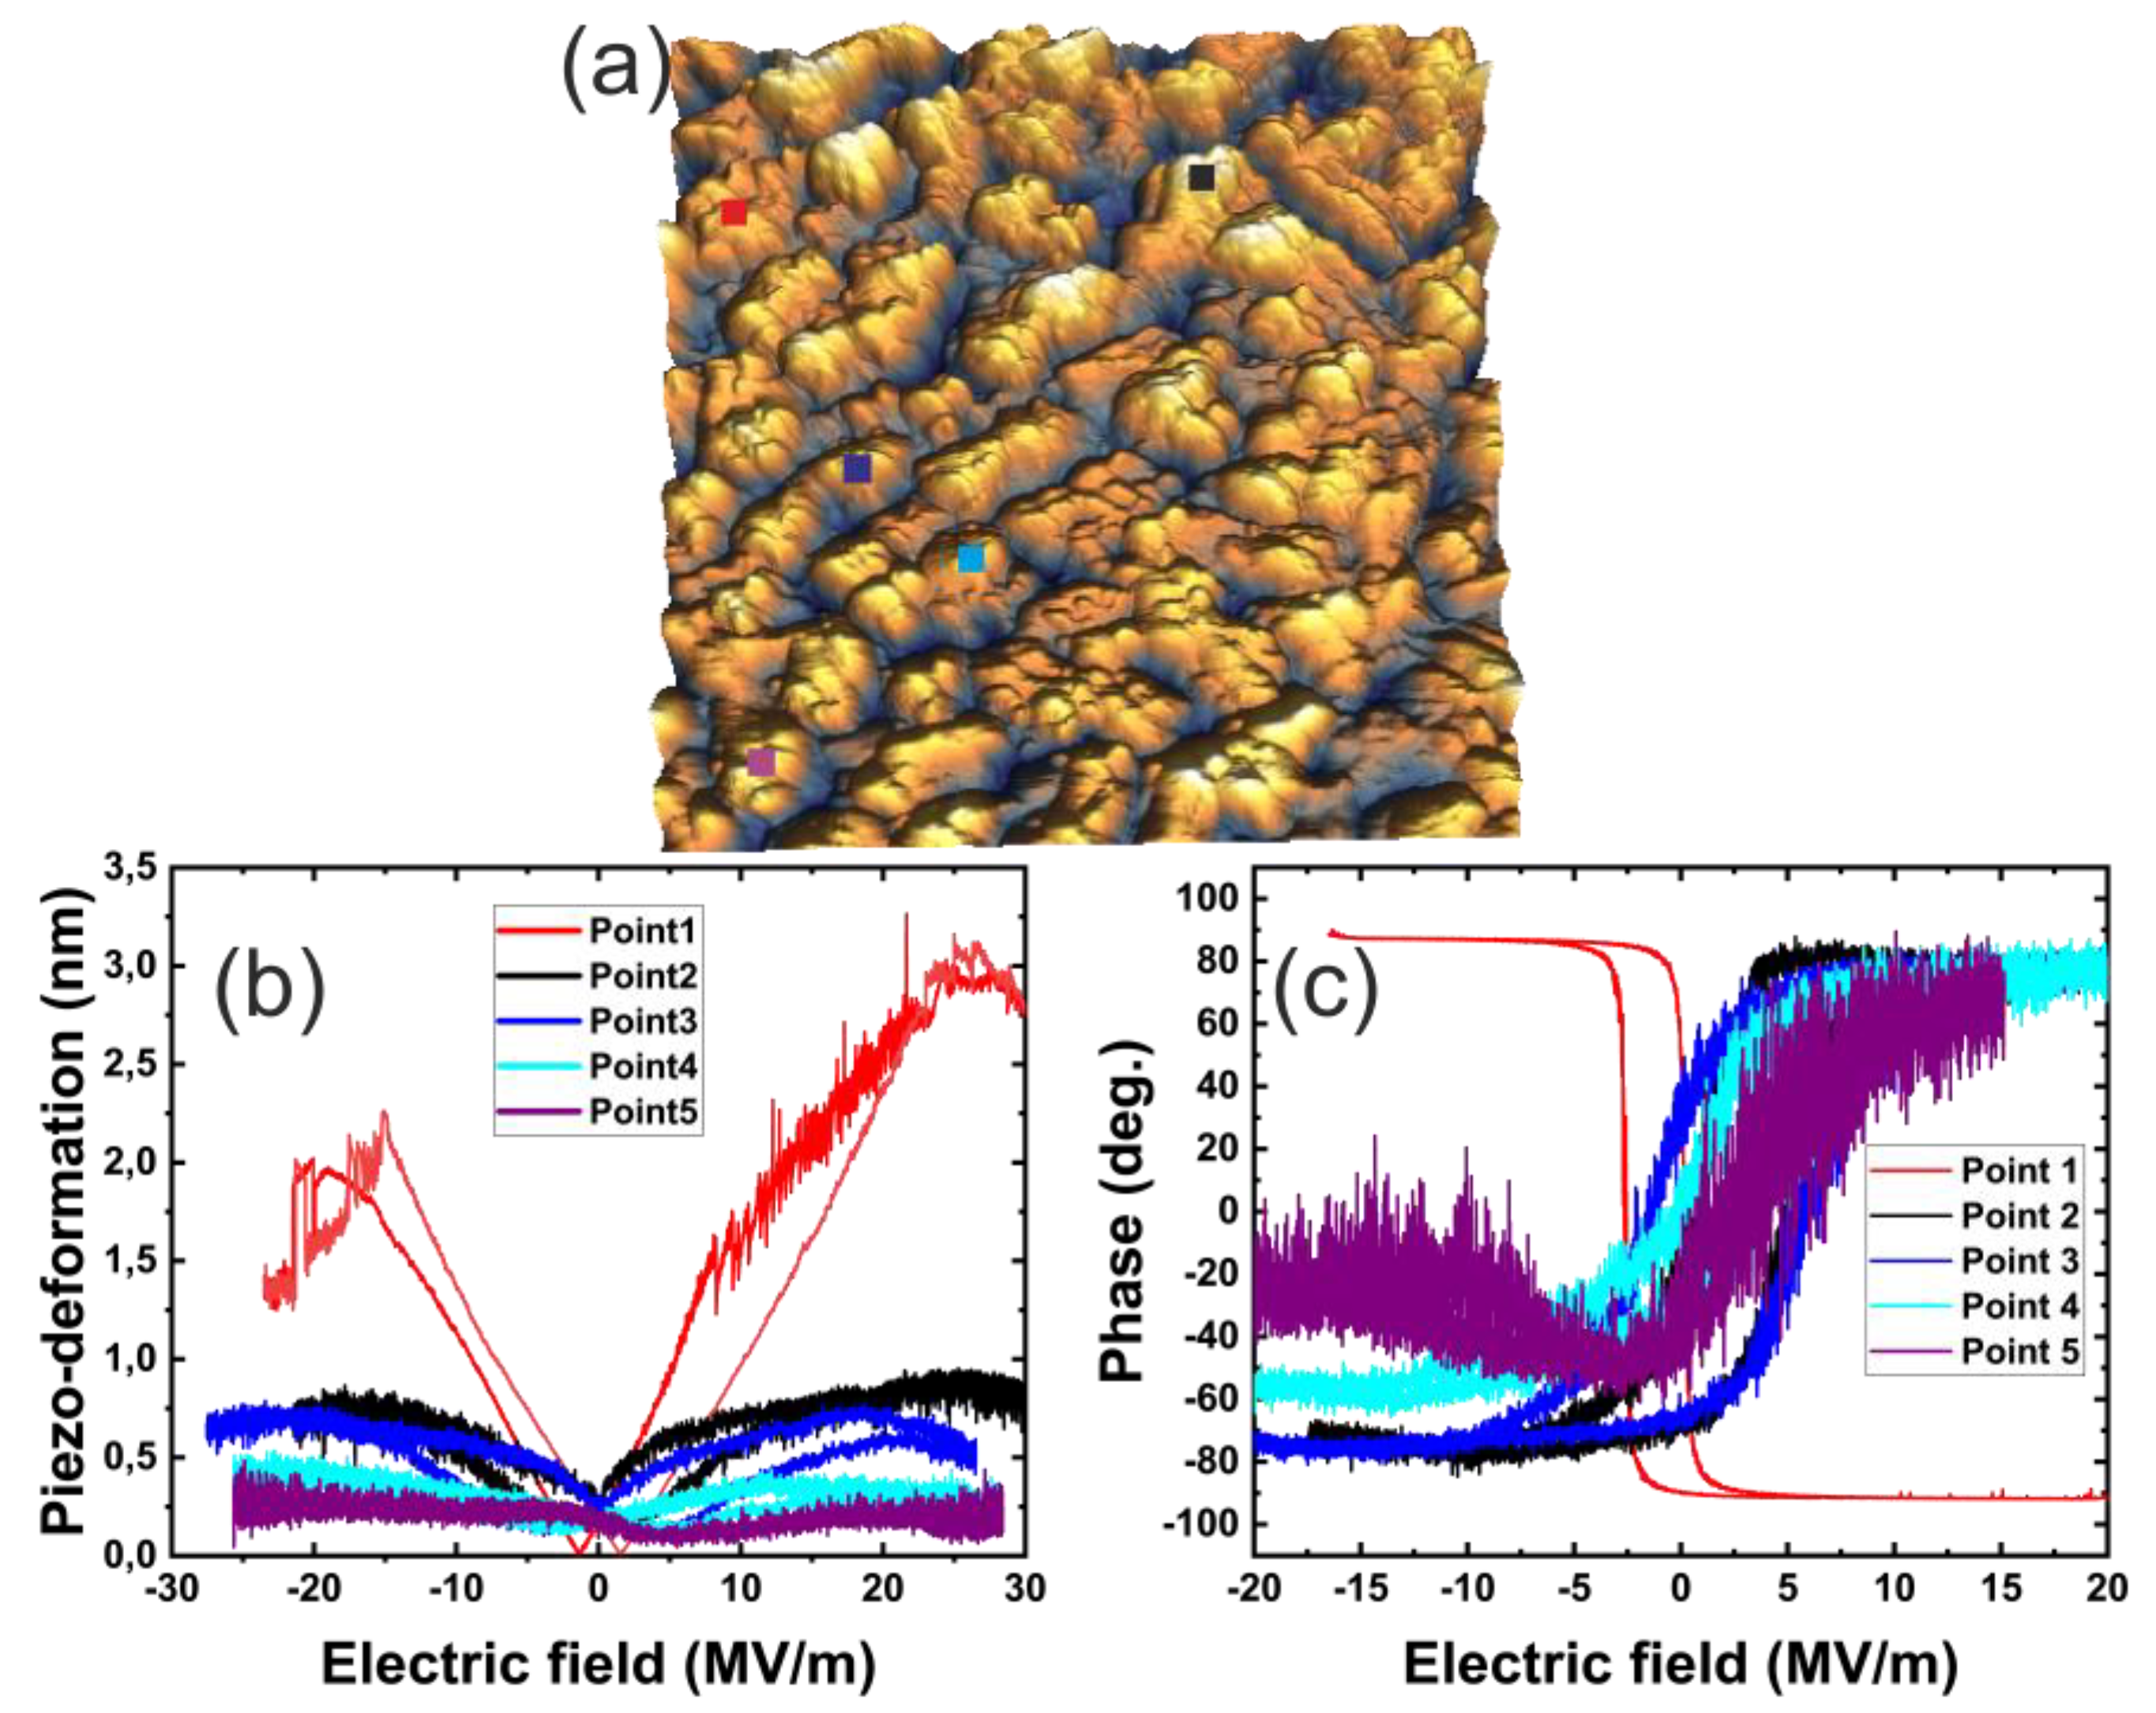
Figure 3.
Local hysteresis loop analysis for the 14% PVP sample, (a) topography of the selected region 3x3mkm, where colored squares indicate the probe’s contact points on the surface, (b) dependence of cantilever deflection on the applied electric field, showing the local piezoelectric response, (c) frequency dependence of cantilever deflection under the applied electric field.
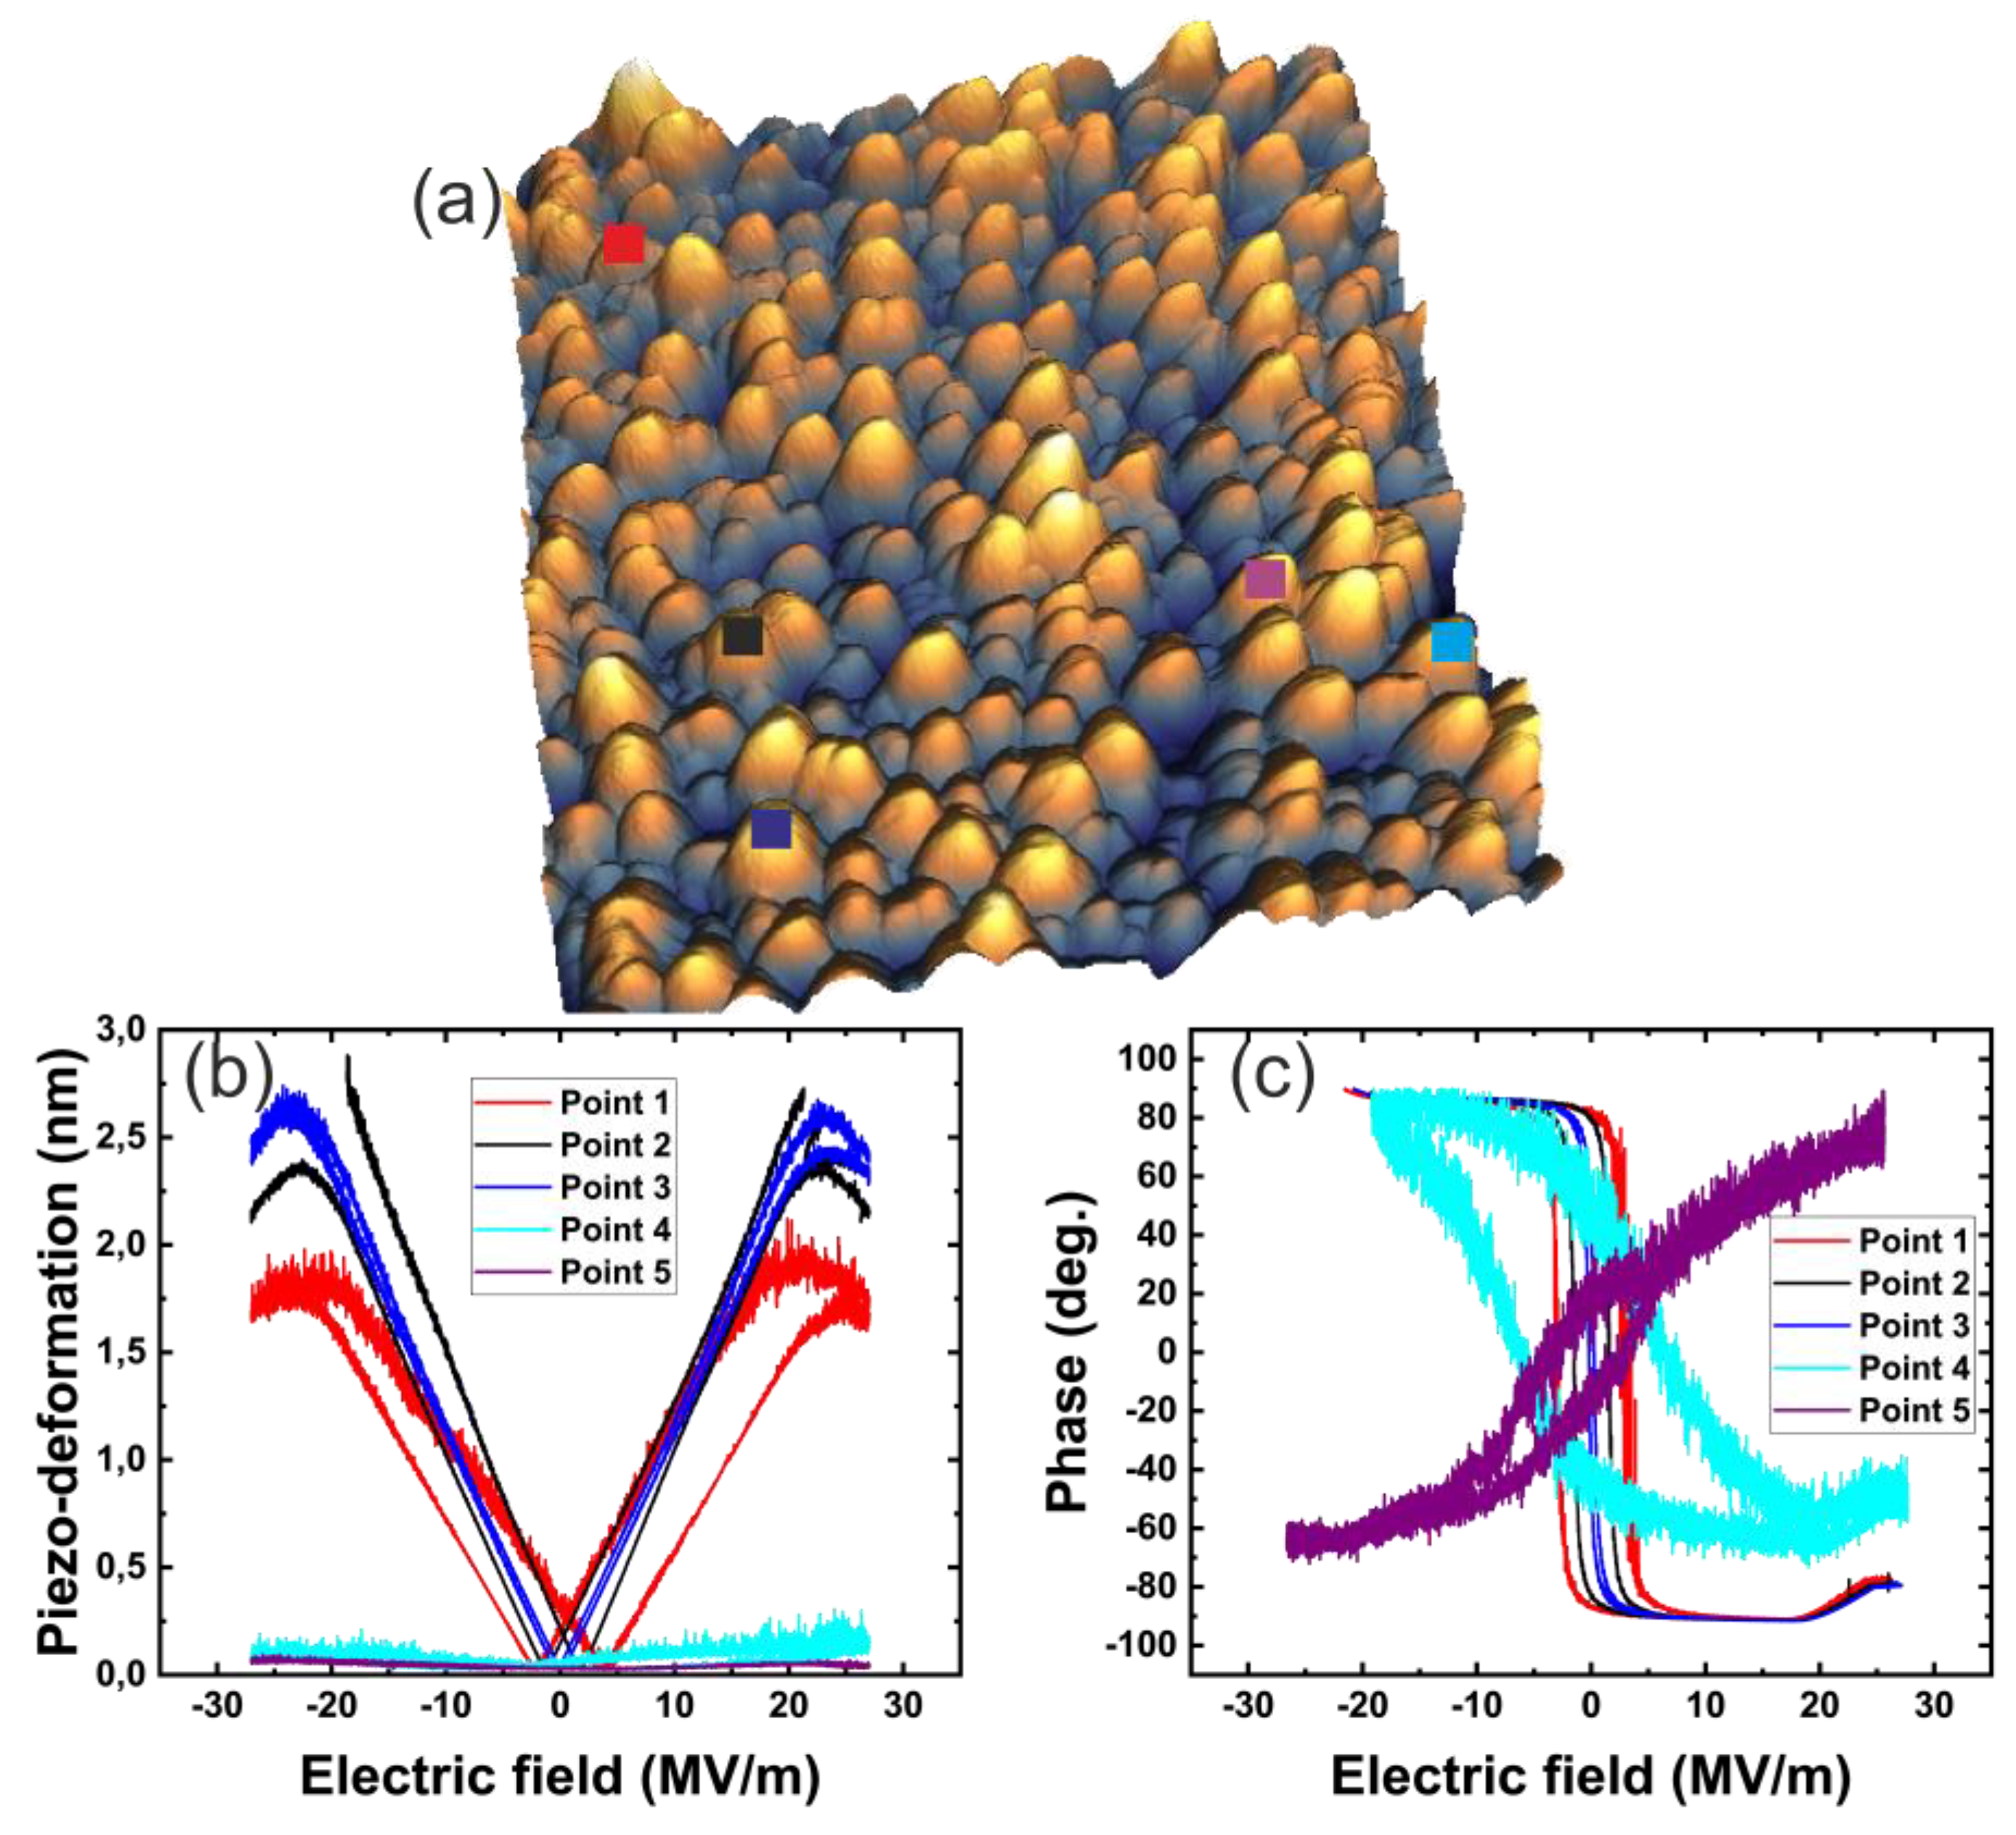
Figure 5.
Cross-section and scanning results of the 3x3 mkm polymer-free sample (10 layers of PZT, thickness 370 nm, 0% porosity), (a) polarization contrast before repolarization, showing the initial distribution of spontaneous polarization, (b) polarization contrast after repolarization, illustrating the effect of charge lithography on the ferroelectric domain structure, (c) cross-section along the scan width, highlighting polarization variations before and after repolarization.
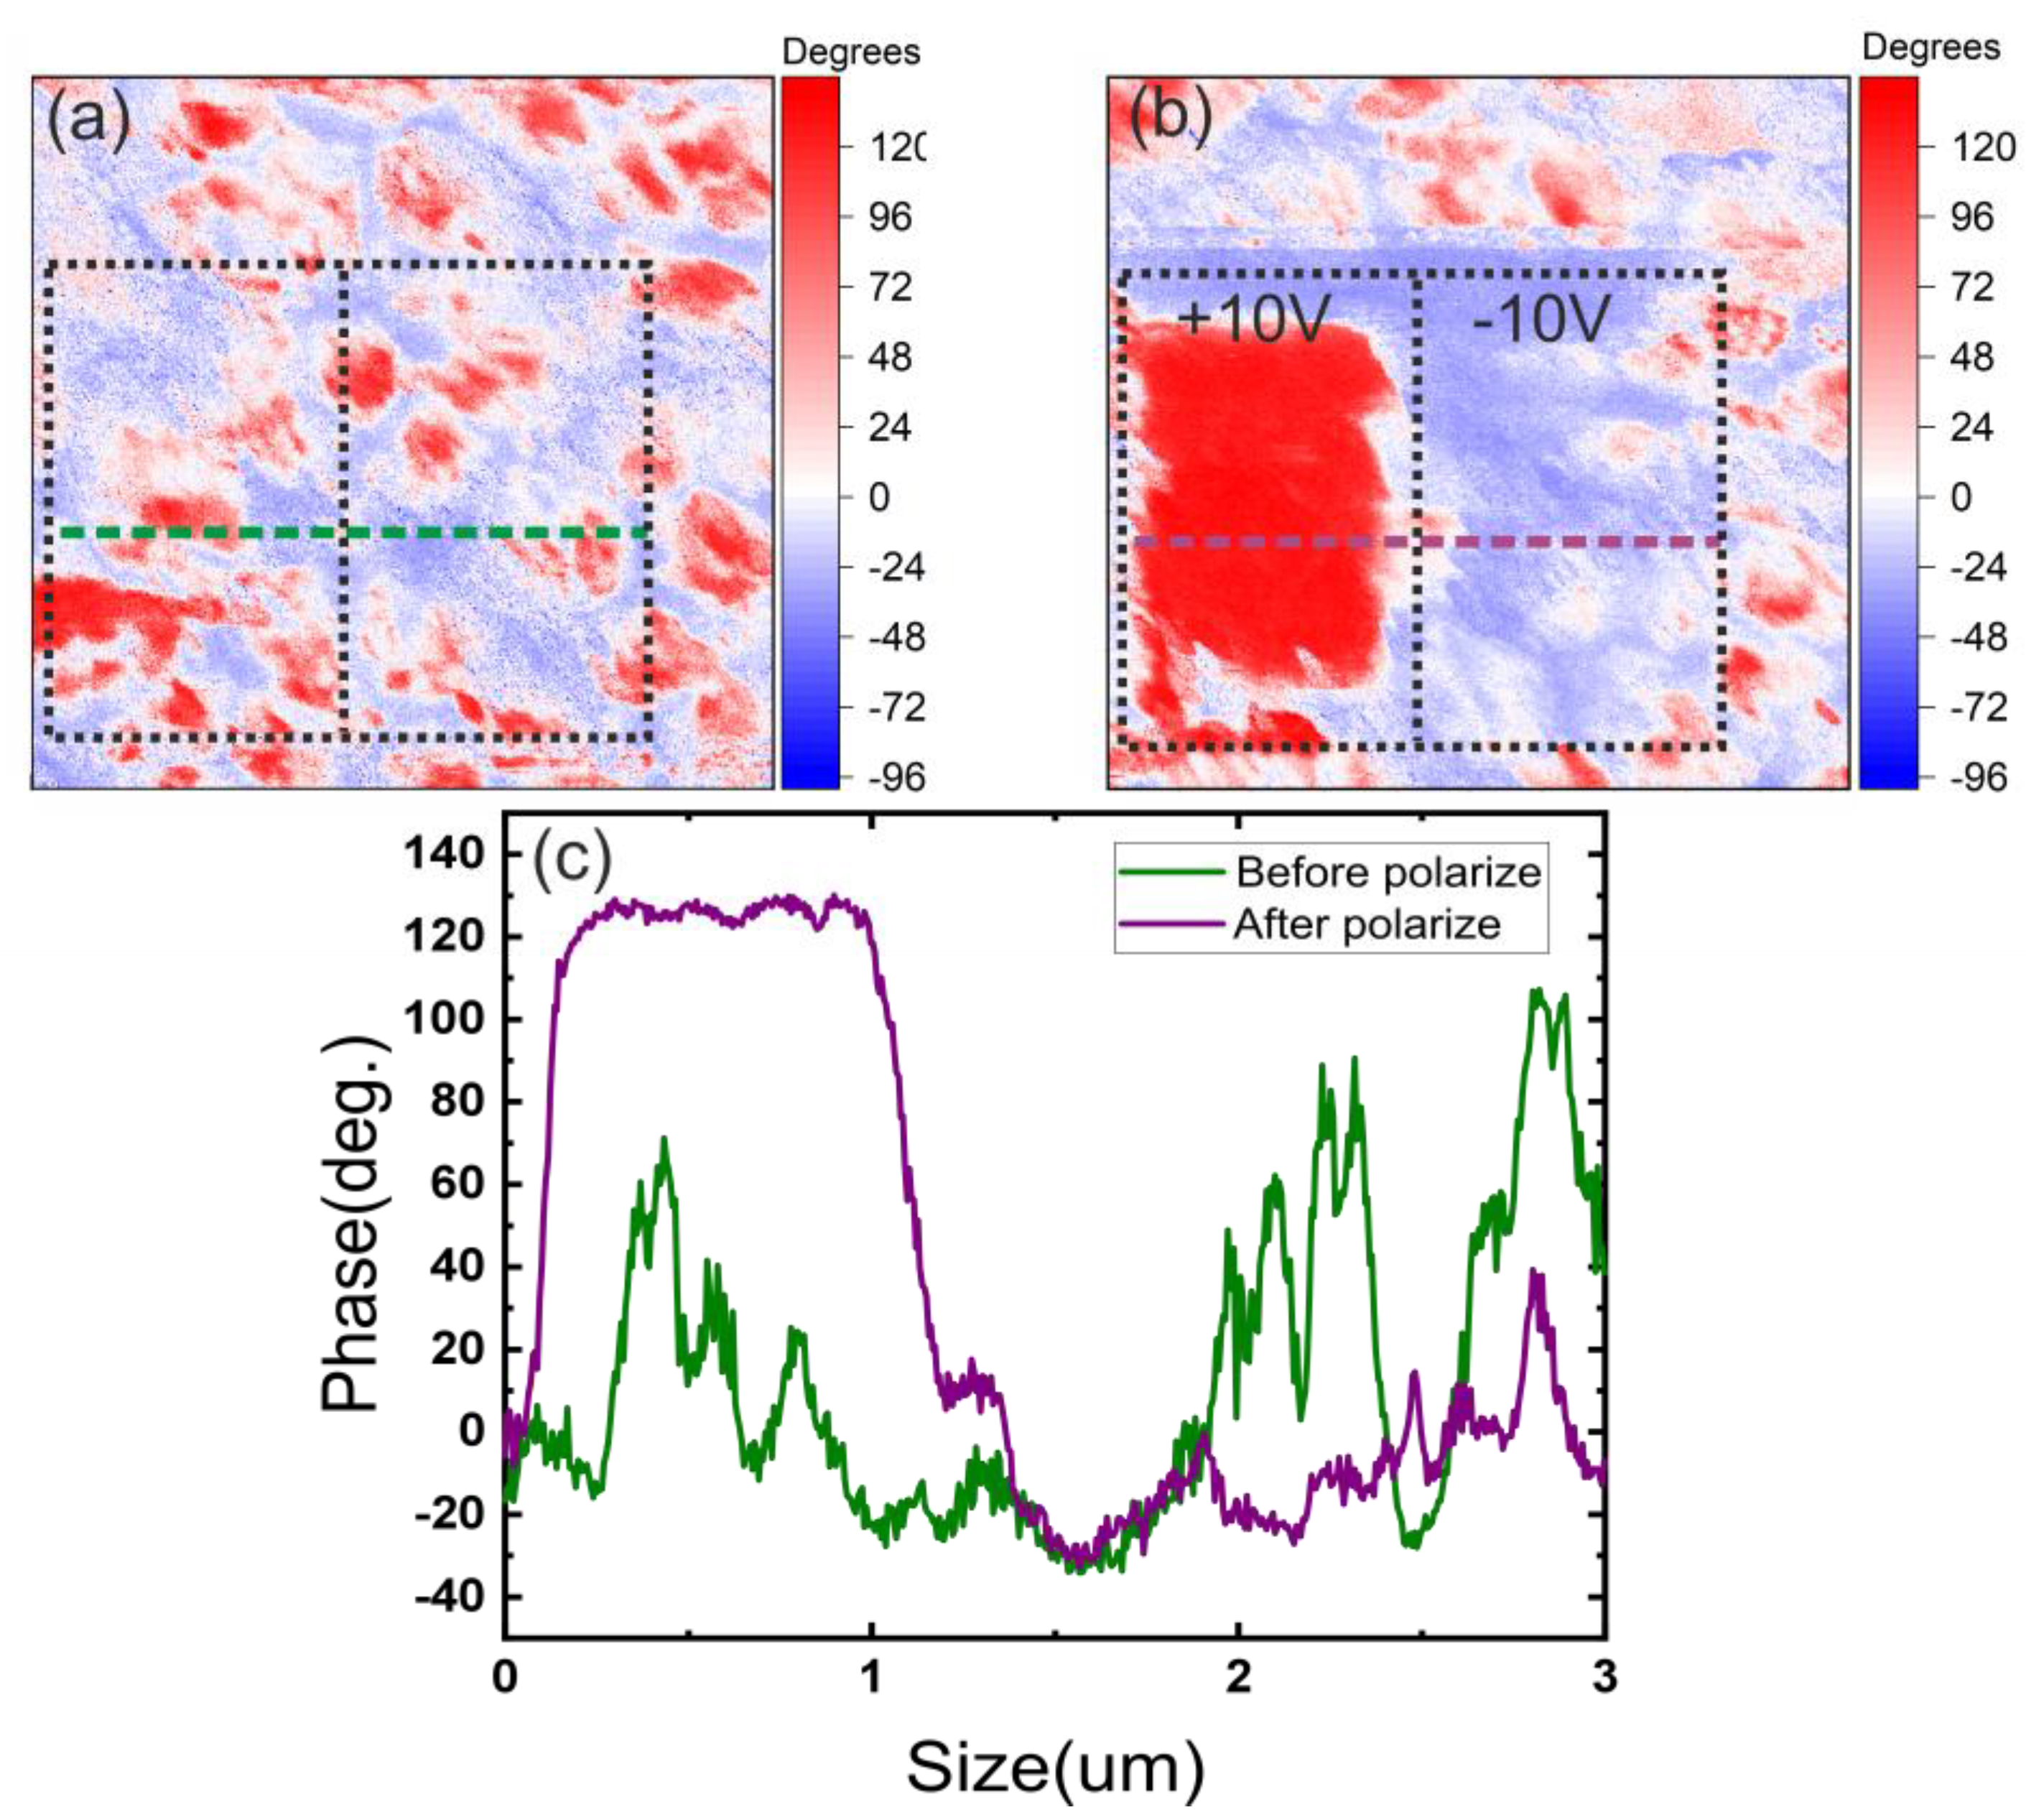
Figure 6.
Cross-section and scanning results of the 3x3 mkm 1% PVP sample (9 layers of PZT, thickness 390 nm, 6.8% porosity), (a) polarization contrast before repolarization, illustrating the initial spontaneous polarization distribution in the porous structure, (b) polarization contrast after repolarization, showing the altered domain structure and its weaker response to charge lithography, (c) cross-section along the scan width, highlighting polarization variations before and after repolarization.
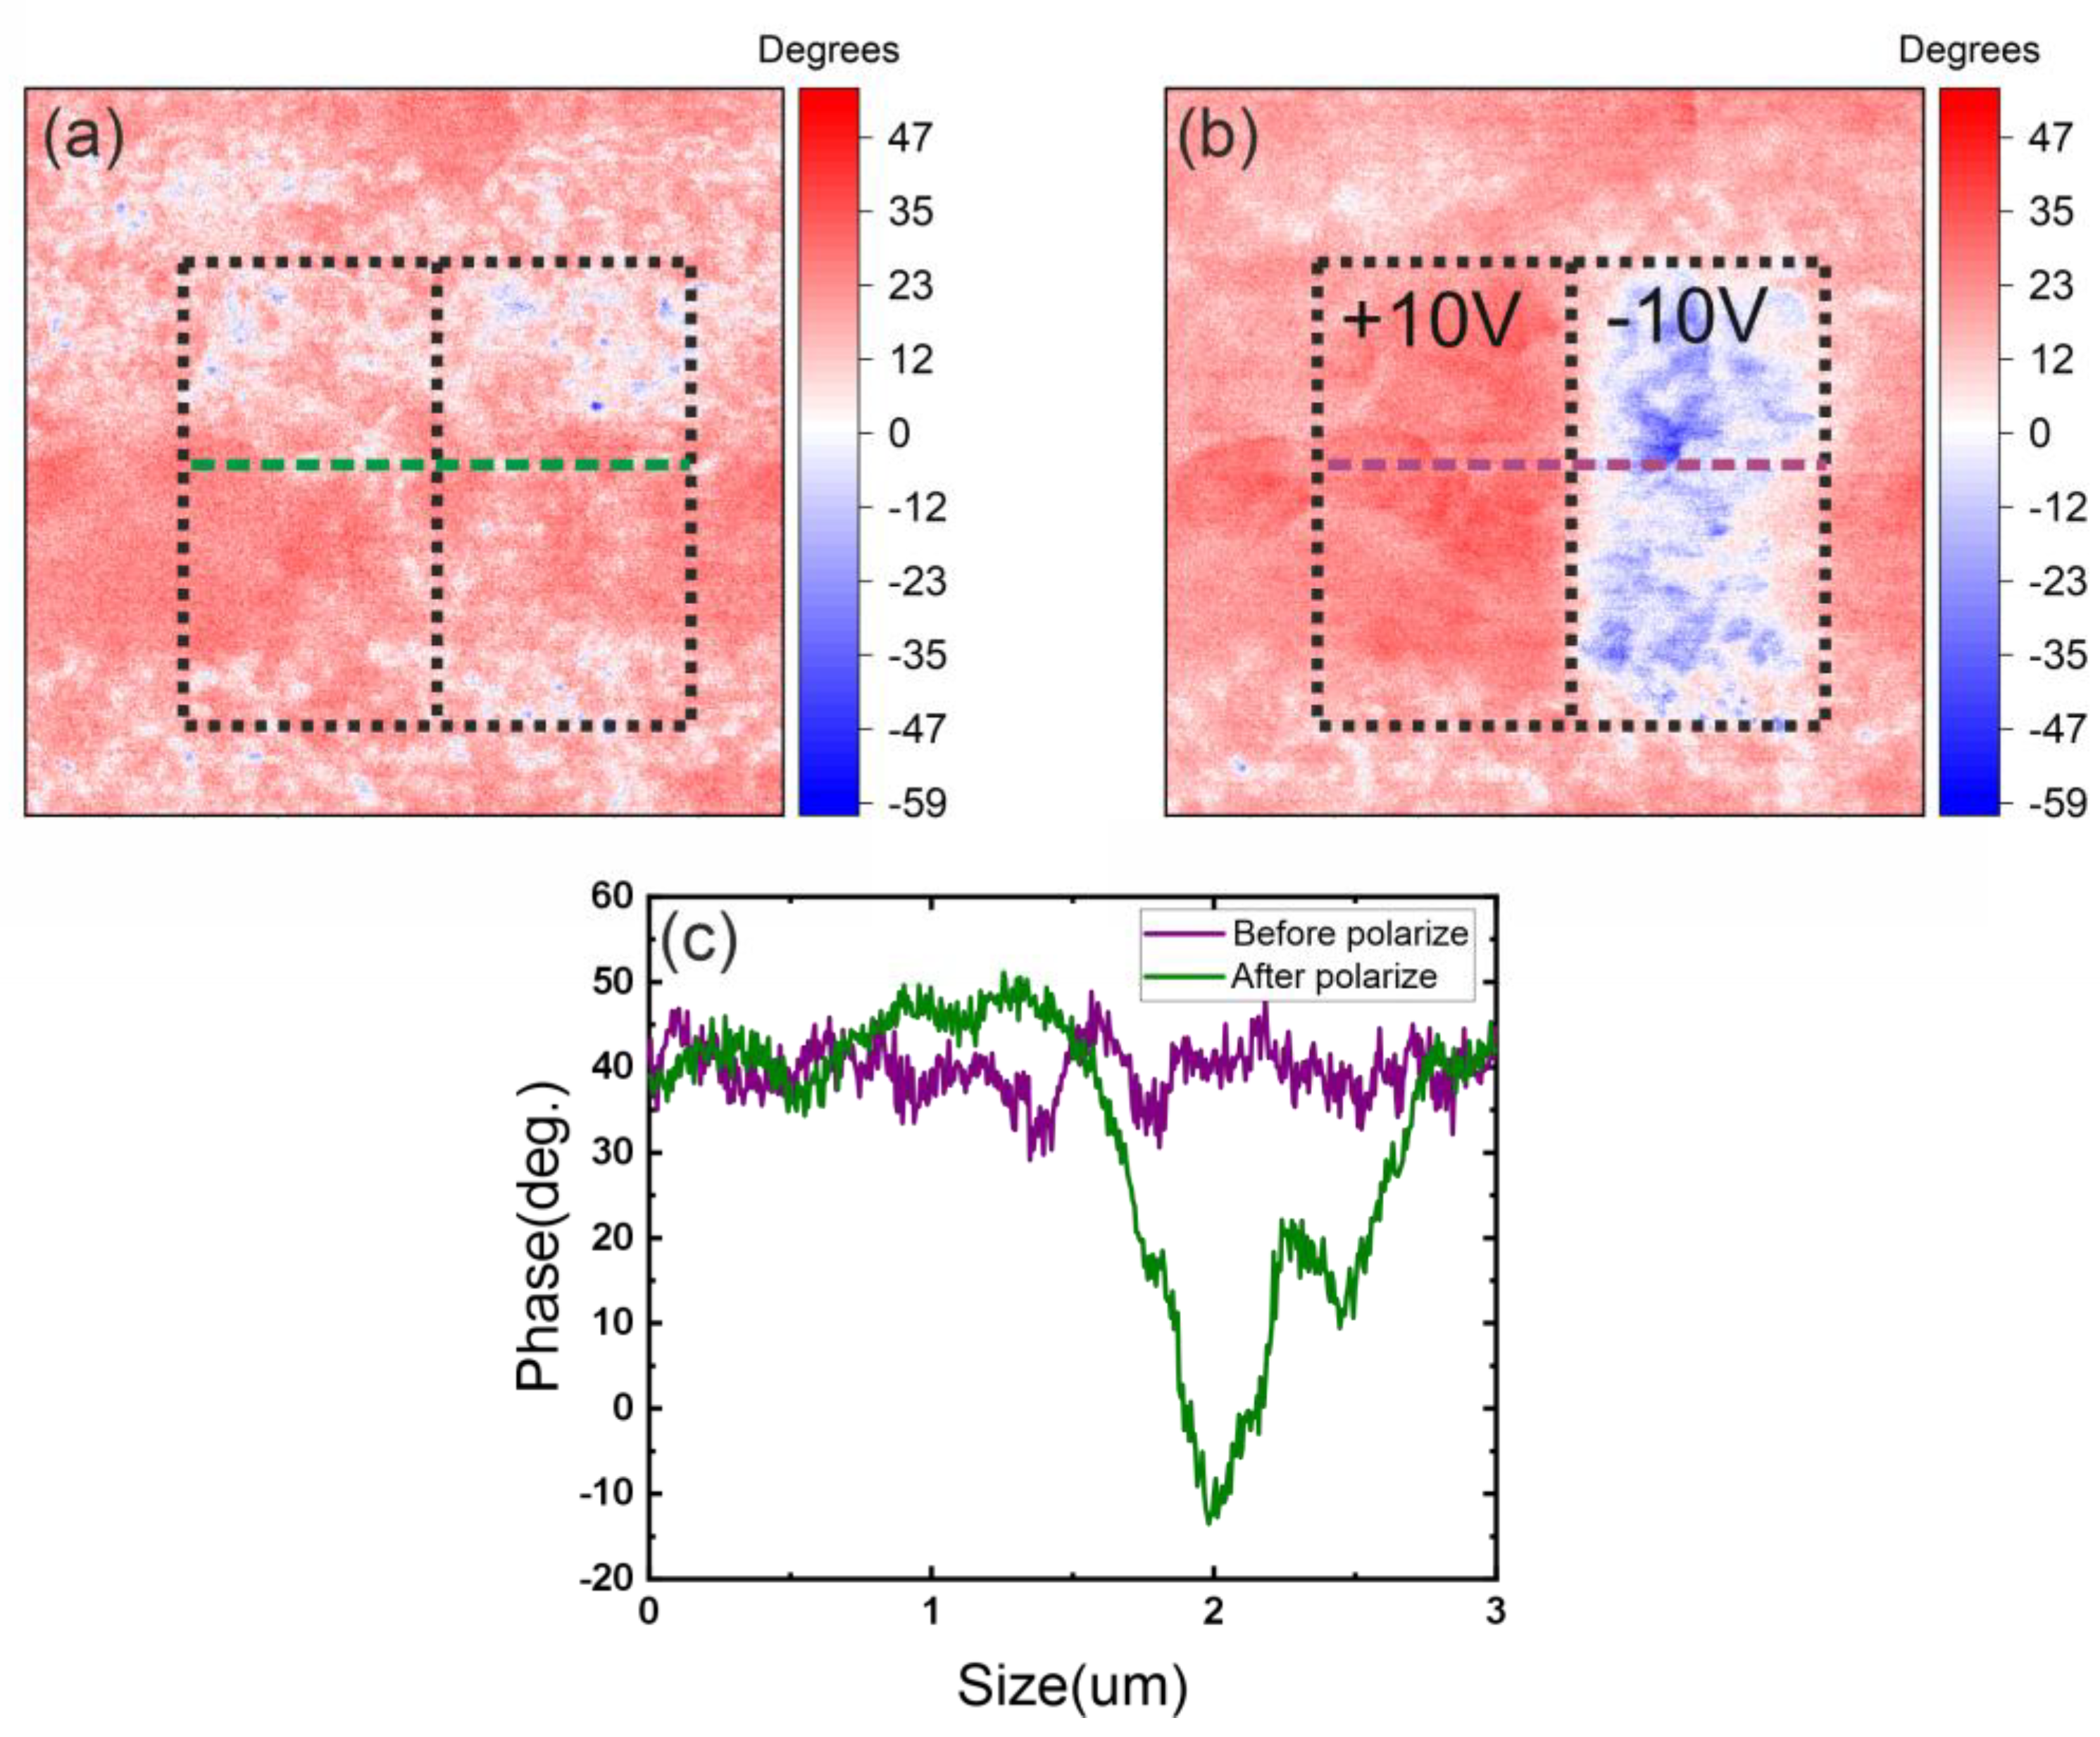
Figure 7.
Cross-section and scanning results of the 3x3 mkm 3% PVP sample (7 layers of PZT, thickness 370 nm, 11% porosity), (a) polarization contrast before repolarization, illustrating the initial spontaneous polarization distribution and the increased influence of porosity on domain formation, (b) polarization contrast after repolarization, demonstrating the irregular and less stable polarization switching due to enhanced porosity, (c) cross-section along the scan width, highlighting polarization variations before and after repolarization.
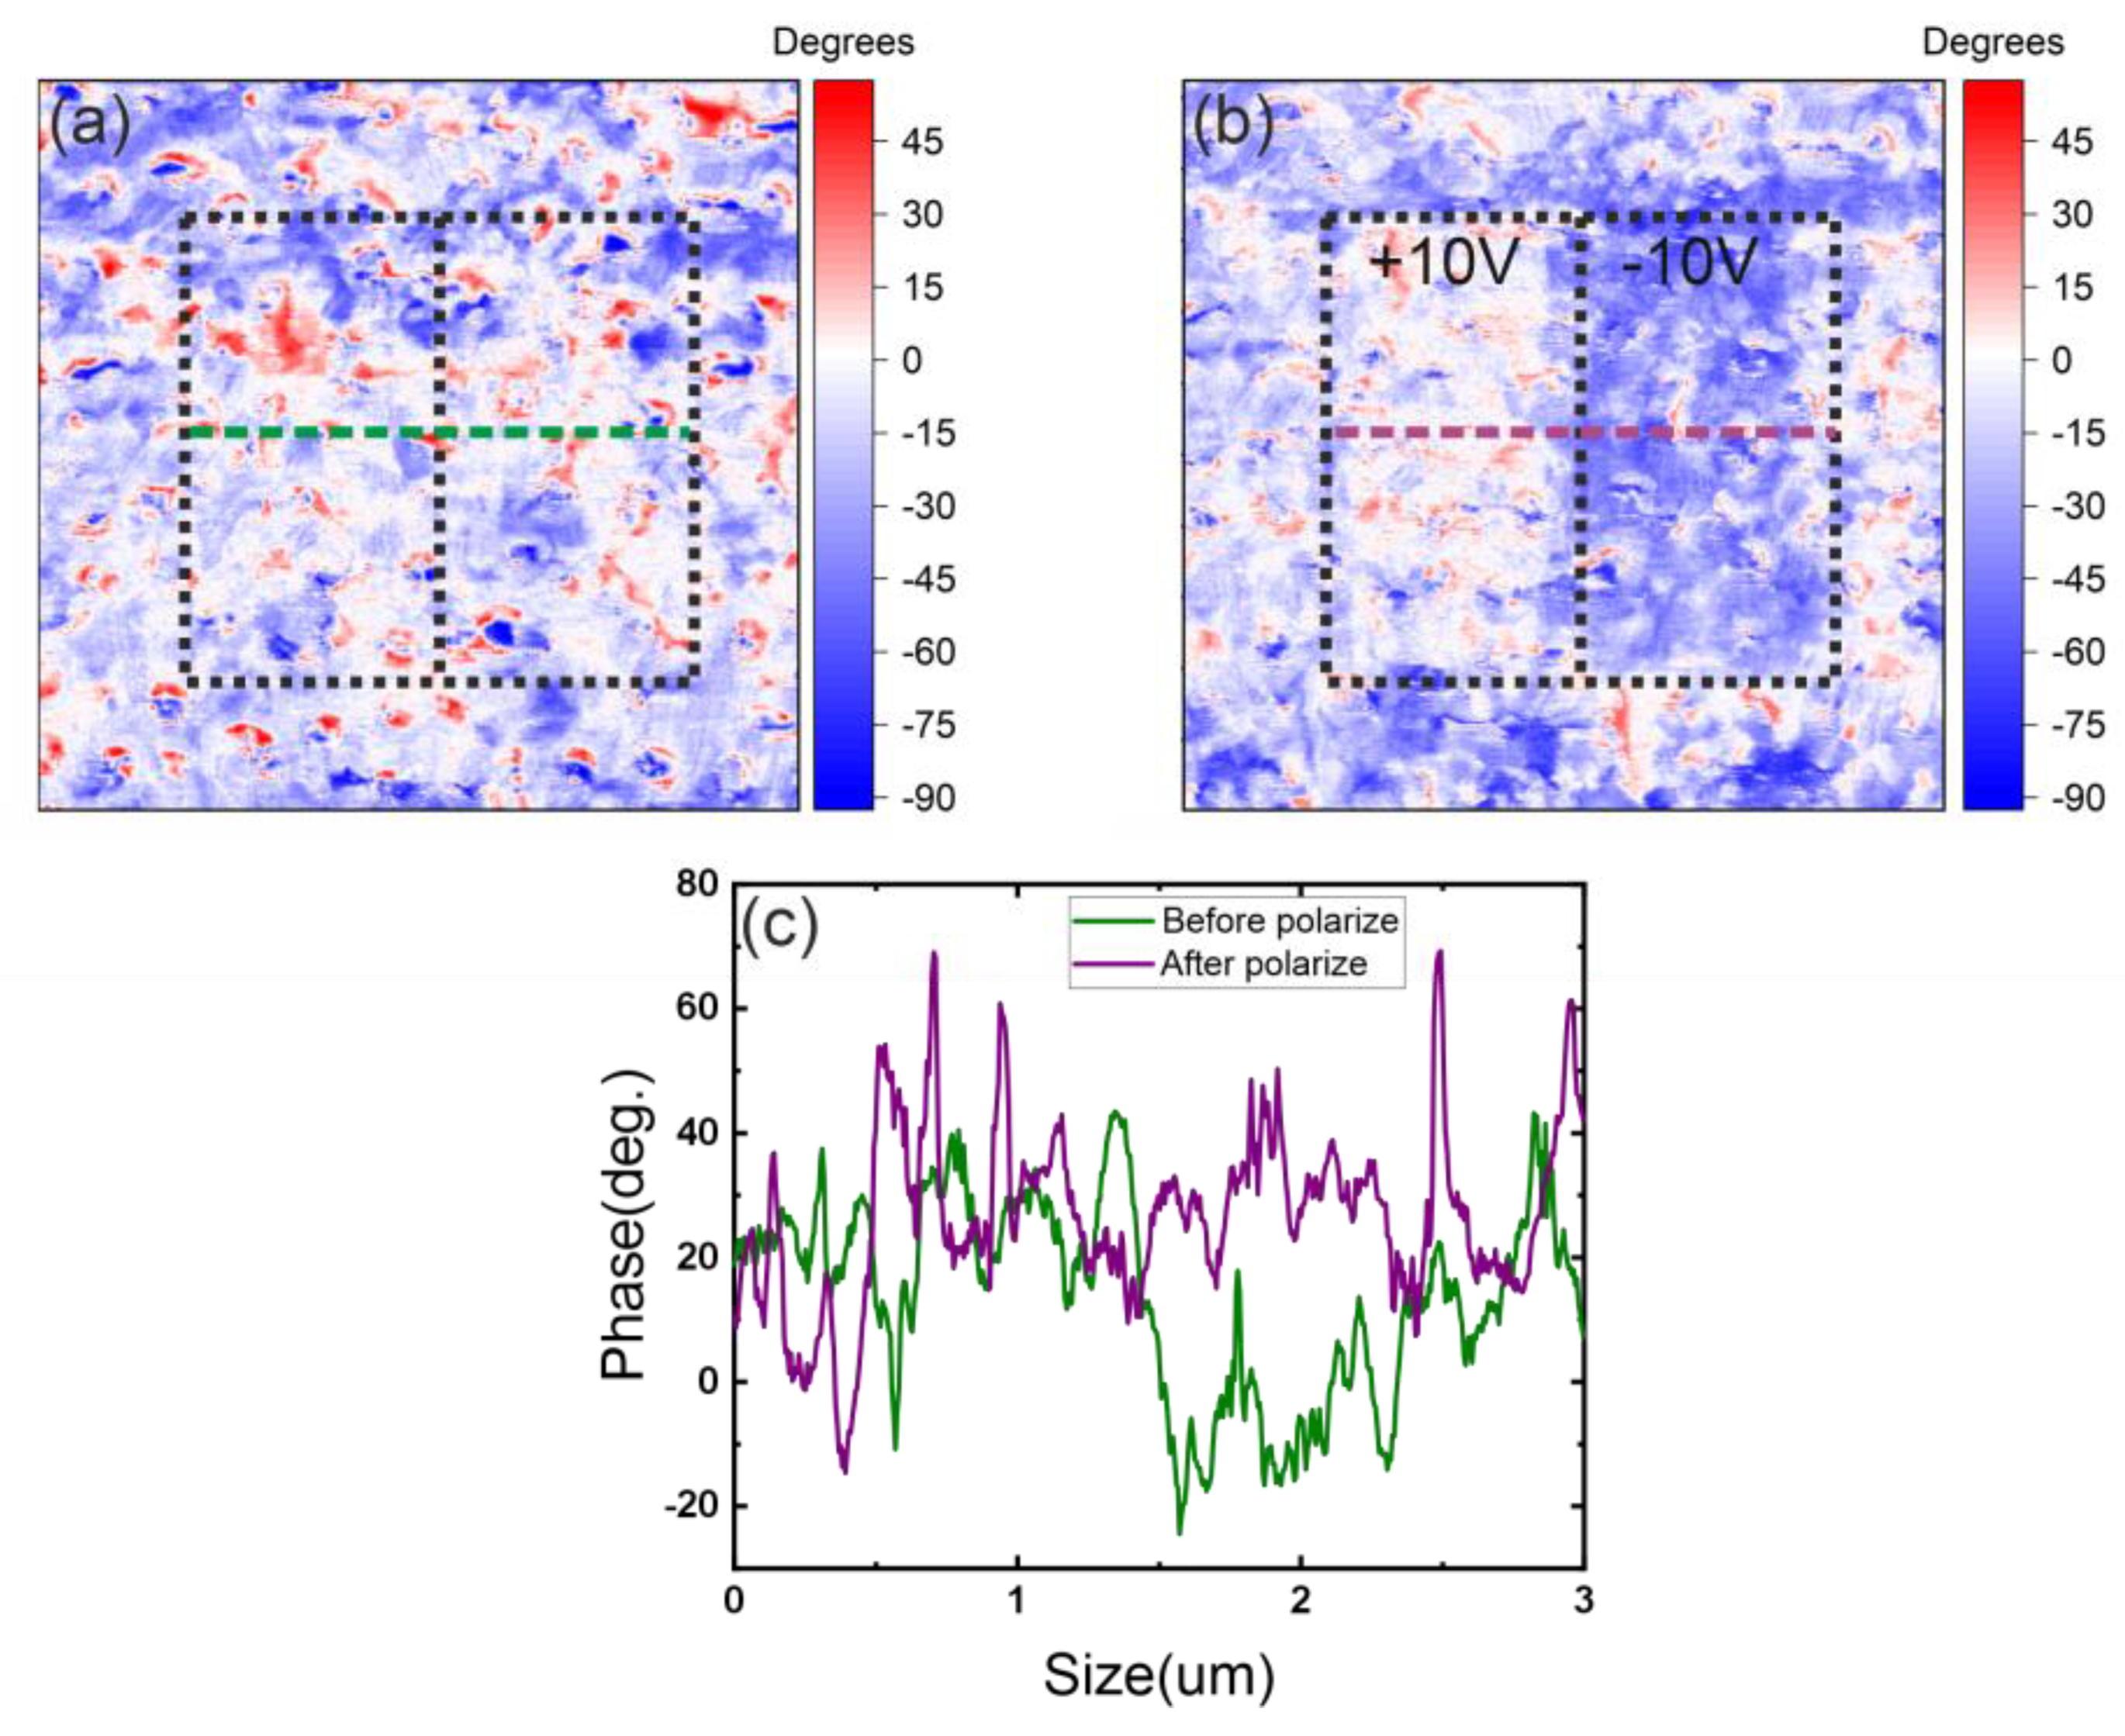
Figure 8.
Cross-section and scanning results of the 3x3 mkm 6.6% PVP sample (4 layers of PZT, thickness 390 nm, 33.3% porosity), (a) polarization contrast before repolarization, showing the domain structure and polarization distribution in a highly porous film, (b) polarization contrast after repolarization, demonstrating the material’s response to charge lithography and the effectiveness of polarization switching, (c) cross-section along the scan width, illustrating the variations in polarization response and the influence of increased porosity on domain alignment.
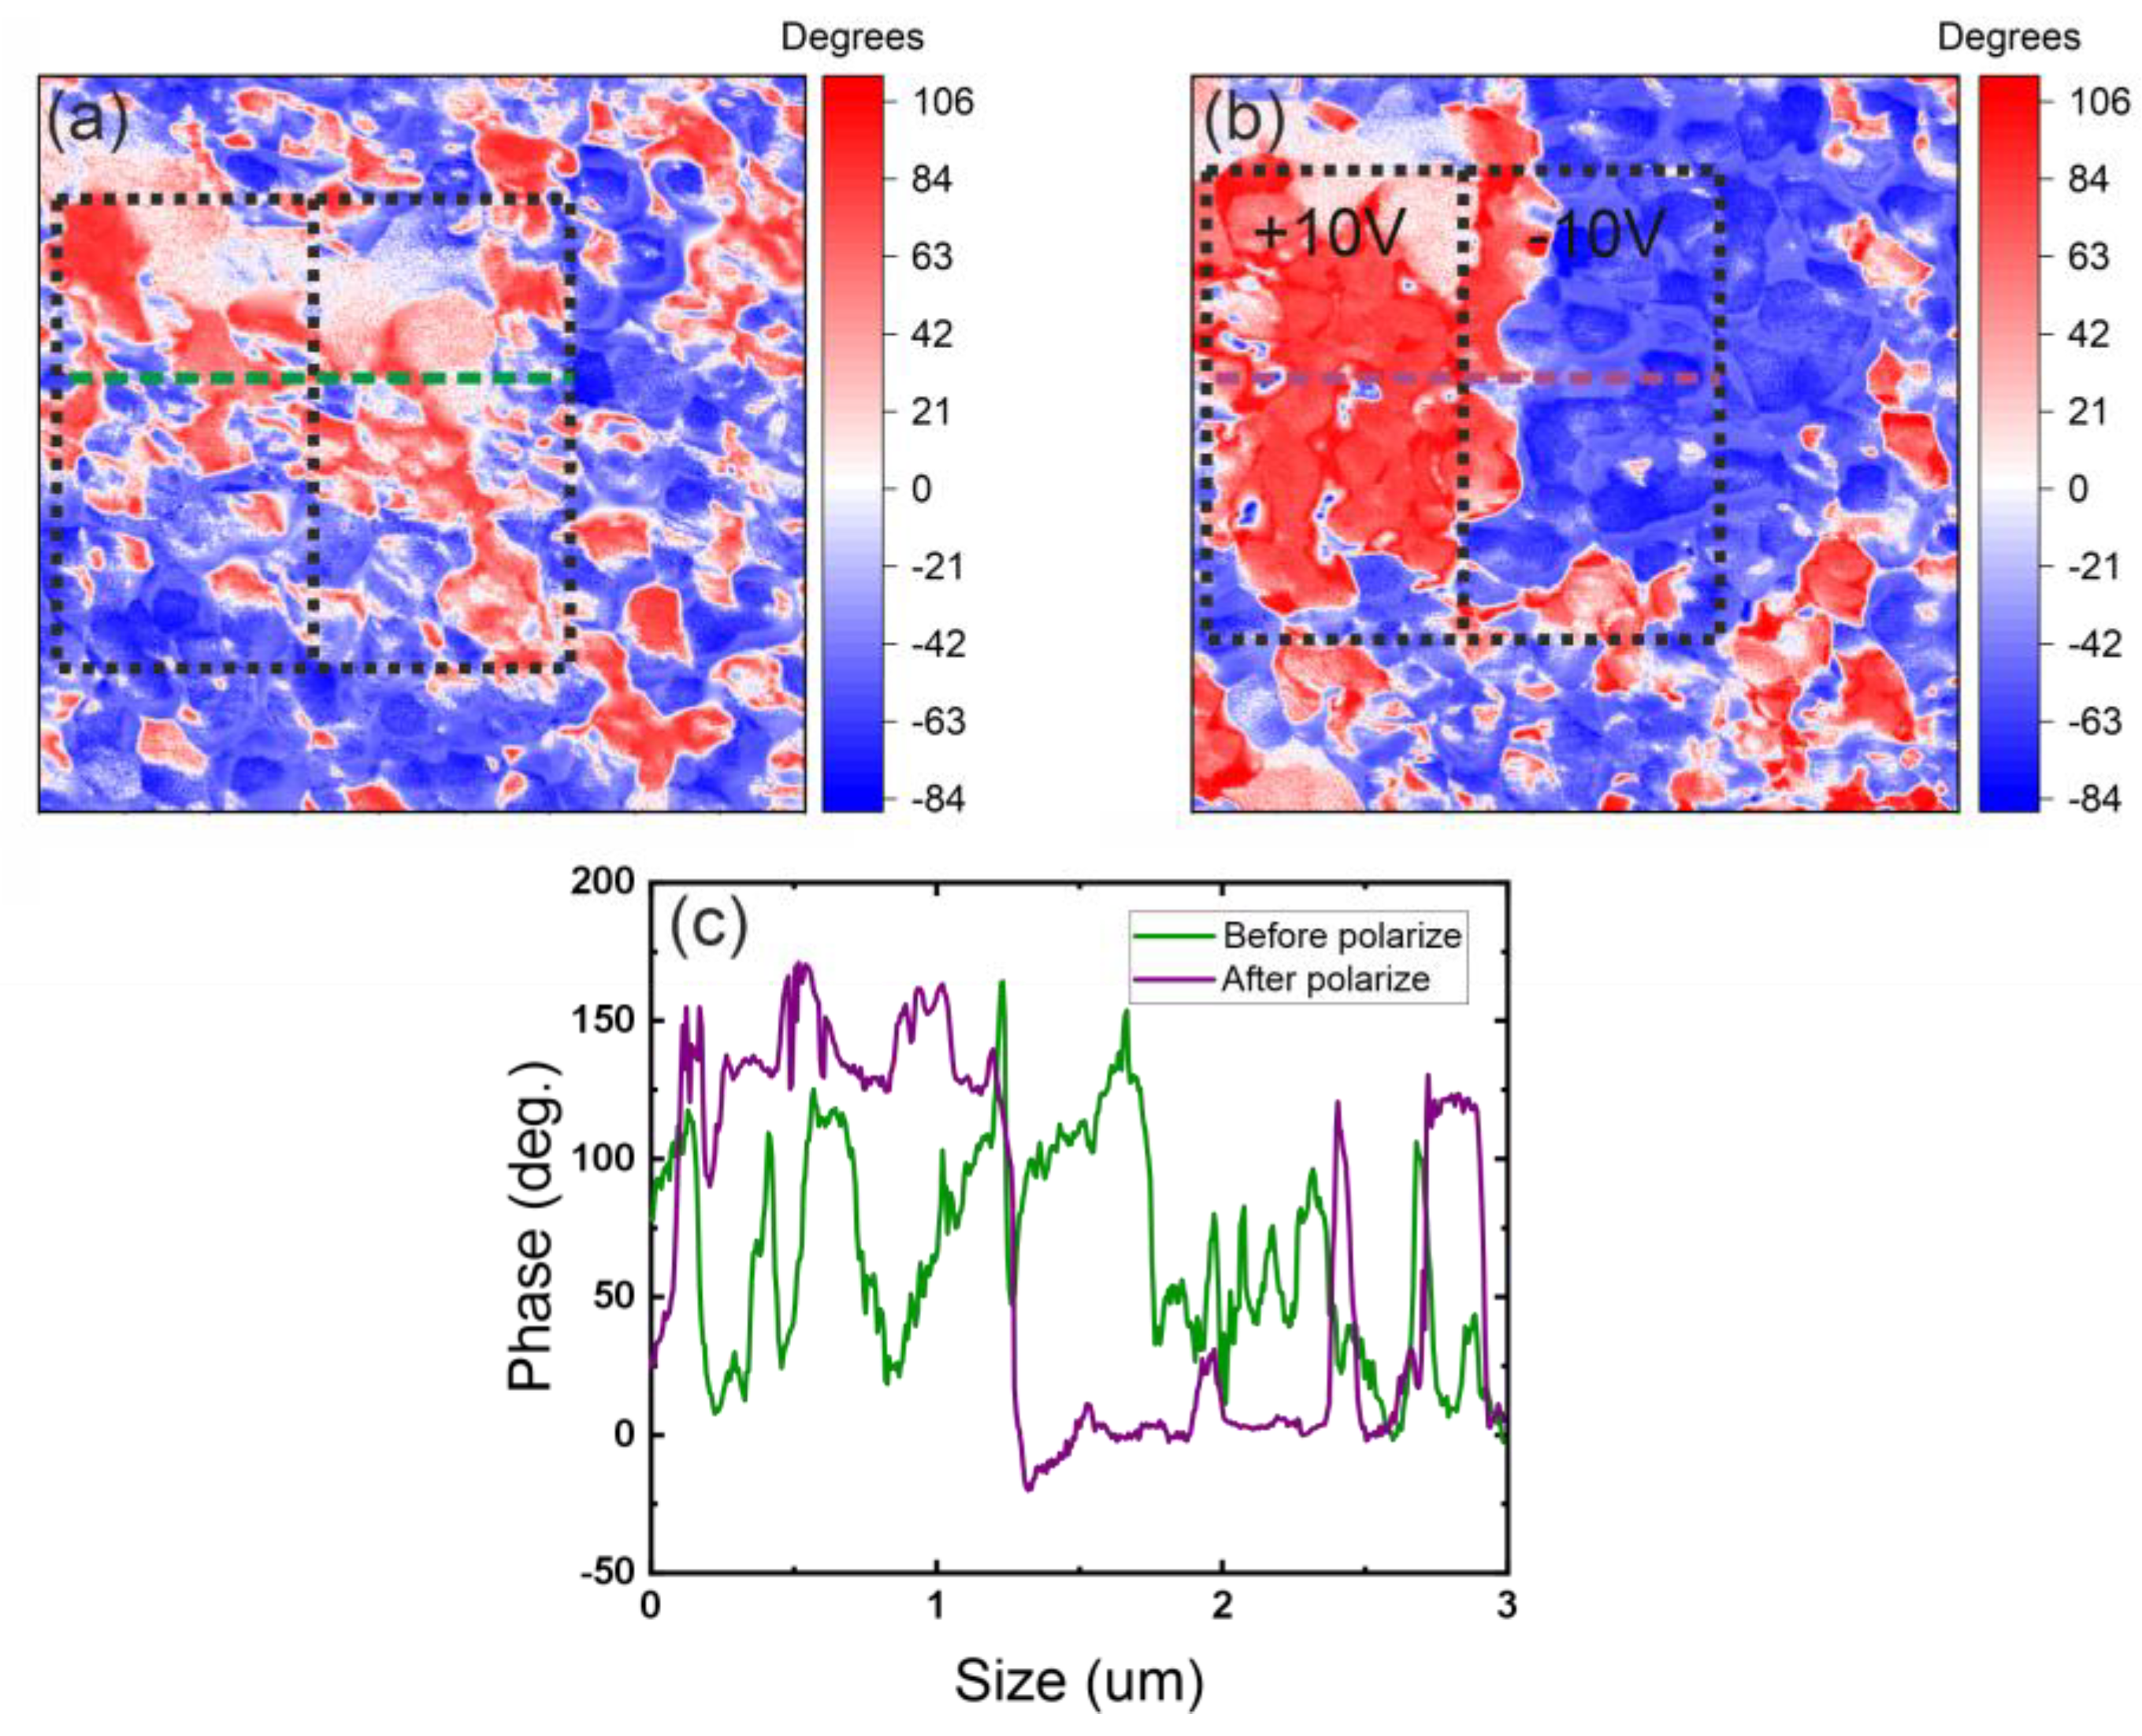
Figure 9.
Cross-Section and scanning results of the 3x3mkm 14% PVP Sample (3 layers of PZT, approximate thickness 400 nm, porosity not measured) , (a) polarization contrast before repolarization, showing the domain structure and polarization distribution in a highly porous film, (b) polarization contrast after repolarization, demonstrating the material’s response to charge lithography and the effectiveness of polarization switching, (c) cross-section along the scan width, illustrating the variations in polarization response and the influence of increased porosity on domain alignment.
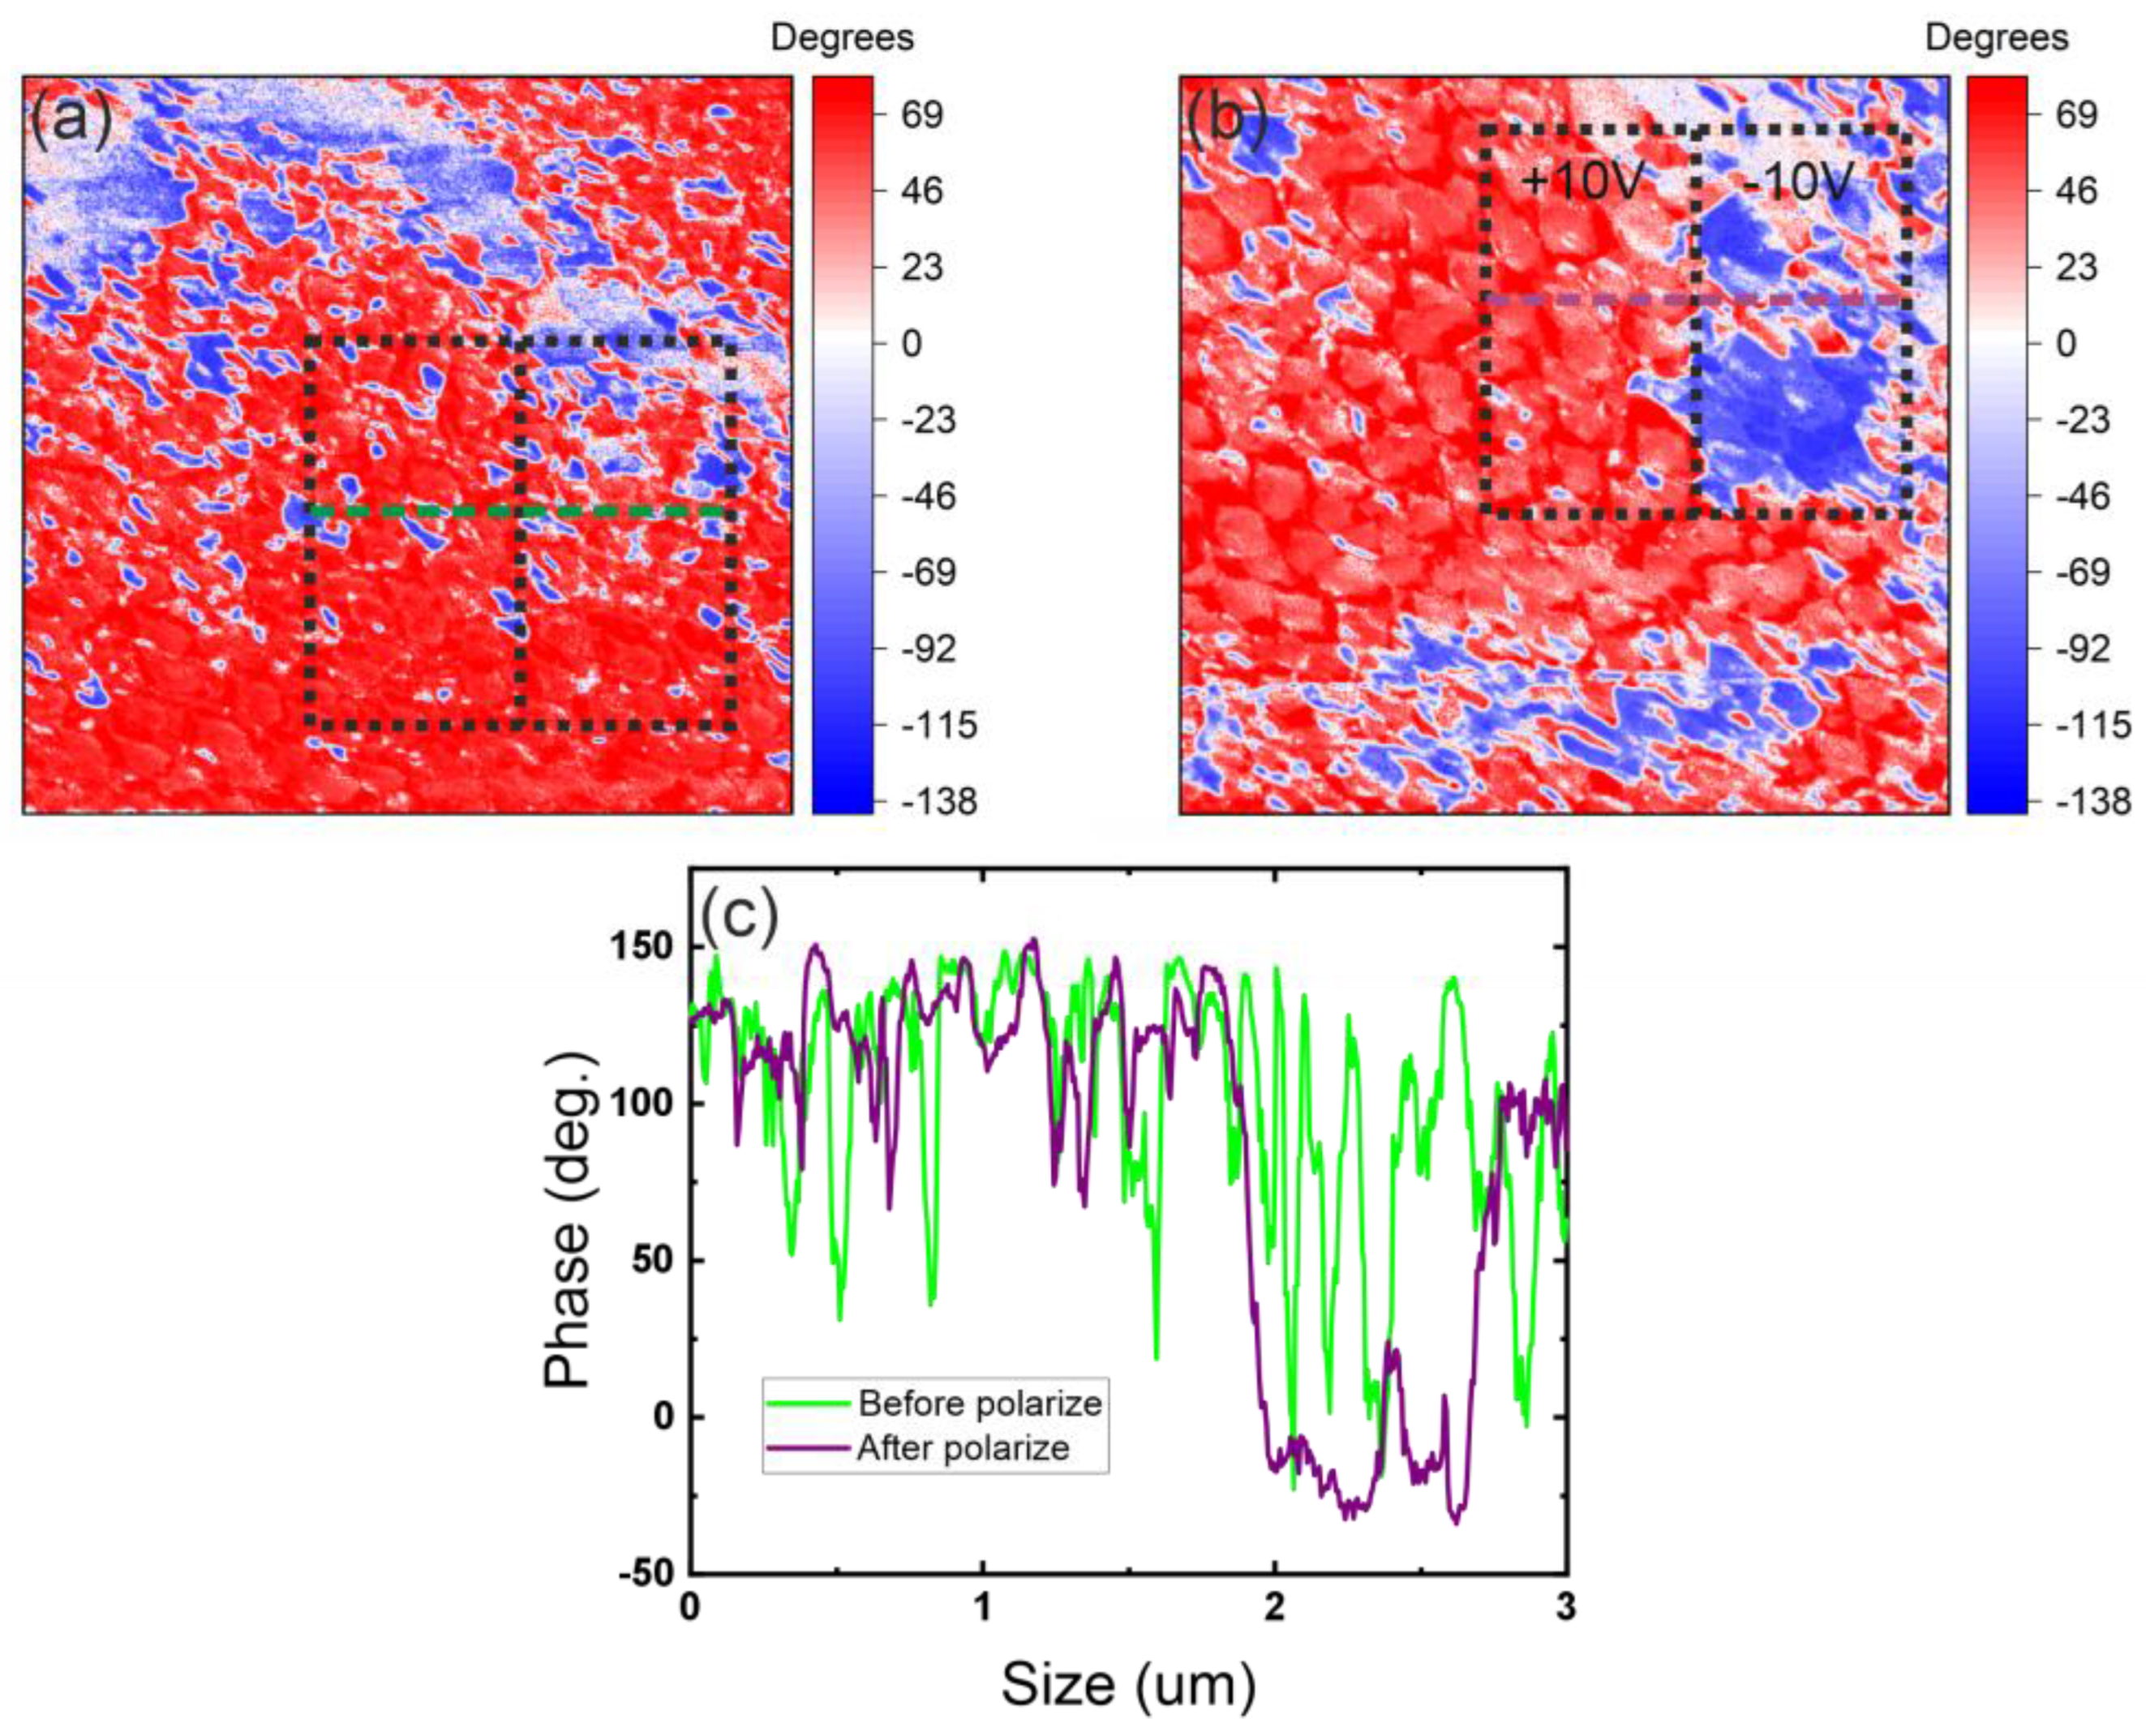

Table 1.
Samples parameters.
| № sample | wt % PVP360000 | Number of layers | Ellipsometry thickness, nm | n | Relative porosity , % | SEM thickness, nm |
|---|---|---|---|---|---|---|
| 1 | 0 | 10 | 370 | 2.543 | 0.0 | - |
| 2 | 1 | 9 | 390 | 2.397 | 6.8 | 407-503 |
| 3 | 3 | 7 | 370 | 2.288 | 11.0 | 322 – 347 |
| 4 | 6.6 | 4 | 390 | 1.829 | 33.3 | 375 – 378 |
| 5 | 14 | 3 | 400 | - | - | 357 – 363 |
Table 2.
Topography of samples with different porosity.
| wt % PVP 360000 | 3D and 2D visualization of Pb(Zr0,48Ti0,52)O3 topography | |
|---|---|---|
| 0 | 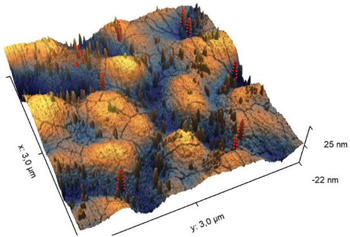 |
 |
| 1 | 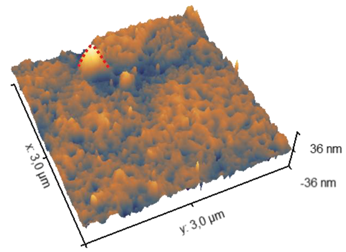 |
 |
| 3 | 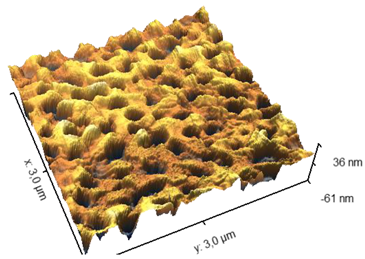 |
 |
| 6.6 | 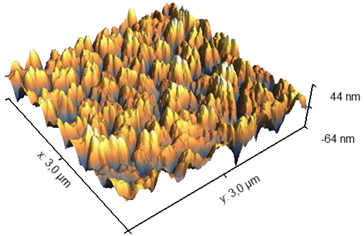 |
 |
| 14 | 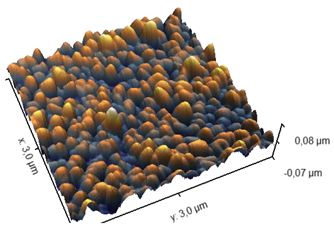 |
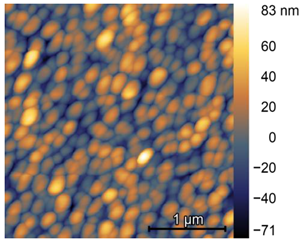 |
Table 3.
Comparison of topographical parameters.
| wt % PVP360000 | Average roughness (Sa), nm | RMS roughness (Sq), nm | Air phase area (As), mkm2 |
|---|---|---|---|
| 0 | 5,28 | 6,56 | 0 |
| 1 | 4,25 | 5,55 | 0,506 |
| 3 | 10,31 | 13,49 | 1,624 |
| 6,6 | 16,38 | 20,10 | 2,619 |
| 14 | 16,03 | 20,05 | 1,637 |
Disclaimer/Publisher’s Note: The statements, opinions and data contained in all publications are solely those of the individual author(s) and contributor(s) and not of MDPI and/or the editor(s). MDPI and/or the editor(s) disclaim responsibility for any injury to people or property resulting from any ideas, methods, instructions or products referred to in the content. |
© 2025 by the authors. Licensee MDPI, Basel, Switzerland. This article is an open access article distributed under the terms and conditions of the Creative Commons Attribution (CC BY) license (http://creativecommons.org/licenses/by/4.0/).
Copyright: This open access article is published under a Creative Commons CC BY 4.0 license, which permit the free download, distribution, and reuse, provided that the author and preprint are cited in any reuse.


