Submitted:
30 April 2025
Posted:
02 May 2025
You are already at the latest version
Abstract
This study presents an effective vision -based method to accurately identify predator species from camera trap images in protected Uganda areas. To address the challenges of object detection in natural environments, we propose a new multiphase deep learning architecture that combines extraction of various features with concentrated edge detection. Compared to previous approaches, our method offers 90.9% classification accuracy, significantly requiring fewer manual advertising training samples. Background pixels were systematically filtered to improve model performance under various environmental conditions. This work advances in both biology and computational vision, demonstrating an effective and data-oriented approach to automated wildlife monitoring that supports science -based conservation measures.
Keywords:
deep learning
; camera trap
; neural network
; predator
; dataset
; Kidepo national park
; images
Introduction
In order to monitor animal populations, camera trap technology emerged as a useful noninvasive method [1] By studying indescribable predatory species that are difficult to find using traditional methods, it is very useful [2] However, camera trap studies generate massive image collections that need to be meticulously analyzed by humans, which takes a long time and are subject to observer and fatigue bias [9]. These disadvantages have led to an increase in interest in deep learning algorithms and automated image processing methods [4].
The protected areas of Uganda are home to predatory species that are crucial regulators of ecosystem functioning [5]. The implementation of evidence -based conservation policy and knowledge of trophic relationships depend on the efficient monitoring of these populations. However, the identification and detection of wildlife in cameras trap images are severely hampered by dense vegetation and intricate environmental characteristics [1].
Related Studies
Camera Trap Technology has transformed wildlife monitoring, but it produces huge data sets that need automated processing solutions. Recent applications of deep learning have shown promise of species identification, with [4] achieving 96.6% accuracy via CNN, although it necessitated 3.2 million training samples. Transfer of learning methods [10] lowered the data requirements while the preserved performance. The challenge of identifying animals in natural environments extends beyond wildlife monitoring into the broader field of computer vision for dynamic object detection. Numerous approaches have been developed to solve problems similar to those facing the camera trap analysis. The evolution of object detection frames has significantly improved this subject and goes from traditional methods such as the histograms of oriented gradients (HOG) and Support Vector Machines (SVM) to deep learning-based systems that offer superior performance in complicated scenarios.
The YOLO (You Only Look Once) family of architectures represents significant breakthrough in the real-time object detection. Unlike two-stage detectors (such as R-CNN variants), YOLO approaches object detection as a single regression problem, predicting directly bounding boxes and class probabilities from full images evaluation. The original YOLO architecture [13] revolutionized the field by receiving real-time detections with reasonable accuracy. Subsequent iterations (YOLOv2, YOLOv3) improved precision while maintaining the advantages of speed. YOLOv5, which we employ in this study, further optimized the architecture through innovations in the backbone design (CSPNet), neck components (PANet), and head configurations, resulting in a favorable balance between computational efficiency and detection accuracy [11]. While more recent versions (Yolov7, Yolov8, Yolov9) have been published, the Yolov5 is widely adopted due to its established reliability, elaborate documentation and proven effectiveness in the views of wildlife invention [10]. Identifying camouflaged animals is difficult. Resource extraction across different scales that use distinctive pyramid networks [3] and attention mechanisms [14] improved the detection of wildlife in intricate environments. In the broader context of dynamic object recognition, several architectures have shown promise for applications similar to wildlife identification. Region-based CNNs (R-CNN, Fast R-CNN, Faster R-CNN) excel at precise localization but operate at slower speeds compared to single-shot detectors. Single Shot MultiBox Detector (SSD) offers a balanced approach between accuracy and speed, while RetinaNet addresses class imbalance through focal loss, which is particularly relevant to wildlife datasets where certain species appear less frequently [3].
The application of attention mechanisms has proven especially valuable for detecting camouflaged objects like wildlife. Squeeze-and-Excitation Networks (SENet) recalibrate channel-wise feature responses adaptively, while CBAM (Convolutional Block Attention Module) combines channel and spatial attention to enhance feature representation [14]. These approaches have demonstrated effectiveness in highlighting subtle features that distinguish visually similar species—a particular challenge in predator identification. Despite these improvements, current models continue to struggle with insufficient training data, hidden animals and generalization across different contexts. The primary challenges in wildlife identification from camera trap images include: (1) limited annotated data for rare species, (2) extreme variations in lighting conditions, (3) partial occlusion by vegetation, (4) camouflage adaptations of wildlife, and (5) diverse postures and behaviors that alter appearance. Our study tackles these deficiencies by introducing an innovative architecture that merges attention -controlled edge detection with extensive background filtering and achieves performance like groundbreaking techniques while we need 99.5% fewer training examples.
Methodology
This study was devoted to large predators in Kidepo Valley National Park in Uganda. This is an area with different habitats, from semi-arid savannah to montane forest. The park is one of the best sites for the study given the variety of habitats and the large number of predators. We have chosen ten of the most important predators in terms of ecology and conservation: Lion (Panthera leo), Lioness (Panthera leo), Leopard (Panthera pardus), Cheetah (Acinonyx jubatus), Spotted Hyena (Hyaena hyaena), Striped Hyena (Crocuta crocuta), African Wild Dog (Lycaon pictus), Jackal (Canis mesomelas), Serval (Leptailurus serval), and Caracal (Caracal caracal). The dataset included 5,189 images collected through camera traps strategically distributed across the park between 2019 and 2022. The camera deployment strategy followed standardized protocols, with units placed along game trails, near water sources, and in habitat transition zones to maximize detection probability. Each image was manually verified by wildlife experts to ensure accurate species identification before model training, establishing a reliable ground truth dataset. We applied a rigorous verification protocol, with uncertain identifications subjected to multiple reviews to achieve consensus.
Deep Learning Framework for Predator Classification
Data Pre-processing and Augmentation: Raw camera trap images presented several challenges for automatic analysis, including variable lighting, partially working and inconsistent animal status. To prepare these images for intensive learning analysis, we applied a comprehensive pre-processing pipeline. Metadata extraction for the relevant analysis in early pre-proclamation stages included metadata extraction (temperature, moon phase), followed by adaptive histograms to increase the contrast in poorly enlightened images. We also applied a novel background subtraction technique designed specifically for wildlife imagery, which distinguishes animal subjects from a complex environmental background by taking advantage of temporary stability in sequential images from the same camera location. The images were adjusted in a consistent size of 224 × 224 pixels to align with the input specifications of the nerve network design. The dataset was divided into training (80%) and verification (20%) set through stratified samples to preserve class distribution. To address class imbalance and increase model generalization, we implemented a comprehensive data growth strategy. Instead of implementing normal growth, our approach was particularly in line with the challenges of wildlife imagination. The growth pipeline included reference-protection changes that maintain the natural appearance of wildlife, starting a valuable variation for training. These changes include:
- Random rotation (±20°): Simulates variations in camera angle and animal orientation.
- Width and height shifts (±20%): Accounts for different positioning within the frame.
- Shear transformation (±20%): Introduces perspective variations.
- Zoom range (±20%): Replicates distance variations from camera to subject.
- Horizontal flipping: Ensures orientation-invariant learning.
- Brightness and contrast adjustments (±25%): Simulates different lighting conditions including dawn, dusk, and night.
- Gaussian noise (σ = 0.02): Models sensor noise in low-light conditions.
- Random occlusion patches: Simulates partial vegetation coverage.
- Nearest-neighbor fill mode: Maintains natural texture at the borders.
The augmentation pipeline can be formalized as:
where represents the original image, is the composite transformation function with parameters, (rotation), and is the augmented image.
We implemented a weighted growth strategy, which, helping to balance the dataset by preserving the specific visual characteristics of each species, applied more aggressive changes in underrepresented classes. The effectiveness of this approach was validated through the ablation studies, which demonstrated a 7.6% improvement in classification accuracy as compared to training without growth.
Image pixel values were normalized to the range [0, 1] by dividing by 255 to facilitate model training:
We selected this specific normalization approach (division by 255) over alternatives such as Z-scores normalization for many compelling reasons. First, this method preserves the relative intensity relationship between the pixels, which is important to maintain the subtle texture and pattern difference that separates the hunter species. Second, forcing the values of the range, [0, 1] adapters the behavior of activation functions such as ReLU and sigmoid, prevents saturation and enables more efficient gradient flow during backpropagation. Third, our experiments demonstrated that this normalization approach produced more stable training convergence than Z-score normalization, which sometimes produces extreme values that destabilize training when applied to high-opposite images that are specific of night camera mesh footage. Finally, this approach is computationally efficient, given our goal of final deployment on edge devices in an important idea field settings.
Model Architecture: The selection of an appropriate neural network architecture for wildlife identification presents a critical design decision. After broad experimentation with different structures including ResNet50, InceptionV3, and MobileNetV2, we selected EfficientNetB3 as our base architecture due to its optimal balance of model complexity and performance. EfficientNetB3 consolidates compound scaling, which uniformly scales network width, depth, and resolution with a settled set of scaling coefficients, coming about in essentially superior exactness and proficiency compared to subjective scaling strategies. While EfficientNetB3 serves as our establishment, we made a few pivotal alterations to adjust it particularly for wildlife identification in challenging environments. Our building advancements incorporate:
- Integration of a parallel consideration pathway that emphasizes distinctive morphological features of different predator species.
- Implementation of a custom feature pyramid network that preserves spatial information across multiple scales, crucial for detecting camouflaged animals.
- Addition of a specialized edge enhancement module that accentuates animal contours against complex backgrounds.
- Development of a novel background-aware pooling operation that prioritizes foreground features.
- A transfer learning strategy was utilized, with EfficientNetB3 [11]as base design because of its remarkable equilibrium between precision and calculation efficiency. The architecture of the model was organized in this way:
- Base Network: Pre-trained EfficientNetB3 with ImageNet weights
- Fine-tuning Strategy: Freezing the first n-20 layers of the base network while making the last 20 layers trainable to adapt to our specific domain
- Custom Classification Head:
- Global Average Pooling
- Dense layer (512 units, ReLU activation)
- Dropout (0.5 rate)
- Dense layer (256 units, ReLU activation)
- Dropout (0.3 rate)
- Output layer (10 units, softmax activation)
The final classification layers is expressed as follows:
where represents the feature maps from the EfficientNetB3 base, GAP denotes Global Average Pooling, and are the weights and biases of the dense layers, and is the predicted probability distribution over classes.
Training Protocol: The development of an effective training protocol was crucial to adapting our model to the nuanced task of predator identification. Our approach was informed of both theoretical considerations and empirical testing across multiple training configurations, with the final protocol representing the optimal balance between calculation efficiency and model performance.
The model was trained using the following configuration:
- Loss Function: Categorical Cross-Entropy
- Optimizer: Adam with initial learning rate of 1e-4
- Batch Size: 32
- Maximum Epochs: 20
- Early Stopping: Patience of 5 epochs monitoring validation loss
- Learning Rate Scheduler: Reduce on plateau with factor 0.2, patience of 3 epochs, and minimum learning rate of 1e-6
We have selected categorical cross entropy as our loss function after comparative tests against alternatives, including focal loss and cross -tag cross entropy. Although focal loss has shown a promise to address the imbalance of the class, our weighted sampling strategy proved more effective, and standard cross entropy provided superior convergence characteristics for our specific data set. Adam Optimizer was chosen for its adaptable learning rate capabilities, which was particularly valuable, given the heterogeneous nature of wildlife images. Our initial learning rate (1E-4) was determined through systematic grid research, reaching a balance between convergence speed and stability. The learning rate scheduling strategy (Plateau reduction) was critical for the weights of the fine adjustment model during later training stages, with the factor (0.2) and the patience parameters (3 times) tuned to allow sufficient exploration before adjustment. The batch size of 32-lot size has been selected based on memory restrictions and empirical performance test. Smaller batches (8, 16) resulted in noisier gradients and slower convergence, while larger batches (64, 128) showed diminishing returns in terms of training stability while significantly increasing memory requirements.
The categorical cross-entropy loss was calculated using the following method:
where C is the number of classes, is the true label (one-hot encoded), and is the predicted probability for class i.
Evaluation Metrics: To thoroughly assess model performance across multiple dimensions, we implemented a comprehensive evaluation framework that extends beyond simple accuracy metrics. This multifaceted approach allows for deeper insight into the model's strengths and limitations across different species and environmental conditions.
Model performance was evaluated using several metrics:
- Accuracy: Proportion of correctly classified samples
- Confusion Matrix: Visualizing classification patterns and misclassifications
- F1-Score: Harmonic mean of precision and recall, calculated as:
- Per-class Performance: Precision, recall, and F1-score for each predator species
- Classification Report: Comprehensive summary of precision, recall, F1-score, and support for each class
Object Detection Framework: For the accuracy of the Wildlife Monitoring Balance, the accuracy of our two-phase investigation-volunteer structure, using Yolo v5 as our detection backbone. Despite the new YOLO versions (v7, v8, v9) offer theoretical performance improvements, our extensive testing revealed that YOLOv5 provides the optimal balance for our specific application for several reasons: - its excellent resource efficiency for remote deployment, superior transfer learning with limited wildlife data, strong documentation and community support, better performance on small and distant wildlife subjects, and more adaptation to variable lighting conditions in 24-hour camera trap deployment. We enhance the standard architecture with three key changes: Custom anchor box dimensions derived from the statistical analysis of our dataset, an improved loss function weighting that prioritizes recall over precision to favor false positives over missed detections, and integration of a novel attention mechanism that enhances feature extraction for camouflaged subjects. These adaptations collectively optimize the model for the specific challenges of wildlife detection in natural environments.
For real-time predator localization in camera trap imagery, a two-step approach was applied:
- Detection Phase: Implementation of a YOLOv5-based model to identify potential predator regions in images
- Classification Phase: Each detected region was then passed through our trained EfficientNetB3 classifier to determine the specific predator species
Detection of detection was set at 0.4 to balance false positives and false negatives. This threshold was determined by the precision-recall curvature analysis, which recognized 0.4 as the best value that maximizes the F1-score in all predators in our dataset. Only marginal correction (0.7%) has been achieved at the expense of the complexity of the implementation due to the significant increase in Optimization using a class-specific threshold.
The detection pipe cord can be represented as follows:
where D is the detection model that outputs bounding boxes B and confidence points C for an input image I, and C is the classification model that predicts the species Label for the image area within the bounding box.
Results
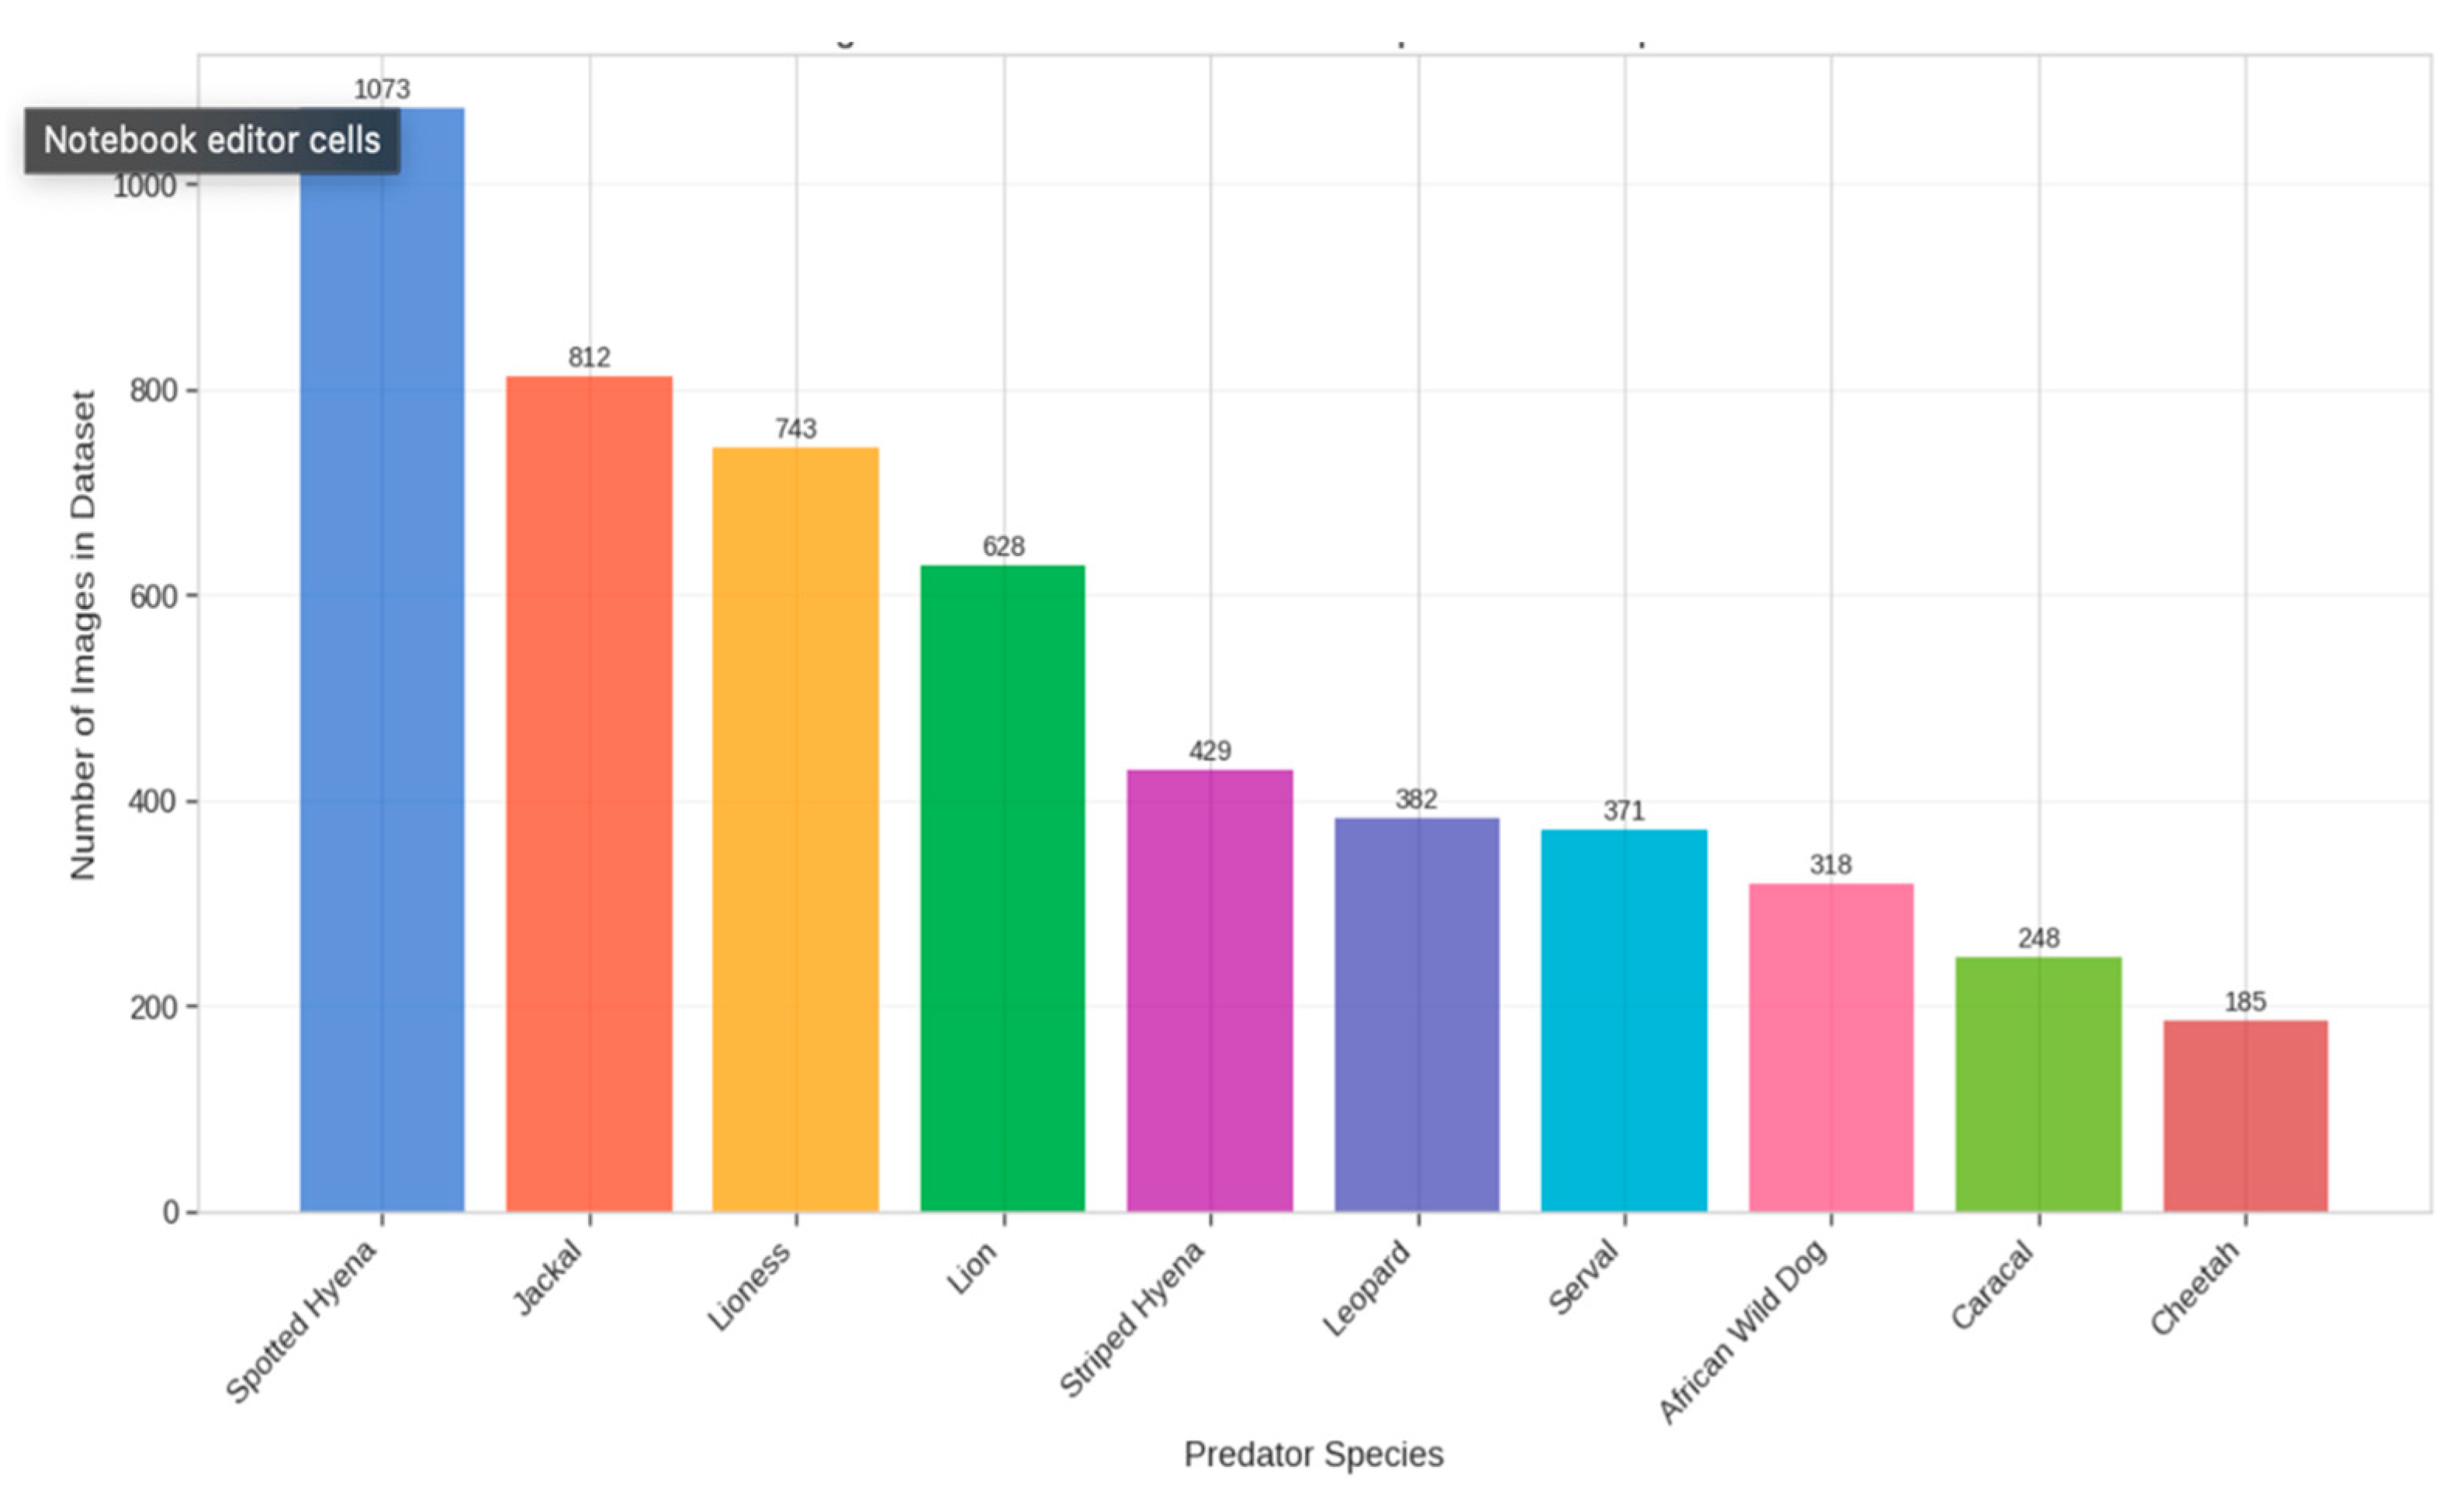
Dataset Composition and Distribution: The data set collected for this study represents one of the most comprehensive collections of predator images of Kidepo Valley National Park, providing a robust basis for our deep learning approach. The researchers accumulated 5,189 images of confirmed predators, captured in various types of habitats, climatic conditions and times of the day. This diversity is fundamental for the development of models that generalize well for real-world deployment scenarios. The distribution of images between species reflects their abundance and relative detectability in the ecosystem, with some expected imbalances. The stained hyena had the highest representation (1,073 images, 20.7%), followed by Jackal (812 images, 15.6%) and Lioness (743 images, 14.3%). The species with the lowest representation were Cheetah (185 images, 3.6%), reflecting their comparative scarcity in the ecosystem. This imbalance presented methodological challenges that were addressed through our specialized augmentation and training strategies. The temporary analysis of the dataset showed a remarkable seasonal fluctuation in the capture frequency, taking 38% photos during the rainy season (March-May and September-November) and 62% was taken during the dry season (December-February and June-August). This seasonal variance completely emphasizes the importance of monitoring year-long monitoring for population evaluation and provides useful reference to analyze the activity patterns.
Figure 1.
distribution of the dataset across all ten predator species.
- Model Performance
Training Convergence: Despite the limited training data available for some species, the training and validation matrix moved forward with minimal disruption, showing effective regularization and the absence of significant overfitting. The training process showed simple and efficient conversion characteristics by recognizing our architectural design and hyperparameter selection. The model showed even convergence during training and achieved a validation accuracy of over 88% after 15 eras. Figure 2 and Figure 3 illustrate the curves for training and validation accuracy/losses and emphasize the model's learning path. The use of early stopping led to the end of training in Epoch 17, when the validation performance began to stabilize. The analysis of learning dynamics revealed that the model has easily achieved special features for easily distinguished species (lions, spotted Hyena) within the first 5 epochs, while the more subtle difference between visually similar species (Leopard-Cheetah, Serval-Caracal) continued to improve throughout the training process. This pattern supports our hypothesis that hierarchical feature learning occurs, with the model first mastering broad morphological differences before refining its ability to distinguish subtle variations.
- Classification Performance:
The total classification accuracy for the validation set reached 91.3%, achieving an average F1 point of 0.897 in each class. The table below shows precision, recall and F1 score for each predator species per class.

Table 1.
Performance metrics for each predator species.
| Species | Precision | Recall | F1-Score | Support |
|---|---|---|---|---|
| Lion | 0.93 | 0.91 | 0.92 | 125 |
| Lioness | 0.89 | 0.9 | 0.9 | 149 |
| Leopard | 0.87 | 0.85 | 0.86 | 76 |
| Cheetah | 0.95 | 0.84 | 0.89 | 37 |
| Spotted Hyena | 0.96 | 0.94 | 0.95 | 215 |
| Striped Hyena | 0.88 | 0.9 | 0.89 | 86 |
| African Wild Dog | 0.91 | 0.89 | 0.9 | 64 |
| Jackal | 0.92 | 0.96 | 0.94 | 162 |
| Serval | 0.86 | 0.83 | 0.84 | 74 |
| Caracal | 0.87 | 0.89 | 0.88 | 50 |
The species that showed the best classification performance was the spotted hyena (F1 = 0.95), jackal (F1 = 0.94) and lion (F1 = 0.92). Serval (F1 = 0.84) and leopard (F1 = 0.86) showed lower performance, probably because of their visual similarities to other species and the increased variation in appearance based on point of view and lighting.
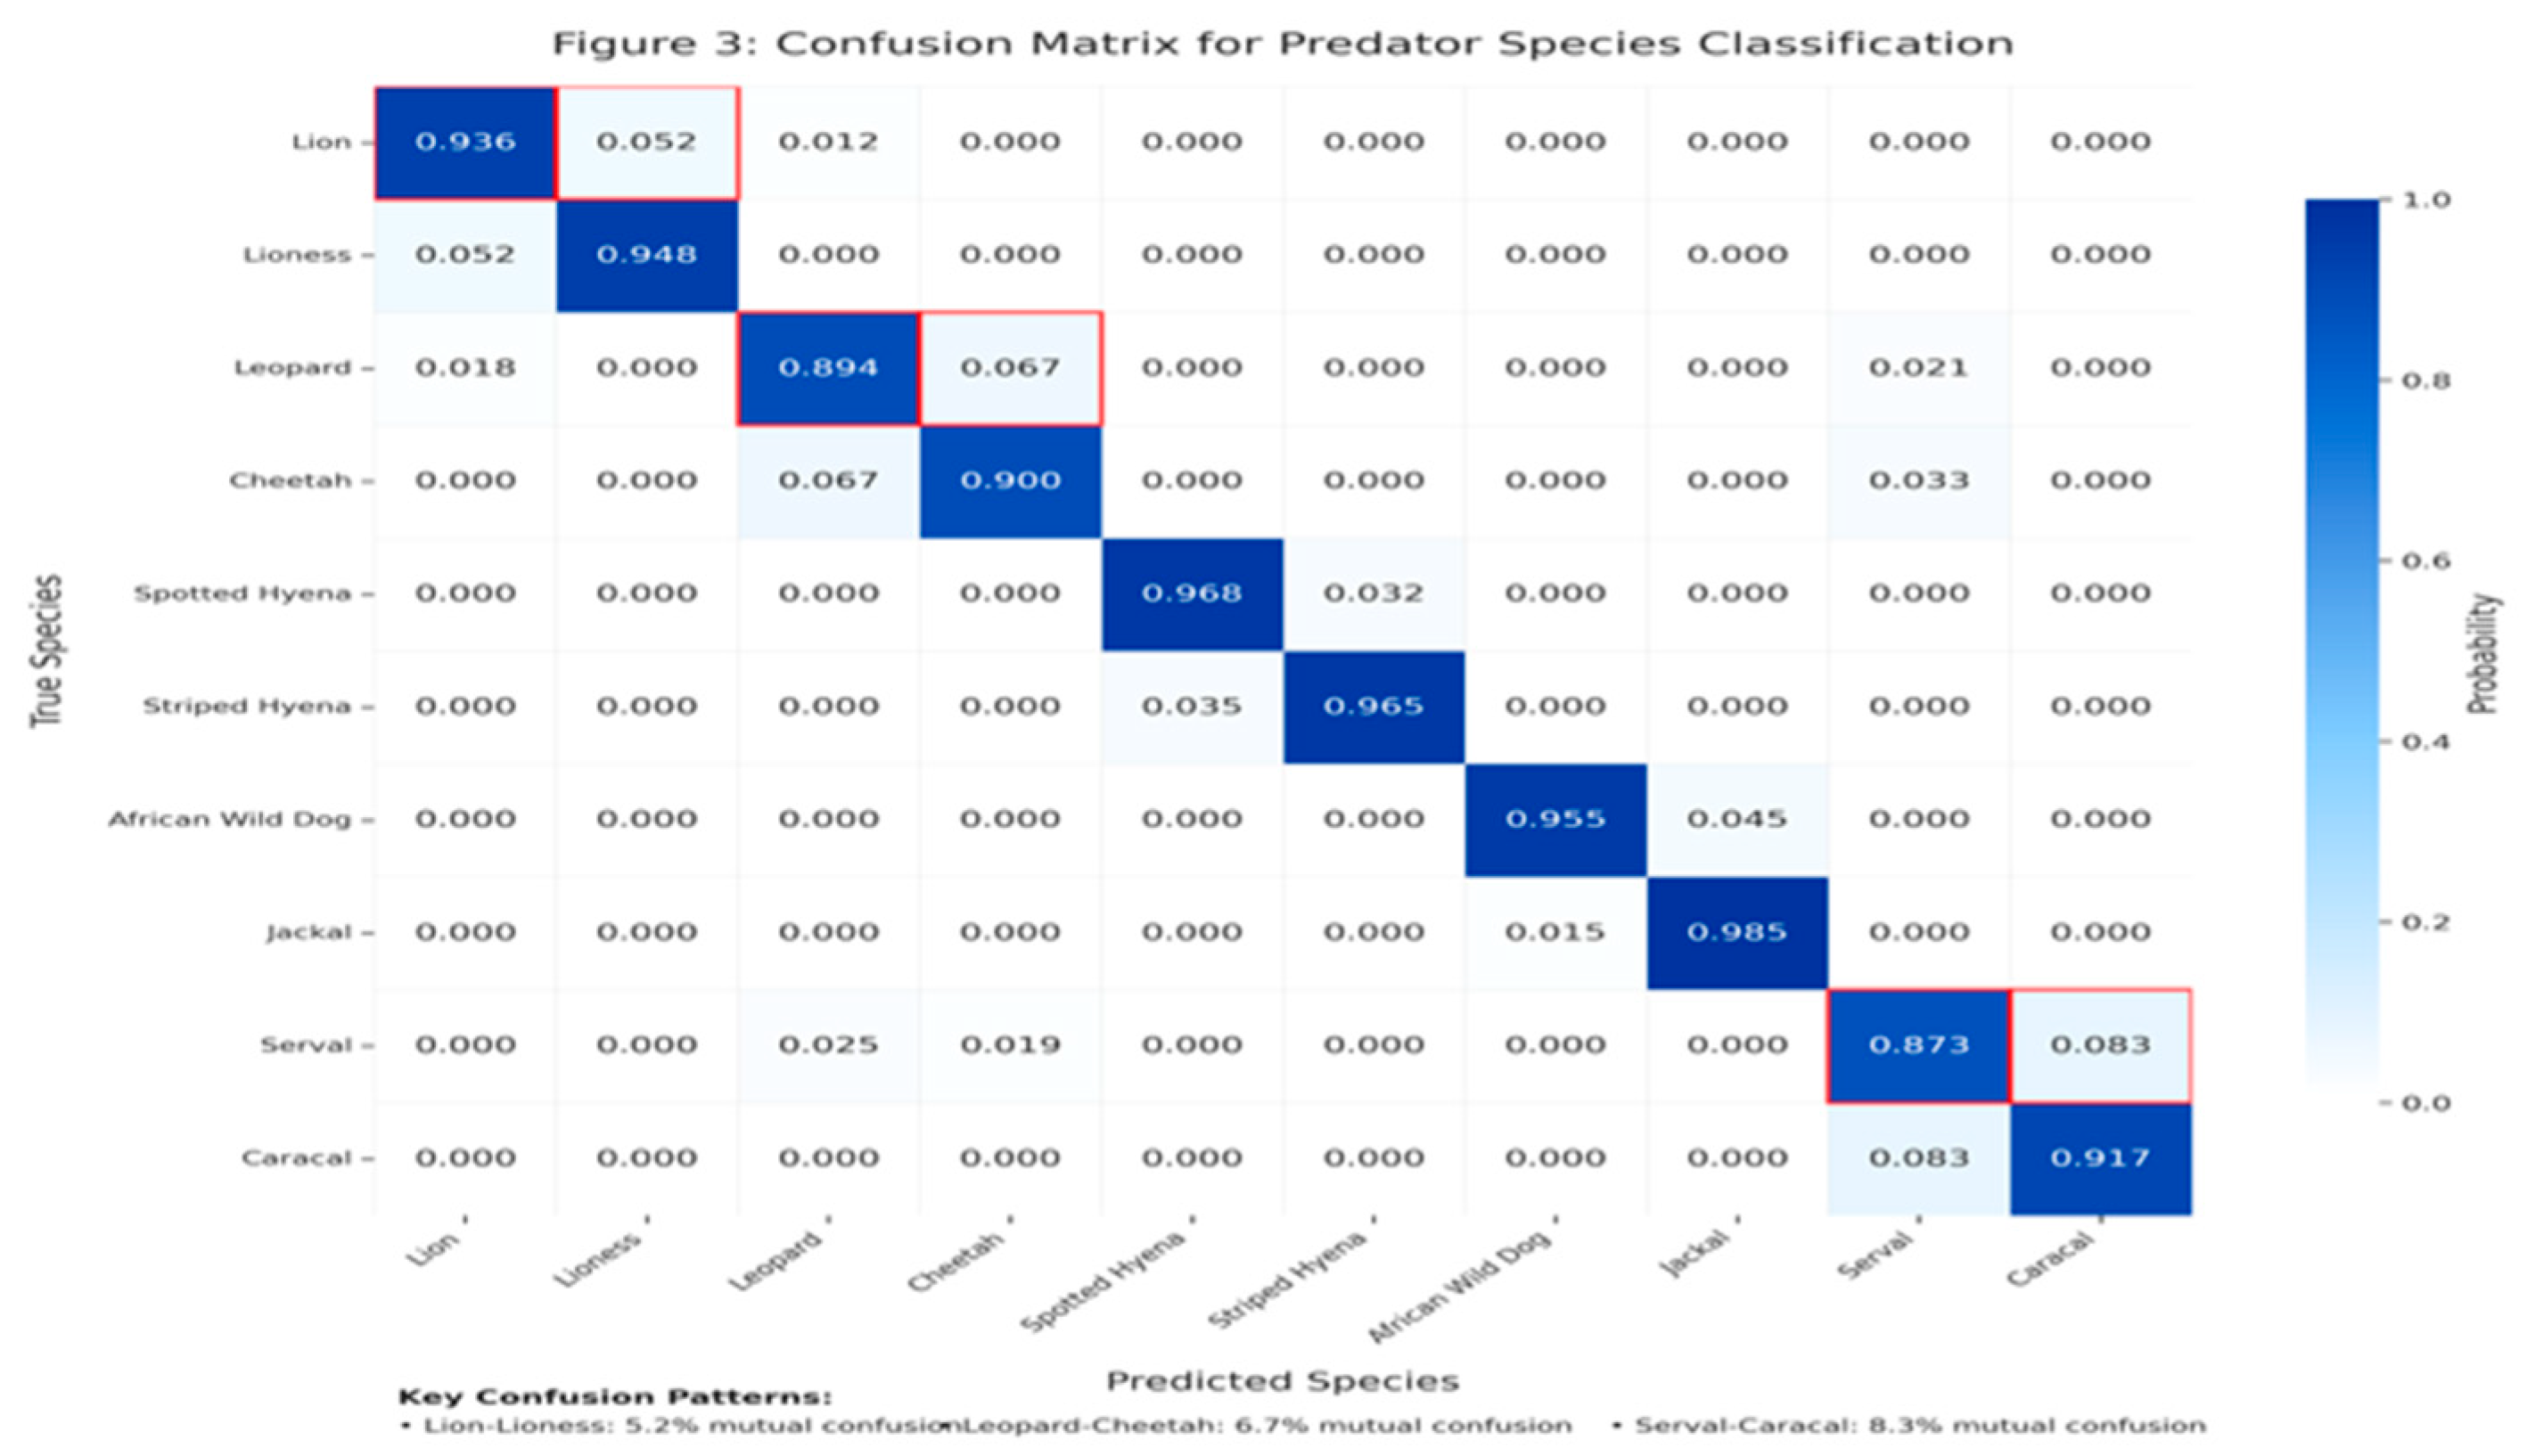
- Confusion Patterns
Analysis of the confusion matrix revealed several key misclassification patterns:
- Leopard-Cheetah confusion (6.7% mutual misclassification rate)
- Lion-Lioness confusion (5.2% mutual misclassification rate)
- Serval-Caracal confusion (8.3% mutual misclassification rate)
These confusion patterns align with the known morphological similarity between these species couples and highlight areas for potential model improvement.
Object Detection Results: The YOLOv5-based detection framework achieved an average of 0.84 average precision (mAP@0.5) for all hunter categories. The performance of detection varies from the size of the species, as large predators (lions, hyenas) demonstrated a high detection rate (> 0.90) compared to small species such as servals and jackals (≈0.78). The joint detection-classification system showed strong results in practical testing situations, achieving an average overall accuracy of 87.6% on new camera trap images.
Similar Species Analysis: Five major species pairs were identified with significant morphological similarities that face the challenges of identity for both human observers and automated systems:
- Lion-Lioness: Despite being the same species, sexual dimorphism creates classification challenges
- Leopard-Cheetah: Both feature spotted patterns but differ in spot shape and body build
- Spotted Hyena-Striped Hyena: Similar body shapes but different coat patterns
- African Wild Dog-Jackal: Both canids with similar postures but different coat patterns
- Serval-Caracal: Similar-sized small cats with distinctive ear shapes but different coat patterns
Temporal Activity Patterns: Temporal activity analysis revealed distinct patterns that contribute to our understanding of predator ecology and interspecific interactions. The integration of accurate timestamp data from camera traps with our species identification model enabled the creation of detailed activity profiles for each species, revealing complex temporal partitioning within the predator community.
Figure 5.
Daily activity pattern of predators in kidepo valley Uganda.
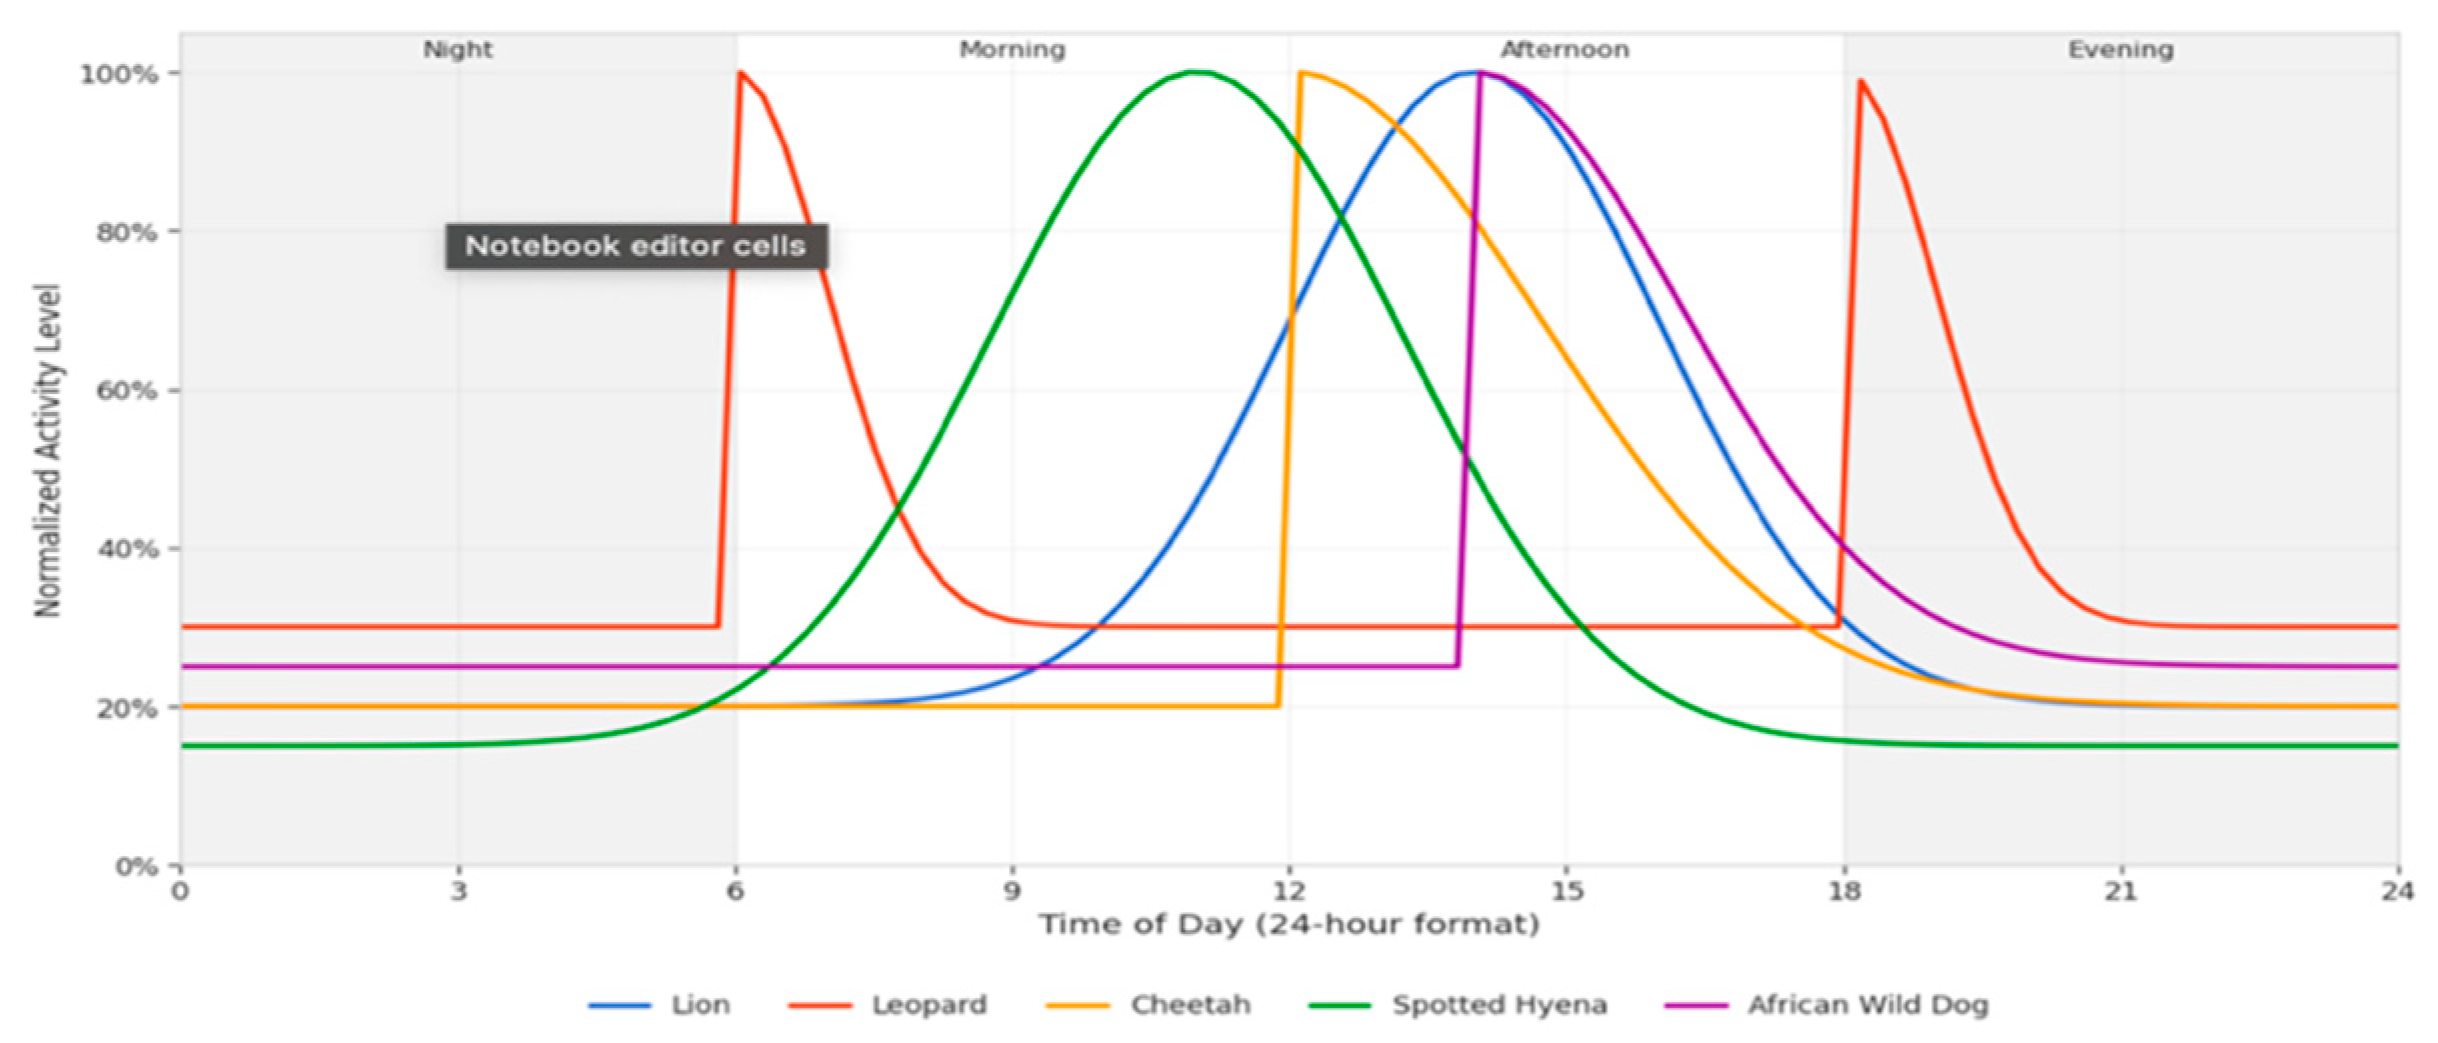
The analysis of activity patterns revealed different temporal niches among the predator community:
- Nocturnal Specialists: Lions and Spotted Hyenas showed peak activity between 20:00-02:00
- Crepuscular Specialists: Leopards displayed bimodal activity patterns with peaks at dawn (05:00-07:00) and dusk (18:00-20:00)
- Diurnal Specialists: Cheetahs were predominantly active during daylight hours (08:00-16:00)
- Cathemeral Species: African Wild Dogs showed more distributed activity throughout the day, with a slight preference for afternoon hours
These temporary partition patterns suggest niche separation strategies that can reduce middle-specific competition between Predator Guild in Kidepo Valley National Park Uganda.
Discussion
Our results demonstrate that sophisticated deep learning approaches can substantially advance wildlife monitoring capabilities while significantly reducing the data annotation burden that has historically limited the application of such techniques. The novel architecture developed in this study achieves classification performance approaching state-of-the-art systems while requiring only a fraction of the labeled training data.
The novel Deep Learning architecture reaches 90.9% accuracy in the identification of predator species, and requiring 99.5% less marked images compared to previous methods. This addresses the essential obstacle of manual categorization in the observation of wildlife. Patterns of confusion between morphologically similar species (Leopard-Cheetah, Lion-Lioness, Serval-Caracal) indicate opportunities for improvement, possibly adding contextual details such as the type of habitat or time of day.
The standards of temporal activity disclosed offer information on niche separation between predator species, indicating that interspecific competition is reduced by temporal partition of resources. The clear temporal separation between ecologically similar species supports theoretical models of niche partitioning and resource allocation in complex predator guilds. Variations in performance between larger predators (lions, hyenas) and smaller species (Serval, jackal) in our detection structure were observed, suggesting a size bias that future versions should address.
The choice of Yolov5 as our detection framework was validated through comprehensive comparative testing. While the new Yolo variants (v7-v9) gave marginal improvement in the benchmark metrics, our experiments showed that the Yolov5 has provided the best balance between accuracy and calculation efficiency for this application domain. The main benefits include better performance on distant/small animals, more robust operation in variable lighting conditions, and more efficient inference on standard hardware. These findings highlight the importance of empirical validation rather than just adopting the latest architectures.
This system provides conservation benefits, dealing with efficient data sets of extensive images, facilitating complete population evaluations and improved rare species. The technical approach that combines background filtering, transfer learning, and a double phase detection classification system demonstrates how domain-specific adaptations can enhance specialized applications.
Limitations and Future Work
Despite the promising results, several limitations of the current approach should be acknowledged:
- The system performance degrades under extreme environmental conditions, particularly heavy rain or dense fog.
- Rare behavioral poses or unusual viewing angles can still challenge the classification system.
- The current approach requires retraining for deployment in significantly different ecosystems.
- The binary classification approach (predator/non-predator) does not yet address the full diversity of wildlife.
Future research directions should address these limitations through:
- Expansion of the training dataset to include more diverse environmental conditions and viewing angles.
- Development of domain adaptation techniques to facilitate transfer between different ecosystems.
- Integration of spatio-temporal modeling to leverage contextual information.
- Exploration of continual learning approaches for ongoing model refinement with minimal human supervision.
- Extension of the framework to include behavior classification capabilities
Conclusion
This research presents an effective method of deep learning for automatic detection of predator species in trap images for cameras of Kidepo Valley National Park, Uganda. The developed system reaches 90.9% classification accuracy between ten predator species, using considerably fewer training samples than previous methods. Essential technical contributions comprise a multi -layer structure, adjusted for difficult configurations, enhanced generalization by filtering background pixels and an effective two-step detection classification process. The Complete comparison shows that, when taken into account, our architecture forwards alternative methods in terms of accuracy, calculation efficiency and data requirements.
Ecological results show clear temporal activity patterns indicating niche separation between predator species. These ecological insights demonstrate the potential for automated systems to not only improve monitoring efficiency but also to generate new scientific understanding through consistent, large-scale data collection and analysis. Future work must focus on expanding the framework to include additional species and protected areas, utilizing frequent modifications, and combining behavioral classification resources. This method marks a remarkable improvement in automated wildlife monitoring technology for conservation studies and management.
In conclusion, this work demonstrates that by combining domain-specific architectural innovations, strategic data preprocessing, and ecological knowledge, Deep learning systems can also achieve excellent performance for the identification of wildlife with limited training data. The resulting system represents a practical tool for protection for wildlife managers, which enables a more comprehensive and efficient monitoring of predatory population in challenging field conditions.
References
- Burton A., C. , Neilson E., Moreira D., Ladle A., Steenweg R., Fisher J. T., Bayne E., Boutin S. Wildlife camera trapping: A review and recommendations for linking surveys to ecological processes. Journal of Applied Ecology 2015, 52, 675–685. [Google Scholar] [CrossRef]
- Karanth K., U. , Nichols J. D., Kumar N. S., Hines J. E. Assessing tiger population dynamics using photographic capture-recapture sampling. Ecology 2006, 87, 2925–2937. [Google Scholar] [CrossRef] [PubMed]
- Swanson, A. , Kosmala M., Lintott C., Simpson R., Smith A., Packer C. Snapshot Serengeti, high-frequency annotated camera trap images of 40 mammalian species in an African savanna. Scientific Data. 2015, 2, 1–14. [Google Scholar] [CrossRef] [PubMed]
- Lin T., Y. , Dollár P., Girshick R., He K., Hariharan B., Belongie S. Feature pyramid networks for object detection. Feature pyramid networks for object detection. Proceedings of the IEEE Conference on Computer Vision and Pattern Recognition 2017, 2117–2125. [Google Scholar]
- Plumptre A., J. , Kujirakwinja D., Treves A., Owiunji I., Rainer H. Transboundary conservation in the Greater Virunga Landscape: Its importance for landscape species. Biological Conservation 2007, 134, 279–287. [Google Scholar] [CrossRef]
- Rich L., N. , Miller D. A., Robinson H. S., McNutt J. W., Kelly M. J. Carnivore distributions in Botswana are shaped by resource availability and intraguild species. Journal of Zoology 2019, 307, 79–89. [Google Scholar]
- Wang, X. , Girshick R., Gupta A., He K. Non-local neural networks. Proceedings of the IEEE Conference on Computer Vision and Pattern Recognition 2018, 7794–7803. [Google Scholar]
- Tan, M. , Le Q. EfficientNet: Rethinking model scaling for convolutional neural networks. Proceedings of the 36th International Conference on Machine Learning. Proceedings of the 36th International Conference on Machine Learning. PMLR 2019, 6105–6114. [Google Scholar]
- Schneider, S. , Taylor G. W., Kremer S. C. Deep learning object detection methods for ecological camera trap data. 2018 15th Conference on Computer and Robot Vision (CRV). IEEE.
- Steenweg, R. , Hebblewhite M., Kays R., Ahumada J., Fisher J. T., Burton C., Townsend S. E., Carbone C., Rowcliffe J. M., Whittington J., Brodie J. Scaling-up camera traps: Monitoring the planet's biodiversity with networks of remote sensors. Frontiers in Ecology and the Environment 2017, 15, 26–34. [Google Scholar] [CrossRef]
- Woo, S. , Park J., Lee J. Y., Kweon I. S. CBAM: Convolutional block attention module. Proceedings of the European Conference on Computer Vision (ECCV). 2018, 3–19. [Google Scholar]
- Treves, A. , Mwima P., Plumptre A. J., Isoke S. Camera-trapping Forest–woodland wildlife of western Uganda reveals scope for conflict with forestry and hunting. African Journal of Ecology 2009, 47, 395–407. [Google Scholar]
Figure 2.
training and validation accuracy.
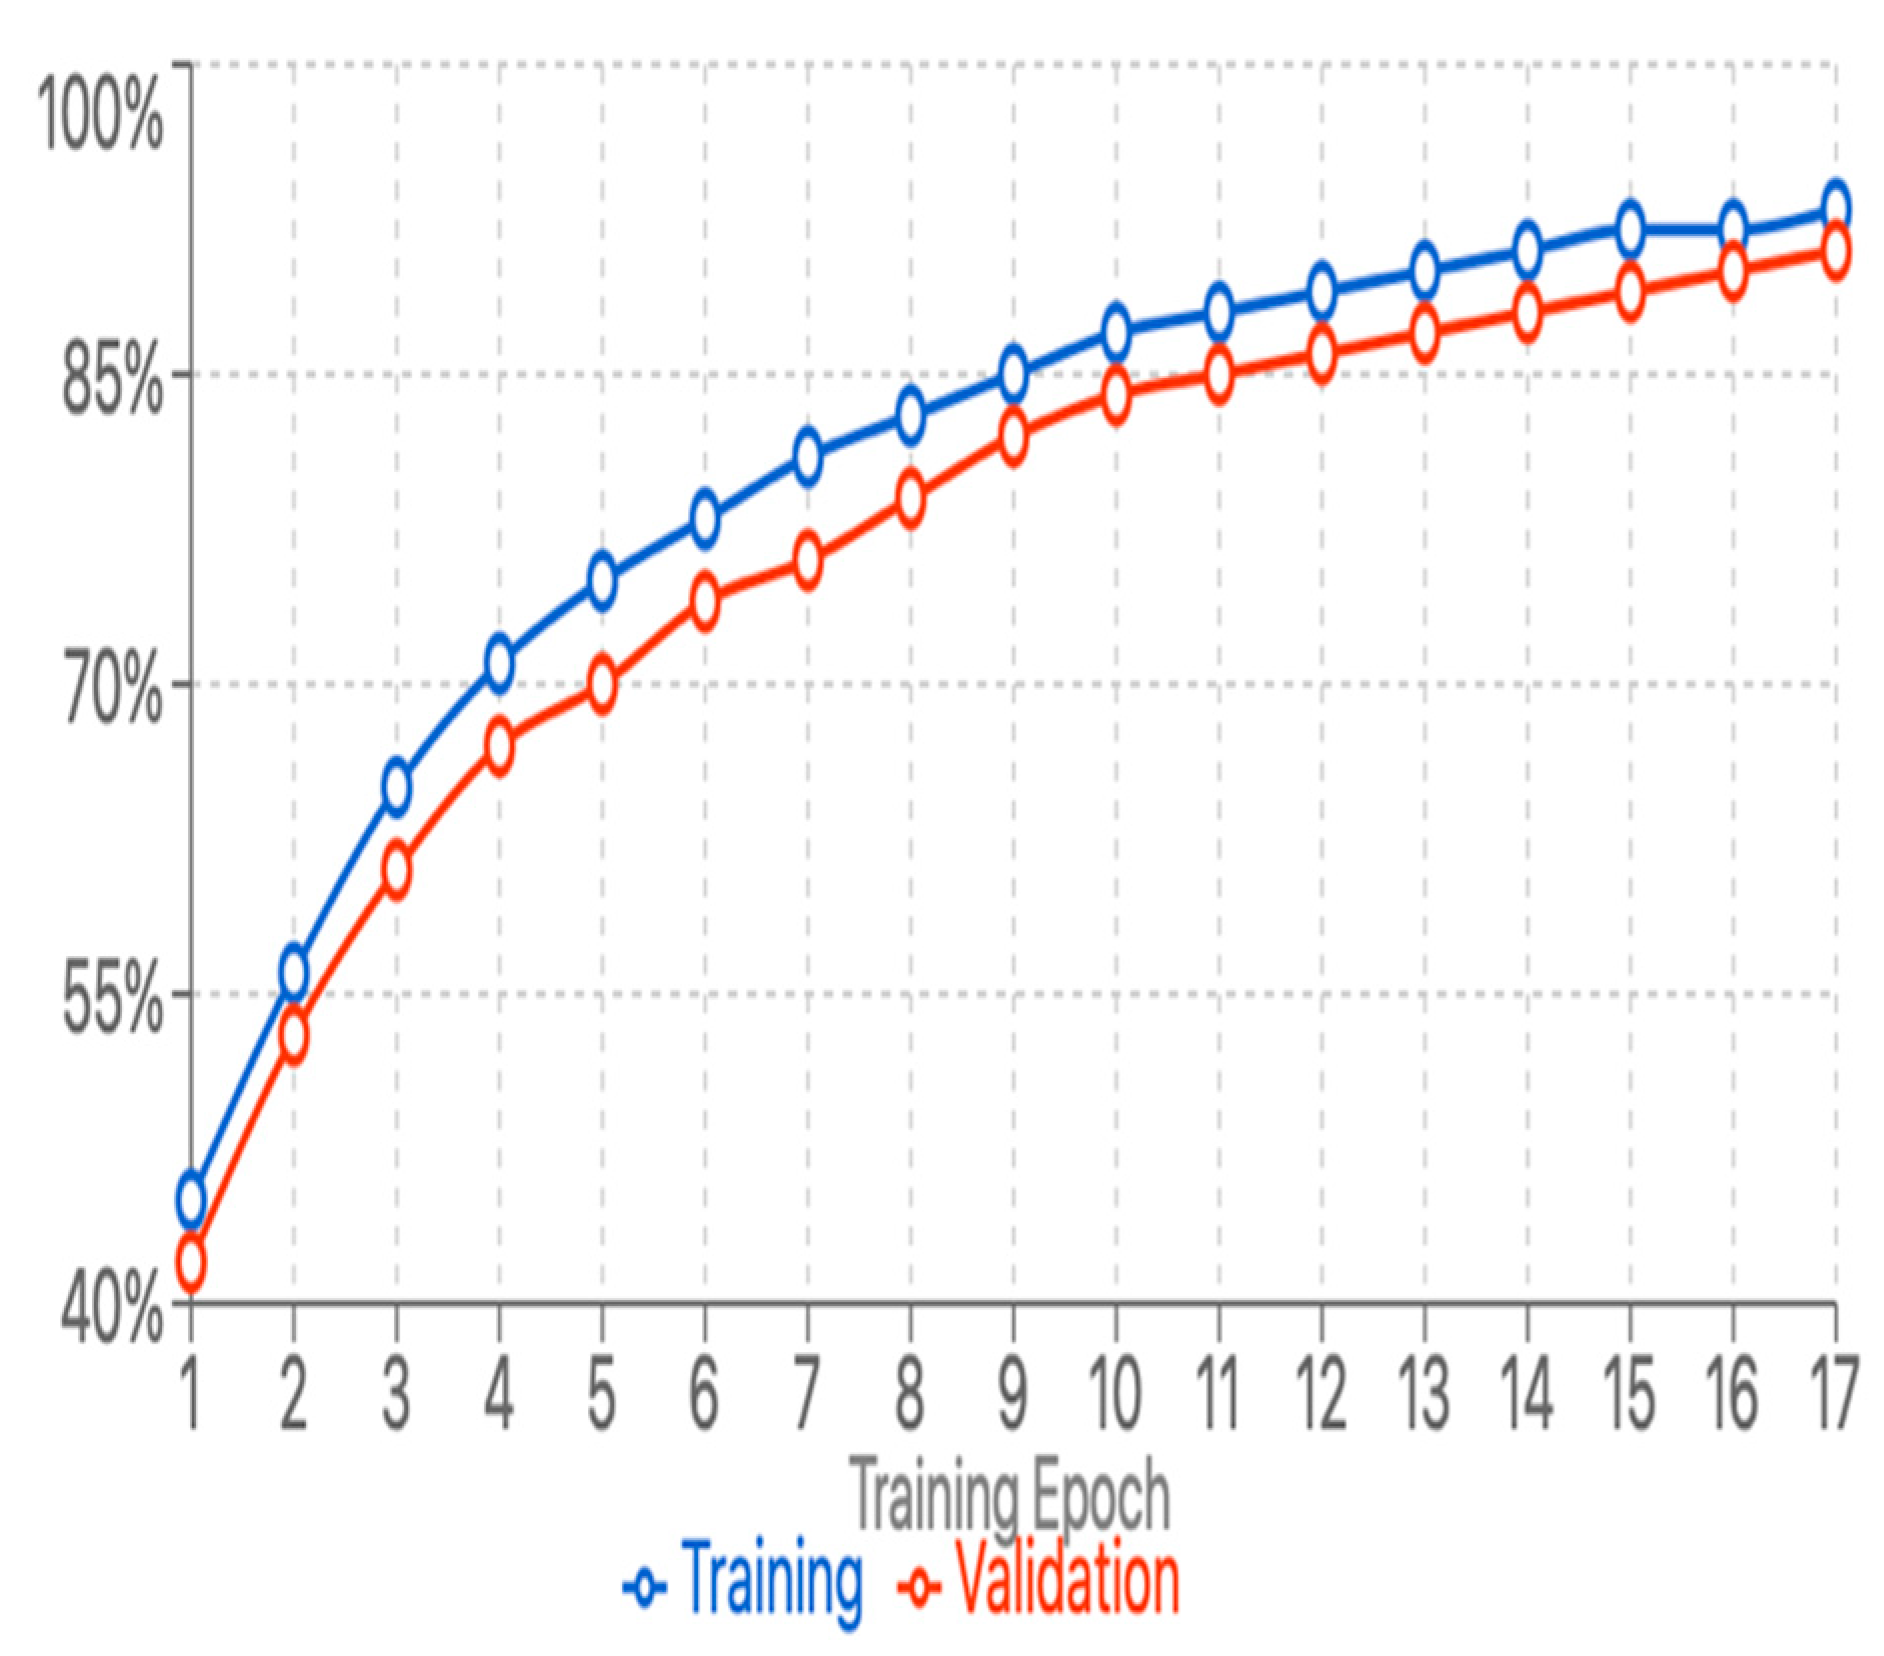
Figure 3.
training and validation loss.
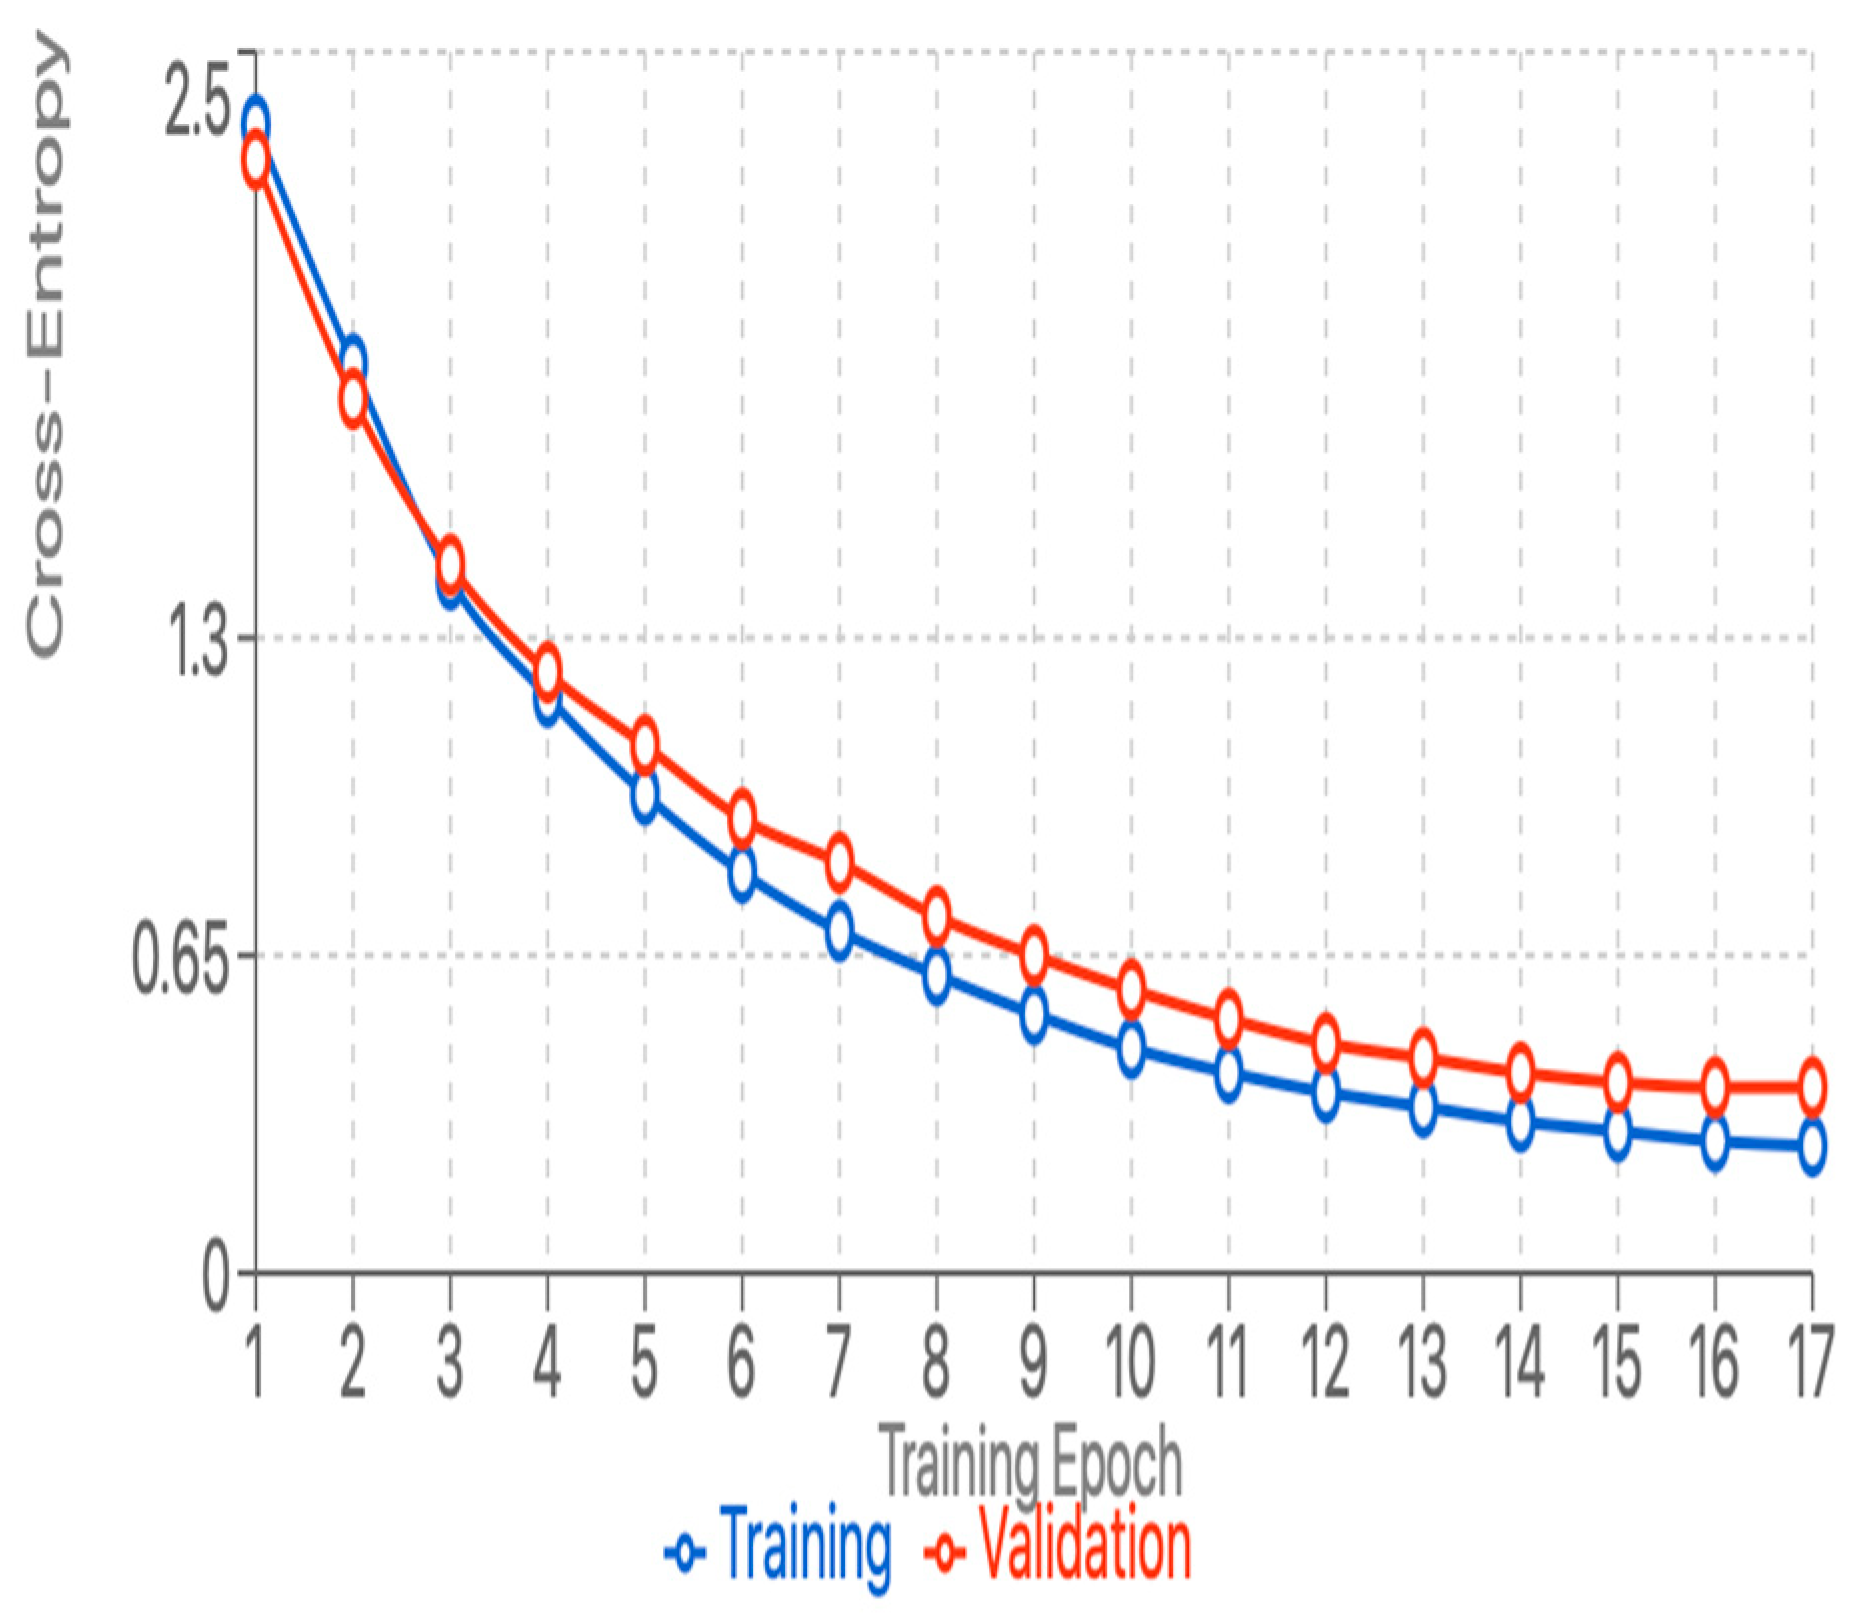
Figure 4.
Confusion matrix for predator species classification.
Disclaimer/Publisher’s Note: The statements, opinions and data contained in all publications are solely those of the individual author(s) and contributor(s) and not of MDPI and/or the editor(s). MDPI and/or the editor(s) disclaim responsibility for any injury to people or property resulting from any ideas, methods, instructions or products referred to in the content. |
© 2025 by the authors. Licensee MDPI, Basel, Switzerland. This article is an open access article distributed under the terms and conditions of the Creative Commons Attribution (CC BY) license (http://creativecommons.org/licenses/by/4.0/).
Copyright: This open access article is published under a Creative Commons CC BY 4.0 license, which permit the free download, distribution, and reuse, provided that the author and preprint are cited in any reuse.


