
Submitted:
28 April 2025
Posted:
30 April 2025
You are already at the latest version
Abstract
For a highly beneficial mutation A at locus 1 spreading in a very large population, we have analyzed the scenario that at a closely linked locus 2 a second beneficial mutant B arises in repulsion; i.e. on a chromosome carrying the wildtype a at locus 1. Under the assumptions that the fitness of B is greater than that of A and that A- and B-carrying chromosomes can recombine at some rate r, recombinants AB may form and eventually fix. We present explicit formulas for the fixation time of AB under additive fitness of the mutants as a function of the frequency X_2 (0) of A at the time when B is introduced. Our analysis suggests that the effect of interference between the beneficial mutations is most pronounced for small values of X_2 (0)< 0.1. Furthermore, we identify a threshold value for r, above which recombination speeds up fixation. Using published simulation data we also describe the genomic footprint of competing beneficial mutations. At neutral sites between the two linked selected loci an excess of intermediate-frequency variants may occur when interference is strong; i.e. X_2 (0) small. Finally, we discuss under which circumstances this scenario may be encountered in real data.
Keywords:
mathematical population genetics
; nonnormalized allele frequencies
; recurrent selective sweeps
1. Introduction
The speed of beneficial mutations on their way to fixation in natural populations is a fundamental topic in population genetics. Knowing how fast selection can act to change allele frequencies is essential for understanding evolution. The time for a beneficial allele to spread through a natural population was investigated early in the history of population genetics, using deterministic models . Later, propertiies of the fixation time of individual advantageous mutations under the influence of positive directional selection and genetic drift in populations of finite size have been derived by several authors .
However, the spread of two or more beneficial mutations that arise and interact during their fixation process is much less investigated. For two interacting mutations Otto and Barton have studied the case that the second mutation is less beneficial than the first one. In contrast, Cuthbertson et al. and Bossert and Pfaffelhuber considered the scenario that the second mutation is fitter than the first one. Furthermore, they assumed that there is a chance that the first and second mutant recombine such that the recombinant type has the highest fitness and eventually fixes. Here we will focus on this latter case.
We consider the mathematical analysis of the fixation time in conjunction with the theory of selective sweeps. Although beneficial mutations are a comparatively small fraction of all new mutations, some of them may reach fixation and are thus important in evolution. If the fitness effects of these beneficial mutations are sufficiently strong, they may cause selective sweeps, i.e. localized reductions of genetic variation along genomes . Such localized patterns of reduced genetic variation have been convincingly described in a variety of organisms.
Detecting signatures of selective sweeps in genomes is a major goal of current population genetics, as it allows estimating the rate of beneficial mutations going to fixation and finding the genes involved in selection. The inference methods for detecting sweeps depend critically on assumptions on whether the benefical mutations occur sequentially (such that there is at most one beneficial allele on a chromosome on the way to fixation at a time) or whether beneficial alleles overlap with each other. Models of recurrent selective sweeps traditionally assume that in chromosomal regions of normal recombination rates at most one beneficial allele is on the way to fixation .
Here we follow the scenario proposed by Bossert and Pfaffelhuber. Thus we assume that, while a highly beneficial mutation spreads in a natural population, a second beneficial mutation arises before the first one has fixed. Furthermore, we envision that the first mutation is less fit than the second one and that recombination may occur between the two chromosomes. Under these conditions a haplotype may be formed that is fitter than the two individual mutations and may therefore eventually fix. To model this process for a population of finite size, Bossert and Pfaffelhuber used stochastic differential equations and calculated the fixation time of a recombinant haplotype under the assumption that it fixes. In contrast, we use a deterministic approach based on ordinary differential equations (ODEs). Thus, in our analysis an explicit assumption about the fixation of a recombinant is not necessary.
We begin by formulating the differential equations for the basic allele frequency changes. Then we introduce nonnormalized variables (that are proportional to the allele frequencies) to find approximate solutions of this system of ODEs. Subsequently, we provide explicit formulas for the fixation time of the recombinant type. Finally, we apply our results to simulation data by Chevin et al. to describe patterns of selective sweeps in the genome caused by the joint fixation of two mutations due to selection and recombination.
2. Model
We consider a two-locus model, with alleles A and a at locus 1 and B and b at locus 2, respectively. The upper-case letters denote beneficial alleles with selection coefficient at locus 1 and at locus 2, whereas the alleles with lower-case letters are assumed to be neutral (wildtype). This model has four haplotypes AB, Ab, aB, and ab, with frequencies given by the variables and (which add up to 1). Assuming additive selection, their relative fitnesses are , , and 1, respectively, where . Recombination between locus 1 and locus 2 occurs at rate r. Since we are interested in closely linked loci, we assume that for i = 2, 3. In our deterministic setting (without genetic drift) the ODEs for the time change of the variables Xi are obtained by adding the change due to selection and the change due to recombination (, chapt. 2):
where measures time in generations.
For , which we assume throughout this paper, an exact solution of this system of ODEs is not known. An approximate solution can be obtained using nonnormalized variables Yi (i = 1, .... , 4) (see for mutation-selection and for recombination-selection equations). These are related to the original variables of equations (1) as:
Using (2) it can be shown that the nonnormalized variables satisfy the following ODEs:
Note that rescaling all by a constant leaves invariant. To fix this scaling, we use for all i = 1, ... , 4. As outlined in Appendix (A), the following approximate solutions of the ODEs (3) can be found, assuming that both mutations A and B arise on background ab (so that :
These approximations were first established and tested by Yun Song (personal communication). Numerical analysis suggests that they are generally excellent for /10.
3. Fixation time
Using equations (4) we can find the fixation time of two interfering mutations. We call an allele or haplotype fixed when it reaches frequency and denote this time . Thus measures the time from some initial frequency at to . The initial frequency may be the frequency of a newly arising mutation. In a haploid population of size , which we consider here, this initial frequency is given by . In our case, however, we are interested in the fixation of the double mutant whose initial frequency is as arises during the fixation process due to recombination. Thus, the fixation time of is found by solving the equation
where is a small number.
Next we express equation (5) in terms of nonnormalized variables and obtain
Using (4) with and , this equation can be approximated by
Evaluating the terms on the right-hand side of equation (6) requires that we find useful approxiations of the integrals in equations (4) because closed formulae for these integrals are not known (see Appendix (B)). Besides the two aforementioned assumptions, we assume that is sufficiently large such that the second mutation is eventually dominating the first one; i.e. , and population size is large such that selection is strong Under these assumptions we find for the integrals defined in Appendix (B):
Inserting these formulas into equation (6), this equation can be written in the following form:
We can neglect the first term on the right-hand side of equation (8) for the following reasons: first, because we assumed that and second since is bounded by the term can be neglected compared to . This leads to equation (9):
Finally, we introduce population size into this equation by writing and , where is the number of alleles at Then solving the equation for yields
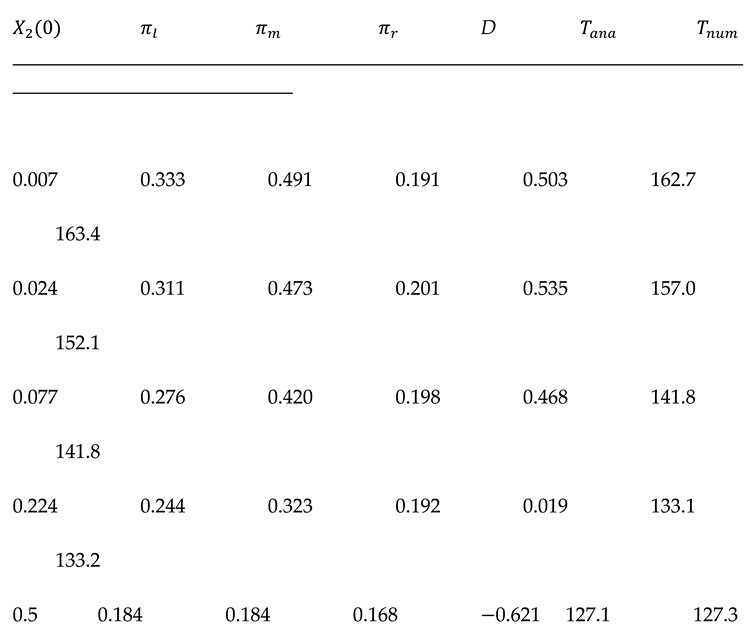
Table 1 shows that this result agrees very well with the numerical solution of equation (8).
As expected, the formula for is complex. However, in the interesting parameter range of small values such that , we may approximate equation (10) as
The first term on the right-hand side of equation (11) equals the fixation time of a new allele starting at frequency and ending at , driven by positive directional selection with selection coeffcient. This term also appears in the result of Bossert and Pfaffelhuber . The denominator can be explained as follows. To go to fixation, the successful recombinant AB with fitness has to compete against the – at the time – dominant aB type with fitness having a fitness advantage Furthermore, unless is very small, the second term in equation (11) is negative such that is smaller than . This is not surprising as we are dealing here with an equation describing continuous input of new alleles due to recombination, similar to the case of fixation under continuous mutation pressure and positive directional selection (, equation (8)). Thus, based on equation (11) we obtain a relatively simple formula for the threshold of
above which recombination speeds up fixation time, whereas for the second term in equation (11) turns positive, such that the fixation time becomes larger than , meaning that the input of recombinants ceases.
4. Genomic footprint of competing mutations
As an application we analyze simulation data from a study of genetic variation at neutral sites located between two selected loci . The data were obtained using Monte Carlo simulations of a Wright-Fisher model (, chapt. 3) with two selected loci and three neutral loci. The three neutral sites are located between the selected loci as described in Table 1. Table 1 also contains the parameter values used in the simulations. They meet the assumptions of our analysis, except for the populaton size. In the simulations was used, while in our derivation was suggested. To check whether this causes problems, we compared the analytical results for T from equation (10) with the numerical solutions of equation (8) for However, as Table 1 (columns 6 and 7) shows, no discrepancies could be found.
The first observation concerns T as a function of . Since was used in all simulations and in all cases is larger than the threshold (equation 12), we expect that T is smaller than and decreases with increasing . This is indeed the case. The most pronounced effect of on fixation time is observed for small values of For larger values of , however, fixation time is relatively constant. This observation is consistent with the formulas for T, especially equation (11), which shows that, for given , fixation time depends about logarithmally on . This formula also says that recombination is most important in speeding up fixation when the second mutation is introduced at low values. Here the interference between the two mutations is largest.
Next we discuss the simulation results of Chevin et al. in the light of our analysis. Variation at the neutral loci (close to the selected ones) shows typical hitchhiking effects ; i.e. variation is reduced relative to the neutral standard level such that stronger selection acting at locus 2 leads to a greater reduction than at the neutral site near locus 1. Furthermore, variation at the neutral locus in the middle between the two selected loci is greater than that at the loci near the selected sites, which is also a typical hitchhiking effect, because the distance to the selected loci (and hence recombination rate) is larger.
Increasing generally leads to stronger hitchhiking effects such that levels of neutral variation decrease with . This can be clearly observed at the neutral locus close to locus 1, whereas at the neutral locus close to the stronger selected site this is hardly visible. At the neutral locus in the middle there is also a strong decay of variation with increasing levels of . The effect of on hitchhiking is likely due to the interference of the two mutations. The longer they compete with each other on their way to fixation, the weaker their hitchhiking effect. This has already been observed in other studies (e.g. ).
Finally, we discuss D, a statistic introduced by Tajima . In Table 1 (column 5) only the D values for the neutral locus in the middle between locus 1 and 2 are shown. All D values at the other two loci are negative as expected from the theory of genetic hitchhiking. A negative D is observed when an allele has either a lower or higher frequency than expected by the neutral theory. Interestingly, however, Chevin et al. observed strongly positive D values for and 0.077, whereas D is around zero or negative for larger Positive values of D indicate that alleles are at intermediate frequencies, such as predicted for balancing selection. In our case, however, this is probably not a valid hypothesis, at least concerning the standard models of balancing selection. A plausible hypothesis proposed by Bossert and Pfaffelhuber is that positive D may be observed when a haplotype structure arises in the genome through recombination between different haplotypes consisting of multiple polymorphic loci. Haplotype structures exist in populations only if polymorphisms at individual loci tend to be in intermediate frequency (such that the less frequent variants are not too rare). This may be the case for and 0.077, but not for the larger values, for which diversity is more heavily reduced (Table 1). An alternative, though related hypothesis postulates that the dynamics of the two selected mutations (while in repulsion) reaches nonnegligible frequencies at similar times such that recombination may produce haplotypes with the two favorable alleles in coupling .
If these hypotheses are correct, a genomic footprint of competing beneficial mutations may be detected by measuring Tajima’s D and/or linkage disequilibrium. In general, footprints associated with selective sweeps caused by the fixation of beneficial mutations can be found in genetic data if their characteristic pattern of variation, such as a dip of nucleotide diversity around a selected site or a haplotype structure revealed by linkage disequilibrium, persist for some time. For Wright-Fisher populations such signatures may be detected for up to 0.1 generations after fixation of the driving mutations .
5. Discussion
For a highly beneficial mutation A at locus 1 spreading in a very large population, we have analyzed the scenario when a second beneficial mutant B arises in repulsion; i.e. on a chromosome carrying the wildtype a at locus 1. Under the assumptions that the fitness of B is greater than that of A and that A- and B-carrying chromosomes can recombine, recombinants AB may form and eventually fix. We present approximate formulas for the fixation time of AB under additive fitness of the mutations as a function of the frequency of A at the introduction of B. The latter parameter turns out to be useful for describing the interference between competing beneficial mutations.
Our analysis suggests that the effect of interference between beneficial mutations is most pronounced for small values of In this parameter range fixation time decreases substantially with However, for larger values fixation time is relatively constant (Table 1). This agrees with the formulas for T, especially equation (11), which shows that T depends about logarithmally on . Similarly, the effect of interference on the genomic footprint of competing mutations can be clearly discerned. For small values of and 0.077, a strongly positive D was observed, whereas D is around zero or negative for larger Positive values of D indicate that alleles are in intermediate frequencies. This may be observed when a haplotype structure arises in the genome through recombination between different allelic types consisting of multiple polymorphic loci .
Finally, we address the question whether we can expect observing patterns of overlapping selective sweeps due to competing mutations in genomes. Estimates of the average selection coefficient and the rate at which beneficial mutations arise and go to fixation (i.e. selective substitutions) are known for some species including Drosophila melanogaster. For instance, Jensen et al. analyzed a dataset of genetic variation from the euchromatic part of the genome of a D. melanogaster population from Africa, which is – roughly speaking – the recombining portion of chromosomes. They obtained the following estimates: , and per generation per nucleotide site. Since under selection and genetic drift the mean fixation time (conditional on fixation) for a diploid species such as D. melanogaster is , we find that the probability of a second substitution arising on a chromosome during the sojourn of the first one to fixation is per nucleotide site. Multiplying with the size of the euchromatic part of a chromosome (in D. melanogaster approximately 24 Mb base pairs), we find that on average at about 20 sites of a chromosome strongly selected substitutions could arise and compete with the first mutation during its sojourn to fixation.
An example that some of these selected substitutions occur in close proximity in the genome is found at the polyhomeotic locus of a European population of D. melanogaster. Voigt et al. report a case in which five selected substitutions (i.e. nearly fixed variants between Europe and Africa) are located in the 5-kb intergenic region between polyhomeotic proximal and the gene CG3835 within a segment of 2.28 kb. They showed that these five selected variants are involved in adaptation of D. melanogaster to the higher temperature in Europe compared to that of the ancestral species range in Africa. Variation is generally low in the whole polyhomeotic region and Tajima’s D is strongly negative, as expected after a sweep. However, using a larger dataset than in her previous study, Susanne Voigt (personal communication) found evidence that the five beneficial substitutions that likely caused the sweep did not act independently in a sequential manner but were selected as haplotype block. As a consequence, an elevated level of Tajima’s D in the fragment containing the five selected substitutions was not detected.
A more promising example in the context of interference between beneficial mutations may be the Agouti locus in deer mice. Here the precise mutations required for adaptation to light-colored soil of the Nebraska Sand Hills have been identified . The authors claim that – contrary to the aforementioned Drosophila case – the light Sand Hills phenotype is the result of independent selection on many mutations within the Agouti locus spanning about 120 kb. Thus, in this case a genomic footprint of interference between beneficial mutations may be encountered in sequence data.
Institutional Review Board Statement
Not applicable.
Informed Consent Statement
Not applicable.
Data Availability Statement
The data analyzed are contained in Table 1.
Acknowledgments
I am very grateful to Peter Pfaffelhuber (U Freiburg) whose paper
helped me to conceptualize this study, Yun Song (UC Berkeley) for supporting this project during a sabbatical in his lab and providing equations (3) and (4), and Luis-Miguel Chevin (CNRS Montpellier) for supplying his simulation data. I also thank Ellen Baake (U Bielefeld) for introducing me to references on nonnormalized allele frequencies and Susanne Voigt (TU Dresden) for her recent analyses of polyhomeotic sequences.
Conflicts of Interest
The author declares no conflict of interest.
Appendices
(A) Derivation of the approximate solutions of ODEs (3)
We write the solutions in the form
where for i = 1, ... , 4.
Next we compare the time derivatives of equations (A1) with those of the corresponding equations (3). Assuming r << si then leads to
This immediately yields the last equation in (4) (up to first order in r). In a similar way, we obtain for i = 1, 2 , 3 by comparing the time derivatives of equations (A1) with those of the corresponding equations (3).
(B) Approximations of the integrals in equations (4)
We begin by approximating the integral
The function to integrate has a maximum at and decays quickly to zero (within about generations). Because we may assume for large populations that within this short decay time and neglect the last term in the denominator. For the integral can then be approximated by a standard formula. This leads to the approximation for given in equations (7). This approximation is excellent for large population sizes Next we consider the integral
Here the function to integrate increases monotonically up to a level of for large . This leads to the upper bound of this integral given in equations (7). A more precise approximation is not required in this case (see main text below equation (8)).
Finally, we approximate the integral
The function to integrate has a maximum at For we integrate the function and for larger times . This leads to the third formula in equations (7), which was obtained assuming large populations.
In general, the analytical results in this paper were derived for large populations ( In the applying these results to the simulation data of Chevin et al. , we had to check numerically whether they are still valid for a smaller population size of 20000 used in these simulations. We found that the fixation times analytically calculated agree very well with the numerical results (see Table 1).
The first five columns show the simulation data: the frequency of the first mutation when the second mutation is introduced; relative genetic diversity at a neutral locus between loci 1 and 2 near locus 1 (here ’relative’ refers to expected diversity under neutrality); relative genetic diversity at neutral locus in the middle between loci 1 and 2; relative genetic diversity at a neutral locus between loci 1 and 2 near locus 2; Tajima’s measure of the deviation of the level of variation from neutrality at the locus in the middle. is the fixation time from equation (10) measured in generations, and is obtained by solving equation (8) numerically. The parameter values are: This research was supported by retirement benefits.
References
- Fisher, R.A. On the dominance ratio. Proceedings of the Royal Society of Edinburgh 1922, 42, 321–341. [Google Scholar] [CrossRef]
- Kimura, M.; Ohta, T. The average number of generations until the fixation of a mutant gene in a finite population. Genetics 1969, 61, 763–771. [Google Scholar] [CrossRef]
- van Herwaarden, O.A.; van der Wal, N.J. Extinction time and age of an allele in a large finite population. Theoretical Population Biology 2002, 61, 311–318. [Google Scholar] [CrossRef]
- Hermisson, J.; Pennings, P.S. Soft sweeps: molecular population genetics of adaptation from standing genetic variation. Genetics 2005, 169, 2335–2355. [Google Scholar] [CrossRef] [PubMed]
- Otto, S.P.; Barton, N.H. The evolution of recombination: removing the limits to natural selection. Genetics 1997, 147, 879–906. [Google Scholar] [CrossRef] [PubMed]
- Cuthbertson, C.A.; Etheridge, A.; Yu, F. Fixation probability for competing selective sweeps. Electronic Journal of Probability 2012, 17, 1–36. [Google Scholar] [CrossRef]
- Bossert, S.; Pfaffelhuber, P. The fixation probability and time for a doubly beneficial mutant. Stochastic Processes and their Applications 2018, 128, 4018–4050. [Google Scholar] [CrossRef]
- Maynard Smith, J.; Haigh, J. The hitchhiking effect of a favourable gene. Genetical Research 1974, 23, 23–35. [Google Scholar] [CrossRef]
- Kaplan, N.L.; Hudson, R.R.; Langley, C.H. The ’hitchhiking effect’ revisited. Genetics 1989, 123, 887–899. [Google Scholar] [CrossRef]
- Wiehe, T.H.E.; Stephan, W. Analysis of a genetic hitchhiking model and its application to DNA polymorphism data from Drosophila melanogaster. Molecular Biology and Evolution 1993, 10, 842–854. [Google Scholar]
- Stephan, W. An improved method for estimating the rate of fixation of favorable mutations based on DNA polymorphism data. Molecular Biology and Evolution 1995, 12, 959–962. [Google Scholar] [PubMed]
- Chevin, L.-M.; Billiard, S.; Hospital, F. Hitchhiking both ways: Effect of two interfering selective sweeps on linked neutral variation. Genetics 2008, 180, 301–316. [Google Scholar] [CrossRef]
- Ewens, W.J. (2004) Mathematical Population Genetics. I. Theoretical Introduction, 2nd ed.; Springer: Berlin, Germany, 2004. [Google Scholar]
- Thompson, C.J.; McBride, J.L. On Eigen’s theory of self-organization of matter and the evolution of biological macromolecules. Mathematical Biosciences 1974, 21, 127–142. [Google Scholar] [CrossRef]
- Baake, M.; Baake, E. An exactly solved model for mutation, recombination and selection. Canadian Journal of Mathematics 2003, 55, 3–41. [Google Scholar] [CrossRef]
- Stephan, W. The classical hitchhiking model with continuous mutation pressure and purifying selection. Ecology and Evolution 2021, 11, 15896–15904. [Google Scholar] [CrossRef] [PubMed]
- Kim, Y.; Stephan, W. Selective sweeps in the presence of interference among partially linked loci. Genetics 2003, 164, 389–398. [Google Scholar] [CrossRef]
- Tajima, F. Statistical method for testing the neutral mutation hypothesis by DNA polymorphism. Genetics 1989, 123, 585–595. [Google Scholar] [CrossRef]
- Kim, Y.; Stephan, W. Joint effects of genetic hitchhiking and background selection on neutral variation. Genetics 2000, 155, 1415–1427. [Google Scholar] [CrossRef]
- Przeworski, M. The signature of positive selection at randomly chosen loci. Genetics 2002, 160, 1179–1189. [Google Scholar] [CrossRef]
- Jensen, J.D.; Thornton, K.R.; Andolfatto, P. An approximate Bayesian estimator suggests strong recurrent sweeps in Drosophila. PLoS Genetics 2008, 4, e1000198. [Google Scholar] [CrossRef]
- Voigt, S.; Laurent, S.; Litovchenko, M.; Stephan, W. Positive selection at the polyhomeotic locus led to decreased thermosensitivity of gene expression in temperate Drosophila melanogaster. Genetics 2015, 200, 591–599. [Google Scholar] [CrossRef] [PubMed]
- Linnen, C.R.; Poh, Y.-P.; Peterson, B.K.; Barrett, R.D.H.; Larson, J.G.; Jensen, J.D.; Hoekstra, H.E. Adaptive evolution of multiple traits through multiple mutations at a single gene. Science 2013, 339, 1312–1316. [Google Scholar] [CrossRef] [PubMed]

Table 1.
Simulation data of Chevin et al. and fixation times.
Disclaimer/Publisher’s Note: The statements, opinions and data contained in all publications are solely those of the individual author(s) and contributor(s) and not of MDPI and/or the editor(s). MDPI and/or the editor(s) disclaim responsibility for any injury to people or property resulting from any ideas, methods, instructions or products referred to in the content. |
© 2025 by the authors. Licensee MDPI, Basel, Switzerland. This article is an open access article distributed under the terms and conditions of the Creative Commons Attribution (CC BY) license (http://creativecommons.org/licenses/by/4.0/).
Copyright: This open access article is published under a Creative Commons CC BY 4.0 license, which permit the free download, distribution, and reuse, provided that the author and preprint are cited in any reuse.


