Submitted:
28 April 2025
Posted:
29 April 2025
You are already at the latest version
Abstract
Inflammatory bowel diseases are chronic diseases of the gastrointestinal tract with a growing prevalence worldwide, requiring precise diagnostic and monitoring methods to guide their appropriate treatment. In this context, MRE (magnetic resonance enterography) has become an essential imaging technique as a non-invasive option for the diagnosis of Crohn's disease and ulcerative colitis in recent years. This method provides detailed information about intestinal inflammation, disease activity, complications, and response to therapy, without the need to expose the patient to ionizing radiation. This study analyzes the advantages of MRE over other imaging methods, as well as its clinical applicability and current challenges. We also discuss future perspectives, including the integration of artificial intelligence and the optimization of protocols for better diagnostic accuracy.
Keywords:
MR enterography
; inflammatory bowel disease
; colonoscopy
; intestinal ultrasound
; imaging
1. Introduction
Inflammatory bowel diseases are a heterogeneous group of chronic, disabling gastrointestinal disorders characterized by inflammation of the digestive tract, including ulcerative colitis and Crohn's disease [1,2]. Ulcerative colitis affects the entire colon, with inflammation limited to the mucosal layer, while Crohn's disease can affect any segment of the digestive tract with transmural involvement [3].
Inflammatory bowel diseases are a global problem with a significant impact on the quality of life of affected patients, requiring effective diagnostic and monitoring strategies. In developed countries, while the incidence of these two diseases has stabilized, their prevalence is increasing: approximately 1.6 million people are affected in the USA while, in Europe, almost 3 million are affected [3,4]. The age of onset of both ulcerative colitis and Crohn's disease is between 15 and 30 years, although there is a second peak between 50 and 80 years [5,6]. The etiologies of inflammatory bowel diseases have not been fully elucidated, but several triggering factors are involved, including genetic and environmental triggers, as well as alterations in the gut microbiota and intestinal immune system as a result of an inadequate response to immune hyper-reactivity [3,7].
According to the ECCO-ESGAR (European Crohn's and Colitis Organisation–European Society of Gastrointestinal and Abdominal Radiology) guidelines, the diagnosis of inflammatory bowel diseases is based on the correlation of clinical features, laboratory tests, endoscopic, histological (endoscopic and histological findings) and imaging data [3,8].
Although colonoscopy with biopsy remains the gold standard for identifying mucosal lesions, this procedure is invasive and cannot provide information about intestinal segments located outside its visualization range, especially the small intestine [9]. In this context, imaging techniques, including intestinal ultrasound (IUS), MRE (magnetic resonance enterography), and CT (computed tomography), play essential roles in assessing the extent of the disease, detecting complications, and guiding treatment [10]. Among the available imaging methods, MRE has established itself as a first-line technique for exploring the small intestine and colon, providing detailed functional and structural information, highlighting the activity and severity of inflammatory bowel diseases, staging transmural lesions [11], and evaluating therapeutic responses [12]. As it does not require exposure to ionizing radiation, this imaging method is preferred in young patients [2]. At the same time, MRE is indicated in patients with normal colonoscopy results [13].
This review aims to analyze the utility of MRE in the diagnosis and monitoring of inflammatory bowel diseases, highlighting its advantages, current challenges, and future perspectives.
2. Imaging Methods Used in Inflammatory Bowel Diseases
The diagnosis and monitoring of inflammatory bowel diseases requires precise imaging methods which are capable of evaluating both mucosal lesions and inflammatory changes in the intestinal walls and perenteric tissues.
- A.
- Colonoscopy remains the gold standard for diagnosis, allowing for direct visualization of the mucosa, biopsy sampling [14], and treatment of some complications. It is superior to other imaging methods in highlighting superficial erosions and ulcerations, mucosal hyperemia, and loss of vascular pattern and detecting colonic polyps [2]. Despite its advantages, it has certain limitations: it is invasive, can be uncomfortable for the patient, and does not allow for visualization of the entire small intestine, requiring the use of additional imaging techniques such as CT, intestinal ultrasound, and MRE [15]. However, a colonoscopic evaluation is necessary if patients have persistent symptoms despite normal MRE results [16]. Colonoscopy also cannot evaluate extraintestinal lesions and may limit the penetration of the endoscope in the presence of stenosis (stricture) [17]. Additionally, during the examination, lesions located in hidden parts of the colon may be missed [18].
- B.
- Video capsule endoscopy is useful in exploring the small intestine, with high sensitivity for early mucosal changes, such as small aphthous lesions[19]. It is also indicated in patients with suspected Crohn's disease and normal endoscopic results[20,21]. Recent studies have shown that video capsule endoscopy is superior to MRE in detecting lesions located in the proximal region of the small intestine[20]. However, it does not allow for in-depth evaluation of the intestinal wall and carries a risk of capsule retention in stenoses and intestinal obstructions.
- C.
- Intestinal ultrasound is a non-invasive, accessible, radiation-free method that does not require prior preparation, except for fasting a few hours before the examination[8]. Firstly, it allows for the detection of wall thickening, with a value over 3 mm considered pathological [8] and a measurement over 7 mm indicating an unfavorable prognosis, with surgical indication within the following year [22]. At the same time, the use of color Doppler or contrast medium (CEUS) allows for evaluation of both the wall perfusion and the intestinal inflammatory status, as well as the presence of complications (fistulas, abscesses, or inflammatory lesions), visualized as hypo or hyperechogenic masses[8]. An increased color Doppler signal is observed in cases of transmural edema present in the active form of Crohn's disease, as evidenced by disrupted mural stratification[23]. Intestinal ultrasound is also useful in detecting the thickening of peri-visceral adipose tissue or fat wrapping [24], as evidenced by increased echogenicity at this level, representing a sign of active disease [23]. Ultrasound images may be unsatisfactory and limited in obese patients, body habitus, or significant abdominal distension that may obscure the intestinal region [23].
- D.
- Computed tomography enterography provides detailed images of both the small intestine—highlighting intestinal wall thickening, hyperemia, submucosal fat deposition, and lymphadenopathy[25,26]—and of extraintestinal, perineural lesions, with greater accuracy in terms of the degree and severity of the disease [27], differentiating the active form from the fibrotic one. At the same time, this imaging technique is frequently used for the detection of complications of inflammatory bowel diseases (fistulas, perforations, and abscesses) [25,26] and in emergencies, such as sepsis or penetrating intra-abdominal lesions requiring surgical intervention [13]. Other advantages of CTE include a shorter scanning time, reduced costs compared to MRE [28], and suitability for patients with contraindications to MRE [13], those who are allergic to gadolinium-based contrast media [8],those who were claustrophobic in prior MR exams, and those with acute symptoms [13]. The main disadvantage is exposure to ionizing radiation, which limits its repeated use in young patients [29,30]. The radiation dose used in CTE for the adult population is between 10 and 20 mSv (milisievert) [31], while that in the pediatric population is between 2.9 and 4 mSv [32]. New protocols propose reducing the radiation dose in adults to 5-7 mSv and the noise produced by CTE during the investigation [33]. At the same time, recent studies have focused their interest on artificial intelligence and radiomics. Li et al. have demonstrated that a radiomics model (RM) based on CTE accurately describes intestinal fibrosis in patients with CD[34].
- E.
- Magnetic resonance enterography (MRE) has become the gold standard [8] in the evaluation of inflammatory bowel disease, providing simultaneously detailed images of the intestinal wall and adjacent structures and inflammatory lesions [23], differentiating inflammation from fibrosis in both the small and large intestine submucosa and the perineal area [35,36]. MRE also has high accuracy in staging small bowel inflammatory bowel disease [30], in monitoring treatment response and relapse [23], and in detecting and classifying isolated forms of colonic involvement [37]. This imaging modality is preferred in complex cases with evidence of penetrating, fistulizing, and stenosing lesions [23], as well as in fistulas and perianal sepsis [13]. Fat smudging, fecal sign, fluid level, gaseous distension, comb sign (related vascular congestion), and lymphadenopathy are elements mainly visualized/detected by MRE [2]. Another advantage—perhaps the most important—is that MRE is an imaging method that can be used to evaluate the activity of Crohn's disease and ulcerative colitis in both adults and young people [38], without the use of ionizing radiation [2]. Taylor et al. have shown that MRE has a sensitivity of 97% for detecting inflammatory bowel diseases, over 90% for fibro-inflammatory strictures, and specificity of over 95% [30].
3. Technical Principles of MRE
For optimal evaluation, MRE requires a standardized protocol, including the administration of an oral contrast agent and the use of T2 and diffusion-weighted imaging (DWI) sequences to highlight active inflammation [15].
3.1. Standardized Protocol for MRE
A strict protocol is followed to obtain quality images; which includes the following steps:
(a) Patient preparation before the examination involves following a light diet 24 hours before, fasting 4-6 hours before, and light hydration with water up to 1-2 hours before the investigation. Fractional administration (250ml/10-15 minutes) of 1-1.5 liters within 45-60 minutes of an oral contrast agent—for example, hypo-osmolar or iso-osmolar solutions such as Mannitol 2.5%, PEG (polyethylene glycol), or water with methylcellulose—is necessary for adequate distension of the intestine prior to the scan. Complete intestinal emptying with purgative solutions is not necessary, as MRE aims at distending the loops with liquid, not complete emptying, and these solutions may produce artifacts through hyperperistalsis or intestinal irritation [2,39]. Additionally, 10-15 minutes before the acquisition, glucagon (0.5-1 mg im or iv) or butylscopolamine (20mg iv) is administered to reduce bowel movements [40].
(b) Technical parameters—imaging protocol: The recommended equipment is a 1.5 Tesla or 3 Tesla MRI. The patient is asked to lie on the bed in the supine position.
T1 and T2 sequences with fat suppression, as dynamic sequences after the administration of iv contrast (Gadolinium) and diffuse light (DWI) sequences, are obtained. The images acquired in the axial and coronal planes allow for a detailed visualization of the intestinal wall and perineal tissues. The total duration of the examination is 30-45 minutes.
T2-weighted HASTE(half-Fourier single-shot turbo spin-echo)/SSFSE (single-shot fast spin echo sequences): Axial and coronal (with or without fat suppression), with TR(repetition time)/TE(echo time) of 90 ms, flip angle 90º, matrix 320x320 and thickness of4-6 mm. This is recognized as one of the most important sequences for the evaluation of the small intestine and aims to highlight detailed intestinal and mesenteric structures, extraintestinal regions, and parietal inflammation and edema [41,42].
Balanced coronal steady-state free procession gradient-echo (SSFPGR)is used to evaluate the intestinal walls, mesenteric structures, and ganglia [42].
Three-dimensional cinematic coronal bSSFP captures extremely fast images of intestinal peristalsis in real-time [43].
Dynamic coronal 3D T1-weighted high-resolution isotropic volume (THRIVE) -GRE (gradient recalled echo) with FS (fat suppression) post-contrast allows for the evaluation of contrast uptake (inflammation versus fibrosis); matrix 256x256, thickness 2mm, flip angle 10º.Sequences are obtained in multiple series post-injection of antiperistaltic agents, within 40-55 seconds for the enteric phase and 60-70 seconds in the portal venous phase, as well as at 180 seconds[2,8].
Delayed axial 3D T1-weighted post-contrast fat-saturated GRE (gradient recalled echo)allow for evaluation of complications such as fistulas and abscesses[44].
The DWI (diffusion-weighted imaging) sequence is obtained with the aim of detecting active inflammation, fibrosis, edema, and vasculopathy. It includes b-values of 0.400 and 800 s/mm2, which reflect the sensitivity of the image to Brownian motion; the higher the value, the more sensitive the image to diffusion. It also includes ADC, with an acquisition time of approximately 4 minutes. Inflamed areas present DWI hypersignal with low ADC (apparent diffusion coefficient) in active areas. The ADC value is insufficient for assessing the response to treatment if used alone[46]. Table 1.
3.2. Relevant Imaging Features in Magnetic Resonance Enterography
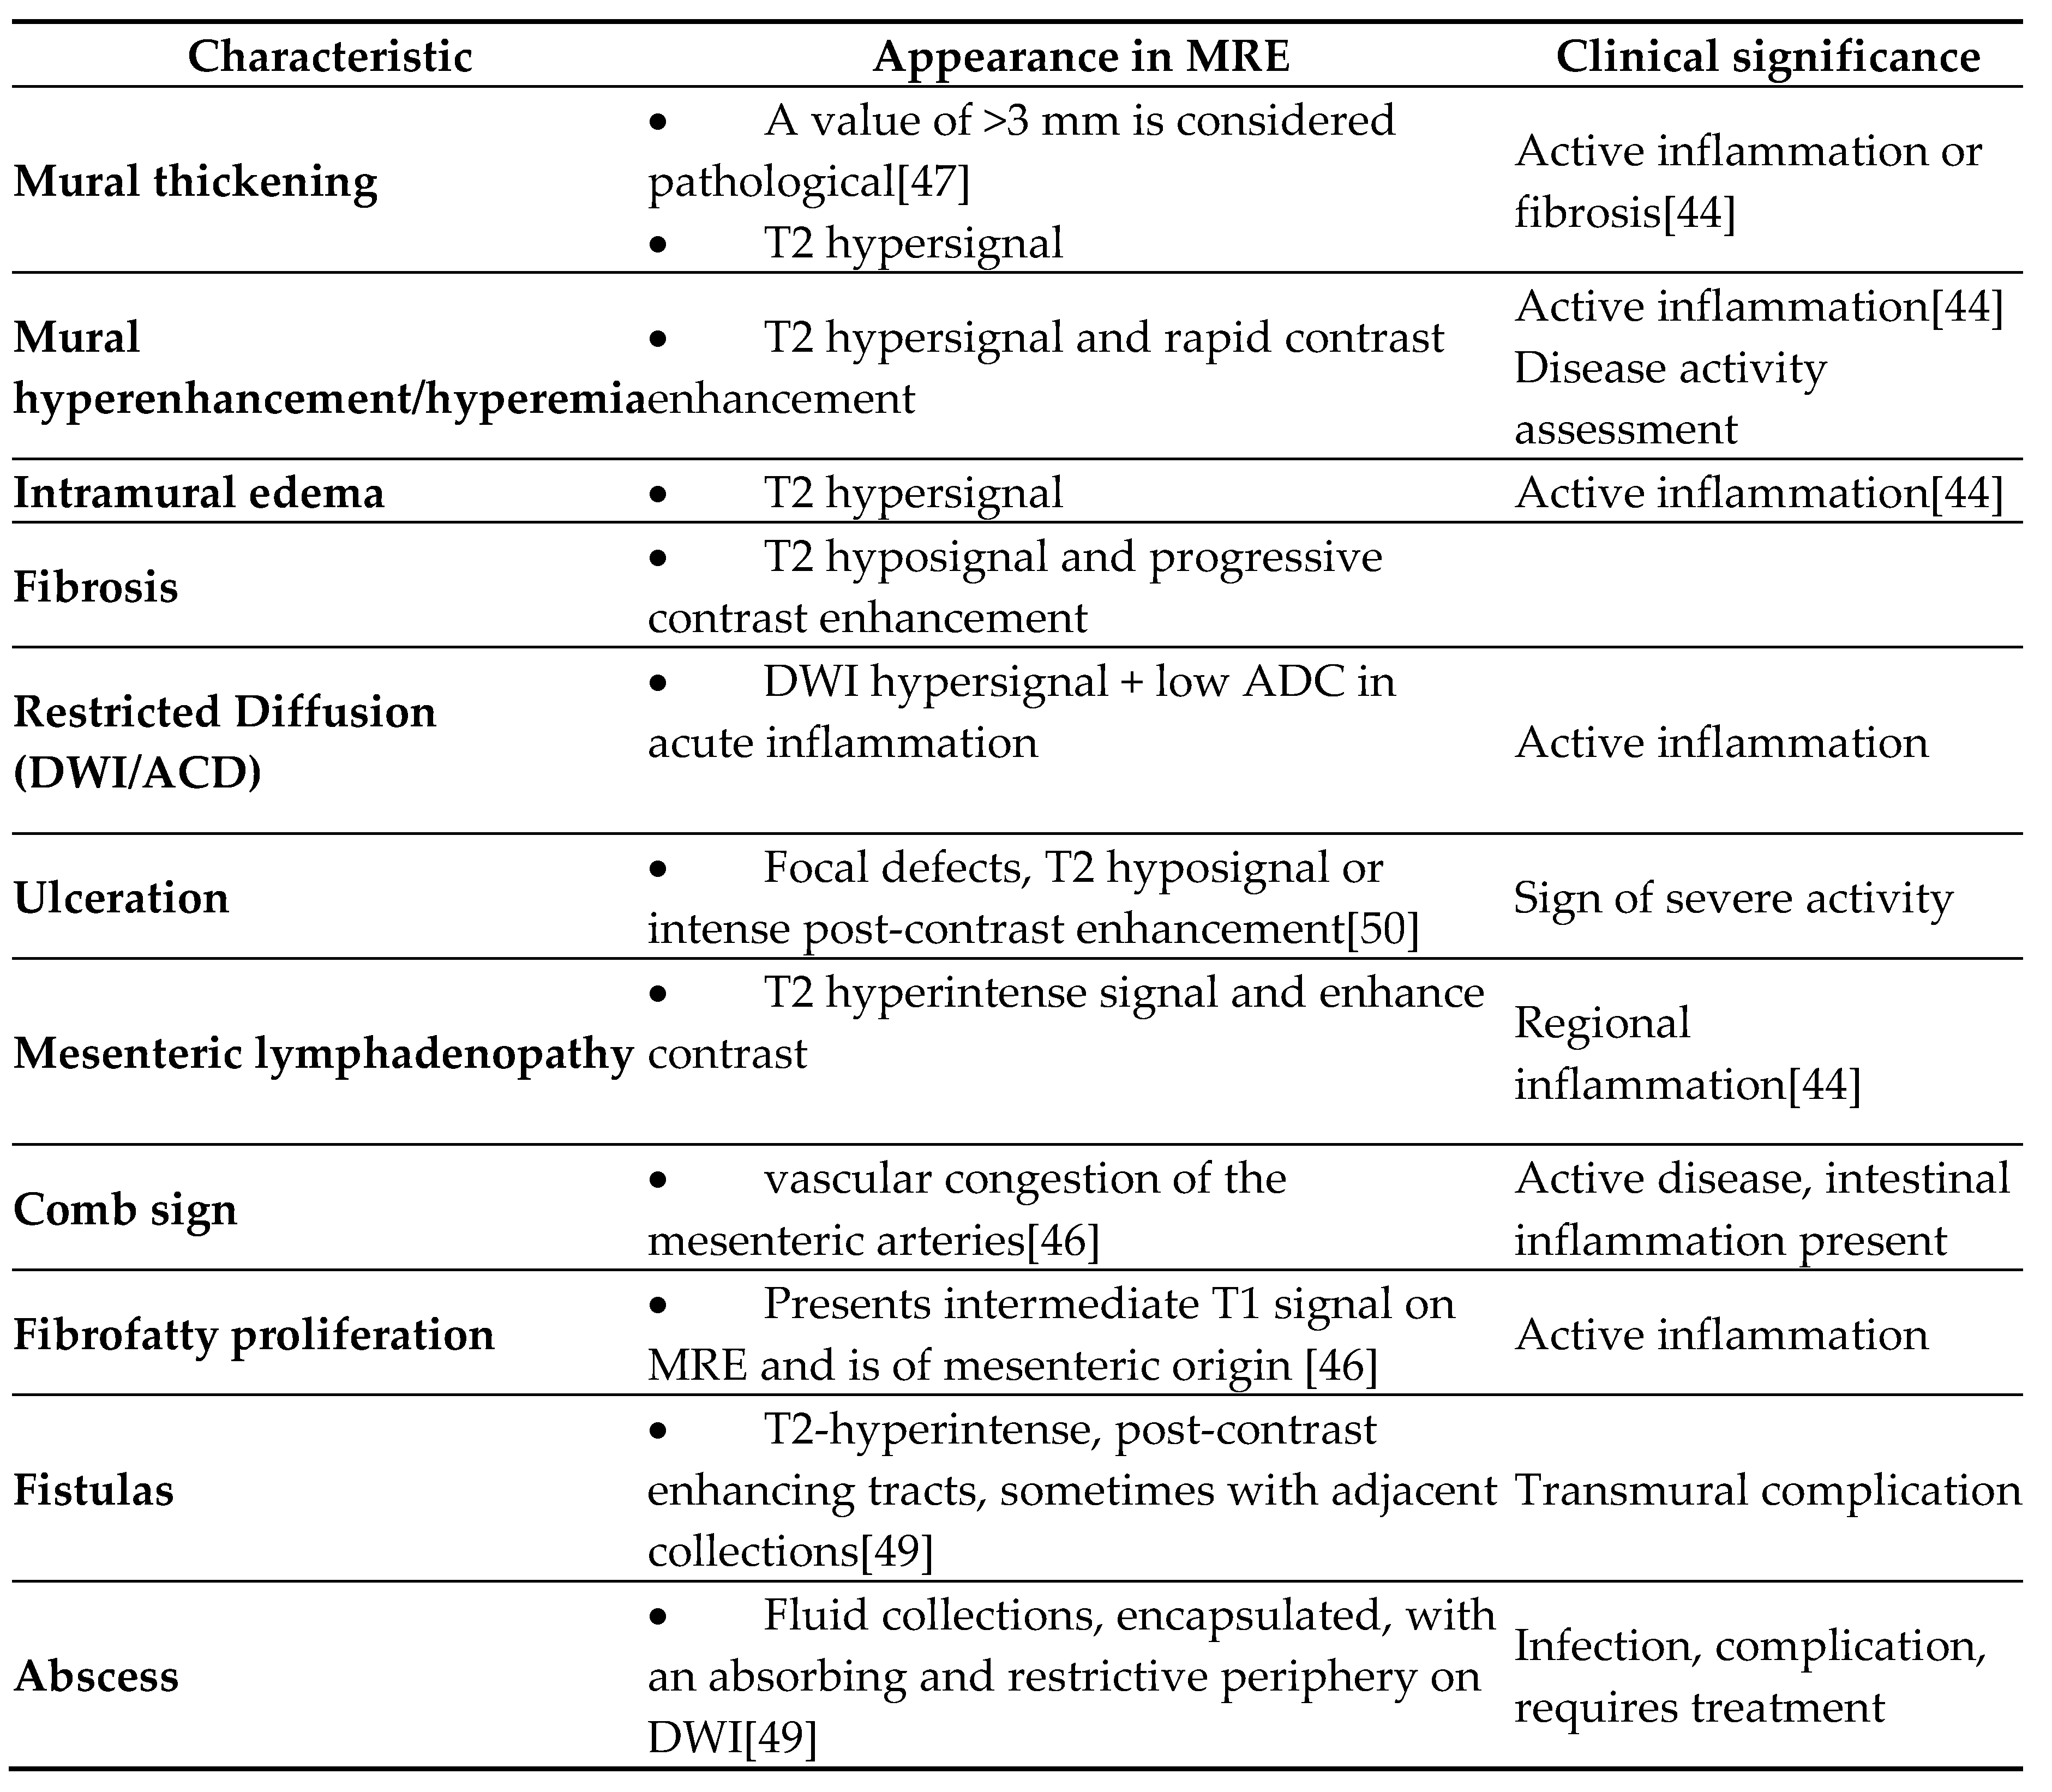
The most important imaging findings indicative of disease activity are mucosal hyperenhancement/hyperemia, wall thickening, intramural edema, ulcerations, lymphadenopathy, vascular congestion of mesenteric arteries, and strictures [2,8]. Table 2.
- a.
- Mural thickening :
- Is mild (<5 mm), moderate (<9mm) and severe (> 10 mm)
- Commonly occurs in active areas of inflammation (Figure 1).
- b.
- Mural hyperenhancement
- Asymmetric distribution in CD or ontinuous and concentric distribution in extensive ulcerative colitis[44]
- Stratified uptake: “double layer” (submucosa is thickened by edema and inflammation) or “trilaminar layer” (when serosa is also involved) [8]
- Homogeneous, hypovascular uptake in (chronic) fibrosis
- Correlates with clinical and biological activity scores [44]
- Evaluated on post-gadolinium T1 fat-sat sequences, in dynamics [50]
- c.
- Intramural edema
- Is detected as T2 hyperintense signal
- d.
- Restricted diffusion
- DWI hypersignal + low ADC in acute inflammation
- e.
- Ulceration
- Focal defects, fine disruptions of the mucosal contour - small signs of T2 hyposignal or intense post-contrast enhancement[50]
- Requires adequate distension of the small bowel (Figure 4 ).
- f.
- Mesenteric lymphadenopathy
- g.
- Comb sign
- h.
- Fibrofatty proliferation
- Also called “creeping fat”
- i.
- Fistulas
- They may be enteroenteric, enterocolic, enterovesical, or perianal [8]
- Fistulae occur following advanced penetrating disease [8]
- j.
- Abcesses
- Abscesses are found in the abdominal cavity, intestinal wall, or perianal area[8]
- k.
- Stenosis
- May be inflammatory (with edema and entrapment) or fibrotic (without inflammatory signs)(Figure 7)
4. Applicability of MRE in Inflammatory Bowel Diseases
MRE has become established in the last decade and is widely used in clinical practice for the differential diagnosis between Crohn's disease and ulcerative colitis[52]. As a non-irradiating, reproducible, and versatile method, this imaging technique provides detailed information about the intestinal wall and adjacent structures and allows for the early detection of complications such as fistulas and abscesses, with an accuracy comparable to that of exploratory surgery [29]. In addition, MRE plays a crucial role in monitoring the response to treatment, with studies demonstrating a direct correlation between imaging changes and the clinical evolution of patients treated with biological agents [15].
MRE allows for characterization of the affected segments and establishment of the transmural distribution of inflammation. It is sensitive in detecting lesions in the small intestine—a region which is difficult to access when using conventional colonoscopy. It may reveal thickening of the intestinal wall, submucosal edema, deep ulcerations, or segmental and saltatory extension (specific to Crohn's disease) or continuous lesions (in cases of ulcerative colitis).
4.2. Differentiating Between Active Inflammation and Fibrosis
One of the most valuable contributions of MRE is the ability to differentiate between active inflammation (characterized by edema, layered contrast enhancement, and increased DWI signal) and fibrosis (with homogeneous enhancement, without edema or restrictive signal on DWI). This distinction is crucial in medical versus surgical therapeutic decisions. A recent study has suggested that fibrotic lesions seen on MRE can be confirmed histologically, with approximately 98% diagnostic accuracy [53]. Another study has shown that the performance of MRE decreased in situations where active inflammatory lesions and intestinal fibrosis coexisted [54].
4.3. Screening/Detection of Complications
MRE is excellent in identifying typical complications of inflammatory bowel diseases, especially Crohn's disease:
- ➢
- Enteroenteric, enterocutaneous, perianal fistulas: MRE can distinguish between simple and complicated fistulas, guiding the decision between conservative treatment and surgical drainage;
- ➢
- Intra-abdominal abscesses;
- ➢
- Fibrous stenosis with dilation of the upstream loops;
- ➢
- Mesenteric adenopathies and changes in perenteric fat;
- ➢
- Toxic megacolon—a rare but severe complication of ulcerative colitis [29].
4.4. Monitoring Response to Treatment
MRE is ideal for assessing the efficacy of biological treatment and immunosuppressive or immunomodulatory therapies. The reduction in wall thickness, the disappearance of edema, and a decrease in post-contrast uptake reflect the therapeutic response and can predict clinical remission. In clinical studies, the concept of “mucosal healing” represents an indicator associated with sustained clinical remission and a reduced rate of surgical interventions and hospitalizations[55,56,57,58], making it a therapeutic target in patients with inflammatory bowel diseases [56,59]. Recent studies have suggested that MRE can detect mucosal healing. Imaging changes can be used to adjust treatment before the onset of clinical symptoms [15], minimizing the adverse effects of expensive drugs by delaying their administration [60].
4.5. Complementarity with Other Methods
While colonoscopy remains the standard for colonic mucosal visualization and biopsy, MRE is indispensable for the following:
- ➢
- Exploration of jejunal and ileal loops;
- ➢
- Transmural and extramural evaluation;
- ➢
- Therapeutic guidance in the absence of obvious colonic lesions.
4.6. Role in Staging and Imaging Scores
Through the use of standardized scores (MaRIA, sMaRIA, London, and Nancy), Magnetic Resonance Enterography provides an objective and reproducible assessment of the severity of inflammation. This is useful in both clinical and research settings [13].
- Standardized imaging scores in Magnetic Resonance Enterography
MRE allows for the quantification of intestinal inflammation through validation scores, such as MaRIA, sMaRIA, London, Nancy, Clemont, and MEGS, which are useful for standardization, longitudinal follow-up, and assessing responses to biological therapies. They generally measure histologic, endoscopic inflammation, and/or quantitative measurements[13], including wall thickening, mural edema, ulceration [23],intramural hyperintense T2 signal, and relative contrast enhancement [13],in comparison to an index tissue(e.g.,a normal bowel wall or psoas muscle)[3].
- The most widely studied scoring system that assesses Crohn's disease activity on MRE is the magnetic resonance index activity (MaRIA) score. The score is calculated using the following equation:
- MaRIA score=1.5 x wall thickness + 0.02 x RCE (relative contrast enhancement) + 5 x edema + 10 x ulceration [61];
RCE = [(WSI – wall signal intensity postgadolinium – WSI pregadolinium)/(WSI pregadolinium)] x 100 x SD noise pregadolinium/ SD noise postgadolinium), where SD(standard deviation) noise represents the average of three SDs of the signal intensity measured outside the body before and after administration of the contrast agent [61].
The cut-off values of the MaRIA score are as follows:
- ➢
- Normal: 0-6;
- ➢
- Moderate disease: ≥ 7-11;
- ➢
- Severe disease: ≥ 11 [23].
- 2.
- The major disadvantage of this score is that it is time-consuming to obtain. Such a limitation led to the development of a simplified new scoring system, the sMaRIA, which requires just 4.5 minutes compared to over 12 minutes for the MARIA [23,61,62]. The sMaRIA was validated by Ordas et al. in 2019, and its most significant advantage is that it does not involve contrast-enhanced imaging [23,63].
The sMaRIA is calculated with the following equation:
- MARIAs = (1 x thickness >3 mm) + (1 x edema) + (1 x fat stranding) + (2 x ulcers)
The cut-off points of the sMaRIA score are as follows:
- ➢
- A score of >1 identifies active disease, with 90% sensitivity and 81% specificity;
- ➢
A recent study has confirmed the accuracy of the sMaRIA score, which identified endoscopic remission after 3 months of treatment with anti-TNF α agents and corticosteroids [23].
- 3.
The total MEGS is a sum of scores of qualitative and semiquantitative assessments: score per segment × multiplication score per segment + additional score per patient (lymph node, comb sign, abscess, and fistula)[44,65] (Table 3).
Makayanga et al. compared the MEGS with laboratory biomarkers of activity, such as fecal calprotectin> 100 µg/g. The calculation formula involved the elevated fecal calprotectin value and the probability of active disease in patients with Crohn's disease. It was formulated using a logarithmic form: α = 1.8 × wall thickness + 0.08 × mural T2 + 0.19 × length − 0.192 [66].
London and “extended” London scores
In 2012, Steward et al. validated the London and “extended” London scores using the endoscopic acute inflammatory score (AIS), a histopathological grading of the terminal ileum as the reference standard[44,67], with a sensibility of 81% and specificity of 70% [23,67].
The London score is calculated as follows: 1.79+1.34 x mural thickness score+0.94 x mural T2 score [65].
The "extended" London score is a detailed version and assesses both active inflammation and complications of Crohn’s disease. The major disadvantage is that requires a contrast agent (gadolinium), which represents a limitation in clinical practice. As such, it is mainly applied in research trials [23].
Crohn’s Disease MRI Index (CDMI)
The CDMI was validated in 2012, with the objective of quantifying inflammatory activity on Magnetic Resonance Enterography. It is a semiquantitative, rigorous, and detailed score with good histological correlations. As it requires precise measurements and specific software for calculating the gradient, it is less commonly applied in clinical practice [65].
Although recent literature references have equated the CDMI with the "extended" London score, the two have different methodologies and bodies. While the CDMI involves post-contrast gradient measurements, the London score and "extended" London score are based on visual assessment of morphological and functional parameters.
Clermont score
The Clermont score is another MRE index which was validated in 2013, representing an efficient tool for the evaluation of CD activity. It is similar to the MaRIA score [68], in terms of the parameters highlighted (wall thickness, edema, and ulceration) [65]. The Clermont score uses ADC measurements from diffusion-weighted sequences [69].
The Clermont score is calculated as follows: -1.321 × ADC (mm2 /s) + 1.646 × wall thickness (mm) + 8.306 × ulcers + 5.613 × edema + 5.039 [44,65], with a sensitivity of about 82% and specificity of 100% [69].
Nancy score
The Nancy score was validated in 2010 and, similar to the Clermont score, uses a DWI sequence, but requires a visual assessment assessing both the small and large bowel [70].
The Nancy score is calculated as follows: ulceration + parietal edema + bowel wall thickening + differentiation between the (sub) mucosa and muscularis propria + rapid contrast enhancement + DWI hyperintensity. The presence or absence of these findings is rated as one or zero.
5. Limitations and Challenges of enteroMR
Although magnetic resonance enterography has been established as a reference imaging method for the evaluation of inflammatory bowel diseases and presents multiple advantages, there are a number of technical and logistical limitations that must be taken into account [71]. Another important aspect is the variability of protocols among institutions, which may influence the interpretation of the obtained results [29]. The standardization of guidelines and the integration of artificial intelligence could improve the applicability of such methods in the future [15].
5.1. Accessibility and Costs
- MRE requires modern, high-performance equipment (preferably 1.5T or 3T), specialized software, and trained personnel.
- The limited availability of these resources in some centers may restrict patient access.
- Additionally, the associated costs are higher than those of other investigations, such as ultrasound or CT, which may influence clinical decisions in resource-limited health systems.
- The examination time is longer (30-45 minutes), which can lead to longer waiting lists in congested hospitals.
Possible solutions include the development of rapid scanning protocols and the implementation of clear criteria for the selection of patients who would benefit the most from this investigation.
5.2. The Need for Standardized Protocols and Experience in Interpretation
- There are variations among centers regarding the oral contrast dose scanning technique used and the criteria for interpreting the images, especially in centers without a standardized protocol.
- The lack of correlation with clinical findings and biomarkers can lead to over- or underdiagnosis errors.
- The scores used to assess disease activity (e.g., MaRIA, Clermont, Nancy, and London score) are not always applied uniformly in all centers.
A possible solution is the development of international guidelines for the standardization of MRE in inflammatory bowel diseases, similar to the existing recommendations for colonoscopy and CT enterography.
5.3. Patient Preparation and Compliance
- The examination requires specific preparation, including the ingestion of a large volume of oral solution, maintaining immobility for 30-45 minutes, and tolerating possible dyspeptic symptoms. These factors can limit the quality of the examination, especially in children, elderly patients, or patients with severe abdominal pain.
5.4. Artifacts and Technical Limitations
- Respiratory movements and intestinal peristalsis can generate artifacts that degrade image quality, despite the administration of antiperistaltic agents.
- Excessive intestinal gas can affect adequate loop distension and correct interpretation.
- The sensitivity of MRE is lower than that of endoscopy in cases of small, superficial lesions, such as millimeter-sized ulcerations, incipient disease, or subtle inflammatory changes.
5.5. Contraindications and Limitations of use
- Patients with severe claustrophobia or incompatible metallic implants cannot be examined.
- MRE is not indicated in major emergencies, such as perforations or complete occlusions, where CT is preferred for speed.
A possible solution is the optimization of guided breathing protocols and the exploration of alternatives for claustrophobic patients (e.g., wide-aperture MR).
6. Conclusions and Future Perspectives
MRE is an advanced imaging technique with extensive applicability in DG and the monitoring of inflammatory bowel diseases. Unlike conventional imaging methods, MRE allows for the detailed characterization of inflammation and extra-luminal complications without requiring exposure to ionizing radiation. Therefore, it has been recommended in recent guidelines for the evaluation of patients with inflammatory bowel diseases [71].
6.1. Main Benefits of enteroMRI
The main benefits of enteroMRI are as follows:
It allows for detailed evaluation of the small intestine, and is superior to colonoscopy for endoscopically inaccessible segments;
It distinguishes between active inflammation and fibrosis, which is an essential aspect for guiding treatment;
It detects complications of Crohn's disease, providing critical information for therapeutic decisions;
It is safe for repeated use, which is ideal for the long-term monitoring of patients with IBD.
6.2. Research and Innovation Directions
The future of MRE is moving toward optimizing the technique and integrating advanced technologies, such as the following:
AI—Deep learning algorithms could automate image interpretation, reducing inter-radiologist variability and improving the accuracy of diagnosis.
New imaging techniques may provide improved MR sequences for the early detection of inflammation and more precise differentiation between edema and fibrosis;
The development of shorter scanning protocols will allow for faster and more accessible examinations while maintaining image quality;
The effective utilization of serum and fecal biomarkers, such as the integration of MRE with non-invasive tests (e.g., fecal calprotectin), will allow for more efficient patient monitoring.
Conclusions
As technology advances and protocols become standardized, MRE has the potential to become the gold standard for small bowel imaging in inflammatory bowel disease. This non-invasive method, which is well-tolerated by patients and does not require exposure to ionizing radiation, has an overall accuracy of approximately 90%. Its integration into international clinical guidelines will improve patient management and contribute to better personalization of treatment. At the same time, multidisciplinary collaboration between gastroenterologists and imaging specialists (radiologists) is essential for further optimization of the diagnostic and treatment process of patients with inflammatory bowel disease, significantly contributing to achievement of the proposed objectives.
Author Contributions
Conceptialization, R.M.; methodology , D.P.; validation T.M., E.C. and D.P.;formal analysis E.C.; investigation and data curation , T.M., E.C., D.P.; writing – original draft, R.M.; preparation supervision R.M., T.M., E.C. and D.P. All authors heve read and agreed to the published version of the manuscript.
Funding
This research received no external funding.
Institutional Review Board Statement
Not applicable.
Informed Consent Statement
Not applicable.
Data Availability Statement
Not applicable.
Conflicts of Interest
The authors declare no conflict of interest.
References
- Cozzi D., Moroni C., Addeo G., Danti G., Lanzetta M.M., Cavigli E., Falchini M., Marra F., Piccolo C.L., Brunese L., et al. Radiological Patterns of Lung Involvement in Inflammatory Bowel Disease. Gastroenterol. Res. Pract. 2018;2018:5697846. - DOI - PMC - PubMed. [CrossRef]
- Rasha Mostafa Mohamed Ali, Aya Fawzy Abd El Salam, Ismail Anwar, Hany Shehab, Maryse Youssef Awadallah. Role of MR enterography versus ileo-colonoscopy in the assessment of inflammatory bowel diseases. Egypt J Radiol Nucl Med 2023;54:17. doi.org/10.1186/s43055-023-00967-5.
- Arif-Tiwari H., Taylor P., Kalb B.T., Diego R. M. Magnetic resonance enterography in inflammatory bowel disease. Appl Radiol 2019; (1):9-15.
- Shivashankar R, Tremaine WJ, Harmsen WS, Loftus EV Jr. Incidence and Prevalence of Crohn's Disease and Ulcerative Colitis in Olmsted County, Minnesota From 1970 Through 2010. Clin Gastroenterol Hepatol 2017; 15:857.
- Bernstein CN, Wajda A, Svenson LW, et al. The epidemiology of inflammatory bowel disease in Canada: a population-based study. Am J Gastroenterol 2006; 101:1559.
- Ekbom A, Helmick C, Zack M, Adami HO. The epidemiology of inflammatory bowel disease: a large, population-based study in Sweden. Gastroenterology 1991; 100:350.
- Schultsz C, Van Den Berg FM, Ten Kate FW, et al. The intestinal mucus layer from patients with inflammatory bowel disease harbors high numbers of bacteria compared with controls. Gastroenterology 1999; 117:1089.
- Biondi M., Bicci E., Danti G., Flammia F., Chiti G., Palumbo P., Bruno F., Borgheresi A., Grassi R., Grassi F. The role of Magnetic Resonance Enterography in Crohn’s Disease:A Review of Recent Literature. Diagnostics 2022; 12, 1236. [CrossRef]
- Girometti R, Zuiani C, Toso F, et al. MRI scoring system including dynamic motility evaluation in assessing the activity of Crohn’s disease of the terminal ileum. Acad Radiol. 2008;15(2):153-164. - DOI - PubMed. [CrossRef]
- Bonifacio C., Dal Buono A., Levi R., Gabbiadini R., Reca C., Bezzio C., Francone M., Armuzzi A., Balzarini L. Reporting of Magnetic Resonance Enterography in Inflammatory Bowel Disease: Results of an Italian Survey. J Clin Med. 2024, 13, 3953. [CrossRef]
- Fiorino G, Peyrin-Biroulet L, Danese S (2012) Bowel damage assessment in Crohn’s disease by magnetic resonance imaging. Curr Drug Targets 13:1300–1307.
- Brem O., Elisha D., Konen E., Amitai M., Klang E. Deep learning in magnetic resonance enterography for Crohn’s disease assessment : a systematic review. Abdominal Radiology 2024.49:3183-3189. [CrossRef]
- Bruining D., Zimmermann E., Loftus E Jr , Sandborn W., Sauer C. , Strong S. Consensus Recommendations for Evaluation, Interpretation, and Utilization of Computed Tomography and Magnetic Resonance Enterography in Patients With Small Bowel Crohn's Disease. Radiology. 2018 Mar;286(3):776-799. [CrossRef]
- Rutter MD, Saundrs BP, Wilkinson M, et al. Colonoscopy in IBD:When, how, and why?Gut. 2022; 71(1):15-30.
- RimolaJ, Ordas I, Rodiguea S, et al. Magnetic resonance enterography in Crohn’s disease:Expert consensus recommendations. Gastroenterology. 2022; 162(3):803-817.
- Dulai PS, Levesque BG, Feagan BG (2015) Assessment of mucosal healing in inflammatory bowel disease. Gastrointest Endosc 82(2):246–255.
- Langan RC, Gotsch PB, Krafczyk MA (2007) Ulcerative colitis: diagnosis and treatment. Am Fam Physician 76(9):1323–1330.
- Neumann H, Tontini GE, Albrecht H (2016) Su1702 accuracy of the full spectrum endoscopy system (FUSE) for prediction of colorectal polyp histology. Gastrointest Endosc 83(5):AB402.
- Tillack C, Seiderer J, Brand S, et al. Correlation of magnetic resonance enteroclysis (MRE) and wireless capsule endoscopy (CE) in the diagnosis of small bowel lesions in Crohn’s disease. Inflamm Bowel Dis. 2008;14(9):1219–1228.
- Kopylov U. Diagnostic yield of capsule endoscopy versus magnetic resonance enterography and small bowel contrast ultrasound in the evalu- ation of small bowel Crohn’s disease: Systematic review and meta-analysis. Dig Liver Dis. 2017;49:854–863. - DOI - PubMed. [CrossRef]
- Rozendorn N., Klang E., Lahat A., Yablecovitch D., Kopylov U., Eliakim A., Ben-Horin S., Amitai M.M. Prediction of patency capsule retention in known Crohn’s disease patients by using magnetic resonance imaging. Gastrointest. Endosc. 2015;83:182–187. - DOI - PubMed. [CrossRef]
- Castiglione F, de Sio I, Cozzolino A, et al. . Bowel wall thickness at abdominal ultrasound and the one-year-risk of surgery in patients with Crohn’s disease. Am J Gastroenterol 2004;99:1977–83. - PubMed.
- Kumar S. , De Kock I., Blad W., Hare R., Pollok R., Taylor S.Magnetic Resonance Enterography and Intestinal Ultrasound for the Assessment and Monitoring of Crohn's Disease.J Crohns Colitis2024 Sep 3;18(9):1450-1463. [CrossRef]
- Rosenfeld G., Brown J., Vos P.M., Leipsic J., Enns R., Bressler B. Prospective Comparison of Standard- Versus Low-Radiation-Dose CT Enterography for the Quantitative Assessment of Crohn Disease. Am. J. Roentgenol. 2018;210:W54–W62. - DOI - PubMed. [CrossRef]
- Gore RM, Balthazar EJ, Ghahremani GG, Miller FH. CT features of ulcerative colitis and Crohn’s disease. AJR Am J Roentgenol. 1996;167:3-15.
- Duigenan S, Gee MS. Imaging of pediatric patients with inflammatory bowel disease. AJR Am J Roentgenol. 2012;199:907-915.
- Elsayes K, Al Hawary MM, Jagdish J et al. (2010) CT enterography: principles, trends, and interpretation of findings. RadioGraphics 30:1955–1970.
- Haas K, Rubesova E, Bass D. Role of imaging in the evaluation of inflammatory bowel disease: How much is too much? World J Radiol 2016; 8(2): 124-131 [PMID: 26981221. [CrossRef]
- Makanyanga JC, Taylor SA. Current and future role of MRI in Crohn’s disease. Clinical Radiology. 2021; 76(3):157-167.
- aylor SA, Mallett S, Bhatnagar G, et al.Diagnostic accurancy of magnetic resonance enterography and small bowel ultrasound for the extent and activity of Crohn’s disease (METRIC): A multicentre trial. Lancet Gastroenterol Hepatol. 2021; 6(8):548-562.
- Mettler FA, Huda W, Yoshizumi TT, Mahesh M. Effective doses in radiology and diagnostic nuclear medicine: a catalog. Radiology. 2008;248:254-263.
- Gaca AM, Jaffe TA, Delaney S, Yoshizumi T, Toncheva G, Nguyen G, Frush DP. Radiation doses from small-bowel follow-through and abdomen/pelvis MDCT in pediatric Crohn disease. Pediatr Radiol. 2008;38:285-291.
- Del Gaizo AJ, Fletcher JG, Yu L, Paden RG, Spencer GC, Leng S, Silva AM, Fidler JL, Silva AC, Hara AK. Reducing radiation dose in CT enterography. Radiographics. 2013;33:1109-1124.
- X. Li, D. Liang, J. Meng, et al. Development and validation of a novel computed-tomography enterography radiomic approach for characterization of intestinal fibrosis in crohn's disease Gastroenterology, 160 (2021), pp. 2303-2316e11.
- Martin DR, Lauenstein T, Sitaraman SV. Utility of magnetic resonance imaging in small bowel Crohn’s disease. Gastroenterology. 2007; 133(2):385–390.
- Kim KJ, Lee Y, Park SH (2015) Diffusion-weighted MR enterography for evaluating Crohn’s disease: how does it add diagnostically to conventional MR enterography. Inflamm Bowel Dis 21(1):101–109.
- Kaushal P, Somwaru AS, Charabaty A (2017) MR enterography of inflammatory bowel disease with endoscopic correlation. Radiographics 37(1):116–131.
- Lanier MH, Shetty AS, Salter A (2018) Evaluation of noncontrast MR enterography for pediatric inflammatory bowel disease assessment. J Magn Reson Imaging 48(2):341–348.
- Fallis S.A., Murphy P., Sinha R. Magnetic reso-nance enterography in Crohn’s disease: A compari-son with the findings at surgery. Colorectal. Dis. 2013;15:1273–1280. - DOI - PubMed. [CrossRef]
- Kuehle C.A., Ajaj W., Ladd S.C., Massing S., Barkhausen J., Lauenstein T.C. Hydro-MRI of the Small Bowel: Effect of Contrast Volume, Timing of Contrast Administration, and Data Acquisition on Bowel Distention. Am. J. Roentgenol. 2006;187:W375–W385. - DOI - PubMed. [CrossRef]
- Maccioni F., Bruni A., Viscido A., Colaiacomo M.C., Cocco A., Montesani C., Caprilli R., Marini M. MR Imaging in Patients with Crohn Disease: Value of T2- versus T1-weighted Gadolinium-enhanced MR Sequences with Use of an Oral Superparamagnetic Contrast Agent. Radiology. 2006;238:517–530. - DOI - PubMed. [CrossRef]
- Low R.N., Sebrechts C.P., Politoske D.A. Crohn disease with endoscopic correlation: Single-shot fast spin-echo and gadolinium-enhanced fat-sup-pressed spoiled gradient-echo MR imaging. Radiology. 2002;222:652–660. - DOI - PubMed. [CrossRef]
- Tolan DJ, Greenhalgh R, Zealley IA, Halligan S, Taylor SA. MR enterographic manifestations of small bowel Crohn disease. Radiographics. 2010; 30(2):367-384.
- Moy M., Sauk J., Gee M. The Role of MR Enterography in Assessing Crohn's Disease Activity and Treatment Response. Gastroenterol Res Pract. 2015 Dec 27;2016:8168695. [CrossRef]
- Radmard A., Amouei M.,Torabi A.,Sima A.,Saffar H., Geahchan A., Davarpanah A., Taouli B. MR Enterography in Ulcerative Colitis:Beyond Endoscopy. RadioGraphics.2024Volume 44, Issue 1. [CrossRef]
- Rimola J, Fernandez-Clotet A, Capozzi N, et al. . ADC values for detecting bowel inflammation and biologic therapy response in patients with Crohn disease: a Post-Hoc Prospective Trial Analysis. AJR Am J Roentgenol 2023;222:e2329639. - PubMed.
- Mentzel HJ, Reinsch S, Kurzai M, et al. Magnetic resonance imaging in children and adolescents with chronic inflammatory bowel disease. World J Gastroenterol 2014; 20: 1180-1191. [DOI] [PMC free article] [PubMed] [Google Scholar].
- Alexopoulou E, Roma E, Loggitsi D, et al. Magnetic resonance imaging of the small bowel in children with idiopathic inflammatory bowel disease: evaluation of disease activity. Pediatr Radiol 2009; 39: 791-797. [DOI] [PubMed] [Google Scholar].
- Qiu Y, Mao R, Chen BLet al. Systematic review with meta-analysis: magnetic resonance enterography vs. computed tomography enterography for evaluating disease activity in small bowel Crohn’s disease. Aliment Pharmacol Ther 2014; 40: 134-146. [DOI] [PubMed] [Google Scholar].
- Biernacka K., Barańska D., Matera K., PodgórskiM. , Czkwianianc E., Zakrzewska K., Dziembowska I., Grzelak P. The value of magnetic resonance enterography in diagnostic difficulties associated with Crohn’s disease. Pol J Radiol. 2021 Mar 3;86:e143–e150. [CrossRef]
- Athanasakos A, Mazioti A, Economopoulos N, et al. Inflammatory bowel disease-the role of cross-sectional imaging techniques in the investigation of the small bowel. Insights Imaging 2015; 6: 73-83. [DOI] [PMC free article] [PubMed] [Google Scholar].
- Ordas I, Rimola J, Rodriuea-Lago I, et al. Imaging in inflammatory bowel disease: State of the art. Gut.2023. 72(5):889-904.
- Fornasa F., Benassuti C., Benazzato L. Role of magnetic resonance enterography in differentiating between fibrotic and active inflammatory small bowel stenosis in patients with Crohn's disease. Journal of Clinical Imaging Science. 2011;1, article 35. [DOI] [PMC free article] [PubMed] [Google Scholar]. [CrossRef]
- Gee M. S., Nimkin K., Hsu M., et al. Prospective evaluation of MR enterography as the primary imaging modality for pediatric Crohn disease assessment. American Journal of Roentgenology. 2011;197(1):224–231. [DOI] [PMC free article] [PubMed] [Google Scholar]. [CrossRef]
- Baert F., Moortgat L., Van Assche G., et al. Mucosal healing predicts sustained clinical remission in patients with early-stage Crohn's disease. Gastroenterology. 2010;138(2):e410–e468. [DOI] [PubMed] [Google Scholar]. [CrossRef]
- Neurath M. F., Travis S. P. L. Mucosal healing in inflammatory bowel diseases: a systematic review. Gut. 2012;61(11):1619–1635. [DOI] [PubMed] [Google Scholar]. [CrossRef]
- Frøslie K. F., Jahnsen J., Moum B. A., Vatn M. H. Mucosal healing in inflammatory bowel disease: results from a Norwegian population-based cohort. Gastroenterology. 2007;133(2):412–422. [DOI] [PubMed] [Google Scholar. [CrossRef]
- Björkesten C.-G., Nieminen U., Sipponen T., Turunen U., Arkkila P., Färkkilä M. Mucosal healing at 3 months predicts long-term endoscopic remission in anti-TNF-treated luminal Crohn's disease. Scandinavian Journal of Gastroenterology. 2013;48(5):543–551. [DOI] [PubMed] [Google Scholar]. [CrossRef]
- Rutgeerts P., Van Assche G., Sandborn W. J., et al. Adalimumab induces and maintains mucosal healing in patients with Crohn's disease: data from the EXTEND trial. Gastroenterology. 2012;142(5):1102.e2–1111.e2. [DOI] [PubMed] [Google Scholar]. [CrossRef]
- Peyrin-Biroulet L., Deltenre P., de Suray N., Branche J., Sandborn W. J., Colombel J.-F. Efficacy and safety of tumor necrosis factor antagonists in Crohn's disease: meta-analysis of placebo-controlled trials. Clinical Gastroenterology and Hepatology. 2008;6(6):644–653. [DOI] [PubMed] [Google Scholar]. [CrossRef]
- 61. Rimola J, Ordás I, Rodriguez S et al. Magnetic Resonance Imaging for Evaluation of Crohn's Disease: Validation of Parameters of Severity and Quantitative Index of Activity. Inflamm Bowel Dis. 2011;17(8):1759-68. - Pubmed. [CrossRef]
- Williet N, Jardin S, Roblin X.. The simplified Magnetic Resonance Index of Activity [MARIA] for Crohn’s disease is strongly correlated with the MARIA and Clermont score: an external validation. Gastroenterology 2020;158:282–3. - PubMed.
- Ordás I, Rimola J, Alfaro I et al. Development and Validation of a Simplified Magnetic Resonance Index of Activity for Crohn's Disease. Gastroenterology. 2019;157(2):432-439.e1. - Pubmed. [CrossRef]
- Kumar S., Plumb a., Mallett S., Bhatnagar G., Bloom S., Clarke C. , Hamlin J.,Hart A., Jacobs I., Travis S., Vega R., Halligan S. , Taylor S. METRIC-EF: magnetic resonance enterography to predict disabling disease in newly diagnosed Crohn’s disease—protocol for a multicentre, non-randomised, single-arm, prospective study. BMJ Open 2022;12:e067265. [CrossRef]
- Nieun Seo. Comprehensive Review of Magnetic Resonance Enterography-Based Activity Scoring Systems for Crohn’s Disease. iMRI 2025;29(1):1-13 . [CrossRef]
- Makanyanga J. C., Pendsé D., Dikaios N., et al. Evaluation of Crohn's disease activity: initial validation of a magnetic resonance enterography global score (MEGS) against faecal calprotectin. European Radiology. 2014;24(2):277–287. [DOI] [PubMed] [Google Scholar]. [CrossRef]
- Steward MJ, Punwani S, Proctor I, et al. Non-perforating small bowel Crohn’s disease assessed by MRI enterography: derivation and histopathological validation of an MR-based activity index. Eur J Radiol 2012;81:2080-2088.
- Hordonneau C, Buisson A, Scanzi J, et al. . Diffusion-weighted magnetic resonance imaging in ileocolonic Crohn’s disease: validation of quantitative index of activity. Am J Gastroenterol 2014;109:89–98. - PubMed.
- Buisson A, Joubert A, Montoriol PF, et al. Diffusion-weighted magnetic resonance imaging for detecting and assessing ileal inflammation in Crohn’s disease. Aliment Pharmacol Ther 2013; 37:537-545.
- Oussalah A, Laurent V, Bruot O, et al. Diffusion-weighted magnetic resonance without bowel preparation for detecting colonic inflammation in inflammatory bowel disease. Gut 2010;59:1056- 1065.
- Panes J, Bouhnik Y, ReinischW, et al. Imaging techhiquws for assessment of inflammatory bowel disease: Joint ECCO-ESGAR evidence-based consensus guidelines. Journal of Crohn’s and Colitis. 2023:17(4):455-472.
Figure 1.
Moderat parietal thickening (7mm). Imaging sequences included: Axial T2, Coronal T2, Axial Diffusion, and Axial T1 Fat Saturation post-contrast. Findings: The last ileal loop shows moderate parietal thickening, more pronounced in the distal segment near the ileocecal valve, with a maximum thickness of 7 mm over a total length of 22 mm. This thickening is uniform, associated with diffusion restriction and early contrast enhancement, suggestive of terminal ileitis.
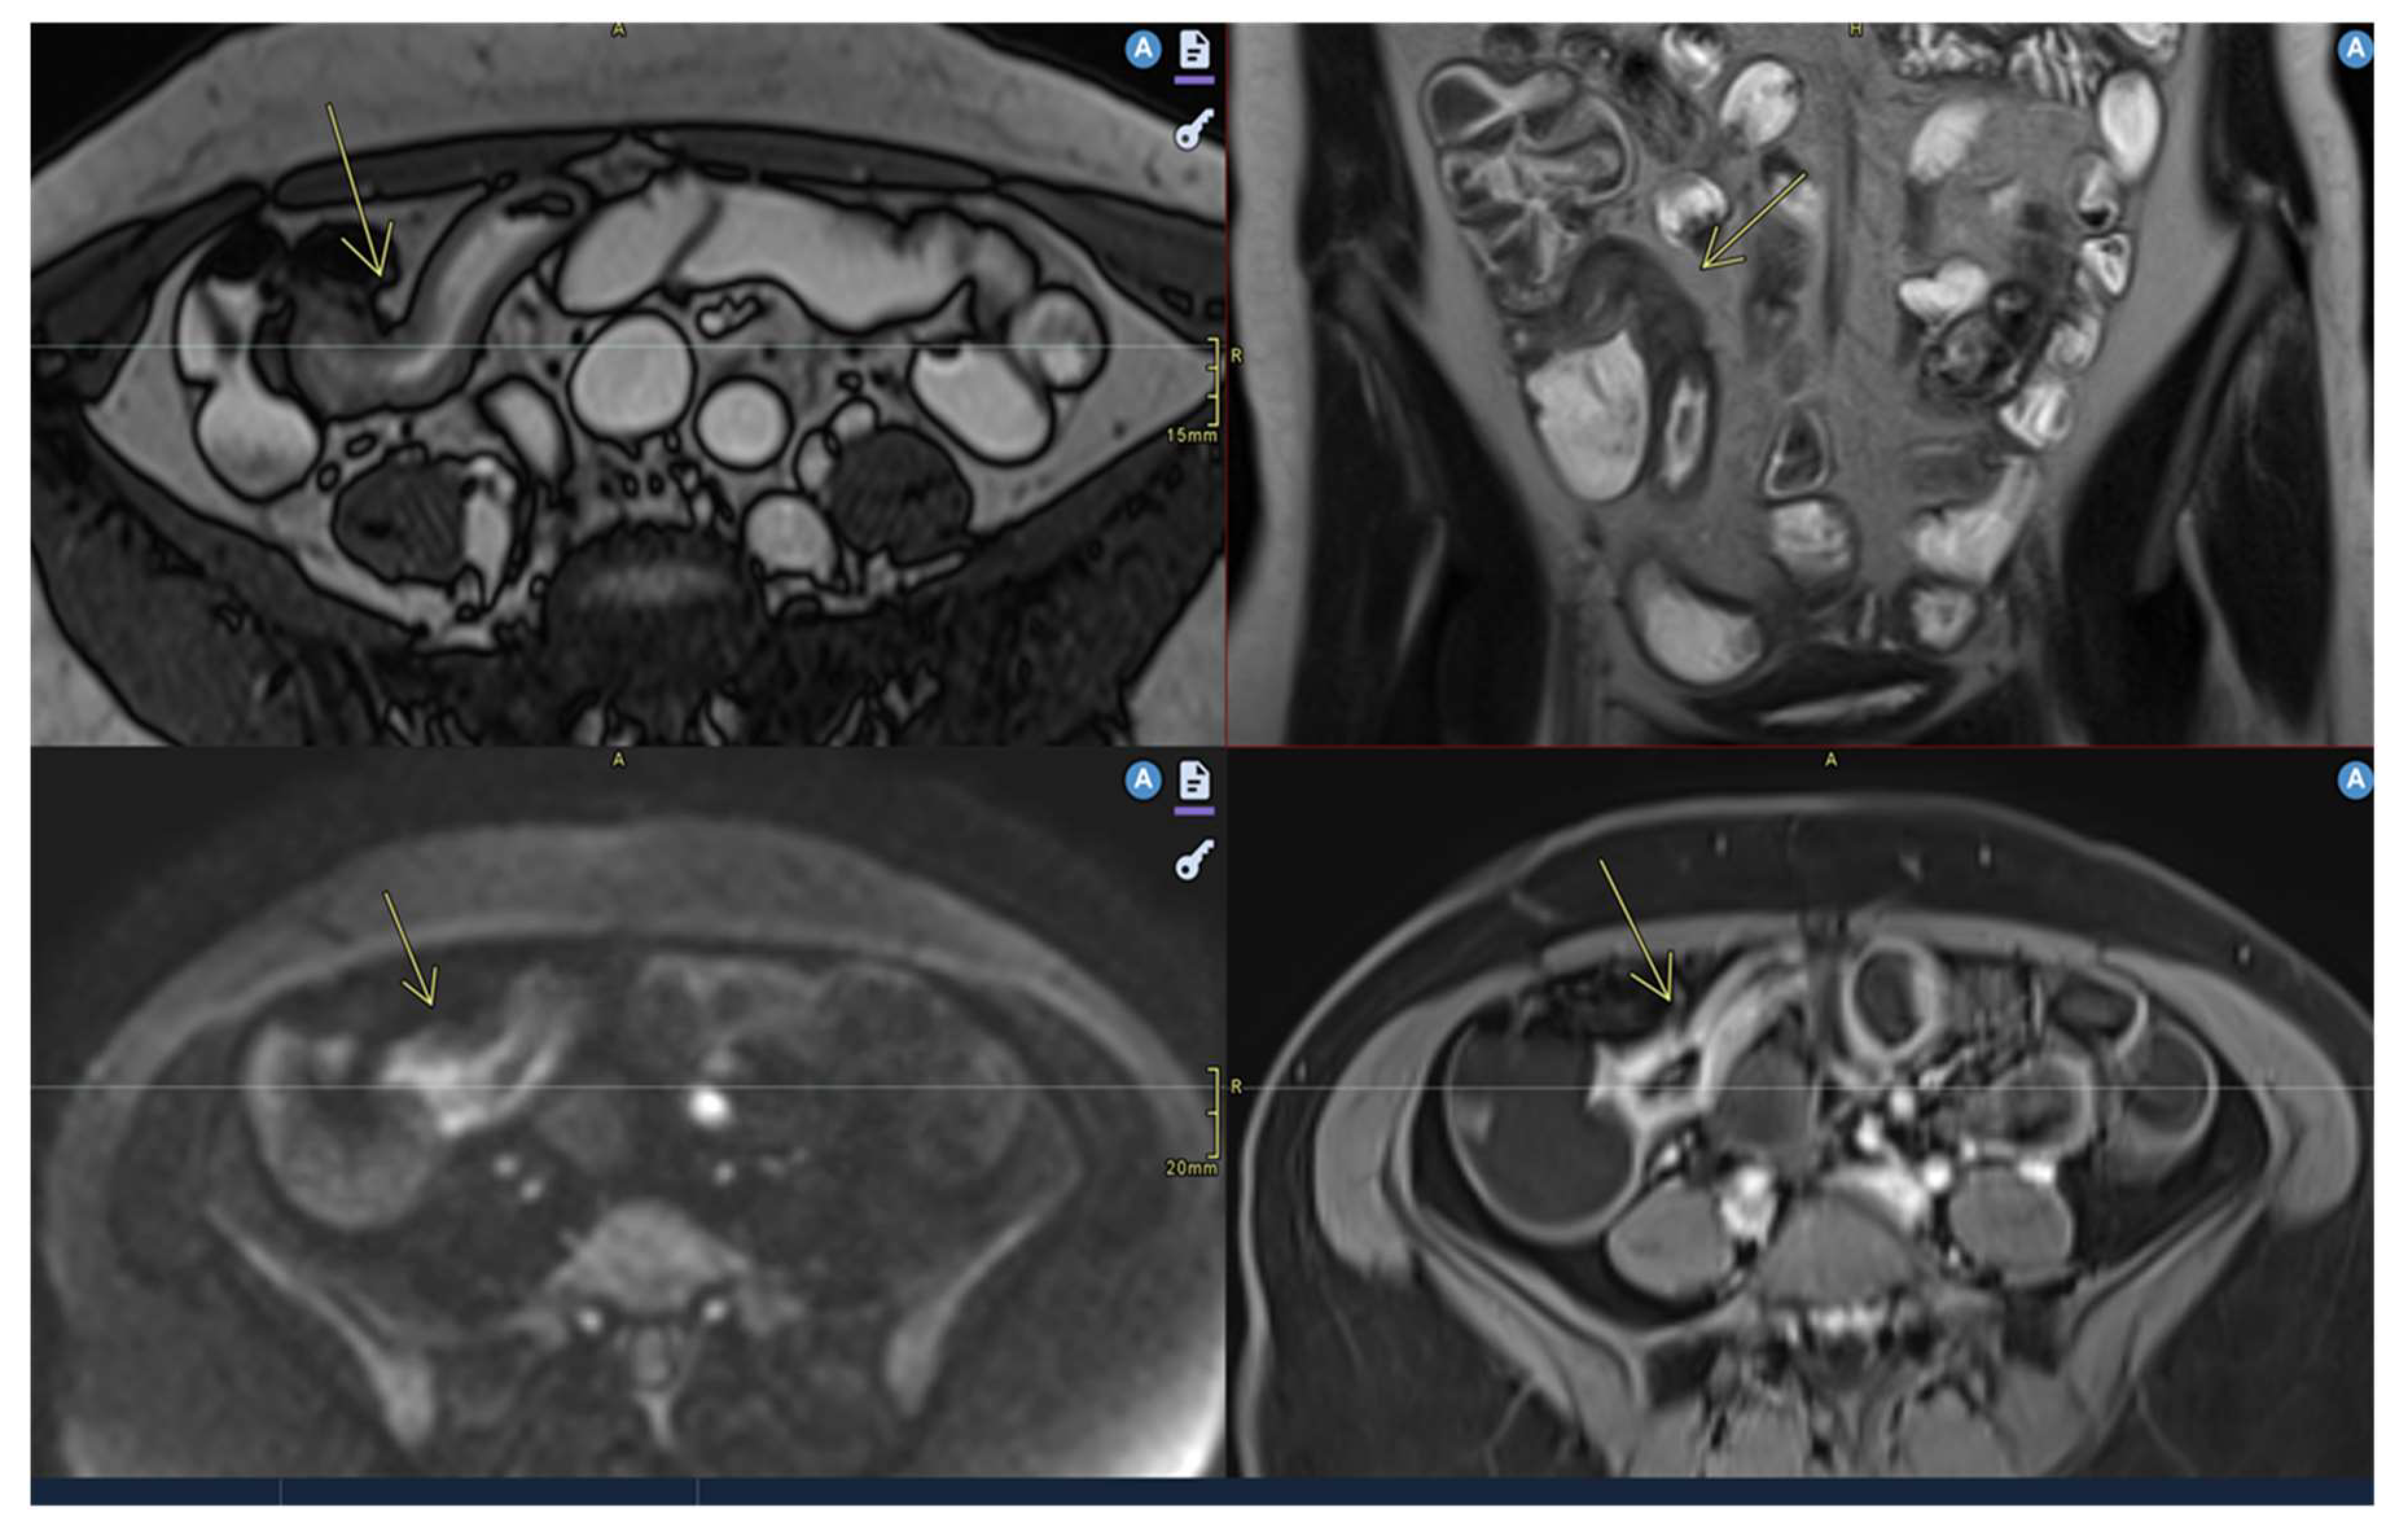
Figure 2.
Restricted diffusion.Moderat parietal thickening . Imaging sequences included: Coronal T2 TRUFI (True Fast Imaging with Steady-State Free Precession), Axial Diffusion, Axial T1 Fat Saturation post-contrast, Axial T2 TRUFI Findings: There is circumferential parietal thickening at the level of the transverse colon, up to 8 mm in thickness over a length of 21 mm, associated with diffusion restriction and early contrast enhancement, suggestive of an acute inflammatory substrate (moderate degree of activity). Additionally, fat stranding is noted in the adjacent fat and peri-digestive vascular hyperemia is observed. No ulcerations or fistulas are present.
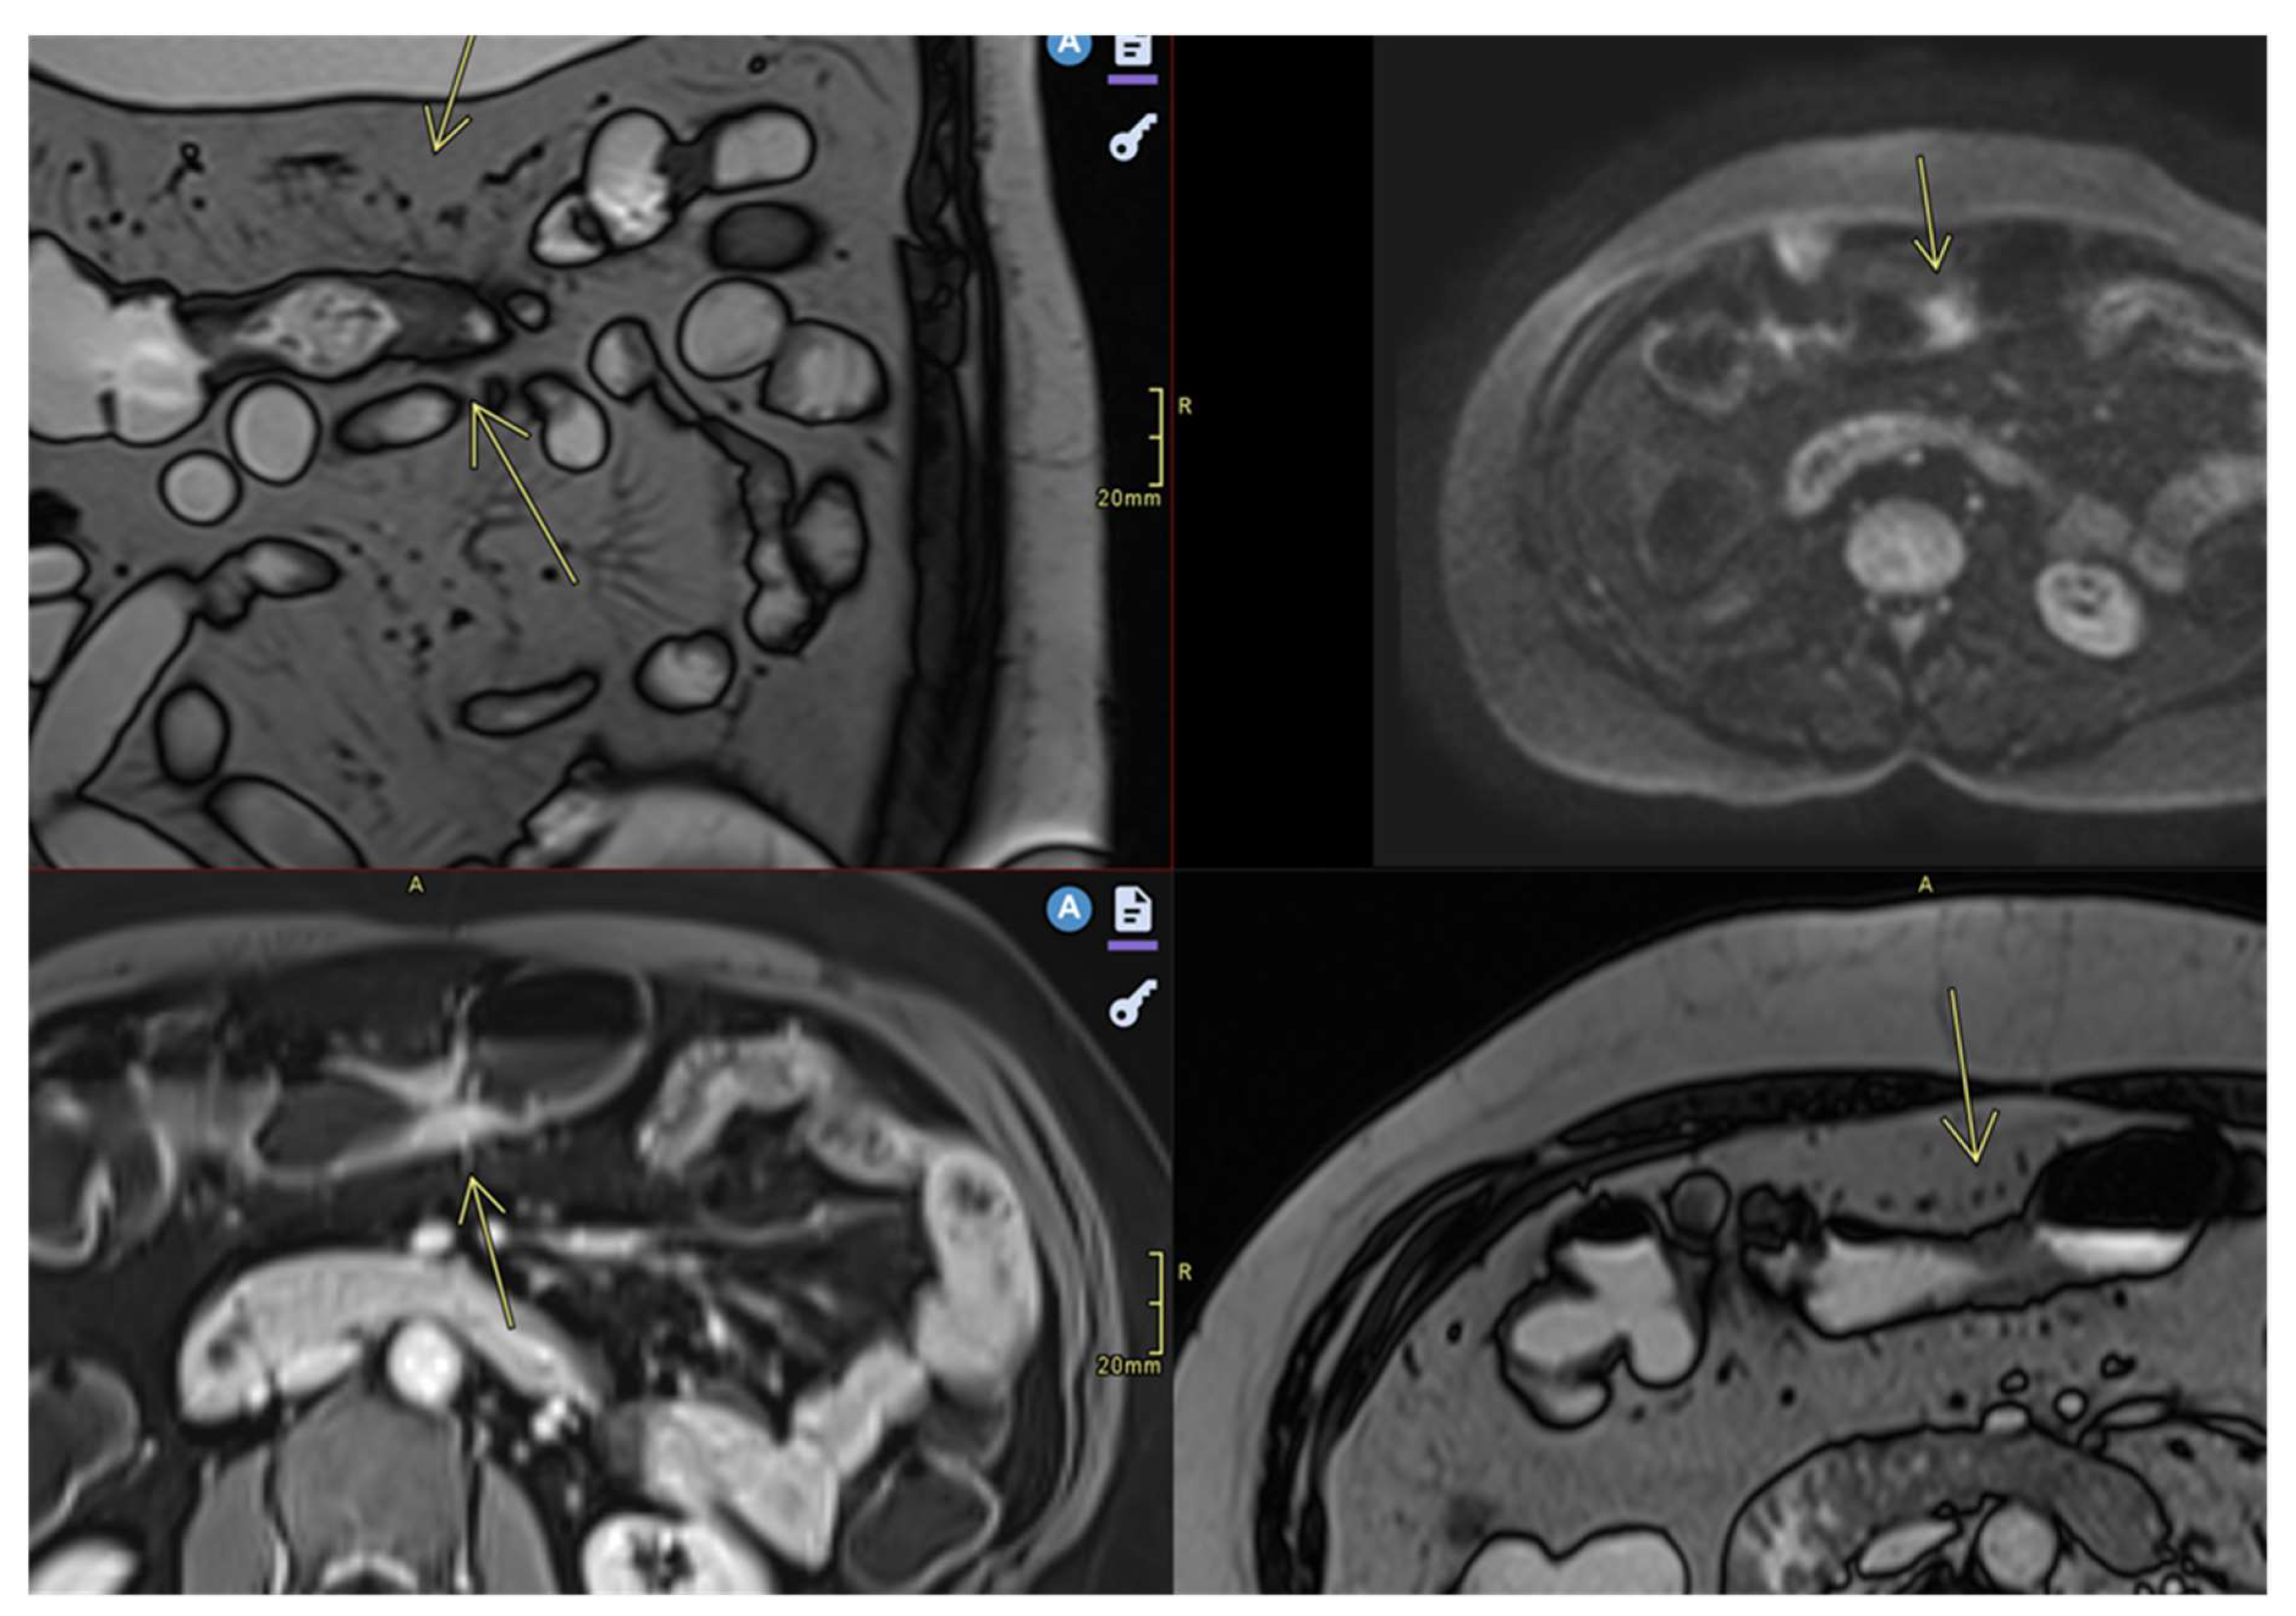
Figure 3.
Restricted diffusion. Moderat parietal thickening (8mm). Imaging sequences performed: Sagittal T2 TRUFI, Axial T2 TRUFI, Axial Diffusion, Axial T1 Fat Saturation post-contrast. Findings: Moderate parietal thickening is noted at the level of the descending colon, associated with diffusion restriction and early contrast enhancement, suggestive of an acute inflammatory substrate. The patient presents with suspected Crohn's disease. No ulcerations or fistulas are observed, and no marked distention of the upper rectum or sigmoid colon is present.
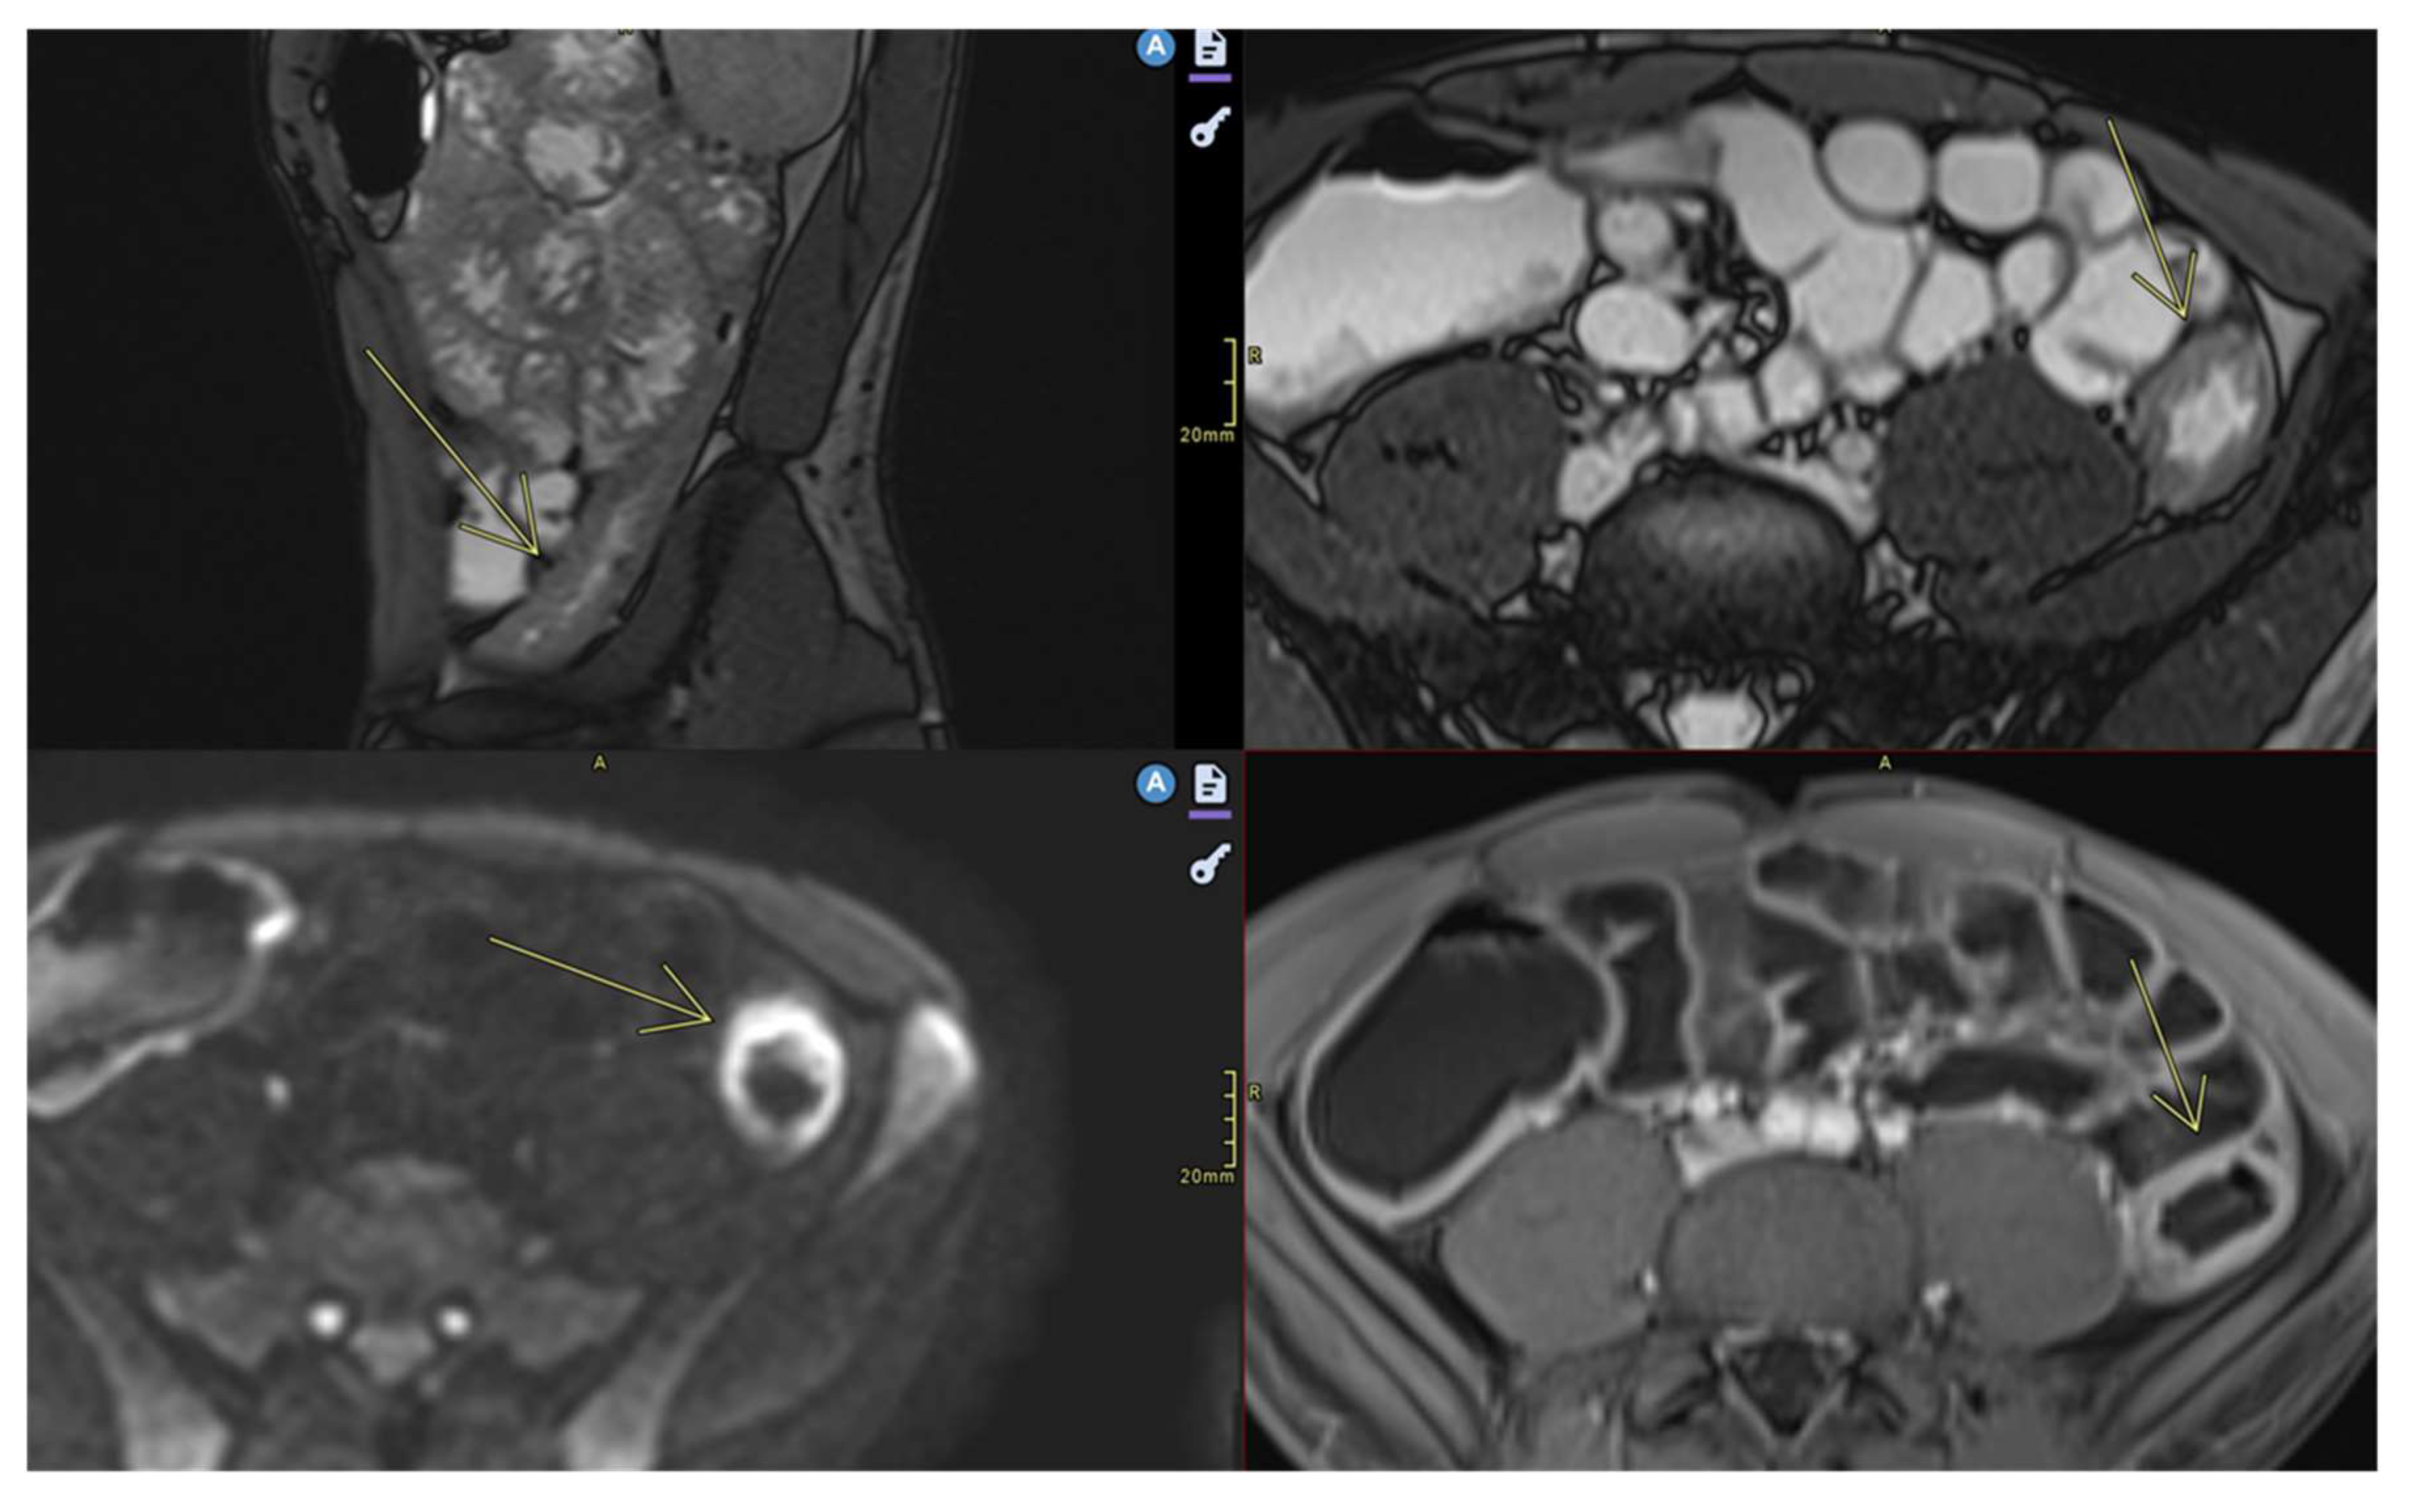
Figure 4.
Ulcerations. Imaging sequences performed: Axial T2 TRUFI, Axial Diffusion, Axial T1 Fat Saturation post-contrast (arterial and venous phases). Findings: Multifocal ileal parietal thickening is noted, with fat stranding in the adjacent fat and peri-digestive vascular hyperemia. Minimal parietal ulcerations are present, with no fistulas observed..
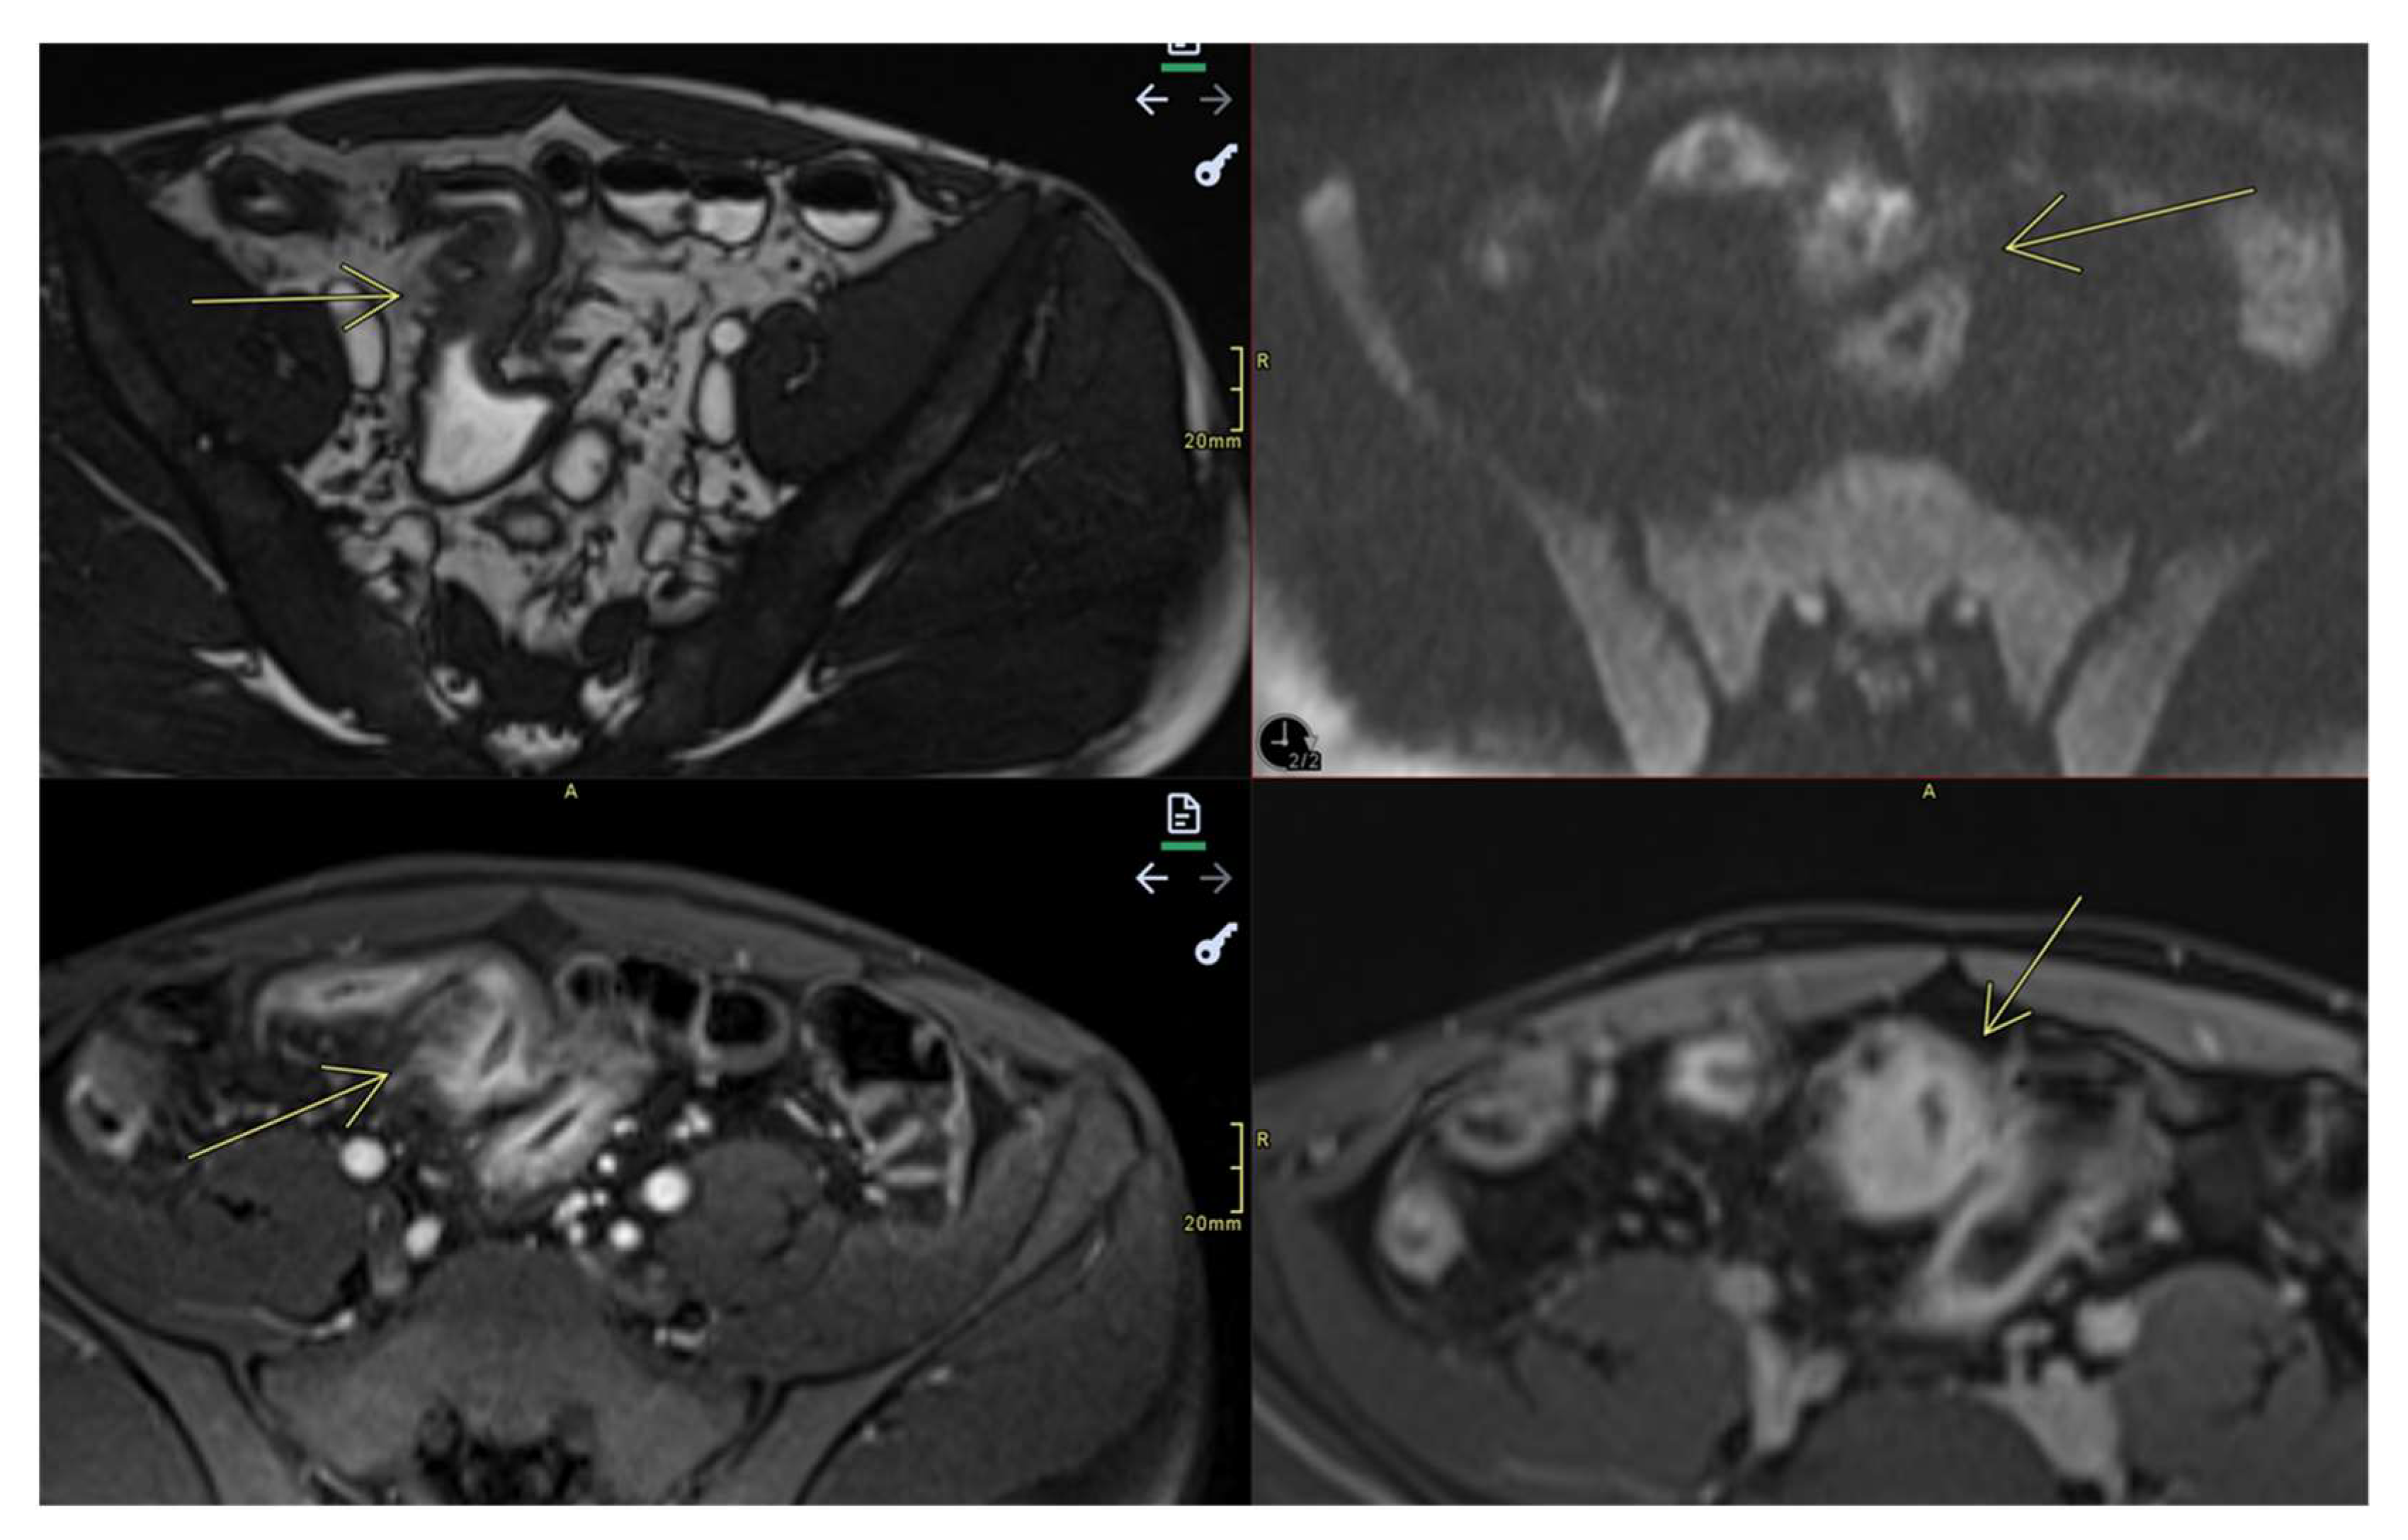
Figure 5.
Severe wall thickering. Fibrofatty proliferation. Lymphadenopathy. Imaging sequences performed: Axial T2, T2 HASTE coronal, T2 FS/STIR. Findings. In the right mesogastric region, several distal ileal loops are identified, displaying a “cloverleaf” configuration, with mildly circumferential wall thickening measuring up to 4 mm, suggestive of a volvulus-like appearance. The ileal segment located medially to this cloverleaf-shaped cluster demonstrates more significant parietal thickening, up to approximately 10 mm, with associated luminal narrowing. Edematous and inflammatory changes are noted in the surrounding fat. Right pericolic lymphadenopathy is present, measuring approximately 10 mm.
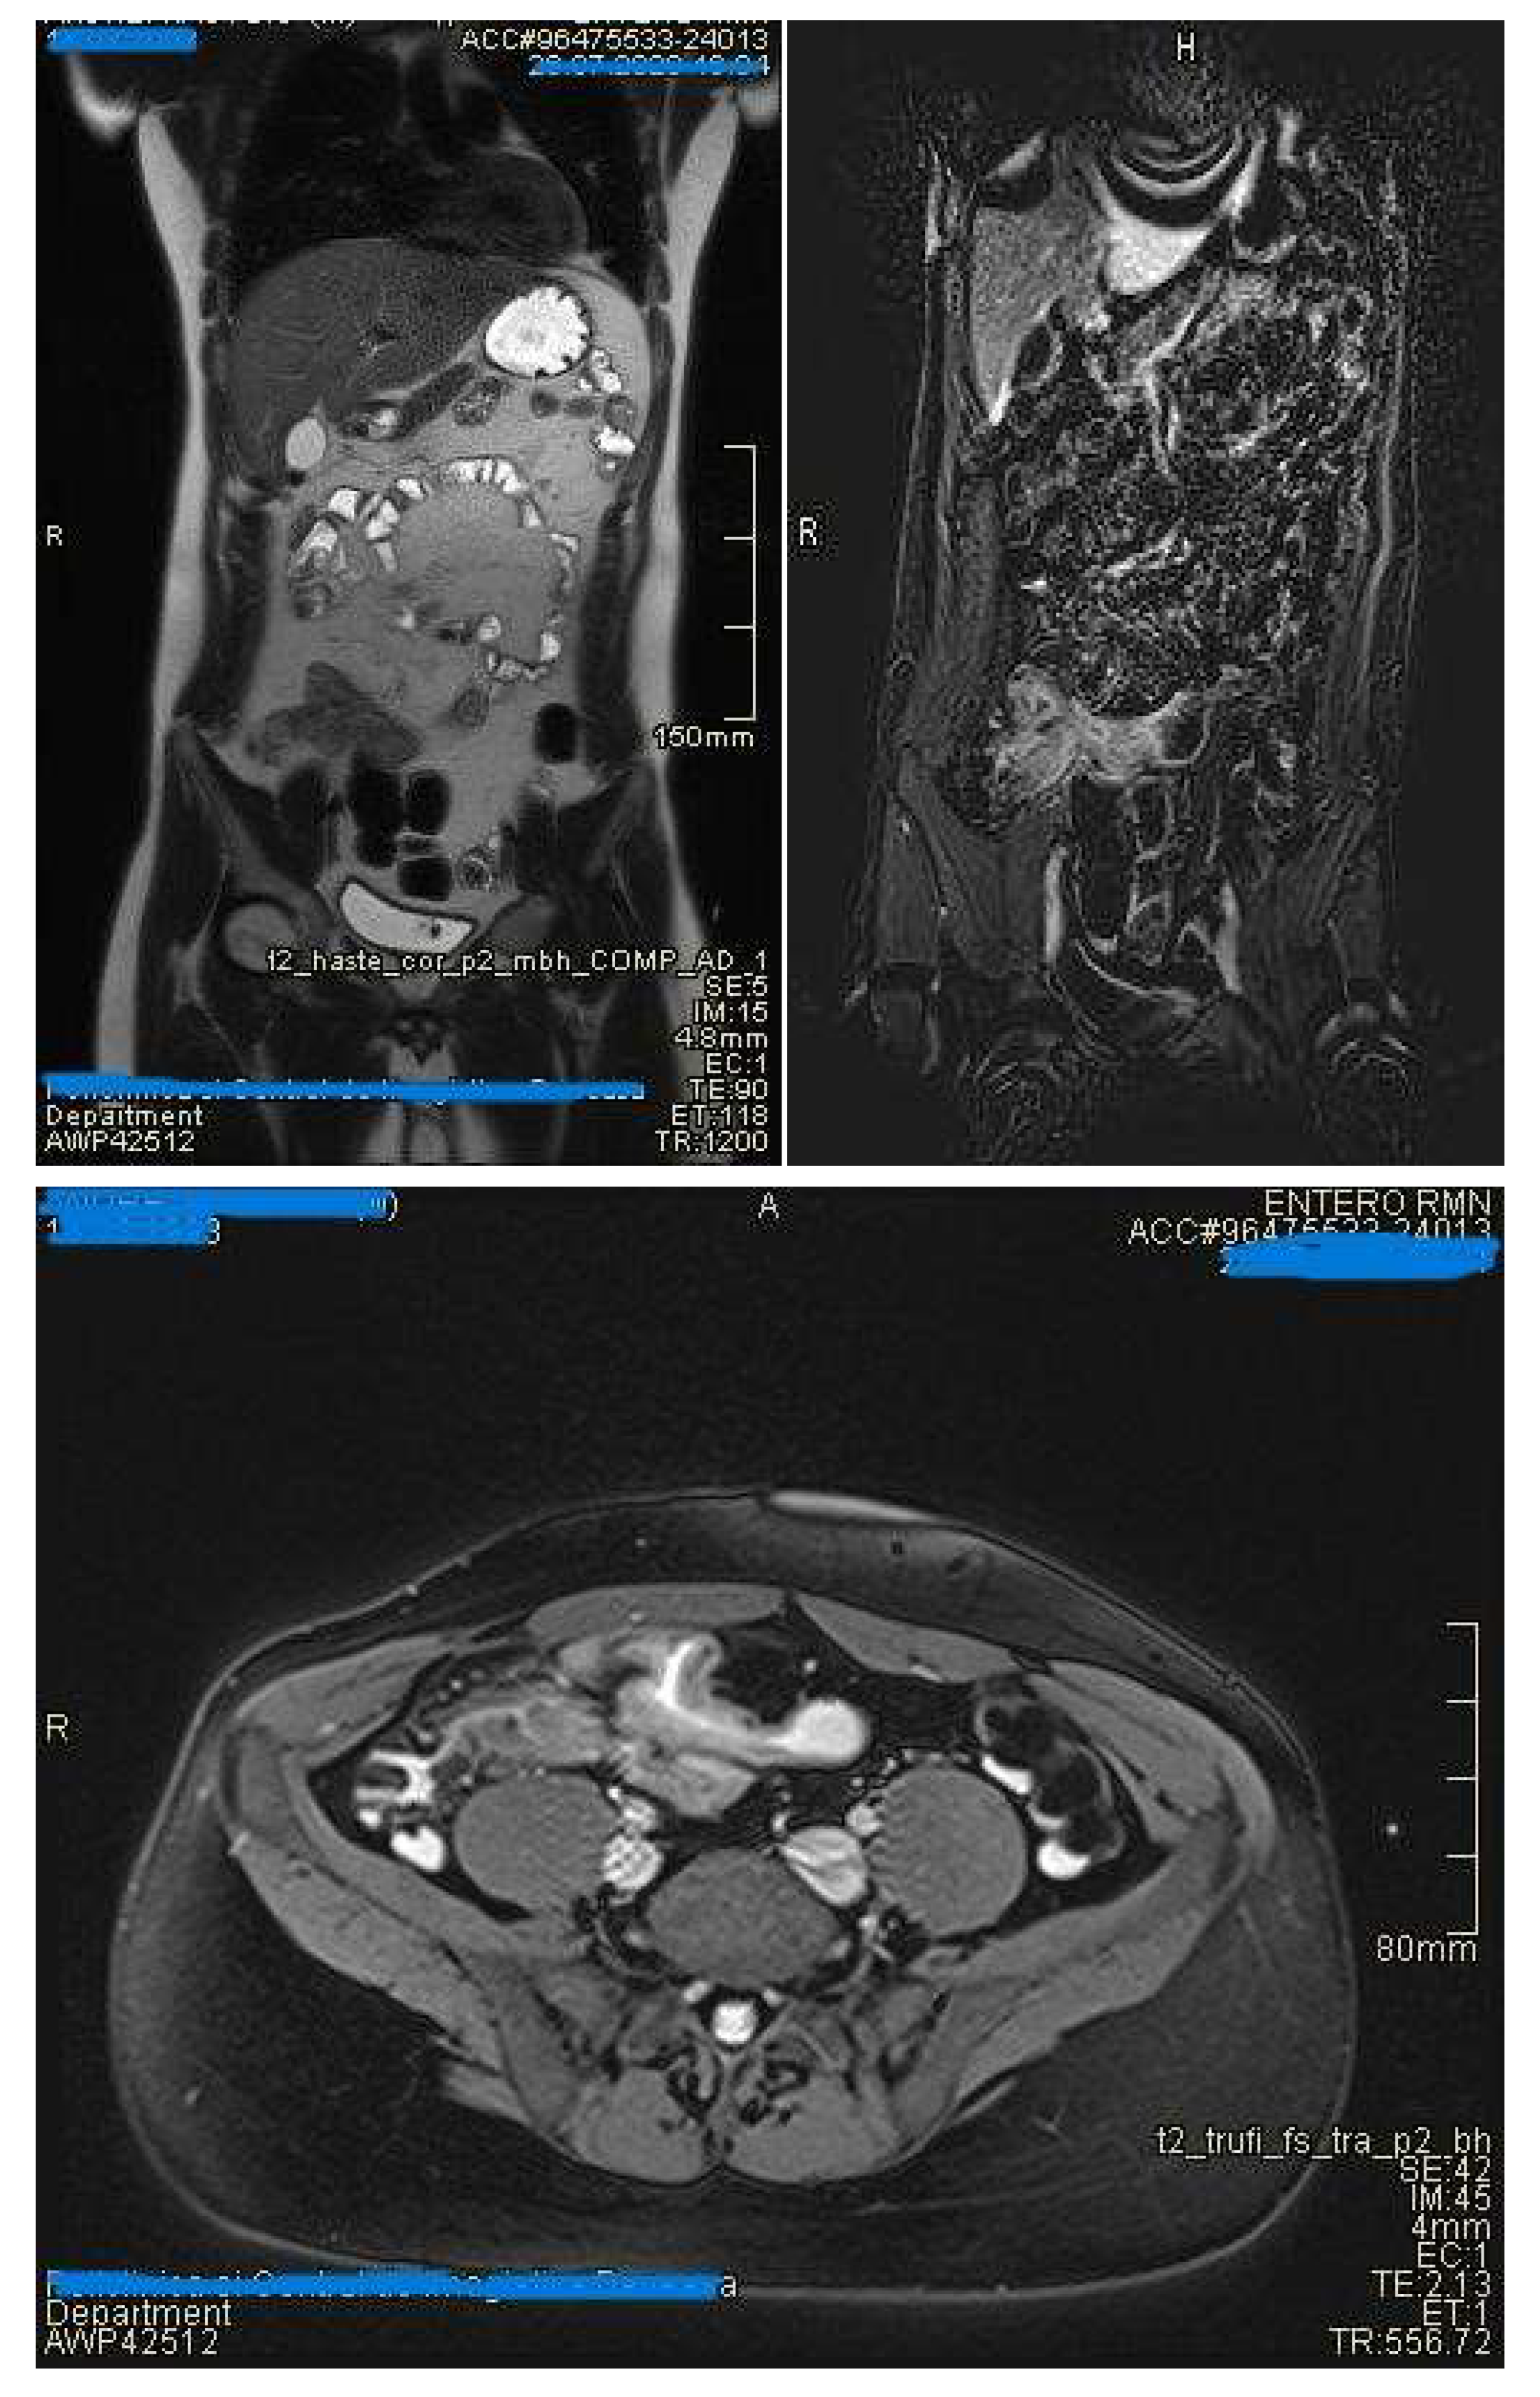
Figure 6.
Comb sign. Imaging sequences performed:Axial T1 post-contrast Fat-sat, Coronal T1 post-contrast Fat-sat. Findings.The last segment of the ileal loop shows circumferential mucosal thickening (maximum thickness approximately 7 mm). These ileal parietal changes involve a long ileal segment located paracecal and in the right iliac fossa and hemipelvis. There is accentuation of the adjacent mesenteric vascular pattern. Upstream of this segment, with uniformly thickened and circumferential walls, several moderately distended ileal loops are evident, with a moderately visible hydro-aeric level.
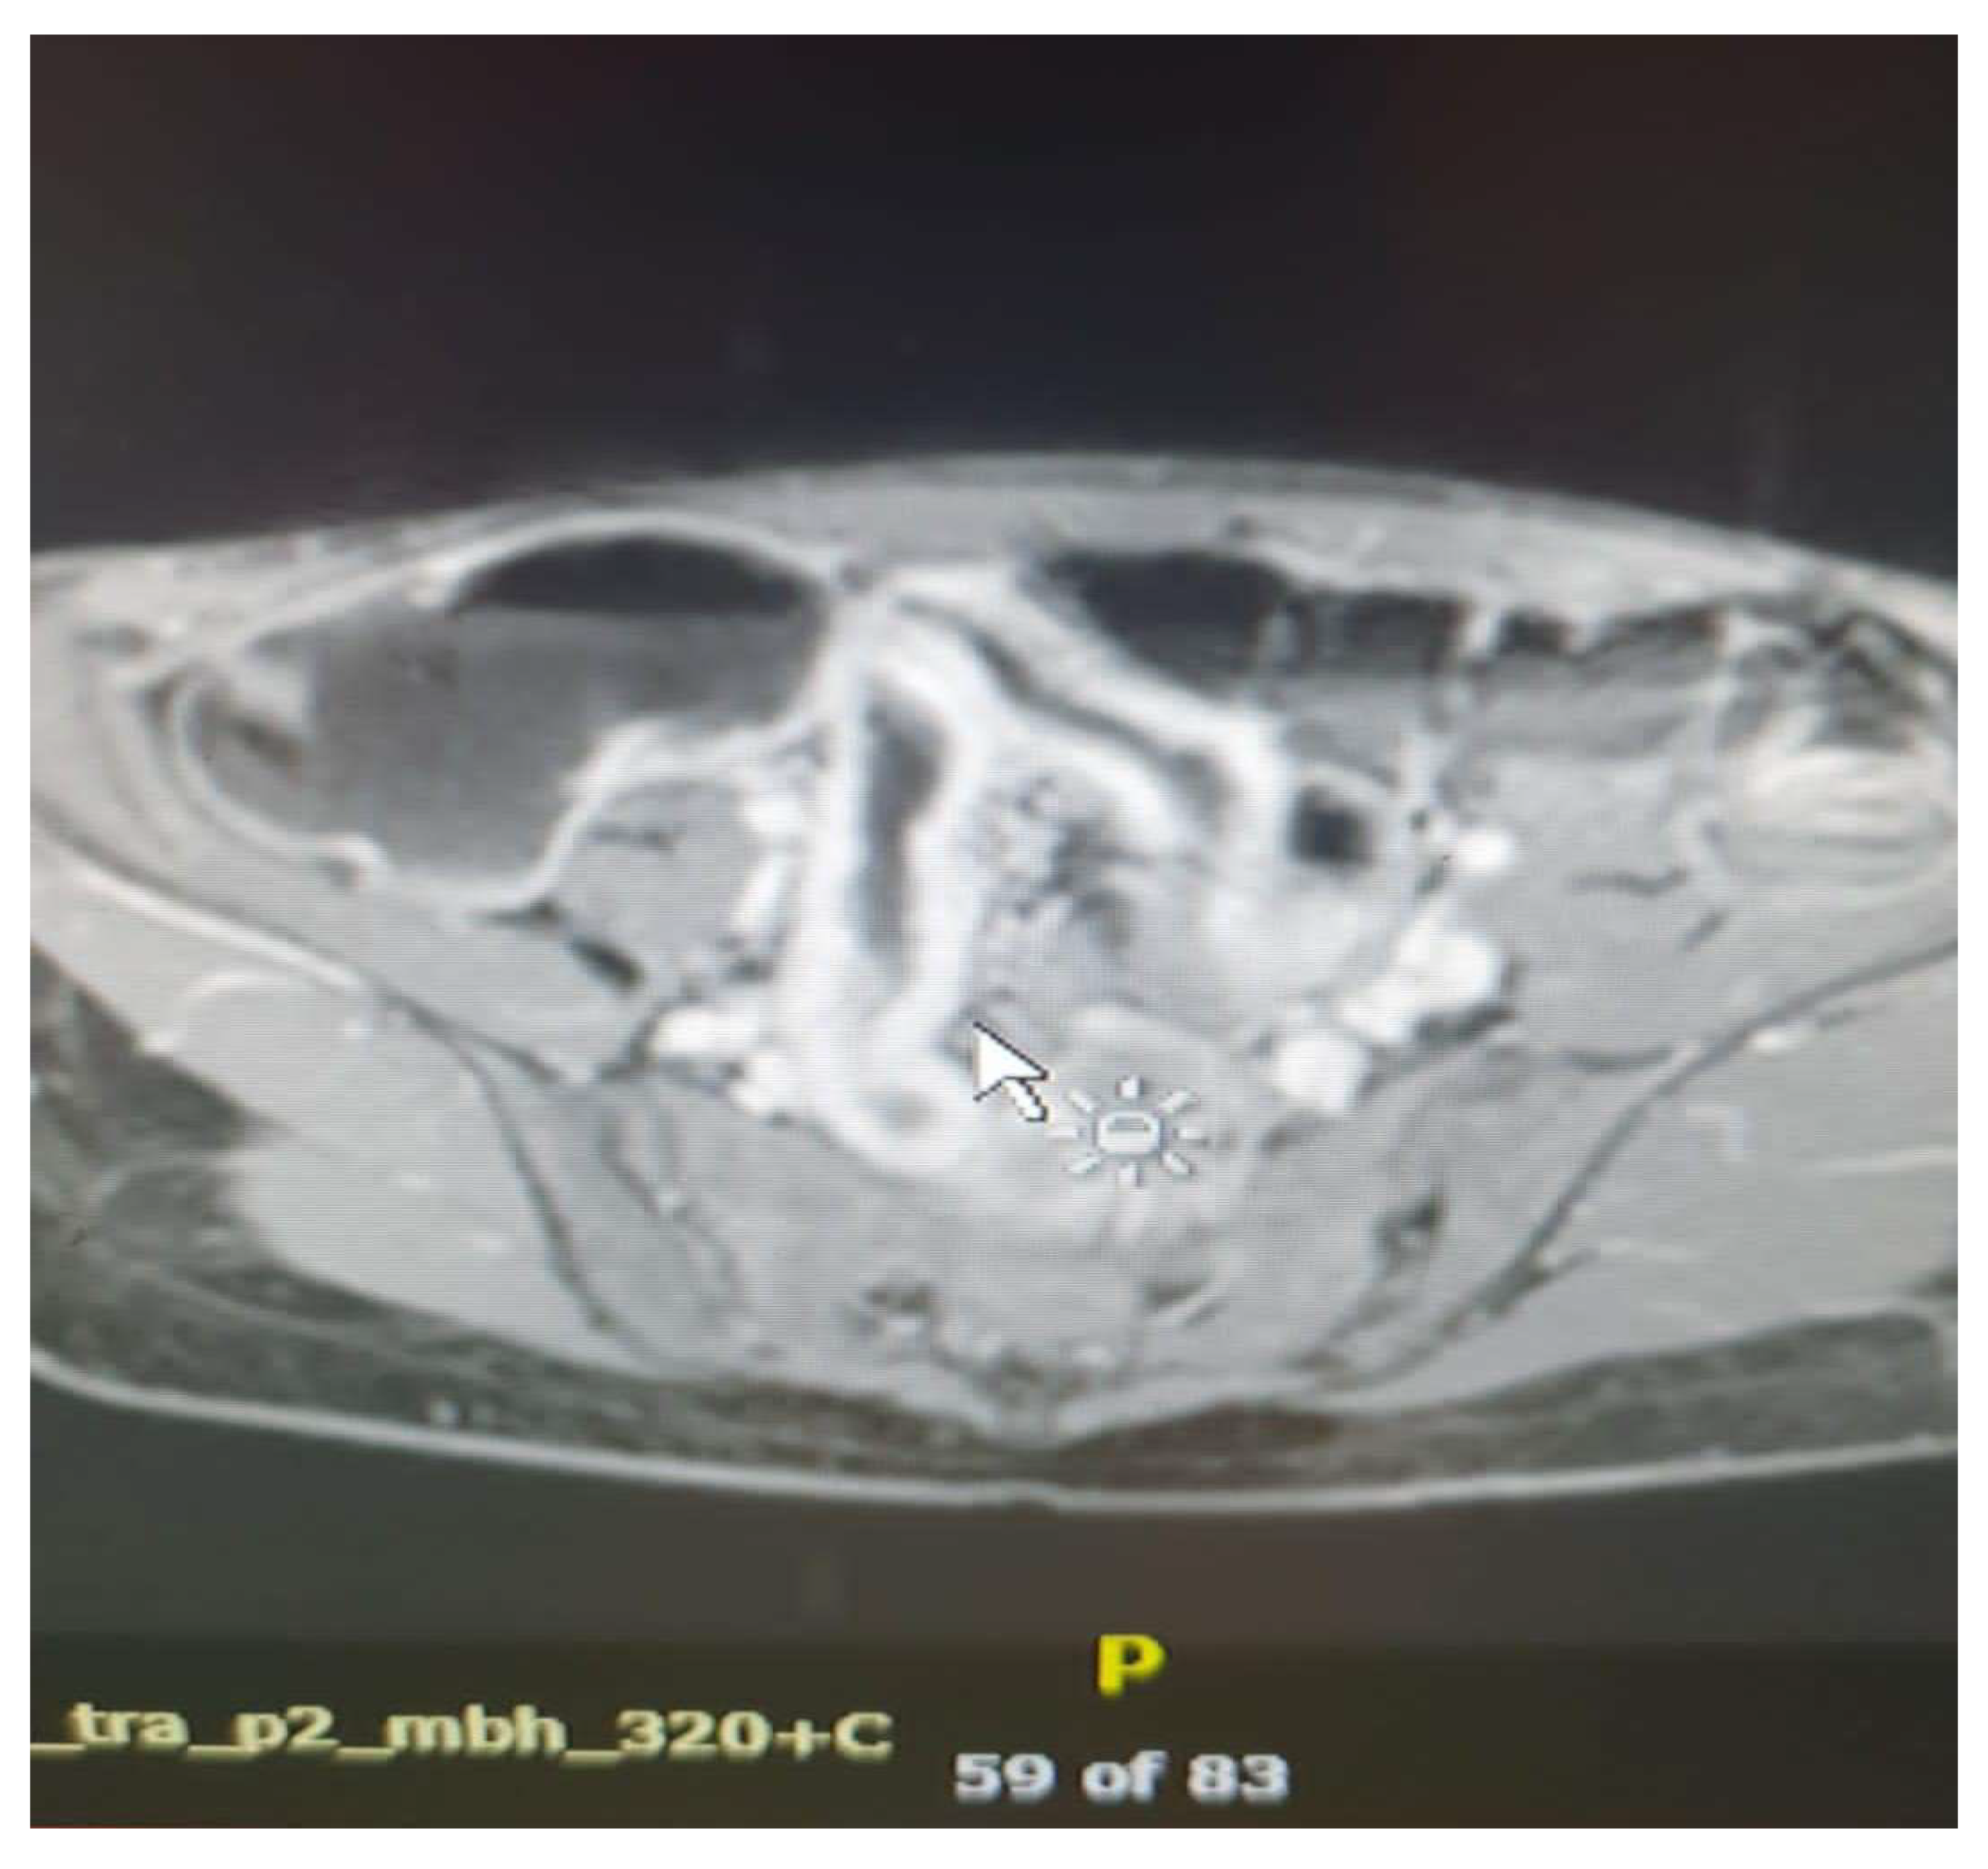
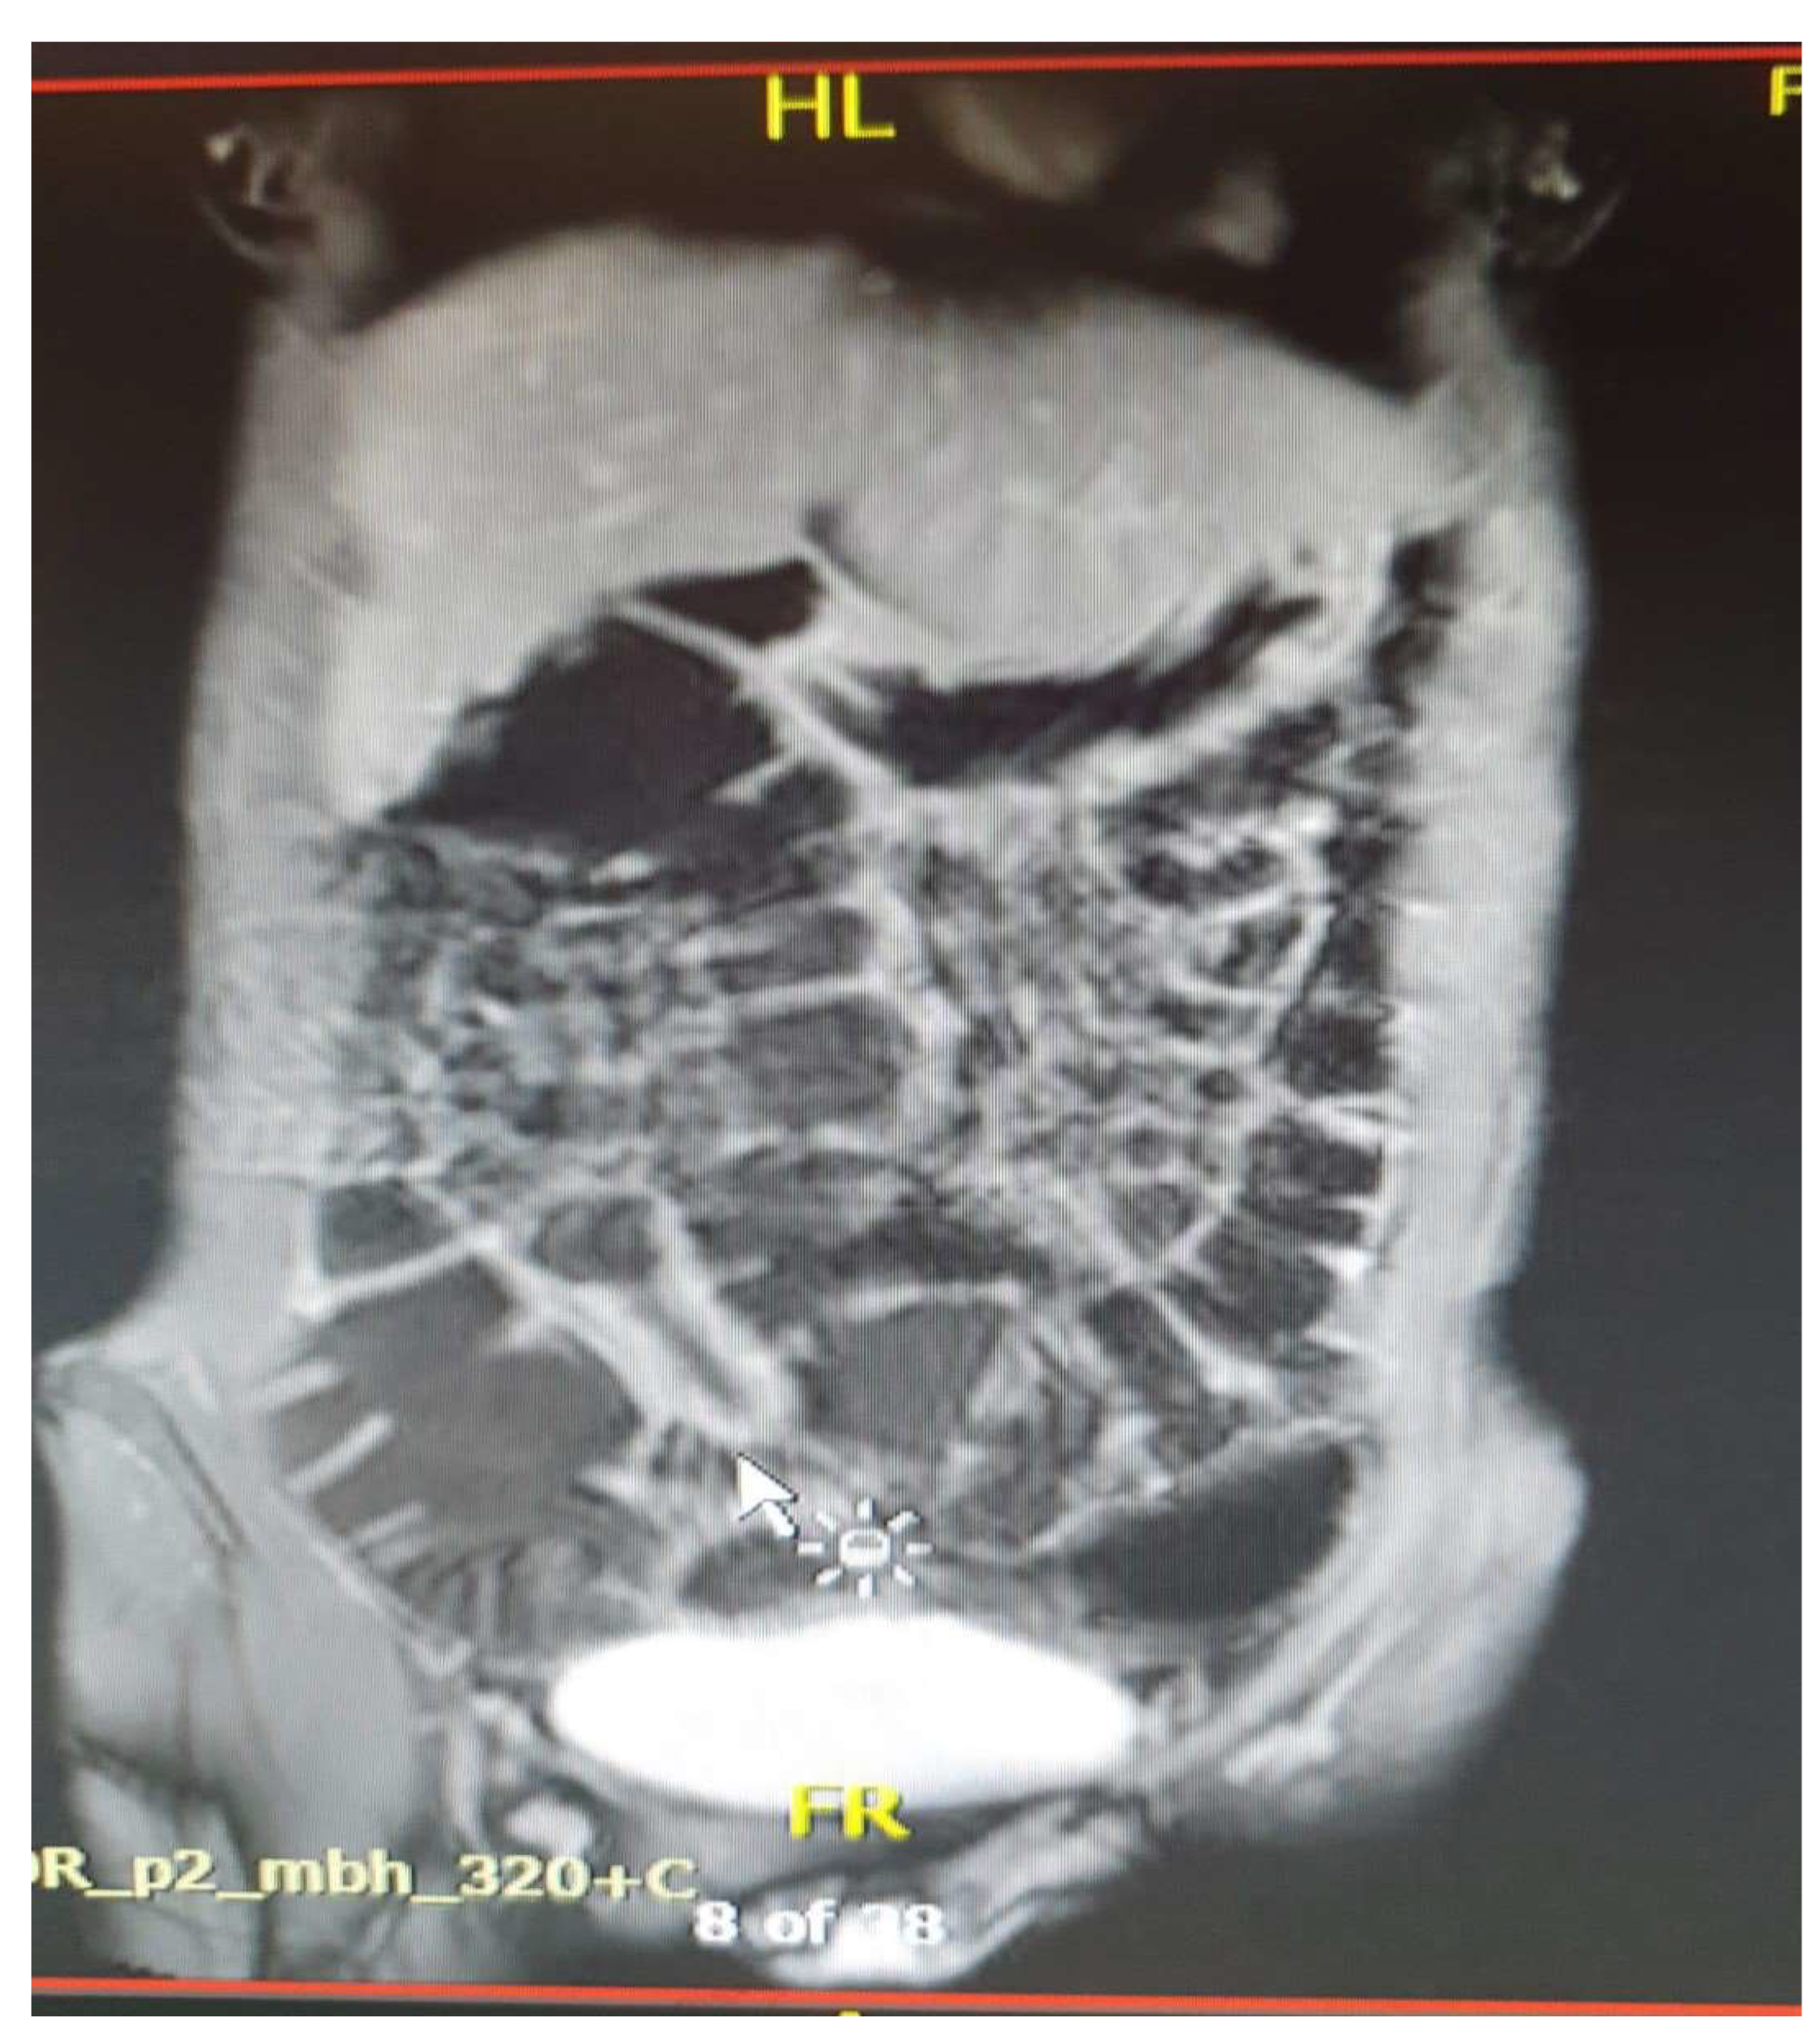
Figure 7.
Stenosis and fistulization. Imaging sequences performed: Coronal T2 TRUFI, Axial T2, Axial and Coronal T1 Fat Saturation post-contrast. Findings: The images reveal areas of stenosis and patchy dilatations within the affected ileum, as well as areas of enteric-enteric fistulization (yellow arrow).
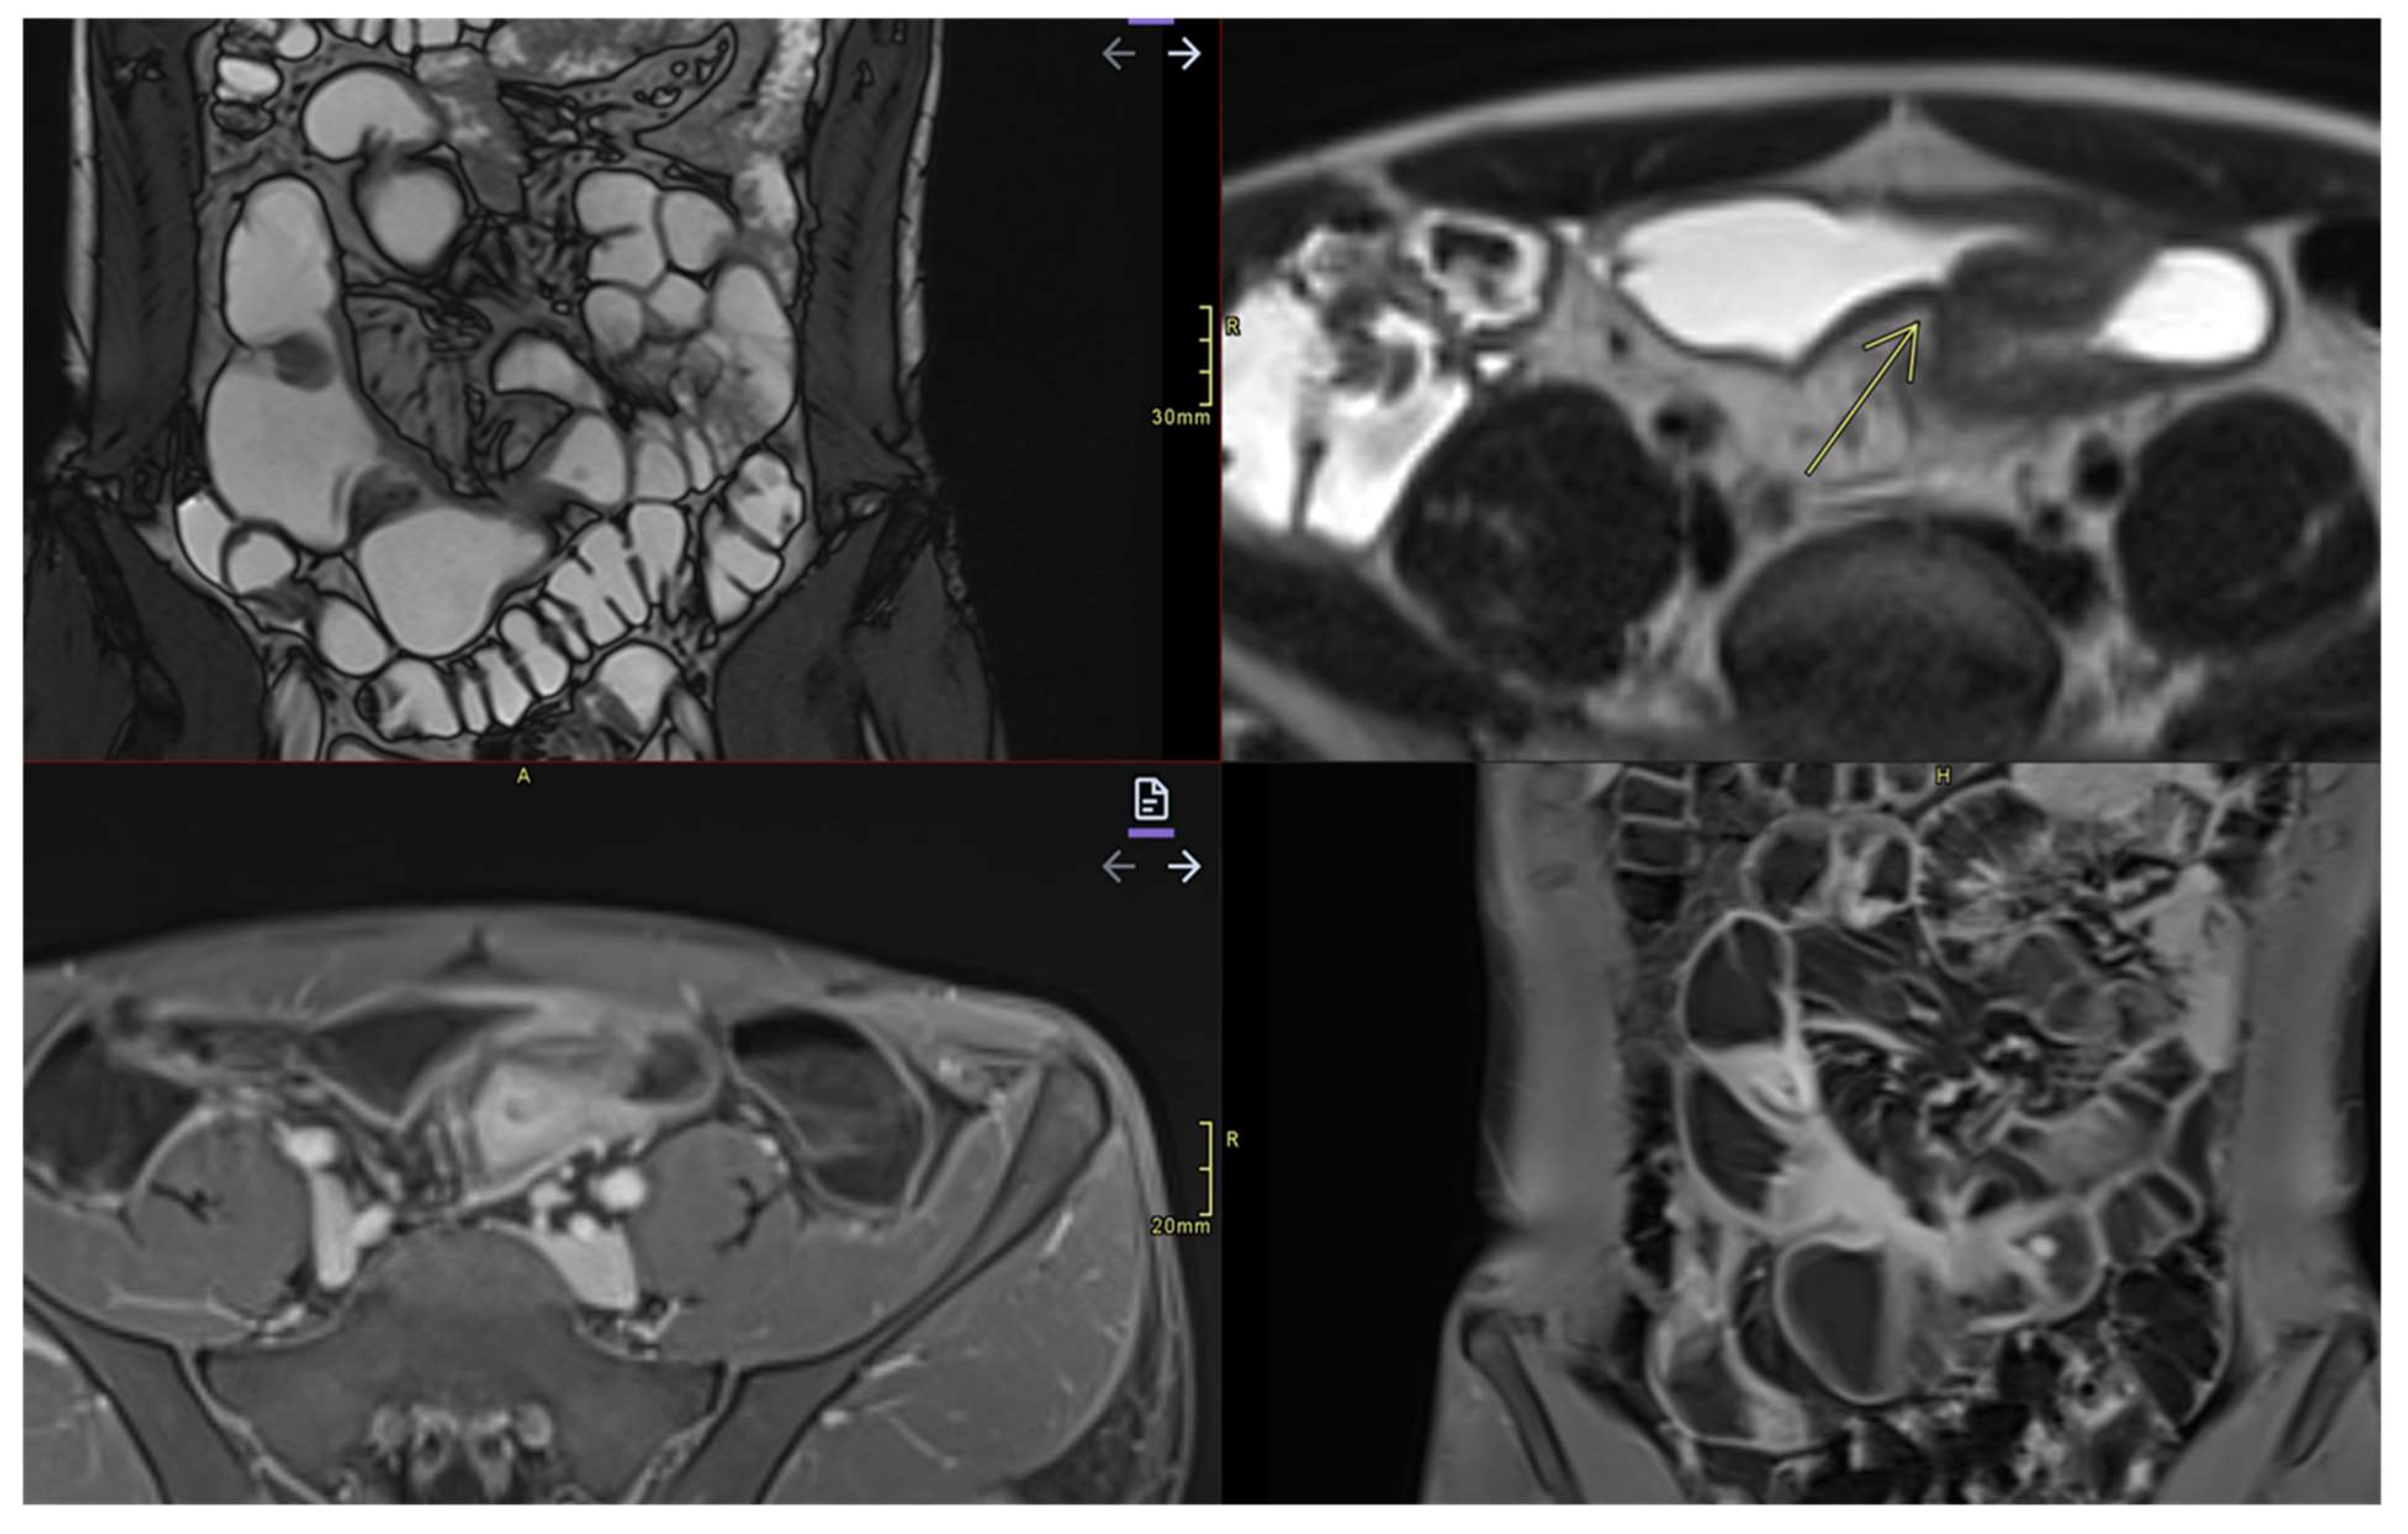

Table 1.
MRE protocol for Crohn disease and Ulcerative colitis.
| CROHN DISEASE | ULCERATIVE COLITIS |
| Intestinal preparation before examination | Colonic preparation before examination |
| T2-weighted HASTE/SSFSE axial and coronal | MR images axial plane with entirely colon and rectum[45] |
| Balanced steady state free procession gradient-echo (SSFPGR) – Coronal | T2-weighted coronal postcontrast additional images to verify if there are complications [45] |
| 3D Cinematic bSSFP- Coronal | |
| Delayed 3D T1-weighted post-contrast fat-saturated GRE (gradient recalled echo) - Axial | Sagittal T2-weighted MR images for anastomosis [45] |
| 3D T1-weighted pre-/post-contrast fat-saturated GRE (gradient recalled echo) –Dynamic- Coronal | Thin-section axial fat-suppression T2-weighted images for perianal disease[45] |
| DWI - Axial |
Table 2.
Relevant imaging features in Magnetic Resonance Enterography.
 |
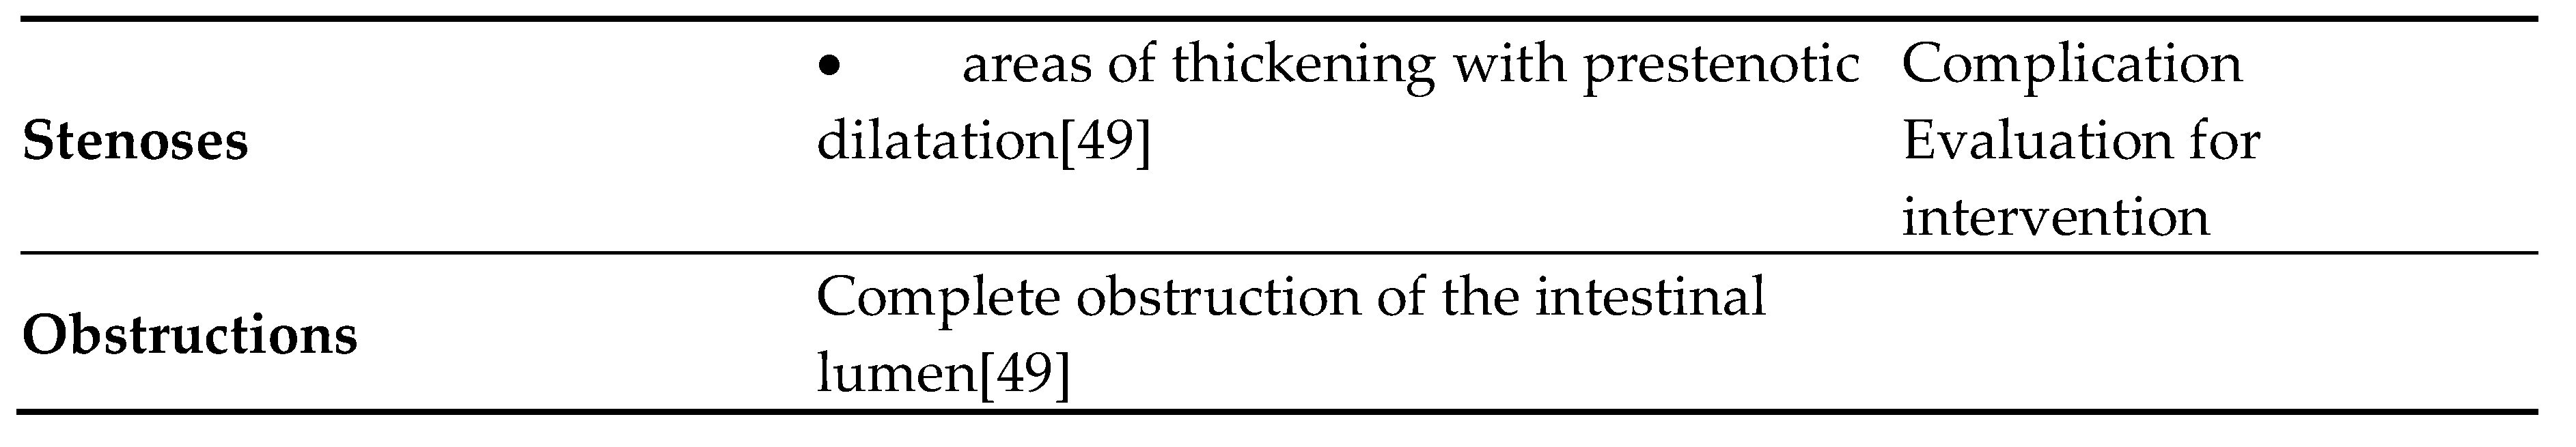 |
Table 3.
MR features for the calculations or MEGS.
| Per-segment score | |||||
| MR features | 0 | 1 | 2 | 3 | |
| Mural thickness | <3mm | >3–5mm | >5–7mm | >7mm | |
| Mural T2 signal (oedema) | NORMAL | Minor increase | Moderate increase | Large increase | |
| Perimural T2 signal | NORMAL | Increased signal but no fluid | Small (≤2mm) fluid rim | Large (>2mm fluid rim) | |
| Contrast enhancement: pattern | NORMAL | N/A or homogeneous | Mucosal | Layered | |
| Haustral loss (colon only) | 0–5 cm | 5–15 cm | >15 cm | ||
| Multiplication factor for segmental score | |||||
| X1 | X2 | X3 | |||
| Length of disease in that segment | <5cm | 5-15cm | >15cm | ||
| Per patient score | |||||
| MR features | 0 | 5 | |||
| Lymph nodes | Absent | Present | |||
| Comb sign | Absent | Present | |||
| Abscess | Absent | Present | |||
| Fistula | Absent | Present | |||
Disclaimer/Publisher’s Note: The statements, opinions and data contained in all publications are solely those of the individual author(s) and contributor(s) and not of MDPI and/or the editor(s). MDPI and/or the editor(s) disclaim responsibility for any injury to people or property resulting from any ideas, methods, instructions or products referred to in the content. |
© 2025 by the authors. Licensee MDPI, Basel, Switzerland. This article is an open access article distributed under the terms and conditions of the Creative Commons Attribution (CC BY) license (http://creativecommons.org/licenses/by/4.0/).
Copyright: This open access article is published under a Creative Commons CC BY 4.0 license, which permit the free download, distribution, and reuse, provided that the author and preprint are cited in any reuse.


