Submitted:
28 April 2025
Posted:
29 April 2025
You are already at the latest version
Abstract
Background/Objectives: Chronic Low Back Pain (CLBP) is a prevalent condition that significantly impacts the aging population. Among non-invasive assessment tools, infrared thermography has been highlighted as a radiation-free method to evaluate thermal variations in the lumbar region. However, its applicability in clinical practice and correlation with functional and pain-related parameters remain unclear. This study aimed to analyze the thermal profile of the lumbar region in elderly individuals with CLBP and explore potential correlations between lumbar temperature patterns and clinical factors such as pain intensity and functional capacity. Methods: Cross-sectional observational study. Outpatient setting. Population: Thirty-one elderly individuals diagnosed with CLBP. Infrared thermography was used to assess lumbar temperature distribution in 31 participants with CLBP, some of whom reported pain radiating to the lower limbs. Pain intensity was measured using a numerical rating scale (0-10). Functional assessment included spine mobility tests and validated questionnaires evaluating clinical characteristics. Results: No significant differences in lumbar temperature patterns were observed among participants. Additionally, no correlation was found between pain intensity and functional capacity based on thermographic analysis. Nonetheless, individuals reporting higher fatigue levels and those with a lower body mass index (BMI) were generally associated with cooler thermal readings on the lumbar region's thermographic maps. Conclusions: These findings suggest that infrared thermography may require methodological refinements, including optimized technical specifications and image acquisition protocols, to enhance its applicability in assessing CLBP. Alternatively, thermography might not be the most effective tool for evaluating pain-related thermal changes in elderly populations. Further research is needed to clarify its role in clinical assessment.
Keywords:
thermography
; low back pain
; elderly
1. Introduction
Chronic Low Back Pain (CLBP) has been extensively recognized as a prevalent health issue, with foundational research by scholars [1,2] underscoring its frequency. The condition has emerged as the foremost reason for diminished activity and work absenteeism across the globe [3]. The socioeconomic impact of CLBP is profound, straining not only the affected individuals but also families, communities, and broader economic structures [4].
Defined by persistent pain in the lumbar area without a clear anatomopathological cause, as elucidated in studies [5,6,7]), CLBP poses a complex diagnostic challenge. A holistic evaluation encompassing biomechanical, sensory, and autonomic dimensions could offer deeper insights into the condition. Hence, thermography [8], presents a straightforward method for investigating autonomic irregularities.
Infrared thermography (IRT) has been employed in the domain of musculoskeletal disorders for decades, tracing back to the pioneering work in the thermographic evaluation of pain [9]. Subsequent research has both supported and contested its efficacy, with notable findings demonstrating IRT's sensitivity, its correlation with other diagnostic tools such as CT scans, myelography, MRI, and its ability to detect abnormalities linked to lumbar radiculopathy [10,11].
Clinically, spinal pathologies and/or pain often manifest as myofascial trigger points, muscle fatigue and soreness, particularly in the paravertebral muscles. Yet, standard imaging tests like X-rays, CT scans, or MRIs frequently fail to reveal abnormalities in patients who continue to experience pain [12]. This discrepancy underscores the potential of IRT to uncover such clinical signs, bolstering arguments for its utility [13]. IRT's capacity to detect changes in body temperature occur due to multiple factors—ranging from physical exertion and metabolic shifts to rheumatic and musculoskeletal conditions—underscoring its diagnostic value. This temperature variation serves as an indicator of underlying physiological processes. The technique's non-contact, non-invasive nature, coupled with its rapidity and the ease of interpreting color-coded images, has facilitated its adoption in clinical settings. Importantly, IRT is safe, leveraging the natural radiation emitted by the skin and its affordability, as well as the simplicity make it suitable for regular use. Therefore, recent developments in device technology and computational methods have further elevated interest in IRT as a diagnostic tool [14]. However, some researchers remain skeptical about its application for low back pain due to perceived limitations in diagnostic accuracy, stability, and specificity [15,16]. Controversy persists, supported by studies reporting divergent findings on skin temperature variations in CLBP patients [17,18].
Beyond its diagnostic applications, thermography has been advocated as a valuable tool for monitoring treatment efficacy, capable of identifying deviations from normative physiological states [19].
This study aims to evaluate autonomic nervous system activity through thermographic assessments, providing insights into thermal profiles that may correlate with the condition. Pain intensity, functionality, fatigue, strength, and other physical, sociodemographic, anthropometric, and clinical data were collected to provide a broader context for understanding the condition. Ultimately, the study seeks to identify potential patterns and contributing factors that could inform future strategies for the treatment and rehabilitation of elderly individuals with CLBP.
2. Materials and Methods
Study Design:
In this study, a cohort of thirty-one individuals suffering from Chronic Low Back Pain (CLBP), with some experiencing radiating pain to the lower extremities, was examined. The participant group was composed of twenty men and eleven women, whose ages spanned from 66 to 88 years. Prior to the commencement of the study, each participant was thoroughly briefed on the study's procedures, potential risks, and benefits. They provided their written, informed consent, agreeing to partake in the study and allowing for their data to be utilized for research purposes. This consent process ensured all participants were fully informed and agreed to their involvement in the research. The study received ethical approval from the local ethics committee at the Instituto de Ciências Biomédicas de Abel Salazar of Porto University (ICBAS-UP), under the protocol number 2021/CE/P31(P371/2021/CETI). The research was carried out in strict adherence to the ethical guidelines set forth in the Declaration of Helsinki, ensuring the ethical integrity of the study.
To ensure the accuracy and reliability of the thermographic evaluations, the study adhered to a standardized operating procedure. These evaluations were critical in assessing the thermal profile of each participant, which is indicative of autonomic nervous system activity and could provide insights into their condition. The level of pain experienced by the participants was quantitatively measured using a numerical pain scale that ranged from 0 to 10, allowing for a standardized assessment of pain intensity.
In addition to thermographic and pain assessments, the study utilized various questionnaires to gather comprehensive sociodemographic, anthropometric, and clinical data from the participants. Among the tools employed were the Oswestry Disability Index version 2.0, which is widely used to gauge the degree of disability related to lower back pain and the Fatigue Assessment Scale, which measures the fatigue levels of the participants. These instruments helped in understanding the broader impact of CLBP on the participants' quality of life and functional abilities.
Moreover, the participants underwent a battery of spinal mobility tests, which included the Shober test, finger-floor distance, occiput-to-wall distance, and lateral flexion assessments. These tests provided quantitative and qualitative data on the spinal mobility and flexibility of the participants. Manual grip strength assessments were also conducted to evaluate the muscular strength and function of the participants. This comprehensive evaluation approach allowed for a multifaceted understanding of the impact of CLBP on the participants, encompassing pain levels, functional disability, fatigue, and spinal mobility.
Instruments:
To prepare for the thermographic evaluations, the study participants were advised to remove their clothing to facilitate a direct assessment of the skin in the lumbar region. This step was essential to ensure the accuracy of the thermographic images. They were then allowed a thermoequilibration period of 10-15 minutes in a controlled environment, where the room temperature was maintained at 24ºC (with a standard deviation of 2.77ºC). This process ensured that the participants' body temperatures stabilized, minimizing external influences on the skin temperature. After this preparatory phase, thermographic images of the participants' back area were captured while they were seated comfortably on a chair. For precise analysis, the lumbar region of interest was marked out using a polygonal outline that spanned from the first to the fifth lumbar vertebra, as depicted in Figure 1 of the study documentation.
The thermographic data acquisition was carried out using a FLIR I7 ® infrared camera, which is equipped with a detector resolution of 140 × 140 pixels and a thermal sensitivity of less than 0.10°C. To optimize the accuracy of the thermal images, the camera's emissivity level was calibrated to 0.98. The camera was strategically positioned 0.8 meters away from the subjects in a room where both temperature and humidity were monitored to ensure consistent and reliable measurements.
The analysis of the thermographic data was conducted using FLIR Research Studio R&D Software. During this analysis phase, all captured images were standardized to a uniform scale, and seven specific anatomical points on the lumbar region were selected for detailed examination, following a pre-established protocol outlined in Figure 1. This meticulous approach allowed for the consistent and precise measurement of thermal variations across the defined points of interest.
For the statistical analysis of the collected data, the study employed SPSS Statistical Software (Statistical Package for the Social Sciences), a comprehensive tool for the analysis of social science data. The statistical methods applied in the analysis included the Mann-Whitney test, Spearman correlation, and linear regression analyses, allowing for the exploration of relationships between thermographic findings and clinical variables. A significance level of p < 0.05 was established, meaning that observed differences or correlations with a probability value less than 0.05 were considered statistically significant, indicating a meaningful deviation from chance. This rigorous analytical approach provided a solid foundation for interpreting the thermographic data in the context of chronic low back pain and its clinical manifestations.
Data Analysis:
Our study adopted a comprehensive approach to analyze data, using a variety of statistical parameters like frequency, percentage, mean, and standard deviation to map the distribution and characteristics of our variables. This initial analysis helped outline the data's distribution and central tendencies, setting the stage for deeper investigation. Considering our relatively small sample size, we considered non-parametric tests over parametric ones for inferential analysis, based on the Kolmogorov-Smirnov normality test results indicating non-normal distribution in our data. This led us to choose the Mann-Whitney test for comparing demographic and clinical variables, such as gender, age, pain type, morning stiffness and low back pain or sciatica episodes, due to its appropriateness for non-normally distributed data. Additionally, we used Spearman's correlation coefficient to explore the strength and direction of associations between variables, given its suitability for ranked, non-parametric data. The findings were presented through tables and graphs for clarity and ease of interpretation, with each accompanied by thorough analysis to enhance understanding. This methodological detail and transparent presentation underscore the depth and seriousness of our investigation into the complexities of chronic low back pain.
3. Results
In our investigation, we analyzed thermographic temperatures in the lower back of elderly individuals with Chronic Low Back Pain (CLBP), assessing potential links between lumbar temperatures and various demographic and clinical factors, including gender, age, pain characteristics, morning stiffness, and episodes of acute pain or sciatica. Using the Mann-Whitney test to compare groups, we particularly focused on gender differences in lumbar temperatures across seven specific points (P1 to P7). Despite thorough analysis, documented in Table 1, we found no significant temperature differences between male and female participants, indicating that gender does not significantly impact the lumbar thermal profile in CLBP sufferers. This conclusion enriches our understanding of CLBP, suggesting similar thermal patterns across genders and highlighting the need for further research into LBP's physiological aspects and management in the elderly.
In our continued exploration, we investigated if age impacts the thermographic temperatures in the lumbar region among Chronic Low Back Pain (CLBP) sufferers, hypothesizing that age-related physiological differences might influence the thermal profile of the lower back. We meticulously analyzed thermographic data from seven lumbar points (P1 to P7), categorizing our participants by age to identify any temperature patterns that could be associated with aging.
The analysis, detailed in Table 2, aimed to uncover how aging might affect the thermal signatures linked to CLBP. However, our findings revealed no statistically significant temperature differences across age groups, indicating that within our study's context, age does not significantly influence the lumbar region's thermal profiles in CLBP patients. This challenges prior assumptions regarding age's role in CLBP's pathophysiology, suggesting consistent thermal characteristics across elderly age brackets. The lack of significant age-related thermal variations highlights the complexity of CLBP and the importance of broader factors in its diagnosis and management, laying groundwork for future research into the condition's multifaceted nature.
Expanding our analysis, we investigated how the thermographic temperature profiles in the lumbar region correlate with pain characteristics in Chronic Low Back Pain (CLBP) sufferers. We aimed to determine if the pain's nature—localized in the lumbar region or radiating to the lower limbs—affected the lumbar area's thermal signatures. This inquiry was based on the hypothesis that the way pain manifests could influence the thermal patterns observed, potentially revealing the mechanisms behind pain distribution. We analyzed thermographic data from specific lumbar points (P1 to P7), categorizing participants by their reported pain type. Findings detailed in Table 3, showed no significant temperature differences between those with localized versus radiating pain. This indicates that, within our study's context, the pain's manifestation does not significantly alter the lumbar region's thermal signatures in CLBP cases.
In a continued effort to deepen our understanding of Chronic Low Back Pain (CLBP) and its manifestations, our study further explored the relationship between thermographic readings of the lumbar area and the presence of morning stiffness in the spine—a common symptom reported by individuals with CLBP. This particular analysis was predicated on the hypothesis that morning stiffness, as a clinical manifestation of CLBP, might be associated with specific thermal patterns detectable through thermography. Therefore, we meticulously examined the thermographic data collected from seven designated points (P1 to P7) across the lumbar region of participants, aiming to identify any significant thermal anomalies correlated with reports of morning stiffness. The outcomes of this investigation were systematically organized and are presented in Table 4 for comprehensive review and analysis.
Upon analyzing the thermographic readings in relation to the reported presence or absence of morning spinal stiffness among the study participants, we found that there were no statistically significant differences in the temperature values. This result indicates that, within the scope of our investigation, the occurrence of morning stiffness in individuals with CLBP does not appear to be associated with distinct thermal signatures in the lumbar area as measured through thermography.
In our investigation into Chronic Low Back Pain (CLBP), we explored whether thermographic readings correlate with recent acute low back pain "episodes" or sciatica incidents. The premise was that such acute episodes might influence the lumbar region's thermal profile, indicating physiological or pathological changes. We thoroughly analyzed thermographic data from seven key points (P1 to P7) on the lumbar area of participants who reported a low back pain "crisis" or sciatica in the last two months, detailed in Table 5. Our goal was to uncover any significant thermographic differences linked to these acute conditions, which could hint at underlying inflammatory or neurogenic processes. However, our examination revealed no statistically significant differences in thermographic values between those who had experienced recent acute episodes and those who had not. This finding suggests that, within the scope of our study, recent acute low back pain or sciatica episodes do not significantly lead to changes in the thermographic profiles of individuals with CLBP. This challenges the utility of thermography for identifying or distinguishing the thermal patterns associated with such acute episodes in CLBP cases.
In our study examining the link between clinical/physiological factors and thermographic profiles in Chronic Low Back Pain (CLBP) sufferers, we used Spearman's correlation coefficient, suited for non-parametric data, to assess the relationship strength and direction between various variables. These variables, including average low back pain intensity over the last 7 days, BMI, Schober test results, fatigue ratings, hand grip strength, and algometry scores, were analyzed against thermographic data from seven lumbar points (P1 to P7). Our aim was to identify any associations that could shed light on the physiological aspects of pain. Despite comprehensive analysis, as shown in Table 6, we found no significant links between the intensity of reported low back pain and the thermographic patterns, indicating that within our research framework, pain intensity did not markedly influence the thermal profiles detected by thermography.
In the correlation between BMI, the Schober test, and the thermographic values in each position (P1 to P7) (see Table 7), statistically significant correlations were observed. Specifically, BMI was found to be negatively correlated with the thermographic values at P1ºC (r = -0.418*), P2ºC (r = -0.508**), and P3ºC (r = -0.361*). This implies that individuals with higher BMI values tend to exhibit lower thermographic values at P1ºC, P2ºC, and P3ºC.
In examining the relationship between Body Mass Index (BMI), results from the Schober test for lumbar flexibility, and thermographic readings at specific positions (P1 to P7) on the lumbar region, our analysis revealed significant correlations, as detailed in Table 7. Notably, a negative correlation was observed between BMI and thermographic readings at certain positions: specifically, at P1ºC (r = -0.418*), P2ºC (r = -0.508**), and P3ºC (r = -0.361*). This indicates that as BMI increases, the thermographic readings at these positions tend to decrease, suggesting that higher BMI values are associated with lower temperatures at specific points in the lumbar area.
From the correlation between the Fatigue Assessment Scale itens and the thermography values in each position (P1 to P7), in the Pre-Treatment (Table 8) in individuals with LBP, there are statistically significant correlations, namely, the item “I feel physically exhausted” is positively correlated with the thermography value at P3ºC (r=-0.363*); at P4ºC (r=-0.384*); and at P7ºC (r=-0.593**); and the item “I feel mentally exhausted” is positively correlated with the thermography value at P1ºC (r=-0.389*); and at P2ºC (r=-0.426*). These results suggest that individuals who present higher values in the items on the Fatigue Assessment Scale tend to present higher thermography values in the mentioned positions.
A detailed examination of the connections between the average right-hand grip strength (measured in kilograms of force), the average left-hand grip strength (also measured in kilograms of force), and the thermographic measurements taken across seven distinct positions (designated P1 through P7), as thoroughly outlined in Table 9, demonstrated that there are no statistically significant relationships between these variables. This analysis was comprehensive, considering various factors and potential interactions, yet the data did not support any significant linkage between the manual grip strengths and the thermal readings across the specified positions.
The analysis investigating the relationship between lumbar algometry readings at seven points and thermographic values across the same positions (P1 to P7), as shown in Table 10, did not reveal any statistically significant correlations.
The analysis of correlations between lumbar algometry measurements (right side, left side, central/spine) and thermographic readings at positions P1 to P7, as outlined in Table 11, found no statistically significant relationships.
4. Discussion
Advancements in camera technology have significantly influenced the adoption of Infrared Thermography (IRT) as a sophisticated method for measuring human skin temperature, commonly referred to as “tsk”. These technological improvements have not only enhanced the precision and functionality of thermal imaging cameras but have also made them more accessible due to reduced costs. Consequently, IRT stands out for its versatility, offering a non-invasive, contactless method of temperature measurement. This attribute is particularly beneficial in medical and research settings where minimizing physical contact is preferred. Additionally, the wireless nature of modern IRT systems facilitates seamless integration into various operational environments. Another notable feature of IRT is its ability to produce detailed thermograms, which visually allow mapping the temperature across different areas of the skin, revealing both hot and cold spots. This capability is invaluable for diagnostic and monitoring purposes, as it provides insights into the physiological state of an individual, offering a window into underlying health conditions or the body's response to environmental changes.
However, methodological limitations inherent to the collection of Infrared Thermography (IRT) data may introduce confounding factors that affect temperature readings. Thus, it is crucial to control certain conditions effectively to reduce their impact on the measurement of skin temperature (tsk) using IRT. Achieving precise standardization is vital because variations in protocols can influence the interpretation of results, image processing, or the consistency in selecting the region of interest [20]. Moreover, this lack of uniform protocols hampers the ability to compare data across studies, obstructing the development of a standardized dataset.
While various authors for clinical thermal imaging [21] and for sports sciences [22], have set forth comprehensive guidelines for the use of Infrared Thermography (IRT) within their respective fields, a gap has been noted in the provision of tailored recommendations for thermal imaging of patients with Low Back Pain (LBP). In the context of clinical thermal imaging, it is imperative to maintain environmental conditions such as humidity and ambient temperature at consistent levels to ensure the normalization of images. Additionally, securing the camera on a tripod is recommended to stabilize the imaging process. In our study, thermographic images were captured by a single examiner in an environment where humidity levels were maintained between 30% to 58%, and the temperature was kept within the range of 23°C to 29°C, with the camera positioned 0.8 meters away from the subject. Given these specifics, we suggest adjustments to the existing criteria for conducting thermal imaging tests, aiming to enhance their applicability and precision, particularly for LBP patients.
The protocol titled "Thermographic Imaging in Sports and Exercise Medicine" (TISEM), devised by Moreira et al. in 2017, aimed to enhance the use of Infrared Thermography (IRT) by outlining a comprehensive approach for data collection and analysis. The process included gathering essential personal data from participants, issuing precise instructions, documenting the ambient temperature and humidity where imaging took place, and detailing the technical specifications of the camera, such as brand, model, accuracy, and emissivity settings. Additionally, it mandated an acclimation period, noted the exact timing of image captures, and required the camera to be aligned perpendicularly to the targeted area. Despite these rigorous guidelines, certain uncontrollable factors remain, even with prior verbal confirmation from subjects. These include the consumption of alcohol, smoking, caffeine intake, eating substantial meals, and the application of ointments or cosmetics within four hours before the thermal imaging. Moreover, participants were advised against the use of anti-inflammatory medications, painkillers, contraceptives and anesthetic agents for 48 hours before undergoing the procedure.
When participants reported specific conditions, these were documented, while some conditions were unavoidable and thus not grounds for exclusion. Instead, participants were advised to refrain from consuming alcohol, smoking, caffeine, eating large meals, using ointments, cosmetics, and showering within four hours before their assessments. However, it's important to note that the TISEM guidelines were originally designed for IRT applications in sports and exercise medicine, not specifically for the scenarios being studied here. In this study, elderly patients were analyzed, many of whom present a degenerative context, which contrasts with the population for whom these guidelines were originally developed.
In the analysis of thermographic data comparing the lower back temperatures of elderly individuals with Chronic Lower Back Pain (CLBP) against conventional benchmarks for this condition, observed no statistically significant differences. However, several factors could account for the absence of statistical significance in our findings. Firstly, the limited size of our sample may have played a role. Additionally, significant variations in humidity were noted across different days of imaging, attributed to the data collection occurring in a room within thermal baths, leading to inconsistent humidity levels. The choice to exclusively include elderly participants might also have limited our ability to detect notable temperature variations. Previous studies [23] in 2008, have shown that older individuals tend to have lower temperature dissipation following physical activity in thermographic analysis compared to younger people. We speculate this could be due to older adults having less hydrated muscle tissue and greater adipose infiltration, which could affect temperature variation magnitude. This theory is bolstered by our findings that individuals with higher BMI, likely to possess more adipose tissue, showed lower temperatures.
Regarding correlations, it was found that individuals scoring higher on the Fatigue Assessment Scale displayed elevated thermography readings at specific sites. This observation is hypothesized to stem from possible changes in spinal alignment in more fatigued individuals, who may exhibit a tendency towards spinal flexion. This could increase the load on the lumbar region's muscular structures, leading to a rise in temperature.
5. Conclusions
The aim of this study was to explore the effectiveness of using infrared thermography for the evaluation of chronic low back pain (CLBP) in the elderly. The findings indicate a lack of correlation between the clinical manifestations of CLBP and the thermal patterns detected in thermographic images. More specifically, no correlations were found between lumbar thermographic profiles and demographic or clinical factors such as gender, age, pain characteristics, morning stiffness, and acute episodes in elderly individuals with CLBP.
This lack of correlation could be attributed to several factors, including an underappreciation of the physiological variability in skin temperatures compared to the specific anatomical sites of nerve damage, and the lack of tailored guidelines for thermal image acquisition in CLBP sufferers. This gap makes it challenging to align and compare data with findings from other research efforts.
Nonetheless, an interesting observation emerged from the study: individuals reporting higher fatigue levels and those with a lower body mass index (BMI) were generally associated with cooler thermal readings on the lumbar region's thermographic maps.
Looking ahead, we propose the integration of thermographic techniques with artificial intelligence (AI) analytics for future investigations. This combined approach has shown potential in enriching clinical assessments and could serve as a valuable complement to traditional diagnostic methods.
Author Contributions
Conceptualization, N.A., L.G., W.S., J.G., L.T., P.C.; methodology, N.A., L.G., W.S., J.G., L.T., P.C.; software, N.A., L.G., W.S., J.G., L.T., P.C.; validation, N.A., L.G., W.S., J.G., L.T., P.C.; formal analysis, N.A., L.G., W.S., J.G., L.T., P.C.; writing—review and editing, N.A., L.G., W.S., J.G., L.T., P.C.; investigation, N.A.; writing—original draft preparation, N.A.; supervision, N.A. All authors have read and agreed to the published version of the manuscript.
Funding
This research received no external funding.
Institutional Review Board Statement
The study received ethical approval from the local ethics committee at the Instituto de Ciências Biomédicas de Abel Salazar of Porto University (ICBAS-UP), under the protocol number 2021/CE/P31(P371/2021/CETI).
Informed Consent Statement
Informed consent was obtained from all subjects involved in the study.
Acknowledgments
The authors would like to express their sincere gratitude to the Faculty of Engineering of the University of Porto for kindly lending one of its thermographic cameras free of charge for the development of this study.
Conflicts of Interest
The authors declare no conflicts of interest.
Abbreviations
The following abbreviations are used in this manuscript:
| CLBP IRT |
Chronic low back pain Infrared Thermography |
| ICBAS-UP | Instituto de Ciências Biomédicas de Abel Salazar of Porto University |
| BMI | Body mass index |
| AI TISEM |
Artificial intelligence Thermographic Imaging in Sports and Exercise Medicine |
References
- Rossignol, M.; Rozenberg, S.; Leclerc, A. Epidemiology of low back pain: What’s new? Jt Bone Spine. 2009, 76(6), 608–13. [Google Scholar] [CrossRef] [PubMed]
- Deyo, R.A.; Cherkin, D.; Conrad, D.; Volinn, E. Cost, controversy, crisis: low back pain and the health of the public. Annu Rev Public Health. 1991, 12, 141–56. [Google Scholar] [CrossRef]
- Lidgren, L. The bone and joint decade 2000-2010. Bulletin of the World Health Organization. 2003, 81, 629. [Google Scholar]
- Steenstra, I.A.; Verbeek, J.H.; Heymans, M.W.; Bongers, P.M. Prognostic factors for duration of sick leave in patients sick listed with acute low back pain: A systematic review of the literature. Occup Environ Med. 2005, 62(12), 851–60. [Google Scholar] [CrossRef]
- Imamura, M.; Chen, J.; Matsubayashi, S.R.; Targino, R.A.; Alfieri, F.M.; Bueno, D.K.; et al. Changes in pressure pain threshold in patients with chronic nonspecific low back pain. Spine (Phila Pa 1976). 2013, 38(24), 2098–107. [Google Scholar] [CrossRef] [PubMed]
- Murray, C.J.L.; Vos, T.; Lozano, R.; Naghavi, M.; Flaxman, A.D.; Michaud, C.; et al. Disability-adjusted life years (DALYs) for 291 diseases and injuries in 21 regions, 1990–2010: a systematic analysis for the Global Burden of Disease Study 2010. Lancet (British Ed. 2012, 380(9859), 2197–223. [Google Scholar] [CrossRef] [PubMed]
- Hoy, D.; Brooks, P.; Blyth, F.; Buchbinder, R. The Epidemiology of low back pain. Best Pract Res Clin Rheumatol. 2010, 24(6), 769–81. [Google Scholar] [CrossRef]
- Soares, A.L.; Xavier AAde, P.; Michaloski, A.O. Occupational risk evaluation through infrared thermography: Development and proposal of a rapid screening tool for risk assessment arising from repetitive actions of the upper limbs. Int J Environ Res Public Health. 2020, 17(10). [Google Scholar] [CrossRef]
- ALBERT, S.M.; GLICKMAN, M.; KALLISH, M. THERMOGRAPHY IN ORTHOPEDICS. Ann N Y Acad Sci. 1964, 121, 157–70. [Google Scholar] [CrossRef]
- Sherman, R.A.; Barja, R.H.; Bruno, G.M. Thermographic correlates of chronic pain: analysis of 125 patients incorporating evaluations by a blind panel. Arch Phys Med Rehabil. 1987, 68 5 Pt 1, 273–9. [Google Scholar]
- Takahashi, Y.; Takahashi, K.; Moriya, H. Thermal deficit in lumbar radiculopathy. Correlations with pain and neurologic signs and its value for assessing symptomatic severity. Spine (Phila Pa 1976). 1994, 19(21), 2443–50. [Google Scholar] [CrossRef] [PubMed]
- Lluch, E.; Nijs, J.; De Kooning, M.; Van Dyck, D.; Vanderstraeten, R.; Struyf, F.; et al. Prevalence, Incidence, Localization, and Pathophysiology of Myofascial Trigger Points in Patients With Spinal Pain: A Systematic Literature Review. J Manipulative Physiol Ther. 2015, 38(8), 587–600. [Google Scholar] [CrossRef] [PubMed]
- Vardasca, R.; Magalhaes, C.; Silva, P.; Abreu, P.; Mendes, J.; Restivo, M.T. Biomedical musculoskeletal applications of infrared thermal imaging on arm and forearm: A systematic review. J Therm Biol [Internet]. 2019, 82, 164–77. [Google Scholar] [CrossRef]
- Holey, L.A.; Dixon, J.; Selfe, J. An exploratory thermographic investigation of the effects of connective tissue massage on autonomic function. J Manipulative Physiol Ther. 2011, 34(7), 457–62. [Google Scholar] [CrossRef]
- So, Y.T.; Aminoff, M.J.; Olney, R.K. The role of thermography in the evaluation of lumbosacral radiculopathy. Neurology. 1989, 39(9), 1154–8. [Google Scholar] [CrossRef]
- Leclaire, R.; Esdaile, J.M.; Jéquier, J.C.; Hanley, J.A.; Rossignol, M.; Bourdouxhe, M. Diagnostic accuracy of technologies used in low back pain assessment. Thermography, triaxial dynamometry, spinoscopy, and clinical examination. Spine (Phila Pa 1976). 1996, 21(11), 1325–30, discussion 1331. [Google Scholar] [CrossRef]
- Alfieri, F.M.; Lima, A.R.S.; Battistella, L.R.; Silva, N.C.d.O.V.e. Superficial temperature and pain tolerance in patients with chronic low back pain. J Bodyw Mov Ther. 2019, 23(3), 583–7. [Google Scholar] [CrossRef] [PubMed]
- Roy, R.A.; Boucher, J.P.; Comtois, A.S. Comparison of paraspinal cutaneous temperature measurements between subjects with and without chronic low back pain. J Manipulative Physiol Ther. 2013, 36(1), 44–50. [Google Scholar] [CrossRef] [PubMed]
- Albuquerque, N.F.; Lopes, B.S. Musculoskeletal applications of infrared thermography on back and neck syndromes: A systematic review. Eur J Phys Rehabil Med. 2021, 57(3), 386–96. [Google Scholar] [CrossRef]
- Roggio, F.; Petrigna, L.; Filetti, V.; Vitale, E.; Rapisarda, V.; Musumeci, G. Infrared thermography for the evaluation of adolescent and juvenile idiopathic scoliosis: A systematic review. J Therm Biol [Internet]. 2023, 113, 103524. [Google Scholar] [CrossRef]
- Ammer, K.; Ring, E.F.J. The Thermal Human Body: A Practical Guide to Thermal Imaging. Taylor Fr Jenny Stanford Publ. 2019.
- Moreira, D.G.; Costello, J.T.; Brito, C.J.; Adamczyk, J.G.; Ammer, K.; Bach, A.J.E.; et al. Thermographic imaging in sports and exercise medicine: A Delphi study and consensus statement on the measurement of human skin temperature. J Therm Biol. 2017, 69, 155–62. [Google Scholar] [CrossRef] [PubMed]
- Ferreira, J.J.A.; Mendonça, L.C.S.; Nunes, L.A.O.; Andrade Filho, A.C.C.; Rebelatto, J.R.; Salvini, T.F. Exercise-associated thermographic changes in young and elderly subjects. Ann Biomed Eng. 2008, 36(8), 1420–7. [Google Scholar] [CrossRef] [PubMed]
Figure 1.
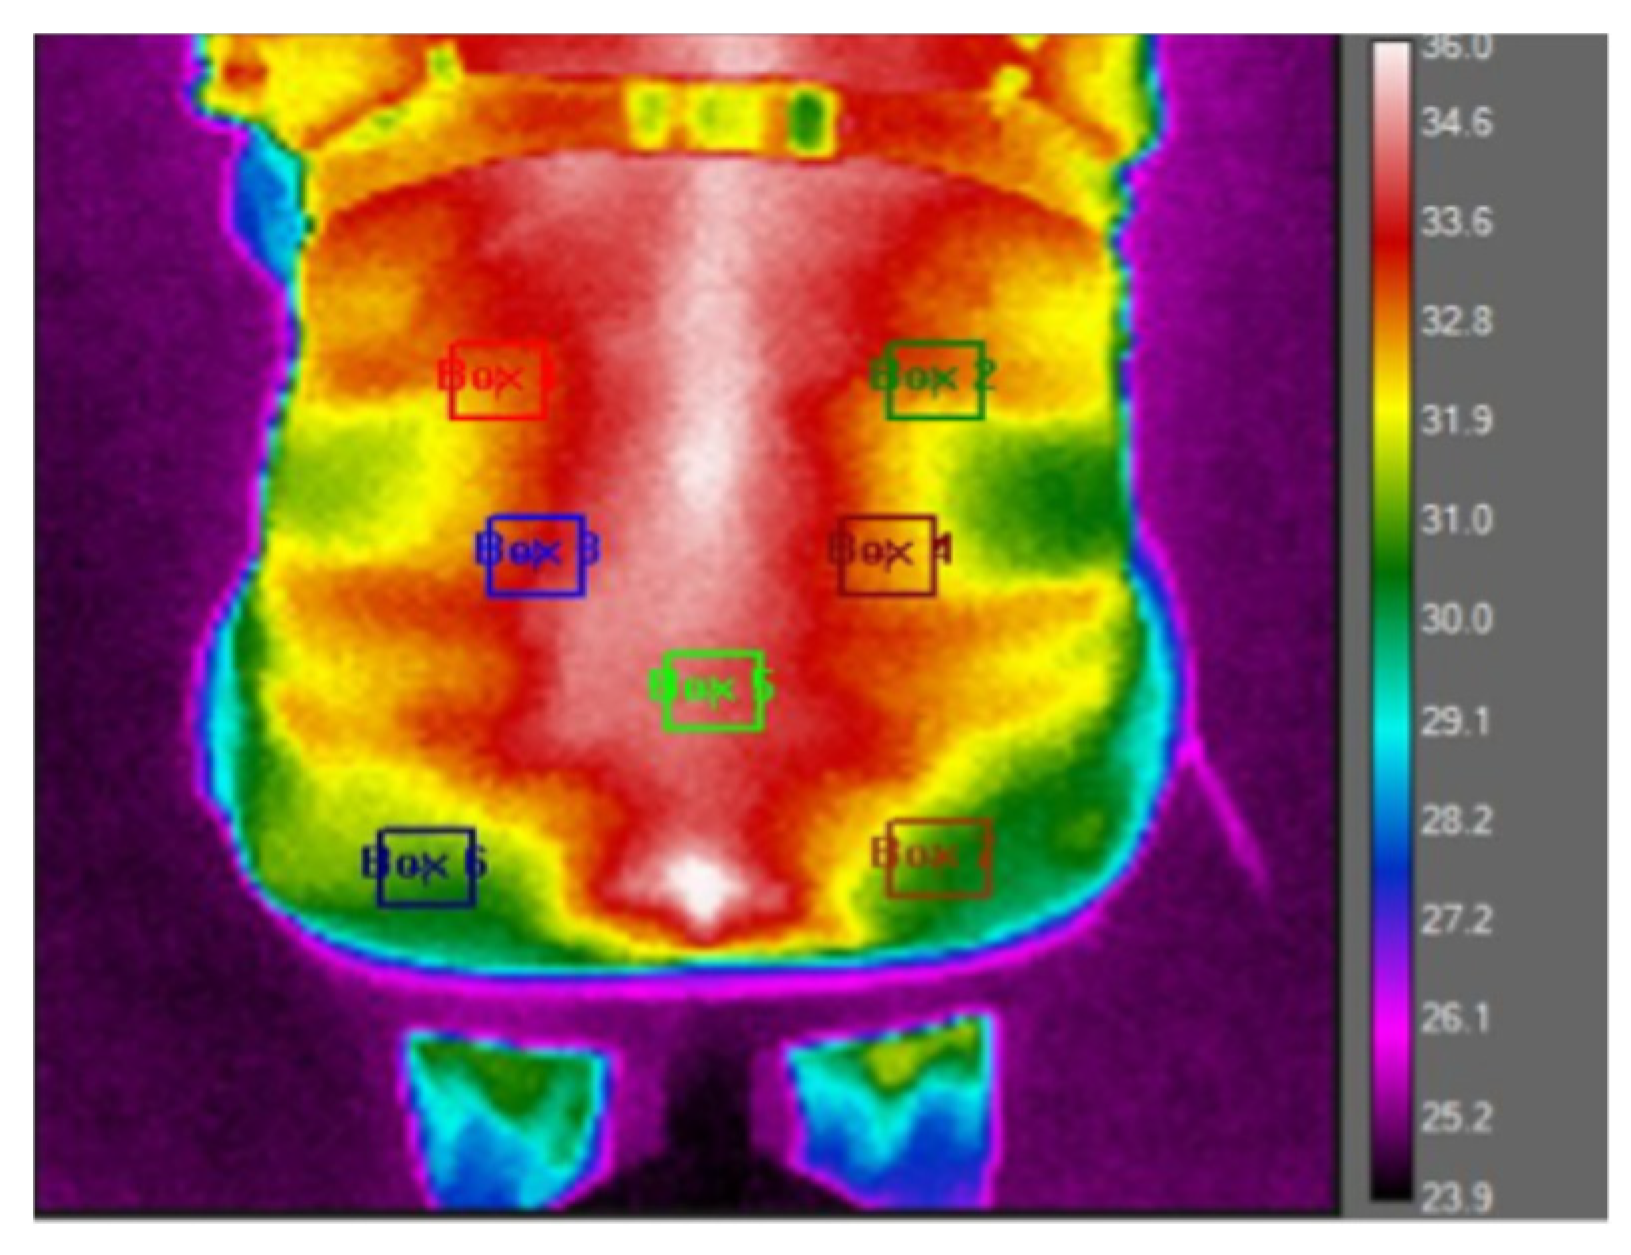

Table 1.
Comparison of thermography values in each position (P1 to P7) with sex.
| Gender | ||||||||||
|---|---|---|---|---|---|---|---|---|---|---|
| Man | Woman | |||||||||
| n | mean | SD | n | mean | SD | dif. | p-value | |||
| Therm. | ||||||||||
| P1_ºC | 9 | 32,53 | 1,94 | 21 | 32,59 | 1,39 | -0,06 | 0,928 | ||
| P2_ºC | 9 | 32,49 | 1,80 | 21 | 32,58 | 1,55 | -0,10 | 0,874 | ||
| P3_ºC | 9 | 33,07 | 1,49 | 21 | 33,32 | 1,42 | -0,25 | 0,803 | ||
| P4_ºC | 9 | 32,98 | 1,46 | 21 | 33,21 | 1,38 | -0,22 | 0,964 | ||
| P5_ºC | 9 | 33,95 | 1,07 | 21 | 33,65 | 1,24 | 0,30 | 0,483 | ||
| P6_ºC | 9 | 32,12 | 1,25 | 21 | 31,82 | 1,68 | 0,30 | 0,402 | ||
| P7_ºC | 9 | 31,95 | 1,56 | 21 | 31,59 | 1,60 | 0,36 | 0,415 | ||
|
(p=Teste de Mann-Whitney) | ||||||||||
Table 2.
Comparison of thermography values in each position (P1 to P7) with ages.
| 64-75 years old | >75 years old | |||||||||
|---|---|---|---|---|---|---|---|---|---|---|
| n | mean | SD | n | mean | SD | dif. | p-value | |||
| Therm. | ||||||||||
| P1_ºC | 18 | 32,56 | 1,55 | 12 | 32,58 | 1,59 | -0,01 | 0,783 | ||
| P2_ºC | 18 | 32,53 | 1,56 | 12 | 32,59 | 1,73 | -0,05 | 0,611 | ||
| P3_ºC | 18 | 33,07 | 1,57 | 12 | 33,52 | 1,18 | -0,45 | 0,341 | ||
| P4_ºC | 18 | 33,05 | 1,45 | 12 | 33,27 | 1,33 | -0,21 | 0,582 | ||
| P5_ºC | 18 | 33,61 | 1,40 | 12 | 33,93 | 0,76 | -0,32 | 0,310 | ||
| P6_ºC | 18 | 32,35 | 1,62 | 12 | 31,26 | 1,23 | 1,09 | 0,083 | ||
| P7_ºC | 18 | 31,98 | 1,64 | 12 | 31,27 | 1,41 | 0,71 | 0,310 | ||
| (p=Teste de Mann-Whitney) | ||||||||||
Table 3.
Comparison of Thermography values in each position (P1 to P7) with pain type.
| Lumbar pain | Pain radiating to the lower limbs | |||||||||
|---|---|---|---|---|---|---|---|---|---|---|
| n | mean | SD | n | mean | SD | dif. | p-value | |||
| Therm. | ||||||||||
| P1_ºC | 9 | 32,08 | 2,06 | 21 | 32,78 | 1,25 | 0,70 | 0,342 | ||
| P2_ºC | 9 | 31,96 | 2,18 | 21 | 32,81 | 1,26 | 0,85 | 0,455 | ||
| P3_ºC | 9 | 32,94 | 1,77 | 21 | 33,38 | 1,27 | 0,44 | 0,769 | ||
| P4_ºC | 9 | 32,92 | 1,75 | 21 | 33,24 | 1,23 | 0,32 | 0,946 | ||
| P5_ºC | 9 | 33,61 | 1,40 | 21 | 33,80 | 1,11 | 0,19 | 0,910 | ||
| P6_ºC | 9 | 31,90 | 1,12 | 21 | 31,92 | 1,73 | 0,01 | 0,946 | ||
| P7_ºC | 9 | 31,47 | 1,19 | 21 | 31,80 | 1,72 | 0,32 | 0,684 | ||
| (p=Teste de Mann-Whitney) | ||||||||||
Table 4.
Comparison of thermography values in each position (P1 to P7), with morning stiffness.
| Presence of morning stiffness in the spine | ||||||||||
|---|---|---|---|---|---|---|---|---|---|---|
| I do not feel it, or it is less than 30 minutes. | I feel it, and it is more than 30 minutes | |||||||||
| n | mean | SD | n | mean | SD | dif. | p-value | |||
| Therm. | ||||||||||
| P1_ºC | 24 | 32,47 | 1,59 | 6 | 32,98 | 1,37 | 0,51 | 0,422 | ||
| P2_ºC | 24 | 32,45 | 1,63 | 6 | 33,00 | 1,53 | 0,56 | 0,325 | ||
| P3_ºC | 24 | 33,27 | 1,46 | 6 | 33,16 | 1,37 | -0,11 | 0,917 | ||
| P4_ºC | 24 | 33,18 | 1,41 | 6 | 32,97 | 1,38 | -0,22 | 0,795 | ||
| P5_ºC | 24 | 33,84 | 1,20 | 6 | 33,35 | 1,10 | -0,49 | 0,568 | ||
| P6_ºC | 24 | 32,17 | 1,54 | 6 | 30,89 | 1,22 | -1,28 | 0,070 | ||
| P7_ºC | 24 | 31,92 | 1,58 | 6 | 30,82 | 1,29 | -1,10 | 0,102 | ||
| (p=Teste de Mann-Whitney) | ||||||||||
Table 5.
Comparison of thermography values in each position (P1 to P7), with “crisis” of low back pain or sciatica.
Table 5.
Comparison of thermography values in each position (P1 to P7), with “crisis” of low back pain or sciatica.
| In the past two months, have you experienced any 'crisis' of low back pain or sciatica? | ||||||||||
|---|---|---|---|---|---|---|---|---|---|---|
| No | Yes | |||||||||
| n | mean | SD | n | mean | SD | dif. | p-value | |||
| Thermography | ||||||||||
| P1_ºC | 16 | 32,30 | 1,46 | 14 | 32,87 | 1,62 | 0,57 | 0,383 | ||
| P2_ºC | 16 | 32,36 | 1,59 | 14 | 32,78 | 1,64 | 0,41 | 0,647 | ||
| P3_ºC | 16 | 32,86 | 1,28 | 14 | 33,69 | 1,50 | 0,82 | 0,114 | ||
| P4_ºC | 16 | 32,91 | 1,29 | 14 | 33,41 | 1,49 | 0,50 | 0,442 | ||
| P5_ºC | 16 | 33,34 | 1,02 | 14 | 34,20 | 1,22 | 0,87 | 0,061 | ||
| P6_ºC | 16 | 31,63 | 1,17 | 14 | 32,23 | 1,89 | 0,59 | 0,339 | ||
| P7_ºC | 16 | 31,28 | 1,16 | 14 | 32,18 | 1,86 | 0,89 | 0,212 | ||
| (p=Teste de Mann-Whitney) | ||||||||||
Table 6.
Correlation between average value of low back pain in the last 7 days and the thermography values in each position (P1 to P7).
Table 6.
Correlation between average value of low back pain in the last 7 days and the thermography values in each position (P1 to P7).
| How do you rate the average value of your low back pain over the last 7 days? | |
|---|---|
| Thermography | |
| P1_ºC | 0,257 |
| P2_ºC | 0,250 |
| P3_ºC | 0,131 |
| P4_ºC | 0,118 |
| P5_ºC | 0,158 |
| P6_ºC | -0,027 |
| P7_ºC | 0,114 |
| (p=Coeficiente de correlação de Spearman) | |
Table 7.
Correlation between BMI, Schober test and the thermography values in each position (P1 to P7).
Table 7.
Correlation between BMI, Schober test and the thermography values in each position (P1 to P7).
| MBI | Schober test | |
|---|---|---|
| Thermography | ||
| P1_ºC | -0,418* | -0,020 |
| P2_ºC | -0,508** | -0,040 |
| P3_ºC | -0,361* | -0,078 |
| P4_ºC | -0,227 | -0,153 |
| P5_ºC | -0,340 | -0,092 |
| P6_ºC | -0,015 | -0,100 |
| P7_ºC | 0,094 | -0,173 |
| * The correlation is significant at the 0.05 level | ||
| ** The correlation is significant at the 0.01 level | ||
Table 8.
Correlation between itens from Fatigue Assessment Scale and the thermography values in each position (P1 to P7).
Table 8.
Correlation between itens from Fatigue Assessment Scale and the thermography values in each position (P1 to P7).
| Fatigue Assessment Scale | ||||||
|---|---|---|---|---|---|---|
| Fatigue bothers me | I get tired very quickly | I feel physically exhausted | I feel like I don't want to do anything | I feel mentally exhausted | ||
| Therm. | ||||||
| P1_ºC | 0,062 | 0,188 | 0,244 | 0,224 | 0,389* | |
| P2_ºC | -0,006 | 0,241 | 0,234 | 0,228 | 0,426* | |
| P3_ºC | -0,042 | 0,12 | 0,363* | 0,118 | 0,358 | |
| P4_ºC | -0,085 | 0,13 | 0,384* | 0,087 | 0,348 | |
| P5_ºC | 0,015 | 0,169 | 0,335 | 0,137 | 0,211 | |
| P6_ºC | -0,15 | -0,099 | 0,29 | 0,003 | 0,223 | |
| P7_ºC | 0,038 | 0,217 | 0,593** | 0,082 | 0,189 | |
| * The correlation is significant at the 0.05 level | ||||||
| ** The correlation is significant at the 0.01 level | ||||||
Table 9.
Correlation between Manual Grip R (KgF), Manual Grip LE (KgF) and Thermography values in each position (P1 to P7).
Table 9.
Correlation between Manual Grip R (KgF), Manual Grip LE (KgF) and Thermography values in each position (P1 to P7).
| Hand grip (KgF) | ||
|---|---|---|
| R - Mean | L - Mean | |
| Thermography | ||
| P1_ºC | -0,046 | -0,012 |
| P2_ºC | -0,070 | -0,038 |
| P3_ºC | -0,113 | -0,097 |
| P4_ºC | -0,136 | -0,049 |
| P5_ºC | 0,028 | 0,016 |
| P6_ºC | -0,059 | 0,048 |
| P7_ºC | -0,048 | 0,068 |
| * The correlation is significant at the 0.05 level | ||
| ** The correlation is significant at the 0.01 level | ||
Table 10.
Correlation between Lumbar Algometry and thermography values in each position (P1 to P7).
| Lumbar Algometry (KgF) | |||||||
|---|---|---|---|---|---|---|---|
| ALG_1 | ALG_2 | ALG_3 | ALG_4 | ALG_5 | ALG_6 | ALG_7 | |
| Thermography | |||||||
| P1_ºC | 0,090 | -0,009 | -0,035 | -0,067 | -0,113 | 0,031 | -0,005 |
| P2_ºC | 0,135 | 0,089 | 0,043 | 0,011 | -0,050 | 0,060 | 0,087 |
| P3_ºC | -0,069 | -0,026 | -0,053 | -0,114 | -0,057 | 0,159 | -0,028 |
| P4_ºC | -0,273 | -0,185 | -0,136 | -0,261 | -0,156 | -0,058 | -0,243 |
| P5_ºC | -0,082 | -0,031 | -0,026 | -0,041 | -0,026 | 0,258 | -0,022 |
| P6_ºC | -0,090 | -0,024 | 0,040 | -0,101 | 0,082 | 0,116 | -0,045 |
| P7_ºC | -0,104 | -0,033 | 0,036 | -0,075 | 0,144 | 0,141 | -0,047 |
Table 11.
Correlation between Lumbar Algometry (Right, Left, Central) and the Thermography values in each position (P1 to P7).
Table 11.
Correlation between Lumbar Algometry (Right, Left, Central) and the Thermography values in each position (P1 to P7).
| Lumbar Algometry (KgF) | |||
|---|---|---|---|
| Right | Left | Central | |
| Thermography | |||
| P1_ºC | 0,037 | -0,066 | 0,031 |
| P2_ºC | 0,093 | 0,028 | 0,060 |
| P3_ºC | 0,018 | -0,070 | 0,159 |
| P4_ºC | -0,174 | -0,249 | -0,058 |
| P5_ºC | 0,044 | -0,042 | 0,258 |
| P6_ºC | 0,014 | -0,057 | 0,116 |
| P7_ºC | -0,002 | -0,046 | 0,141 |
Disclaimer/Publisher’s Note: The statements, opinions and data contained in all publications are solely those of the individual author(s) and contributor(s) and not of MDPI and/or the editor(s). MDPI and/or the editor(s) disclaim responsibility for any injury to people or property resulting from any ideas, methods, instructions or products referred to in the content. |
© 2025 by the authors. Licensee MDPI, Basel, Switzerland. This article is an open access article distributed under the terms and conditions of the Creative Commons Attribution (CC BY) license (http://creativecommons.org/licenses/by/4.0/).
Copyright: This open access article is published under a Creative Commons CC BY 4.0 license, which permit the free download, distribution, and reuse, provided that the author and preprint are cited in any reuse.


