Submitted:
23 April 2025
Posted:
24 April 2025
You are already at the latest version
Abstract
The Internet of Things (IoT) networks face an increasing number of cyber threats due to their heterogeneous, distributed, and resource-constrained nature. Conventional static defense mechanisms are often inadequate against sophisticated and advanced persistent threats. Moving target defense (MTD) is a dynamic, proactive security method that increases system resilience by continuously changing the attack surface, thereby increasing uncertainty and complexity for the attackers. In this paper, we evaluate the effectiveness of shuffling or diversity-based MTD methods using time-to-comprise and security risk metrics. We develop attack path-based mean time-to-comprise and security risk reduction metrics for assessing the effectiveness of the MTD. These metrics provide a quantitative basis for evaluating how MTD techniques delay successful compromises and lower overall security risk exposure. The performance of the deployed MTD mechanism is evaluated and discussed for different attacker skills and shuffling frequencies.
Keywords:
internet of things
; IoT security
; moving target defense
; security metric
; security evaluation
; time to compromise
; security risk
; cybersecurity
; attack path
1. Introduction
The rapid growth of Internet of Things (IoT) technologies has enabled the creation of innovative applications across diverse domains [1,2]. However, the large-scale deployment of IoT devices and their inherent resource constraints, such as limited bandwidth and power, pose challenges for the effective application of traditional security and defense mechanisms. As a result, IoT systems remain vulnerable to various security threats and attacks, which can disrupt the seamless delivery and normal operation of IoT-based services [3]. Moving Target Defense (MTD) methods have emerged as proactive and adaptive security strategies for safeguarding IoT systems despite resource limitations and evolving dynamic threats [4]. MTD mechanism aims to dynamically change the attack surface to increase uncertainty and confuse the attackers by invalidating the attacker’s information collected during the reconnaissance or procedures to launch the attacks [5,6]. Shuffling or diversity-based MTD techniques such as virtual IP shuffling [7], IP randomization [8], IP address rotation or hopping [9], host and service multiplexing [10], cryptosystem or firmware mutation [11], and code partitioning [12] are common MTD mechanisms that can be employed to enhance system security in resource-constrained IoT environments [12]. Several assessment methods for evaluating MTD methods have been proposed [13,14,15,16,17]. However, their application is limited to particular attack scenarios, threat models, or specific network environments, and they generally lack consideration of the IoT network environments. In this paper, we propose a new suite of attack path-based time-to-compromise (TTC) and security risk (SR) metrics to evaluate the effectiveness of shuffling and diversity-based MTD methods in IoT networks. The key contributions of this work are summarized as follows:
- Proposed a set of attack-path-based TTC metrics to estimate the mean time to compromise a smart device in an IoT network deploying the MTD defense mechanism. TTC-related metrics include mean TTC, minimum TTC, and maximum TTC, considering different skill levels of attackers.
- Devised a set of risk-based security metrics considering TTC and attack cost into account. These risk-based metrics compute the risk reduction with MTD mechanism in terms of shuffling rate and strategies.
- Conducted extensive simulation experiments to measure the effectiveness of the MTD methods deployed in IoT networks, and identified key factors that significantly influence the performance of the MTD methods.
The rest of this paper is organized as follows. Section 2 discusses the state-of-the-art of the related work. Section 3 describes network, threat, and defense models considered in this work. Section 4 presents the proposed metrics to evaluate the MTD methods. Section 5 discusses experimental results and analysis. Lastly, Section 6 concludes this paper and suggests potential future research directions.
2. Related Work
Various security assessment models and metrics have been proposed for evaluating the effectiveness of MTD methods. Picek et al. [18] proposed optimization-based metrics to assess the effectiveness of the MTDs. They used a network neighborhood partitioning algorithm to improve the precision of MTD influence measurement. Osei et al. [19] developed a game-theoretic approach to produce an optimal defense strategy.Zaffarano et al. [15] introduced a quantitative framework measuring productivity, success, confidentiality, and integrity for given missions and attack models. Carroll et al. [20] proposed a probabilistic model and analyzed the performance of the network address shuffling MTD technique. Similarly, Hong and Kim [14] developed a set of risk-based metrics to assess the effectiveness of MTD’s shuffling, diversity, and redundancy. In addition, Hong et al. [21] also proposed attack and defense effort-based dynamic security metrics for assessing the effectiveness of MTD techniques. Several entropy-based methods have been introduced to quantitatively assess the security of MTD methods [22,23,24]. These approaches rely on probability distributions to estimate the likelihood of events, which can limit their precision in capturing real-time system dynamics. Sharma et al. [13] proposed a set of dynamic security metrics to evaluate the effectiveness of the deployed MTD methods in Software-Defined Network (SDN) environments. These metrics capture the dynamic changes in network and host state information such as IP addresses, ports, software stacks, vulnerabilities, or network topology introduced by the MTD methods through shuffling and reconfiguration. However, the metrics do not offer the ability to capture and measure the effectiveness of the MTDs in IoT networks.
The state-of-the-art security metrics for assessing MTD methods mainly focus on measuring the static or dynamic aspects of network addresses, networks, or systems, and most of them were developed for enterprise network settings and are not suitable for IoT environments. In addition, no attack-path-based TTC and security risk metrics for shuffling and diversity-based MTDs. This work proposes a suite of attack path-based time-to-compromise and security risk metrics to evaluate the MTD methods in IoT networks.
3. System Model
This section presents the network, threat, and defense models considered in this work. It outlines the assumptions and scenarios about the considered IoT network system, including the devices, vulnerabilities, attacker capabilities, and deployed defense mechanisms.
3.1. Network Model
In this study, we consider a smart home IoT networked system similar to the one described in [3]. This IoT network system consists of various interconnected IoT devices with wireless communication protocols. Figure 1 shows the smart home IoT network setup scenario with smart TVs, smart door lock, smart security cameras, thermostats, meters, a smart plug, a smart phone, and appliances all communicating over wireless protocols such as Wi-Fi, Bluetooth, or Zigbee. IoT devices are managed through a central hub or mobile app, allowing users to control and monitor them remotely. Each of these devices has one or more vulnerabilities. Table 1 shows the example vulnerabilities of those devices with their CVE ID, CVSS score, and description [25]. For example, the smart TV (e.g, LG WebOS Smart TV and security camera (Wyze Cam) have high-severity vulnerabilities (CVSS 9.8) that allow remote command execution and login bypass, respectively, potentially giving attackers full control of the devices. Smartphone is also affected by memory corruption, posing serious risks when connected to smart environments. Smart door lock has relatively less risk as it has low CVSS score. Additionally, smart plug , smart meters, and thermostats suffer from incorrect signature verification, authentication bypass and buffer overflow.
3.2. Threat Model
In this study, we model attackers based on their capability to scan and exploit vulnerabilities within a smart home IoT network. As shown in Figure 1, the attackers are assumed to be external to the network and attempt to identify and compromise vulnerable IoT devices through scanning and analysis. They can use common network scanning tools such as Nmap[26] or Nessus[27] to detect active hosts, open ports, and known vulnerabilities. We consider three levels of attackers based on their technical expertise and knowledge:
- Beginner: These attackers use default scanning configurations and have limited knowledge of the target network. Their ability to interpret scan results is minimal, and they require significant effort to identify vulnerabilities and find usable exploits to attack the system.
- Intermediate: These attackers have a moderate understanding of IoT network structures and known vulnerabilities. They can customize scan parameters to focus on specific devices or services and are generally able to identify vulnerabilities. However, they may struggle to find or develop suitable exploits to compromise the targets effectively.
- Expert: Expert attackers possess deep knowledge of the IoT systems and employ stealthy or adaptive scanning techniques. They can efficiently discover vulnerabilities and are capable of locating or creating effective exploits, enabling them to compromise a wide range of heterogeneous devices with ease.
3.3. Defense Model
In this work, we use shuffling and/or diversity-based MTD methods to protect the smart home IoT network. These methods dynamically change key elements of the system, such as network address, operating system rotations, or application software at regular intervals [4]. This constant change makes it difficult for attackers to scan, identify, and exploit known vulnerabilities. For example, if a smart device’s operating system version is changed, a vulnerability the attacker was targeting may no longer exist. Similarly, changing the network layout or IP address disrupts the attacker’s ability to track or reach the device. The brief description of time-based shuffling and diversity-based defense methods is as follows.
- Shuffling-based MTDs: Shuffling-based MTD methods periodically modify network attributes such as IP addresses, ports, or configurations in a fixed interval of time. These MTD methods hinder an attacker’s ability to maintain an accurate view of the system, invalidating reconnaissance efforts and narrowing the window for successful exploitation.
- Diversity-based MTDs: Diversity-based MTD methods dynamically change device characteristics such as operating systems (OS rotation), firmware versions, or application configurations to ensure that vulnerabilities of the IoT devices differ over time, reducing the risk of uniform exploitation.
4. Proposed Approach
This section presents the proposed time-to-compromise and security risk metrics to evaluate the effectiveness of the IoT-based MTD methods. IoT-based MTD mechanisms dynamically change the attack surface of the IoT network, and these dynamic network changes affect the IoT device’s reachability, vulnerabilities. Attack graph-based security metrics describe attack paths in the attack graph [28], which can be used to analyze the security [29]. Attack paths are sequences of devices or vulnerabilities that an attacker can compromise to reach a target. We assume that the target IoT network system has been deployed with any time-based shuffling MTD mechanisms that continuously change the attack surface network, devices, or software properties by shuffling IP address, route, cryptosystem, firmware, operating system, service, application software, or code partitioning. The shuffling event invalidates security-related information (e.g., vulnerabilities and exploits) of the target networked systems collected by the attacker and consequently reduces the visibility of the attack surface to the attacker.
4.1. Time-to-Compromise Metrics
Time-to-Compromise Metrics (TTC) security metrics estimate the mean time to compromise of a host in a network with the deployment of MTD mechanism. We devise security metrics for the MTD by modifying the existing models Byres and Leversage [30], and McQueen et al. [31] for incorporating the MTD shuffling rate in their estimation. These proposed metrics estimate MTTC for different skill levels of attackers with different shuffling rates of the MTD mechanism, taking attack paths into account. Let be a set of all possible attack path from an attacker to a target host or device . The time to compromise using an attack path, at time :
wher is a function that estimates the expected time to compromise of a host or device . Now, the Mean Time To Compromise (MTTC) on all the attack paths is:
Using Eq. 1, the minimum and maximum time to compromise on the attack path at time point can be estimated as follows:
Eqs. 3 and 4 can be used to find the minimum and maximum time-to-compromise for a given MTD shuffling time window [,], which is given as follows:
Metrics presented in Eqs. 1 - 6 can be used to estimate the TTC of a target-host using attack paths. Attack paths are sequences of hosts/devices or vulnerabilities that an attacker can exploit and compromise to reach the target device or system. However, time-to-compromise of a host, in Eq. 1 is still unknown. To estimate it, we adapt a method Byres and Leversage [30] considering three different levels of attacker’s skills and knowledge about the target IoT network system (e.g., beginner, intermediate, or expert) with three attacking processes. Estimation of the TTC relies on the attacker’s skills and knowledge. Based on different skill levels of an attacker, the attacking processes can be divided into the following three exclusive processes:
- Attack process 1: In this scenario, an attacker has one or more known vulnerabilities and exploits ( i.e., with known vulnerabilities and known exploits). These attackers have all the required knowledge to attack the system.
- Attack process 2: In this process, an attacker has one or more known vulnerabilities but does not have any exploits on hand ( i.e., known vulnerabilities and unknown exploits). These attackers have partial knowledge about the target IoT network system.
- Attack process 3: These attacker has no known vulnerabilities and exploits (i.e., unknown vulnerabilities and unknown exploits). It means attackers do not have any knowledge about the target system. Attacker scans the network, finds vulnerabilities, and builds an exploit to launch the attack.
Some of these attack processes are mutually exclusive. For instance, Attack process 1 and Attack process 2; Attack process 2 and Attack process 3 are mutually exclusive processes, respectively. Therefore, we can multiply the probabilities and the expected time to compromise a host () is as follows:
where, p and u are the probabilities of an attacker in Process 1 and Process 3, and , , and are the times required for completing the attack in each process, respectively. As MTD changes attack surfaces, it makes vulnerabilities and other related information invisible to the attacker. The visibility factor of a host can be related with shuffling rate as (, where for . We relate this visibility factor with vulnerability information using different skill levels of the attacker to estimate the probabilities p and u. The computation of the probabilities p and u are as follows.
where,
- =# of vulnerabilities exist in a host or a component,
- =# of exploits readily available for vulnerabilities of the host ,
- K=# of total non-duplicate vulnerabilities in vulnerability database,
- = shuffling rate of the host with MTD interval time ,
- s: attacker’s skill level, (e.g., for beginner, for intermediate, and for expert).
Now, we estimate the attack completion time of each attack process by adapting the estimation method and parameters used in model McQueen et al. [31]. Let ,, and represent the amount of time for completing attack process 1, process 2, and process 3, respectively, and given by:
- day
- , where
-
, andwhere:
- : Expected number of tries
- : Number of vulnerabilities for which exploits are available or can be created by the attacker at their skill level
- : Number of vulnerabilities for which no exploits are available at their skill level
- s: Attacker skill level.
4.2. Security Risks Metrics
Security risk (SR) is an important metric that is used to evaluate and assess security methods, including MTDs [14]. The quantitative security risk of an attack incident on IoT-based system ’s a host, , for an attack duration time, t, can be defined as:
where, is the probability of an attack happening on the host for attack duration t, and is the loss or damage cost of the attack, typically measured in monetary value ( e.g., dollars). Here, the probability, can be defined in terms of an expected time-to-compromise of a host, , and obtained as follows:
where, , which can be obtained using the Eq.7.
The SR of a Network (SRN) is a risk of compromising all the hosts in the network with the MTD mechanism can be computed as:
Now, we propose a security risk reduction with MTD metric for measuring the effectiveness of deploying the MTD mechanism. It estimates the amount of security risk reduction using the MTD mechanism in terms of TTC based on the quantitative risk model. To measure it, we consider a system without MTD mechanism and with MTD mechanism. Using Eq. 11, the security risk of a system without and with MTD mechanism can be respectively defined as:
where, , and are probability of occurrence of an attack on a system in a host for an attack duration time t without, and with MTD mechanism respectively, and a cost of the attack (i.e., CoA value is same in both systems). The evaluation of the effectiveness of the deployed MTD methods in an IoT network, comparing it with a baseline model (without any defense/MTD). In addition, the attack path can be taken into account and define the path-based SR metrics. The SR reduction and path-based SR metrics are as follows:
-
Security Risk Reduction Percentage (SRRP): SRRP can express in terms of percentage and it can be obtained as:Security Risk Reduction Percentage of a Network (SRRPN): SRRPN is the risk reduction of compromising all the hosts in the network using the MTD, and it can be obtained as:
- Security Risk on Path (SRP): It is a security risk on path metric that estimates the risk associated with the attack path. SRP is the sum of the security risk of the hosts on a path . SRP of an attack path, , for attack duration time t with starting at time obtained as:where, .
- Security Risk on Paths of a Network (SRPN): SRPN is a maximum security risk among all the attack paths, which can be obtained as:
5. Experiments & Results Analysis
This section presents a network setting and scenario description, simulation experiment setup, and results analysis for the evaluation of the MTD methods.
5.1. Network Setting & Scenario Description
Simulation experiments were conducted considering the scenarios and settings as discussed in the system model Section 3. In this setting, IoT network system (smart home system) is protected with one or more shuffling and/or diversity based MTD mechanism(s), which dynamically reconfigure or shuffles each host or device ’s configurations such as IP address, operating system/application software, or network topology at a specific shuffling rate rate. This simulation experiment used real-world data from a public vulnerability database [32], considering 122,774 unique vulnerabilities and 4,333 known exploits [25]. Attackers are assumed to be external to the network, and attacking the network using their skills and available tools and techniques as discussed in Section 3.2. The effectiveness of deploying MTD methods(s) is evaluated under varying some key parameters such as vulnerability distributions, MTD shuffling rates, and attacker skill levels.
5.2. Results & Analysis
Evaluating MTD methods by varying vulnerabilities: Figure 2 presents the performance evaluation of the MTD mechanism (s) in terms of Time-to-Compromise (TTC) under varying vulnerability distributions with different shuffling rates for different attacker skill levels. The results indicate that TTC increases as the number of vulnerabilities in the network increases, regardless of the attacker’s skill level. This is because a higher number of vulnerabilities introduces more uncertainty for the attackers. Furthermore, the shuffling rate has a significant impact on the effectiveness of the MTD strategy. The simulation explores shuffling intervals of 2, 5, 7, and 15 days. It is observed that more frequent shuffling (i.e., every 2 days) significantly increases the TTC compared to less frequent shuffling (e.g., 15 days). In particular, shuffling intervals of 15 days or shorter consistently improve the IoT system’s resilience, making it harder and more time-consuming for attackers to achieve a successful compromise. These findings suggest that frequent reconfiguration through MTDs is critical to enhancing security posture, especially in the IoT environments with a high number of vulnerabilities or facing skilled adversaries.
Evaluating MTD methods with different shuffling rates: Figure 3 shows performance comparison of deploying MTD mechanisms using the Time-to-Compromise (TTC) metric across varying attacker skill levels and shuffling rates. These results demonstrate that TTC increases with higher shuffling frequency, indicating the high impact of reconfiguration rate. Also, the results show that attacker skill level plays a critical role, where low-skilled (beginner) attackers experience a substantial increase in TTC even with moderate shuffling; however, highly skilled attackers are only significantly affected when the shuffling rate is very high. This indicates that defending against advanced adversaries requires frequent shuffling strategies to effectively delay or prevent successful compromise.
Evaluating MTD methods with different attackers’ skills levels: Figure 4 presents a comparative analysis of MTD performance with Time-to-Compromise (TTC) metrics for different attacker skill levels. The results show a clear distinction in TTC values based on attacker expertise. Specifically, beginner-level attackers require approximately 8 to 158 days to successfully compromise a device/host, while intermediate attackers take between 30 to 62 days. In contrast, expert attackers exhibit significantly shorter TTC values, ranging from approximately 15 to 30 days. These findings highlight that attacker proficiency substantially influences the effectiveness of the MTD mechanism.
Evaluating MTD methods with SRRP metric: Figure 5 evaluates the effectiveness of the deployed MTD mechanisms using the SRRP metric by varying shuffling rates with different attacker skill levels. The results indicate a consistent decline in MTD effectiveness as the shuffling interval increases. Specifically, daily shuffling yields the highest performance, reducing security risk by approximately 90% for all attacker skill levels. However, the effectiveness drops significantly to approximately 25-35% when the shuffling interval increases from 1 day to 2 days. This sharp decline highlights the sensitivity of MTD performance to shuffling frequency, emphasizing the necessity of high-frequency shuffling or reconfiguration to protect the IoT environment from attackers.
6. Conclusions
This work proposes a set of metrics for measuring the effectiveness of shuffling or diversity-based MTD methods that shuffle device configurations, protocols, links, topology, operating systems, or application software in the IoT network. The metrics estimate mean time-to-compromise and security risk metric scores for smart devices in IoT network systems, considering attackers’ skill levels and attack paths. Attack path-based metrics captured the dynamic change of an IoT network’s vulnerabilities made by MTD methods. Simulation results show that the effectiveness of MTD depends significantly on the frequency of shuffling and the attacker’s skill levels.
In future work, we plan to: (1) develop context-aware metrics that incorporate contextual information such as device mobility, usage pattern, etc. to provide more adaptive and dynamic assessment of MTD methods; (2) design metrics that evaluate the energy consumption, computation overhead, and communication cost introduced by the deploying MTD methods; and (3) investigate how machine learning models can be utilized to analyze system behavior and evolving pattern with historical attack data in real-time settings.
Funding
Not applicable.
Institutional Review Board Statement
Not applicable.
Informed Consent Statement
Not applicable.
Data Availability Statement
Data sharing does not apply to this article, as no datasets were generated.
Conflicts of Interest
The author declares no conflicts of interest.
References
- Al-Fuqaha, A.; Guizani, M.; Mohammadi, M.; Aledhari, M.; Ayyash, M. Internet of Things: A Survey on Enabling Technologies, Protocols, and Applications. IEEE Communications Surveys & Tutorials 2015, 17, 2347–2376. [Google Scholar]
- Roman, R.; Zhou, J.; Lopez, J. On the features and challenges of security and privacy in distributed Internet-of-Things. Computer Networks 2013, 57, 2266–2279. [Google Scholar]
- Ge, M.; Hong, J.B.; Guttmann, W.; Kim, D.S. A Framework for Automating Security Analysis of the Internet of Things. Journal of Network and Computer Applications 2017, 83, 12–27. [Google Scholar] [CrossRef]
- Cho, J.H.; Sharma, D.P.; Alavizadeh, H.; Yoon, S.; Ben-Asher, N.; Moore, T.J.; Kim, D.S.; Lim, H.; Nelson, F.F. Toward Proactive, Adaptive Defense: A Survey on Moving Target Defense. IEEE Communications Surveys & Tutorials 2020, 22, 709–745. [Google Scholar]
- Jajodia, S.; Ghosh, A.K.; Swarup, V.; Wang, C.; Wang, X.S. Moving Target Defense: Creating Asymmetric Uncertainty for Cyber Threats, 1st ed.; Springer Publishing Company, Incorporated, 2011.
- Sharma, D.P. Software-Defined Networking Based Moving Target Defenses. 2020.
- Sharma, D.P.; Kim, D.S.; Yoon, S.; Lim, H.; Cho, J.; Moore, T.J. FRVM: Flexible Random Virtual IP Multiplexing in Software-Defined Networks. In Proceedings of the Proceedings of the IEEE TrustCom, Aug. 2018, pp. 579–587.
- Sherburne, M.; Marchany, R.; Tront, J. Implementing Moving Target IPv6 Defense to Secure 6LoWPAN in the Internet of Things and Smart Grid. In Proceedings of the Proceedings of the 9th Annual Cyber and Information Security Research Conference (CISR), 2014, pp. 37–40.
- Zeitz, K.; Cantrell, M.; Marchany, R.; Tront, J. Designing a Micro-moving Target IPv6 Defense for the Internet of Things. In Proceedings of the Proceedings of IEEE/ACM 2nd International Conference on Internet-of-Things Design and Implementation (IoTDI), 2017, pp. 179–184.
- Sharma, D.P.; Cho, J.; Moore, T.J.; Nelson, F.F.; Lim, H.; Kim, D.S. Random Host and Service Multiplexing for Moving Target Defense in Software-Defined Networks. In Proceedings of the ICC 2019 - 2019 IEEE International Conference on Communications (ICC), May 2019, pp. 1–6.
- Casola, V.; Benedictis, A.D.; Albanese, M. A moving target defense approach for protecting resource-constrained distributed devices. In Proceedings of the Proceedings of the IEEE 14th International Conference on Information Reuse Integration (IRI), 2013, pp. 22–29.
- Mahmood, K.; Shila, D.M. Moving target defense for Internet-of-Things using context aware code partitioning and code diversification. In Proceedings of the Proceedings of the IEEE 3rd World Forum on Internet of Things (WF-IoT), 2016, pp. 329–330.
- Sharma, D.P.; Enoch, S.Y.; Cho, J.H.; Moore, T.J.; Nelson, F.F.; Lim, H.; Kim, D.S. Dynamic Security Metrics for Software-Defined Network-based Moving Target Defense. Journal of Network and Computer Applications 2020, 170, 102805. [Google Scholar] [CrossRef]
- Hong, J.B.; Kim, D.S. Assessing the effectiveness of moving target defenses using security models. IEEE Transactions on Dependable and Secure Computing 2016, 13, 163–177. [Google Scholar] [CrossRef]
- Zaffarano, K.; Taylor, J.; Hamilton, S. A Quantitative Framework for Moving Target Defense Effectiveness Evaluation. In Proceedings of the Second ACM Workshop on Moving Target Defense, MTD ’15. New York, NY, USA, 2015; pp. 3–10. [Google Scholar]
- Zhuang, R.; DeLoach, S.A.; Ou, X. A model for analyzing the effect of moving target defenses on enterprise networks. In Proceedings of the Proc. of the 9th Annual Cyber and Information Security Research Conference. ACM, 2014, pp. 73–76.
- Dishington, C.; Sharma, D.P.; Kim, D.S.; Cho, J.H.; Moore, T.J.; Nelson, F.F. Security and performance assessment of ip multiplexing moving target defence in software defined networks. In Proceedings of the 2019 18th IEEE International Conference On Trust, Security And Privacy In Computing And Communications/13th IEEE International Conference On Big Data Science And Engineering (TrustCom/BigDataSE). IEEE, 2019, pp. 288–295.
- Picek, S.; Hemberg, E.; O’Reilly, U.M. If you can’t measure it, you can’t improve it: Moving target defense metrics. In Proceedings of the Proceedings of the 2017 Workshop on Moving Target Defense, 2017, pp. 115–118.
- Osei, A.B.; Yeginati, S.R.; Al Mtawa, Y.; Halabi, T. Optimized Moving Target Defense Against DDoS Attacks in IoT Networks: When to Adapt? In Proceedings of the GLOBECOM 2022 - 2022 IEEE Global Communications Conference; 2022; pp. 2782–2787. [Google Scholar] [CrossRef]
- Carroll, T.E.; Crouse, M.; Fulp, E.W.; Berenhaut, K.S. Analysis of network address shuffling as a moving target defense. In Proceedings of the 2014 IEEE International Conference on Communications (ICC), June 2014, pp. 701–706.
- Hong, J.B.; Enoch, S.Y.; Kim, D.S.; Nhlabatsi, A.; Fetais, N.; Khan, K.M. Dynamic security metrics for measuring the effectiveness of moving target defense techniques. Computers & Security 2018, 79, 33–52. [Google Scholar]
- Zhuang, R.; DeLoach, S.A.; Ou, X. Towards a Theory of Moving Target Defense. In Proceedings of the Proc. of the First ACM Workshop on Moving Target Defense, 2014, pp. 31–40.
- Ma, D.; Wang, L.; Lei, C.; Xu, Z.; Zhang, H.; Li, M. POSTER: Quantitative Security Assessment Method Based on Entropy for Moving Target Defense. In Proceedings of the Proc. of the 2017 ACM on Asia Conference on Computer and Communications Security, 2017, pp. 920–922.
- Steinberger, J.; Kuhnert, B.; Dietz, C.; Ball, L.; Sperotto, A.; Baier, H.; Pras, A.; Dreo, G. DDoS Defense using MTD and SDN. In Proceedings of the IEEE/IFIP Network Operations and Management Symposium, 2018, pp. 1–9.
- https://www.cvedetails.com/.
- Lyon, G.F. Nmap Network Scanning: The Official Nmap Project Guide to Network Discovery and Security Scanning; Insecure: USA, 2009. [Google Scholar]
- Nessus. Nessus Professional, 2018. https://www.tenable.com/products/nessus/nessus-professional.
- Sheyner, O.; Haines, J.; Jha, S.; Lippmann, R.; Wing, J.M. Automated generation and analysis of attack graphs. In Proceedings of the Security and privacy, 2002. Proceedings. 2002 IEEE Symposium on. IEEE, 2002, pp. 273–284.
- Idika, N.; Bhargava, B. Extending Attack Graph-Based Security Metrics and Aggregating Their Application. IEEE Transactions on Dependable and Secure Computing 2012, 9, 75–85. [Google Scholar] [CrossRef]
- Byres, E.; Leversage, D. Estimating a System’s Mean Time-to-Compromise. IEEE Security & Privacy 2008, 6, 52–60. [Google Scholar]
- McQueen, M.A.; Boyer, W.F.; Flynn, M.A.; Beitel, G.A. Time-to-Compromise Model for Cyber Risk Reduction Estimation. In Proceedings of the Quality of Protection; Gollmann, D.; Massacci, F.; Yautsiukhin, A., Eds., Boston, MA, 2006; pp. 49–64.
- NIST-NVD. National Vulnerability Database (NVD), 2025. https://nvd.nist.gov/, Accessed on 2025-03-01.
Figure 1.
Smart home IoT system.
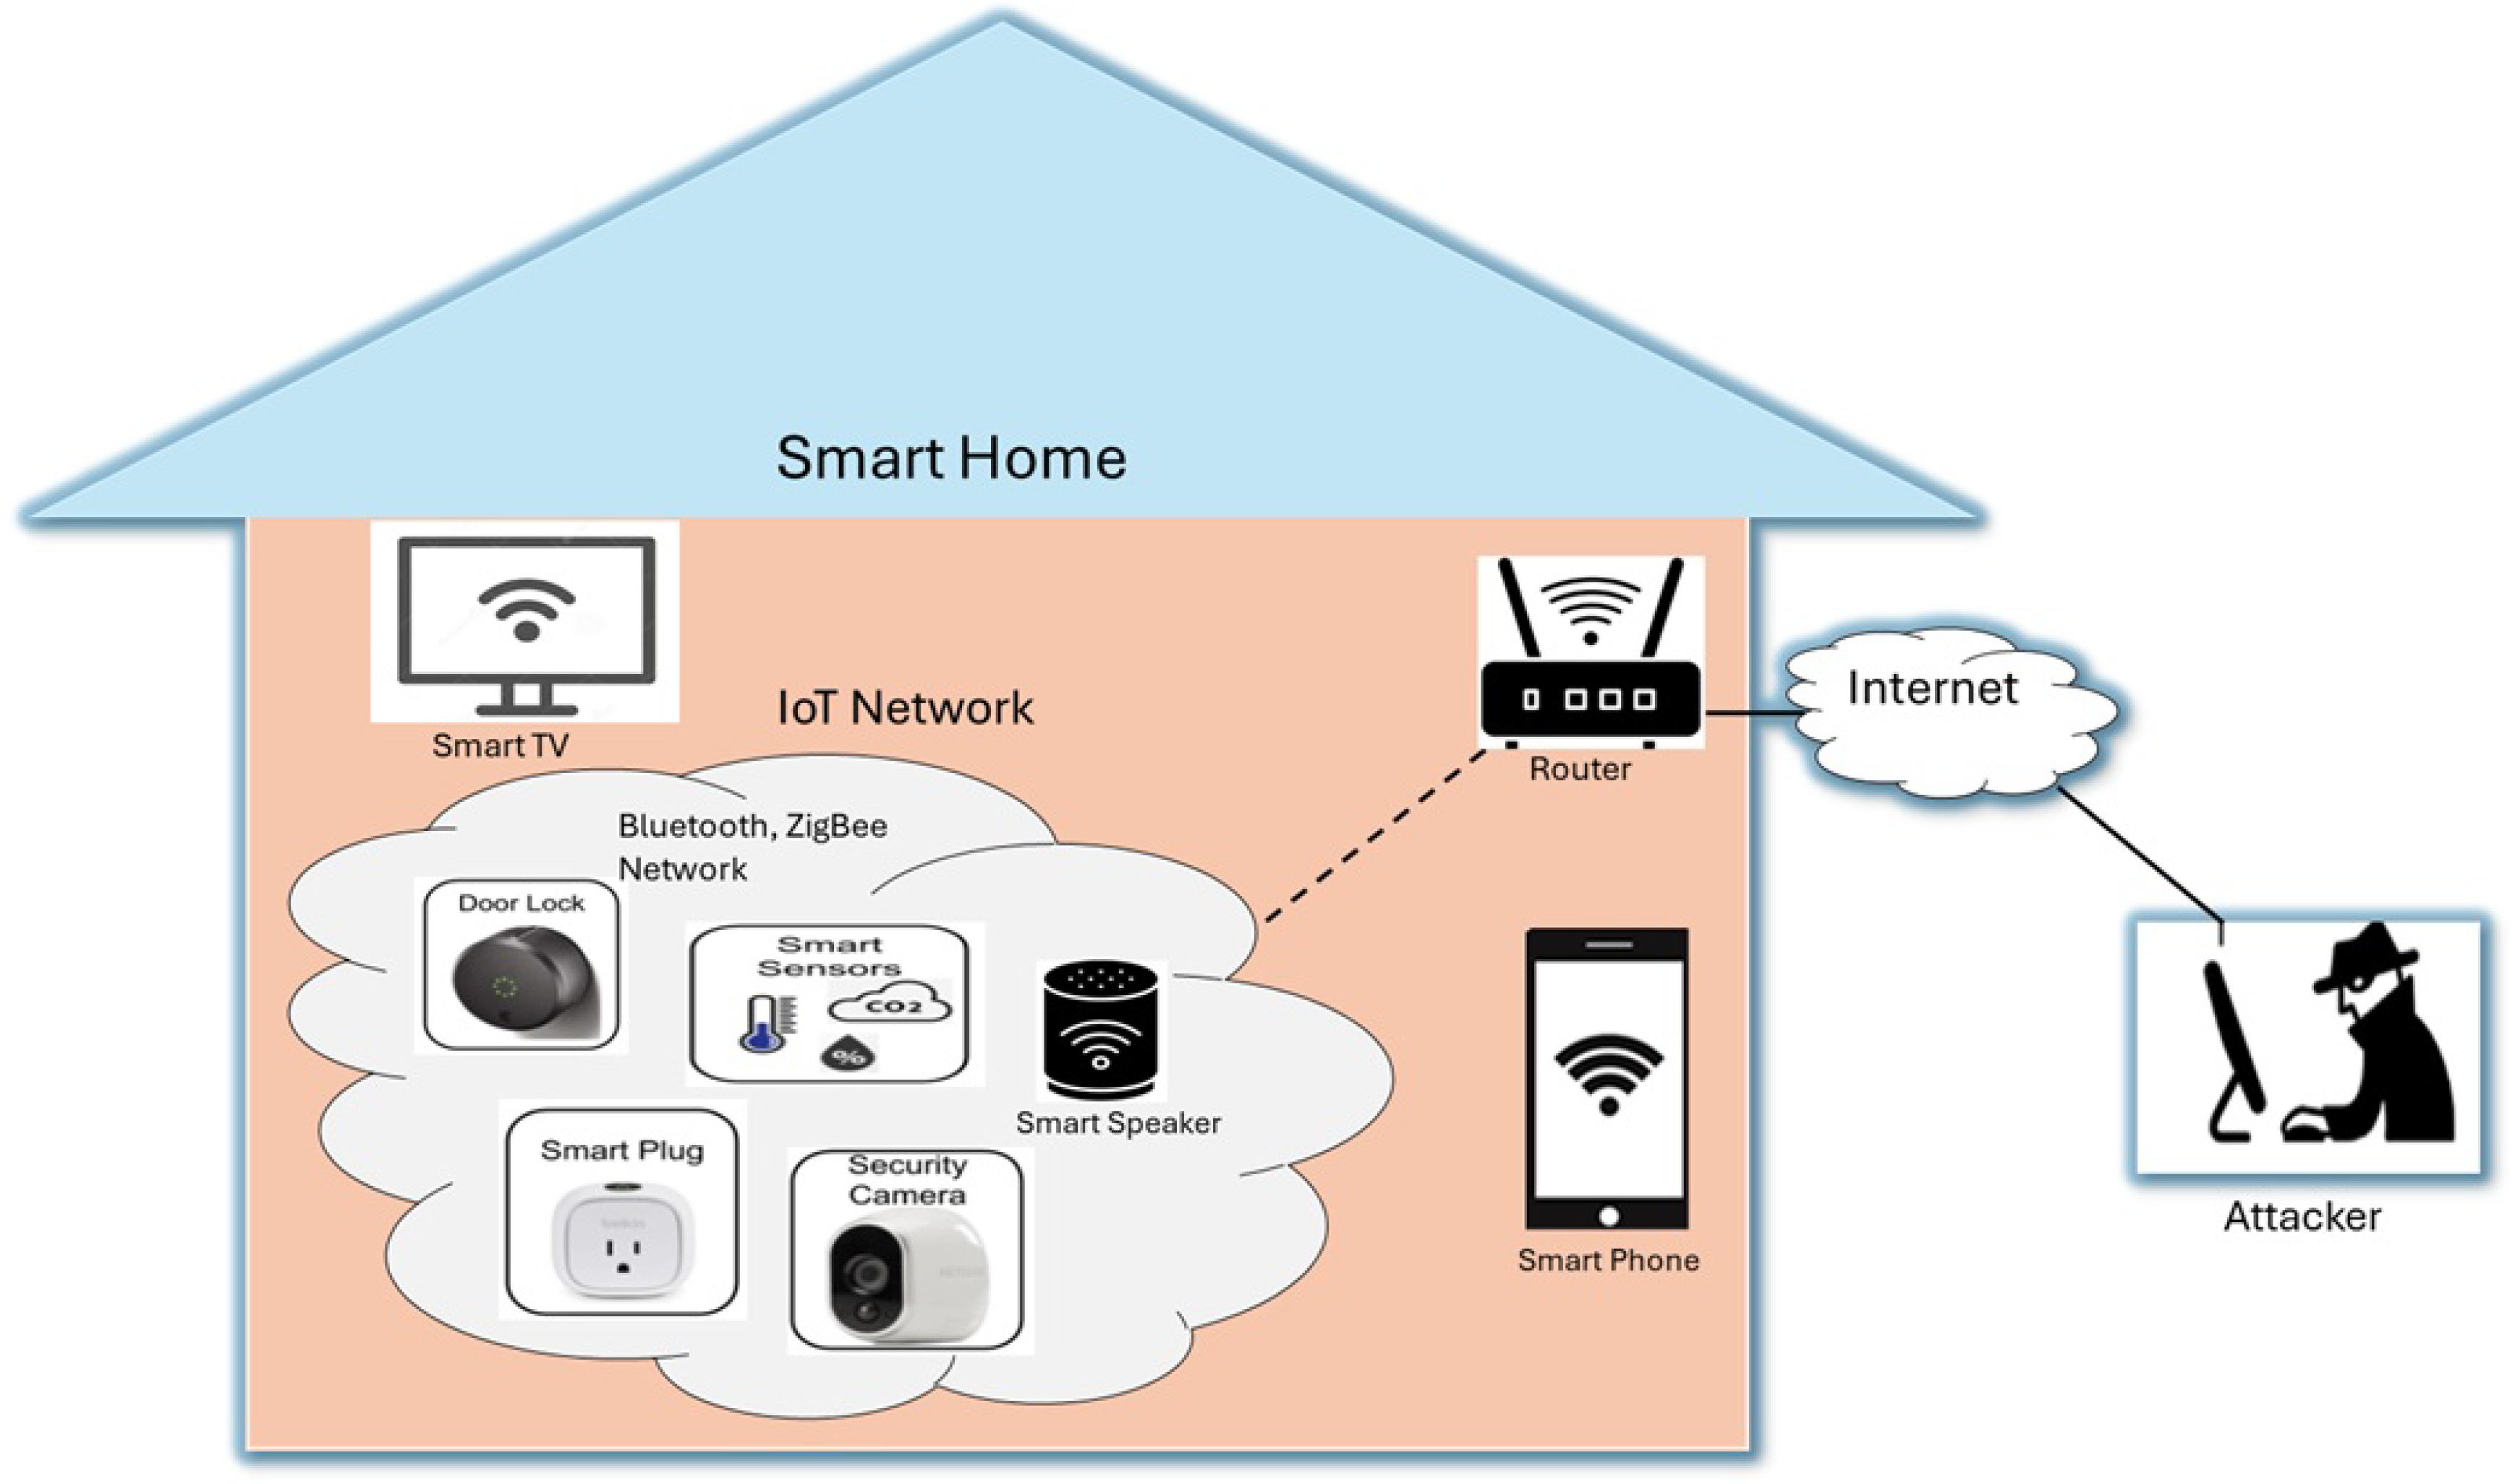
Figure 2.
Performance evaluation of the MTD method with time-to-compromise with different shuffling rates varying the distribution of the vulnerabilities for different attacker skill levels: (a) Beginner, (b) Intermediate, and (c) Expert. No shuffling represents a baseline IoT network with no defense mechanism.
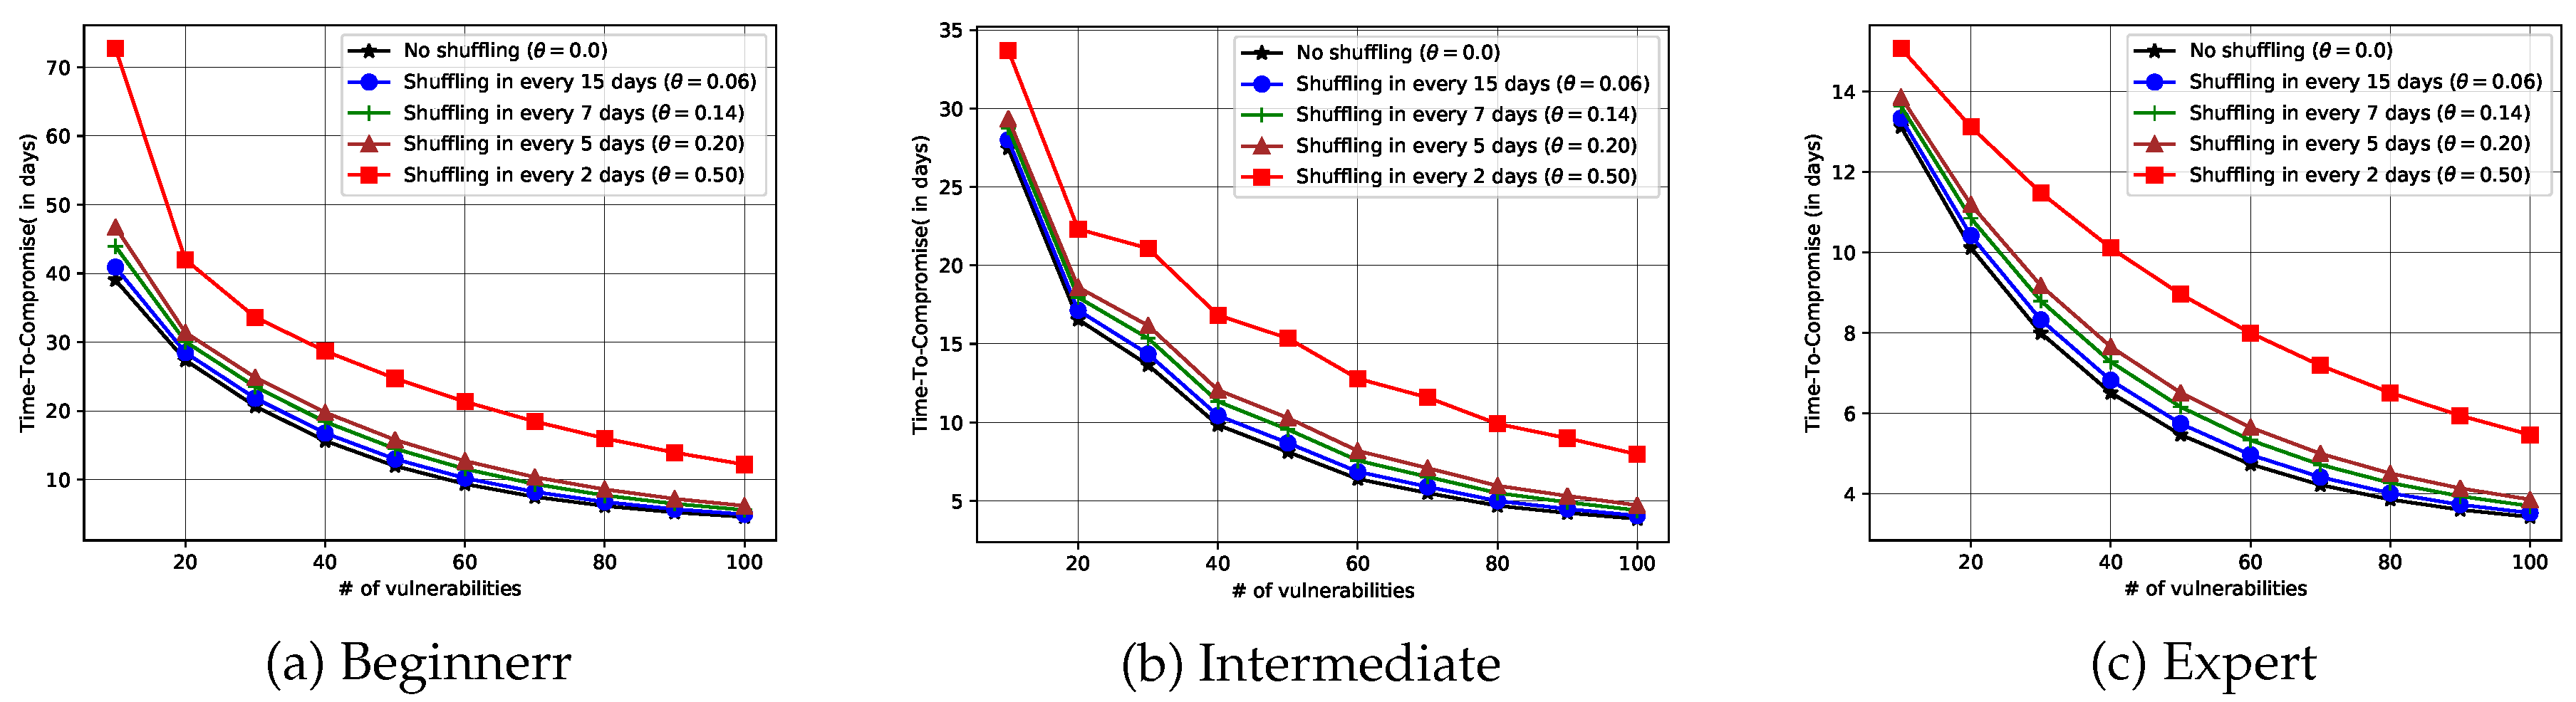
Figure 3.
Performance comparison of MTD mechanisms with time-to-compromise metrics with different attacker skill levels varying shuffling rate: (a) Minimum time-to-compromise (MinTTC), (b) Mean time-to-compromise (MTTC), and (c) Maximum time-to-compromise (MaxTTC).
Figure 3.
Performance comparison of MTD mechanisms with time-to-compromise metrics with different attacker skill levels varying shuffling rate: (a) Minimum time-to-compromise (MinTTC), (b) Mean time-to-compromise (MTTC), and (c) Maximum time-to-compromise (MaxTTC).
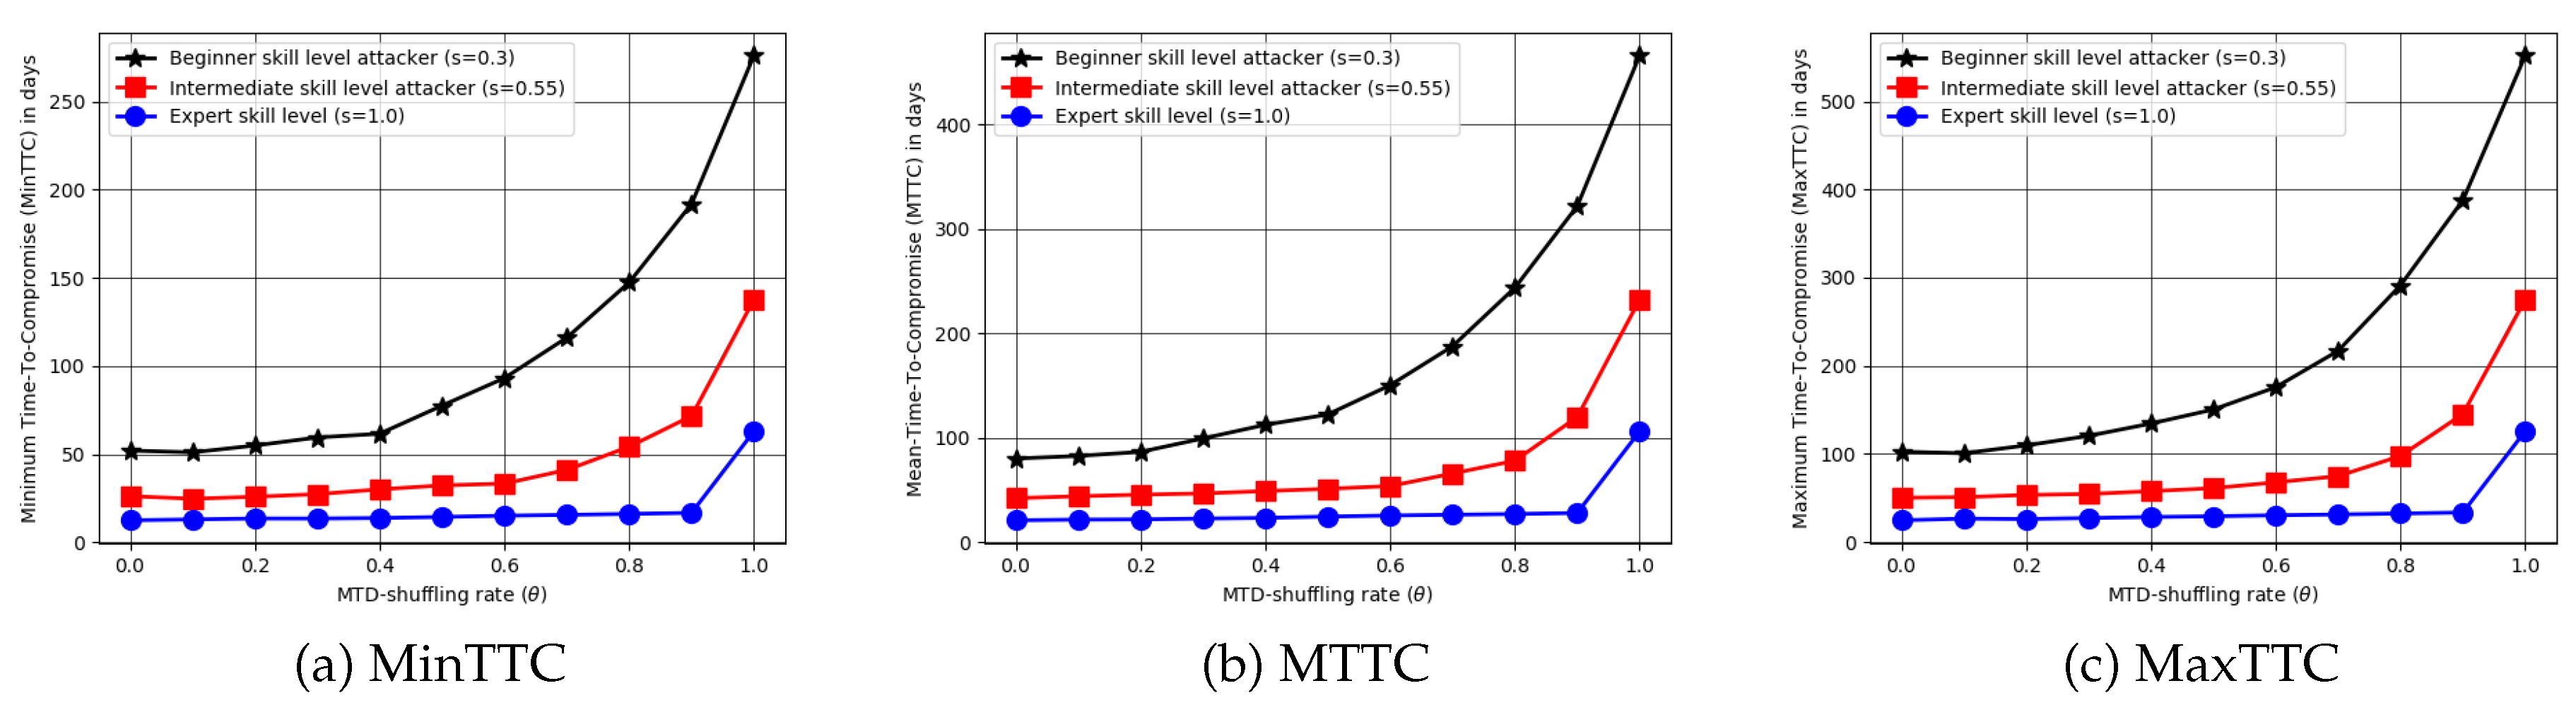
Figure 4.
Comparing time-to-compromise metrics (MinTTC, MTTC, and MaxTTC) for different attackers.
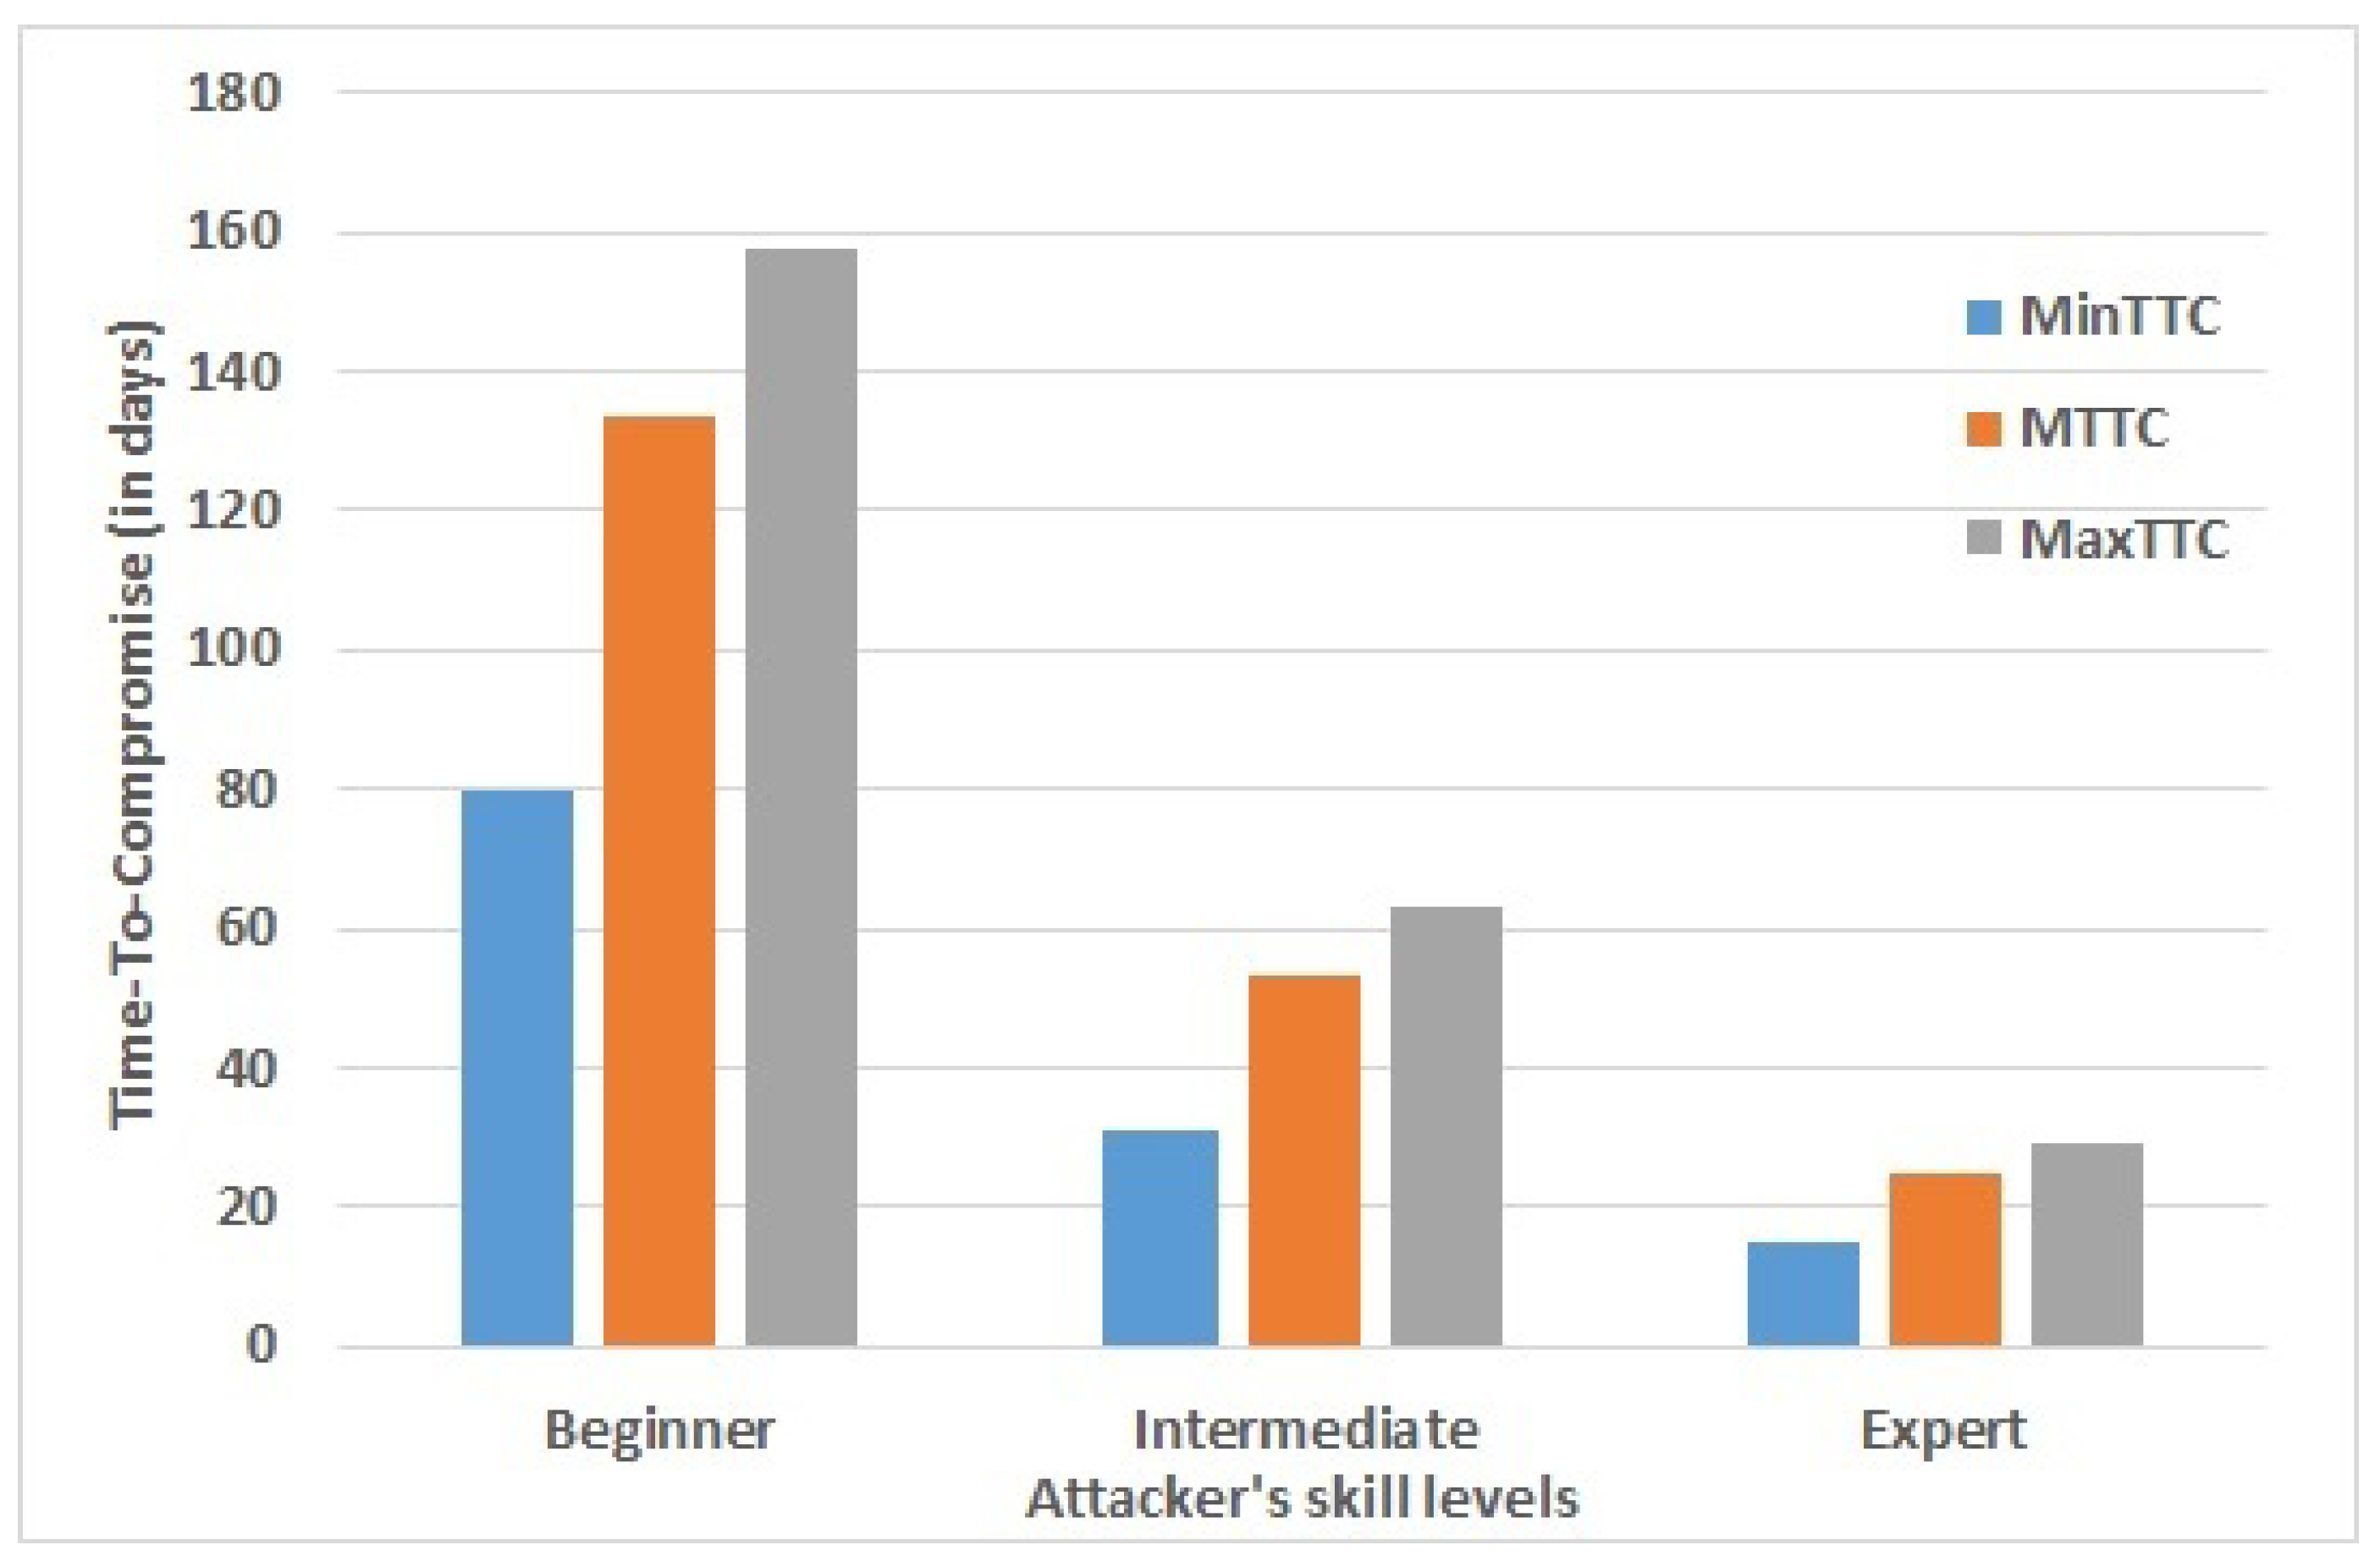
Figure 5.
Evaluation of effectiveness of MTD methods with security risk reduction percentage (SRRP) metric with different shuffling rates for different attacker skill levels.
Figure 5.
Evaluation of effectiveness of MTD methods with security risk reduction percentage (SRRP) metric with different shuffling rates for different attacker skill levels.
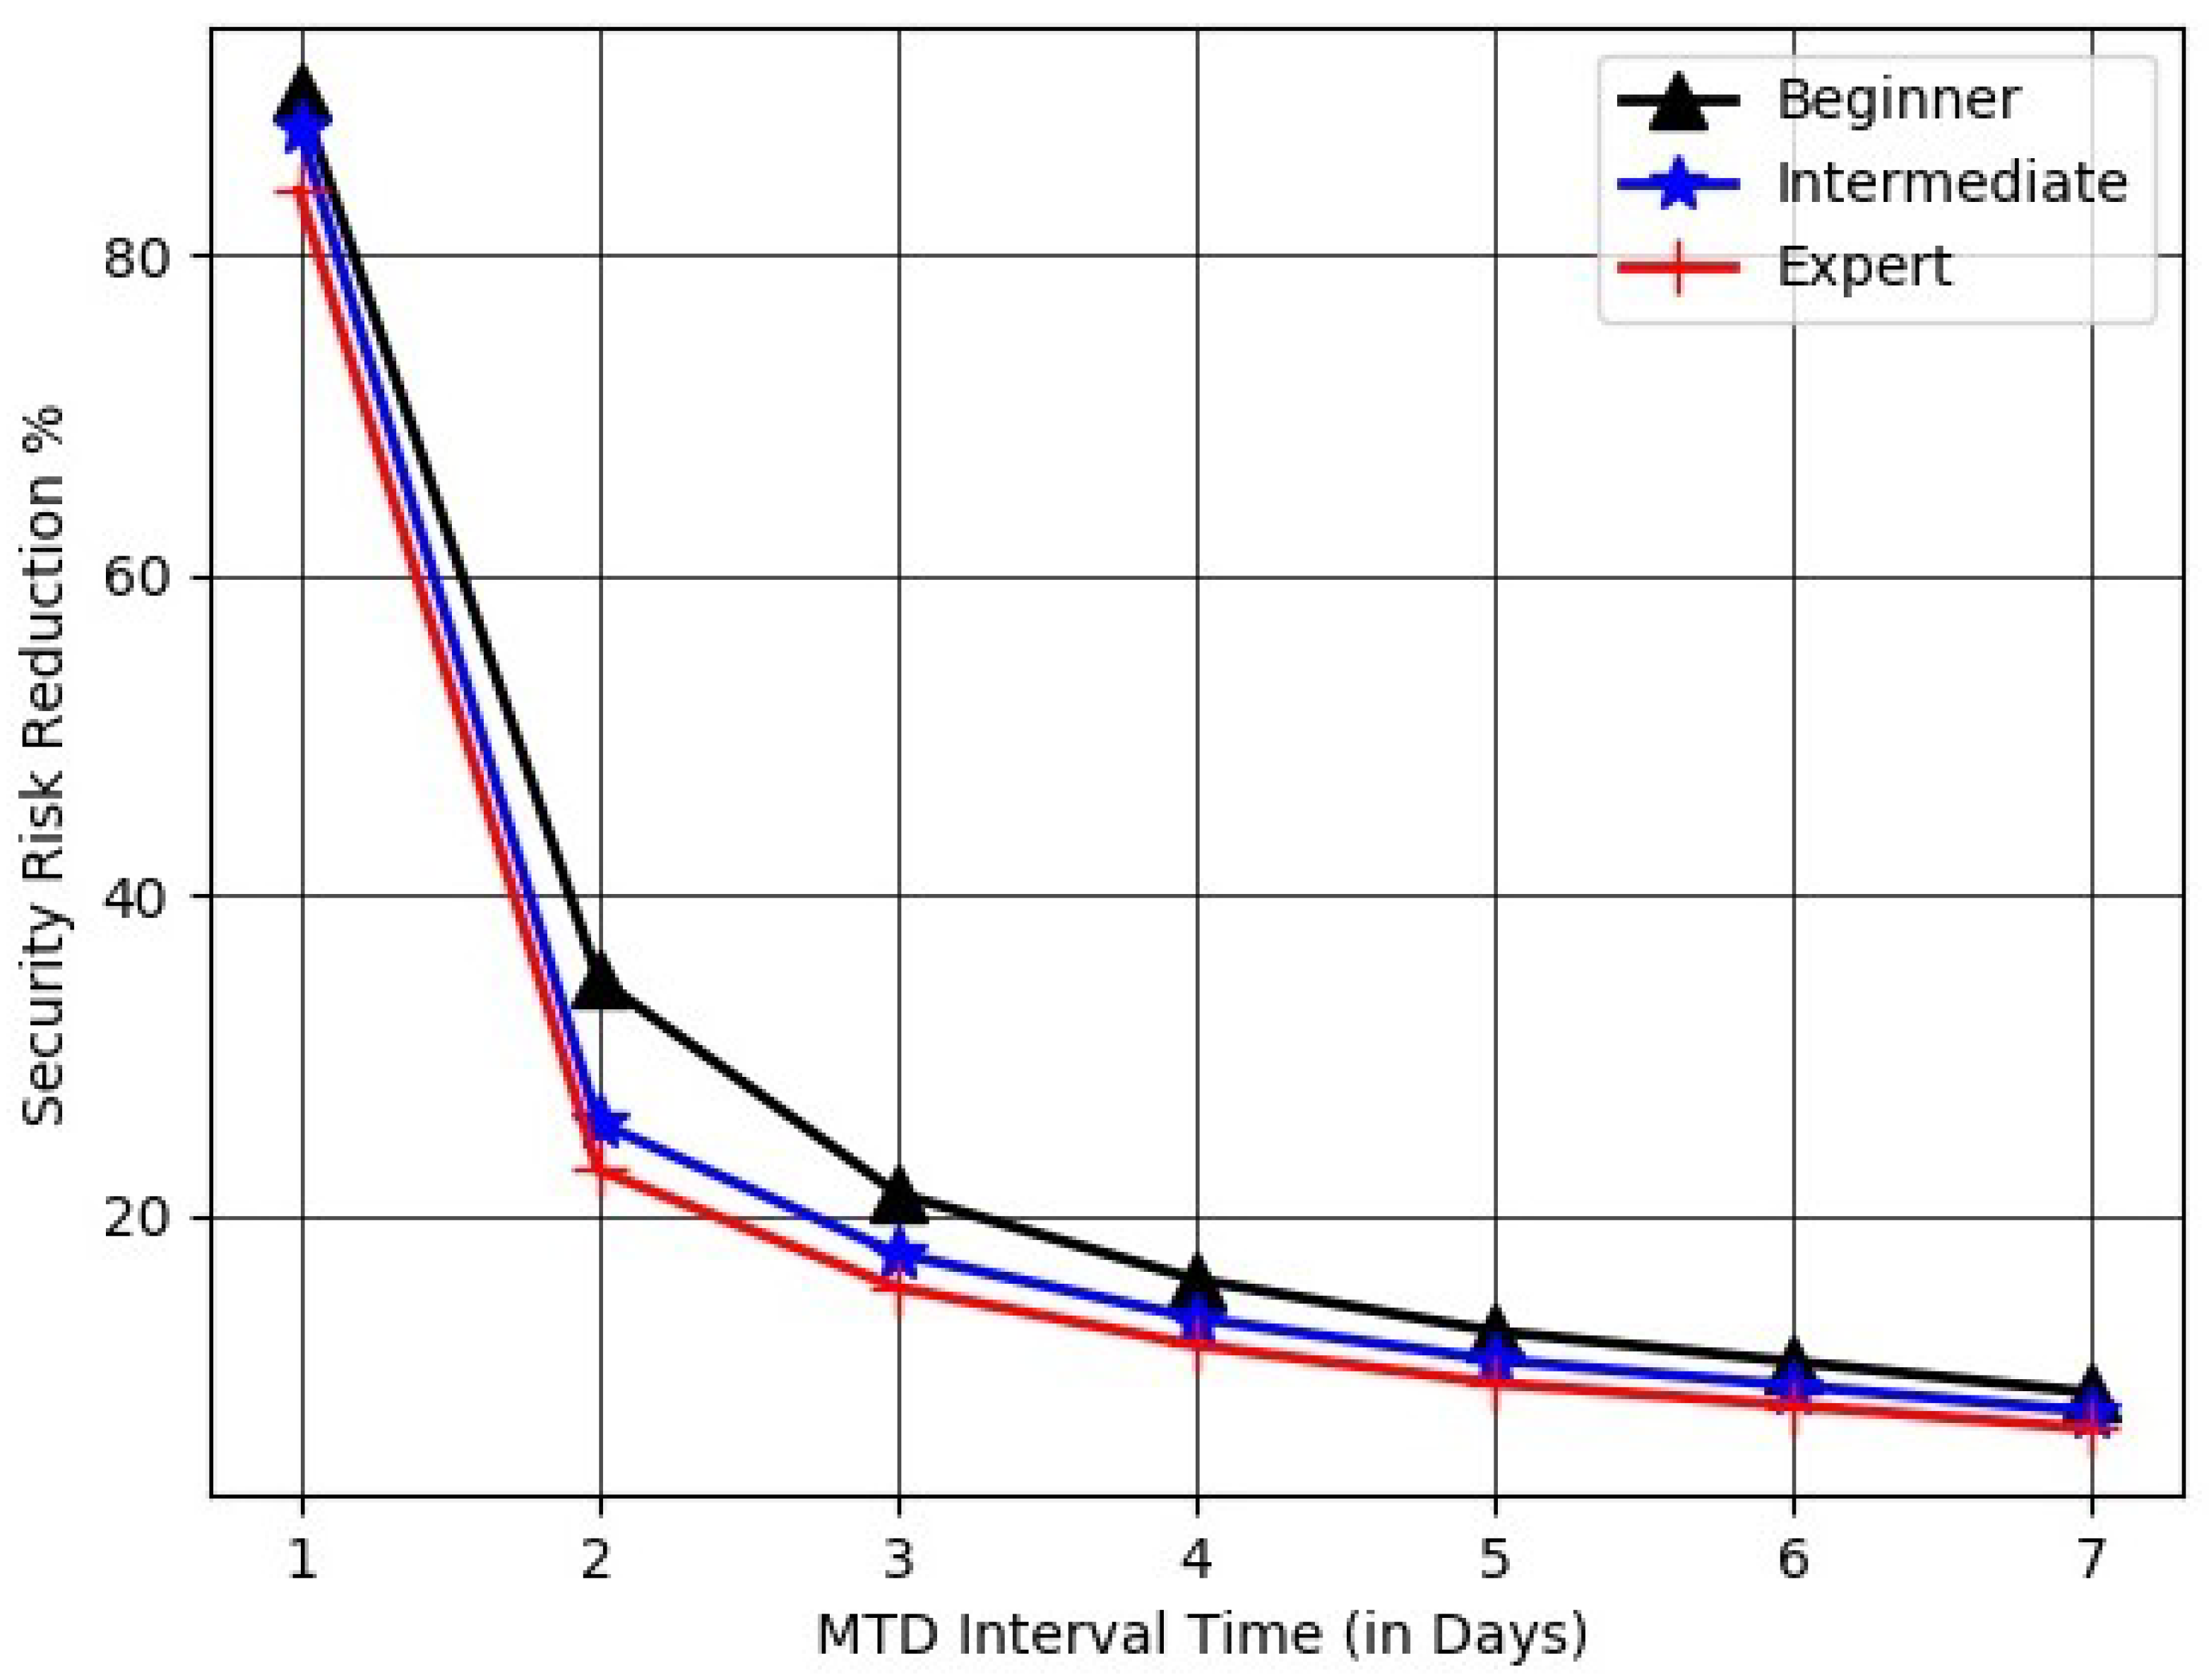

Table 1.
Vulnerabilities in IoT devices with CVE IDs, and CVSS score & description
| Device type | Brand/Model | CVE ID | CVSS score | Description |
|---|---|---|---|---|
| Smart TV | LG WebOS | CVE-2023-6317 | 9.8 | Remote command execution |
| Smart door lock | Suleve 5-in-1 Smart Door Lock v1.0 | CVE-2023-39843 | 2.4 | Missing encryption |
| Smart speaker | Sonos Era 100 | CVE-2024-5269 | 8.8 | Use-after-free remote code execution |
| Smartphone | Android Devices | CVE-2023-40088 | 8.8 | Memory corruption |
| Security Camera | Wyze Cam | CVE-2019-9564 | 9.8 | Bypass login and control the devices |
| Smart Meter | Siemens 7KT PAC1200 | CVE-2017-9944 | 8.8 | Authentication bypass |
| Smart Thermostat | Ecobee3 lite | CVE-2021-27954 | 8.5 | Buffer-overflow |
| Smart Plug | WSP080 v1.2 lite | CVE-2023-33768 | 6.5 | Incorrect signature verification |
Disclaimer/Publisher’s Note: The statements, opinions and data contained in all publications are solely those of the individual author(s) and contributor(s) and not of MDPI and/or the editor(s). MDPI and/or the editor(s) disclaim responsibility for any injury to people or property resulting from any ideas, methods, instructions or products referred to in the content. |
© 2025 by the author. Licensee MDPI, Basel, Switzerland. This article is an open access article distributed under the terms and conditions of the Creative Commons Attribution (CC BY) license (http://creativecommons.org/licenses/by/4.0/).
Copyright: This open access article is published under a Creative Commons CC BY 4.0 license, which permit the free download, distribution, and reuse, provided that the author and preprint are cited in any reuse.


