Submitted:
22 April 2025
Posted:
23 April 2025
You are already at the latest version
Abstract
Background/Objectives: This study evaluated the relationship between baseline TSH levels and mortality, micro- and macrovascular complications during a three-year follow-up in T2DR patients with T2DM for at least 5 years. Methods: This single-center, retrospective cohort study included 363 euthyroid adult patients with T2DM and diabetic retinopathy in 2019. Patients were divided into three tertiles according to TSH levels (Group 1: 0.35–1.24 mIU/L, Group 2: 1.24–1.94 mIU/L, Group 3: 1.94–4.50 mIU/L) and followed for three years. Clinical outcomes were compared; multivariable logistic regression and nonlinear models were used for one-year mortality and complication risks. Results: At the end of the first year, mortality and mortality + microvascular complication rates were significantly higher in Group 1 compared to Group 2 (p = 0.025 and p = 0.041). Group 2 showed a lower risk for both outcomes (OR for mortality = 0.349, p = 0.004; OR for combined outcome = 0.358, p = 0.007). There was an inverted U-shaped non-linear relationship between TSH and mortality risk, with the lowest risk at ~2.0 mIU/L. Conclusions: Our findings indicate that, even within the normal reference range, TSH levels may influence outcomes in euthyroid T2DR patients with a ≥5-year T2DM history. Patients with TSH < 1.24 mIU/L had higher one-year mortality and microvascular complication rates, while the lowest risk was observed in those with TSH between 1.24–1.94 mIU/L. This range may represent a potential target for safer TSH levels, and closer monitoring may be warranted in patients with lower values.
Keywords:
Thyrotropin (TSH)
; type 2 diabetes mellitus
; diabetic retinopathy
; microvascular complications
; all-cause mortality
1. Introduction
Type 2 diabetes mellitus (T2DM) and thyroid disorders are among the most common endocrine diseases in the general population [1].
The progressive destruction of pancreatic β-cells and insulin resistance play a key role in the pathogenesis of T2DM. According to the International Diabetes Federation Diabetes Atlas, the global prevalence of T2DM is projected to reach 578 million by 2030 and 700 million by 2045 [2,3]. The coexistence of thyroid dysfunction and T2DM is frequently observed in the general population [4]. A systematic review and meta-analysis of studies conducted between 2000 and 2022 investigating the prevalence of thyroid dysfunction among patients with T2DM reported this coexistence to be approximately 20% [5].
The coexistence of thyroid dysfunction and T2DM is attributed to the widespread presence of thyroid hormone receptors throughout the body, particularly the alpha and beta isoforms. Notably, thyroid hormone receptor beta (THRβ) plays a significant role in T2DM by regulating lipid metabolism and gluconeogenesis in the liver and insulin secretion and glucose homeostasis in the pancreas [6,7].
Thyroid hormones are believed to contribute to the development and progression of both macrovascular and microvascular complications of diabetes. This influence occurs through two types of thyroid hormone receptors: thyroid hormone receptor alpha (THRα) and THRβ. THRα is predominantly found in the cardiovascular and nervous systems, while THRβ is primarily located in the retina and is also present in the kidneys [8].
Studies have determined risk factors associated with macro- and microvascular complications and mortality in T2DM patients [9]. Among these risk factors, no information on thyroid-stimulating hormone (TSH) concentrations in the blood has been reported. The available literature includes studies mentioning that the presence of thyroid dysfunction in T2DM patients affects macro- and microvascular complications of diabetes, morbidity, and mortality [5].
Diabetic retinopathy (DR) is one of the most common microvascular complications in T2DM patients and is the leading cause of diabetes-related vision loss [10]. This complication occurs as a result of multicomponent pathophysiological processes, including increased capillary permeability, abnormal vascular proliferation, retinal edema, and ischemia due to persistent hyperglycemia. In particular, previous studies have shown that vascular endothelial growth factor, which is expressed secondary to decreased retinal capillary perfusion, plays a central role in the pathogenesis of DR [11]. A study conducted in 2025 showed that disruptions in tyrosine metabolism may also play a role in the pathogenesis of DR, and L-tyrosine levels may be used as a predictive biomarker in patients with T2DM [10]. Another endocrine marker that may affect the clinical course of DR is likely to be thyroid hormones, since they determine the structural and functional integrity of the retina. This is because triiodothyronine (T3) is involved in retinal development and maturation of photoreceptor cells, and through thyroid hormone receptors (especially TRβ1 and TRβ2), it is effective in the differentiation of cone cell subtypes and regulation of opsin gene expression [12]. Therefore, it is thought that alterations in thyroid function may have clinical consequences not only at the systemic level but also at the retinal level. However, the potential effects of thyroid function on disease-related prognosis are still not fully understood, highlighting the need for further research in this area. Moreover, there are insufficient studies on the impact of different TSH levels on the development of macro- and other microvascular complications (microvascular complications) or mortality in euthyroid type 2 diabetic retinopathy (T2DR) patients and their relationship with time.
This study aimed to determine the safer and riskier TSH ranges regarding mortality or complications during a 3-year follow-up by dividing TSH levels measured at admission into three tertiles in euthyroid T2DR patients.
2. Materials and Methods
2.1. Study Design and Participants
This study was designed as a single-center, retrospective investigation. Between January 1, 2019, and December 31, 2019, 363 patients over the age of 18 with a T2DR diagnosis, followed up at our hospital's endocrinology outpatient clinic with a Type 2 diabetes mellitus diagnosis for at least 5 years, were included in the study.
The inclusion criteria for the study were as follows: being 18 years of age or older; having a diagnosis of T2DM for at least five years based on the American Diabetes Association (ADA) criteria; having a confirmed diagnosis of diabetic retinopathy; and having TSH levels within the euthyroid reference range (0.35–4.5 mU/mL) [13].
The exclusion criteria were as follows: being under 18 years of age; having a TSH level outside the euthyroid reference range defined by the Turkish Society of Endocrinology and Metabolism (TEMD); having one of the microvascular complications of T2DM other than diabetic retinopathy (i.e., diabetic neuropathy or diabetic nephropathy) at the time of enrollment; having any macrovascular complication of T2DM, including cardiovascular diseases; current or previous levothyroxine replacement therapy; a history of hypothalamic or pituitary disease; having a comorbid condition unrelated to T2DM but known to affect mortality (e.g., cancer, chronic obstructive pulmonary disease, autoimmune diseases, chronic liver diseases, or neurodegenerative disorders); use of medications that may affect thyroid function; pregnancy; or lactation.
Demographic data, laboratory test results, medical history, and physical examination findings of the patients included in the study were obtained from the hospital automation system. Demographic characteristics included age, gender, and smoking status of the patients. The diagnosis of DR was confirmed based on EURETINA guidelines, and the diagnosis of T2DM was confirmed based on the American Diabetes Association's 2019 criteria [14,15]. Patients' medical history, duration of diabetes (≥5 years), diagnosis and duration of hypertension, and insulin use status were taken into consideration. The diagnosis of hypertension was defined as systolic blood pressure ≥140 mmHg, diastolic blood pressure ≥90 mmHg, or use of antihypertensive medication [16]. All laboratory parameters in the study were evaluated by the Biochemistry Laboratory of our hospital using automatic analyzers.
2.2. Ethical Approval
The study was approved by our university's Ethics Committee of the Faculty of Medicine (Protocol Code: TÜTF-GÖBAEK 2024/42; Date: 19 February 2024). All procedures were conducted in accordance with the Declaration of Helsinki and its later amendments.
2.3. TSH Groups
The patients included in the study were divided into three equal groups based on their TSH levels. After sorting the TSH values in ascending order, the sample was stratified into tertiles to ensure equal group sizes. Accordingly:
• patients with TSH levels between 0.35 ≤ TSH < 1.24 mIU/L were assigned to Group 1 (n = 120),
• those with 1.24 ≤ TSH ≤ 1.94 mIU/L were assigned to Group 2 (n = 122), and
• those with 1.94 < TSH ≤ 4.50 mIU/L were included in Group 3 (n = 121).
This classification was designed to ensure balanced sample sizes across groups, enable a more detailed assessment of the effect of TSH levels on euthyroid T2DR patients, and identify potential risk thresholds.
2.4. Statistical Analysis
The normality of the distribution of quantitative variables was assessed using the Shapiro–Wilk test. Descriptive statistics for normally distributed quantitative demographic and clinical data were presented as mean ± standard deviation, while non-normally distributed data were expressed as median (minimum–maximum). Descriptive statistics for categorical variables were reported as frequency and percentage (%).
Patients were divided into three groups based on TSH tertile values. The distribution of TSH levels across these tertile groups was visualized using box plots displaying the median, interquartile range, minimum, and maximum values.
For comparisons of quantitative variables among groups. One-way ANOVA was used for normally distributed data, while the Kruskal–Wallis test was applied for non-normally distributed data. Categorical variables were compared using the Chi-square test. Bonferroni correction was applied for multiple testing in pairwise comparisons.
Binary logistic regression analysis was performed to evaluate the independent effect of TSH groups on one-year mortality and one-year mortality plus microvascular complications. TSH group (Group 1, Group 2, Group 3), age, gender, smoking status, and insulin use were included as independent variables in the model. The results were reported as odds ratios (OR) with 95% confidence intervals (CI). The overall significance of the model was assessed using the Omnibus test, and model fit was evaluated with the Hosmer–Lemeshow goodness-of-fit test.
To examine a potential non-linear (inverted U-shaped) relationship between TSH levels and first-year mortality, a separate logistic regression model was constructed that included both linear (TSH) and quadratic (TSH²) terms. Age, gender, insulin use, and smoking status were entered as covariates. The independent effects of all variables on one-year mortality were evaluated accordingly.
A non-linear logistic regression model was constructed SPSS 20.0 software (IBM SPSS Statistics for Windows, Version 20.0, Armonk, NY, USA). The predicted proba-bility curve of mortality risk across TSH levels was visualized using Python 3.10 with the statsmodels and matplotlib libraries (Figure 2).
A p-value of <0.05 was considered the threshold for statistical significance. All analyses were performed using SPSS 20.0 software (IBM SPSS Statistics for Windows, Version 20.0, Armonk, NY, USA).
3. Results
The demographic and clinical characteristics of the patients are shown in Table 1. The mean age of the patients was 62.9 ± 9.3 years, and 39.9% were female.

Table 1.
Demographic and clinical characteristics of the patients.
| N=363 | |
|---|---|
| Age, years | 62.9 ± 9.3 |
| Gender, female | 145 (39.9) |
| Insulin therapy, yes | 255 (70.2) |
| HT, yes | 342 (94.2) |
| Sigara ≥ 20 Paket/yıl | 187 (51.5) |
Mean ± standard deviation or n (%); HT, hypertension.
Figure 1.
Distribution of TSH values across tertile groups.
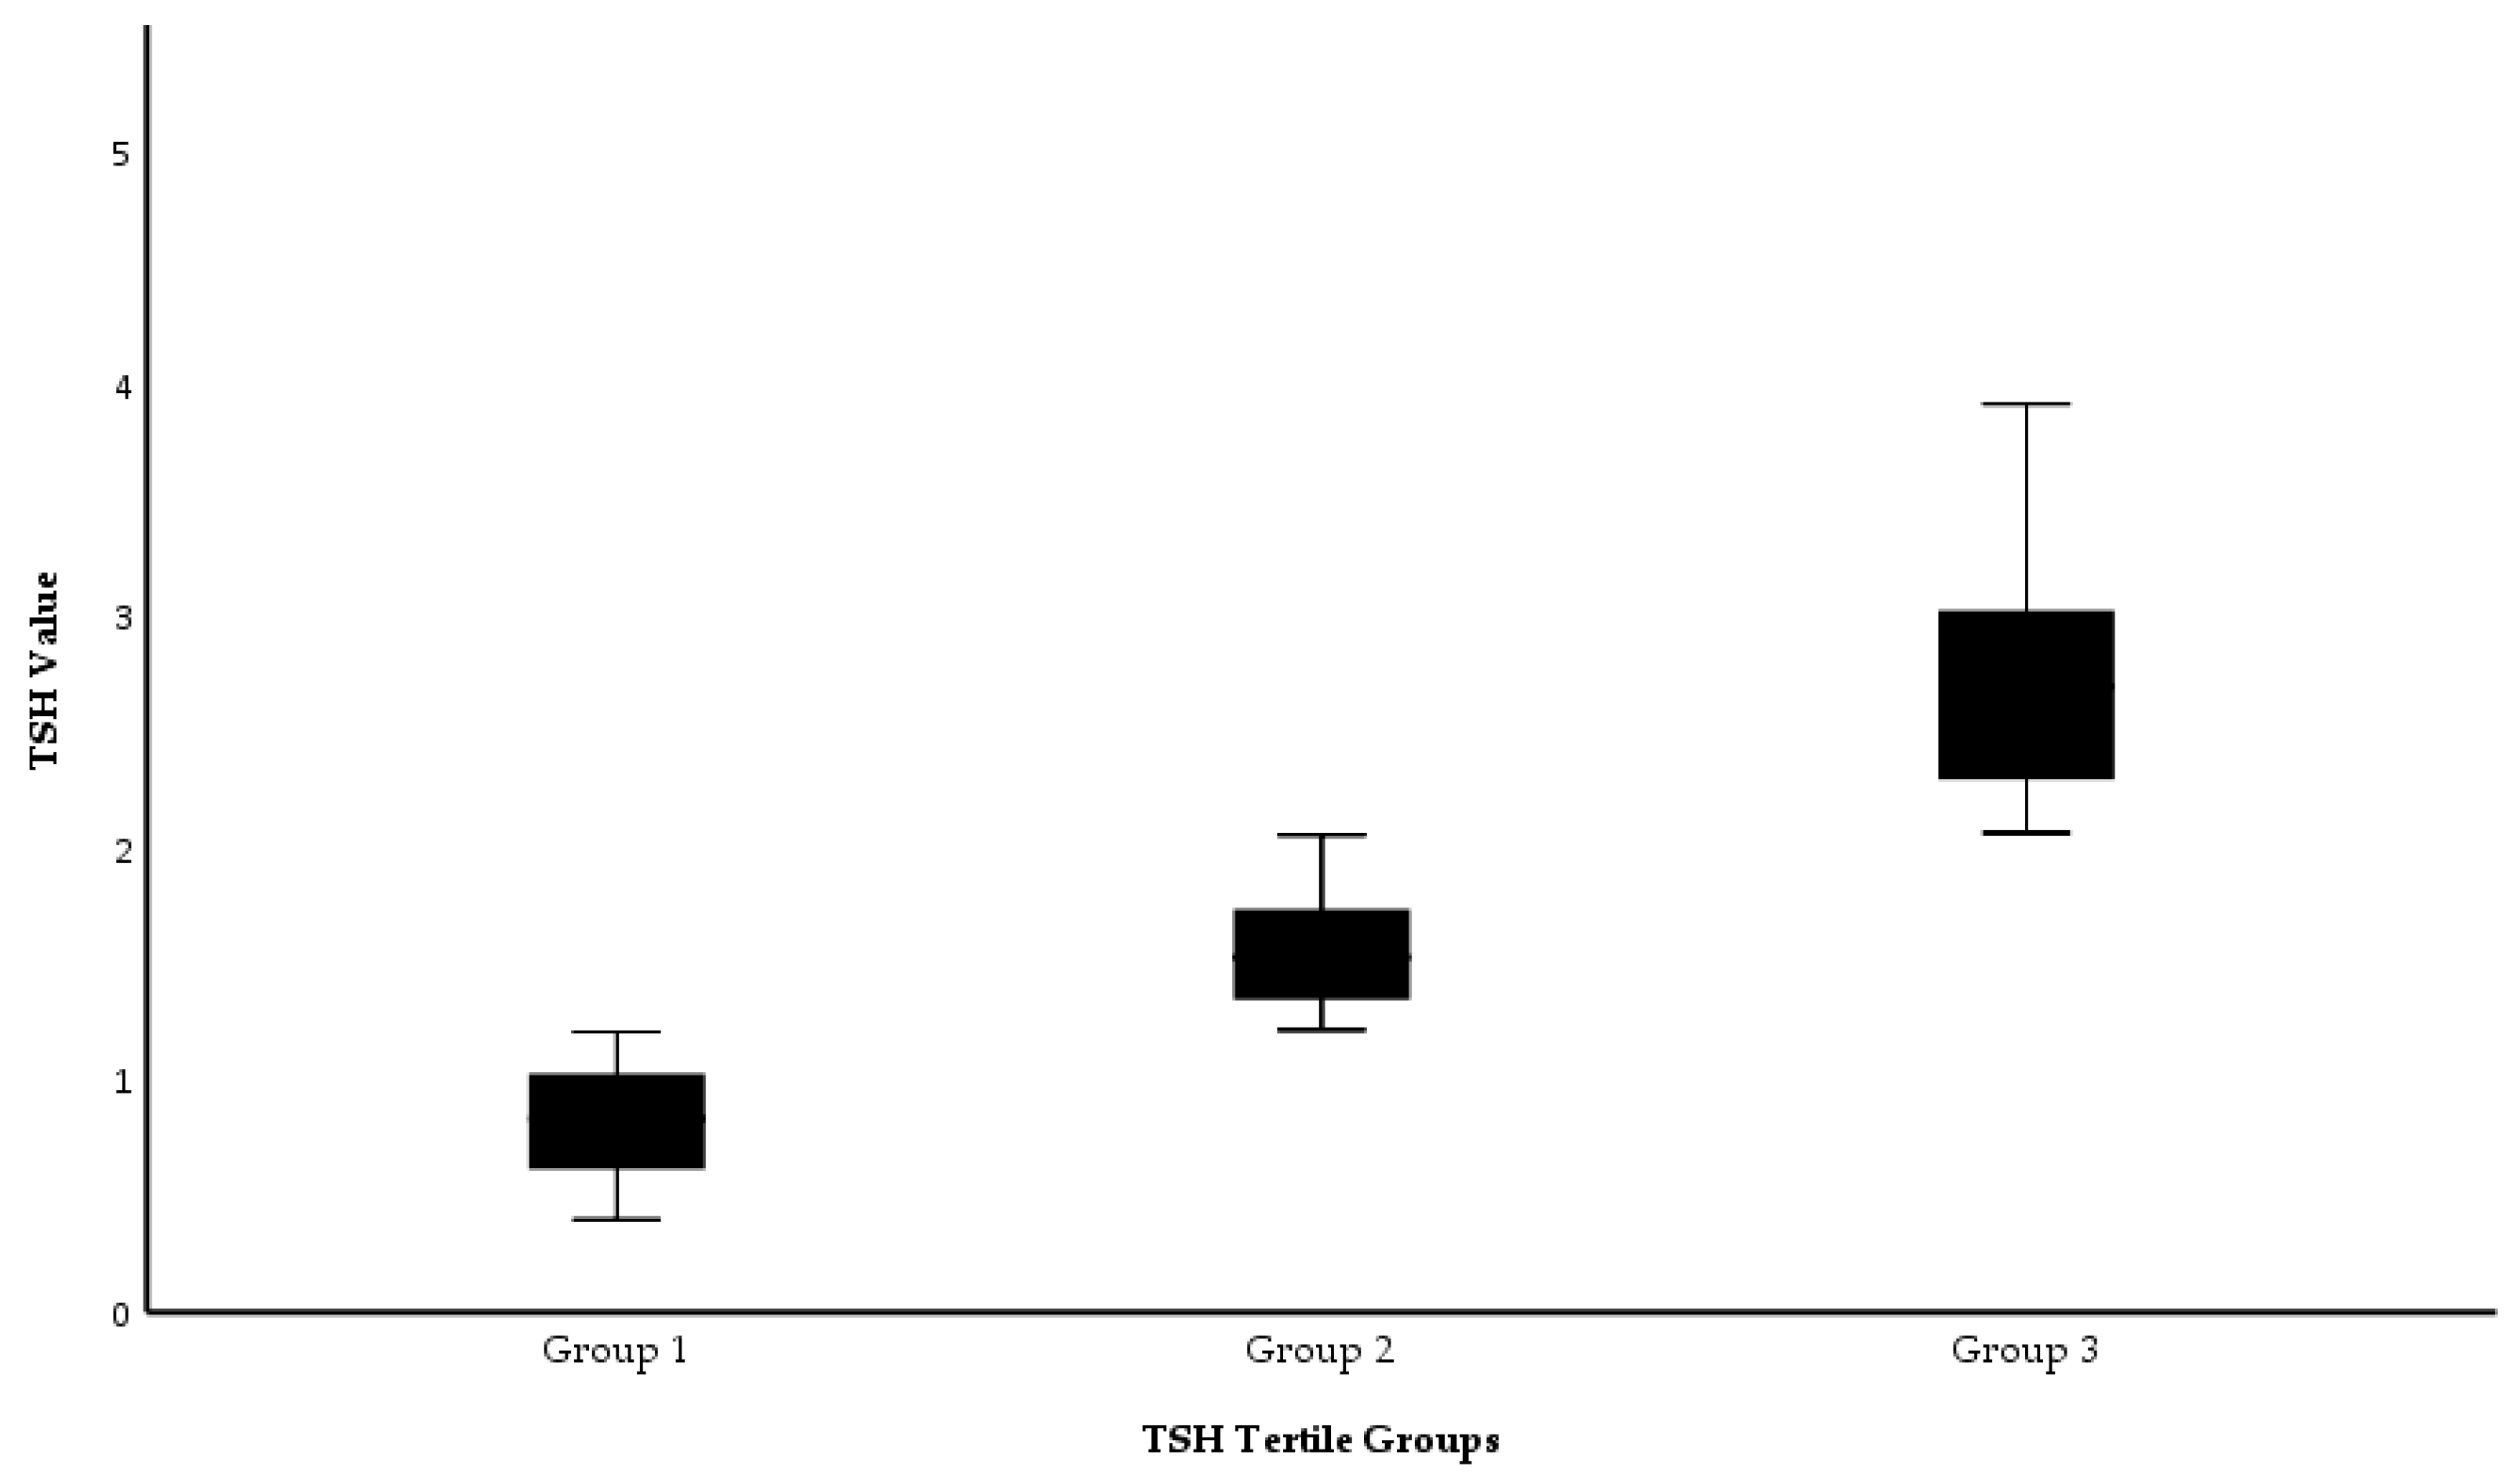
The distribution of TSH values in tertile groups of the patients, divided into 3 tertile groups according to TSH values, is shown in Figure 1.
The comparison of demographic and clinical characteristics of the patients according to TSH tertiles is presented in Table 2. A statistically significant difference was observed in free thyroxine (FT4) levels among the groups (p = 0.023); this difference was attributed to higher FT4 levels in the first tertile group compared to the third tertile group (p = 0.018, Bonferroni correction). No other significant differences were found among the tertile groups (p > 0.05).
Comparison of mortality and complication values of the patients at one and three years is presented in Table 3. At one year, there was a significant difference in mortality between the groups (p = 0.025); this difference was due to the higher mortality rate in the first tertile group compared to the second tertile group. Similarly, there was a significant difference in mortality + microvascular complications between the groups (p = 0.041); this difference was again due to higher rates in the first tertile group compared to the second tertile. For the other variables, there was no significant difference between tertile groups (p > 0.05).
The effects of TSH groups on one-year mortality and one-year mortality + microvascular complications were evaluated using multivariate logistic regression analysis, as presented in Table 4. According to the results, TSH groups had a statistically significant impact on both one-year mortality and one-year mortality + microvascular complications (p = 0.015 and p = 0.026, respectively).
Patients in TSH Group 2 had a lower mortality risk than those in Group 1 (B = -1.053, p = 0.004, OR = 0.349, 95% CI: 0.195–0.778). This group also demonstrated a protective effect against the combined outcome of mortality + microvascular complications (B = -1.027, p = 0.007, OR = 0.358, 95% CI: 0.169–0.759). In contrast, no significant association was found between TSH Group 3 (1.94–4.50 mIU/L) and either mortality or the development of microvascular complications (Mortality: B = -0.319, p = 0.323; Mortality + Microvascular Complications: B = 0.251, p = 0.453).
Age was identified as the strongest independent predictor for both mortality (B = 0.054, p = 0.001, OR = 1.056, 95% CI: 1.020–1.089) and mortality + microvascular complications (B = 0.046, p = 0.005, OR = 1.047, 95% CI: 1.014–1.081). Gender, smoking status, and insulin use were not found to be significantly associated with mortality or microvascular complications (p > 0.05). The overall significance of the models was confirmed by the Omnibus test (p = 0.001 and p = 0.005, respectively), and the goodness-of-fit was evaluated as acceptable based on the Hosmer–Lemeshow test (p = 0.543 and p = 0.406, respectively). In conclusion, Group 2 patients with intermediate TSH levels had a lower risk of 1-year mortality and microvascular complications, while age was the most critical risk factor.
The results of the multivariate logistic regression analysis are summarized in Table 4.
Table 4.
Effects of TSH tertiles and other covariates on first-year mortality and combined mortality + microvascular complications (multivariate logistic regression).
Table 4.
Effects of TSH tertiles and other covariates on first-year mortality and combined mortality + microvascular complications (multivariate logistic regression).
| Mortality Beta (B) | Mortality p-value (Sig.) | Mortality + Microvascular Complications Beta (B) | Mortality + Microvascular Complications p-value (Sig.) | |
|---|---|---|---|---|
| TSH percentile group (overall effect) | - | 0,015 | - | 0,026 |
| TSH group 2 | -1,053 | 0,004 | -1,027 | 0,007 |
| TSH group 3 | -0,319 | 0,323 | 0,251 | 0,453 |
| Gender, female | 0,358 | 0,294 | 0,454 | 0,198 |
| Age, years | 0,054 | 0,001 | 0,046 | 0,005 |
| Smoking ≥20 pack-years, yes | -0,421 | 0,218 | -0,362 | 0,306 |
| Insulin therapy, yes | -0,201 | 0,517 | 0,232 | 0,477 |
| Constant | -4,467 | 0,000 | -4,414 | 0,000 |
B, unstandardized beta; mIU/L, milli-international units per liter.
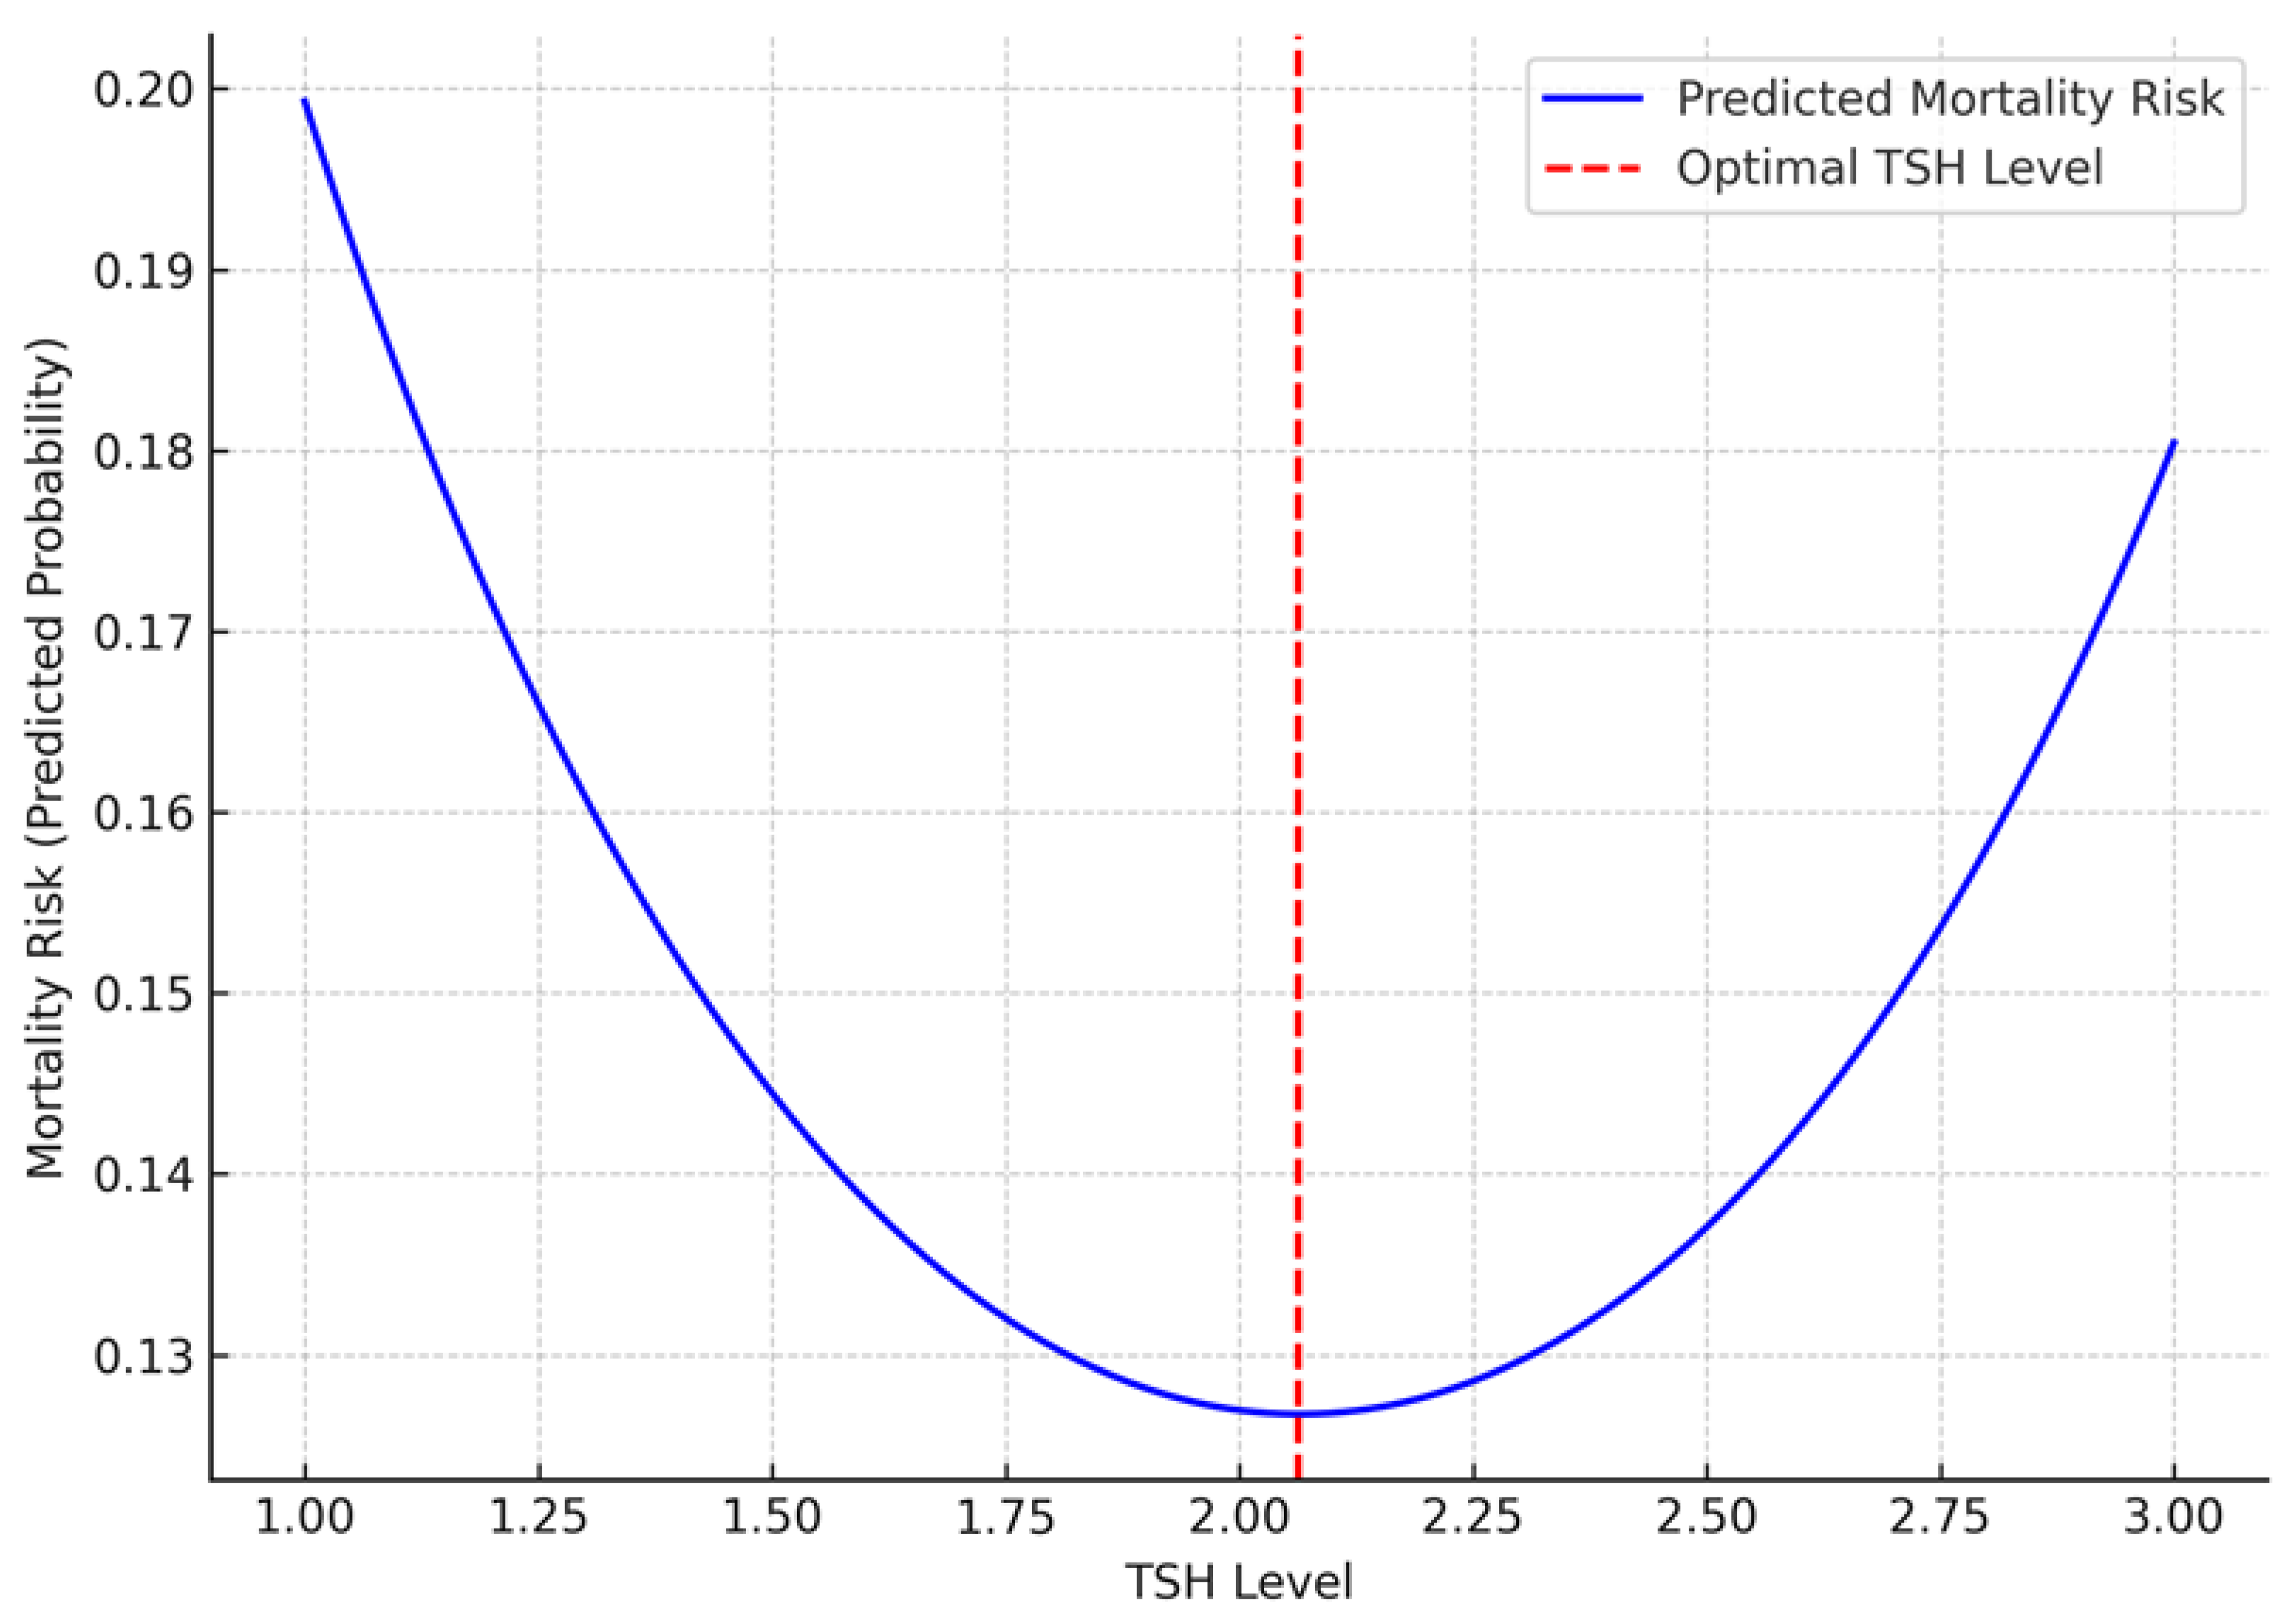
In the non-linear logistic regression analysis, the linear coefficient of TSH was negative (B = -2.094, p = 0.002), while the quadratic term (TSH²) was positive (B = 0.512, p = 0.002). These findings support a non-linear, inverted U-shaped relationship between TSH levels and one-year mortality (Table 5). This relationship is visualized in Figure 2. Accordingly, the mortality risk was higher at lower TSH levels, decreased at intermediate levels, and increased again at higher levels.
Table 5.
Independent effects of TSH, TSH², and clinical covariates on first-year mortality (nonlinear logistic regression model).
Table 5.
Independent effects of TSH, TSH², and clinical covariates on first-year mortality (nonlinear logistic regression model).
| Variable | Beta (B) | p-Value (Sig.) | |
| TSH² | 0.512 | 0.002 | |
| TSH | -2.094 | 0.002 | |
| Age, years | 0.054 | 0.001 | |
| Insulin therapy, yes | 0.189 | 0.541 | |
| Gender, female | 0.269 | 0.428 | |
| Smoking ≥20 pack-years, yes | -0.321 | 0.345 |
B, unstandardized regression coefficient; DM, diabetes mellitus. TSH²: quadratic term of TSH.
Figure 2.
Inverse U-shaped relationship between TSH levels and one-year mortality risk, X-axis: TSH Levels; Y-axis: Mortality Risk (Predicted Probability); Blue Line: Predicted mortality risk across TSH levels; Red Dashed Line: Optimal TSH level where mortality risk is lowest.
Figure 2.
Inverse U-shaped relationship between TSH levels and one-year mortality risk, X-axis: TSH Levels; Y-axis: Mortality Risk (Predicted Probability); Blue Line: Predicted mortality risk across TSH levels; Red Dashed Line: Optimal TSH level where mortality risk is lowest.
4. Discussion
This study aimed to evaluate the relationship between TSH levels and the risk of mortality, microvascular, and macrovascular complications over a three-year follow-up period in euthyroid individuals with DR who had been diagnosed with T2DM for at least five years. Patients were grouped based on their TSH levels, and their clinical outcomes, specifically mortality and complications, were analyzed at both the first and third years of follow-up. The results from these two time points were compared to assess the clinical trajectories associated with different TSH levels.
Our findings revealed significant differences in first-year mortality and combined mortality + microvascular complications among the TSH tertile groups; notably, Group 1, which included patients with the lowest TSH levels, demonstrated significantly higher rates (Table 2, p = 0.025 and p = 0.041, respectively). These results suggest that even within the euthyroid range, TSH may play a critical role in the clinical prognosis of patients with T2DR. Furthermore, the lowest mortality rates were observed in Group 2, with TSH levels ranging from 1.24 to 1.94 mIU/L (inclusive). This may indicate that this range represents a safer threshold regarding metabolic stability and vascular integrity. In contrast, although Group 3 (TSH 1.94–4.50 mIU/L) exhibited higher mortality rates compared to Group 2, the difference was not statistically significant. These results demonstrate a non-linear (inverted U-shaped) relationship between TSH levels and clinical outcomes, highlighting the potential prognostic significance of maintaining TSH within an optimal range, even in euthyroid patients with T2DR.
In addition, patients in the lowest TSH tertile (Group 1) were found to have significantly higher FT4 levels compared to those in the highest TSH tertile (Group 3).
T2DM and thyroid disorders are among the most common endocrinopathies in the general population. Due to the presence of metabolic symptoms and complications in both conditions, their potential interactions have attracted increasing attention in the literature [17,18]. Thyroid hormones exert their physiological effects through thyroid hormone receptors (THRs) located in several vital organs, particularly the liver, pancreas, intestines, and cardiovascular system. These receptors are classified into THRα (including isoforms THRα1 and THRα2) and THRβ (including THRβ1 and THRβ2), and they play critical roles in regulating systemic metabolism [19,20]. In particular, THR-mediated effects on the liver and pancreas support the role of thyroid hormones in the pathophysiology of T2DM [21].
T3, the biologically active form of thyroid hormone, binds to thyroid hormone receptors (THRs) with a higher affinity than thyroxine (T4), exerting more potent physiological effects. However, T4 is the predominant form circulating in the bloodstream, where it is bound to carrier proteins such as albumin, thyroxine-binding globulin (TBG), and transthyretin. This binding system helps maintain FT4 levels within a homeostatic range. Both FT4 and T3 are transported from the circulation into hepatocytes primarily via monocarboxylate transporter 8 (MCT8) and organic anion transporting polypeptide 1B1 (OATP1B1) [22,23,24]. Intracellularly, T4 is converted into its active form, T3, by deiodinase 1 (DIO1) and deiodinase 2 (DIO2), while deiodinase 3 (DIO3) inactivates T4 to 3,3′,5′-T3 (rT3) and T3 to 3,3′-diiodothyronine (T2), thereby limiting hormonal activity [25]. T3 is known to bind predominantly to the hepatic THRβ1 receptor, where it regulates processes such as glycogenolysis, lipolysis, and mitochondrial energy production, thus playing a critical role in systemic metabolic homeostasis [26].
Thyroid hormones affect the pancreas through THRα and THRβ receptors by modulating insulin and glucagon secretion [24]. The presence of these receptors in pancreatic cells suggests that thyroid hormones may play a role in glycemic control, the progression of T2DM, and the development of its complications [27]. Moreover, the tissue-specific distribution of thyroid hormone receptors further highlights the diverse actions of these hormones across different organ systems [28]. For instance, TRα isoforms are predominantly expressed in the brain, heart, skeletal muscle, and adipose tissue, while the TRβ isoform is primarily found in the liver, heart, and pituitary gland, where it contributes to the regulation of cholesterol metabolism [29].
In the context of DR, one of the most common complications of diabetes, the predominant thyroid hormone receptor in the retina, THRβ, has been shown to be highly expressed, particularly in cone cells. Thyroid hormone signaling through THRβ is thought to play a key role in the development and pathology of the retinal vascular system [30]. This suggests that thyroid hormones may influence not only systemic metabolism but also diabetes-related organ damage, which is consistent with the findings of our study.
Demographic and clinical characteristics of euthyroid T2DR patients in our study revealed that the mean age was 62.9 ± 9.3 years and 39.9% of the patients were female (Table 1). In the current literature, it has been reported that the proportion of women in T2DR patients generally ranges between 38.7% and 45.1% [31,32]. This similarity shows that the gender distribution of our patient population overlaps with the sample groups in the literature.
In a study involving 1024 patients with type 2 diabetes, the most common comorbidities were hypertension and hyperlipidemia, with a rate of 84.9% [33]. In our study, 70.2% of the patients used insulin, and 94.2% had hypertension; these rates were found to be compatible with the literature. Previous studies have also shown that hypertension is common in T2DM patients and is an important risk factor for vascular complications [34].
In addition, concerning smoking, 51.5% of the patients had a smoking history of ≥20 pack-years. This finding is consistent with previous studies reporting that smoking plays a critical role in the progression of microvascular and macrovascular complications of diabetes [35]. These data from our study indicate that comorbidities play an important role during the course of T2DM, and hypertension and smoking are the prominent risk factors.
When demographic and clinical variables were compared among the TSH tertile groups, only a statistically significant difference in FT4 levels was observed (Table 2; p = 0.023). This discrepancy resulted from higher FT4 levels in the first tertile group compared to the third tertile group. This finding may be explained by the negative feedback mechanism of the hypothalamic–pituitary–thyroid axis.
TSH is a glycoprotein hormone secreted by the anterior pituitary gland that stimulates the thyroid gland to produce T3 and T4. Increased circulating FT4 levels may suppress TSH secretion from the pituitary via a negative feedback mechanism.
T2DM is a chronic metabolic disease characterized by persistent hyperglycemia resulting from the inability of the pancreas to produce sufficient insulin, reduced insulin sensitivity in peripheral tissues, or a combination of both mechanisms [36]. Persistent hyperglycemia induces oxidative stress and the production of reactive oxygen species (ROS) through several pathways, including the formation of advanced glycation end-products (AGEs), activation of protein kinase C, mitochondrial dysfunction, and the polyol pathway. The balance between the body’s antioxidant defenses and ROS production becomes disrupted, shifting towards increased ROS levels. Elevated ROS contributes to endothelial dysfunction, vascular inflammation, and vasoconstriction due to impaired nitric oxide release, playing a central role in the pathophysiology of both microvascular and macrovascular complications of T2DM [37].
T2DR is a microangiopathic complication of diabetes in which chronic inflammation and oxidative stress play a key role. Hyperglycemia promotes inflammation through the formation of advanced glycation end-products (AGEs) and activation of nuclear factor kappa B (NF-κB), while also accelerating the consumption of nicotinamide adenine dinucleotide phosphate (NADPH) via the polyol pathway. These processes lead to the accumulation of reactive oxygen species (ROS) and subsequent retinal cell damage. NADPH oxidase (NOX) enzymes further enhance ROS production, exacerbating retinal vascular permeability and neovascularization [38]. Additionally, increased lipid peroxidation, elevated levels of fatty acid binding protein 4 (FABP4), and suppression of the Nrf2–Keap1–ARE (nuclear factor erythroid 2-related factor 2–Kelch-like ECH-associated protein 1–antioxidant response element) signaling pathway—which plays a critical role in regulating cellular antioxidant defenses—further amplify oxidative stress and contribute to the pathogenesis of T2DR [39].
Inflammatory markers have been closely associated with the severity of T2DR. In patients with T2DR, levels of interleukins IL-1β, IL-6, IL-8, IL-17A, and tumor necrosis factor-alpha (TNF-α) have been found to be significantly elevated. In a hyperglycemic environment, the expression of these cytokines has been shown to trigger endothelial dysfunction, increased vascular permeability, and neovascularization [40]. Additionally, activation of the NLRP3 inflammasome pathway and overexpression of thioredoxin-interacting protein (TXNIP) have been reported to accelerate pericyte apoptosis, disrupt retinal vascular integrity, and contribute to the progression of T2DR [41].
TSH is a glycoprotein hormone secreted from the adenohypophysis that regulates the synthesis and release of T3 and T4 by binding to THRs in the thyroid gland [42]. Recently, studies have shown that both TSH levels and subclinical hypothyroidism are associated with T2DR in diabetic patients [43,44]. A cohort study of 1938 participants from the Tehran Thyroid Study group showed a complex relationship between changes in thyroid hormones and T2DM [45].
The results of our study showed an association between mortality and microvascular complications of T2DM + mortality in the short-term follow-up of patients with T2DR (Table 3). Özellikle, en düşük TSH seviyesine sahip Grup 1’de ölüm oranı anlamlı düzeyde daha yüksek bulunmuştur (Table 3, p=0.025). Although the overall distribution regarding micro-macrovascular complications was similar, there was a significant difference between the groups regarding microvascular complications + mortality rate (Table 3, p=0.041). This finding is in line with the study that reported in 2022 that TSH levels, even within normal limits, were significantly associated with both all-cause and cardiovascular mortality in euthyroid diabetic individuals [46]. Another study in euthyroid T2DM patients showed a significant association between TSH levels and low eGFR [47]. This finding of our study suggests that low TSH levels may be associated with a higher mortality risk and mortality + microvascular complications in euthyroid T2DR patients. This may be explained by the interaction of thyroid hormones with inflammatory processes, oxidative stress, and vascular dysfunction. In the existing literature, low TSH levels have been shown to increase endothelial dysfunction by impairing anti-inflammatory mechanisms and exacerbating the already high levels of oxidative stress in diabetic patients [48]. As a result, accelerated inflammation and vascular damage within the first year may have led to a significant increase in both mortality and concomitant microvascular complications in the early period, and our result is consistent with the existing literature [48].
However, in the long term, this difference may have stabilized over time due to factors such as changes in medical treatment approaches, metabolic control of patients, and survival bias. In the literature, in a large-scale study of 3515 coronary artery disease patients with TSH levels in the normal range and divided into three groups according to TSH levels, thyroid function was shown to be closely related to the cardiovascular system and inflammatory processes; it was reported that major cardiovascular events and heart failure developed more frequently, especially in patients with low and high TSH levels, so TSH can be considered as an independent prognostic marker [49]. These findings are consistent with our results, which show the association between TSH levels and vascular dysfunction and inflammatory response in diabetic individuals. They also support the idea that TSH may be a marker not only of thyroid function but also of cardiometabolic risk. In this context, it may be recommended that in euthyroid T2DR patients, patients with low TSH levels should be monitored more closely in the early period and considered as a potential prognostic marker to reduce the risk of mortality and mortality + microvascular complications.
Multivariable logistic regression analysis of the groups according to TSH levels showed that Group 2 patients had a significantly lower risk of both 1-year mortality and mortality + microvascular complications compared to the reference Group 1 (B = -1.053, p = 0.004 and B = -1.027, p = 0.007; Table 4). In contrast, no significant difference was observed for these two clinical outcomes in Group 3. These findings suggest that intermediate TSH levels (1.24-1.94 mU/mL) may represent a clinically safer range. Furthermore, age showed a positive and statistically significant association with both mortality and mortality + development of microvascular complications (B = 0.054, p = 0.001; B = 0.046, p = 0.005), suggesting that age is an independent risk factor for clinical prognosis (Table 4). This result is consistent with the study investigating the relationship between TSH levels and microvascular complications in 248 euthyroid T2DM patients in 2022 [50]. This study reported that thyroid hormone levels and age were determinants in the development of microvascular complications.
In our study, in the multivariate logistic regression analysis evaluating the clinical variables that may be effective in predicting mortality at 1 year, the linear coefficient of TSH was negative (B = -2.094, p = 0.002) and the quadratic (TSH²) coefficient was positive (B = 0.512, p = 0.002, Table 5). These findings suggest a non-linear, inverted U-shaped relationship between TSH levels and 1-year mortality (Figure 2). According to this model, the lowest mortality risk is observed at a TSH level of approximately 2.0 mU/L. However, when tertile groups were formed according to TSH levels in our study, Group 2, which covers the TSH: 1.24-1.94 mU/L, was associated with a significantly lower mortality risk compared to both Group 1 (TSH <1.24) and Group 3 (TSH >1.94). Interestingly, the minimum point on the curve, TSH 2.0, was located in Group 3, but since the majority of individuals in this group had TSH values above 2.0, mortality risk increased again across the group.
This shows that the regression model can show the effect of TSH as a continuous variable with precision, but average trends are prominent in group-based analyses. Therefore, the identification of Group 2 as the most advantageous group in terms of mortality may be because individuals in this range are both close to the optimum value in the model and clustered in a narrower safe range.
In other words, the risk of mortality increases in Group 1 patients with very low TSH levels, decreases to the lowest level in Group 2 patients with intermediate levels, and increases again in Group 3 patients with higher TSH levels (Figure 2). Similarly, a study conducted in 2023 involving 422 euthyroid T2DM patients found an inverted U-shaped non-linear relationship between thyroid hormone sensitivity and DR risk [31]. These results suggest that Group 2 TSH levels may have a protective effect on short-term survival.
This non-linearity suggests that TSH may not only be a parameter reflecting thyroid function but also a prognostic marker associated with systemic inflammation, vascular stress, and metabolic balance in diabetic individuals. Furthermore, the significant positive association between age and mortality (Table 5; B = 0.054, p = 0.001) supports the impact of age-related vascular dysfunction on prognosis in patients with T2DR. This finding suggests that the increasing systemic risk associated with aging may be a critical determinant of survival in individuals with T2DR. The other variables of gender, insulin use, and smoking history were not found to be significant in our analysis; this supports that TSH level may be an independent risk indicator (Table 5).
In conclusion, this study demonstrates that in euthyroid patients with T2DR, even TSH levels within the normal reference range show a non-linear relationship with the risk of mortality and microvascular complications. In particular, low TSH levels were associated with an increased risk of mortality and microvascular complications in the first year of follow-up. These findings suggest that TSH is not only a biochemical parameter reflecting thyroid function but also a potential marker that may influence clinical prognosis in euthyroid patients with T2DR. However, our study's single-center and retrospective design limits the generalizability of the findings. Future prospective, long-term follow-up studies in different centers and in larger and heterogeneous populations are needed. Such studies may contribute to developing more individualized and risk-based follow-up strategies in patients with diabetic retinopathy by supporting the integration of TSH levels into clinical decision-making processes.
5. Conclusions
In our study, in euthyroid T2DR patients, the rates of death and death + microvascular complications in the first year of follow-up were significantly higher in individuals with TSH levels < 1.24 mU/mL. In contrast, this risk was lowest in Group 2 with TSH levels between 1.24 ≤ ─ ≤1.94 mU/mL. A non-linear, inverted U-shaped relationship was observed between TSH and mortality in the first year. The findings suggest that TSH levels may predict clinical outcomes in euthyroid T2DR patients, even when within the normal reference range. They also suggest that individuals with particularly low TSH levels should be monitored closely, and the Group 2 range should be considered as a potential target value.
Author Contributions
Conceptualization, N.T.T and M.C.; methodology, N.T.T.; software, N.T.T.; validation, N.T.T. and M.C.; formal analysis, N.T.T.; investigation, N.T.T and M.C.; resources, N.T.T. and M.C.; data curation, N.T.T. and M.C.; writing—original draft preparation, N.T.T.; writing—review and editing, N.T.T.; visualization, N.T.T.; supervision, N.T.T. and M.C.; All authors have read and agreed to the published version of the manuscript.
Funding
Please add: This research received no external funding
Institutional Review Board Statement
Ethics committee approval for this study was obtained from the Ethics Committee of the Faculty of Medicine of our University with the decision number and protocol code TÜTF-GÖBAEK 2024/42; dated: 19 February 2024, and all procedures in this study were performed under the Declaration of Helsinki and its subsequent amendments.
Data Availability Statement
Our study data contain personal information of patients, and therefore,
Acknowledgments
We would like to thank N.S. and H.G. for his assistance in conducting this study.
Conflicts of Interest
The authors declare no conflicts of interest.
References
- Uppal, V.; Vij, C.; Bedi, G.K.; Vij, A.; Banerjee, B.D. Thyroid Disorders in Patients of Type 2 Diabetes Mellitus. Indian Journal of Clinical Biochemistry 2013, 28, 336–341. [Google Scholar] [CrossRef] [PubMed]
- Khin, P.P.; Lee, J.H.; Jun, H.-S. Pancreatic beta-cell dysfunction in type 2 diabetes. European Journal of Inflammation 2023, 21. [Google Scholar] [CrossRef]
- Saeedi, P.; Petersohn, I.; Salpea, P.; Malanda, B.; Karuranga, S.; Unwin, N.; Colagiuri, S.; Guariguata, L.; Motala, A.A.; Ogurtsova, K. Global and regional diabetes prevalence estimates for 2019 and projections for 2030 and 2045: Results from the International Diabetes Federation Diabetes Atlas. Diabetes research and clinical practice 2019, 157, 107843. [Google Scholar] [CrossRef] [PubMed]
- Rong, F.; Dai, H.; Wu, Y.; Li, J.; Liu, G.; Chen, H.; Zhang, X. Association between thyroid dysfunction and type 2 diabetes: a meta-analysis of prospective observational studies. BMC Medicine 2021, 19, 1–13. [Google Scholar] [CrossRef]
- Hadgu, R.; Worede, A.; Ambachew, S. Prevalence of thyroid dysfunction and associated factors among adult type 2 diabetes mellitus patients, 2000–2022: a systematic review and meta-analysis. Systematic Reviews 2024, 13, 119. [Google Scholar] [CrossRef]
- Luong, X.G.; Stevens, S.K.; Jekle, A.; Lin, T.-I.; Gupta, K.; Misner, D.; Chanda, S.; Mukherjee, S.; Williams, C.; Stoycheva, A. Regulation of gene transcription by thyroid hormone receptor β agonists in clinical development for the treatment of non-alcoholic steatohepatitis (NASH). PLoS One 2020, 15, e0240338. [Google Scholar] [CrossRef]
- Matsuda, H.; Mullapudi, S.T.; Zhang, Y.; Hesselson, D.; Stainier, D.Y.R. Thyroid Hormone Coordinates Pancreatic Islet Maturation During the Zebrafish Larval-to-Juvenile Transition to Maintain Glucose Homeostasis. Diabetes 2017, 66, 2623–2635. [Google Scholar] [CrossRef]
- Rehman, G.; Kumari, N.; Bano, F.; Tyagi, R.K. Thyroid hormone receptor beta: Relevance in human health and diseases. Endocrine and Metabolic Science 2023, 13, 100144. [Google Scholar] [CrossRef]
- Han, H.; Cao, Y.; Feng, C.; Zheng, Y.; Dhana, K.; Zhu, S.; Shang, C.; Yuan, C.; Zong, G. Association of a Healthy Lifestyle With All-Cause and Cause-Specific Mortality Among Individuals With Type 2 Diabetes: A Prospective Study in UK Biobank. Diabetes Care 2022, 45, 319–329. [Google Scholar] [CrossRef]
- Sánchez-Valencia, P.E.; Díaz-García, J.D.; Leyva-Leyva, M.; Sánchez-Aguillón, F.; González-Arenas, N.R.; Mendoza-García, J.G.; Tenorio-Aguirre, E.K.; de León-Bautista, M.P.; Ibarra-Arce, A.; Maravilla, P. Frequency of Tumor Necrosis Factor-α, Interleukin-6, and Interleukin-10 Gene Polymorphisms in Mexican Patients with Diabetic Retinopathy and Diabetic Kidney Disease. Pathophysiology 2025, 32, 14. [Google Scholar] [CrossRef]
- Murugesan, N.; Üstunkaya, T.; Feener, E.P. Thrombosis and Hemorrhage in Diabetic Retinopathy: A Perspective from an Inflammatory Standpoint. Semin Thromb Hemost 2015, 41, 659–664. [Google Scholar] [CrossRef] [PubMed]
- Ng, L.; Liu, H.; Liu, Y.; Forrest, D. Biphasic expression of thyroid hormone receptor TRβ1 in mammalian retina and anterior ocular tissues. Frontiers in endocrinology 2023, 14, 1174600. [Google Scholar] [CrossRef]
- Grubu, T.T.Ç. Tiroid Hastalıkları Tanı ve Tedavi Kılavuzu-2023. 7. Baskı, Türkiye Endokrinoloji ve Metabolizma Dernegi (TEMD) Yayınları, Bayt Matbaacılık, Ankara 2023.
- Schmidt-Erfurth, U.; Garcia-Arumi, J.; Bandello, F.; Berg, K.; Chakravarthy, U.; Gerendas, B.S.; Jonas, J.; Larsen, M.; Tadayoni, R.; Loewenstein, A. Guidelines for the management of diabetic macular edema by the European Society of Retina Specialists (EURETINA). Ophthalmologica 2017, 237, 185–222. [Google Scholar] [CrossRef]
- Care, D. Care in diabetesd2019. Diabetes care 2019, 42, S13–S28. [Google Scholar] [CrossRef]
- McDonagh, T.A.; Metra, M.; Adamo, M.; Gardner, R.S.; Baumbach, A.; Böhm, M.; Burri, H.; Butler, J.; Čelutkienė, J.; Chioncel, O. 2023 focused update of the 2021 ESC guidelines for the diagnosis and treatment of acute and chronic heart failure: developed by the task force for the diagnosis and treatment of acute and chronic heart failure of the European Society of Cardiology (ESC) with the special contribution of the Heart Failure Association (HFA) of the ESC. European heart journal 2023, 44, 3627–3639. [Google Scholar] [CrossRef]
- Isong, I.K.; Udiong, C.E.; Akpan, U.O. Thyroid hormones and glycaemic indices in euthyroid, hyperthyroid, hypothyroid, all type 2 diabetics and non-diabetic subjects. Bulletin of the National Research Centre 2022, 46, 211. [Google Scholar] [CrossRef]
- Kalra, S.; Aggarwal, S.; Khandelwal, D. Thyroid dysfunction and type 2 diabetes mellitus: screening strategies and implications for management. Diabetes Therapy 2019, 10, 2035–2044. [Google Scholar] [CrossRef]
- Ortiga-Carvalho, T.M.; Sidhaye, A.R.; Wondisford, F.E. Thyroid hormone receptors and resistance to thyroid hormone disorders. Nature Reviews Endocrinology 2014, 10, 582–591. [Google Scholar] [CrossRef] [PubMed]
- Teixeira, P.d.F.d.S.; Dos Santos, P.B.; Pazos-Moura, C.C. The role of thyroid hormone in metabolism and metabolic syndrome. Therapeutic advances in endocrinology and metabolism 2020, 11. [Google Scholar] [CrossRef]
- Blanc, E.; Ponce, C.; Brodschi, D.; Nepote, A.; Barreto, A.; Schnitman, M.; Fossati, P.; Salgado, P.; Cejas, C.; Faingold, C. Association between worse metabolic control and increased thyroid volume and nodular disease in elderly adults with metabolic syndrome. Metabolic syndrome and related disorders 2015, 13, 221–226. [Google Scholar] [CrossRef]
- Lee, K.W.; Shin, Y.; Lee, S.; Lee, S. Inherited disorders of thyroid hormone metabolism defect caused by the dysregulation of selenoprotein expression. Frontiers in Endocrinology 2022, 12, 803024. [Google Scholar] [CrossRef] [PubMed]
- Penna, G.C.; Salas-Lucia, F.; Ribeiro, M.O.; Bianco, A.C. Gene polymorphisms and thyroid hormone signaling: implication for the treatment of hypothyroidism. Endocrine 2024, 84, 309–319. [Google Scholar] [CrossRef] [PubMed]
- Groeneweg, S.; van Geest, F.S.; Peeters, R.P.; Heuer, H.; Visser, W.E. Thyroid hormone transporters. Endocrine reviews 2020, 41, 146–201. [Google Scholar] [CrossRef] [PubMed]
- Luongo, C.; Dentice, M.; Salvatore, D. Deiodinases and their intricate role in thyroid hormone homeostasis. Nature Reviews Endocrinology 2019, 15, 479–488. [Google Scholar] [CrossRef]
- Suvarna, R.; Shetty, S.; Pappachan, J.M. Efficacy and safety of Resmetirom, a selective thyroid hormone receptor-β agonist, in the treatment of metabolic dysfunction-associated steatotic liver disease (MASLD): a systematic review and meta-analysis. Scientific Reports 2024, 14, 19790. [Google Scholar] [CrossRef]
- Gauthier, B.R.; Sola-García, A.; Cáliz-Molina, M.Á.; Lorenzo, P.I.; Cobo-Vuilleumier, N.; Capilla-González, V.; Martin-Montalvo, A. Thyroid hormones in diabetes, cancer, and aging. Aging cell 2020, 19, e13260. [Google Scholar] [CrossRef]
- Nappi, A.; Murolo, M.; Cicatiello, A.G.; Sagliocchi, S.; Di Cicco, E.; Raia, M.; Stornaiuolo, M.; Dentice, M.; Miro, C. Thyroid Hormone Receptor Isoforms Alpha and Beta Play Convergent Roles in Muscle Physiology and Metabolic Regulation. Metabolites 2022, 12. [Google Scholar] [CrossRef] [PubMed]
- Minakhina, S.; Bansal, S.; Zhang, A.; Brotherton, M.; Janodia, R.; De Oliveira, V.; Tadepalli, S.; Wondisford, F.E. A direct comparison of thyroid hormone receptor protein levels in mice provides unexpected insights into thyroid hormone action. Thyroid 2020, 30, 1193–1204. [Google Scholar] [CrossRef]
- Nicolini, G.; Casini, G.; Posarelli, C.; Amato, R.; Lulli, M.; Balzan, S.; Forini, F. Thyroid Hormone Signaling in Retinal Development and Function: Implications for Diabetic Retinopathy and Age-Related Macular Degeneration. Int J Mol Sci 2024, 25. [Google Scholar] [CrossRef]
- Yang, J.; Ding, W.; Wang, H.; Shi, Y. Association between sensitivity to thyroid hormone indices and diabetic retinopathy in euthyroid patients with type 2 diabetes mellitus. Diabetes, Metabolic Syndrome and Obesity 2023, 535-545. [CrossRef]
- Zou, J.; Li, Z.; Tian, F.; Zhang, Y.; Xu, C.; Zhai, J.; Shi, M.; Wu, G.; Zhang, Z.; Yang, C. Association between normal thyroid hormones and diabetic retinopathy in patients with type 2 diabetes. BioMed Research International 2020, 2020, 8161797. [Google Scholar] [CrossRef]
- Akın, S.; Bölük, C. Prevalence of comorbidities in patients with type–2 diabetes mellitus. Primary care diabetes 2020, 14, 431–434. [Google Scholar] [CrossRef]
- Almalki, Z.S.; Albassam, A.A.; Alhejji, N.S.; Alotaibi, B.S.; Al-Oqayli, L.A.; Ahmed, N.J. Prevalence, risk factors, and management of uncontrolled hypertension among patients with diabetes: A hospital-based cross-sectional study. Primary care diabetes 2020, 14, 610–615. [Google Scholar] [CrossRef] [PubMed]
- Śliwińska-Mossoń, M.; Milnerowicz, H. The impact of smoking on the development of diabetes and its complications. Diabetes and Vascular Disease Research 2017, 14, 265–276. [Google Scholar] [CrossRef] [PubMed]
- Low, C.Y.; Gan, W.L.; Lai, S.J.; Tam, R.S.-M.; Tan, J.F.; Dietl, S.; Chuah, L.H.; Voelcker, N.; Bakhtiar, A. Critical updates on oral insulin drug delivery systems for type 2 diabetes mellitus. Journal of Nanobiotechnology 2025, 23, 16. [Google Scholar] [CrossRef] [PubMed]
- Caturano, A.; Rocco, M.; Tagliaferri, G.; Piacevole, A.; Nilo, D.; Di Lorenzo, G.; Iadicicco, I.; Donnarumma, M.; Galiero, R.; Acierno, C. Oxidative Stress and Cardiovascular Complications in Type 2 Diabetes: From Pathophysiology to Lifestyle Modifications. Antioxidants 2025, 14, 72. [Google Scholar] [CrossRef]
- Cecilia, O.M.; José Alberto, C.G.; José, N.P.; Ernesto Germán, C.M.; Ana Karen, L.C.; Luis Miguel, R.P.; Ricardo Raúl, R.R.; Adolfo Daniel, R.C. Oxidative Stress as the Main Target in Diabetic Retinopathy Pathophysiology. J Diabetes Res 2019, 2019, 8562408. [Google Scholar] [CrossRef]
- Li, H.; Liu, X.; Zhong, H.; Fang, J.; Li, X.; Shi, R.; Yu, Q. Research progress on the pathogenesis of diabetic retinopathy. BMC ophthalmology 2023, 23, 372. [Google Scholar] [CrossRef]
- Peng, W.; Zhang, M.; Yi, X. Systemic inflammatory mediator levels in non-proliferative diabetic retinopathy patients with diabetic macular edema. Current Eye Research 2024, 49, 80–87. [Google Scholar] [CrossRef]
- ElSayed, M.H.; Elbayoumi, K.S.; Eladl, M.A.; Mohamed, A.A.; Hegazy, A.; El-Sherbeeny, N.A.; Attia, M.A.; Hisham, F.A.; Saleh, M.A.; Elaskary, A. Memantine mitigates ROS/TXNIP/NLRP3 signaling and protects against mouse diabetic retinopathy: Histopathologic, ultrastructural and bioinformatic studies. Biomedicine & Pharmacotherapy 2023, 163, 114772. [Google Scholar] [CrossRef]
- Braun, D.; Schweizer, U. Thyroid Hormone Transport and Transporters. Vitam Horm 2018, 106, 19–44. [Google Scholar] [CrossRef]
- Cao, X.; Lu, M.; Xie, R.R.; Song, L.N.; Yang, W.L.; Xin, Z.; Yang, G.R.; Yang, J.K. A high TSH level is associated with diabetic macular edema: a cross-sectional study of patients with type 2 diabetes mellitus. Endocr Connect 2022, 11. [Google Scholar] [CrossRef]
- Heidari, Z.; Asadzadeh, R. Subclinical Hypothyroidism Is a Risk Factor for Diabetic Retinopathy in Patients with Type 2 Diabetes Mellitus. Med J Islam Repub Iran 2021, 35, 186. [Google Scholar] [CrossRef]
- Amirabadizadeh, A., Mehran, L., Amouzegar, A., Asgari, S., Khalili, D., & Azizi, F. Association between changes in thyroid hormones and incident type 2 diabetes using joint models of longitudinal and time-to-event data: more than a decade follow up in the Tehran thyroid study. Frontiers in endocrinology 2024, 15. [CrossRef]
- Zhu, P.; Lao, G.; Chen, C.; Luo, L.; Gu, J.; Ran, J. TSH levels within the normal range and risk of cardiovascular and all-cause mortality among individuals with diabetes. Cardiovasc Diabetol 2022, 21, 254. [Google Scholar] [CrossRef] [PubMed]
- Chen, Y.; Zhang, W.; Wang, N.; Wang, Y.; Wang, C.; Wan, H.; Lu, Y. Thyroid Parameters and Kidney Disorder in Type 2 Diabetes: Results from the METAL Study. J Diabetes Res 2020, 2020, 4798947. [Google Scholar] [CrossRef] [PubMed]
- Mancini, A.; Di Segni, C.; Raimondo, S.; Olivieri, G.; Silvestrini, A.; Meucci, E.; Currò, D. Thyroid Hormones, Oxidative Stress, and Inflammation. Mediators Inflamm 2016, 2016, 6757154. [Google Scholar] [CrossRef]
- Ding, N.; Hua, R.; Guo, H.; Xu, Y.; Yuan, Z.; Wu, Y.; Li, T. Effect of thyroid stimulating hormone on the prognosis of coronary heart disease. Front Endocrinol (Lausanne) 2025, 16, 1433106. [Google Scholar] [CrossRef]
- Hu, Y.; Hu, Z.; Tang, W.; Liu, W.; Wu, X.; Pan, C. Association of Thyroid Hormone Levels with Microvascular Complications in Euthyroid Type 2 Diabetes Mellitus Patients. Diabetes Metab Syndr Obes 2022, 15, 2467–2477. [Google Scholar] [CrossRef]
Table 2.
Demographic and clinical characteristics of patients, according to TSH tertiles.
| Group 1 (n=120) TSH: 0.35 - 1.24 mIU/L |
Group 2 (n=122) TSH: 1.24 - 1.94 mIU/L |
Group 3 (n=121) TSH: 1.94 - 4.5 mIU/L |
p | |
|---|---|---|---|---|
| Age, years | 63.1 ± 9.5 | 64.2 ± 8.6 | 61.7 ± 9.7 | 0.119a |
| Fasting plasma glucose, mg/dL | 169 (68 - 478) | 158.5 (48 - 386) | 175 (50 - 453) | 0.570b |
| Urea, mg/dL | 45 (12 - 159) | 48 (12 - 253) | 41 (16 - 278) | 0.234b |
| Creatinine, mg/dL | 1 (0.4 - 7.8) | 1 (0.5 - 6.8) | 1 (0.5 - 55) | 0.926b |
| eGFR, mL/min/1.73 m² | 67.6 (4.9 - 126.6) | 69.5 (5.1 - 169.2) | 67.9 (3.1 - 151.6) | 0.704b |
| CRP, mg/dL | 0.4 (0.1 - 67.5) | 0.5 (0.1 - 72.8) | 0.5 (0.2 - 13.4) | 0.265b |
| ALT, IU/L | 17 (4 - 124) | 15 (4 - 252) | 17 (3 - 91) | 0.120b |
| AST, IU/L | 18 (8 - 274) | 18 (9 - 124) | 19 (7 - 108) | 0.442b |
| Albumin, g/L | 40 (4.3 - 49) | 41 (2.8 - 48) | 40 (4 - 48) | 0.880b |
| Uric acid, mg/dL | 5.7 (1.5 - 10.8) | 5.5 (0.6 - 35) | 5.4 (2.4 - 12.8) | 0.784b |
| Total bilirubin, mg/dL | 0.4 (0.1 - 2.4) | 0.4 (0.1 - 9) | 0.5 (0.1 - 4) | 0.938b |
| Total cholesterol, mg/dL | 177 (69 - 353) | 184.5 (86 - 361) | 173 (82 - 356) | 0.150b |
| Triglycerides, mg/dL | 125 (35 - 645) | 132 (38 - 619) | 138 (39 - 902) | 0.537b |
| LDL-cholesterol, mg/dL | 110 (22 - 229) | 119.5 (39 - 247) | 110 (30 - 291) | 0.065b |
| HDL-cholesterol, mg/dL | 42 (19 - 86) | 42 (24 - 94) | 39 (16 - 85) | 0.237b |
| Free T4, ng/dL | 1.1 (0.5 - 3.9) | 1.1 (0.6 – 2.16) | 1.0 (0.5 – 2.64) | 0.023b |
| T3, ng/mL | 2.9 (0.5 - 4) | 2.9 (1 - 4.1) | 2.9 (0.9 - 5.7) | 0.911b |
| WBC, 10³/µL | 8.1 (3.5 - 19.8) | 7.5 (3.9 - 16.6) | 8.3 (4 - 20.1) | 0.119b |
| Hemoglobin, g/dL | 12.3 (6.7 - 16.8) | 12.4 (1 - 16.4) | 12.3 (7.5 - 16.7) | 0.973b |
| HbA₁c, % | 8.3 (5.4 - 14.2) | 8.2 (5.3 - 15.1) | 8.6 (5.5 - 15.2) | 0.260b |
| Platelets, 10³/µL | 236.5 (68 - 586) | 232.5 (85 - 459) | 231 (22 - 491) | 0.546b |
| Lymphocytes, 10³/µL | 1.8 (0.5 - 5.1) | 1.8 (0.5 - 4.2) | 2.1 (0.6 - 5.9) | 0.094b |
| Neutrophils, 10³/µL | 4.9 (1.1 - 16.7) | 4.6 (2 - 12.7) | 5 (0 - 16.5) | 0.373b |
| Monocytes, 10³/µL | 0.6 (0.2 - 1.6) | 0.6 (0.3 - 1) | 0.6 (0 - 1.5) | 0.120b |
| Gender Female, yes n (%) | 41 (34.2) | 52 (42.6) | 52 (43.0) | 0.287c |
| Insulin therapy, n (%), yes | 84 (70.0) | 86 (70.5) | 85 (70.2) | 0.997c |
| Insulin therapy, n (%), yes | 112 (93.3) | 118 (96.7) | 112 (92.6) | 0.336c |
| Smoking ≥20 pack-years, n (%), yes | 63 (52.5) | 63 (51.6) | 61 (50.4) | 0.948c |
Ortalama ± Standart sapma, Medyan (minimum – maksimum), n (%), ALT, alanine aminotransferase; AST, aspartate aminotransferase; CRP, C-reactive protein; DM, diabetes mellitus; eGFR, estimated glomerular filtration rate; FT4, free thyroxine; HbA₁c, hemoglobin A₁c; HDL-C, high-density lipoprotein cholesterol; LDL-C, low-density lipoprotein cholesterol; PLT, platelet count; SII, systemic immune-inflammation index; T3, total T3; TSH, thyroid-stimulating hormone; WBC, white blood cell count. a Tek Yönlü ANOVA test; b Kruskal Wallis test; c Pearson ki-kare testi
Table 3.
Comparison of patients’ complication rates and mortality at one- and three-year follow-up, stratified by TSH tertiles.
Table 3.
Comparison of patients’ complication rates and mortality at one- and three-year follow-up, stratified by TSH tertiles.
| Group 1 (n=120) TSH: 0.35 - 1.24 mIU/L |
Group 2 (n=122) TSH: 1.24 - 1.94 mIU/L |
Group 3 (n=121) TSH: 1.94 - 4.5 mIU/L |
pa | |
|---|---|---|---|---|
| Death at year 1, yes | 30 (25.0) | 14 (11.5) | 23 (19.0) | 0.025 |
| Death at year 3, yes | 7 (7.9) | 6 (5.6) | 11 (11.3) | 0.317 |
| Microvascular complication, year 1, yes | 92 (76.7) | 88 (72.1) | 88 (72.7) | 0.684 |
| Microvascular complication, year 3, yes | 69 (57.5) | 83 (68) | 77 (63.6) | 0.234 |
| Macrovascular complication, year 1, yes | 55 (45.8) | 63 (51.6) | 56 (46.3) | 0.602 |
| Macrovascular complication, year 3, yes | 37 (30.8) | 43 (35.2) | 41 (33.9) | 0.758 |
| Micro + Macro complications, year 1, yes | 50 (41.7) | 52 (42.6) | 46 (38.0) | 0.743 |
| Micro + Macro complications, year 3, yes | 33 (27.5) | 36 (29.5) | 38 (31.4) | 0.802 |
| Death + Microvascular complication, year 1, yes | 26 (21.7) | 12 (9.8) | 21 (17.4) | 0.041 |
| Death + Microvascular complication, year 3, yes | 7 (5.8) | 6 (4.9) | 9 (7.4) | 0.707 |
| Death + Macrovascular complication, year 1, yes | 21 (17.5) | 10 (8.2) | 15 (12.4) | 0.093 |
| Death + Macrovascular complication, year 3, yes | 5 (4.2) | 5 (4.1) | 10 (8.3) | 0.266 |
| Death + Micro + Macro complications, year 1, yes | 19 (15.8) | 8 (6.6) | 13 (10.7) | 0.070 |
| Death + Micro + Macro complications, year 3, yes | 5 (4.2) | 5 (4.1) | 9 (7.4) | 0.411 |
n (%), ᵃ Pearson chi-square test.
Disclaimer/Publisher’s Note: The statements, opinions and data contained in all publications are solely those of the individual author(s) and contributor(s) and not of MDPI and/or the editor(s). MDPI and/or the editor(s) disclaim responsibility for any injury to people or property resulting from any ideas, methods, instructions or products referred to in the content. |
© 2025 by the authors. Licensee MDPI, Basel, Switzerland. This article is an open access article distributed under the terms and conditions of the Creative Commons Attribution (CC BY) license (http://creativecommons.org/licenses/by/4.0/).
Copyright: This open access article is published under a Creative Commons CC BY 4.0 license, which permit the free download, distribution, and reuse, provided that the author and preprint are cited in any reuse.


