Submitted:
21 April 2025
Posted:
22 April 2025
You are already at the latest version
Abstract
Systematic reviews and original research articles should have a structured abstract of around 250 words and contain the following headings: Background/Objectives, Methods, Results, and Conclusions. Background/Objectives The study involves assessment of bioequivalence of a locally manufactured etoricoxib film-coated tablet (test) relative to the reference product, followed by Physiologically based pharmacokinetic (PBPK) modeling. Methods: In-vitro dissolution testing was performed in media of pH 1.2, 4.5, and 6.8 using USP Apparatus II (paddle method). A randomized, open-label, two-treatment, two-period, single-dose crossover study was conducted in 12 healthy Pakistani male volunteers under fasting conditions. Subjects received a single 120 mg dose of either the test (Etoxib®) or reference (Arcoxia®) product, with a 14-day washout. Plasma etoricoxib concentrations were quantified over 72 hours using a validated HPLC-UV method, and pharmacokinetic parameters were determined via non-compartmental analysis. Results: The geometric mean ratios (90% confidence intervals) for Cmax, AUC₀–t, and AUC₀–∞ were 0.946 (0.8855–1.0135), 0.923 (0.8705–0.9795), and 0.960 (0.8955–1.0255), respectively, within the regulatory bioequivalence range. Both formulations were well-tolerated, with no serious adverse events reported. PBPK modeling of in vivo pharmacokinetic data demonstrated acceptable fold errors for assessed parameters, supporting the bioequivalent findings. Conclusions: The study confirms that the locally made etoricoxib tablet is bioequivalent to the reference product, with pharmacokinetic parameters that meet regulatory standards. The PBPK modeling showed acceptable results, proving the test product is a therapeutically equivalent option.
Keywords:
PBPK
; Physiologically Based Pharmacokinetic
; Etoricoxcib
; Bioequivalence
1. Introduction
Etoricoxib (C18H15ClN2O2S), a selective cyclooxygenase-2 (COX-2) inhibitor [1], is prescribed for the management of inflammatory conditions including osteoarthritis, rheumatoid arthritis, and acute pain [2,3]. It offers effective anti-inflammatory and analgesic benefits while minimizing gastrointestinal adverse effects commonly attributed to selective nonsteroidal anti-inflammatory drugs (NSAIDs) [4,5]. It has also been found safe and effective in the management of inflammatory bowel disease [6,7]. Given its clinical significance, ensuring the bioequivalence of generic formulations with the reference product is crucial to maintaining therapeutic efficacy and safety. Bioequivalence studies facilitate regulatory approval of generic versions by demonstrating comparable pharmacokinetic profiles, thereby ensuring interchangeability with the innovator drug [8]. The assessment of bioequivalence involves a multi-step approach, beginning with pharmaceutical assay and comparative dissolution profiling of the test and reference products. Pharmaceutical assay in context of bioequivalence studies ensures the similarity in quality and potency of the reference and test formulations [9]. The dissolution testing serves as an in vitro surrogate for in vivo drug release characteristics. Comparative dissolution profiling evaluates whether the test product exhibits a similar dissolution behavior to the reference product under bio-relevant conditions, which is a prerequisite for establishing bioequivalence [10]. The in vitro assessment is followed by bioequivalence study involving healthy human subjects under controlled conditions. This study evaluates key pharmacokinetic parameters like maximum plasma concentration (Cmax), time to reach Cmax (Tmax), and area under the plasma concentration-time curve (AUC), comparing these metrics between the test and reference formulations. The results determine whether the test product falls within the accepted bioequivalence range set by regulatory agencies, typically 80–125% for Cmax and AUC [11]. The present study aims to establish the bioequivalence of a test formulation of etoricoxib compared to the reference product through a comprehensive approach encompassing pharmaceutical assay, comparative dissolution profiling, bioanalytical method development and validation and bioequivalence assessment. The findings will facilitate the regulatory approval of the generic product and provide insights into the pharmacokinetic properties of etoricoxib, ultimately supporting its safe and effective use in clinical practice.
2. Materials and Methods
Etoricoxib (99.43% pure) standard was obtained as a gift from Glenmark Pharmaceuticals (Pvt. Ltd). All solvents were of HPLC grade, while the rest of the materials were of analytical grade and procured from Sigma-Aldrich. The test product Etoxib® (120mg) was manufactured by Hiranis Pharmaceuticals (Pvt. Ltd), Karachi while the reference product Arcoxia® (120mg) manufactured by Merck Sharp and Dohme GmbH was imported from Dubai, UAE.
2.1. Instruments
The analysis was conducted on a Shimadzu LC-20A system equipped with a UV-VIS detector (SPD-M20A, Shimadzu, Kyoto, Japan), an auto-sampler (SIL-20AC, Shimadzu, Kyoto, Japan), a column oven (CTO-20A, Shimadzu, Kyoto, Japan), and a degasser (DGU-20A5R, Shimadzu LC-20A). Data acquisition was performed using Lab Solution software (version 5.65, Shimadzu, Kyoto, Japan). Sample preparation involved the use of a vortex mixer (Biobase, California, USA), a centrifuge (Mikro, Hettich, Germany), and micropipettes (Eppendorf, Germany). The filtration assembly (Sartorius, Germany) used to degas and filter mobile phase prior to use.
2.2. Chromatographic Conditions for Assay of Etoricoxib Products
The mobile phase composition was 0.05M Potassium Di hydrogen phosphate (KH2PO4) and acetonitrile in the ratio 50:50. The flow rate was set at 1.5mL/min while the detection was performed at 283nm while the column was maintained set at 40°C temperature and the injection volume was 20µl [12].
2.3. Preparation of Standard and Product Samples
For preparation of ETO standard, accurately weighed 120mg of ETO was transferred to 100ml volumetric flask and dissolved in 50ml of diluent (Water:ACN) (50:50). The volume was made up to 100ml with the same diluent. Subsequent dilution (60µg/ml) was prepared from the stock solution. Samples of both test and reference products were prepared separately by weighing and crushing 20tablets and transferring amount equivalent to 120mg of active ingredient to 100ml volumetric flask. It was dissolved in the same diluent as the standard and diluted to nominal concentration of 60µg/ml.
2.4. Comparative Dissolution Testing
The three distinct dissolution media i.e. 0.1 N hydrochloric acid, acetate buffer pH 4.5, and phosphate buffer pH 6.8, were prepared according to United States Pharmacopeia. The dissolution testing was performed on a USP paddle II apparatus (Pharma Test, PT-DT70, Germany) operated at 50rpm paddle speed and 900mL dissolution medium in each vessel. The absorbance measurements for both standard and sample solutions were conducted using a UV-Vis spectrophotometer (UV-1800 Shimadzu, Kyoto, Japan) at a wavelength of 283 nm, with the dissolution medium serving as the blank. Samples were withdrawn at intervals of 5 min, 10 min, 15 min, and 30 min from each vessel. An additional sample was collected at 60 min for pH 4.5 and 90, 120 and 150 min samples were also collected in buffer pH 6.8 owing to reported poor dissolution. A portion of 10mL was collected and adequately diluted with the same buffer for determination of absorbance while the buffer was immediately replaced in each vessel after sample collection.
2.5. Bio-Analytical Method Development and Validation
2.5.1. Chromatographic Conditions
The separation of analyte from plasma matrix was performed on a Welchrom C-18 column (150 mm×4.6mm, 5µm) equipped with a guard column (LiChrospher® 100, 5 µm, LiChroCART® 4-4). The column oven temperature was maintained at 35 °C. The mobile phase consisted of acidic aqueous medium (0.1% formic acid in water) and acetonitrile with 0.1% formic acid. The two solvents were mixed in the ratio of 78:22 (v/v), delivered at 1 mL/min flow rate [13]. UV detector was set at a wavelength of 254 nm, while diclofenac (10 µg/mL) was used as the internal standard. The injection volume was 50 µL, and the total run time was 14 minutes.
2.5.2. Preparation of Calibration Standards and Quality Controls
The stock solution of etoricoxib (1 mg/mL) was prepared in methanol and diluted to 10 µg/mLin plasma. Similarly, the stock solution of the internal standard, diclofenac (1 mg/mL), was prepared by weighing 10 mg of diclofenac, dissolving it in methanol, and diluting the solution to 10 mL with methanol. Furthermore, calibration standards of ETO were prepared in plasma ranging in concentrations 0.175ug/ml to 3.5ug/ml. A system suitability sample containing 2.1 µg/mL etoricoxib and 1 µg/mL diclofenac was prepared for method validation.
2.5.3. Plasma Sample Pre-Treatment
In a 2 mL Eppendorf tube, 400 µL of spiked or blank plasma was added with 50 µL of the I.S (5 µg/mL of Diclofenac) and 400 µL of acetonitrile. The mixture was thoroughly mixed on vortex mixer for 30 seconds, then heated at 56 °C for 5 minutes. After heating, the sample was centrifuged at 12,000 rpm for 10 minutes. About 600 µL of the upper layer was carefully collected, filtered into a 0.5 mL micro-centrifuge tube.
2.5.4. Bio-Analytical Method Validation
The proposed bio-analytical method was fully validated according to ICH guidelines on bioanalytical method validation for selectivity, sensitivity, accuracy, precision and stability [14]. The selectivity was rigorously evaluated on six different blank plasma to ensure accurate quantification of ETO in the presence of potential endogenous matrix interferences. The chosen chromatographic conditions yielded retention times for Etoricoxib and diclofenac to 11.0 ± 1 minute and 6.6 ± 1 minute respectively.
The stability of ETO in plasma was investigated under various storage and handling conditions at three concentration levels of quality control samples: low (0.525µg/mL), medium (1.75µg/mL), and high (3.15µg/mL). The stability parameters evaluated include stock solution, auto-sampler, freeze-thaw, and long-term stability at -70°C. Stock solution stability was assessed by comparing the initial and one-week concentrations of ETO and the internal standard (Diclofenac). Working solutions of ETO (1 µg/mL) and Diclofenac (1µg/mL) were prepared in the mobile phase from freshly prepared stock solutions. Triplicate analyses of these solutions were performed by HPLC after a one-week interval.
For freeze-thaw stability, QC samples were prepared and initially analyzed to establish a baseline (zero-hour) concentration. Subsequently, the samples were kept at -20°C. After 24 hours, these QCs were thawed unassisted at room temperature, a portion (0.4mL) was analyzed, and the remainder was refrozen. The cycle was repeated twice, corresponding to 48 and 72h post-initial preparation. The chemical integrity of ETO was assessed by determining the percent recovery at each time point. Long-term stability at -70°C was assessed using the quality control samples stored at -70°C, and each concentration was analyzed periodically for up to four weeks following the preparation of the initial long-term stability samples.
Recovery was determined by comparing the peak area of ETO extracted from plasma samples to that of ETO in mobile phase samples. Though complete (100%) recovery is not required, consistent and reproducible recovery is essential. Recovery assessments were performed over three consecutive days to evaluate reproducibility. Linearity was assessed by injecting a series of standards at seven distinct concentrations spanning the anticipated concentration range. This procedure yielded the standard curve, thus demonstrating the method's linearity. During the validation of the ETO assay, the calibrators demonstrated linearity across the concentration range of 0.175µg/mL to 3.5µg/mL. Best-fit calibration lines, derived from plotting the chromatographic response against concentration, were generated.
Accuracy was defined as the percentage ratio of the calculated mean concentration of spiked samples in comparison to the nominal (theoretical) concentrations. Both intra-day and inter-day accuracy were assessed using the standard curves generated during the linearity assessment. Five replicate injections of each QC and lower limit of quantification (LLOQ) sample were analyzed, and their concentrations were calculated from the respective standard curve. Intra-day and inter-day accuracy was specifically evaluated for the QC samples. Precision was determined using the same data acquired for the accuracy assessment. Precision was expressed as the percent coefficient of variation (%CV). Intra-day and inter-day precision was evaluated for both calibrators and QC samples over three days using the generated standard curves. The %CV was calculated for the QC samples across their respective concentration ranges. The sensitivity was established by determining the lower limit of quantification (LLOQ). Ten replicate injections of the LLOQ sample were analyzed, and the measured concentrations were determined based on the peak area ratio. This assessment provided a robust measure of the method's ability to accurately quantify ETO at low concentrations.
2.6. Bioequivalence Study Design and Ethical Approval
2.6.1. Subject Selection
A controlled clinical investigation was conducted involving twelve (n=12) healthy male adult volunteers (designated as V1–V12). The eligibility of participants was ascertained through comprehensive physical examinations, medical history assessments, and clinical laboratory evaluations. Individuals presenting with clinical laboratory values deviating from the standard reference range, those afflicted with acute infections or chronic pathologies, and individuals with documented hypersensitivity to NSAIDS were excluded from enrollment. Additionally, subjects with a history of smoking, alcohol consumption, or tobacco use, as well as those who had recently donated blood for therapeutic or research purposes, were precluded from participation.
2.6.2. Study Design and Blood Sampling Protocol
This investigation followed an open-label, randomized, single-dose, two-treatment, two-period, two-sequence crossover bioequivalence design. The reference formulation, Arcoxia® (120 mg film-coated tablet), was designated as treatment A, whereas the test formulation, Etoxib®® (120 mg film-coated tablet), was identified as treatment B. Subjects were admitted to the clinical facility 12 hours prior to drug administration to ensure a fast state for at least one-hour post-dosing. Pharmacokinetic (PK) profiling involved the collection of 15 venous blood samples in heparinized tubes (5 mL per sample) at predefined intervals: 0, 0.25, 0.50, 0.75, 1.0, 2.0, 3.0, 4.0, 6.0, 8.0, 10.0, 12.0, 24.0, 48.0, and 72.0-hours post-dosing. A washout period of one week was observed between crossover phases. Immediately following collection, samples underwent centrifugation at 2500 rpm for 5 minutes at ambient temperature to isolate plasma and stored at −20°C until further analysis.
2.6.3. Pharmacokinetic Analysis
The pharmacokinetic parameters of both the test and reference formulations were determined through plasma drug concentration assessments utilizing validated bioanalytical methods. Non-compartmental analysis was executed on Kinetica® version 5.1 (Thermo Electron Corp., Waltham, USA) to derive key PK parameters, including the time to reach maximum plasma concentration (Tmax), maximum plasma concentration (Cmax), area under the plasma concentration-time curve from zero to the last time point (AUC0-t), and area extrapolated to infinity (AUC0-∞).
2.6.4. Statistical Evaluation
In compliance with U.S. FDA regulatory guidelines on statistical approaches to bioequivalence assessment, a Latin square-design two-way ANOVA was employed on log-transformed pharmacokinetic data using a general linear model framework to evaluate the impact of formulation, period, sequence, and inter-subject variability within sequences using α = 0.05significance level. A two one-sided t-test (TOST) was conducted to compare the mean pharmacokinetic parameter values between the test and reference products. Bioequivalence was confirmed if the 90% confidence intervals for the geometric mean ratios (GMR) of the pharmacokinetic parameters fell within the regulatory acceptance range of 0.80–1.25, signifying comparable systemic exposure between the formulations [11].
2.6.4. Physiologically Based Pharmacokinetic (PBPK) Modeling of Pharmacokinetic Data
A physiologically based pharmacokinetic (PBPK) model for Etoricoxib® 120 mg immediate-release tablets was developed using the Advanced Compartmental Absorption and Transit (ACAT) model in GastroPlus® version 9.8.3 (Simulations Plus, Inc., Lancaster, CA). This model aimed to simulate drug absorption in a healthy male population. Physicochemical, physiological, and pharmacokinetic properties required for the model were gathered from experimental data and literature sources, as summarized in Table 1.The initial step involved validating the model by comparing the simulated intravenous (IV) bolus profile of Etoricoxib with corresponding in vivo data from adult studies4.Furthermore, the simulated plasma concentration-time profile for the immediate-release tablets was cross-checked against observed in vivo oral data. Before establishing the correlation, the plasma concentration-time profile of the optimized formulation was analyzed using the PKPlus™ module, and the resulting compartmental parameters were integrated into the pharmacokinetic section of GastroPlus®. The accuracy of the model was assessed by calculating the fold error (FE) between the predicted and observed pharmacokinetic parameters using a standard formula [16,17].
3. Results
3.1. Pharmaceutical Assay of Test and Reference Products
The HPLC method for the pharmaceutical assay was developed and comprehensively validated in-house. The mobile phase consisted of a binary mixture of phosphate buffer and acetonitrile in a 50:50 ratio. Chromatographic separation was achieved using a conventional C-18 column (25 cm x 0.46 cm) with particle size of 5 µm. Detection of the analyte was performed using a UV detector set at a wavelength of 283 nm. The assay results for both the reference and test products were found to be within the specified acceptance criteria of 90–110% of the label claim, as per the standards outlined in the USP. Additionally, for bioequivalence studies, it is a regulatory requirement that the test and reference products do not exhibit a difference exceeding 5% [9].
3.2. Comparative Dissolution Test
Comparative dissolution profile was conducted in buffers of three different pH values i.e. 1.2, 4.5 and 6.8 to obtain insight about the expected in-vivo drug release behavior of the developed product. As depicted in Figure 1 more than 85% of drug dissolution was observed within 15minutes in buffer pH 1.2. A relatively slower dissolution rate was observed at pH 4.5 for both the products, i.e. around 85% after 30min whereas the slowest dissolution rate was observed at pH 6.8 with around 85% drug dissolution observed after two hours.
3.3. Bio-Analytical Method
The bioanalytical method underwent thorough validation, encompassing all critical validation parameters, including selectivity, sensitivity, accuracy and precision, linearity of the calibration curve and various stability studies as recommended by ICH M10 guidelines for bioanalytical method validation [14].The chromatographic conditions employed provided a highly selective assay, as demonstrated by the absence of interfering peaks in the elution regions of both the analyte (ETO) and the internal standard (IS) in representative plasma sample chromatograms (Figure 2). Critically, no interfering peaks were observed at the retention times corresponding to ETO or the IS, confirming the method's selectivity. The lower limit of quantification (LLOQ) was established at 0.175µg/mL. The calibration curves demonstrated linearity across the concentration range of 0.175–3.5 µg/mL (Figure 3).
In terms of precision and accuracy, the method was deemed satisfactory for both intra-day and inter-day analyses, ensuring high reproducibility and reliability of the method. This was evident from the accuracy and precision values within ±15% of the nominal values (Table 2 and Table 3). Different stability assessments representing varying environmental conditions indicated that samples remained stable with reference to three freeze thaw cycles (-20 °C), stock solution stability and long-term stability for up to 72 hours and up to four weeks respectively at −70 °C (Table 4). These stability findings were crucial for ensuring proper sample preservation prior to and during analysis, thereby enabling accurate quantification of drug concentrations in biological fluids. Overall, all validation parameters satisfied the pre-defined acceptance criteria in accordance with ICH bioanalytical method validation guidelines, confirming the method's reliability and suitability for the quantification of ETO in human plasma.
3.4. Bioequivalence Study Design
The current study was a conventional two treatment, two period two-way crossover study between the reference product (Arcoxia®) and test product (Etoxib®). The demographic analysis of the study population, comprising 12 subjects, revealed an average age of 24 years, with a range spanning from 19 to 27 years. The mean height was observed to be 66 inches (range 61-72 inches), while the average weight was 60.9 kg, (range 50.4-78.4 kg). The BMI distribution indicated a mean of 21.71 kg/m², with a minimum of 18.68 kg/m² and a maximum of 27.14 kg/m². The observed demographic parameters fall within accepted physiological ranges, suggesting a relatively homogenous study population in terms of age, height, weight, and BMI. The absence of extreme values enhances the reliability of the dataset for further analysis.
3.5. Pharmacokinetic and Statistical Analysis
The pharmacokinetic profile of the etoricoxib (120 mg) reference formulation from this study showed a Cmax of 2.915µg/mL, a Tmax of 0.729 hours, an AUC₀-ᵗ of 38.93µg·h/mL, and an elimination half-life (T₁/₂) of 25.18 (6.10) h (Table 4). Compared to previous research, the Cmax values were 23.69µg/mL for Setiawati and 19.86µg/mL for Harikrishnan et al. Tmax values were 1.75 hours for Setiawati and 1.26 hours for Harikrishnan et al. AUC₀-ᵗ values were 4495.03 ng·h/mL for former and 23.47µg·h/mL for latter. AUC₀-∞ values showed a 12% difference compared to Setiawati, and a 2.29% difference compared to Harikrishnan et al. Setiawati's T1/2 was 19.20 (8.0) h. There are other notable studies addressing bioequivalence of ETO but their results cannot be compared here owing to lower doses administered to the subjects21, 22.The comparative pharmacokinetic evaluation of Arcoxia® 120 mg and Etoxib®120 mg (Figure 4) revealed that the Cmax values were 3.124 ± 0.496 µg/mL for Arcoxia® and 2.91 ± 0.350µg/mL for Etoxib®, with a geometric mean ratio (GMR) of 0.947 and a 90% confidence interval (CI) within the 80%-125% bioequivalence range. Tmax values were 0.729 ± 0.198 h for Arcoxia® and 0.791 ± 0.208 h for Etoxib® (Table 5). while AUC₀-ᵗ values were 3.893 ± 0.839µg·h/mL for Arcoxia® and 3.639 ± 1.308µg·h/mL for Etoxib®, with a GMR of 0.923 and a 90% CI within the 80%-125% bioequivalence range. AUC₀-∞ values were 4.554 ± 0.886µg·h/mL for Arcoxia® and 4.450 ± 1.280µg·h/mL for Etoxib®, with a GMR of 0.961 and a 90% CI within the bioequivalence criteria. The elimination half-life (T ½ ) was 25.175 ± 6.10 h for Arcoxia® and 23.73 ± 6.71 h for Etoxib®. Two one-sided t-tests confirmed bioequivalence for Cmax and AUC₀-ᵗ.
The geometric mean ratio (GMR) for Cmax was calculated as 0.947, indicating that the peak plasma concentration of Etoxib® is approximately 94.7% of that of Arcoxia® (Table 6). The 90% confidence interval (CI) for Cmax falls within the accepted bioequivalence range of 80%-125%, as confirmed by the two one-sided t-tests, supporting the bioequivalence of the formulations. The Tmax values for Arcoxia® (0.729 ± 0.198 h) and Etoxib® (0.791 ± 0.208 h) were also similar, demonstrating a comparable rate of absorption between the two formulations. The AUC₀-ᵗ and AUC₀-∞ values, representing the extent of drug exposure, were slightly higher for Arcoxia® (3.893 ± 0.839 ng·h/mL and 4.554±0.886 ng·h/mL, respectively) compared to Etoxib® (3.639 ± 1.308 µg·h/mL and 4.450 ± 1.280µg·h/mL, respectively). The geometric mean ratio (GMR) for AUC₀-ᵗ was calculated as 0.923, indicating that Etoxib® achieved approximately 92.3% of the systemic exposure of Arcoxia®. The 90% confidence interval (CI) for AUC₀-ᵗ also falls within the accepted bioequivalence range of 80%-125%, supporting the conclusion of bioequivalence between the two formulations. Similarly, the geometric mean ratio (GMR) for AUC₀-∞ was determined as 0.961. The 90% confidence interval (CI) for AUC₀-∞ confirms that the two formulations meet the bioequivalence criteria. The elimination half-life (T1/2) for Arcoxia® (25.175 ± 6.10 h) and Etoxib® (23.73 ± 6.71 h) exhibited minor variations, suggesting similar elimination kinetics and duration of systemic drug exposure. The comparable half-life values indicate that both formulations maintain effective plasma concentrations over a similar time period. The pharmacokinetic parameters of Arcoxia® and Etoxib® demonstrate a high degree of similarity, with minor differences observed in Cmax and AUC values. These variations may be attributed to formulation differences or inter-individual variability in drug absorption. However, the Tmax and T ½ values remain consistent between the two formulations, supporting their comparable pharmacokinetic behavior.
Overall, the PBPK model demonstrated reasonable predictive performance, with all fold errors within the generally acceptable range. However, the discrepancies in Cmax and Tmax suggest the need for further refinement of absorption kinetics to improve the accuracy of the model. Mitra et al [28] investigated absorption kinetics of etoricoxib from the tablet products manufactured at two different sites. They used comparative dissolution and PBPK modeling of etoricoxib film coated tablets of three different strengths followed by a bioequivalence study against reference products. They obtained similar drug dissolution results in acidic medium while significant difference was observed at pH 4.5 and 6.8. Upon simulation to PBPK model they predicted bioequivalence of the products manufactured at different sites which was further verified by the bioequivalence study. These observations were found in-line with the current study.
4. Discussion
4.1. Pharmaceutical Assay of Test and Reference Products
There was no official testing method available for ETO in reputed international Pharmacopoeia. Therefore, an in-house method was developed and validated as per general ICH guidelines (Q2 R1) [23] for quantitative determination of active ingredients in dosage form. Topalli et al [24] and Gangane et al. [25] reported HPLC based analytical methods for quantification of ETO in tablet dosage forms and bulk material. They used the λ max wavelength 233nm for detection of API. Though ETO exhibits two wavelengths of maximum absorbance, the second wavelength 285nm as reported by Cacciari et al [26] was selected in the current study. This may enhance specificity of the method since excipients may show absorbance at lower wavelengths. The chromatographic conditions thus applied yielded acceptable results with reference to system suitability parameters. By applying this method, the assay was found to be more than 99% and within ±5% of the reference product.
4.2. Comparative Dissolution Test
It was evident from the observed results that the pH dependent solubility of the drug and the best model for predicting oral absorption can be explained by the drug dissolution at pH 1.2. These observations are in concordance with those reported by Ashokraj et al. [27] while slight difference (around 15%) was observed as reported by Mitra et al. [28]. The difference may be attributed to the developed formulation since they tested formulation variability between products developed at an old and new site. The results also signify that due to the high solubility at lower pH, the absorption and bioavailability of immediate release formulation is expected to be primarily influenced by their initial dissolution in the acidic environment of the stomach (pH < 3). This is further supported by the high absolute bioavailability of Etoricoxib (~100%), indicating that solubility does not limit its absorption [29].
4.3. Bio-Analytical Method
A new bioanalytical method was developed and validated for quantification of ETO in human plasma. Though there are few previously reported bioanalytical methods which used either LC-MS 13, [30,31,32] with stable isotope labeled internal standards (SIL-IS) or used solid phase extraction as sample preparation technique. These approaches are very expensive and require sophisticated instrumentation. Therefore, a simple HPLC-UV-based analytical method was developed on the basis of a literature survey. Matthews et al. [33] used Fluorescence detection after converting ETO to a fluorescent chemical derivative. Secondly, they opted for solid-phase extraction in 96 well plate system. The derivatization technique itself is very laborious and requires extensive validation specifically to optimize derivatization reaction. Ashok et al [27] used a mixture of diethyl ether and Dichloromethane (6:4) in large volume (6mL) for extraction of ETO. These solvents are hazardous and using large volumes is not economically viable. Radwan et al. [34] conducted pharmacokinetic studies of etoricoxib on rats and thus used smaller sample volumes for drug extraction. They used simple protein precipitation and analysis on HPLC –UV with detection wavelength 245nm. They used gradient elution mode for chromatographic separation and applied the method to pharmacokinetic studies of ETO in rats.
4.4. Pharmacokinetics of Reference and Test Products
The observed variations in Cmax values across the studies, with this study reporting the highest value, suggest potential differences in absorption rates or extent. The 14.0% difference between this study and Setiawati's Cmax indicates relatively good agreement, while the 38.0% difference with Harikrishnan et al. [35,36] suggests more substantial variability, possibly due to study conditions, population characteristics, or bioavailability. The 25.0% difference between Setiawati and Harikrishnan et al. reinforces this variability. The variability in Tmax values, with this study reporting the fastest absorption, suggests differences in absorption phases. The greater comparable Tmax between Setiawati and Harikrishnan et al. suggests more similar absorption between those two studies. The significant difference in AUC₀-ᵗ between this study and Harikrishnan et al. may reflect differences in drug metabolism, study design, or bioanalytical methods. The relatively small difference in AUC₀-ᵗ between this study and Setiawati suggests similar overall drug exposure. The better alignment of AUC₀-∞ values across all studies, despite variations in Tmax and AUC₀-ᵗ, indicates overall consistency in total drug exposure. The moderate variation in elimination half-life between this study and Setiawati, with both values within the expected range for etoricoxib, indicates comparable elimination kinetics.
4.5. Statistical Analysis for Establishing Bioequivalence
The comparative pharmacokinetic evaluation demonstrated similar pharmacokinetic profiles for Arcoxia® and Etoxib®, with minor differences observed in absorption, distribution, and elimination parameters. The slightly higher Cmax values for Arcoxia suggest marginally higher peak plasma levels, though the difference is not substantial, indicating comparable bioavailability. The GMR and 90% CI for Cmax and AUC values confirmed the bioequivalence of the two formulations, as supported by the two one-sided t-tests. Similar Tmax values indicate a comparable rate of absorption. The slight differences in AUC₀-ᵗ and AUC₀-∞ values suggest minor variations in the extent of drug exposure, but these variations are within the accepted bioequivalence range. The comparable elimination half-life (T ½) values indicate similar elimination kinetics and duration of systemic drug exposure. These minor variations in Cmax and AUC values may be attributed to formulation differences or inter-individual variability in drug absorption. However, the consistent Tmax and T ½ values support the comparable pharmacokinetic behavior of both formulations.
4.6. Physiologically Based Pharmacokinetic (PBPK) Modeling of Pharmacokinetic Data
The PBPK model predictions for Etoxib® and Arcoxia® were evaluated by comparing key pharmacokinetic parameters, including Cmax, Tmax, AUC0-inf, and AUC0-t (Table 6). The fold error was calculated to assess the predictive accuracy of the model. The model showed a moderate under-prediction of Cmax, while Tmax was notably overestimated (Figure 5). In contrast, the predictions for AUC0-inf and AUC0-t were in close agreement with observed values, indicating a good model fit for drug exposure parameters.
Overall, the PBPK model demonstrated reasonable predictive performance, with all fold errors within the generally acceptable range. However, the discrepancies in Cmax and Tmax suggest the need for further refinement of absorption kinetics to improve the accuracy of the model. Mitra et al28 investigated absorption kinetics of etoricoxib from the tablet products manufactured at two different sites. They used comparative dissolution and PBPK modeling of etoricoxib film coated tablets of three different strengths followed by a bioequivalence study against reference products. They obtained similar drug dissolution results in acidic medium while significant difference was observed at pH 4.5 and pH6.8. Upon simulation to PBPK model they predicted bioequivalence of the products manufactured at different sites which was further verified by the bioequivalence study. These observations were found in-line with the current study.
5. Conclusions
The study successfully established the bioequivalence of the locally manufactured etoricoxib tablet, showing pharmacokinetic parameters meeting the regulatory acceptance criteria. PBPK modeling yielded acceptable fold errors, supporting the consistency of the findings and thus establishing the test product as a therapeutically equivalent alternative to the reference formulation.
Author Contributions
Conceptualization, H.M. and I.M.; methodology, H.M.; software, F.S., T.S., validation, H.M., I.M. and F.S.; formal analysis, H.M., T.S., F.S.; investigation, H.M.; resources, H.M.; data curation, H.M., T.S., F.S; writing—original draft preparation, H.M.; writing—review and editing, H.M., I.M; visualization, I.M.; supervision, I.M.; project administration, I.M. All authors have read and agreed to the published version of the manuscript.
Funding
This research received no external funding.
Institutional Review Board Statement
The study was conducted in accordance with the Declaration of Helsinki and approved by the Institutional Review Board of UNIVERSITY OF KARACHI (IBC KU-358/2023 dated 30/8/2023).
Informed Consent Statement
Informed consent was obtained from all subjects involved in the study.
Data Availability Statement
The original contributions presented in this study are included in the article. Further inquiries can be directed to the corresponding author.
Acknowledgments
The authors are thankful to Hiranis Pharmaceuticals (Pvt. Ltd), Karachi for their support in the study.
Conflicts of Interest
The authors declare no conflicts of interest.
Abbreviations
The following abbreviations are used in this manuscript:
| ETO | Etoricoxib |
| HPLC | High Performance Liquid Chromatography |
| LLOQ | Lower Limit Of Quantification |
| QC | Quality Control |
References
- Martina, S. D.; Vesta, K. S.; Ripley, T. L. Etoricoxib: a highly selective COX-2 inhibitor. Ann Pharmacother 2005, 39 (5), 854-862. [CrossRef]
- Akter, B. A.; Hridoy, S.; Pulok, A.; Islam, M. M. H.; Biswas, M. A.; Patwary, A.; Hoque, A.; Islam, M.; Nirob, M. D. S.; Chowdhury, M. N. H.; Islam, F.; Monir, U. Structural Tailoring of Etoricoxib: A Spectrochemical, Medicinal and Pharmacological Study. Chem. Phys. Impact 2025, 10, 100830. [CrossRef]
- Takemoto, J. K.; Reynolds, J. K.; Remsberg, C. M.; Vega-Villa, K. R.; Davies, N. M. Clinical pharmacokinetic and pharmacodynamic profile of etoricoxib. Clin Pharmacokinet 2008, 47 (11), 703-720. [CrossRef]
- Agrawal, N. G.; Rose, M. J.; Matthews, C. Z.; Woolf, E. J.; Porras, A. G.; Geer, L. A.; Larson, P. J.; Cote, J.; Dilzer, S. C.; Lasseter, K. C.; et al. Pharmacokinetics of etoricoxib in patients with hepatic impairment. J Clin Pharmacol 2003, 43 (10), 1136-1148. [CrossRef]
- Biase, T. M. M. A.; Rocha, J. G. M.; Silva, M. T.; Ribeiro-Vaz, I.; Galvão, T. F. Renal effects of selective cyclooxygenase-2 inhibitor anti-inflammatory drugs: A systematic review and meta-analysis. Exploratory Research in Clinical and Social Pharmacy 2024, 15, 100475. [CrossRef]
- Oliveira, A.; Rodrigues, L. C.; Soares da Costa, D.; Fernandes, E. M.; Reis, R. L.; Neves, N. M.; Leão, P.; Martins, A. COX-2 inhibitor delivery system aiming intestinal inflammatory disorders. Biomaterials Advances 2024, 156, 213712. [CrossRef]
- Ribaldone, D. G.; Fagoonee, S.; Astegiano, M.; De Angelis, C.; Smedile, A.; Caviglia, G. P.; Petrini, E.; Greco, A.; Pellicano, R. Coxib's Safety in Patients with Inflammatory Bowel Diseases: A Meta-analysis. Pain Physician 2015, 18 (6), 599-607.
- Chow, S. C. Bioavailability and Bioequivalence in Drug Development. Wiley Interdisciplinary Reviews: Computational Statistics 2014, 6. [CrossRef]
- International Council for Harmonisation (ICH). M13-A: Bioequivalence for Immediate Release Solid Oral Dosage Forms; ICH: Geneva, 2024.
- Diaz, D. A.; Colgan, S. T.; Langer, C. S.; Bandi, N. T.; Likar, M. D.; Van Alstine, L. Dissolution Similarity Requirements: How Similar or Dissimilar Are the Global Regulatory Expectations? AAPS J. 2016, 18 (1), 15-22. [CrossRef]
- U.S. Food and Drug Administration (FDA). Guidance for Industry: Bioequivalence Studies with Pharmacokinetic Endpoints for Drugs Submitted under an ANDA; U.S. FDA: Silver Spring, MD, 2021.
- Patel, H. M.; Bhandari, N. S.; Shah, S. A.; Rathod, I. S. Determination of Etoricoxib in Pharmaceutical Formulations by HPLC Method. Indian J. Pharm. Sci. 2007, 69 (5), 703–705..
- Loh, G. O. K.; Wong, E. Y. L.; Tan, Y. T. F.; Heng, S. C.; Saaid, M.; Cheah, K. Y.; Mohd Sali, N. D.; Damenthi, N.; Ng, S. S. M.; Ming, L. C.; et al. Fast and Sensitive HPLC-ESI-MS/MS Method for Etoricoxib Quantification in Human Plasma and Application to Bioequivalence Study. Molecules 2022, 27 (17). [CrossRef]
- International Council for Harmonisation (ICH). M10: Bioanalytical Method Validation; ICH: Geneva, 2019.
- World Medical Association. Declaration of Helsinki: Ethical Principles for Medical Research Involving Human Subjects. JAMA 2013, 310 (20), 2191–2194. [CrossRef]
- Cvijic, S.; Ibric, S.; Parojcic, J.; Djuris, J. An In Vitro–In Silico Approach for the Formulation and Characterization of Ranitidine Gastroretentive Delivery Systems. J. Drug Deliv. Sci. Technol. 2018, 45, 1–10. [CrossRef]
- Jones, H. M.; Mayawala, K.; Poulin, P. Dose selection based on physiologically based pharmacokinetic (PBPK) approaches. AAPS J. 2013, 15 (2), 377-387. [CrossRef]
- Gonzalez-Alvarez, I.; Bermejo, M.; Tsume, Y.; Ruiz-Picazo, A.; Gonzalez-Alvarez, M.; Hens, B.; Garcia-Arieta, A.; Amidon, G. E.; Amidon, G. L. An In-Vivo Predictive Dissolution Methodology (iPD Methodology) with a BCS Class IIb Drug Can Predict the In Vivo Bioequivalence Results: Etoricoxib Products. Pharmaceutics 2021, 13 (4). [CrossRef]
- Nayak, A. K.; Panigrahi, P. P. Solubility Enhancement of Etoricoxib by Cosolvency Approach. International Scholarly Research Notices 2012, 2012 (1), 820653. [CrossRef]
- Rodrigues, A. D.; Halpin, R. A.; Geer, L. A.; Cui, D.; Woolf, E. J.; Matthews, C. Z.; Gottesdiener, K. M.; Larson, P. J.; Lasseter, K. C.; Agrawal, N. G. Absorption, metabolism, and excretion of etoricoxib, a potent and selective cyclooxygenase-2 inhibitor, in healthy male volunteers. Drug Metab Dispos 2003, 31 (2), 224-232. [CrossRef]
- Meulman, J.; Davanço, M. G.; Vianna, D. R. B.; da Silva, T. M.; Costa, F.; Pacheco, F. B. C.; de Oliveira, M. E.; Vespasiano, C. F. P. Etoricoxib Coated Tablets: Bioequivalence Assessment between Two Formulations Administered under Fasting Conditions. Pharmaceutics 2023, 15 (11). [CrossRef]
- Shohag, M. H.; Islam, M. S.; Ahmed, M. U.; Joti, J. J.; Islam, M. S.; Hasanuzzaman, M.; Hasnat, A. Pharmacokinetic and bioequivalence study of etoricoxib tablet in healthy Bangladeshi volunteers. Arzneimittelforschung 2011, 61 (11), 617-621. [CrossRef]
- International Council for Harmonisation (ICH). Q2(R1): Validation of Analytical Procedures; ICH: Geneva, 2005.
- Topalli, S.; Chandrashekhar, T. G.; Annapurna, M. M. Validated RP-HPLC Method for the Assay of Etoricoxib (A Non-Steroidal Anti-Inflammatory Drug) in Pharmaceutical Dosage Forms. Journal of Chemistry 2012, 9 (2), 264567. [CrossRef]
- Gangane P.S., S. M. B., S.G.Mujbaile and K.D.Niranjane. Development and Validation of HPLC Assay Method for Etoricoxib in Bulk Drug and Tablet Formulation. Indian Journal of Natural Sciences 2014, 4 (24), 1565-1572.
- Cacciari, R. D.; Menis, F.; Biondi, M. A.; Reynoso, E.; Sabini, C.; Montejano, H. A.; Biasutti, M. A. Mechanistic analysis on the photochemistry of the anti-inflammatory drug etoricoxib in aqueous solution. Cytotoxicity of photoproducts. Journal of Photochemistry and Photobiology A: Chemistry 2020, 390, 112331. [CrossRef]
- Yasvanth Ashokraj, A. D., Raja Gupta, Aruna Khanolkar, Amol Kulkarni, Swati Laud, Milind Pokale, Sanjeet Shedge, and Praveen Date. Discriminatory Dissolution Method Development and Validation of Etoricoxib Tablets. Dissolution technologies May, 2016, 30-34. [CrossRef]
- Mitra, A.; Kesisoglou, F.; Dogterom, P. Application of absorption modeling to predict bioequivalence outcome of two batches of etoricoxib tablets. AAPS PharmSciTech 2015, 16 (1), 76-84. [CrossRef]
- Starek, M. Review of the applications of different analytical techniques for coxibs research. Talanta 2011, 85 (1), 8-27. [CrossRef]
- Sangoi, M. S.; Leite, L. D.; Borges, J. L.; Resende, M. F.; Peixoto, P. R.; Oliveira, T. R.; Marques, M. P. Determination of Etoricoxib in Human Plasma Using Automated On-Line Solid-Phase Extraction Coupled with LC-APCI/MS/MS. Quím. Nova 2008, 31 (3), 467–471. [CrossRef]
- Ifrah, S.; Porat, D.; Deutsch, M.; Dahan, A. Quantification of Etoricoxib in Low Plasma Volume by UPLC-PDA and Application to Preclinical Pharmacokinetic Study. Pharmaceuticals (Basel) 2024, 17 (4). [CrossRef]
- Bräutigam, L.; Nefflen, J. U.; Geisslinger, G. Determination of etoricoxib in human plasma by liquid chromatography-tandem mass spectrometry with electrospray ionisation. J Chromatogr B Analyt Technol Biomed Life Sci 2003, 788 (2), 309-315. [CrossRef]
- Matthews, C. Z.; Woolf, E. J.; Lin, L.; Fang, W.; Hsieh, J.; Ha, S.; Simpson, R.; Matuszewski, B. K. High-throughput, semi-automated determination of a cyclooxygenase II inhibitor in human plasma and urine using solid-phase extraction in the 96-well format and high-performance liquid chromatography with post-column photochemical derivatization-fluorescence detection. J Chromatogr B Biomed Sci Appl 2001, 751 (2), 237-246. [CrossRef]
- Mahasen A. Radwan, I. Y. Z., Nayira A. Abd Elbaky. Stability indicating high performance liquid chromatographic assay for the pharmacokinetics of cyclooxygenase (COX-2) inhibitor etoricoxib in rats. African Journal of Pharmacy and Pharmacology 2009, 3 (7), 339-346.
- Suyatna FD, S. E., Saraswati L, Dewi OU, Darmawan A, Elisda VU1, Mawaddah N and Rosita M. Bioequivalence Study of Two Etoricoxib 90 mg Film-Coated Tablet Formulations. Bioequivalence & Bioavailability International Journal 2022.
- Harikrishnan, N.; Tan, K.-L.; Yee, K. M.; Shukri, A. S. A.; Reddy, N. R.; Leong, C. W. Pharmacokinetics and Bioequivalence of Generic Etoricoxib in Healthy Volunteers. Generics Biosimilars Initiat. J. 2021, 10 (3), 113–118.
Figure 1.
Comparative Dissolution Profile of test and reference and test products.
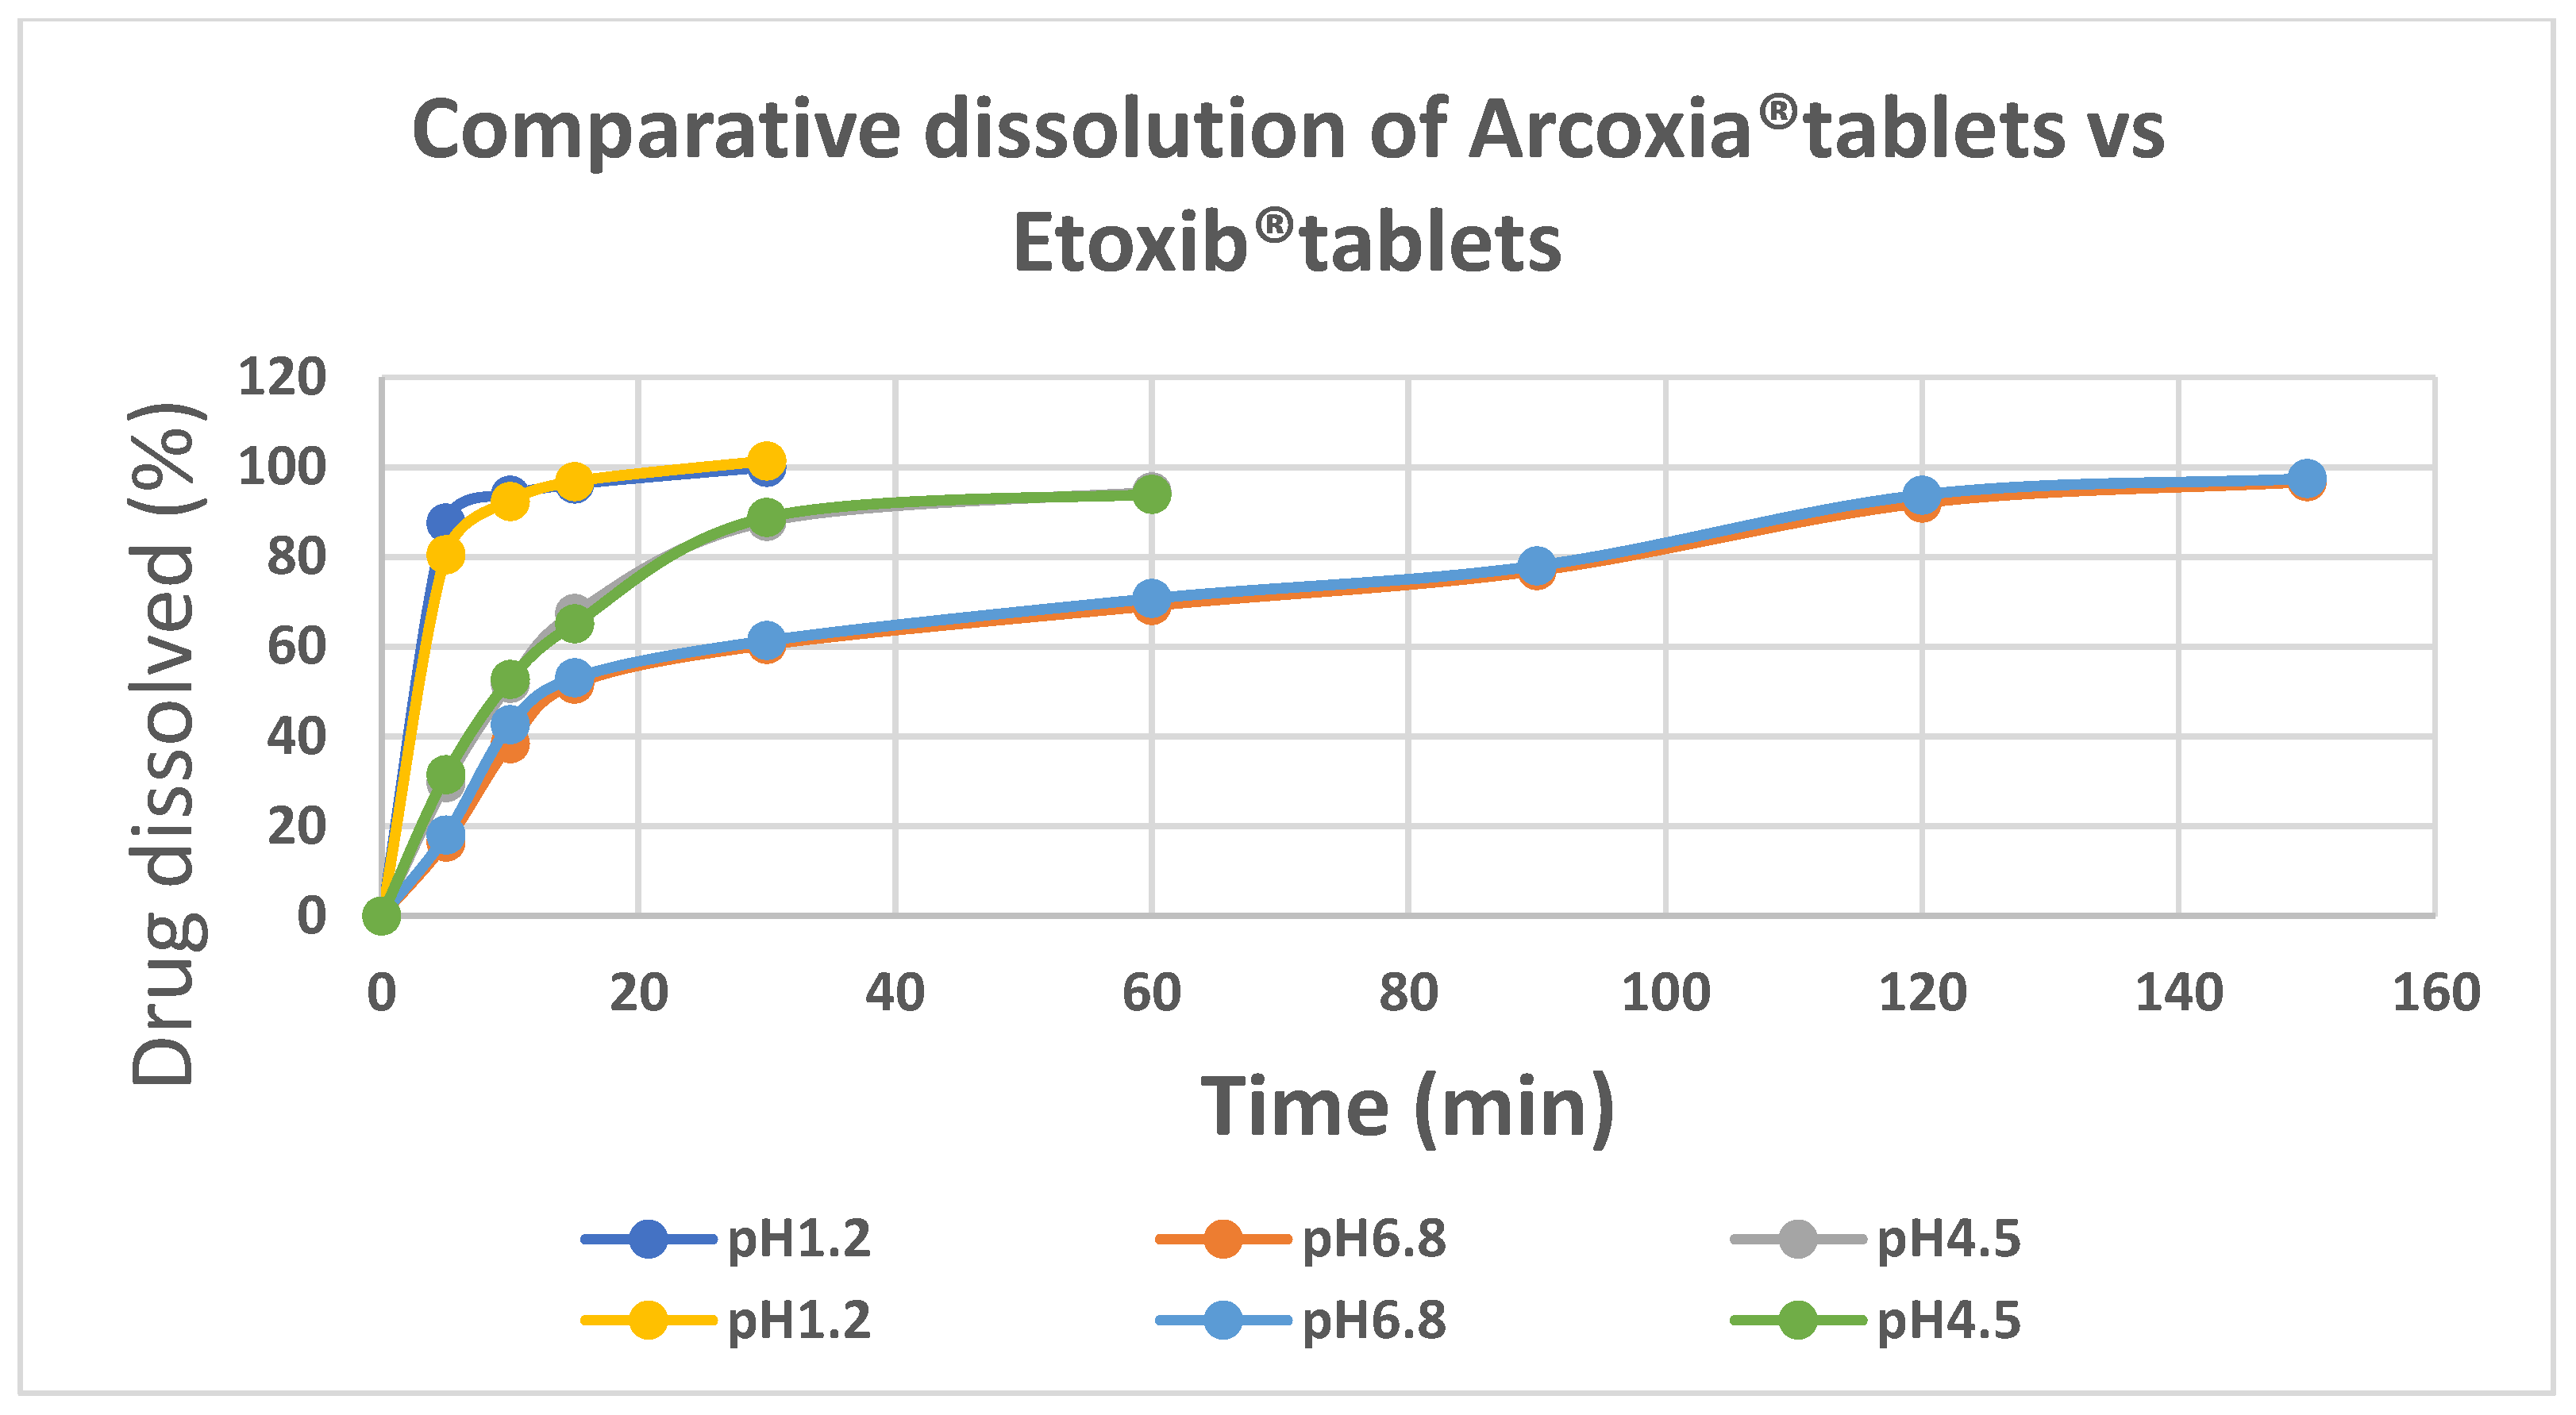
Figure 2.
Chromatograms of A. analyte and I.S. in mobile phase. B. Blank plasma C. etoricoxib with I.S. and D. Plasma sample collected at 2hours.
Figure 2.
Chromatograms of A. analyte and I.S. in mobile phase. B. Blank plasma C. etoricoxib with I.S. and D. Plasma sample collected at 2hours.
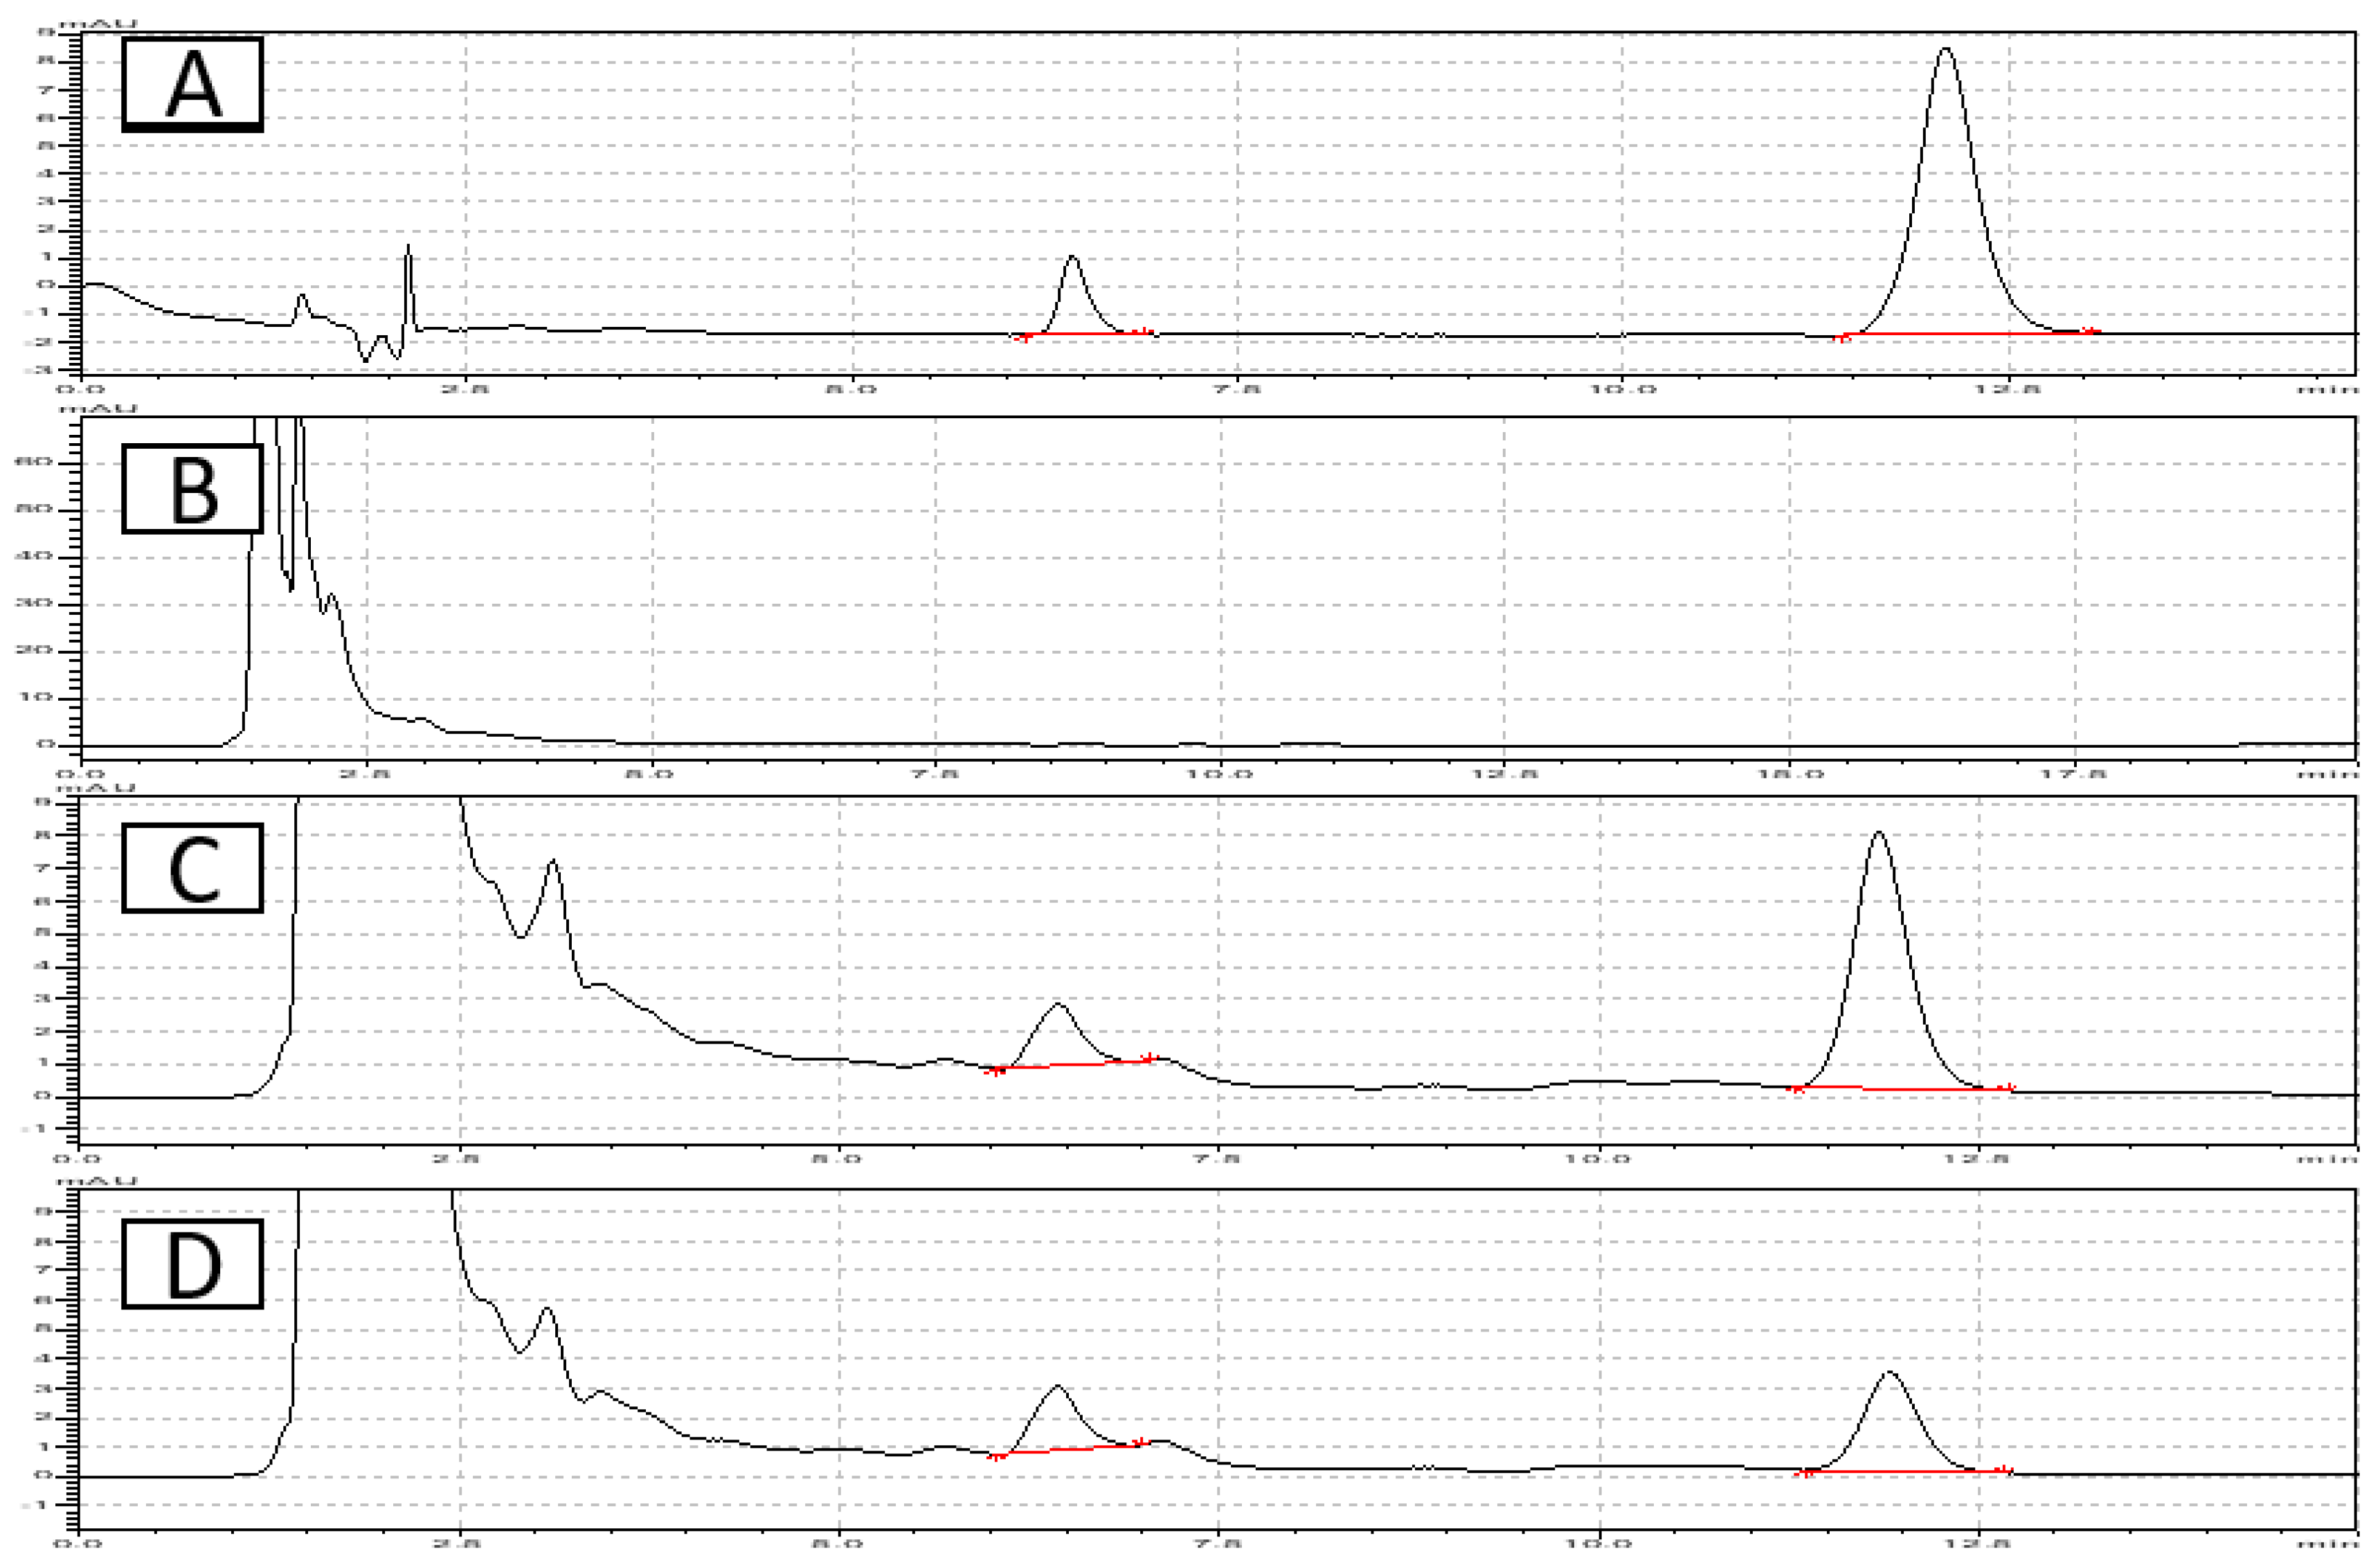
Figure 3.
Linearity curve of etoricoxib in human plasma.
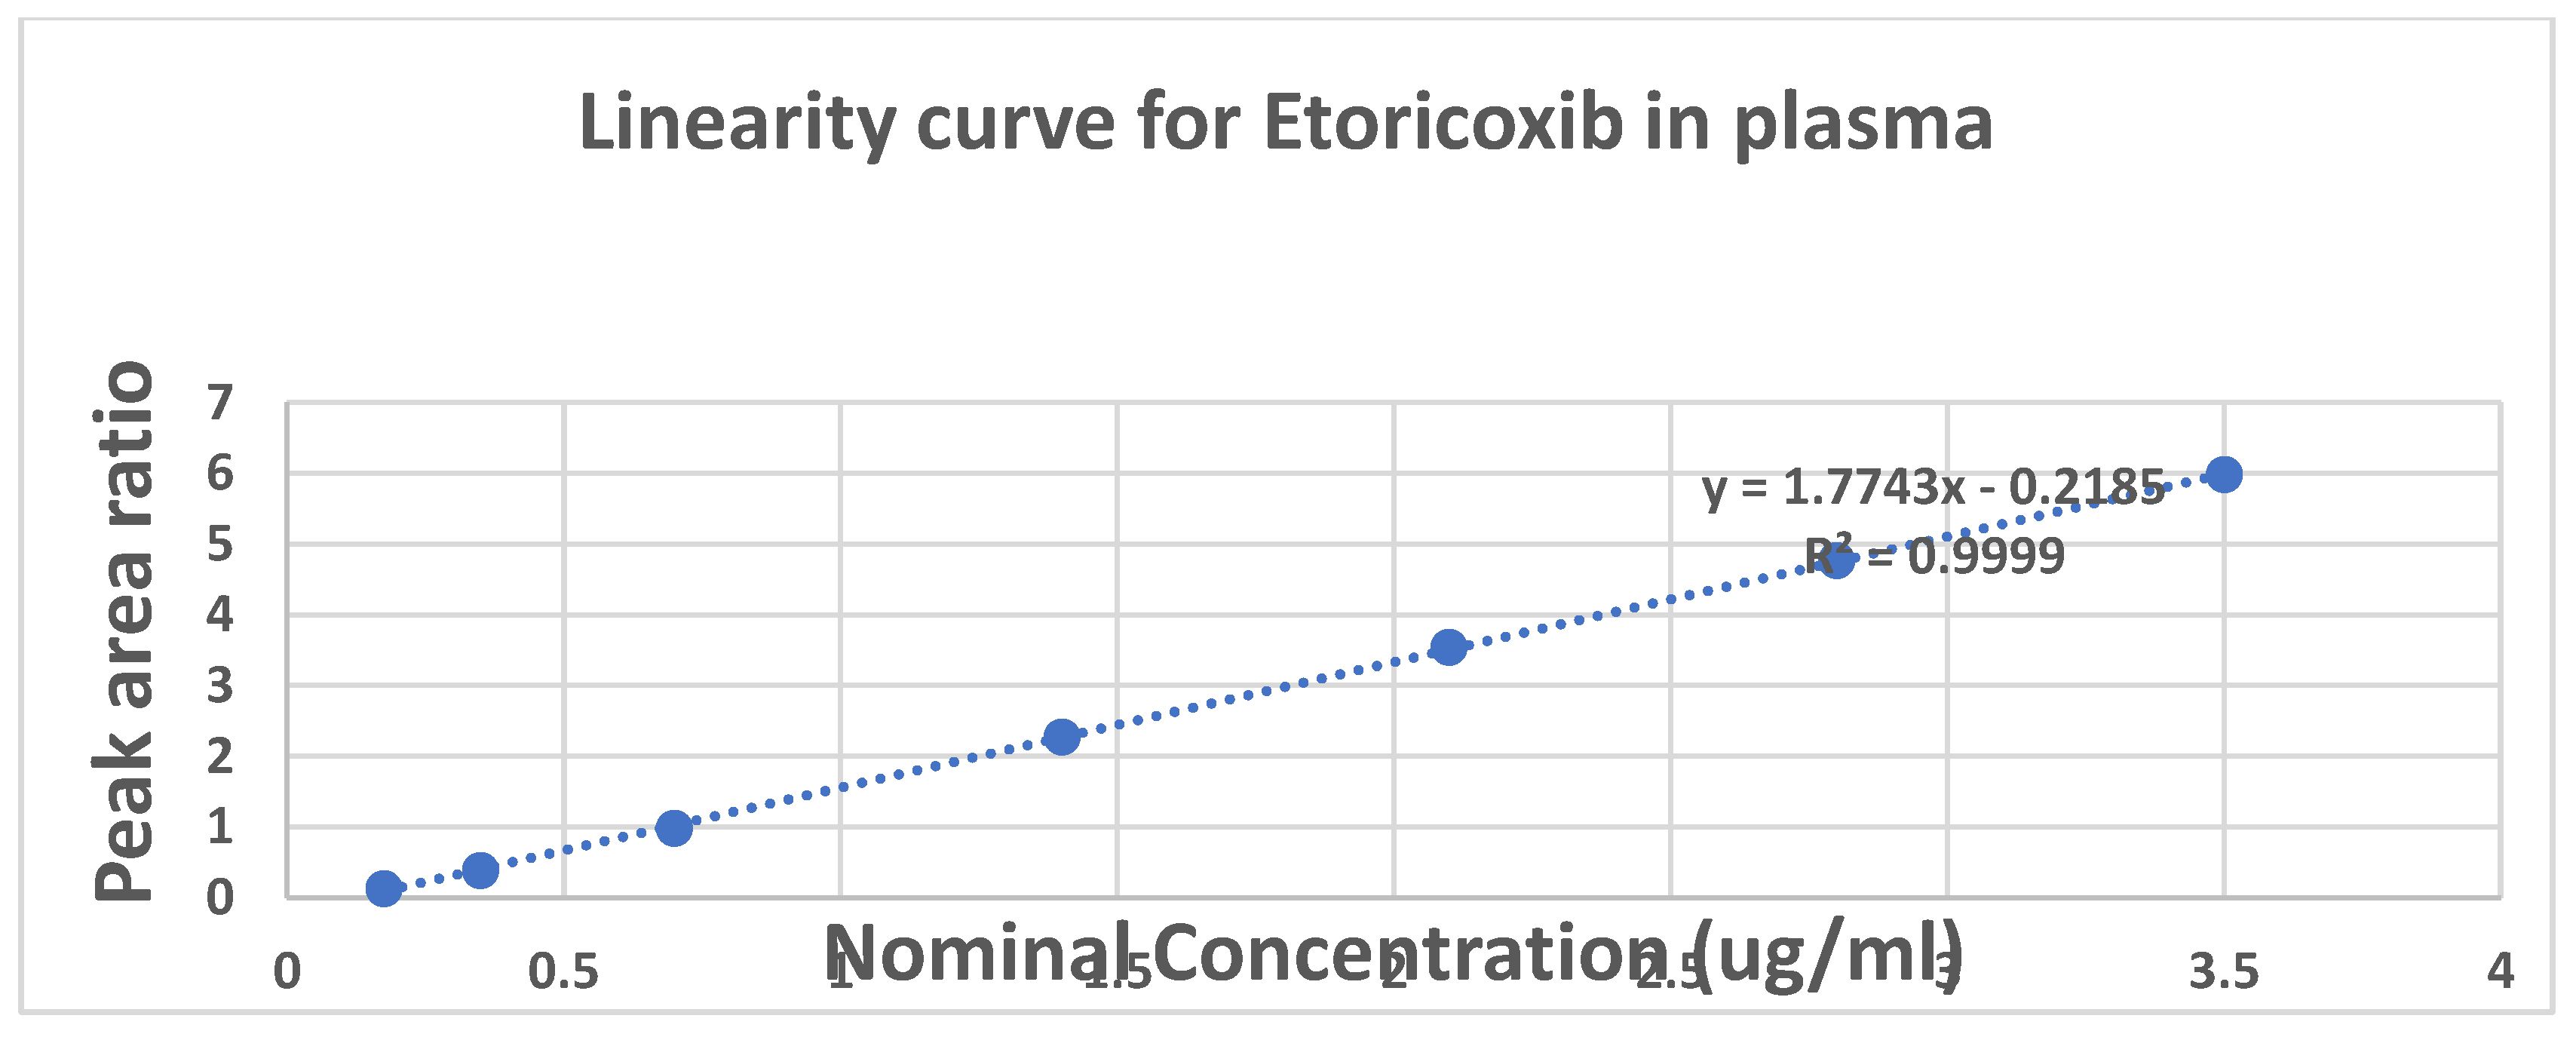
Figure 4.
Concentration vs Time profile of Reference vs test products.
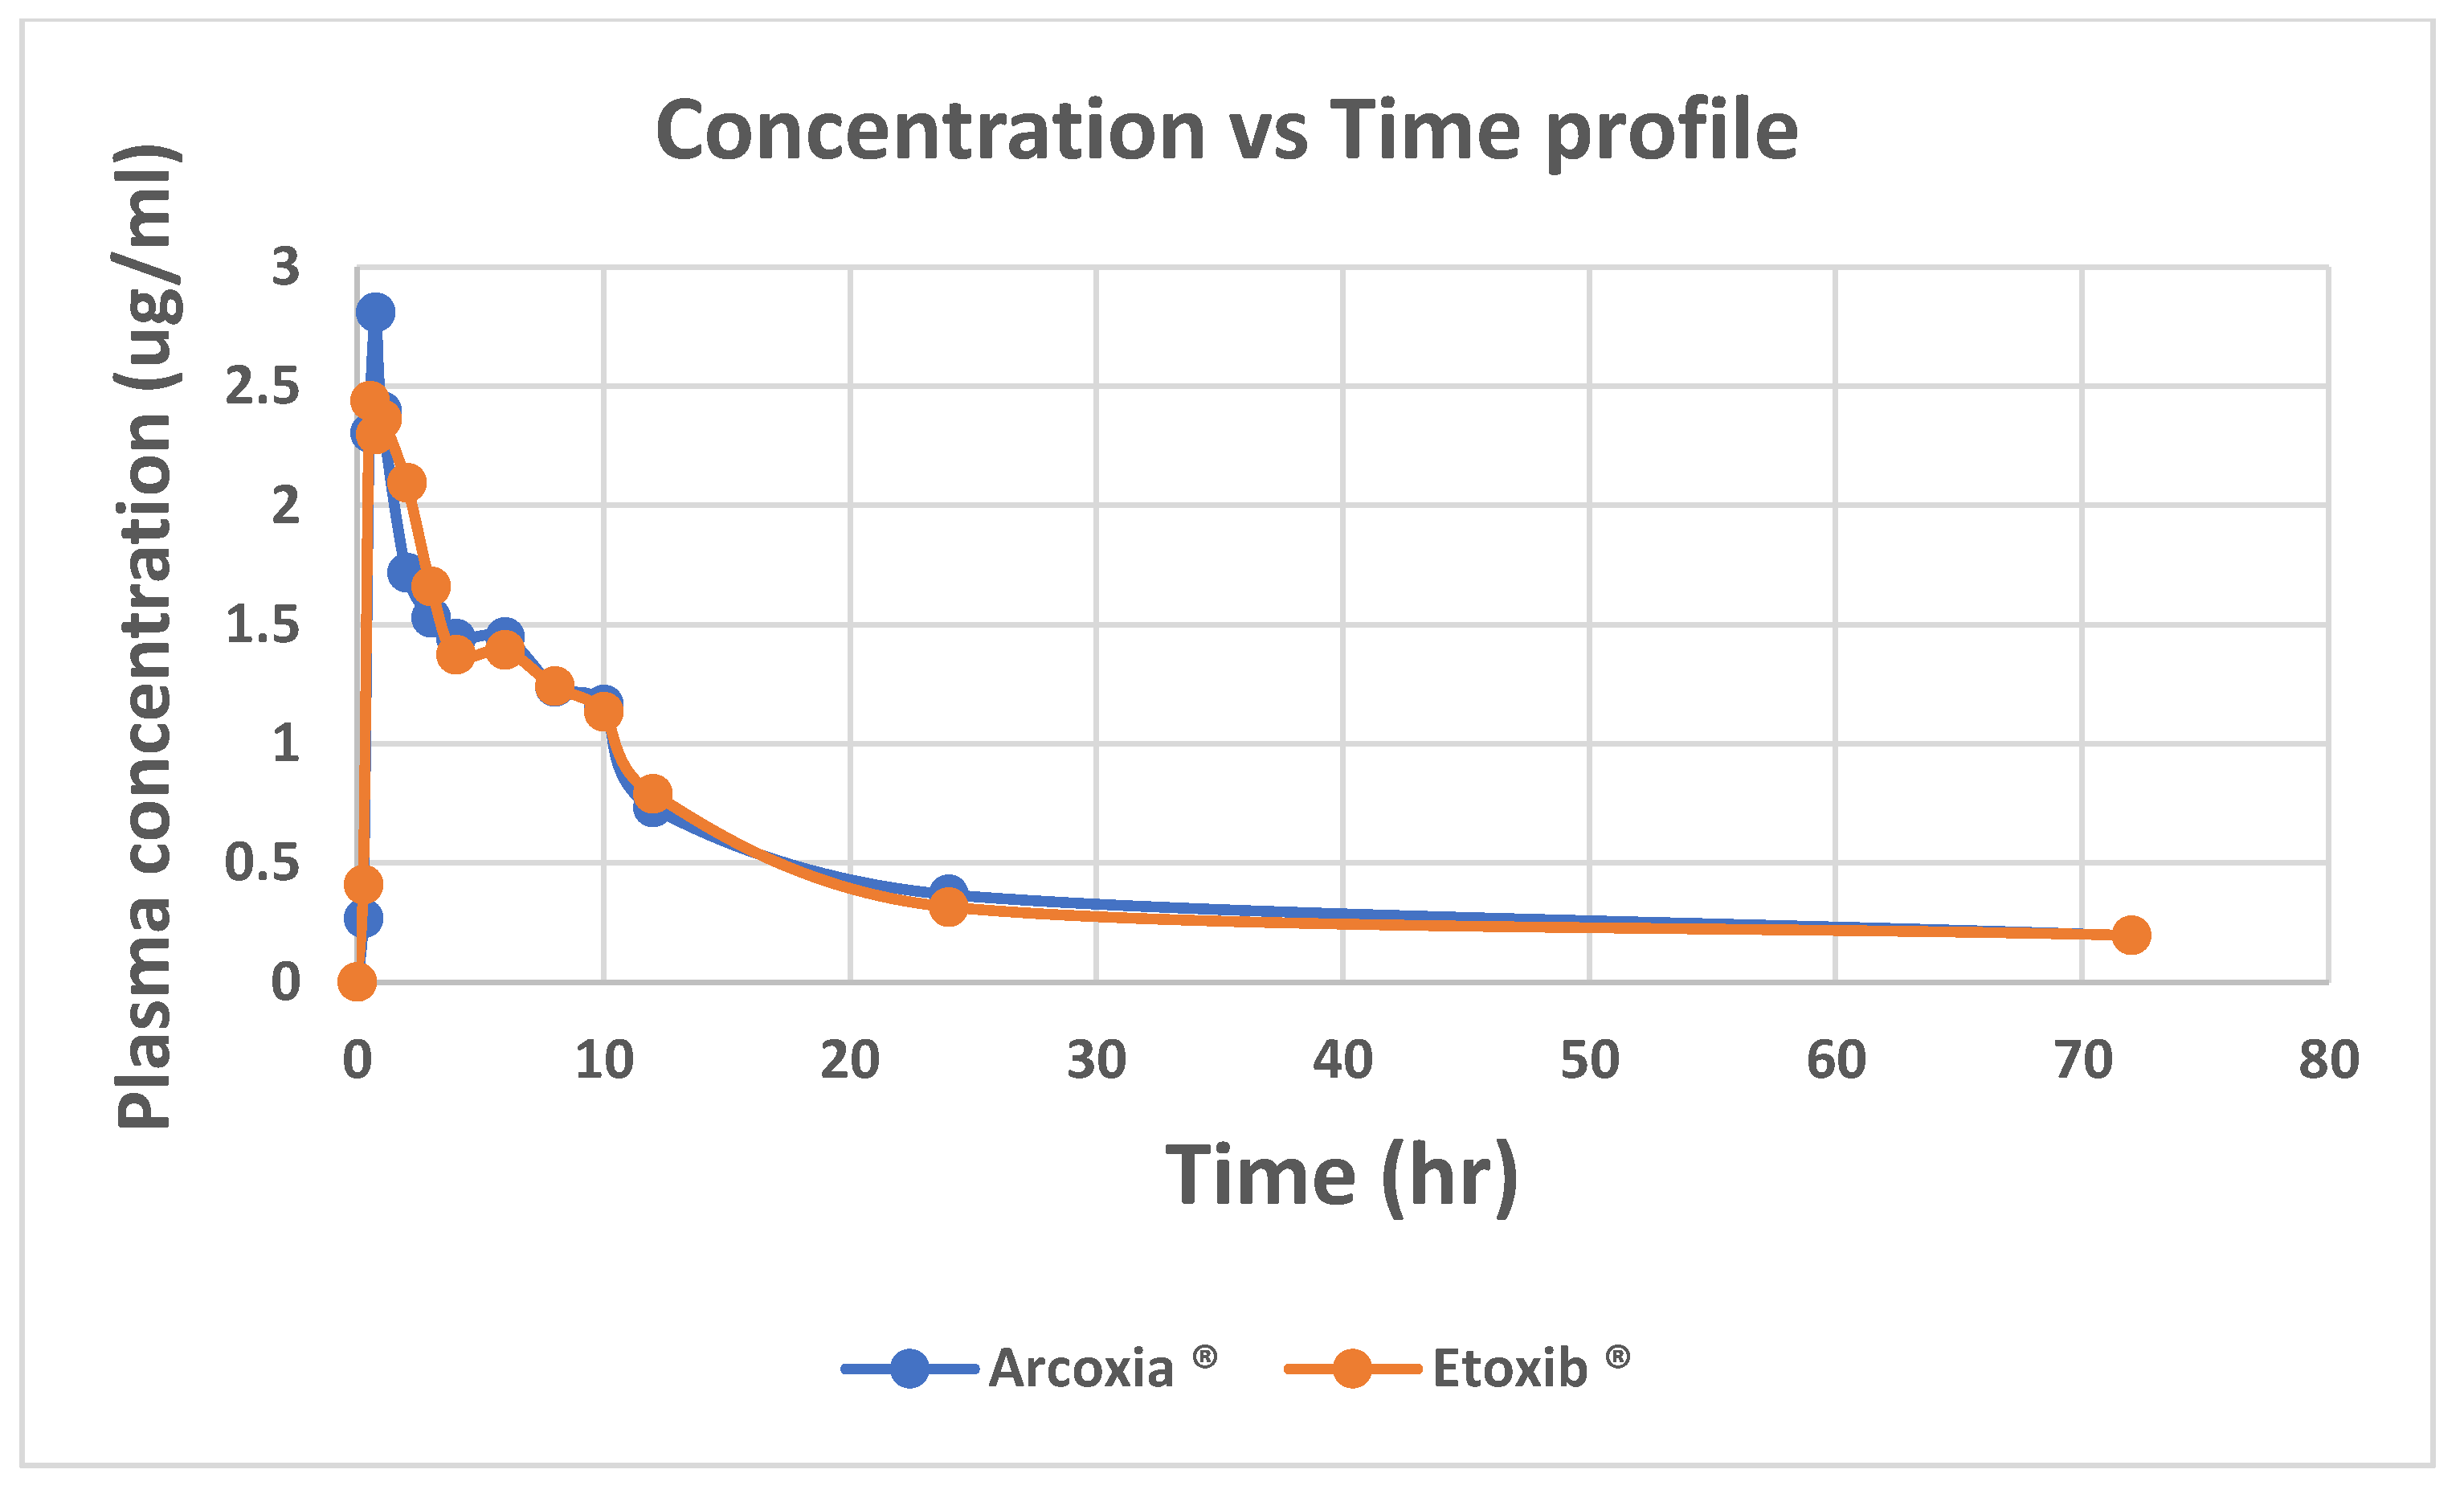
Figure 5.
Observed and predicted plasma concentration vs time curve for A. etoricoxib reference product and B. Test product.
Figure 5.
Observed and predicted plasma concentration vs time curve for A. etoricoxib reference product and B. Test product.
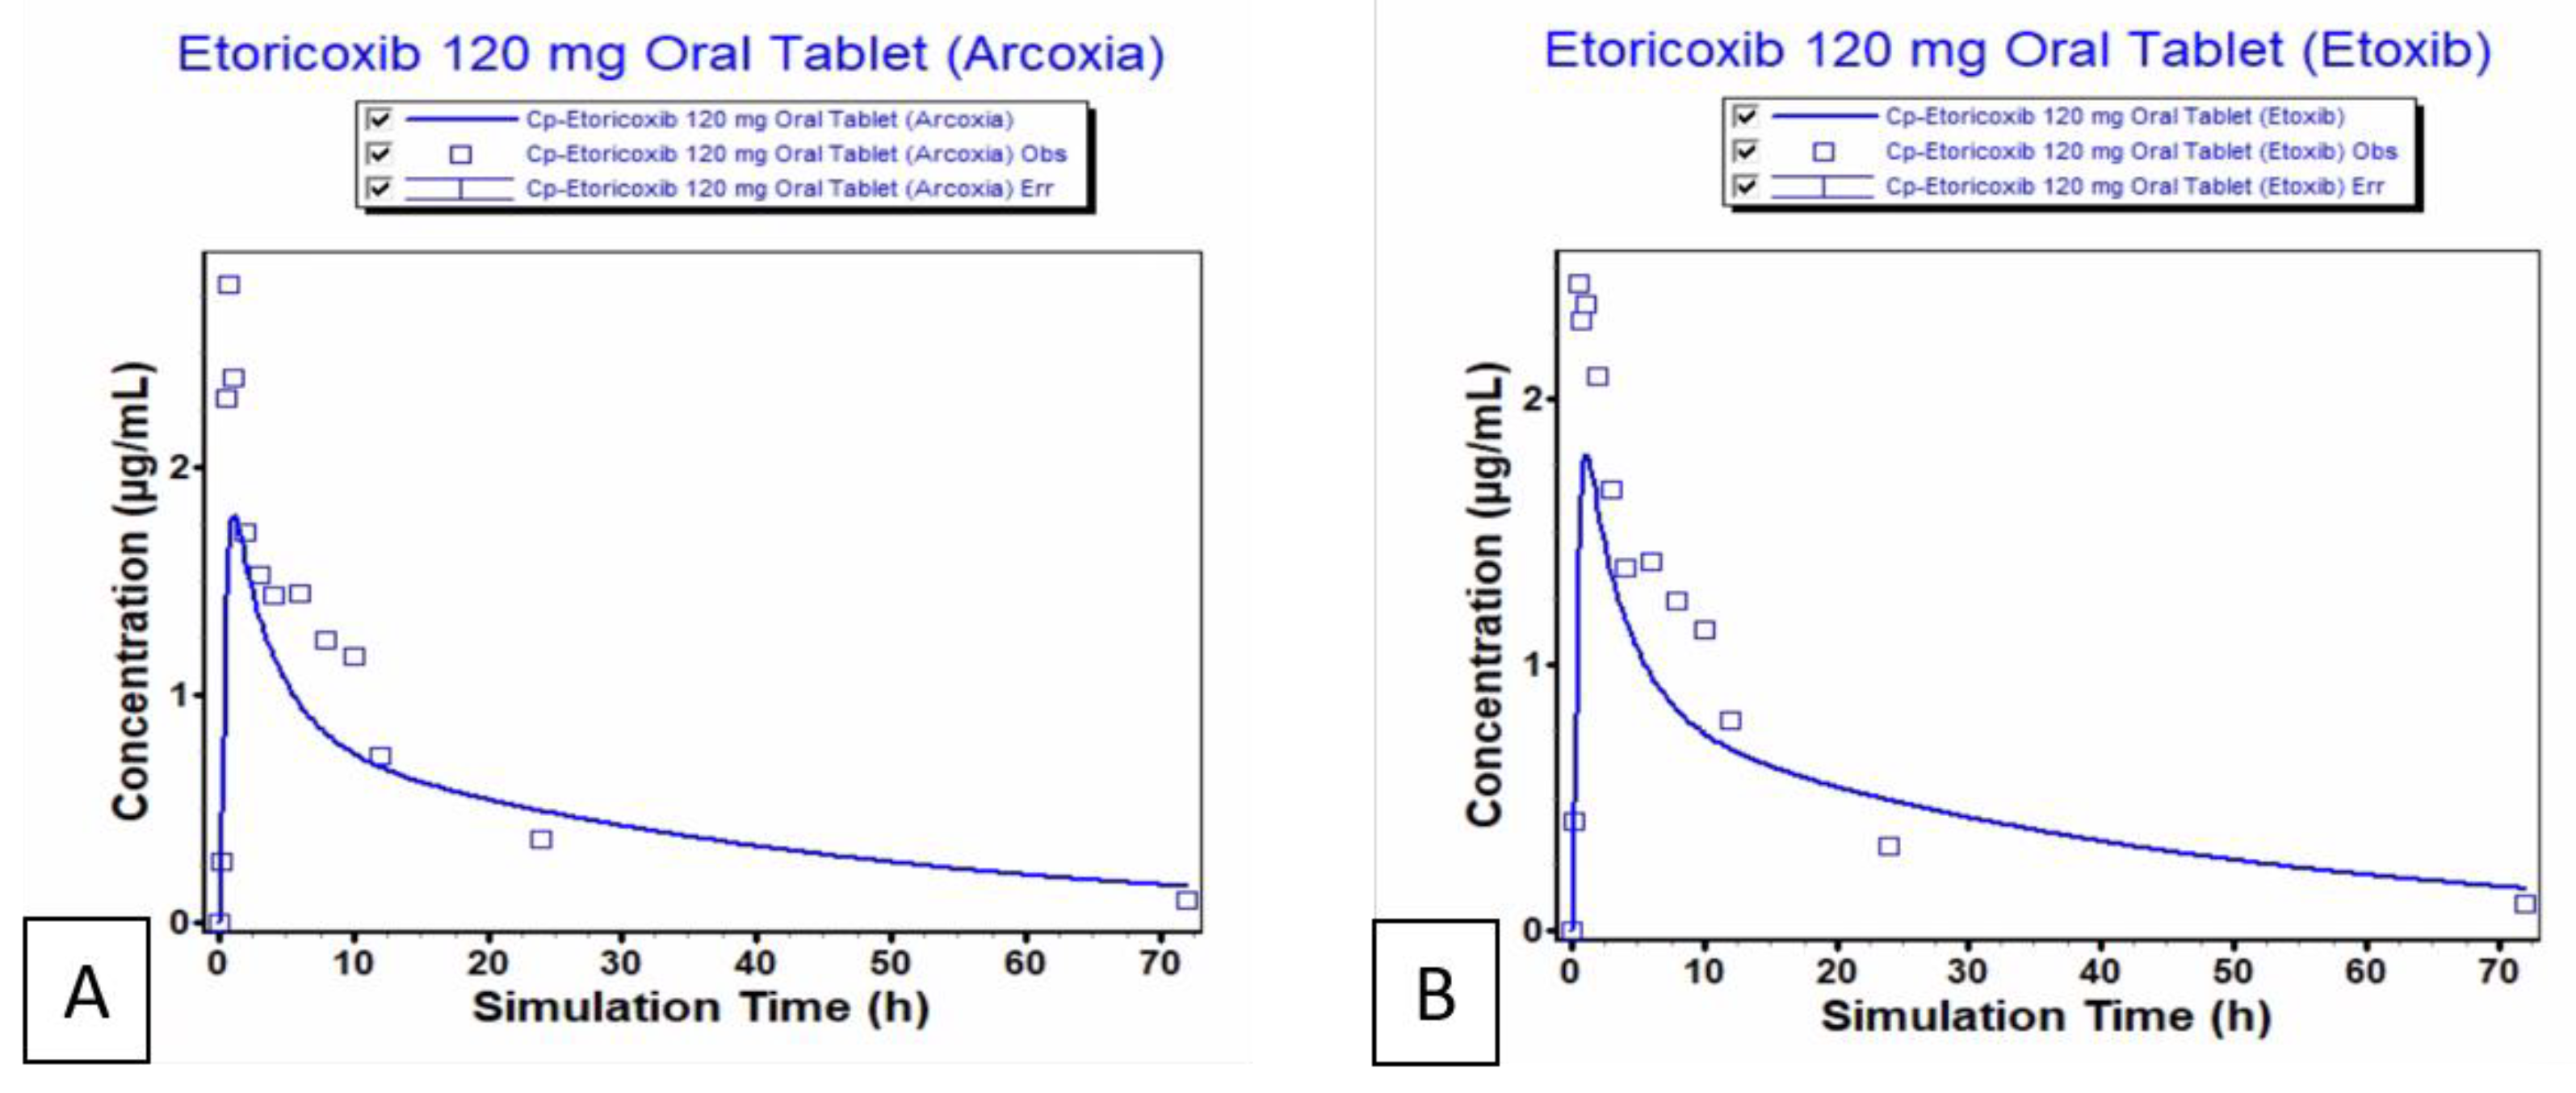

Table 1.
Input values for physiologically based pharmacokinetic (PBPK) model of etoricoxib.
| Parameter | Value | Reference | |
| Log P | 2.794 | 18 | |
| pKa | 4.96 | 18 | |
| Molecular Weight (M/W g/mol) | 358.842 g/mol | 18 | |
| Aqueous Solubility S mg/ml | 0.0767 ± 0.0018 mg/mL | 19 | |
| Jejunal Effective Permeability (Peff) (cm/sec x 10-4 , Fasted State |
4.75 × 10⁻⁴ cm/s | 18 | |
| Human Blood to plasma concentration ratio (Rbp) | 9.2:0.8 (plasma:blood) | 3 | |
| Cl IV (L/h) | 49 ml/min | 4 | |
| Cl Renal (L/h) | 57ml/min | 20 | |
| Cl Biliary (mcL/min/106) | 14.95 | 20 | |
| Vss (L/kg) | 119L | 4 |
Table 2.
Accuracy and precision of the bioanalytical method.
| Concentration Level (µg/ml) | Accuracy and Precision Day 1 |
Accuracy and Precision Day 2 |
Accuracy and Precision Day 3 | ||||||
|---|---|---|---|---|---|---|---|---|---|
| Mean(µg/ml) | SD | %CV | Mean(µg/ml) | SD | %CV | Mean (µg/ml) | SD | %CV | |
| 3.5 | 3.51 | 0.05 | 1.43 | 3.45 | 0.16 | 4.53 | 3.50 | 0.13 | 3.74 |
| 2.8 | 2.84 | 0.044 | 1.54 | 2.75 | 0.08 | 2.75 | 2.75 | 0.10 | 3.49 |
| 2.1 | 2.1 | 0.022 | 1.06 | 2.08 | 0.10 | 4.64 | 2.05 | 0.06 | 3.05 |
| 1.4 | 1.38 | 0.029 | 2.11 | 1.35 | 0.04 | 2.77 | 1.38 | 0.05 | 3.32 |
| 0.7 | 0.71 | 0.035 | 4.91 | 0.71 | 0.03 | 4.80 | 0.71 | 0.03 | 3.75 |
| 0.35 | 0.37 | 0.003 | 0.8 | 0.35 | 0.01 | 3.82 | 0.35 | 0.02 | 5.16 |
| 0.175 | 0.17 | 0.003 | 1.91 | 0.18 | 0.01 | 4.37 | 0.17 | 0.01 | 4.11 |
Table 3.
Inter-day Accuracy and precision for 3 days.
| Concentration Level (µg/ml) | Calculated concentration (ug/ml) | Mean (µg/ml) | SD | %CV | ||
|---|---|---|---|---|---|---|
| Day1 | Day2 | Day3 | ||||
| 3.5 | 3.53 | 3.33 | 3.41 | 3.43 | 0.10 | 2.88 |
| 2.8 | 2.8 | 2.69 | 2.73 | 2.74 | 0.06 | 2.06 |
| 2.1 | 2.07 | 2.00 | 2.06 | 2.04 | 0.04 | 1.75 |
| 1.4 | 1.35 | 1.29 | 1.34 | 1.33 | 0.03 | 2.36 |
| 0.7 | 0.73 | 0.70 | 0.69 | 0.71 | 0.02 | 3.01 |
Table 4.
Results of stability studies of Etoricoxib in plasma.
| Stability parameter | % Recovery | ||
|---|---|---|---|
| QCL | QCM | QCH | |
| Freeze-thaw (24 h) | 98.89 | 100.59 | 96.30 |
| Freeze-thaw (48 h) | 98.42 | 93.43 | 97.70 |
| Freeze-thaw (72 h) | 95.55 | 96.16 | 98.56 |
| Long term (week 1) | 96.67 | 102.20 | 97.15 |
| Long term (week 2) | 95.97 | 100.00 | 98.08 |
| Long term (week 3) | 96.99 | 99.55 | 96.46 |
| Long term ( week 4) | 102.19 | 98.69 | 96.29 |
| Stability week | Week 1 | Week 2 | Week 3 |
| Stock solution (%) ETO | 98.96 | 97.46 | 96.83 |
| Stock solution (%) I.S | 98.57 | 96.86 | 96.30 |
Table 5.
Pharmacokinetic parameters of Etoricoxib (120mg) reference and test products.
| Pharmacokinetic parameter | Arcoxia (120mg) | Etoxib (120mg) |
|---|---|---|
| Cmax | 3124.56 ±0.496 | 2915.25 ±0.350 |
| Tmax | 0.729 ±0.198 | 0.791 ±0.208 |
| AUC 0-t | 3893.91 ±839.58 | 3639.12 ±1308.0 |
| AUC 0-inf | 4554.0 ±886.4 | 4450.68± 1280.68 |
| T1/2 | 25.175 ±6.10 | 23.73 ±6.71 |
Table 6.
Geometric mean ratios at 90% CI of mean pharmacokinetic parameters (log-transformed) of test formulations versus reference product under fasted state.
Table 6.
Geometric mean ratios at 90% CI of mean pharmacokinetic parameters (log-transformed) of test formulations versus reference product under fasted state.
| Parameter | Arcoxia (120mg) (GeoMean) | Etoxib (120mg) (GeoMean) | Geometric Mean Ratio (B/A) | 90% CI |
|---|---|---|---|---|
| Cmax | 3.059 | 2.896 | 0.946 | (0.8855, 1.0135) |
| AUC 0-t | 40.845 | 37.715 | 0.923 | (0.8705, 0.9795) |
| AUC 0-inf | 44.7056 | 42.944 | 0.960 | (0.8955, 1.0255) |
Table 7.
Predicted pharmacokinetic parameters of etoricoxib reference and test products.
| Etoxib® | Arcoxia® | ||||||
|---|---|---|---|---|---|---|---|
| Result | Observed | Simulated | fold error | Result | Observed | Simulated | fold error |
| Cmax (µg/mL): | 2.44 | 1.792 | 1.361 | Cmax (µg/mL): | 2.81 | 1.792 | 1.568 |
| Tmax (h): | 0.6 | 1.1 | 1.833 | Tmax (h): | 0.75 | 1.1 | 1.466 |
| AUC 0-inf (µg-h/mL): | 37.744 | 39.988 | 1.059 | AUC 0-inf (µg-h/mL): | 38.256 | 40.168 | 1.049 |
| AUC 0-t (µg-h/mL): | 33.618 | 33.318 | 1.009 | AUC 0-t (µg-h/mL): | 34.588 | 35.246 | 1.019 |
Disclaimer/Publisher’s Note: The statements, opinions and data contained in all publications are solely those of the individual author(s) and contributor(s) and not of MDPI and/or the editor(s). MDPI and/or the editor(s) disclaim responsibility for any injury to people or property resulting from any ideas, methods, instructions or products referred to in the content. |
© 2025 by the authors. Licensee MDPI, Basel, Switzerland. This article is an open access article distributed under the terms and conditions of the Creative Commons Attribution (CC BY) license (http://creativecommons.org/licenses/by/4.0/).
Copyright: This open access article is published under a Creative Commons CC BY 4.0 license, which permit the free download, distribution, and reuse, provided that the author and preprint are cited in any reuse.


