Submitted:
20 April 2025
Posted:
21 April 2025
You are already at the latest version
Abstract
Probabilistic modeling of net load forecast errors is an important approach for reserve decision-making in power systems with a high penetration of renewable energy. However, existing probabilistic modeling methods face issues such as insufficient estimation accuracy in the small probability interval of the tails or increased complexity in probability decision-making problems. A probabilistic reserve decision-making method based on cumulative probability approximation is proposed. By using key points on the cumulative probability distribution curve of net load forecast error samples, this method enhances the fitting accuracy of the normal distribution model in the small probability interval of the tail, resulting in an optimal reserve outcome with the desired comprehensive expected profit. Using relevant renewable energy output and load data from actual transmission networks in Belgium and Guangdong Province, China, the proposed method demonstrates good practical value.
Keywords:
reserve decision
; net load forecast error
; cumulative probability distribution
; normal distribution model
; key points
; small probability interval of the tail
1. Introduction
The demand for operating reserve capacity in power systems depends on the net load reserve capacity requirement and the contingency reserve capacity requirement [1]. The contingency reserve is generally determined based on the maximum unit generation capacity or the maximum DC import capacity, which is a fixed value independent of load power and renewable energy generation [2]. The net load reserve capacity requirement, on the other hand, depends on load forecast errors and renewable energy output forecast errors. The primary focus of operating reserve decisions lies in net load reserve decisions [3]. Historically, China has set operating reserve capacity based on deterministic criteria, typically ranging from 2% to 5% of the system’s peak load [4]. Deterministic criteria are based on load forecasts and renewable energy forecasts to formulate generation plans, with reserve decisions being manually made. This leads to arbitrariness and blindness in the selection of reserve capacity. When the reserve capacity is too low, it becomes difficult to match the significant fluctuations in renewable energy output and load power, thus jeopardizing system security. Conversely, excessive reserve capacity results in the wastage of reserve resources, affecting the economic efficiency of system operation [5].
With the continuous growth of electricity demand and the ongoing progress in renewable energy technologies, the integration of large-scale wind and solar power generation into the power system has led to a significant increase in the penetration of renewable energy in the grid [6]. The large-scale integration of wind and solar power generation increases the uncertainty of generation output, while the existing deterministic load reserve criteria lack enough theoretical support, resulting in overly conservative scenarios or risky decisions in practical applications [7]. Moreover, the combined uncertainties of renewable energy and load significantly increase the volatility of net load, making it difficult for traditional, experience-based reserve decisions to respond quickly and accurately. There is an urgent need for more precise and flexible reserve decision-making methods [8].
At present, probabilistic modeling of renewable energy output forecast errors and load forecast errors serves as an important basis for analyzing the impact of forecast errors and controlling the consequences of these errors. The reserve decision for high-penetration renewable energy systems heavily depends on the accuracy of the net load forecast error probability model [9,10]. The normal distribution is a commonly used model for fitting renewable energy output forecast errors and load forecast errors [11]. For example, literature [12] adopts a normal distribution to fit the probabilistic model of wind power output forecast errors, thereby facilitating reserve decision-making and comparing it with traditional deterministic criteria. Literature [13] fits the forecast errors of load, wind power, and solar power by using normal distribution models to simplify the aggregation of the respective probability density functions. However, normal distribution is typically used to ensure consistency with the sample mean and standard deviation in practical applications and it lacks adequate precision in estimating the small probability intervals of both tails [14]. Furthermore, statistical results show that the forecast errors of renewable energy output do not strictly follow a normal distribution [15,16]. To improve the overall fitting accuracy of the probability model, some studies adopt other parametric distributions for probabilistic modeling of renewable energy output and load forecast errors, such as the beta distribution [17], Laplace distribution [18], Cauchy distribution [19], Weibull distribution [20] and Gaussian mixture models (GMM) [21]. However, the above methods may increase the complexity of the probabilistic decision problem and negatively impacts the efficiency of solving these problems, while the accuracy of fitting the small-probability regions remains difficult to guarantee [22].
Currently, commonly used probabilistic modeling methods focus on improving the overall fitting accuracy of the probability model. However, for reserve decisions in power systems with a high penetration of renewable energy, no reserve is required when the net load does not exceed the forecast. Hence, the reserve decision model is only related to the probability distribution of net load exceeding the forecasted value [23]. In addition, existing probabilistic reserve decisions are typically based on a certain confidence level to determine the reserve capacity. However, the selection of the confidence level lacks theoretical justification. For example, literature [24,25,26] all propose opportunity constraint approaches based on a certain confidence level, but none provide a theoretical basis for determining the confidence level.
Therefore, this paper proposes a probabilistic reserve decision-making method based on cumulative probability approximation for high-penetration renewable energy power systems. Compared with existing technologies, the advantages of the proposed technical solution are mainly reflected in the following aspects:
- 1)
- The method comprehensively considers three factors: reserve cost, expected generation revenue from reserves, and expected loss due to load shedding. It provides optimal conditions for probabilistic reserve decisions and an iterative solving algorithm, achieving the optimal expected overall benefit in probabilistic reserve decision-making.
- 2)
- The method determines the parameters of the net load forecast error’s normal distribution model based on the key factors influencing the optimality of reserve decisions. By employing cumulative probability approximation at key points, the accuracy of the probabilistic reserve decision results is enhanced.
- 3)
- By selecting key points for cumulative probability approximation, the proposed method effectively improves the fitting accuracy of the cumulative probability in the small probability interval of the tail.
The rest the paper is arranged as follows: Section 2 presents the procedures for the proposed method. Section 3 discusses the required data and the preprocessing operations. Section 4 plots the cumulative probability distribution curve of the samples. Section 5 performs probabilistic reserve decision modeling. Section 6 estimates the parameters of the normal distribution model for net load forecasting errors. Section 7 iteratively solves the reserve results. Section 8 provides a case analysis. Section 9 concludes the paper.
2. Procedures for the Proposed Method
The flowchart of probabilistic reserve decision method based on cumulative probability approximation for high-penetration renewable energy power systems proposed in this paper is shown in Figure 1, which includes the following steps:
- 1)
- Data loading and preprocessing;
- 2)
- Calculation of the cumulative probability distribution of historical net load forecast error sample data;
- 3)
- Probabilistic reserve decision modeling based on the normal distribution probability model of net load forecast errors;
- 4)
- Estimation of the normal distribution model parameters based on cumulative probability approximation at key points;
- 5)
- Probabilistic reserve decision-making based on the normal distribution model of net load forecast errors.
3. Data Loading and Preprocessing
The data required for the reserve decision-making of high-penetration renewable energy power systems include:
- 1)
- historical actual and forecasted data of renewable energy output;
- 2)
- historical actual and forecasted data of load;
- 3)
- unit cost of reserve capacity;
- 4)
- unit revenue from increased power generation during reserve activation;
- 5)
- unit cost of load shedding.
Data preprocessing includes:
- 1)
- subtracting the actual renewable energy output from the historical actual load data at the same time to obtain the actual net load values;
- 2)
- subtracting the forecasted renewable energy output from the historical forecasted load data at the same time to obtain the forecasted net load values;
- 3)
- subtracting the historical forecasted values from the historical actual net load values at the same time to obtain the net load forecast errors.
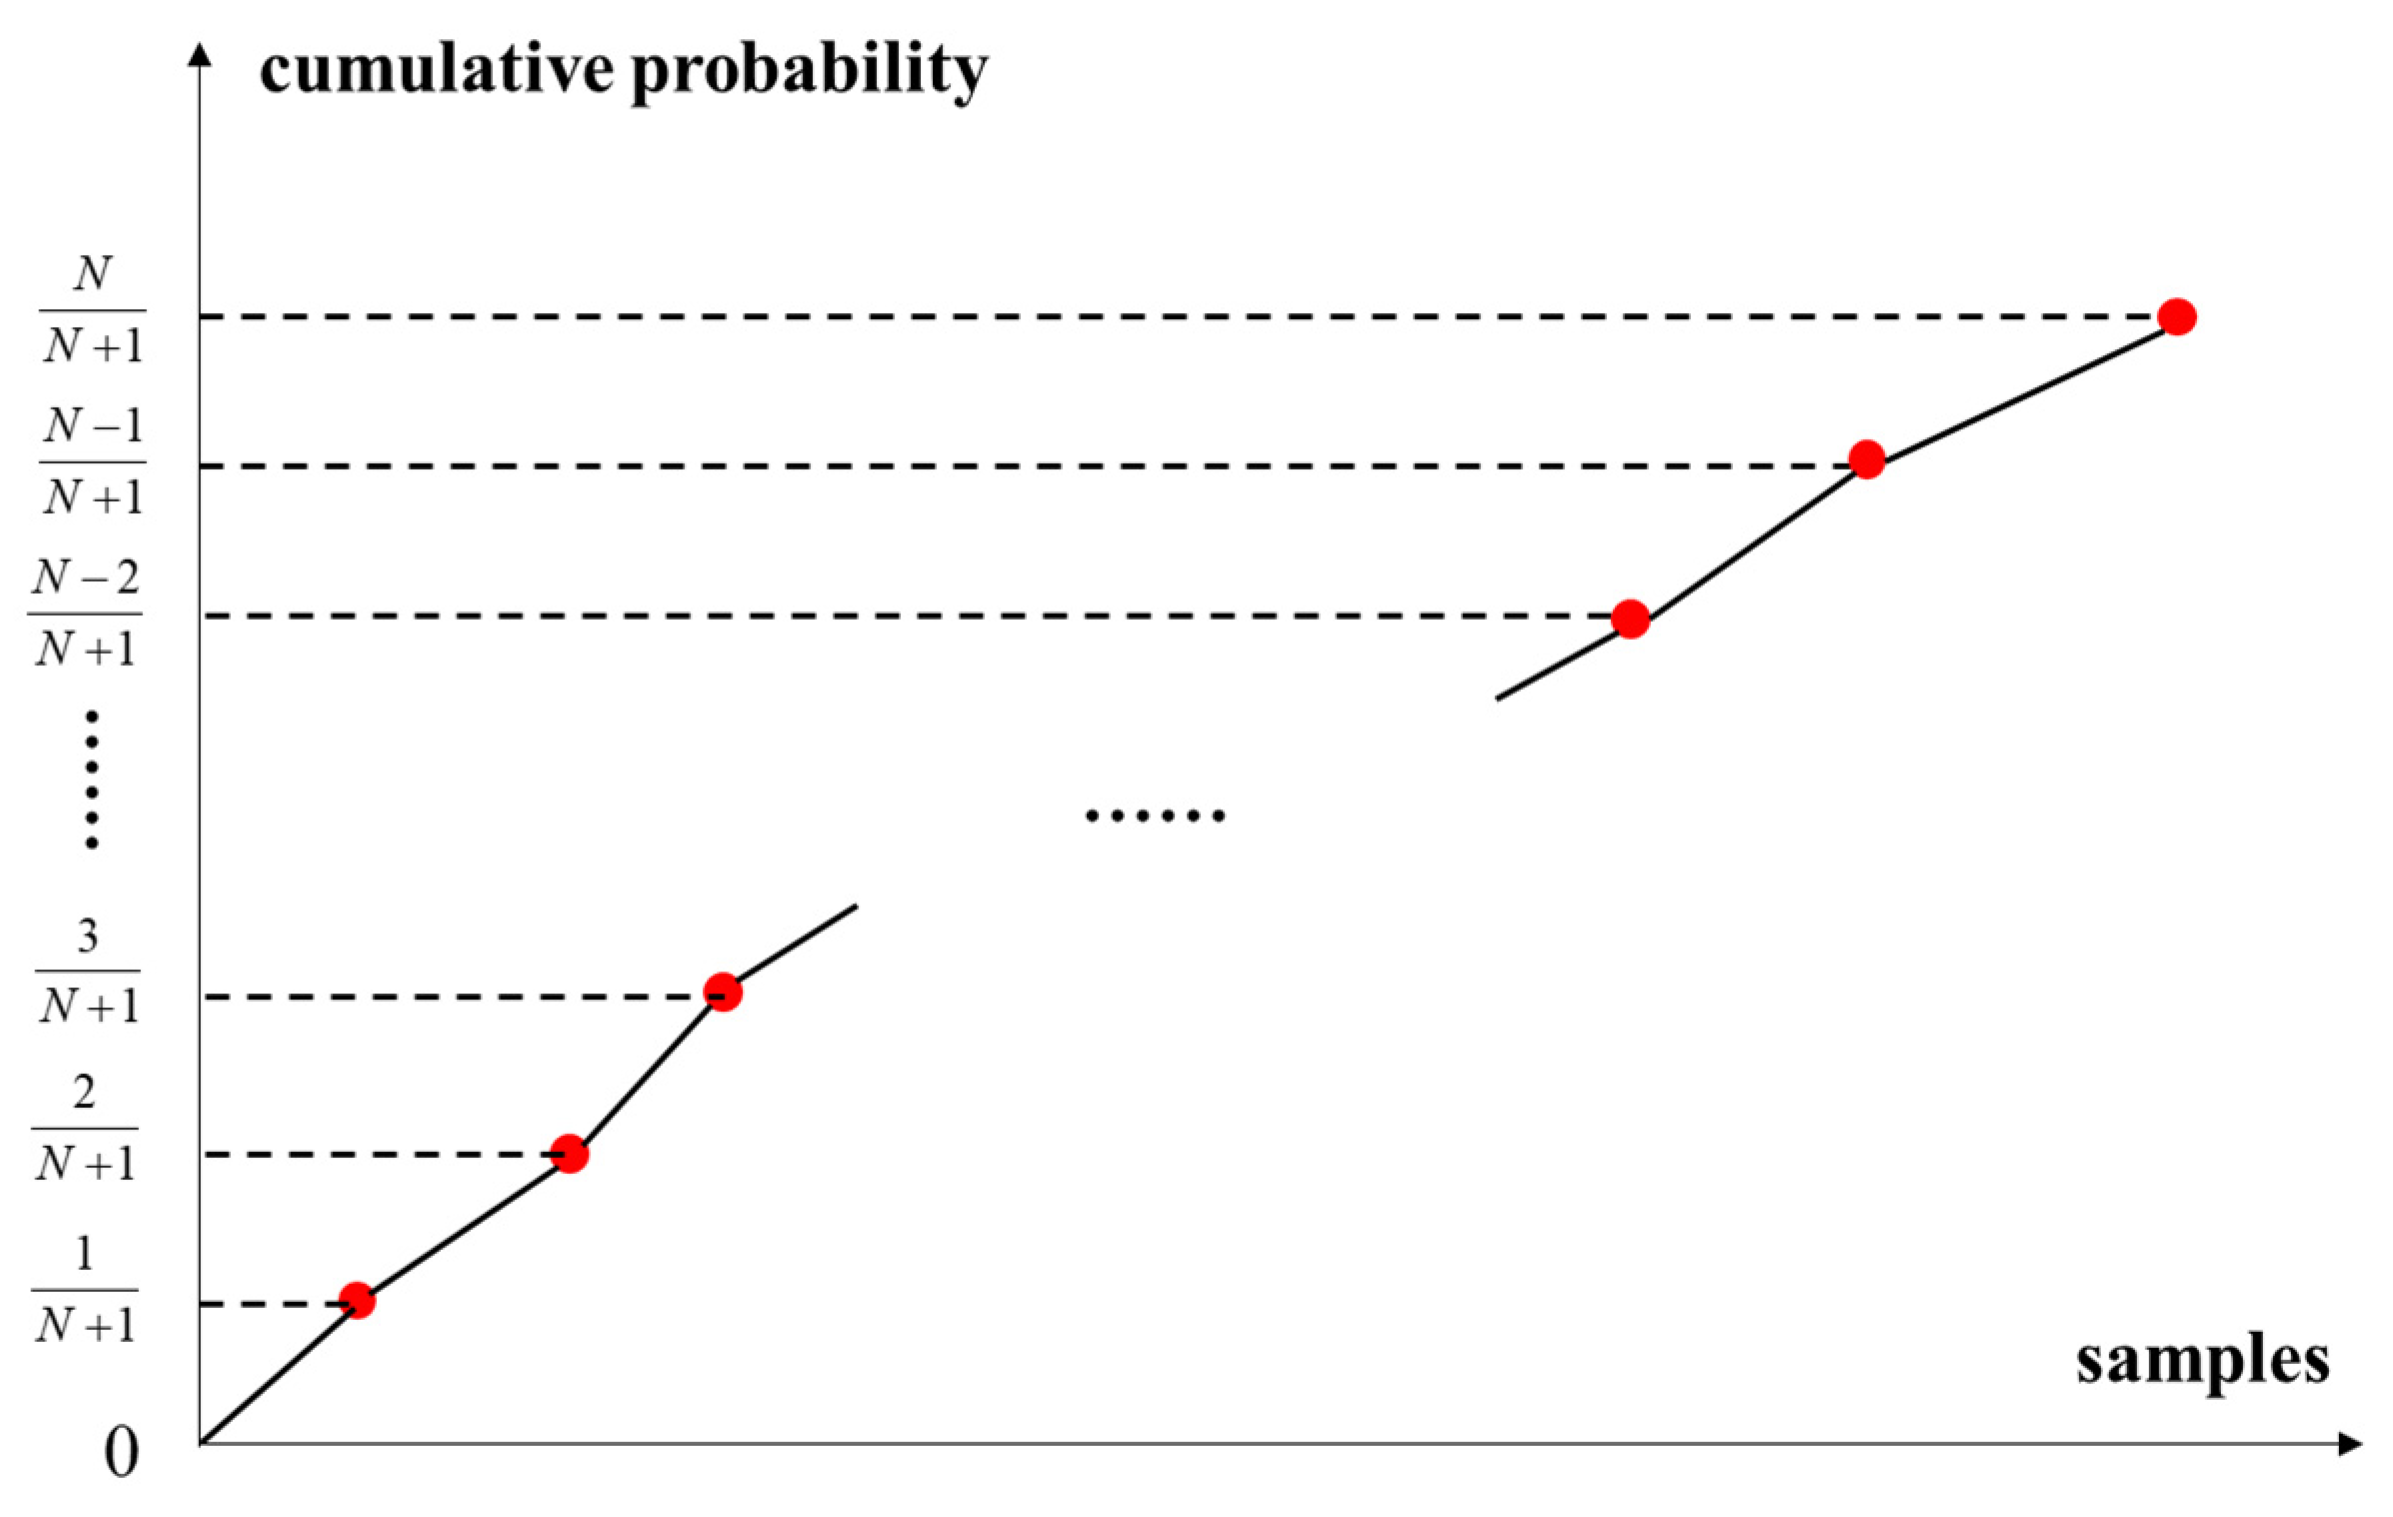
4. Cumulative Probability Distribution Curve of the Net Load Forecast Errors
The net load forecast errors are sorted in ascending order. Assuming the sorted net load forecast errors are , where N represents the number of samples. Each sample corresponds to a probability of . Therefore, the cumulative probabilities for are ,,, respectively. Using the net load forecast errors as the abscissa (x-axis) and the sample cumulative probability as the ordinate (y-axis), the sample points are sequentially connected to form the sample cumulative probability curve. Let γ(x) denote the sample cumulative probability function.
Figure 2.
The cumulative probability distribution curve of net load forecast errors.
5. Probabilistic Reserve Decision Model
The objective of probabilistic reserve decision-making is to minimize the total cost, which is the sum of the reserve configuration cost and the expected cost of power shortage per unit time, after subtracting the revenue from reserve activation:
Where, CR represents the unit cost of reserve capacity, R represents the reserve decision capacity. CEDNS represents the unit cost of power shortage expectation, PEDNS(R) represents the power shortage expectation, which is a function of reserve capacity. CINC represents the unit benefit of additional generation when reserve capacity is dispatched, and PINC(R) represents the expected power generation of reserve capacity.
The normal distribution is commonly used to describe the distribution of forecasting errors in renewable energy output and load prediction. Since the sum or difference of normal distributed random variables also follows a normal distribution, the normal distribution can be used to model the net load forecast error. The probability density function of the normal distribution can be expressed as:
Here, x represents the random variable, which refers to the net load forecast error. μ denotes the mean of the normal distribution, and σ represents the standard deviation of the normal distribution, with .
If the system’s net load forecast error exceeds the reserve capacity of the system, the portion of the load beyond the reserve capacity will be lost, and the system’s power shortage expectation is:
Where, R represents the decision reserve capacity. PEDNS(R) denotes the power shortage expectation, which is a function of the reserve capacity decision.
Where ϕ(⋅) represents the probability density function of the standard normal distribution, and Φ(⋅) represents the cumulative distribution function of the standard normal distribution.
The standard normal distribution refers to a normal distribution with a mean of zero and a standard deviation of one, and its probability density function is:
The expected generation power of the decision reserve capacity consists of two parts: when the net load forecast error x is greater than zero but less than the decision reserve capacity R, the generation power of the reserve capacity is x; when the net load forecast error x exceeds the decision reserve capacity R, the generation power of the reserve capacity is R. Therefore, the expected energy generation of the decision reserve capacity per unit time is:
Where PINC(R) represents the expected generation power per unit time of the decision reserve capacity, which is a function of the decision reserve capacity.
The necessary condition for the extremum of Equation (1) is:
Due to:
By substituting Equations (9) and (10) into Equation (8), we obtain:
By rearranging Equation (9), we obtain:
6. Parameter Estimation of the Normal Distribution Model by Using Key Points
From Equation (12), we can find that the factors influencing the probabilistic reserve decision include the cumulative probability at a net load forecast error of 0, as well as the cumulative probability and probability density at a net load forecast error of R.
Since the normal distribution has only two parameters, the mean and standard deviation, it has only two degrees of freedom. Therefore, the parameters of the normal distribution can be determined by the two points on the cumulative probability distribution curve.
For actual power systems, is close to 1 and is a smaller positive number since CEDNS>>CINC and CEDNS>>CR. The key factors influencing the probabilistic reserve decision are the cumulative probability at a net load forecast error of 0 and at a net load prediction error of R.
To improve the accuracy of the reserve decision as much as possible, the cumulative probabilities of the normal distribution probability model for net load forecast errors at 0 and R are set to be equal to the corresponding sample cumulative probabilities at those positions, i.e.:
Where represents the cumulative probability function of net load forecast error.
From Equations (12), (13) and (14) we have:
Since R is a decision variable, it needs to be determined after the reserve decision and remains an unknown quantity at the time of parameter estimation for the normal distribution model. Considering that is a smaller positive number, the initial value of the decision variable R can be calculated according to Equation (16):
Where the superscript 0 indicates the initial value.
The right end term of Equation (16) can be obtained from the original parameters and the sample data. Thus, R(0) can be obtained by linear interpolation of the sample cumulative probability curves.
Comparison of Equation (15) and Equation (16) shows that:
Since the sample cumulative probability curve is monotonically increasing:
Equation (18) shows that R(0) is a lower bound for the probabilistic reserve decision.
By applying R(0) from the alternative expression (14) of R, we obtain:
It can be obtained from Equation (13) that:
It can be obtained from Equation (19) that:
By solving Equations (20) and (21) simultaneously, we obtain:
The solution of Equations (22) and (23) requires the use of the cumulative probability curve of the standard normal distribution to obtain the quantiles from the cumulative probability.
The cumulative probability table of the standard normal distribution can be obtained through numerical integration. The cumulative probability of the standard normal distribution possesses the following properties:
Due to , it is enough in practice to construct a cumulative probability table of the standard normal distribution for the range [0, 5]. For values exceeding 5, the cumulative probability can be approximated as 1, which meets the accuracy requirements for engineering applications. When constructing the cumulative probability table of the standard normal distribution via numerical integration, it is recommended to use a small integration step size (e.g., 0.0001) to ensure numerical accuracy. When using the table lookup method, linear interpolation can be applied between the data intervals to obtain the cumulative probability corresponding to a specified value. The integral formula for the cumulative probability within the range [0, 5] is as follows:
The numerical integration formula for calculating the cumulative probability of the standard normal distribution is as follows:
Where represents the integration step size and k denotes the number of integration steps.
7. Probabilistic Reserve Decision-Making
After determining the mean and standard deviation of the forecast error normal distribution model, the reserve decision variable R can be obtained based on the optimality conditions of Equation (12).
Since the right-hand side of Equation (12) contains the decision variable R, which poses challenges for direct numerical solution, an iterative method based on Equation (28) is constructed to solve this.
In the equation, the superscript i represents the iteration number.
The solution of Equation (28) also requires the use of the standard normal distribution cumulative probability table to obtain the quantile from the cumulative probability.
If the deviation between two consecutive iteration results is smaller than the predefined allowable error, the iteration converges, and R(i+1) is taken as the probabilistic reserve decision result. The convergence criterion is set as follows:
Where represents the allowable error.
8. Case Analysis
8.1. Case Test of Belgian Transmission Network
Firstly, a case study analysis is conducted by using the relevant data from Belgian transmission network, published by the Elia Group [27]. The frequency distribution histogram of the net load forecast errors for a specific year of this transmission network is shown in Figure 3. The cumulative probability distribution curve of the net load forecast errors is shown in Figure 4.
It can be observed that situations where the net load significantly exceeds expectations (with net load forecast errors greater than 1000 MW) are concentrated in the tail cumulative probability of less than 2%.
Let the unit cost of load shedding, CEDNS, be 1000 $/(MW·h) [28], the unit cost of reserve capacity, CR, be 20 $/(MW·h) [29], and the unit revenue from additional generation during reserve activation, CINC, be 5 $/(MW·h) [30]. According to Equation (16), it can be obtained:
R(0)=1141.14MW
Further, based on Equations (22) and (23), the parameters of the normal distribution probability model for net load forecast errors can be obtained:
μ=228.19
σ=428.53
The iterative solution is carried out according to Equation (28), setting the permissible deviation of the results from two adjacent iterations to be 0.01. The programming is carried out on the MATLAB R2022b software platform, taking 0.3201 seconds. After 4 iterations, the result converges. The final reserve decision-making value was:
R=1152.40MW
It can be found that the final value R obtained for the reserve decision-making is larger than the initial value R(0), which is consistent with the conclusion in the theoretical derivation.
We use two key points on the sample cumulative probability distribution curve to obtain the two key parameters of the net load forecast error normal distribution model: the mean (μ) and the standard deviation (σ). If the sample mean () and standard deviation (s) are directly taken as the parameters of the normal distribution model:
The two obtained normal distribution models and the frequency distribution histogram of the net load forecast errors from Belgian transmission network, are plotted together, and the result is shown in Figure 5:
The normal distribution obtained by using the method proposed in this paper is denoted as Model 1. The normal distribution obtained by using the sample mean and standard deviation is denoted as Model 2. From the Figure 5, it can be observed that Model 1 fits the small probability interval of the tail much more accurately than Model 2. Furthermore, when the normal distribution parameters of Model 2 are directly substituted into the reserve decision-making iteration model, the obtained reserve decision result is 997.87 MW, indicating that the reserve result obtained by Model 2 is riskier.
8.2. Case Test of Guangdong Power Grid in China
The second case study analysis is conducted by using the relevant data from Guangdong Province, China. All the parameter values are the same as those in Section 8.1.
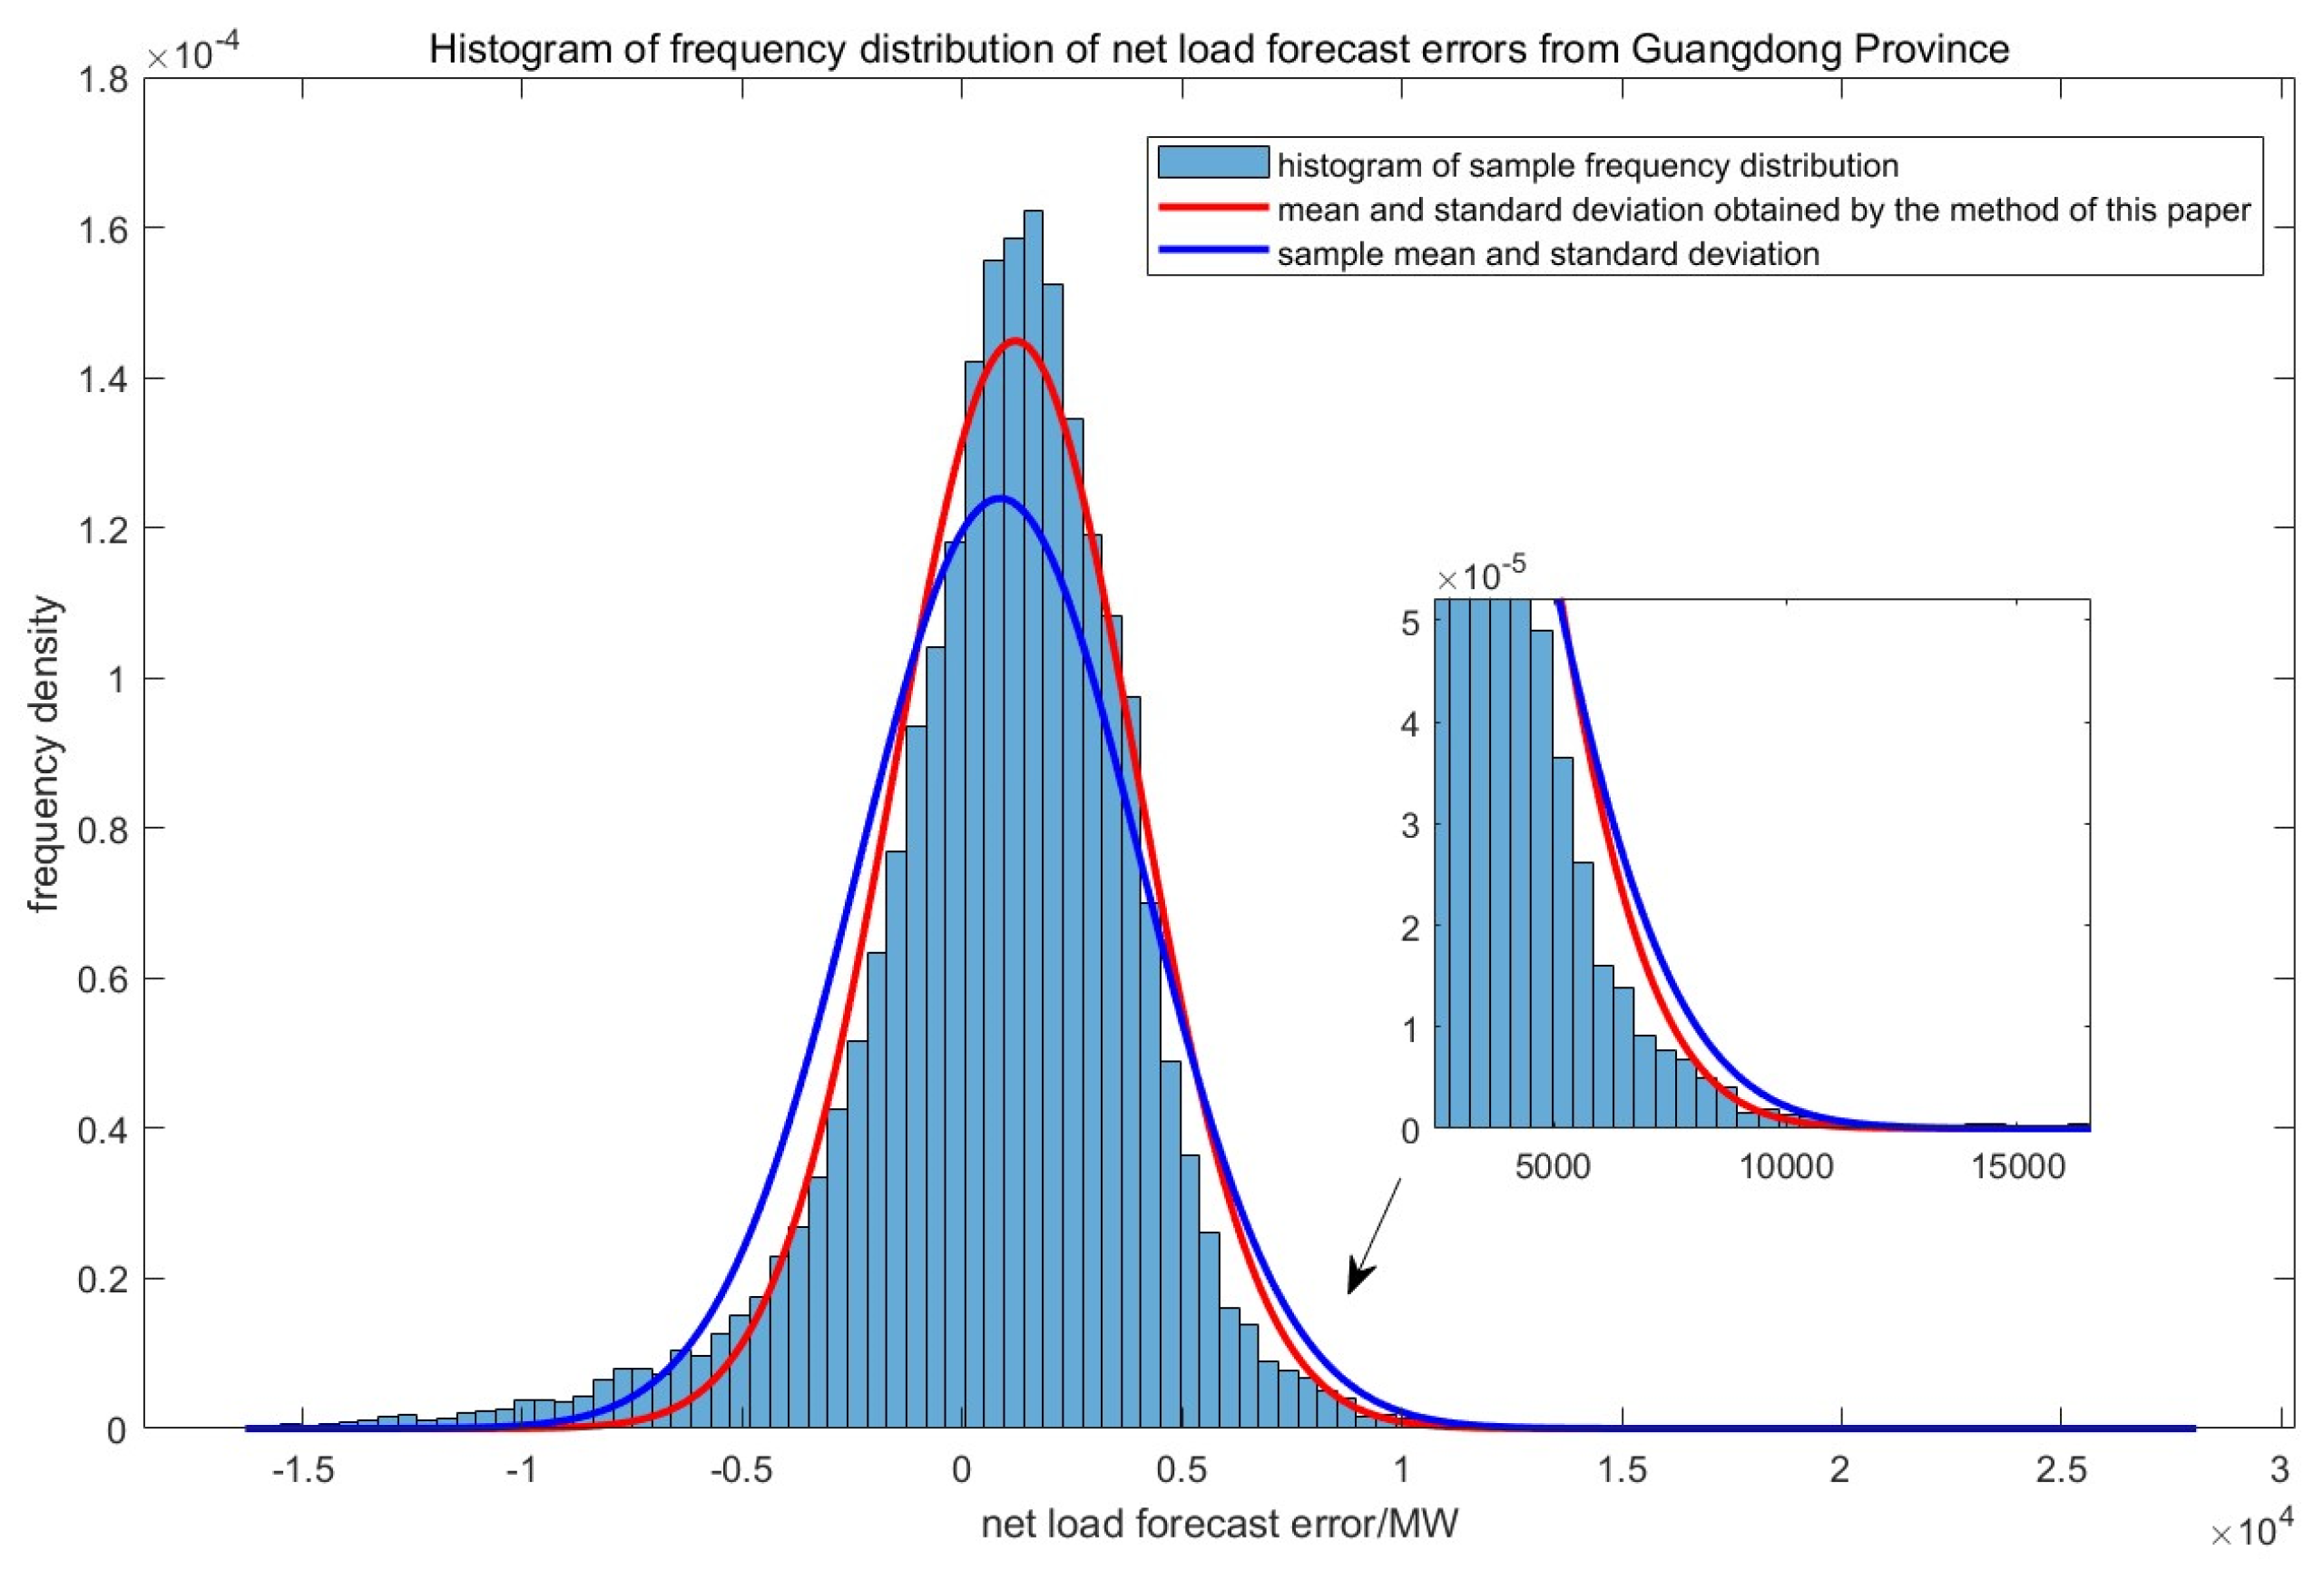
Model 1 (the normal distribution model obtained by using the method proposed in this paper, μ=1210.27, σ=2753.80) takes 4 iterations and 0.4967 seconds, yielding a reserve result of 7135.77 MW. Model 2 (the normal distribution obtained by using the sample mean and standard deviation) takes 5 iterations and 0.3422 seconds, yielding a reserve result of 7758.21 MW. The two obtained normal distribution models and the frequency distribution histogram of net load forecasting errors from Guangdong Province, China, are plotted together, as shown in Figure 6.
From the Figure 6, it can be observed that Model 1 fits the small probability interval of the tail much more accurately than Model 2. Additionally, the reserve decision result obtained by Model 2 is more conservative.
8.3. Result Analysis
Based on the above, the probabilistic reserve decision-making method proposed in this paper has the following mathematical advantages:
- 1)
- The normal distribution model obtained through fitting the key points provides a better fit for the small probability interval of the tail.
- 2)
- Since the normal distribution is still used to fit the net load forecast error variable, compared to other parameter distributions, the method has a lower computational complexity and is easier to compute.
9. Conclusion
This paper proposes a probabilistic reserve decision-making method for high-penetration renewable energy power systems based on cumulative probability approximation. It comprehensively considers three factors: reserve cost, expected generation revenue from reserves, and expected loss due to load shedding. While using a normal distribution model to fit the net load forecast error variable, the method improves the fitting accuracy in the small probability interval of the tail, demonstrating good practical value.
It is worth noting that this paper does not consider the limitations of transmission line capacity in the power system. Moreover, with the increasing frequency of extreme weather in recent years, the power grid is prone to N-k line failures during such events. Therefore, considering transmission line capacity and N-k line failures in reserve decision making will be a direction for future research.
Author Contributions
Conceptualization, Y.Y., Z.M. and G.W.; methodology, Z.Y. and R.G.; software, R.G. and Z.Y.; validation, Z.Y.; formal analysis, R.G.; investigation, Y.Y., Z.M. and G.W.; writing—original draft preparation, Z.Y. and R.G.; writing—review and editing, Z.Y. and R.G.; supervision, Y.Y., Z.M. and G.W. All authors have read and agreed to the published version of the manuscript.
Funding
This study is supported by Science and Technology Project of Guangdong Power Grid Corporation (Project No.: GDKJXM20230802).
Data Availability Statement
Publicly available datasets were analyzed in Section 8.1 of this study. This data can be found here: https://www.elia.be/en/grid-data/power-generation/wind-power-generation (accessed on 17 March 2025).
Conflicts of Interest
The authors declare no conflict of interest.
References
- Cai, Z.; Ding, Q.; Cui, H.; Dai, S.; Li, Q.; Li, Y.X. Configuration Scheme of Provincial Reserve Capacity in Regional Power Grid (Part Ⅱ): Optimization Model. Proc. CSEE. 2023, 43, 1037-1045.
- Liu, Y.K.; Tang, Z.; Wu, L. On Secured Spinning Reserve Deployment of Energy-Limited Resources Against Contingencies. IEEE Trans. Power Syst. 2022, 37, 518-529. [CrossRef]
- Li, B.; Li, H.R.; Liang, Z.C.; Bai, X.Q. Load Day-Ahead Automatic Generation Control Reserve Capacity Demand Prediction Based on the Attention-BiLSTM Network Model Optimized by Improved Whale Algorithm. Energies, 2024, 17, 414. [CrossRef]
- Li, P.; Li, F.T.; Song, X.F.; Zhang, G.H. Considering the Flexible Load New Energy Access System Optimization for Spinning Reserve. Power Syst. Technol. 2021, 45, 1288-1295.
- Liu, S.; Yang, Y.; Yang, Z.F.; Chen, Q.X. Reserve Capacity Determination and Its Cost Allocation Considering Stochastic Characteristics of Renewable Energy. Autom. Electr. Power Syst. 2023, 47, 10-18.
- Shi, Y.S.; Guo, R.P.; Tang, Y.C.; Lin, Y.; Yang, Z.X. Integrated Transmission Network Planning by Considering Wind Power’s Uncertainty and Disasters. Energies 2023, 16, 5336. [CrossRef]
- Zhang, N.; Li, Y.; Ding Q.; Zhang, X.; Jiang, H.; Li, W. An Inertia Reserve Capacity Planning Method for Power Systems Considering Risk Preference. IEEE Access 2024, 12, 87728-87741. [CrossRef]
- Huang, H.Y.; Zhou, M.; Li, G.Y. An Endogenous Approach to Quantifying the Wind Power Reserve. IEEE Trans. Power Syst. 2020, 35, 2431-2442. [CrossRef]
- Parker, K.; Barooah, P. A Probabilistic Method for Reserve Sizing in Power Grids with High Renewable Penetration. IEEE Trans. Power Syst. 2021, 36, 2473-2480. [CrossRef]
- Xu, Y.; Wan, C.; Liu, H.; Zhao, C.; Song, Y. Probabilistic Forecasting-Based Reserve Determination Considering Multi-Temporal Uncertainty of Renewable Energy Generation. IEEE Trans. Power Syst. 2024, 39, 1019-1031. [CrossRef]
- Min, C.G.; Park, J.K.; Hur, D.; Kim, M.K. A risk evaluation method for ramping capability shortage in power systems. Energy 2016, 113, 1316-1324. [CrossRef]
- Ortega-Vazquez, M.A.; Kirschen, D.S. Estimating the Spinning Reserve Requirements in Systems with Significant Wind Power Generation Penetration. IEEE Trans. Power Syst. 2009, 24, 114-124. [CrossRef]
- Rahmann, C.; Heinemann, A.; Torres, R. Quantifying operating reserves with wind power: Towards probabilistic–dynamic approaches. IET Gener. Transmiss. Distrib. 2016, 10, 366-373. [CrossRef]
- Dingec, K.D.; Hormann, W. Efficient Algorithms for Tail Probabilities of Exchangeable Lognormal Sums. Methodol. Comput. Appl. Probab. 2022, 24, 2093-2121. [CrossRef]
- Li, S.H.; Dong, W.C.; Huang, J.J.; Wu, Z.Y.; Zhang, H. Wind power system reliability sensitivity analysis by considering forecast error based on non-standard third-order polynomial normal transformation method. Electr. Power Syst. Res. 2019, 167, 122-129. [CrossRef]
- Eltohamy, M.S.; Talaat, H.E.A.; Moteleb, M.S.A.; Mekhamer, S.F.; Omran, W.A. A Probabilistic Methodology for Estimating Reserve Requirement and Optimizing Its Components in Systems with High Wind Penetration. IEEE Access, 2022, 10, 106148-106168. [CrossRef]
- Yang, H.; Yuan, J.S.; Zhang, T.F. A Model and Algorithm for Minimum Probability Interval of Wind Power Forecast Errors Based on Beta Distribution. Proc. CSEE. 2015, 35, 2135-2142.
- Gayathry, V.; Kaliyaperumal, D.; Salkuti, S.R. Seasonal solar irradiance forecasting using artificial intelligence techniques with uncertainty analysis. Sci. Rep. 2024, 14, 17945. [CrossRef]
- Xu, S.W.; Wu, W.C.; Yang, Y.; Wang, B.; Wang, X.H. Analytical solution of stochastic real-time dispatch incorporating wind power uncertainty characterized by Cauchy distribution. IET Renew. Power Gener. 2021, 15, 2286-2301. [CrossRef]
- Shirzadi, N.; Nasiri, F.; Menon, R.P.; Monsalvete, P.; Kaifel, A.; Eicker, U. Smart Urban Wind Power Forecasting: Integrating Weibull Distribution, Recurrent Neural Networks, and Numerical Weather Prediction. Energies, 2023, 6208. [CrossRef]
- Luo, P.; Yan, W.L.; Wang, Y.; Li, J.J.; Lu, Q.; Robust Optimal Dispatch of Electricity-Gas-Heat Integrated Energy System Considering Carbon Capture, Utilization and Storage. High Volt. Eng. 2022, 48, 2077-2087. [CrossRef]
- Bruninx, K.; Delarue, E. A Statistical Description of the Error on Wind Power Forecasts for Probabilistic Reserve Sizing. IEEE Trans. Sustain. Energy 2014, 5, 995-1002. [CrossRef]
- Shi, J.; Qin, J.R.; Li, H.B.; Li, Z.S.; Ge, Y.; Liu, B.L. Probabilistic Power and Energy Balance Risk Scheduling Method Based on Distributed Robust Optimization. Energies, 2024, 17, 4894. [CrossRef]
- Wu, W.C.; Xu, S.W.; Yang, Y.; Wang, B.; Lin, C.H.; Shen, Y.K. Risk-Quantified Probabilistic Dispatch for Power System with High Proportion of Renewable Energy. Autom. Electr. Power Syst. 2023, 47, 3-11.
- Yang, Y.; Wu, W.; Wang, B.; Li, M. Analytical Reformulation for Stochastic Unit Commitment Considering Wind Power Uncertainty with Gaussian Mixture Model. IEEE Trans. Power Syst. 2020, 35, 2769-2782. [CrossRef]
- Xu, S.; Wu, W. Tractable Reformulation of Two-Side Chance-Constrained Economic Dispatch. IEEE Trans. Power Syst. 2022, 37, 796-799. [CrossRef]
- Elia Group: Wind Power Generation. Available online: https://www.elia.be/en/grid-data/power-generation/wind-power-generation (accessed on 17 March 2025).
- Chen, Z.; Zhang, Y.N.; Ma, G.; Guo, C.X.; Zhang, J.J. Two-stage Day-ahead and Intra-day Robust Reserve Optimization Considering Demand Response. Autom. Electr. Power Syst. 2019, 43, 67-76.
- He, Y.Q.; Li, X.; Jia, H.Q.; Liu, C.X.; Liu R.; Gu, X.D.; Lei, X. Method for Wind Power Balancing Cost Allocation Considering Spatiotemporal Characteristics of Wind Power and Relative Volatility. Electr. Power Constr. 2024, 45, 157-166.
- Sui, D.X.; Wei, Z.B.; Zhou, C.Y.; Yang, H.Q. Deviation Electricity Optimization of Microgrid Based on Hybrid Energy Storage Technology in Spot Market. Autom. Electr. Power Syst. 2021, 45, 160-169.
Figure 1.
The flowchart of probabilistic reserve decision method.
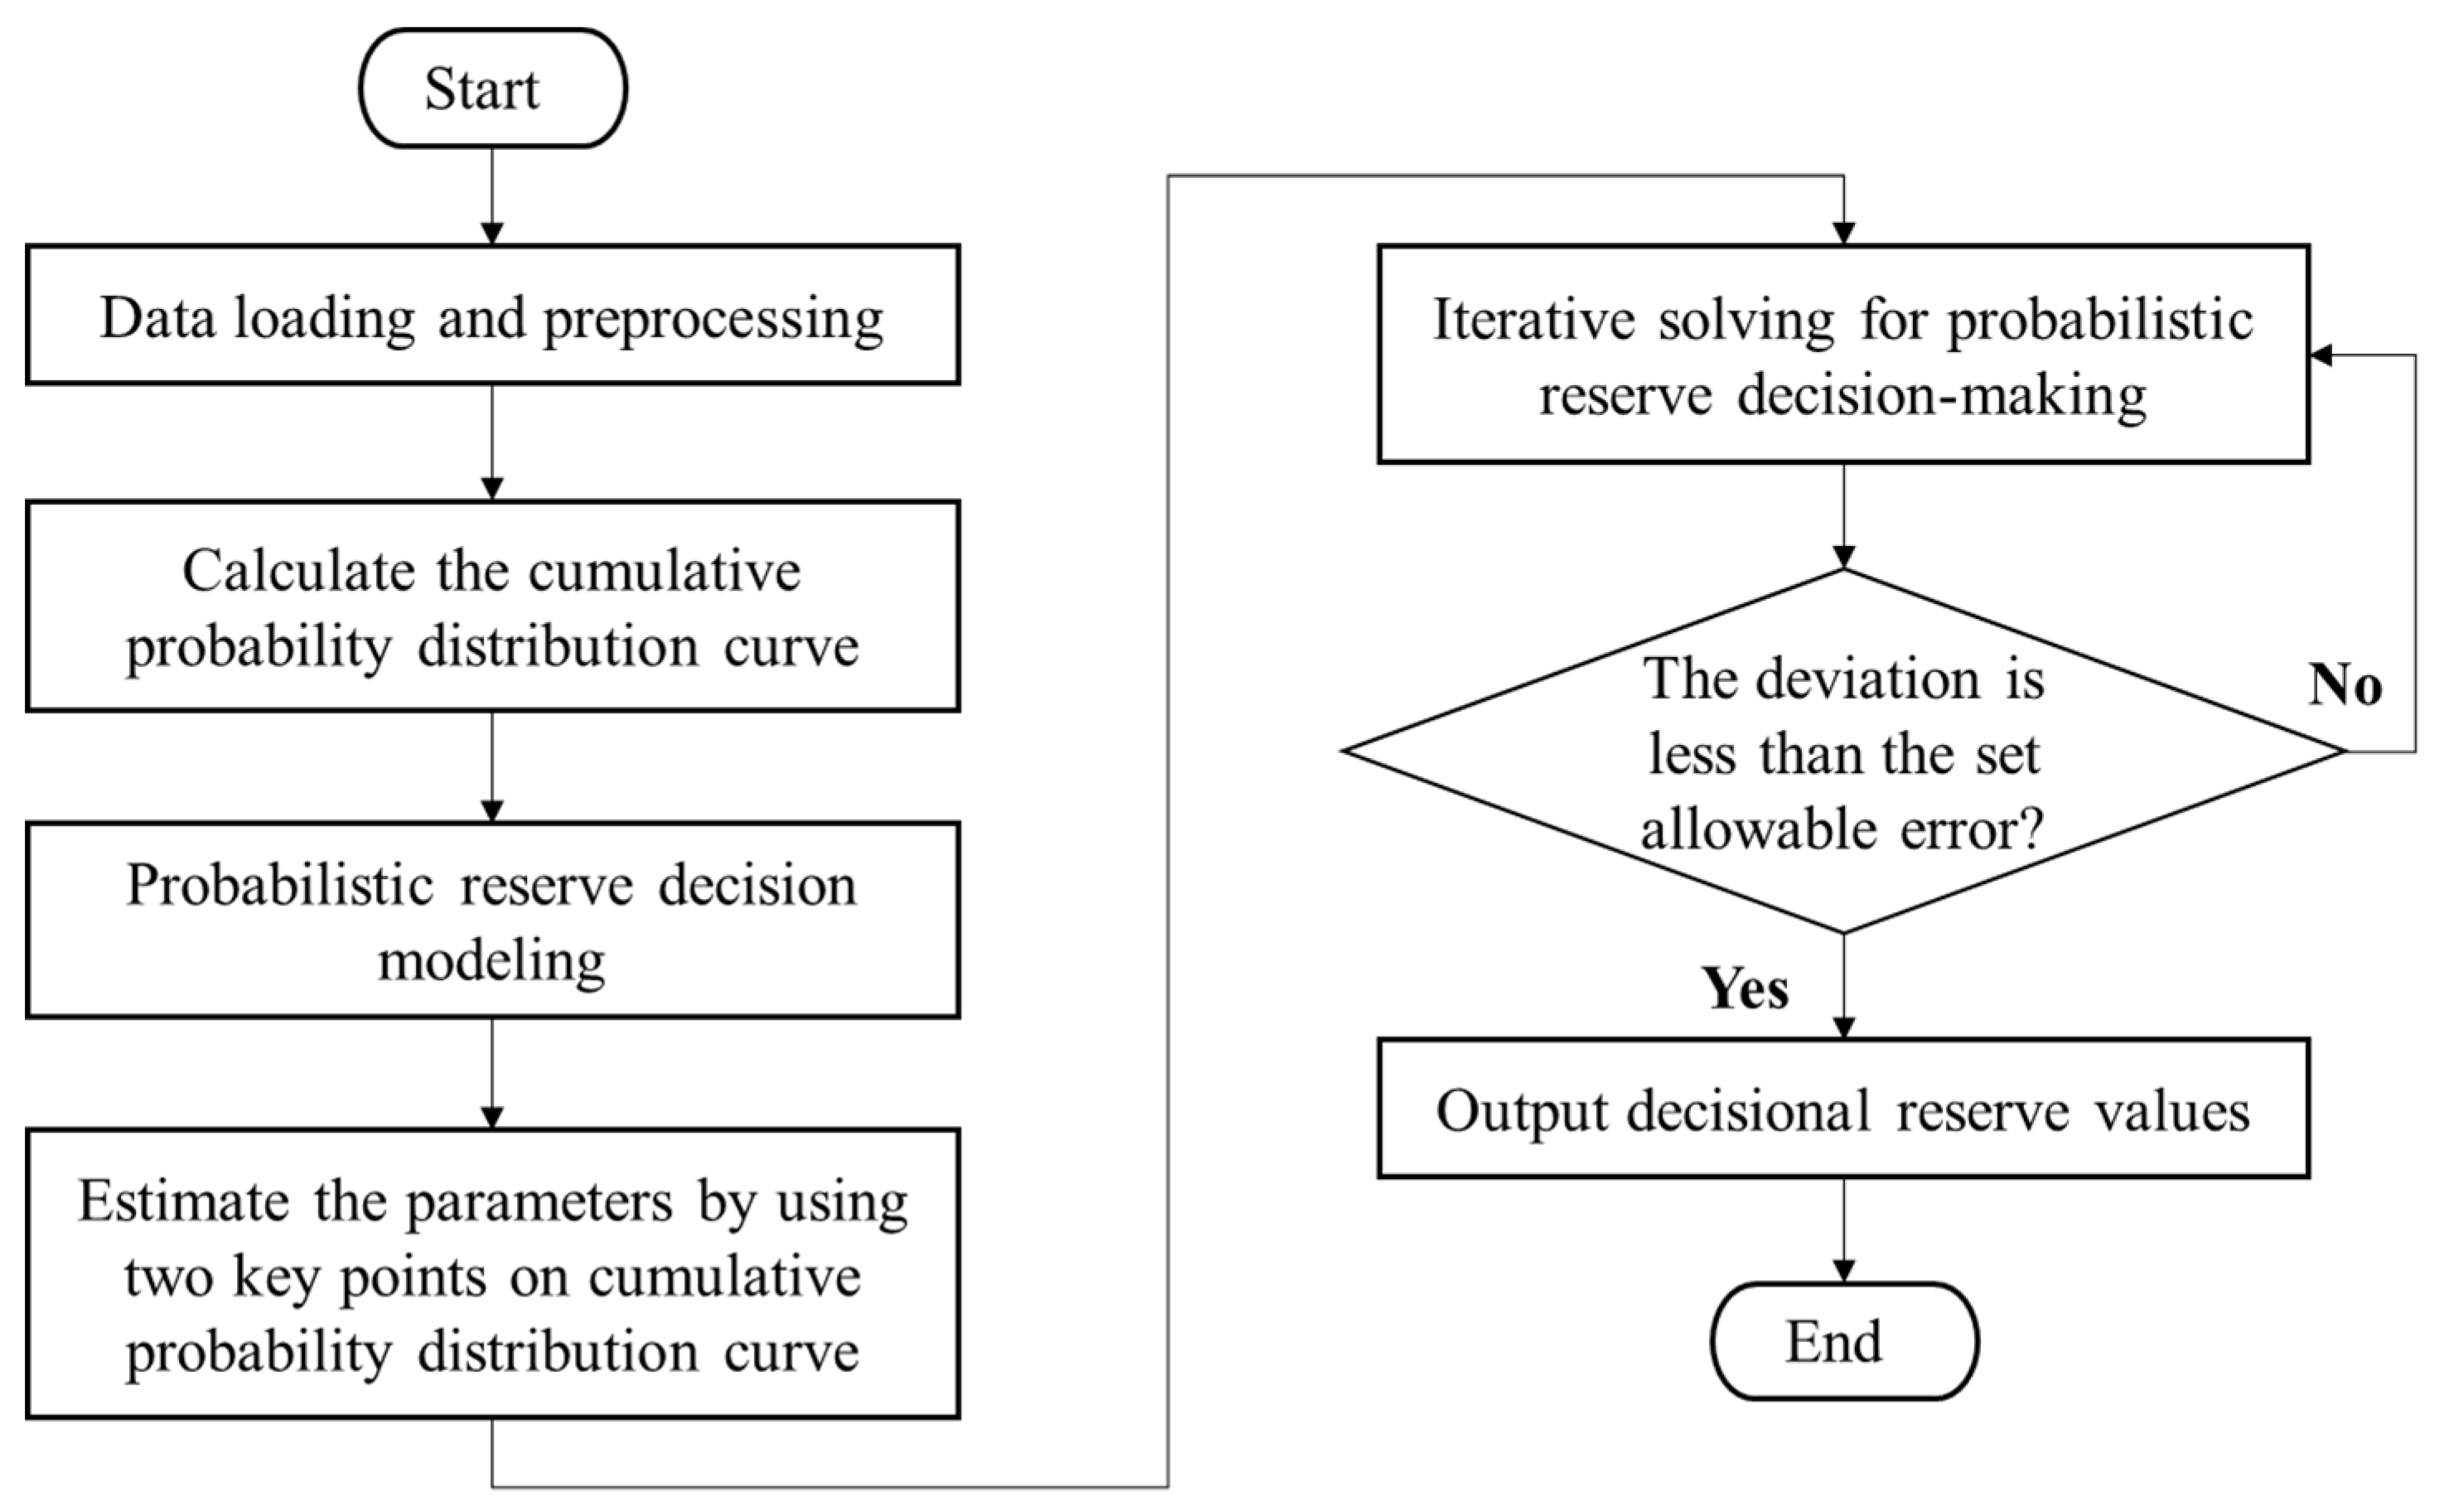
Figure 3.
Histogram of frequency distribution of net load forecast errors.
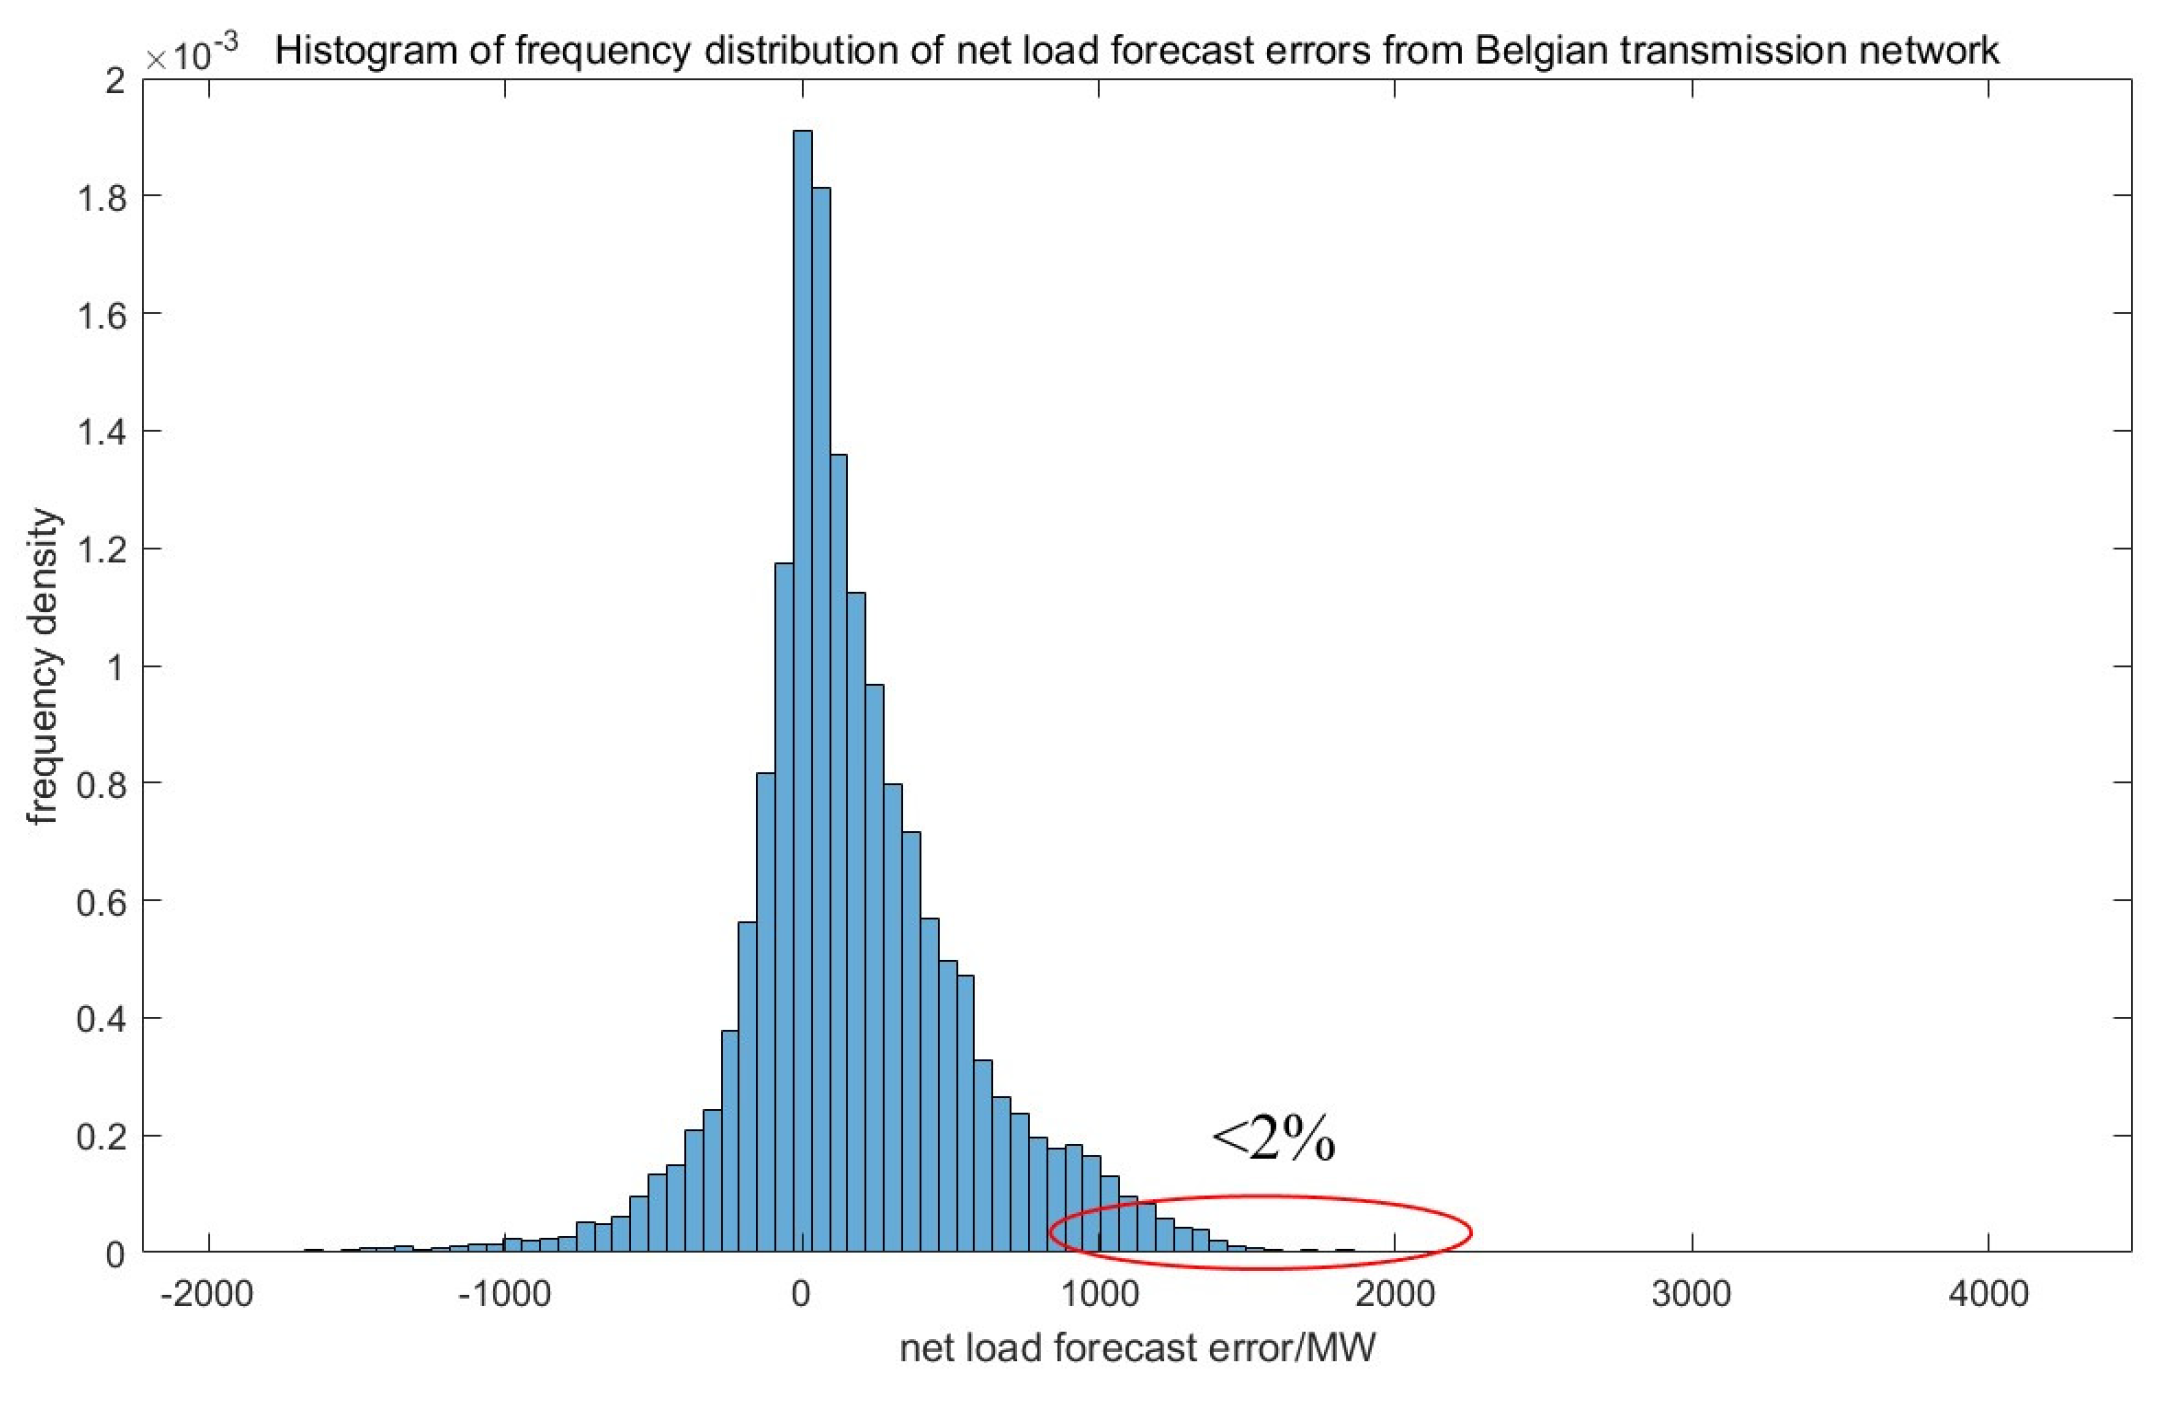
Figure 4.
Cumulative probability distribution curve of net load forecast errors.
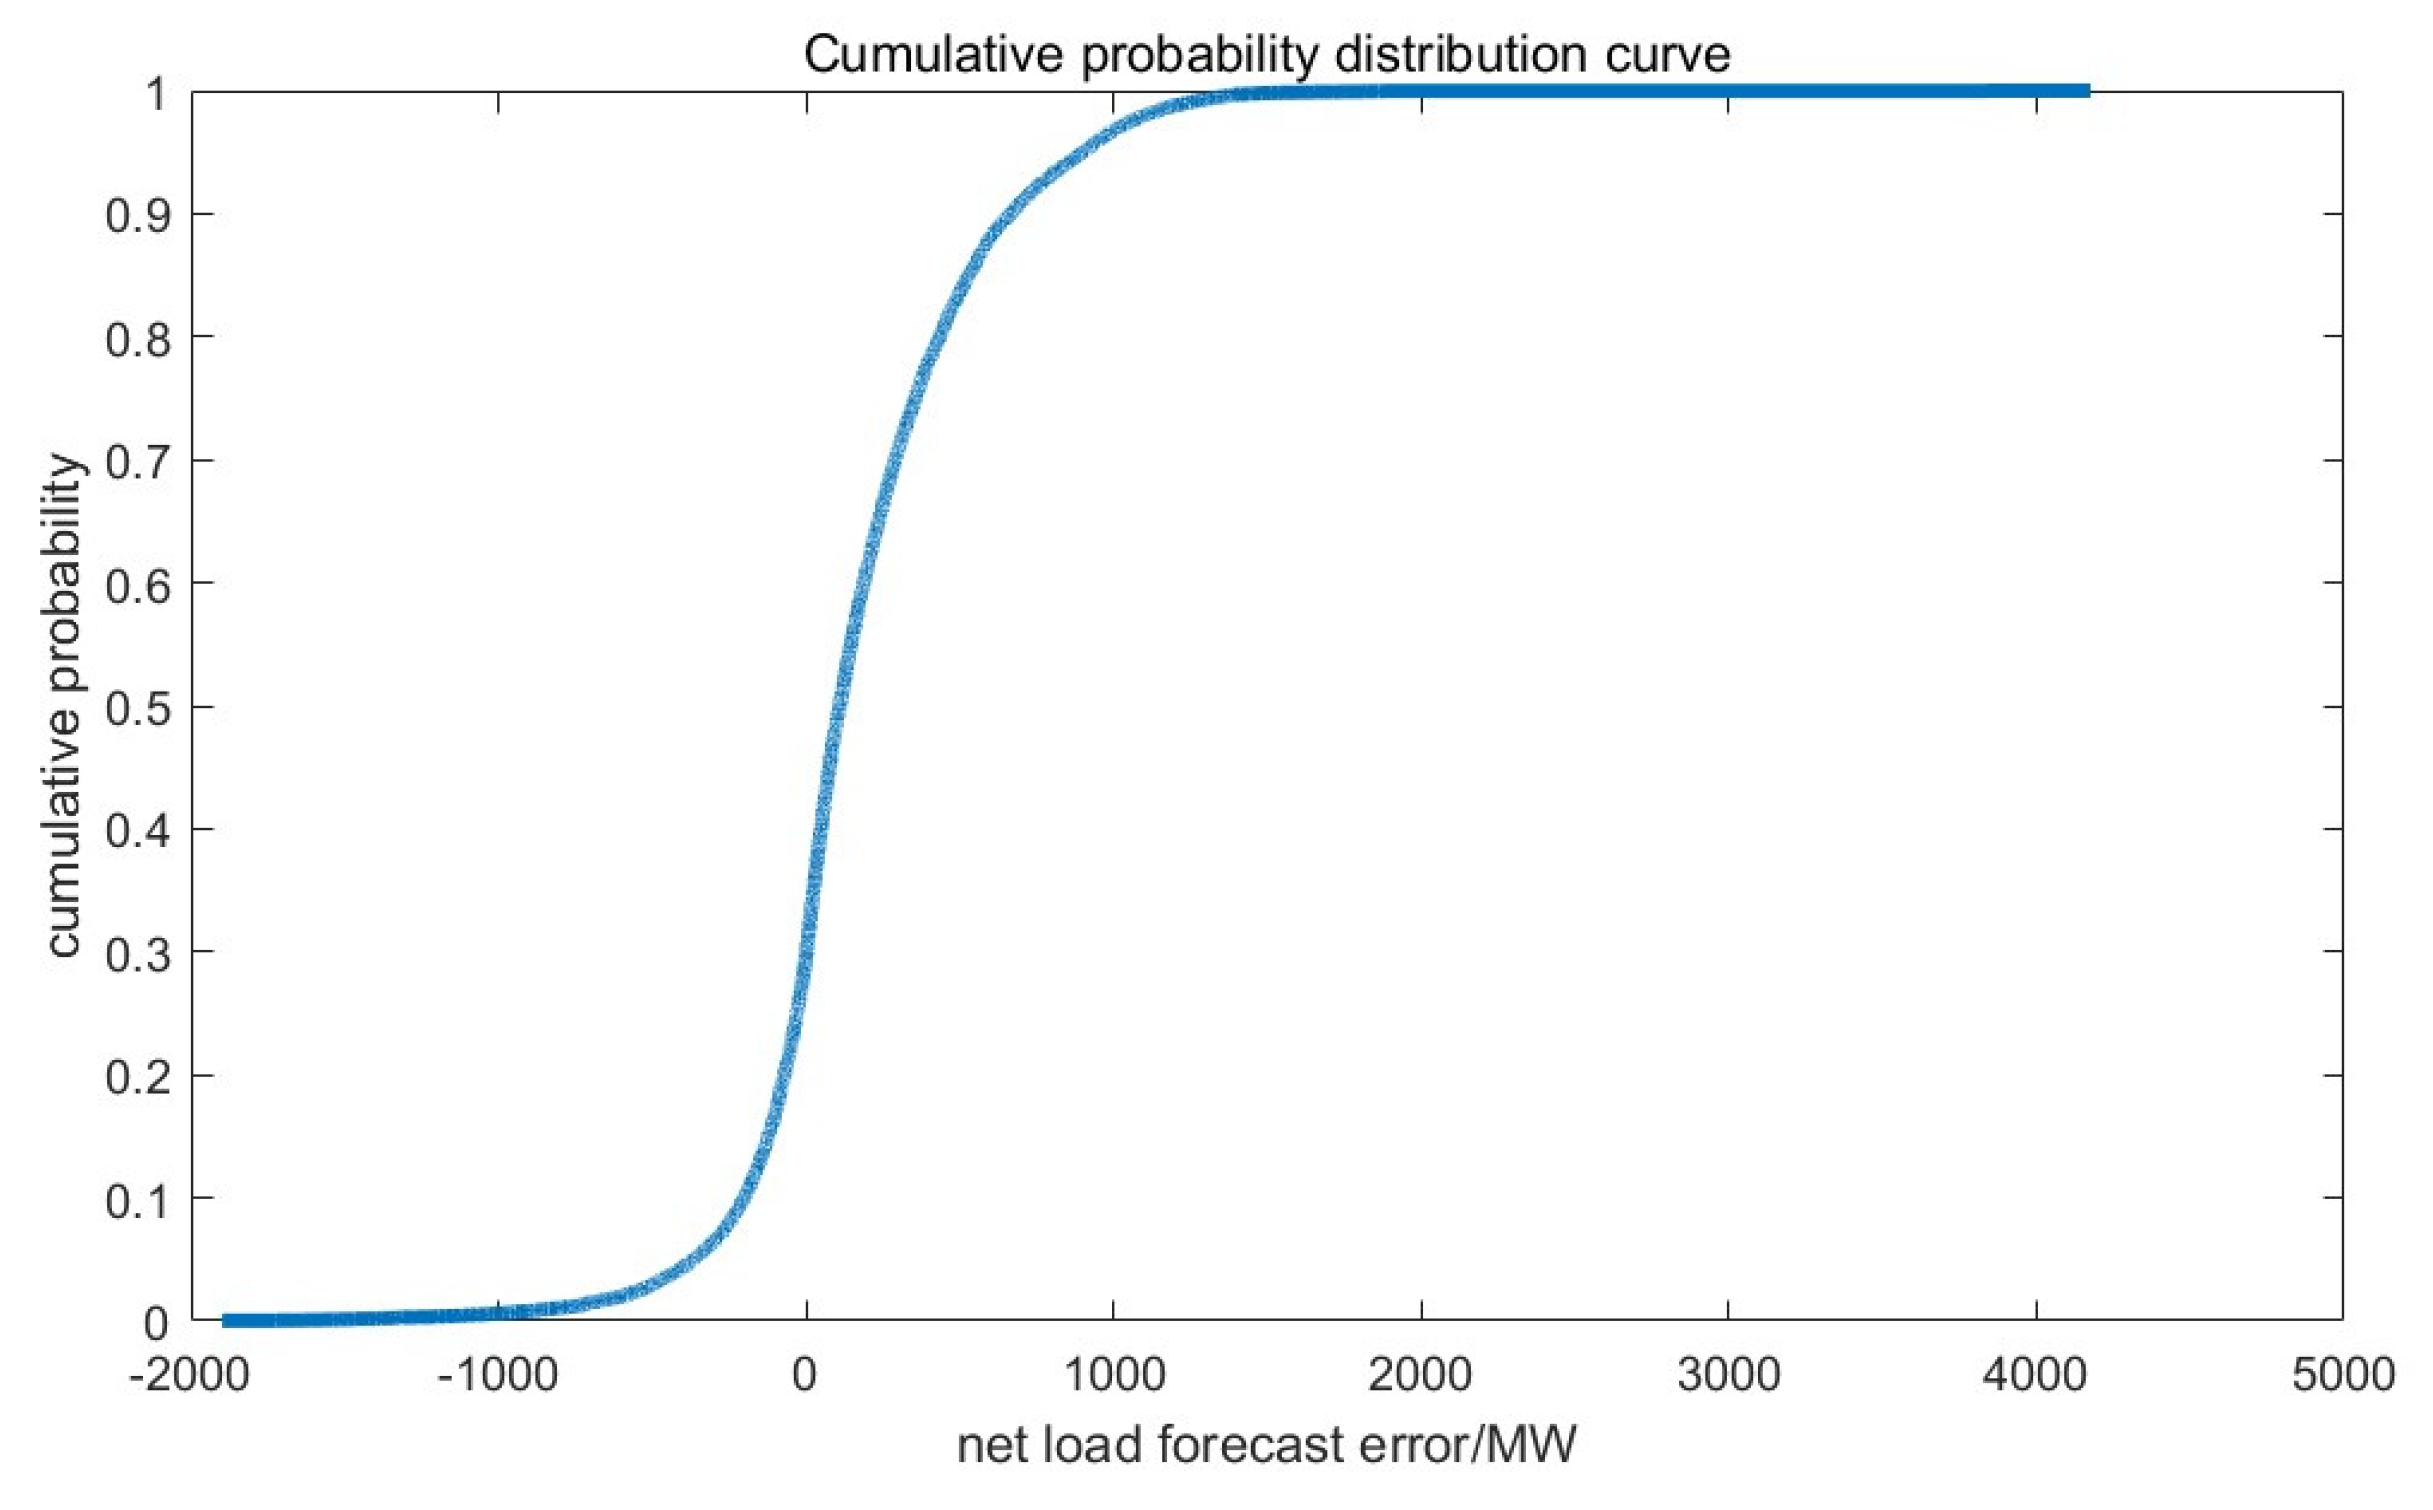
Figure 5.
First comparison of two normal distribution models.
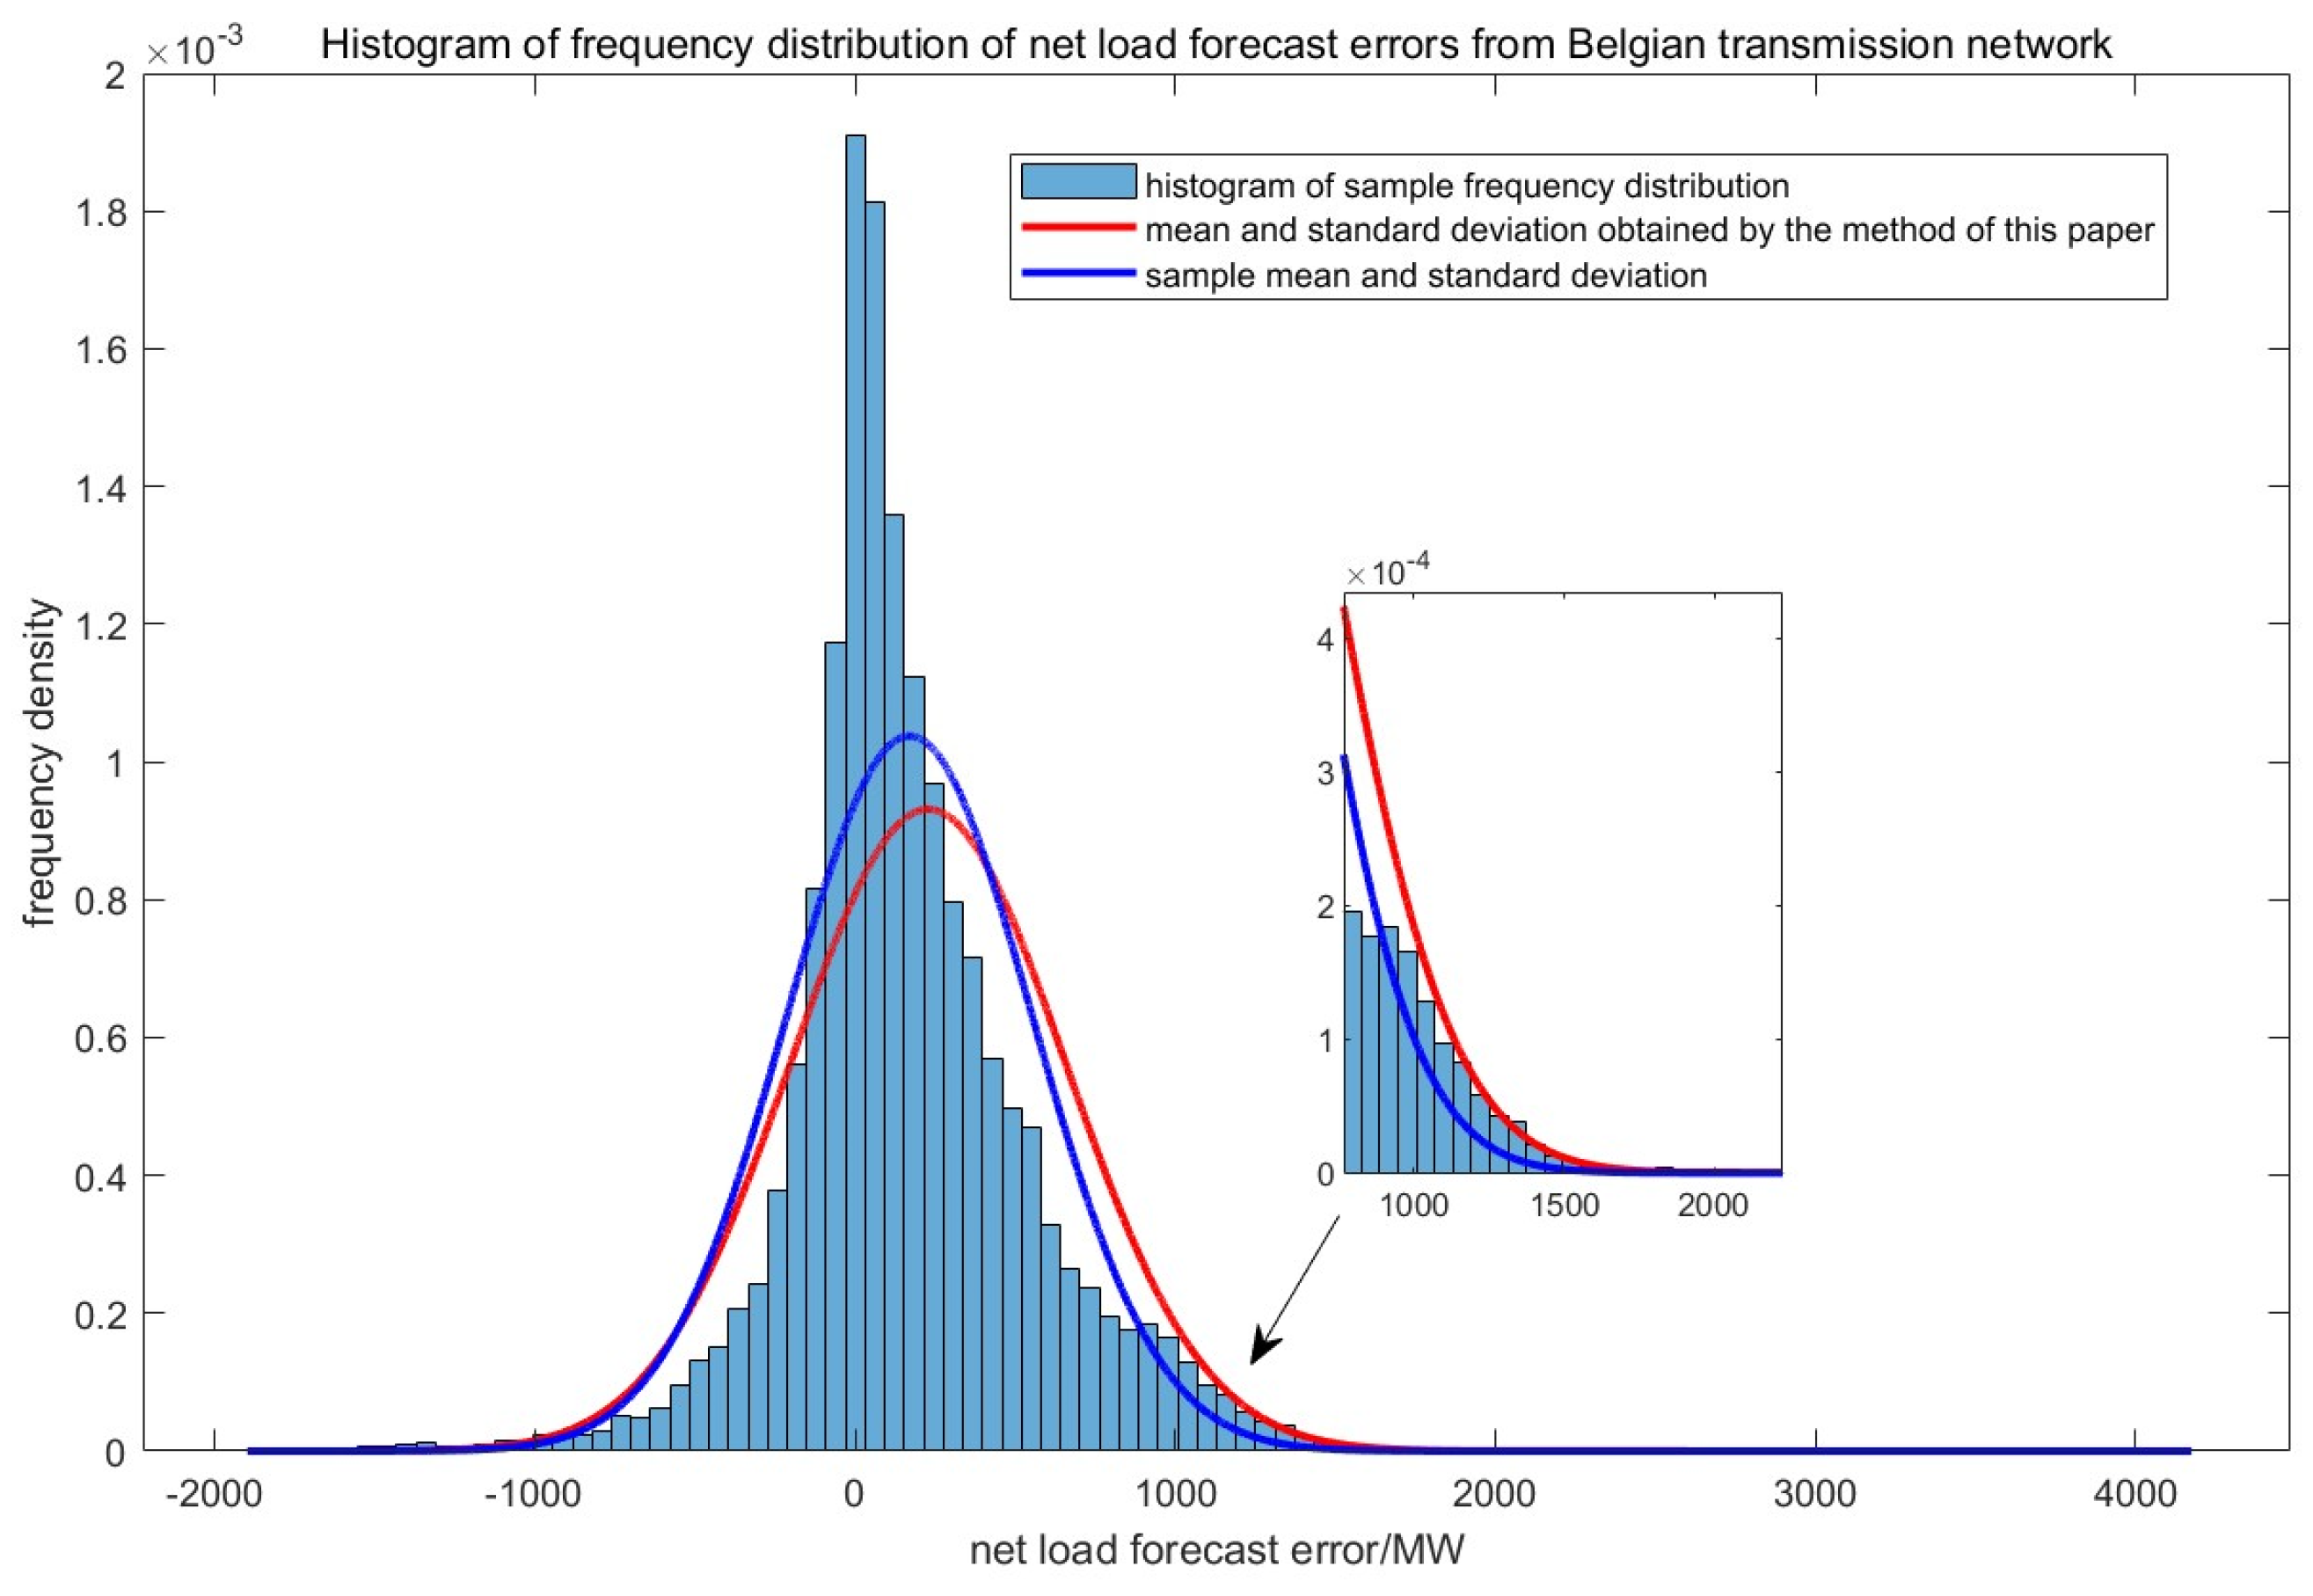
Figure 6.
Second comparison of two normal distribution models.
Disclaimer/Publisher’s Note: The statements, opinions and data contained in all publications are solely those of the individual author(s) and contributor(s) and not of MDPI and/or the editor(s). MDPI and/or the editor(s) disclaim responsibility for any injury to people or property resulting from any ideas, methods, instructions or products referred to in the content. |
© 2025 by the authors. Licensee MDPI, Basel, Switzerland. This article is an open access article distributed under the terms and conditions of the Creative Commons Attribution (CC BY) license (http://creativecommons.org/licenses/by/4.0/).
Copyright: This open access article is published under a Creative Commons CC BY 4.0 license, which permit the free download, distribution, and reuse, provided that the author and preprint are cited in any reuse.


