Submitted:
20 April 2025
Posted:
21 April 2025
You are already at the latest version
Abstract
To address the challenges of multi-scale object recognition and complex background in-terference in remote sensing images, this paper proposes a lightweight improved algo-rithm based on YOLOv8-obb. By integrating a hybrid local-channel attention mechanism (MLCA), dynamic upsampling (DySample), and a reparameterized cross-scale feature aggregation module (RepNCSPELAN), the algorithm achieves dual enhancements in de-tection accuracy and computational efficiency. The MLCA module enhances feature dis-criminability in complex backgrounds through a dual-path mechanism combining local and global pooling. The DySample module employs content-aware sampling point gen-eration to improve feature reconstruction for multi-scale targets. The RepNCSPELAN module reduces model parameters by 29% while preserving cross-scale feature fusion ca-pabilities. Experimental results on the DOTA dataset demonstrate a 2.3% improvement in mAP50, with parameters reduced to 2.2M and FLOPs decreased by 27%. Cross-dataset validation on DIOR further confirms a 1.5% mAP50 gain. Compared to mainstream lightweight models (e.g., YOLOv5n, YOLOv8n), the proposed algorithm exhibits superior performance in accuracy (65.3% vs. 60.8%), parameter efficiency (2.2M vs. 3.1M), and computational cost (6.2G vs. 8.5G FLOPs). Ablation studies validate the efficacy of each module, while visualizations highlight robustness in dense small-object detection and ro-tated target localization. This work provides an efficient solution for real-time remote sensing object detection in complex scenarios and offers a novel technical pathway for lightweight deep learning model design.
Keywords:
Remote sensing object detection
; YOLOv8
; Multi-scale feature fusion
; Dynamic upsampling
; Attention mechanism
; lightweight networks
1. Introduction
In recent years, with the rapid development of satellite remote sensing technology, remote sensing object detection (RSOD) has become a research hotspot with widespread applications in geographic mapping, environmental protection, and national security. However, as most remote sensing images are acquired through aerial or spaceborne platforms, they present unique challenges for conventional object detection algorithms due to the multi-scale characteristics of targets and complex background environments. Consequently, improving the performance of RSOD algorithms has emerged as both a critical and challenging research task.
Object detection methods can be primarily categorized into two types: Traditional approaches typically rely on handcrafted features [1], featuring mature algorithmic frameworks that demonstrate high efficiency in certain applications. Nevertheless, these methods heavily depend on low-level semantic information while neglecting the extraction of high-level semantic features, making them inadequate for accurately detecting diverse targets in complex scenarios. In contrast, deep learning-based methods have significantly enhanced detection efficiency and performance through automated feature extraction. These approaches can be further divided into single-stage and two-stage detectors based on their region proposal generation mechanisms [2].
Single-stage detectors, such as the YOLO series [3] and SSD (Single Shot MultiBox Detector) [4,5], prioritize rapid response at the expense of some detection accuracy. The YOLO series employs an image grid division approach that focuses on target center points rather than entire regions, eliminating the need for region proposal generation and substantially reducing search time to meet real-time detection requirements. Representative two-stage detectors include models based on Region-based Convolutional Neural Networks (RCNN) [6]. RCNN utilizes selective search algorithms [7] to generate region proposals, which are then processed through convolutional neural networks for feature extraction before final classification using support vector machines.
Despite these advancements, current object detection algorithms still face several challenges: (1) The performance of detectors is significantly compromised by multi-scale targets and complex backgrounds in remote sensing images; (2) While some detectors achieve relatively high accuracy on remote sensing datasets, their complex network architectures result in excessively long training and detection times. To address these issues, this paper proposes a lightweight object detection network based on YOLOv8-obb. The main contributions include: (1) Introduction of a Mixed Local Channel Attention (MLCA) module [8] and Dynamic Upsampling module [9] to enhance detection accuracy; (2) Implementation of network optimization through RepNCSPELAN [10] module for lightweight design.
To enhance object detection accuracy in complex backgrounds and for multi-scale targets, this study incorporates attention mechanisms into the network architecture. These mechanisms automatically learn input weight distributions, enabling the model to focus more effectively on critical features. Several established attention modules have been developed, including Squeeze-and-Excitation (SE) [11], Efficient Channel Attention (ECA) [12], Convolutional Block Attention Module (CBAM) [13], Global Attention Mechanism (GAM) [14], Co-Attention [15], Reverse Attention [16], and Cross Attention [17]. However, certain attention layers may introduce unnecessary complexity while providing marginal accuracy improvements. Consequently, the optimal selection of attention modules for specific detection tasks remains a crucial research challenge in computer vision.
Recent trends in network architecture design have favored increasingly deeper and more complex structures, leading to substantial growth in model size and parameter counts. This development has spurred the creation of lightweight network architectures such as MobileNet [18], ShuffleNet [19-20], GhostNet [21], and EfficientDet [22]. Nevertheless, these lightweight modules demonstrate limited adaptability when applied to modified network structures. More importantly, their integration often introduces unintended side effects during algorithm optimization. Therefore, achieving network simplification while maintaining detection accuracy presents a significant and pressing research problem that requires innovative solutions.
2. Methods
2.1. Mixed Local Channel Attention
This paper proposes a Mixed Local Channel Attention (MLCA) module to mitigate severe target information loss during consecutive downsampling operations while effectively integrating global and local information for enhanced detection performance. As illustrated in Figure 1, the MLCA module operates through three sequential processing stages: (1) The input feature map undergoes parallel processing through Local Average Pooling (LAP) and Global Average Pooling (GAP) modules, where LAP extracts fine-grained local region features while GAP captures global statistical characteristics of the entire feature map. (2) The pooled features from both paths are then processed by a 1D convolutional module that compresses channel dimensions while preserving spatial structure, effectively reshaping features for subsequent operations. (3) The module performs hierarchical feature fusion by combining GAP-derived global context with LAP-processed local features, followed by spatial reconstruction through Unpooling (UNAP) operations to restore original dimensions, and finally enhances discriminative features by merging with original inputs. This innovative design effectively addresses information degradation during downsampling while improving feature representation quality, ultimately leading to significant detection performance improvements as demonstrated in our experiments. The MLCA module achieves these benefits while maintaining computational efficiency through its dimension-aware processing architecture.
2.2. DySample
DySample is an innovative and efficient dynamic upsampler that redefines the upsampling process from a point-sampling perspective, avoiding the use of dynamic convolution. As shown in Figure 2, DySample achieves content-aware upsampling by adaptively generating sampling points to resample continuous feature maps, resulting in more efficient feature reconstruction.The dynamic upsampling process operates as follows: Given an input feature map with dimensions , DySample produces an upsampled output feature map with dimensions , where s is the scaling factor. Unlike traditional interpolation-based methods, DySample dynamically adjusts sampling positions based on local feature content, preserving structural details while minimizing artifacts. This approach significantly enhances feature representation quality in super-resolution and object detection tasks.
Figure 3 demonstrates the working principle of the sampling point generator in DySample, which produces a sampling set with dimensions through the following process: the input feature map is first processed by a linear layer to generate a dynamic scope factor that modulates the offset field (where denotes the sigmoid function), and the final sampling set is obtained by combining the original coordinate grid with the learned offsets , achieving content-aware feature resampling through this dynamic coordinate adjustment mechanism.
2.3. RepNCSPELA
GELAN (Generalized Efficient Layer Aggregation Network) draws structural inspiration from CSPNet and ELAN architectures, incorporating three key characteristics: lightweight design, fast inference speed, and high accuracy. Similar to CSPNet's structure, the RepNCSPELAN module (Reparameterized Non-local Cross-Scale Path Enhanced Layer Aggregation) serves as a critical component within the GELAN framework. The module operates through a systematic four-stage process: (1) Input features are initially divided into two pathways via a transition layer; (2) Each branch undergoes distinct computational processing - one branch follows ELAN's characteristic hierarchical connection pattern where each layer's output connects to the next layer's input; (3) Processed features from both branches are subsequently reintegrated; (4) The final aggregated output is generated as shown in Figure 4. This architectural design achieves optimal balance between computational efficiency and feature representation capability through its innovative combination of cross-scale path enhancement and parameter reusability mechanisms.
2.4. YOLOv8-Obb
YOLOv8, through lightweight design and advanced data processing techniques, not only improves detection speed and accuracy but also enhances the model's robustness, making it suitable for remote sensing image applications in complex environments. YOLOv8 excels in detecting targets such as vehicles, buildings, and aircraft, demonstrating high detection precision. Its advantages in speed, accuracy, and robustness make it an ideal choice for target detection in remote sensing images.
The original YOLOv8 consists of four parts: the input end, backbone network, feature fusion, and target localization and classification. The input image size is set to 1024×1024. To address the lack of large-scale targets in remote sensing data, YOLOv8 introduces the Mosaic data augmentation method during the data preprocessing stage. This method randomly selects and stitches four images together, significantly improving model performance, especially as the number of training iterations increases. In the backbone network section, YOLOv8 extracts features through a series of convolutional and deconvolutional layers while incorporating bottleneck structures to enhance performance. YOLOv8 adopts the C2f module as its basic unit, which has fewer parameters and stronger feature extraction capabilities.
In the neck structure (Neck) of YOLOv8, multi-scale feature fusion is introduced to combine features from different stages of the backbone network, thereby enhancing feature representation. Figure 5 illustrates the specific steps of the neck. The outputs P3, P4, and P5 from the backbone network are passed to the PAN-FPN structure to fuse features at different scales. Through the upsampling process, P5 is fused with P4 to produce T1; T1 is then upsampled with P3 to generate D1. Subsequently, D1 undergoes convolutional layer processing and is fused with T1, generating D2 through downsampling. D3 is generated in a similar manner. Finally, D1, D2, and D3 serve as the outputs of the neck and are passed to three detection heads for target detection.
In the detection head part of the network architecture, YOLOv8 differs from YOLOv8-obb. The Oriented Bounding Box (OBB) [23-24] is a new data format that includes directional information for rotated bounding boxes. OBB defines the target's position using the center point, width, height, and rotation angle. As a result, OBB's bounding boxes can better fit the shape of the target, improving target detection performance. YOLOv8-obb introduces OBB to more accurately represent targets with rotated or inclined postures; YOLOv8-obb redesigns the loss function to adapt to the regression task of rotation angles, ensuring the model learns correct orientation information; based on YOLOv8, YOLOv8-obb adds an Angle Branch for predicting rotation angles and adjusts the output of feature maps.
2.5. Improved YOLOv8-Obb
This paper introduces three key modules into the YOLOv8-obb architecture: the Mixed Local Channel Attention (MLCA) module, the Dynamic Upsampling module, and the RepNCSPELAN module.
The MLCA module enhances feature representation capability through a hybrid local-channel attention mechanism, improving the model's object detection performance in complex scenarios. The Dynamic Upsampling module adaptively adjusts sampling strategies to optimize detection performance across targets of different scales, thereby increasing both detection accuracy and computational efficiency. The RepNCSPELAN module employs lightweight design and flexible feature fusion to achieve rapid yet efficient object detection. The modified YOLOv8-obb architecture is shown in Figure 6, with corresponding network parameters detailed in Table 1.
3. Experimental Setup
3.1. Experimental Dataset
This study adopts the DOTA dataset (A Large-scale Dataset for Object Detection in Aerial Images), which was publicly released by Wuhan University in 2017. The dataset comprises 2,806 aerial images acquired from diverse sensors and platforms, with each image having a resolution of 4000×4000 pixels. These images encompass objects with varying scales, orientations, and shapes. The DOTA dataset provides annotations for 15 common categories: plane, ship, storage tank, baseball diamond, tennis court, basketball court, ground track field, harbor, bridge, large vehicle, small vehicle, helicopter, roundabout, soccer ball field, and swimming pool. The fully annotated images contain 188,282 instances, each labeled as an arbitrary quadrilateral.
Among the 15 object categories in the dataset, certain classes such as basketball courts and soccer ball fields typically exhibit lower detection accuracy. The primary reasons for this reduced performance include their relatively small size and the difficulty in distinguishing them from the background environment, which significantly impacts the model’s mean average precision (mAP) on this dataset.
As shown in Table 2, the YOLOv8-obb model achieves an mAP50 of 78.4 across all 15 categories on the DOTA dataset. Notably, categories with distinctive features (e.g., planes and ships) can reach an mAP50 of up to 90%. However, the detection performance remains suboptimal for certain categories like bridges and sports fields. Consequently, improving the detection accuracy for these challenging categories has become a key focus of our architectural enhancements.
This study selected the six categories with the lowest detection accuracy: basketball courts, ground track fields, bridges, small vehicles, roundabouts, and soccer ball fields. The dataset was reorganized accordingly, and training was conducted using the YOLOv8-obb model. The training results are shown in Table 3. Figure 7 illustrates the size distribution of annotated instances, showing that the majority of instances are small-scale targets with relatively uniform distributions in both width and height.
3.2. Experimental Configuration and Performance Metrics
The network performance is evaluated based on four key metrics: Precision (P), Recall (R), Average Precision (AP), and mean Average Precision (mAP). These metrics are formally defined as follows:
In object detection evaluation, true positives (TP) refer to samples that are actually positive and correctly identified as positive by the classifier, while false positives (FP) represent negative samples that are incorrectly classified as positive. Targets that fail to be detected are marked as false negatives (FN). The intersection over union (IoU) measures the ratio of the intersection area to the union area between two shapes. For object detection tasks, we typically compare predicted bounding boxes with ground truth annotations by calculating their IoU. A sample is considered correctly predicted if the computed IoU exceeds a predefined threshold. The mAP50 metric uses a threshold of 0.5, while mAP50-95 serves as a more stringent evaluation indicator that assesses algorithm performance across different IoU thresholds from 0.5 to 0.95 with 0.05 increments, providing a comprehensive measure of detection accuracy under varying localization precision requirements.
4. Results and Discussion
4.1. Ablation Study
Figure 8 displays the training curves of multiple improved YOLOv8-obb models, showing similar convergence patterns where all metrics reach stable values after 150 epochs. Due to space constraints, Figure 8 primarily illustrates the overall trends and approximate values of the metrics during training; therefore, this paper provides precise quantitative results in Table 6 to thoroughly evaluate each model’s performance. The table includes: MLCA (Mixed Local Channel Attention module added to YOLOv8-obb), DS (Dynamic Upsampling module), and GE (RepNCSPELAN layer). For comparison, we also implemented the CBAM attention module and two dynamic upsampling variants: LP (“linear + pixel shuffle” design) and PL (“pixel shuffle + linear” design), enabling systematic analysis of architectural modifications and their individual/combined effects on model optimization.
The ablation experiments validate the effectiveness of the proposed YOLOv8-obb modules. Experimental results demonstrate that incorporating the MLCA attention layer significantly enhances model performance, achieving improvements of 1.7% in precision, 0.2% in recall, 1.8% in mAP50, and 1.2% in mAP50-95. The performance gain primarily stems from MLCA’s enhanced feature extraction capability, which improves multi-scale object detection - particularly for small targets, as evidenced by the experimental data. Although the CBAM module also shows performance benefits, comprehensive comparison confirms MLCA’s superior effectiveness, leading to its selection in our final architecture.
Moreover, the integration of the dynamic upsampling (PL) module yields concurrent optimization in both detection accuracy and model parameters. Specifically, the proposed architecture achieves a 0.1M reduction in parameter count while improving mAP50 by 0.4%. Comparative experiments reveal that the structurally analogous LP module conversely degrades detection performance, underscoring the necessity for prudent selection of upsampling configurations in practical implementations.
The incorporation of the RepNCSPELAN module yields relatively modest improvements across evaluation metrics. The primary objective of replacing the C2f layer was to reduce parameter count for network lightweighting while maintaining detection accuracy. Remarkably, experimental results demonstrate that substituting the complex C2f layer not only preserves but slightly enhances model precision by 0.1%, validating the new module’s efficacy. These findings collectively confirm that our improved algorithm successfully achieves dual objectives: significant enhancement in target detection accuracy (evidenced by 2.3% mAP50 improvement on DOTA dataset) alongside meeting stringent lightweight architecture requirements (29% parameter reduction from 3.1M to 2.2M). The RepNCSPELAN module’s design proves particularly effective in balancing computational efficiency with feature representation capability, making it suitable for deployment in resource-constrained edge computing scenarios while maintaining competitive performance against conventional architectures.
Based on comprehensive ablation studies, this paper adopts the optimal ‘+MLCA+DS(PL)+GE’ configuration (hereafter termed Improved YOLOv8-obb) for subsequent experiments, achieving after 150 epochs: 68.4% precision (P), 60.6% recall (R), 65.3% mAP50, and 48.2% mAP50-95, with detailed category-wise metrics documented in Table 6, demonstrating the architecture’s balanced optimization of accuracy (2.3% mAP50 improvement over baseline) and efficiency (29% parameter reduction to 2.2M) through synergistic integration of Mixed Local Channel Attention for enhanced feature discrimination, dynamic upsampling (PL variant) for multi-scale adaptation, and RepNCSPELAN’s lightweight feature fusion.
To further evaluate the detection performance, Figure 9 and Figure 10 present the confusion matrix and normalized confusion matrix respectively, where the main diagonal elements indicate either the count or proportion of correctly detected targets (with most categories exceeding 0.5 detection accuracy), while off-diagonal elements horizontally represent false positives and vertically represent false negatives - a dominant main diagonal signifies superior detection performance, whereas increased off-diagonal elements reflect higher misdetection and missed detection rates, quantitatively demonstrating the model’s classification capability across all categories through the matrix’s spatial distribution characteristics.
The results demonstrate that the small vehicle category, which has the largest sample size, achieves notably higher overall accuracy after training. Additionally, the roundabout and ground track field categories exhibit relatively strong detection performance. Although the bridge and soccer ball field categories show comparatively lower accuracy rates, analysis of Table 3 reveals that their performance still improves over the baseline YOLOv8-obb model.
To further evaluate the detection capability of the improved YOLOv8-obb across different target categories, Figure 10, Figure 11, Figure 12 and Figure 13 present various evaluation metric curves plotted against confidence scores
Figure 11 shows the Precision-Confidence Curve, illustrating how precision varies across different confidence thresholds. The curve demonstrates higher precision at higher confidence levels, indicating fewer false positives (FP) in high-confidence predictions. While precision typically increases with confidence, the basketball court category shows an unusual precision drop at high confidence values.
Figure 12 presents the Recall-Confidence Curve, displaying recall rate changes at different thresholds. The curve reveals the fundamental trade-off: lower confidence thresholds achieve higher recall but lower precision, while higher thresholds result in lower recall but higher precision.
Figure 13 displays the F1-Confidence Curve, which evaluates the model’s balanced performance by plotting F1-score (the harmonic mean of precision and recall) against confidence thresholds. The peak of this curve corresponds to the optimal confidence threshold that best balances precision and recall - specifically matching the 65.3% mAP50 value in our experiments.
Figure 14 illustrates the Precision-Recall (PR) Curve, with recall on the x-axis and precision on the y-axis. The area under this curve (AP) represents average precision. Key observations include:
1) Curves closer to the upper-right corner indicate better performance
2) Strong convexity shows graceful precision decline as recall increases
3) Diagonal alignment suggests random-guessing-level performance
Notably, all categories except soccer ball field show desirable upper-right convexity, confirming the improved YOLOv8n-obb’s ability to balance precision and recall. Furthermore, the separation between category curves reflects detection difficulty - for example, the relatively flat curves for “bridge” and soccer ball field explicitly demonstrate these categories’ challenging nature for detection algorithms.
4.2. Comparative Experiment
To verify the effectiveness and efficiency of our improved algorithm, we conducted comparative experiments with several classical models including YOLOv5, YOLOv6, YOLOv8 and YOLOv8n-obb, evaluating them using four key metrics: parameter count, FLOPs (floating-point operations per second), mAP (mean average precision), and model size. The experiments specifically employed the ‘nano’ (n) scale variants of YOLO models, which are categorized into five size levels (n, s, m, l, and x) - for instance, YOLOv8n-obb contains only about 3.2M parameters, while YOLOv8s-obb includes approximately 11.2M parameters, and the largest YOLOv8x-obb exceeds 60M parameters. Although models with more parameters typically achieve higher detection accuracy, they require significantly longer training times; therefore, considering the lightweight requirements, we exclusively selected the n-scale models for comparative testing, with the experimental results detailed in Table 8.
Experimental results demonstrate that the improved YOLOv8n-obb algorithm outperforms classical detectors (YOLOv5n, YOLOv6n, YOLOv8, and the original YOLOv8n-obb) in both model size and accuracy. The enhanced algorithm achieves 65.3% mAP50, representing a 2.3% improvement over the original YOLOv8n-obb and significantly surpassing other detectors. The additional parameters introduced by the OBB format substantially enhance the fitting degree between bounding boxes and targets. While leveraging the advantages of OBB data format, our improved algorithm further boosts detection accuracy through the incorporation of attention mechanisms, yet the attention layers’ impact on model size remains negligible due to the model’s lightweight nature. Moreover, the enhanced YOLOv8n-obb shows superior performance in parameter count, FLOPs, and model size compared to its original version - reducing parameters from 3.1M to 2.2M (a 29% decrease that significantly optimizes network architecture), decreasing FLOPs from 8.5G to 6.2G, and shrinking model size from 6.5MB to 4.9MB. Remarkably, while achieving substantial accuracy improvements, the final model size is even smaller than YOLOv5n, fully satisfying lightweight requirements for practical deployment scenarios.
Figure 15 demonstrates the visual detection results of our enhanced YOLOv8-obb algorithm on the DOTA dataset. The visualization reveals that despite the dataset containing numerous small-scale instances (such as those in the small vehicle category) with complex background interference, our detector maintains consistently high detection accuracy.
Figure 15(a) exhibits a representative case of multi-scale characteristics in remote sensing object detection, simultaneously displaying both small vehicle targets and larger sports field targets, highlighting substantial scale variations. Figure 15(b) presents a challenging scenario of nested and stacked objects, where a large roundabout instance encompasses multiple small vehicle targets, posing significant detection difficulties. Figure 15(c) clearly illustrates that the basketball court possesses inherent rotation angles, necessitating rotated bounding boxes for optimal target fitting.
Our improved YOLOv8n-obb algorithm effectively addresses these challenges in remote sensing object detection, successfully completing detection tasks with high confidence scores, thereby demonstrating its superior performance in complex scenarios. The visualization comprehensively validates the algorithm’s capabilities in handling multi-scale objects, nested targets, and rotated instances while maintaining robust detection performance.
Furthermore, we validated our algorithm on the DIOR dataset, which comprises 23,463 images and 192,472 object instances spanning 20 distinct categories. The dataset provides both horizontal bounding box (HBB) and oriented bounding box (OBB) annotation formats. Experimental results of our improved YOLOv8-obb on the DIOR dataset are presented in Figure 16, with corresponding accuracy metrics detailed in Table 9.
Table 9 presents the experimental results comparing the original YOLOv8-obb and our improved algorithm on the DIOR dataset, with 3,488 labeled images per category. The results show our enhanced algorithm achieves higher mAP50 with fewer parameters than the original YOLOv8-obb.
Figure 17 displays detection heatmaps that demonstrate our improved algorithm's more focused attention on target features like airports and runways, compared to the original version's tendency to attend to less relevant areas. These visualizations provide qualitative evidence supporting the quantitative improvements shown in Table 9.
4. Conclusions and Prospects
To address the challenges of multi-scale target recognition and complex background interference in remote sensing image object detection, this study proposes a lightweight improved algorithm based on YOLOv8-obb. Through systematic module innovation and structural optimization, the algorithm achieves dual improvements in detection accuracy and computational efficiency. Specifically, the innovations focus on three key aspects: First, the design of the Mixed Local Channel Attention (MLCA) module enhances feature discriminability in complex backgrounds via a dual-path feature extraction mechanism that integrates local pooling and global average pooling. Second, the introduction of the Dynamic Upsampling (DySample) module significantly improves feature reconstruction quality for multi-scale targets through content-aware sampling point generation. Third, the lightweight structural redesign using the RepNCSPELAN module reduces model parameters by 29% while maintaining feature fusion capabilities. Experimental results on the DOTA and DIOR datasets demonstrate that the improved algorithm achieves mAP50 improvements of 2.3% and 1.5%, respectively, along with a parameter reduction from 3.1M to 2.2M and a 27% reduction in computational costs, validating its synergistic optimization of accuracy and efficiency.
Future research will focus on three directions: (1) Model compression: Structured pruning and knowledge distillation techniques will be introduced to further eliminate redundant parameters and explore edge-device deployment solutions. (2) Dynamic feature processing: A collaborative mechanism between deformable convolutions and dynamic upsampling will be investigated to enhance adaptability to extreme scale variations. (3) Multi-modal fusion: Integration of multi-source remote sensing data (e.g., elevation information, infrared spectra) will be explored to construct cross-modal feature enhancement frameworks. Additionally, practical applications such as video satellite-based dynamic monitoring and disaster emergency response will be tested to advance the transition of the algorithm from laboratory validation to engineering applications.
Author Contributions
Conceptualization, Xilai Ju and YongJian Li; methodology, Xilai Ju; software, Xilai Ju; validation, Genghua Huang, Zhen Yan and Xiyuan Wu; formal analysis, Song Ji; investigation, Song Ji; resources, Song Ji; data curation, Genghua Huang; writing—original draft preparation, Xilai Ju; writing—review and editing, YongJian Li; visualization, Genghua Huang; supervision, Zhen Yan; project administration, Zhen Yan; funding acquisition, Song Ji. All authors have read and agreed to the published version of the manuscript.
Funding
This research was funded by:National Natural Science Foundation of China (Grant Nos. 42371459, 42241169, 62305360),Songshan Laboratory (Grant No. 221100211000-5),Innovation Program for Quantum Science and Technology (Grant No. 2021ZD0300304),Shanghai Institute of Technical Physics (Grant Nos. CX-482, CX-368),Shanghai Municipal Science and Technology Major Project (Grant No. 2019SHZDZX01),Shanghai Science and Technology Development Funds (Grant No. 22YF1456000).
Data Availability Statement
DOTA Dataset.
Official website: https://captain-whu.github.io/DOTA/dataset.html.Baidu Cloud backup: https://pan.baidu.com/s/1o4Tsx7hgh2a2O73kxJRVLg (Extraction code: yvi1).Description: Aerial imagery dataset with 2,806 images and 188,282 annotated instances across 15 object categories.
DIOR Dataset.
Primary repository: OpenDataLab Platform.Alternative download: Chinese Academy of Sciences E-Science Database.Description: Optical remote sensing dataset containing 23,463 images with 192,472 bounding boxes spanning 20 object classes.
Conflicts of Interest
The authors declare no conflicts of interest
References
- Nie, G.; Huang, H. A Survey of Object Detection in Optical Remote Sensing Images. Acta Autom. Sin. 2021, 47, 1749–1768. [Google Scholar]
- Wang, Y.; Bashir, S.M.A.; Khan, M.; Ullah, Q.; Wang, R.; Song, Y.; Guo, Z.; Niu, Y. Remote Sensing Image Super-Resolution and Object Detection: Benchmark and State of the Art. Expert Syst. Appl. 2022, 197, 116793. [Google Scholar] [CrossRef]
- Redmon, J.; Divvala, S.; Girshick, R.; Farhadi, A. You Only Look Once: Unified, Real-Time Object Detection. In Proceedings of the IEEE Conference on Computer Vision and Pattern Recognition, Las Vegas, NV, USA, 27-30 June 2016; pp. 779–788. [Google Scholar]
- Liu, W.; Anguelov, D.; Erhan, D.; Szegedy, C.; Reed, S.; Fu, C.-Y.; Berg, A.C. SSD: Single Shot MultiBox Detector. In Computer Vision - ECCV 2016; Leibe, B., Matas, J., Sebe, N., Welling, M., Eds.; Lecture Notes in Computer Science, Vol. 9905; Springer: Cham, Switzerland, 2016; pp. 21–37. [Google Scholar]
- Lin, T.-Y.; Goyal, P.; Girshick, R.; He, K.; Dollár, P. Focal Loss for Dense Object Detection. In Proceedings of the IEEE International Conference on Computer Vision, Venice, Italy, 22-29 October 2017; pp. 2980–2988. [Google Scholar]
- Girshick, R.; Donahue, J.; Darrell, T.; Malik, J. Rich Feature Hierarchies for Accurate Object Detection and Semantic Segmentation. In Proceedings of the IEEE Conference on Computer Vision and Pattern Recognition, Columbus, OH, USA, 23-28 June 2014; pp. 580–587. [Google Scholar]
- Uijlings, J.R.R.; Van De Sande, K.E.A.; Gevers, T.; Smeulders, A.W.M. Selective Search for Object Recognition. Int. J. Comput. Vis. 2013, 104, 154–171. [Google Scholar] [CrossRef]
- Wan, D.; Lu, R.; Shen, S.; Xu, T.; Lang, X.; Ren, Z. Mixed Local Channel Attention for Object Detection. Eng. Appl. Artif. Intell. 2023, 123, 106442. [Google Scholar] [CrossRef]
- Liu, W.; Lu, H.; Fu, H.; Cao, Z. Learning to Upsample by Learning to Sample. In Proceedings of the IEEE/CVF International Conference on Computer Vision, Montreal, BC, Canada, 11-17 October 2021; pp. 6027–6037. [Google Scholar]
- Wang, C.-Y.; Yeh, I.-H.; Liao, H.-Y.M. YOLOv9: Learning What You Want to Learn Using Programmable Gradient Information. arXiv arXiv:2402.13616, 2024.
- Hu, J.; Shen, L.; Albanie, S.; Sun, G.; Wu, E. Squeeze-and-Excitation Networks. In Proceedings of the IEEE Conference on Computer Vision and Pattern Recognition, Salt Lake City, UT, USA, 18-22 June 2018; pp. 7132–7141. [Google Scholar]
- Wang, Q.; Wu, B.; Zhu, P.; Li, P.; Zuo, W.; Hu, Q. ECA-Net: Efficient Channel Attention for Deep Convolutional Neural Networks. arXiv 2020, arXiv:1910.03151. [Google Scholar]
- Woo, S.; Park, J.; Lee, J.-Y.; Kweon, I.S. CBAM: Convolutional Block Attention Module. In Proceedings of the European Conference on Computer Vision (ECCV), Munich, Germany, 8-14 September 2018; pp. 3–19. [Google Scholar]
- Liu, Y.; Shao, Z.; Hoffmann, N. Global Attention Mechanism: Retain Information to Enhance Channel-Spatial Interactions. arXiv arXiv:2112.05561, 2021.
- Hou, Q.; Zhou, D.; Feng, J. Coordinate Attention for Efficient Mobile Network Design. In Proceedings of the IEEE Conference on Computer Vision and Pattern Recognition, Nashville, TN, USA, 20-25 June 2021; pp. 13713–13722. [Google Scholar]
- Chen, S.; Tan, X.; Wang, B.; Hu, X. Reverse Attention for Salient Object Detection. In Computer Vision - ECCV 2018; Ferrari, V., Hebert, M., Sminchisescu, C., Weiss, Y., Eds.; Lecture Notes in Computer Science, Vol. 11213; Springer: Cham, Switzerland, 2018; pp. 236–252. [Google Scholar]
- Lin, H.; Cheng, X.; Wu, X.; Yang, F.; Shen, D.; Wang, Z.; Song, Q.; Yuan, W. CAT: Cross Attention in Vision Transformer. In Proceedings of the 2022 IEEE International Conference on Multimedia and Expo, Taipei, Taiwan, 11-15 July 2022; pp. 1–6. [Google Scholar]
- Howard, A.G.; Zhu, M.; Chen, B.; Kalenichenko, D.; Wang, W.; Weyand, T.; Andreetto, M.; Adam, H. MobileNets: Efficient Convolutional Neural Networks for Mobile Vision Applications. arXiv arXiv:1704.04834, 2017.
- Zhang, X.; Zhou, X.; Lin, M.; Sun, J. ShuffleNet: An Extremely Efficient Convolutional Neural Network for Mobile Devices. In Proceedings of the IEEE Conference on Computer Vision and Pattern Recognition, Salt Lake City, UT, USA, 18-22 June 2018; pp. 6848–6856. [Google Scholar]
- Ma, N.; Zhang, X.; Zheng, H.-T.; Sun, J. ShuffleNet V2: Practical Guidelines for Efficient CNN Architecture Design. In Proceedings of the European Conference on Computer Vision (ECCV), Munich, Germany, 8-14 September 2018; pp. 116–131. [Google Scholar]
- Han, K.; Wang, Y.; Tian, Q.; Guo, J.; Xu, C.; Xu, C. GhostNet: More Features from Cheap Operations. In Proceedings of the IEEE Conference on Computer Vision and Pattern Recognition, Seattle, WA, USA, 13-19 June 2020; pp. 1580–1589. [Google Scholar]
- Tan, M.; Pang, R.; Le, Q.V. EfficientDet: Scalable and Efficient Object Detection. In Proceedings of the IEEE Conference on Computer Vision and Pattern Recognition, Seattle, WA, USA, 13-19 June 2020; pp. 10781–10790. [Google Scholar]
- Yang, X.; Yang, J.; Yan, J.; Zhang, Y.; Zhang, T.; Guo, Z.; Sun, X.; Fu, K. SCRDet: Towards More Robust Detection for Small, Cluttered and Rotated Objects. In Proceedings of the IEEE/CVF International Conference on Computer Vision, Seoul, Korea, 27 October-2 November 2019; pp. 8231–8240. [Google Scholar]
- Xia, G.-S.; Bai, X.; Ding, J.; Zhu, Z.; Belongie, S.; Luo, J.; Datcu, M.; Pelillo, M.; Zhang, L. DOTA: A Large-Scale Dataset for Object Detection in Aerial Images. In Proceedings of the IEEE Conference on Computer Vision and Pattern Recognition, Salt Lake City, UT, USA, 18-22 June 2018; pp. 3974–3983. [Google Scholar]
Figure 1.
The structure of mixed local channel attention.
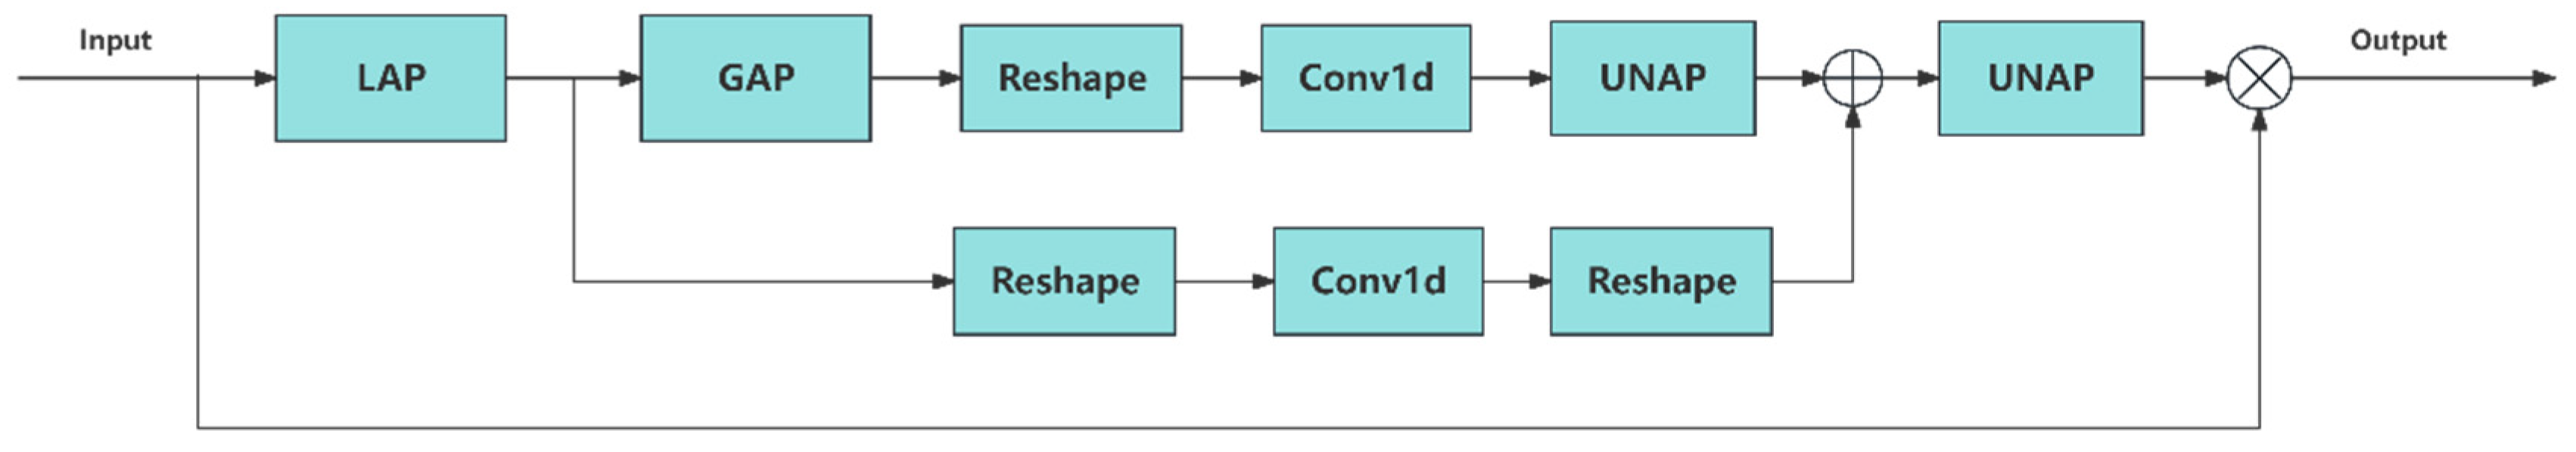
Figure 2.
The Structure of DySample.
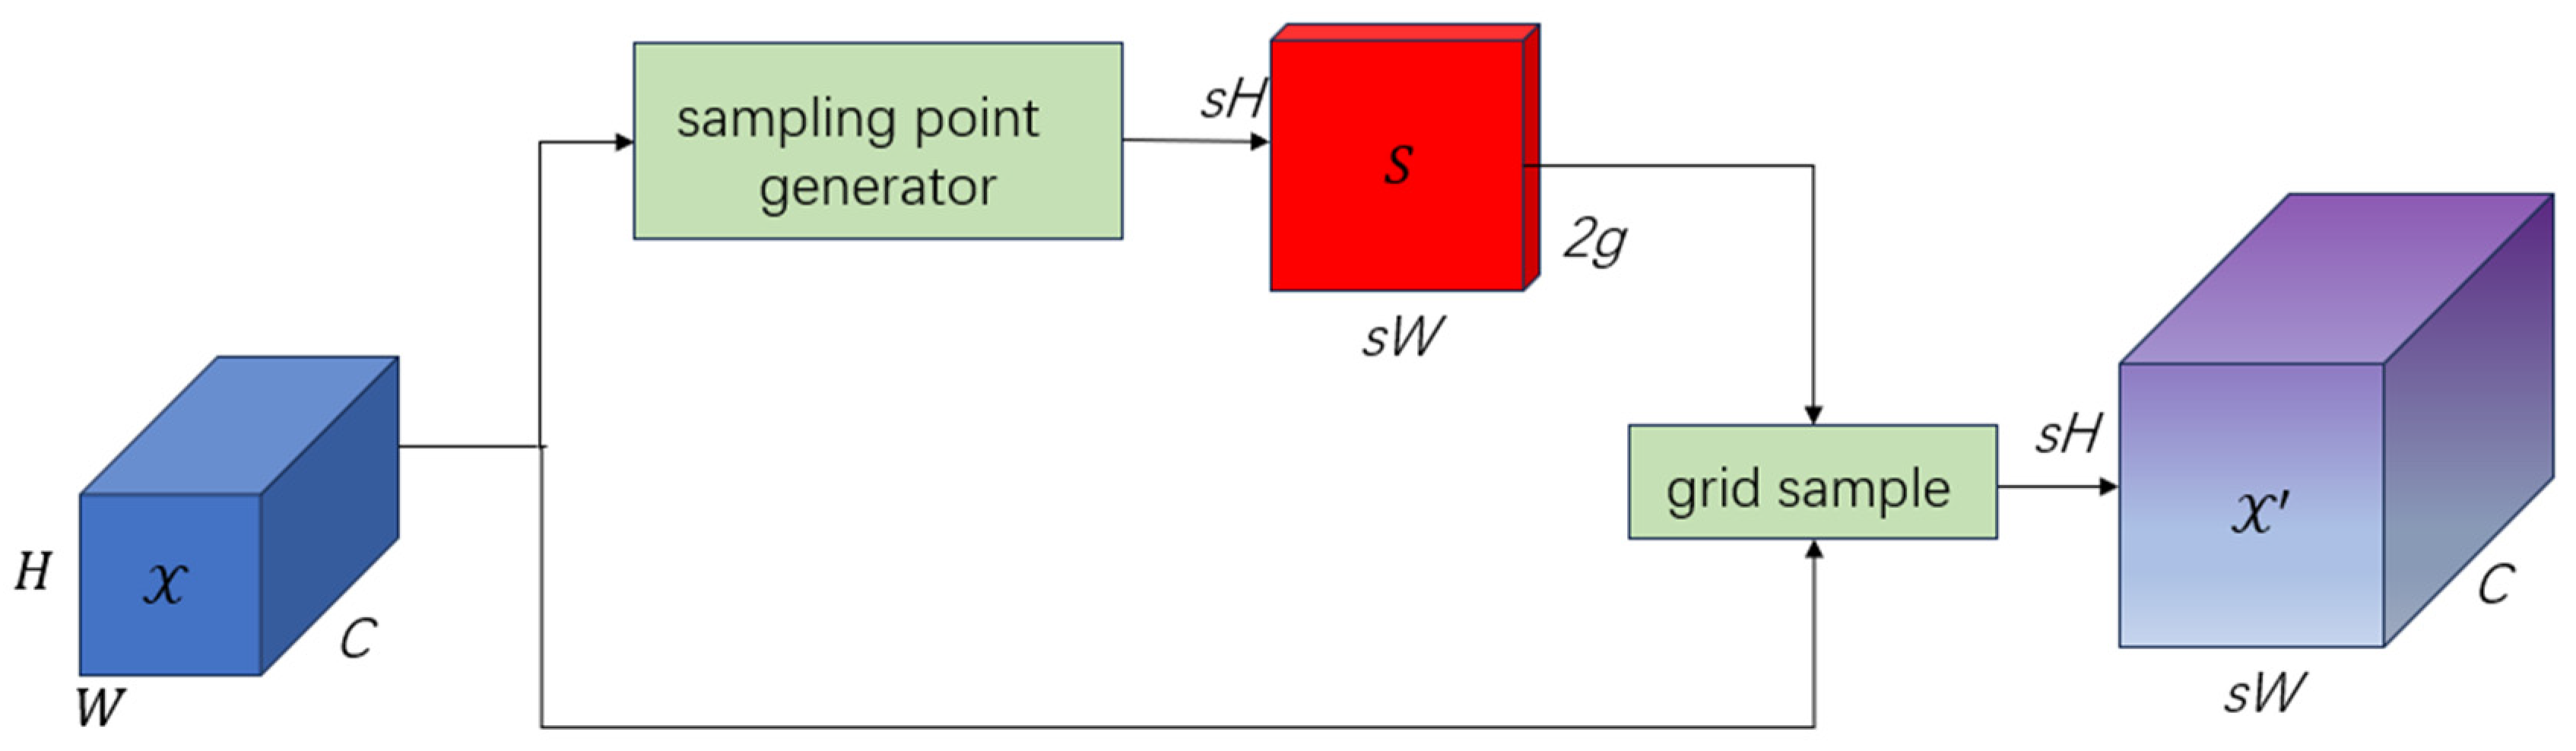
Figure 3.
Sampling point generator in DySample.
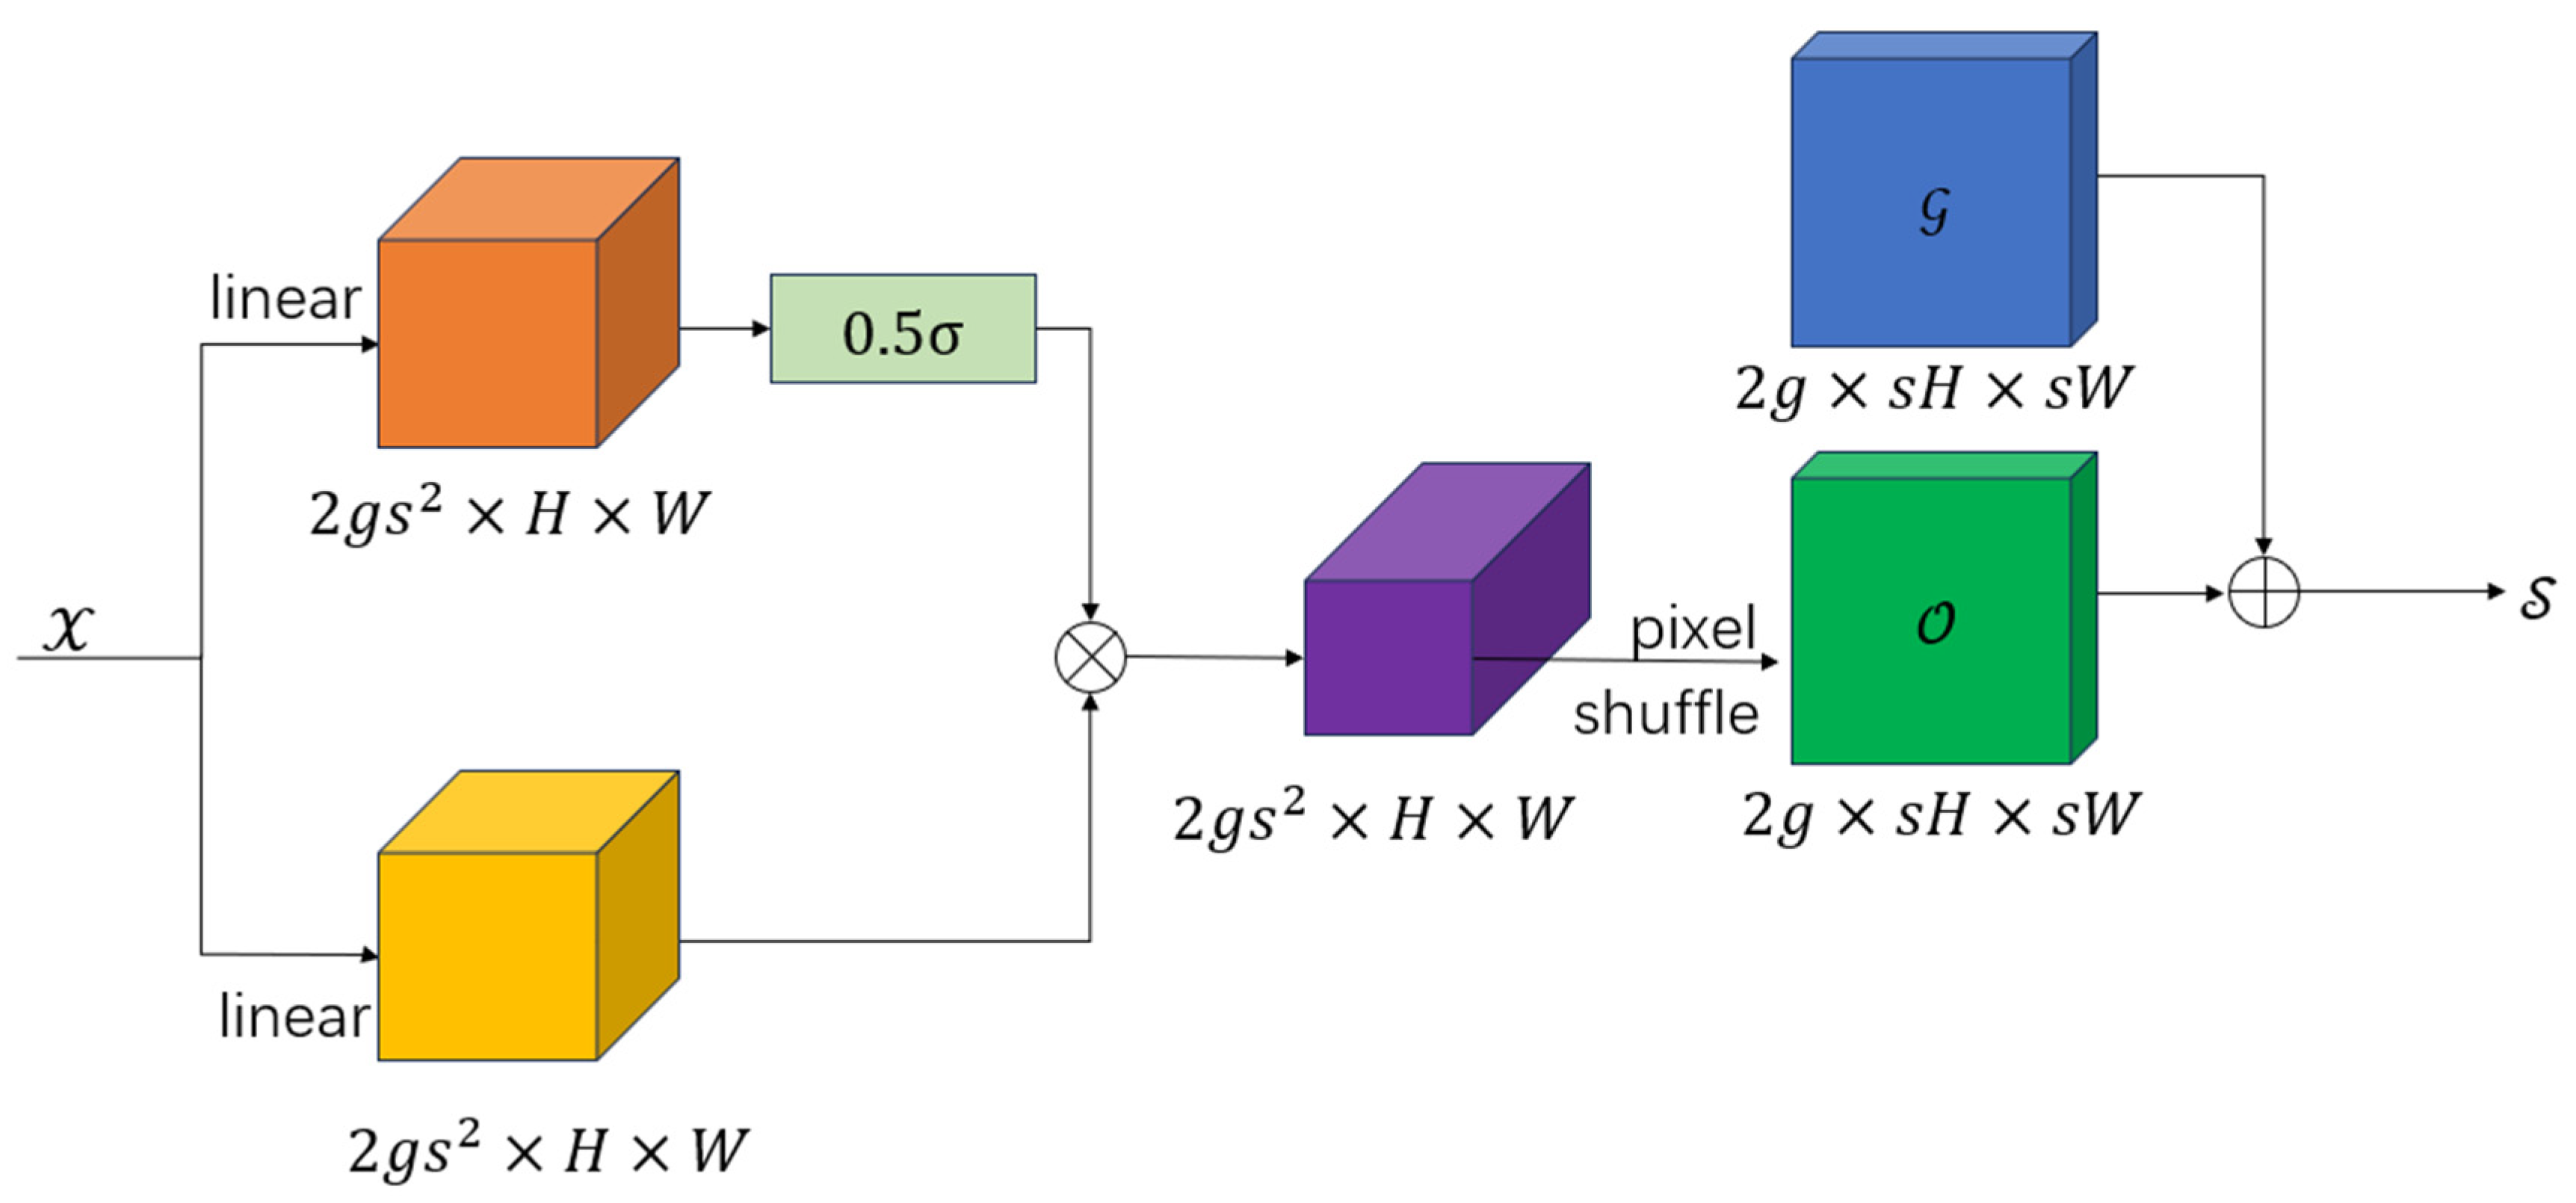
Figure 4.
The structure of RepNCSPELAN.
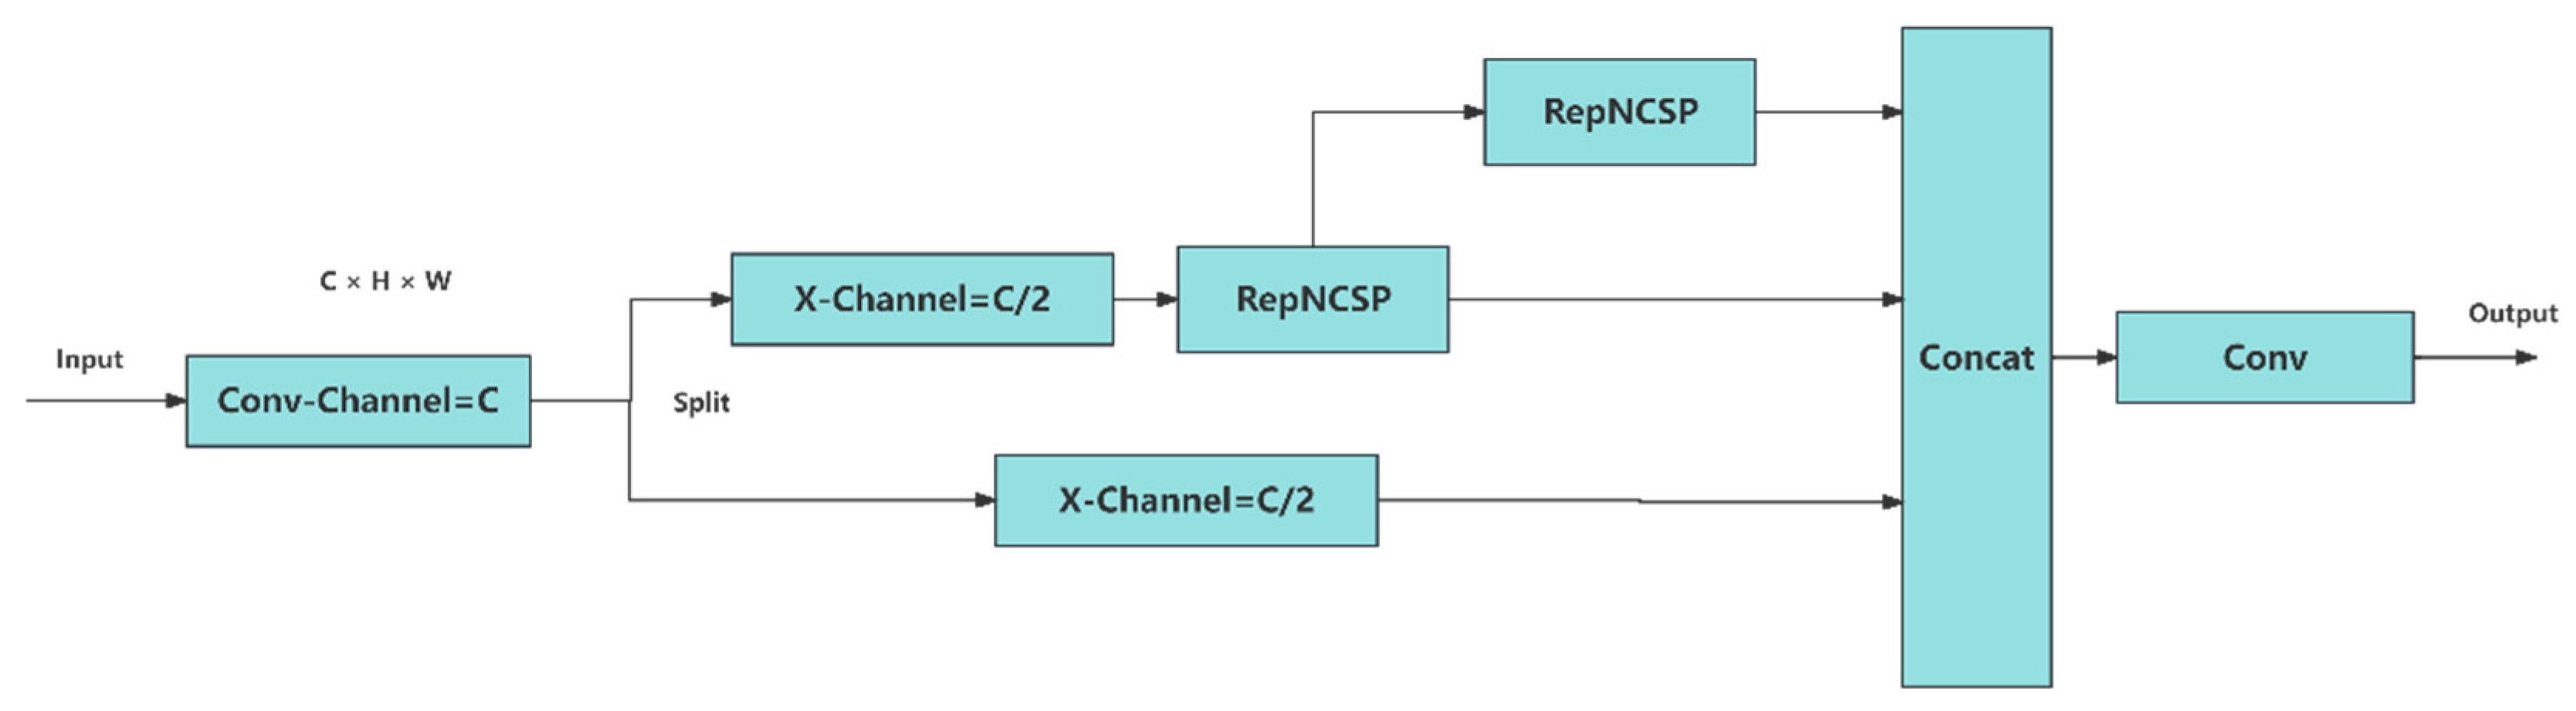
Figure 5.
Multi-scale Feature Fusion Pathway and PAN-FPN Architecture in YOLOv8 Neck.
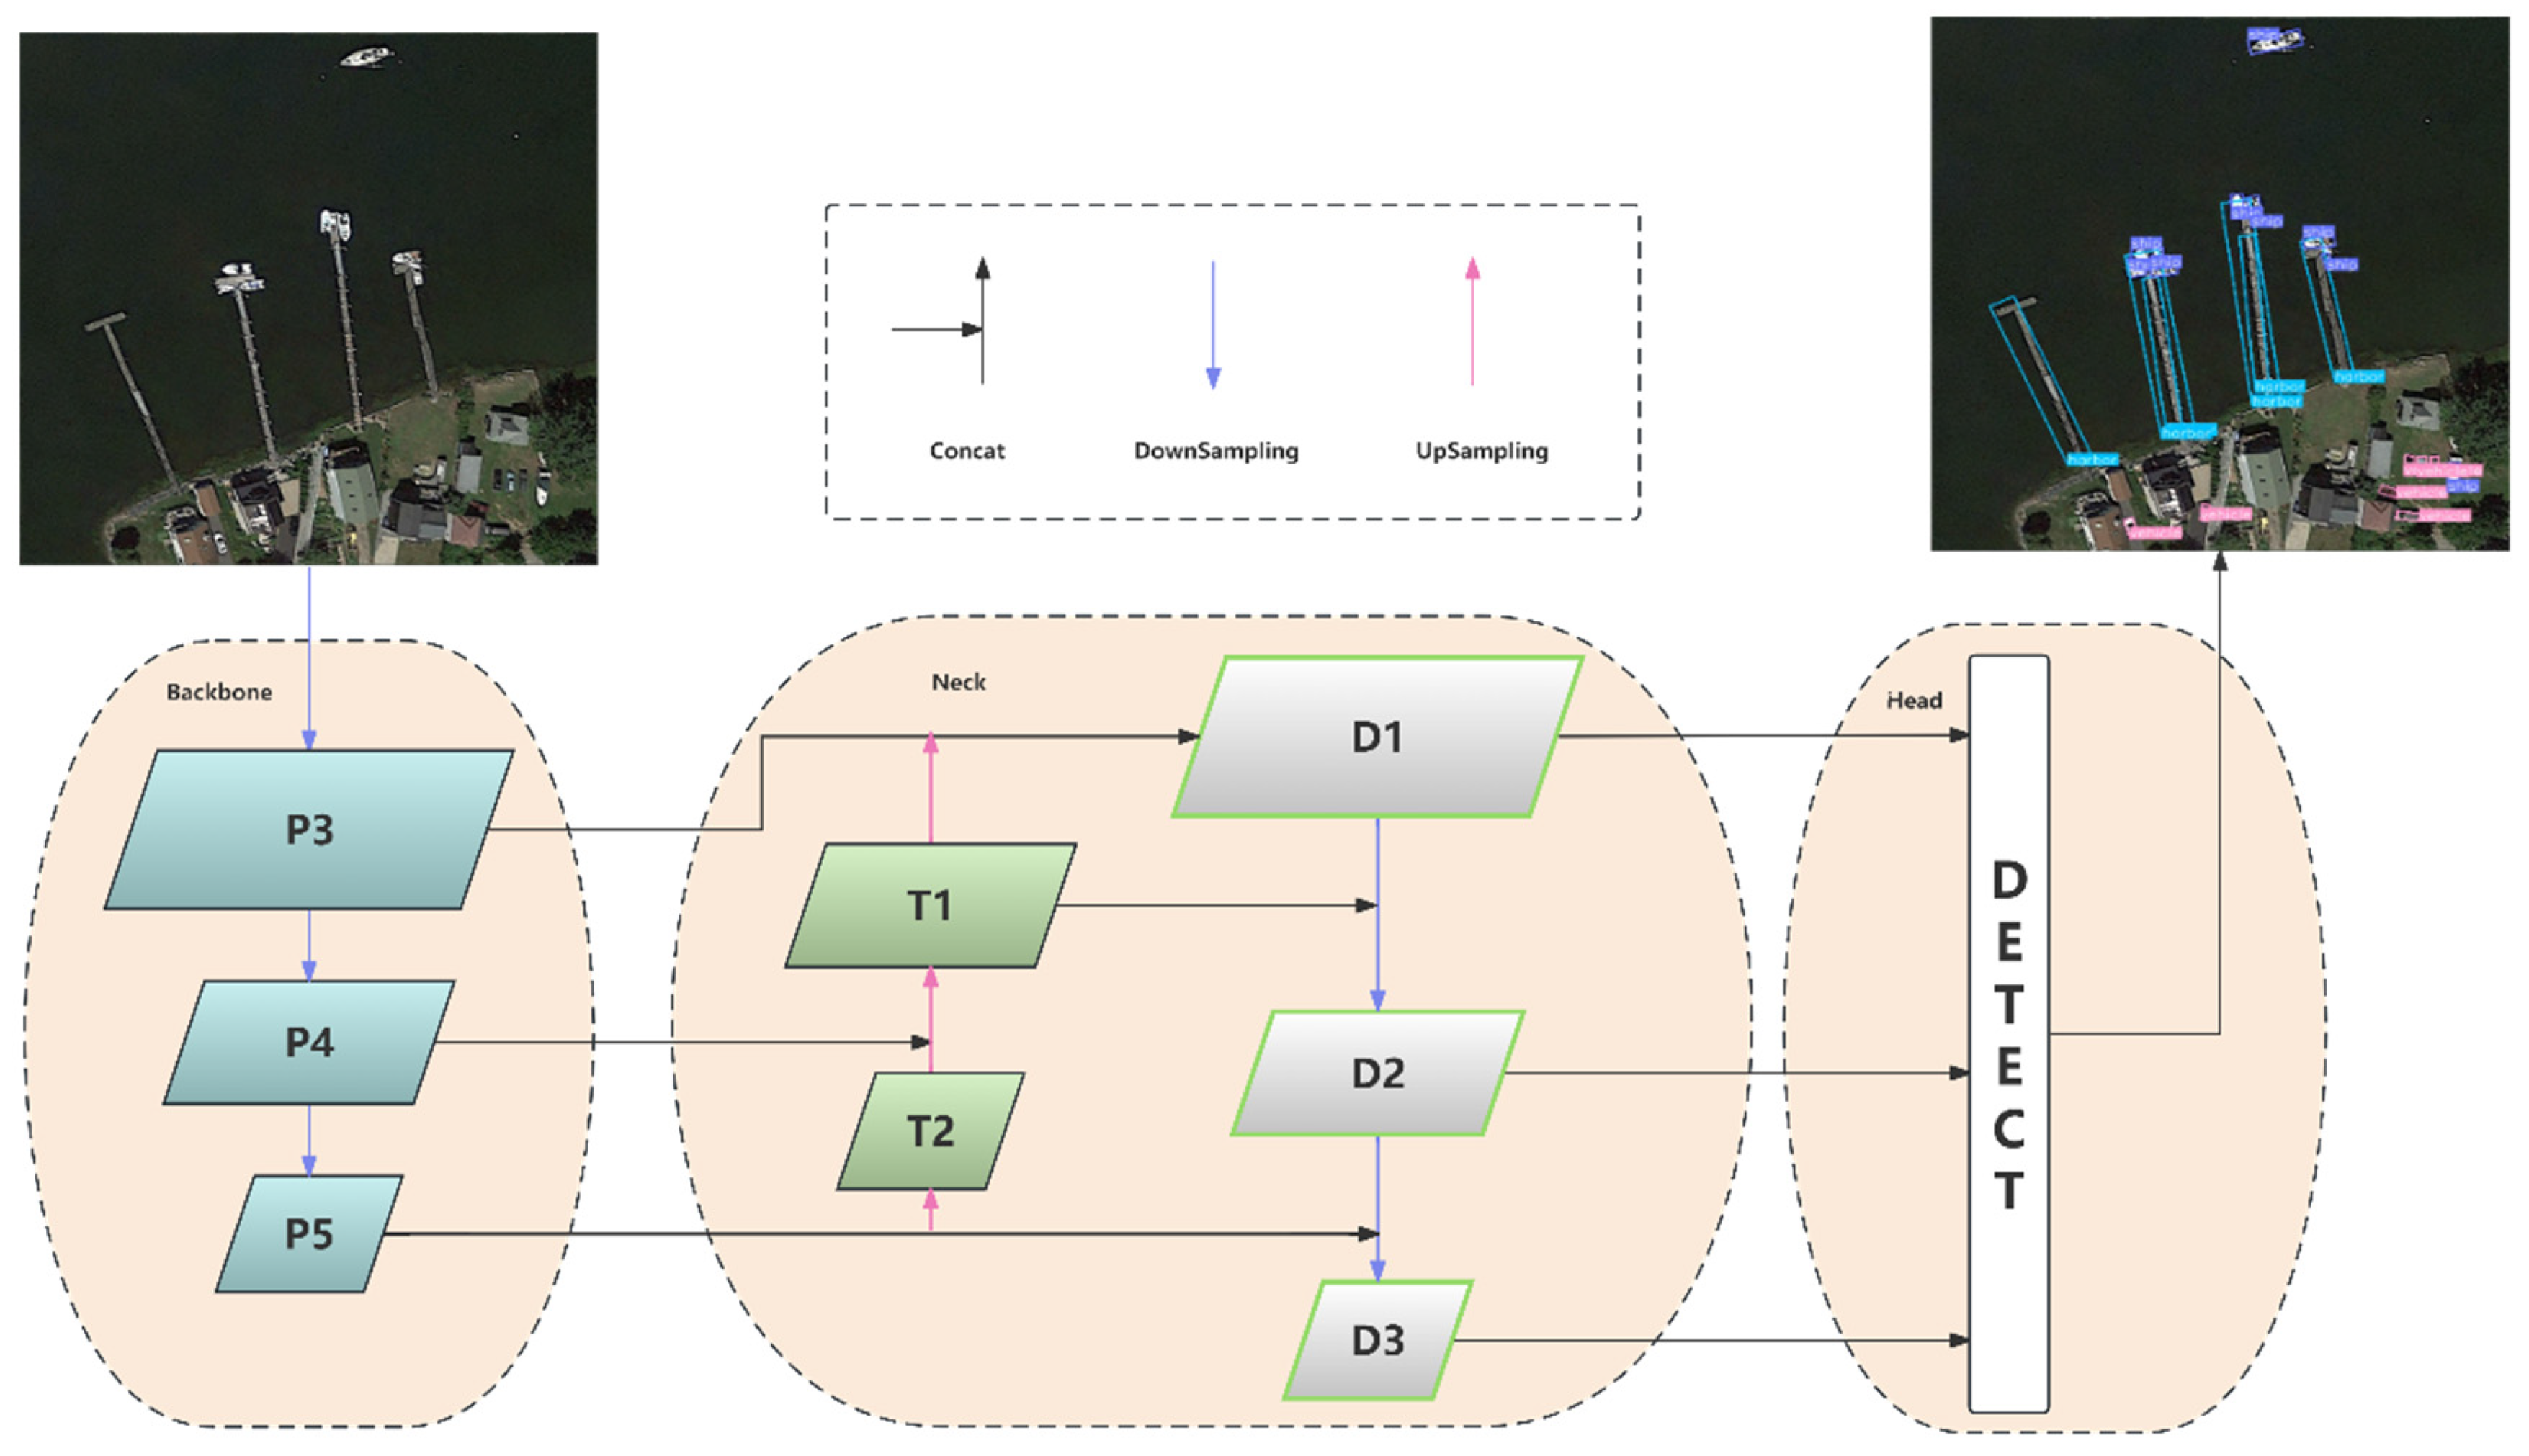
Figure 6.
The original YOLOv8-obb structure and the improved YOLOv8-obb structure.
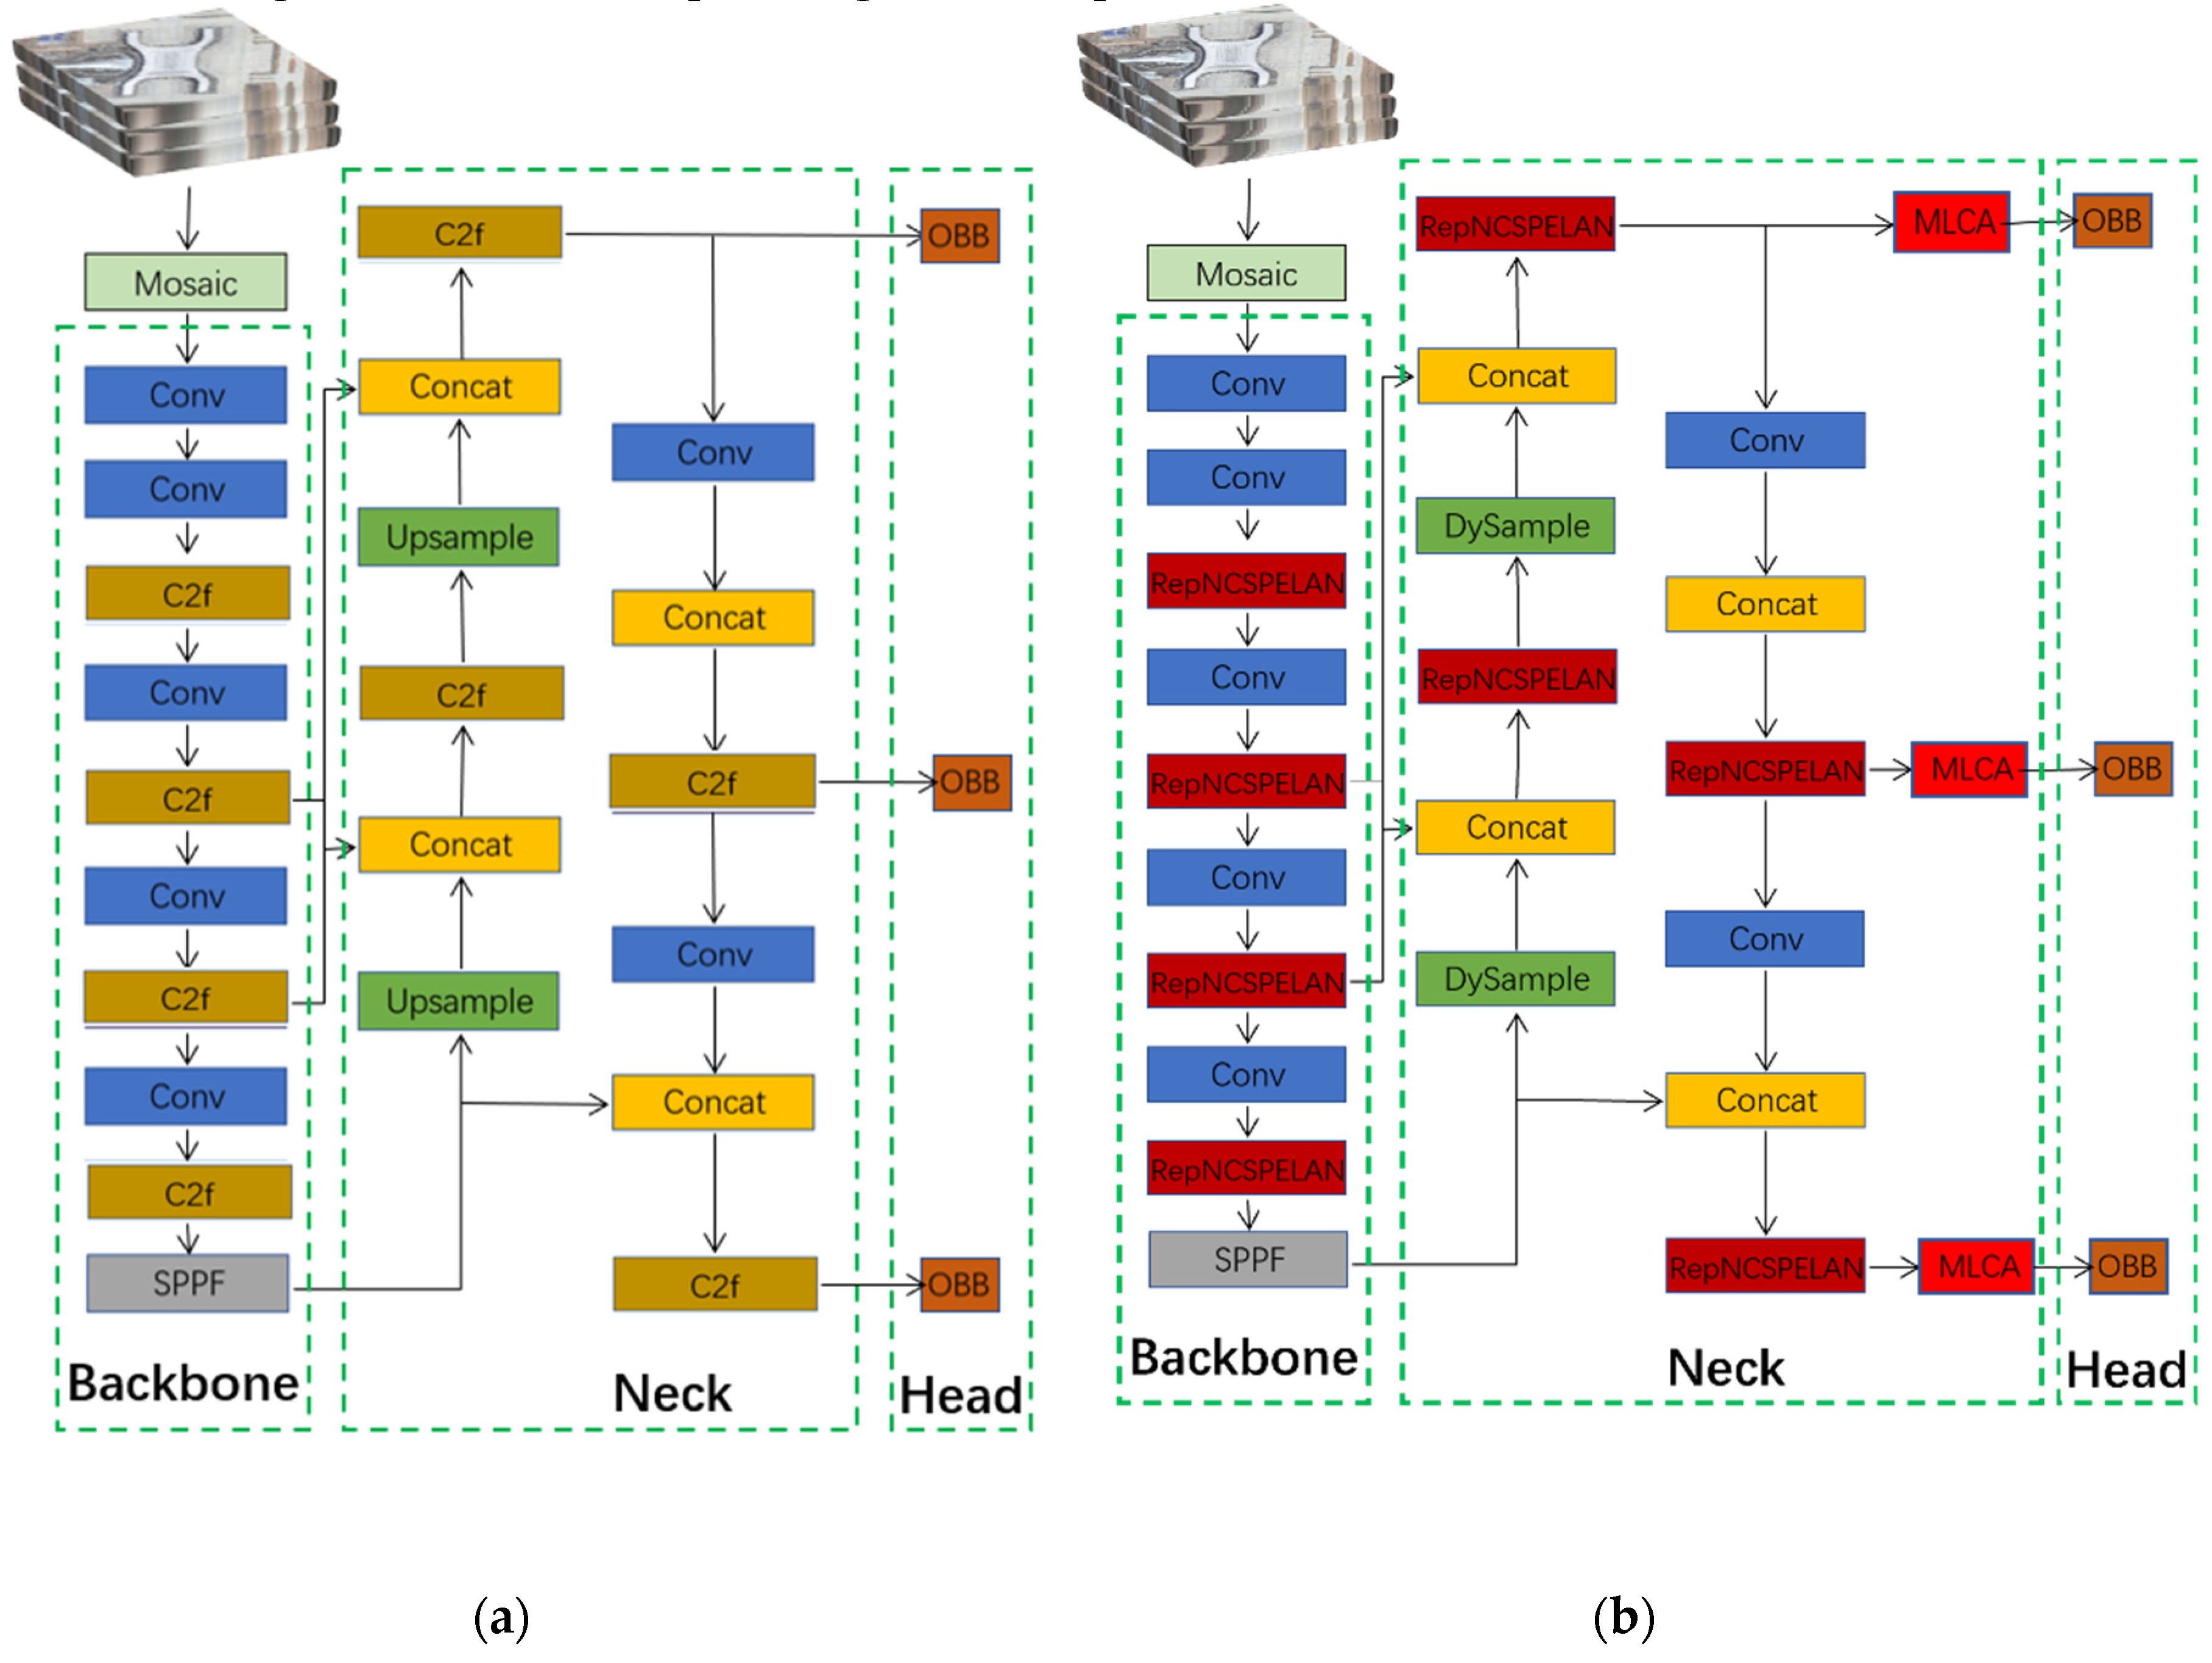
Figure 7.
The distribution of the size of labeled instances.
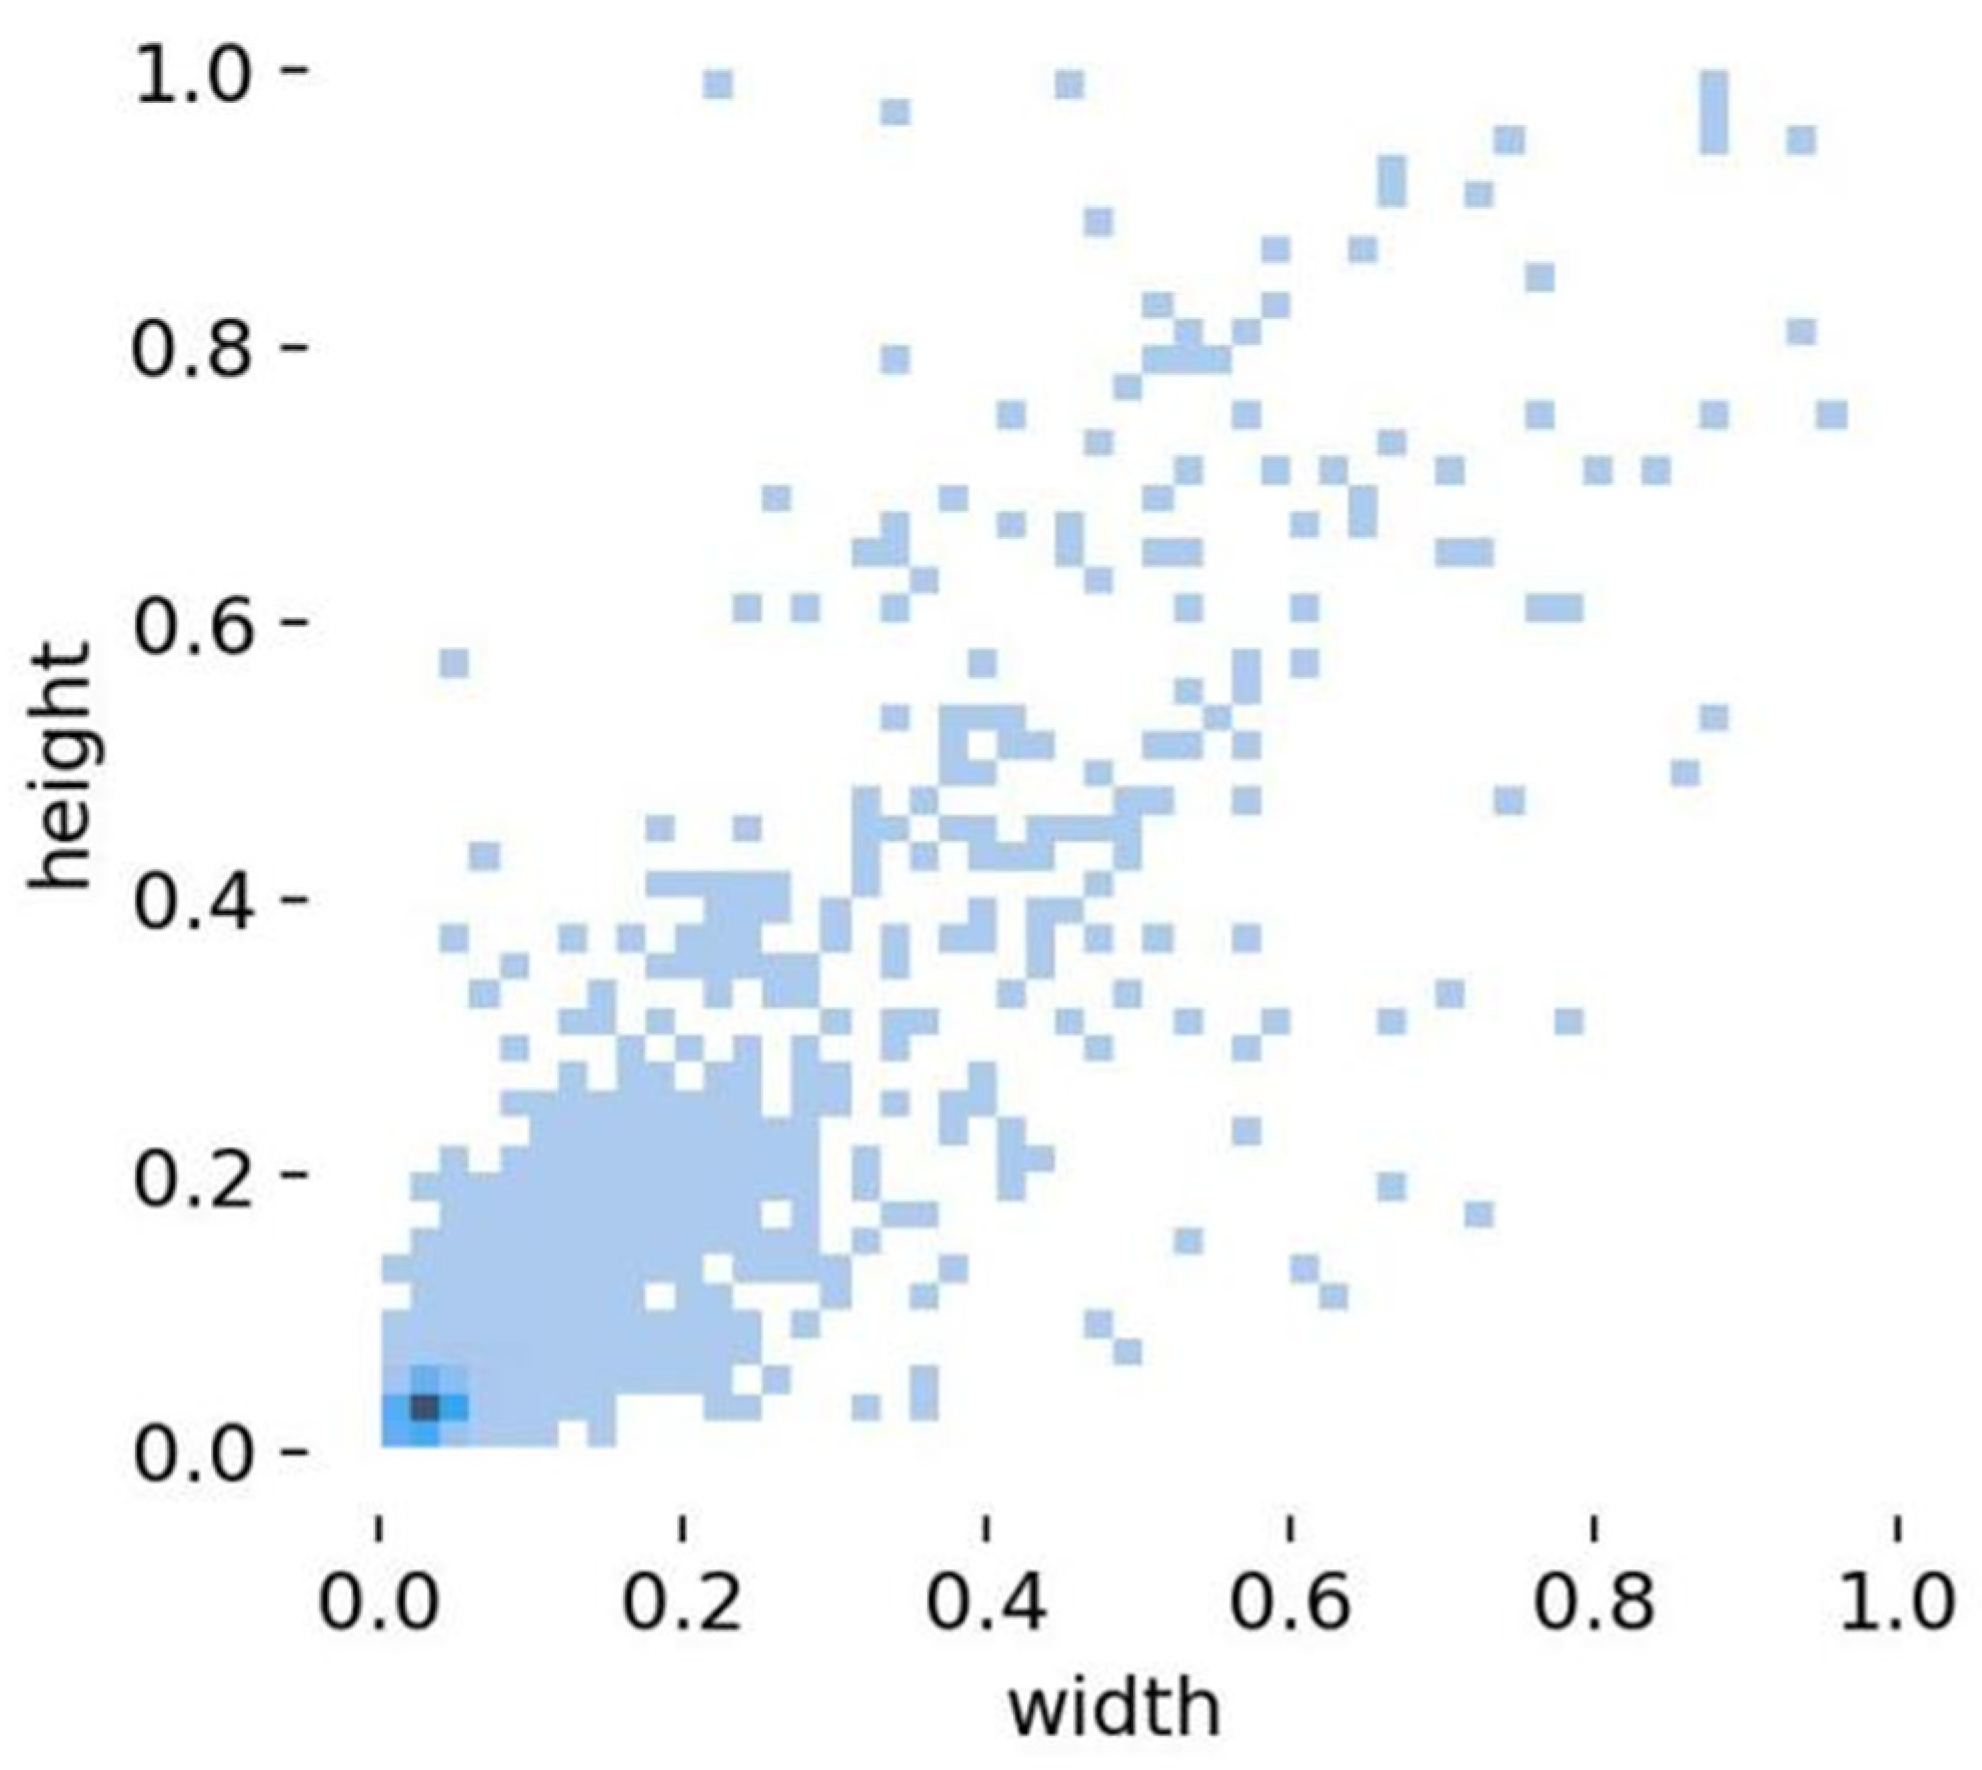
Figure 8.
The training curves.
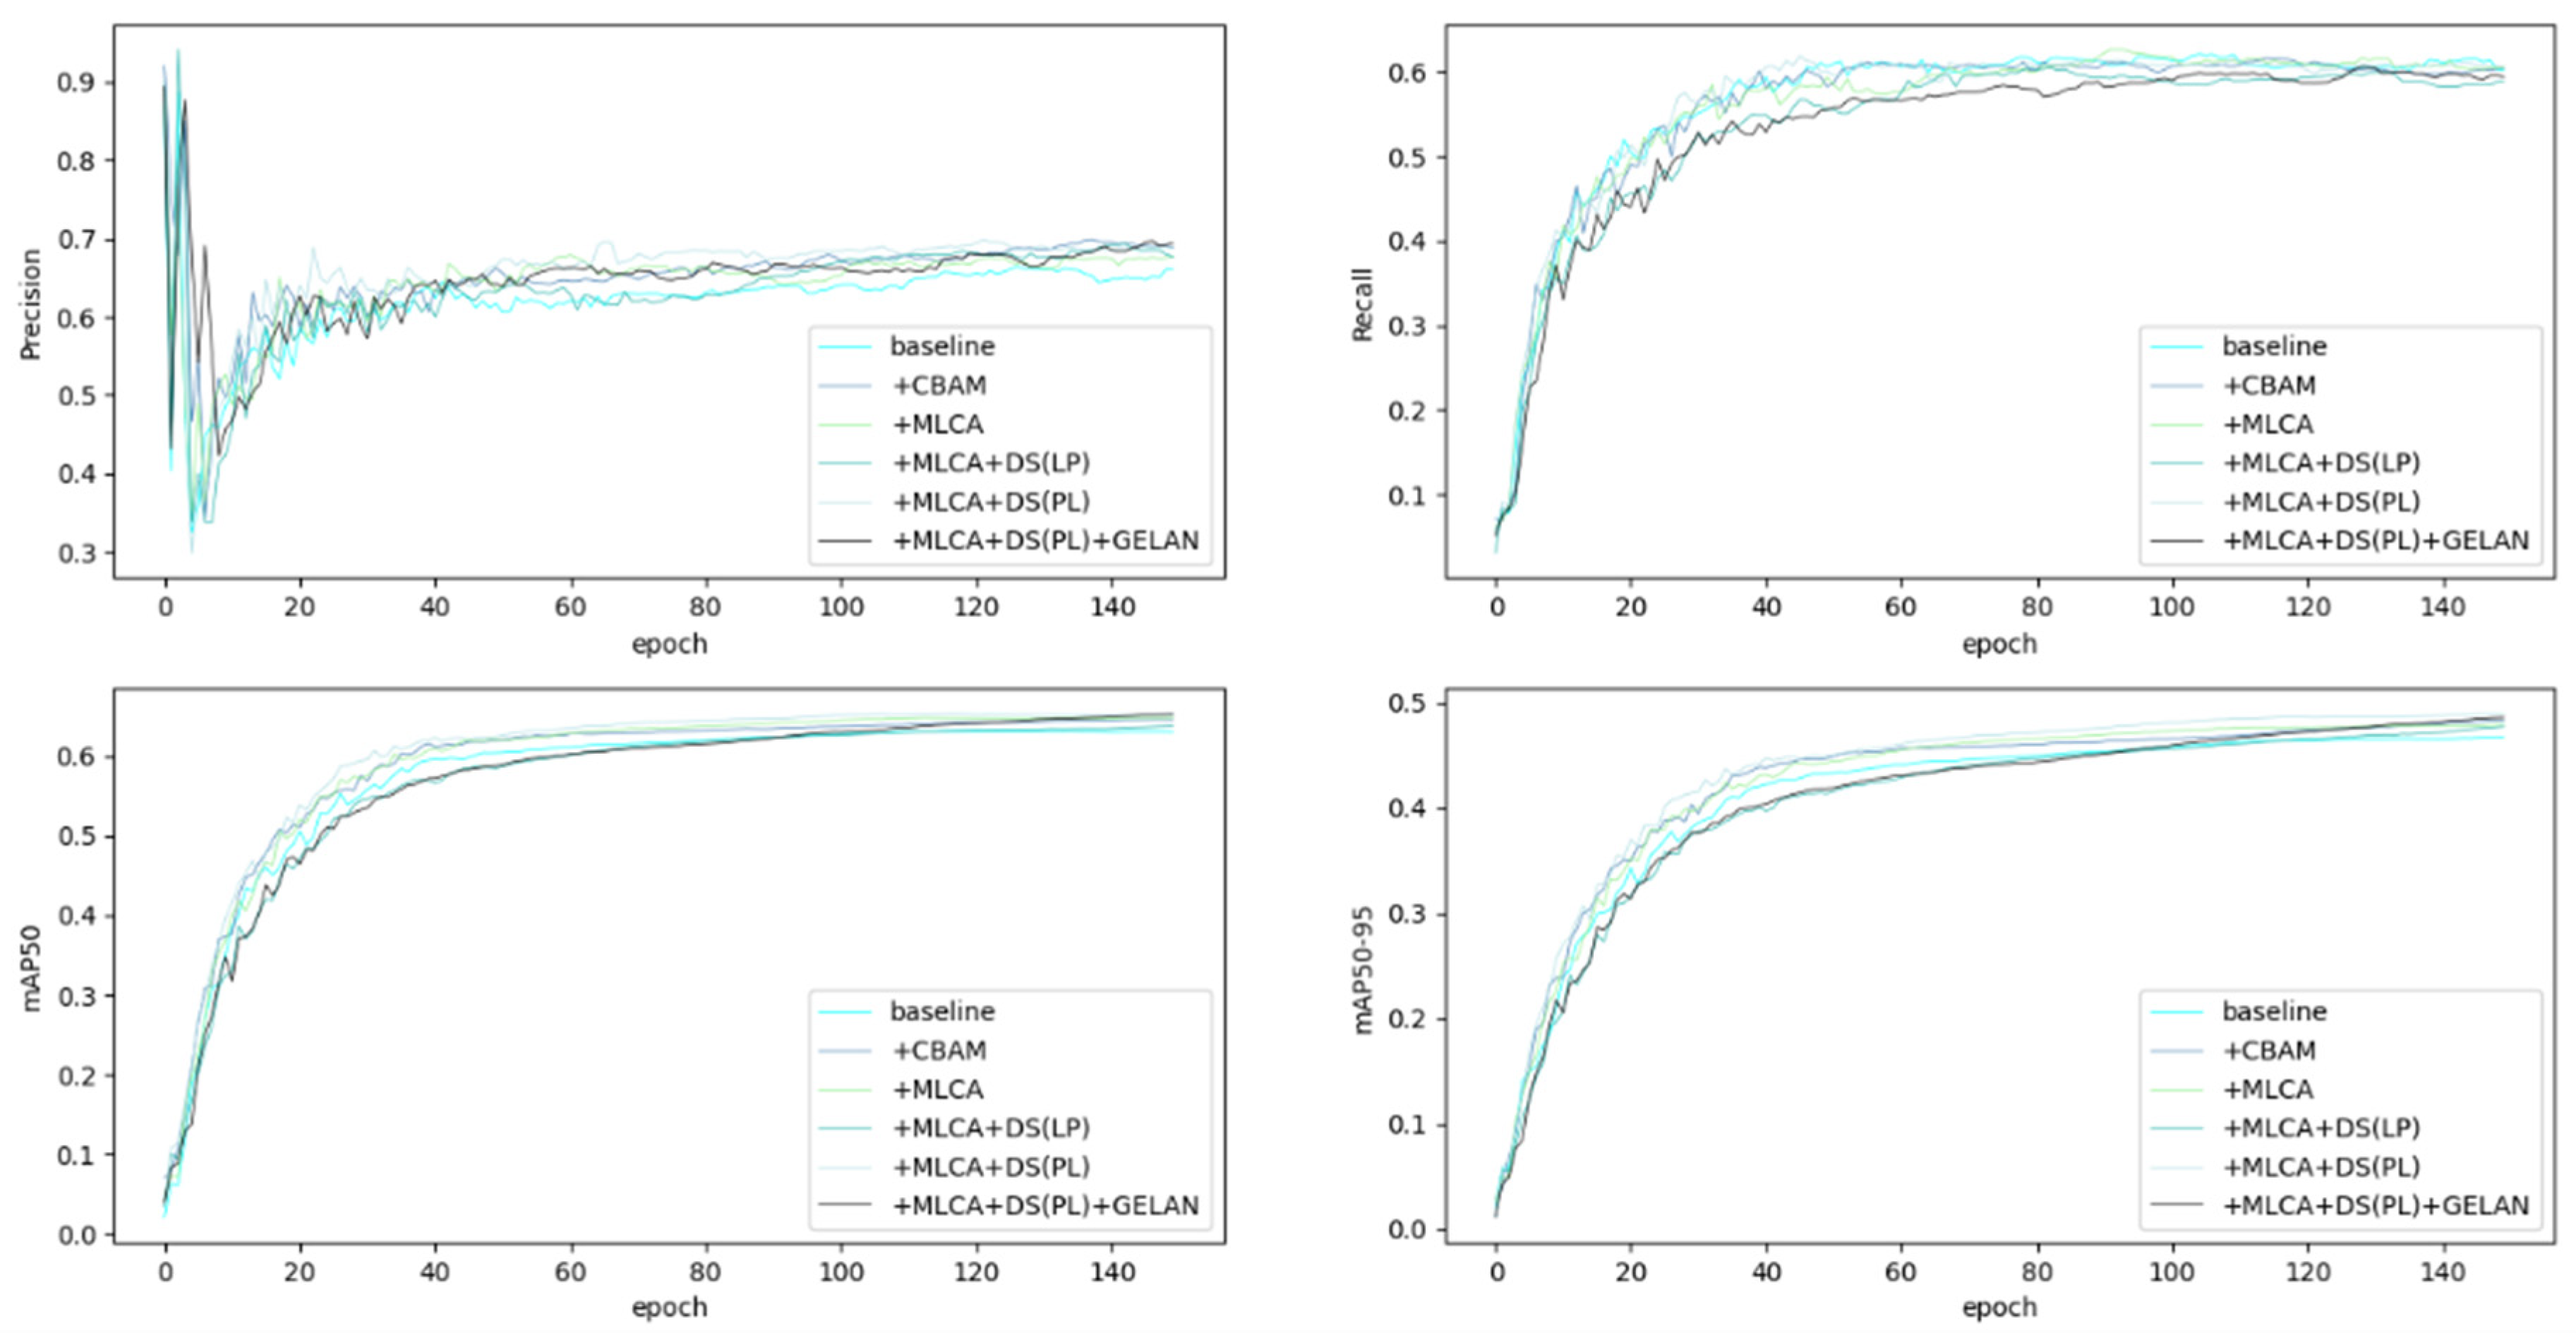
Figure 9.
Confusion Matrix.
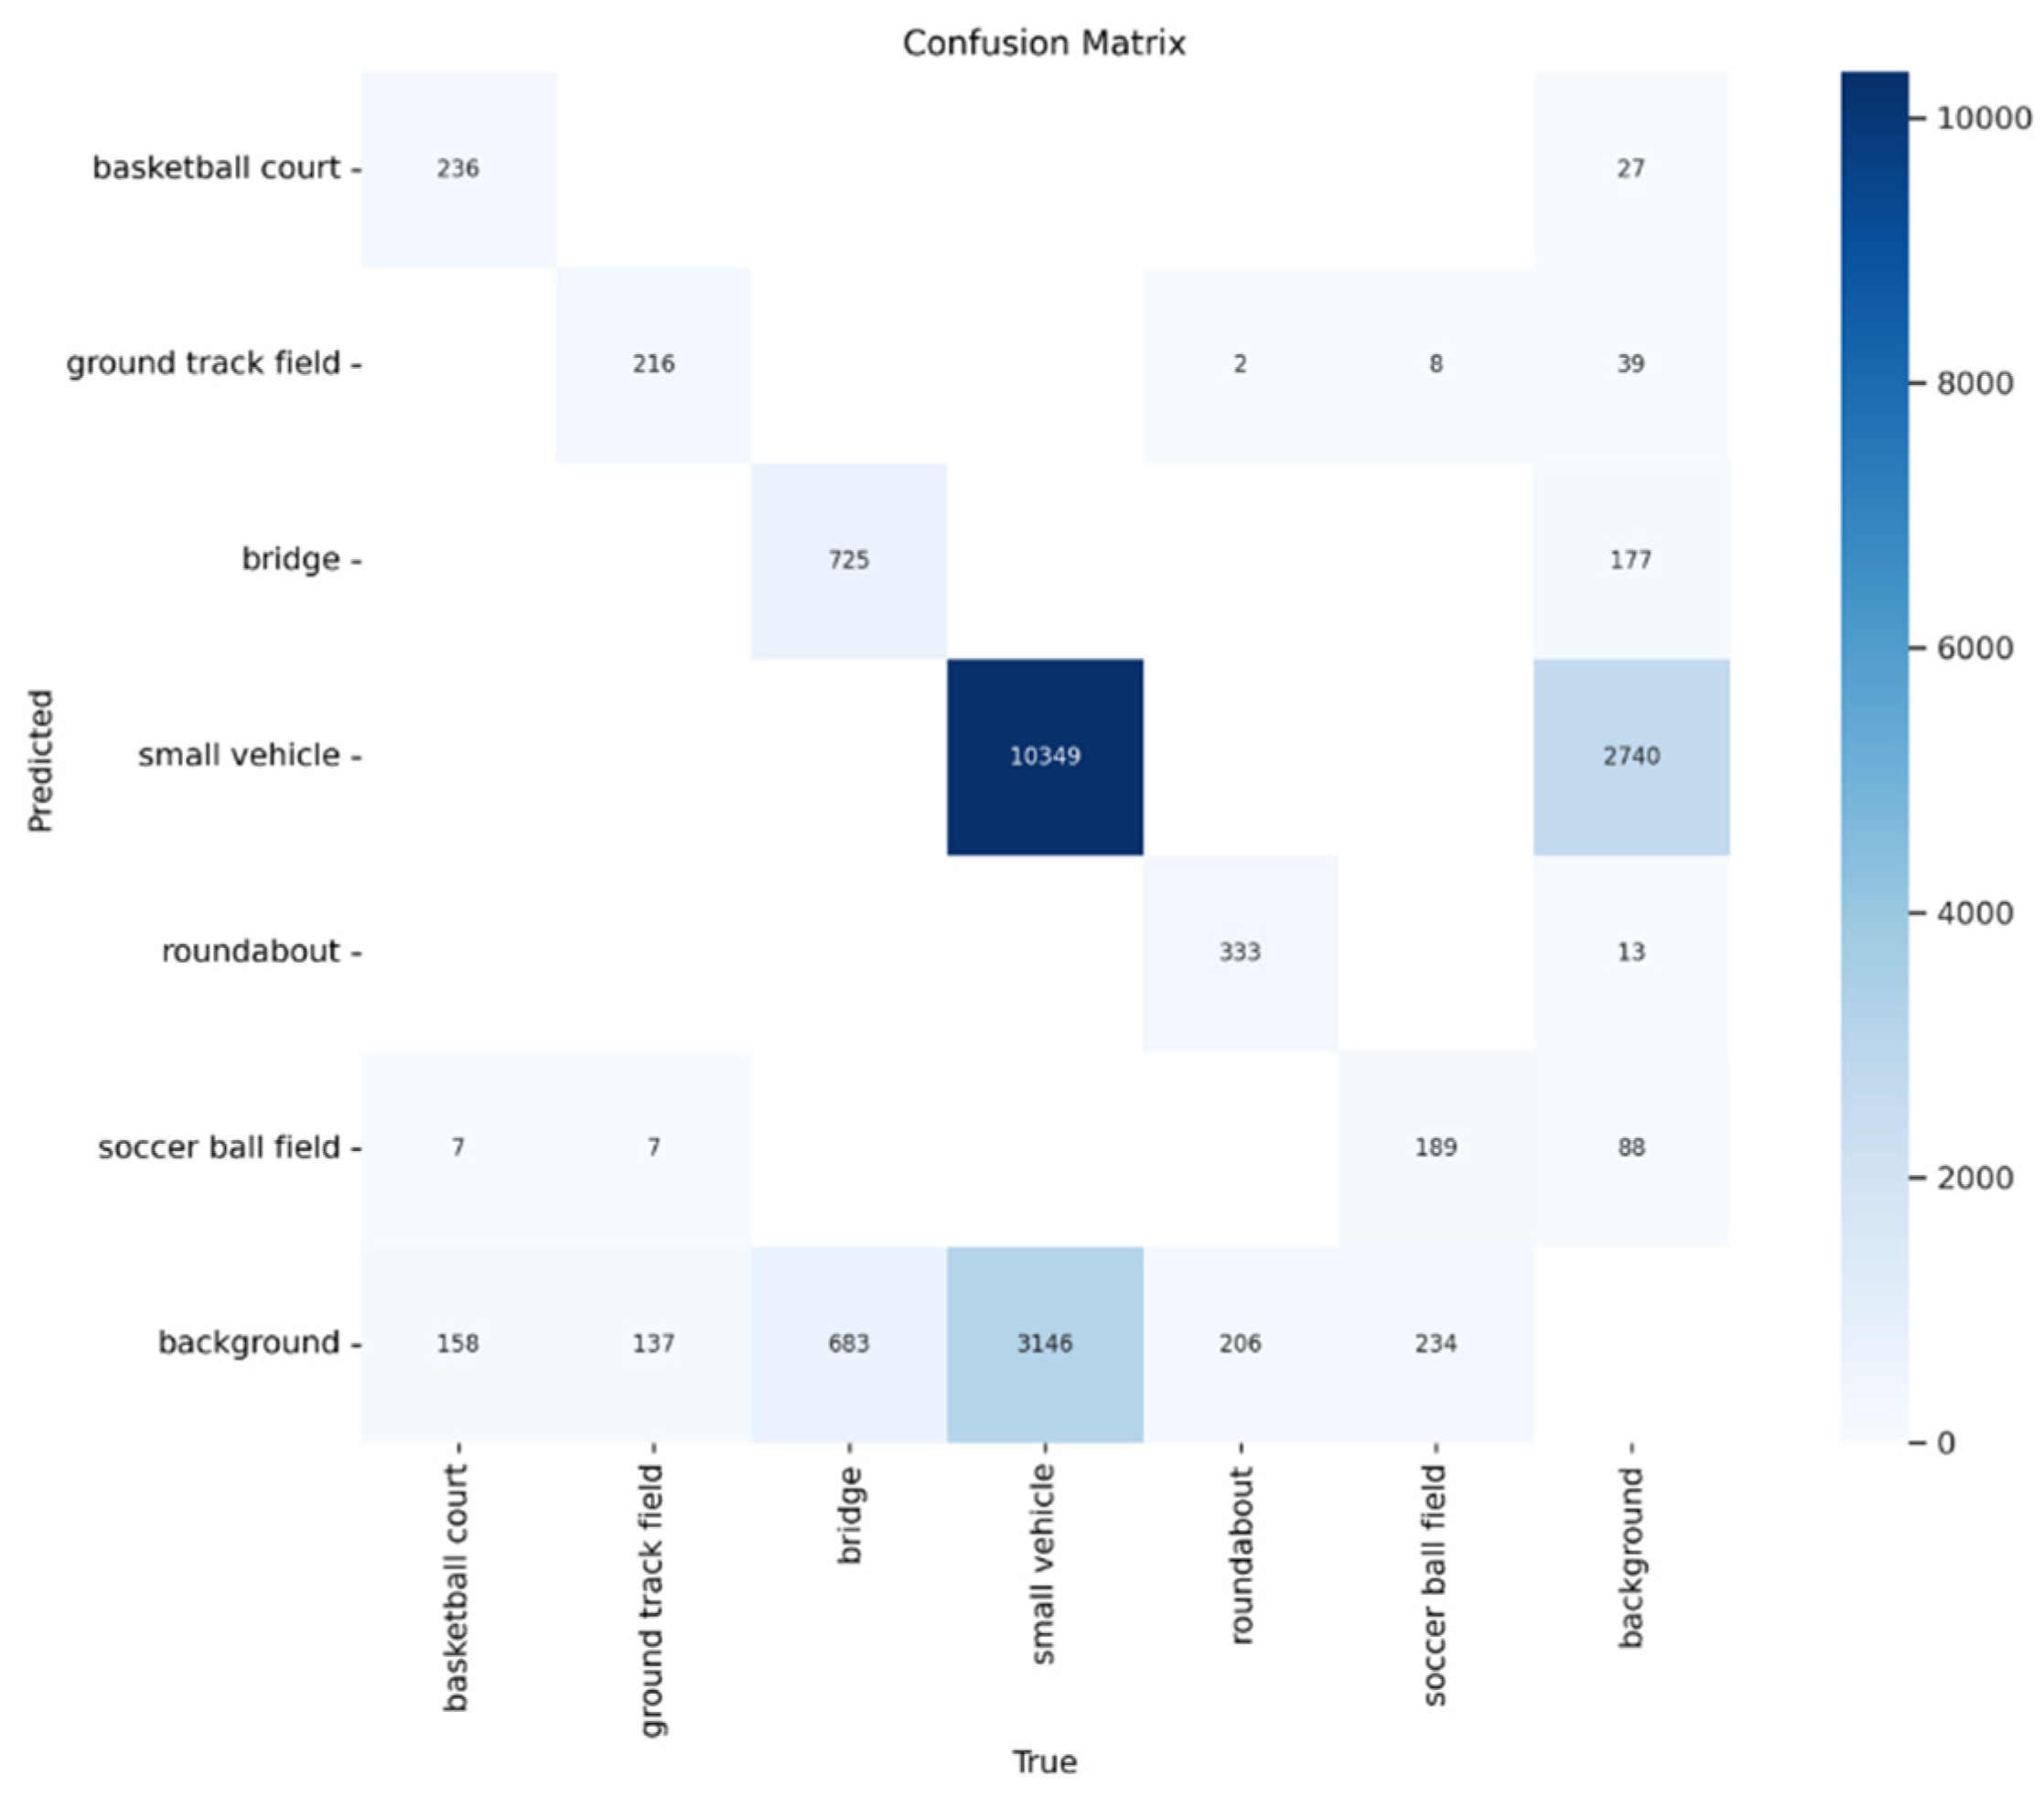
Figure 10.
Normalized Confusion Matrix.
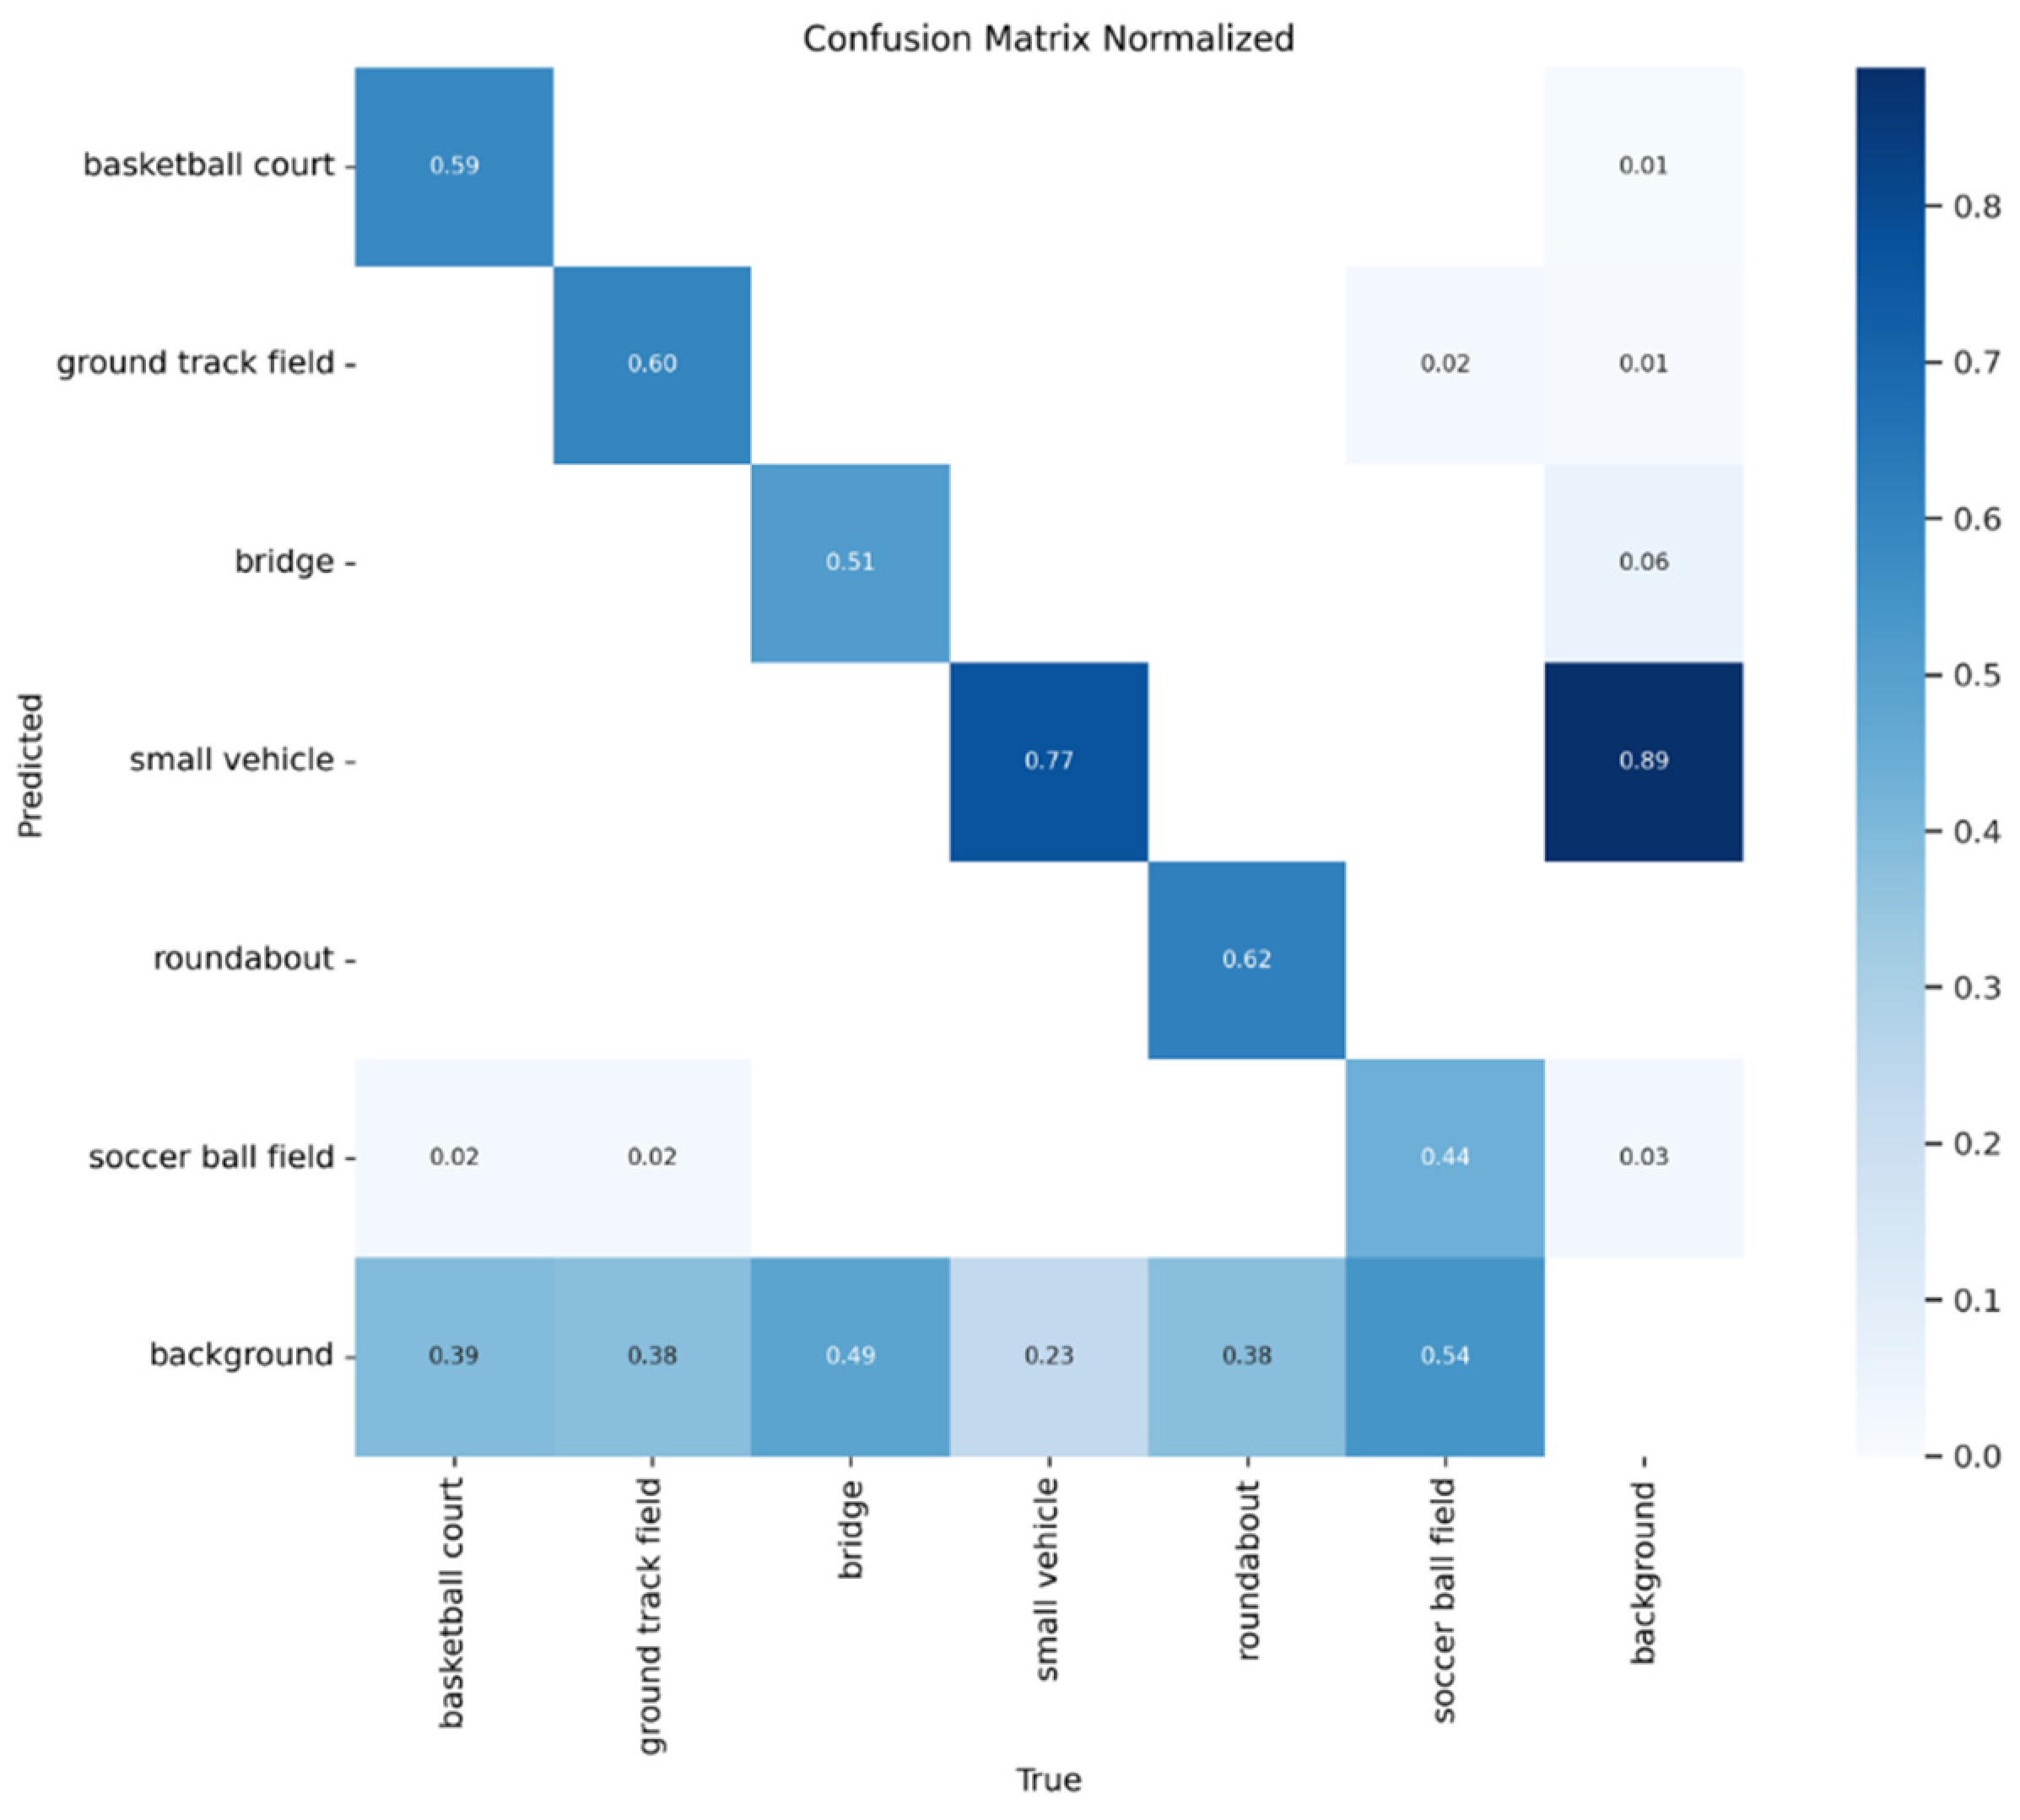
Figure 11.
Precision-Confidence Curve.
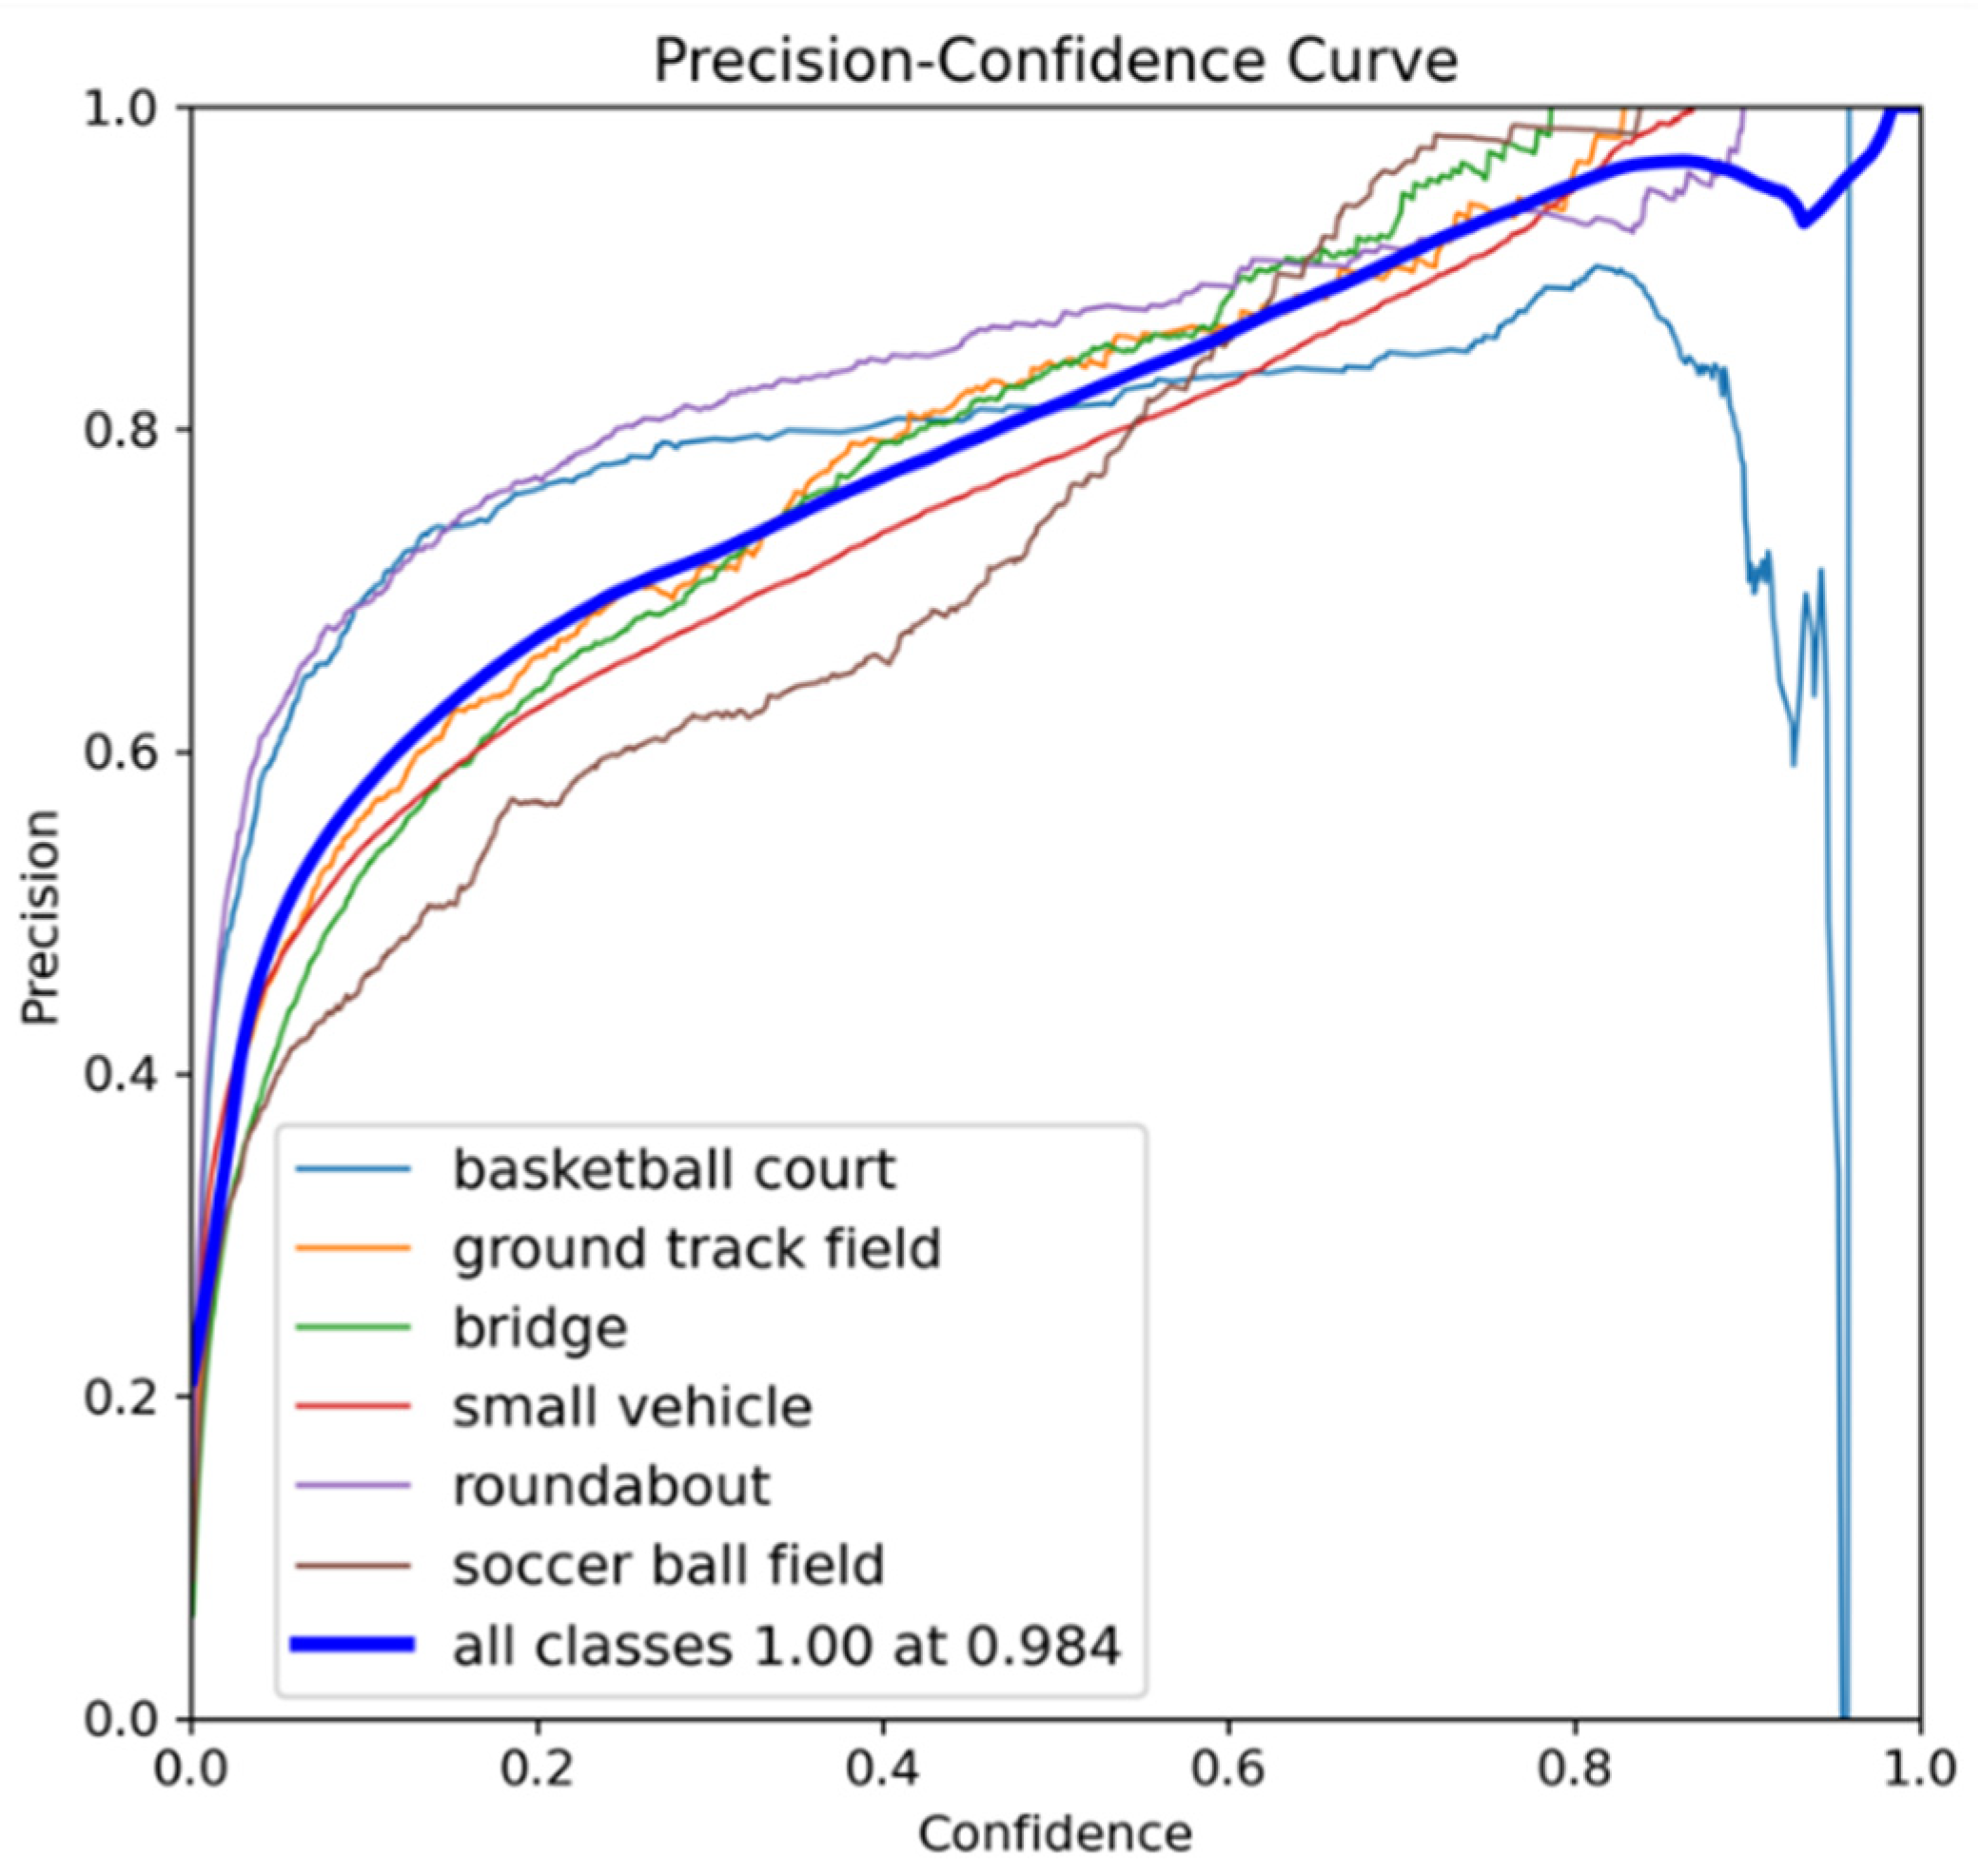
Figure 12.
Recall-Confidence Curve.
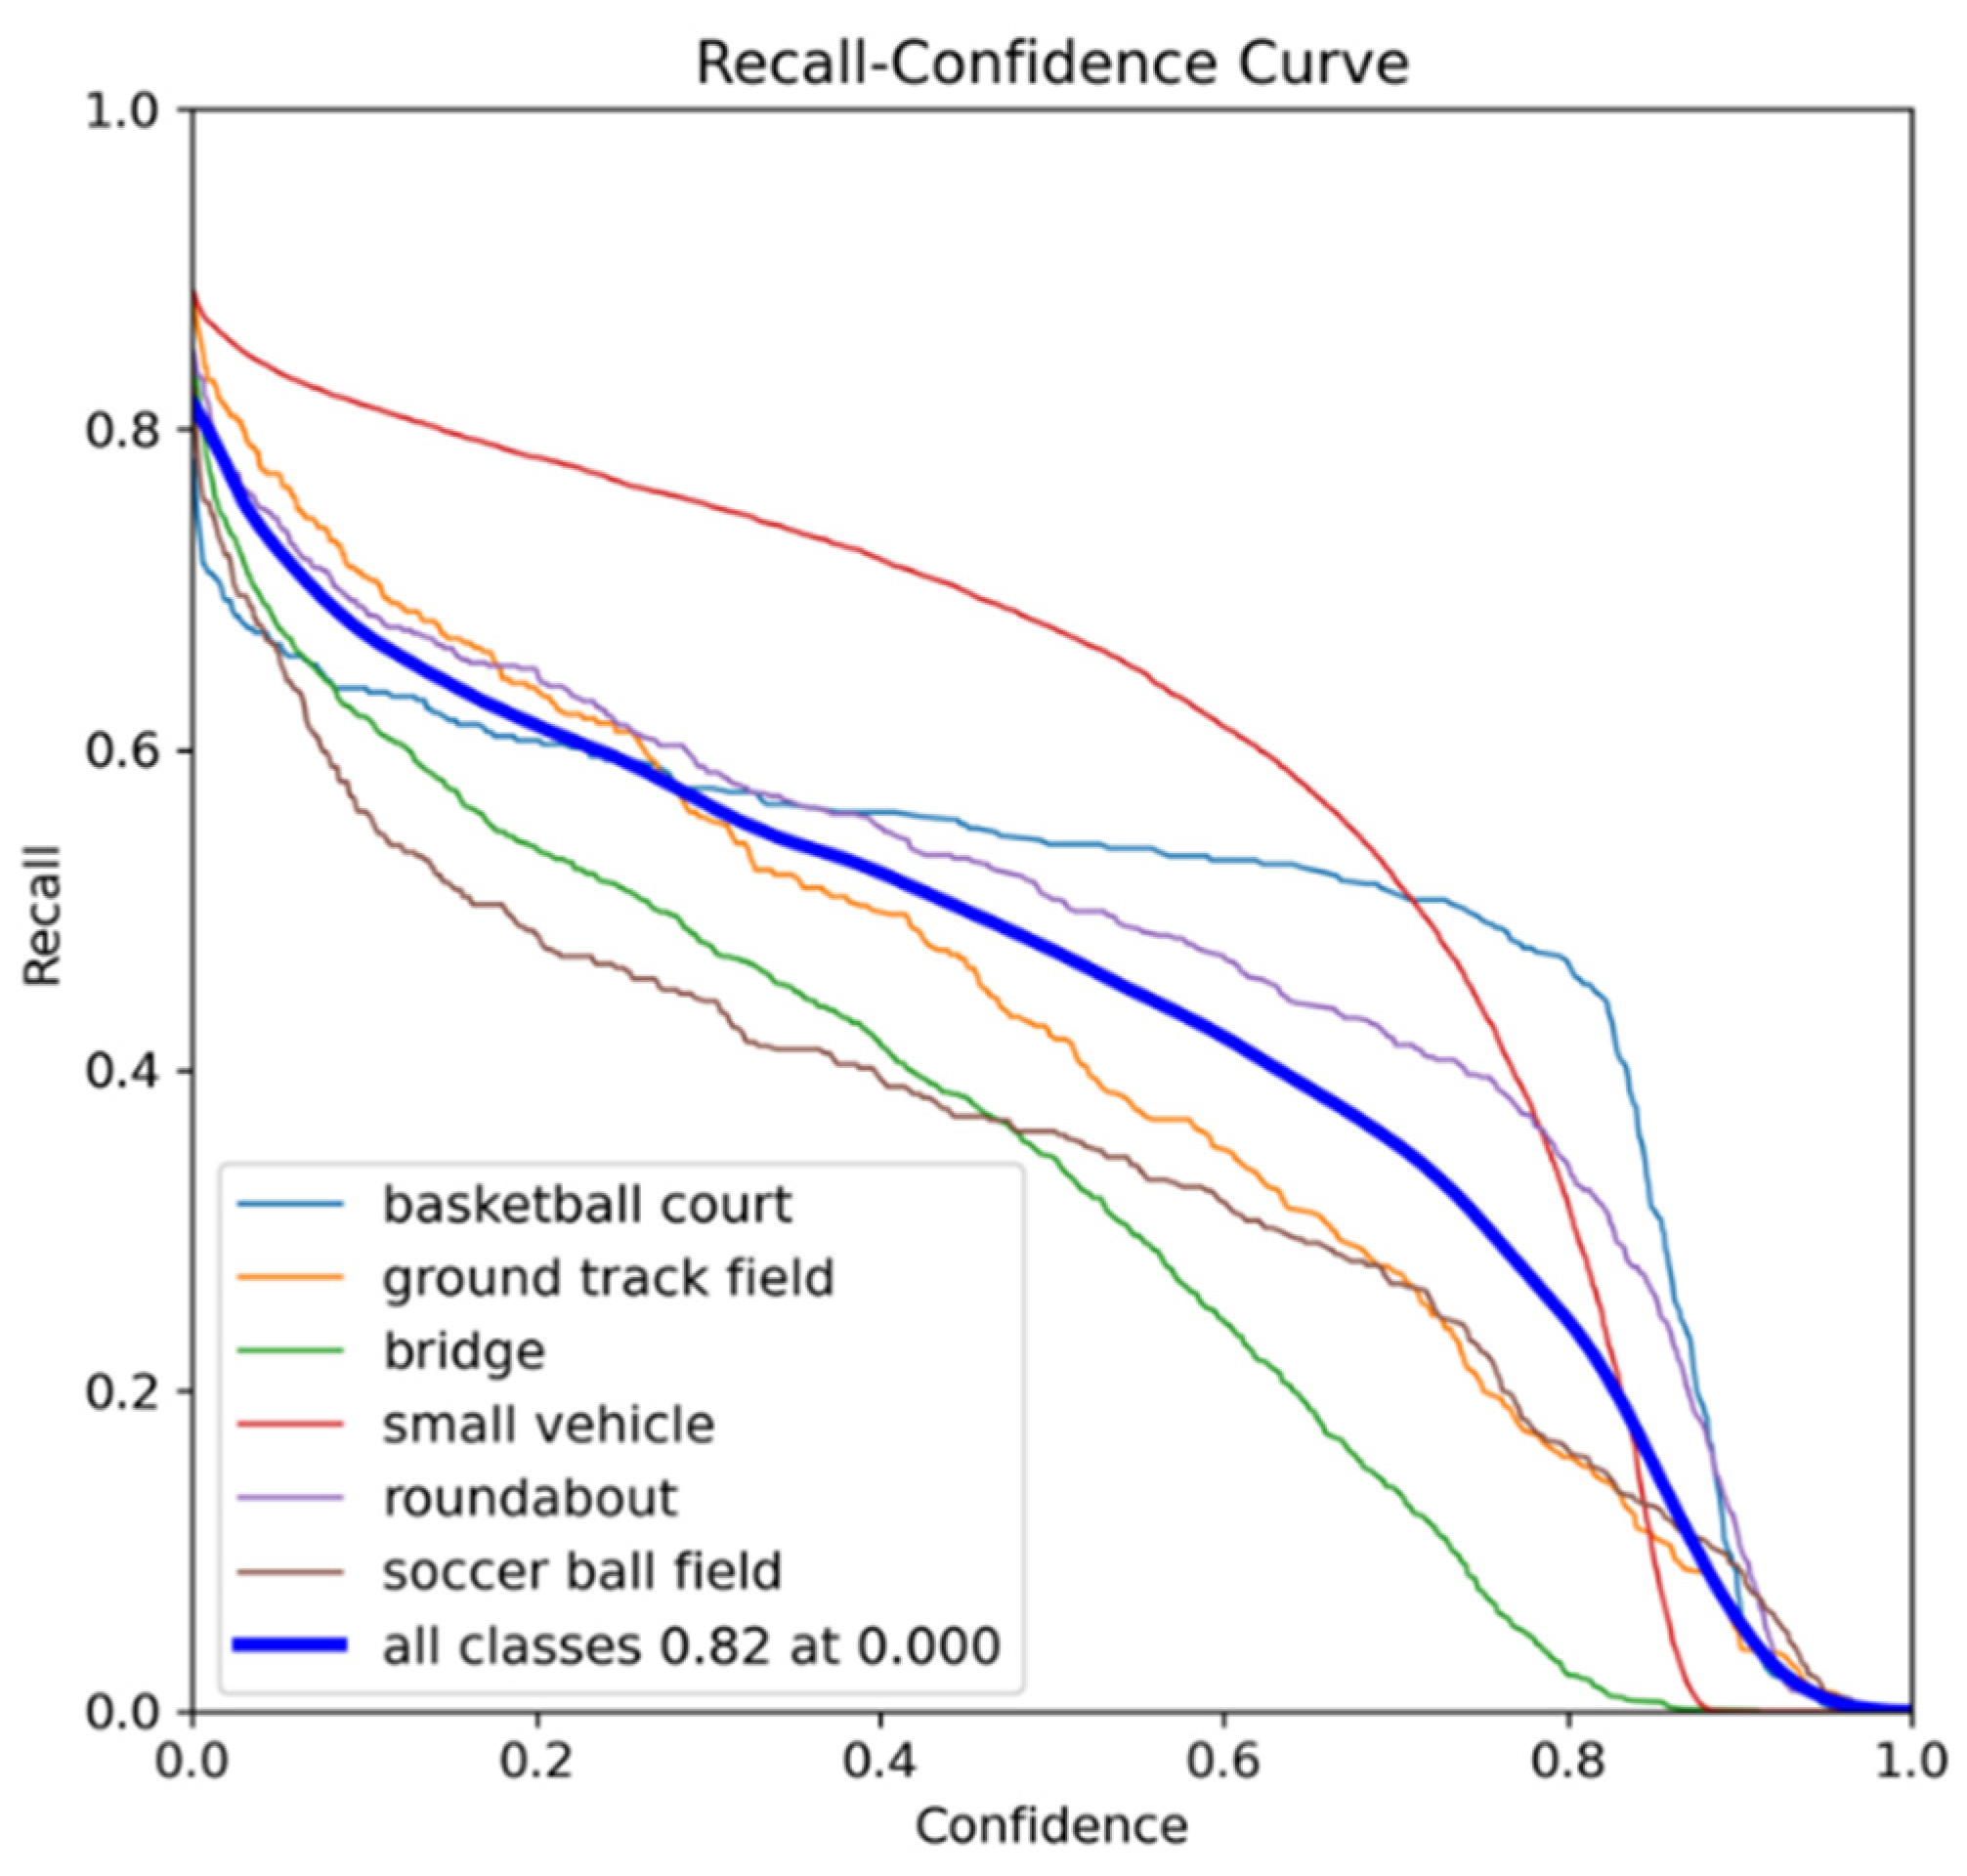
Figure 13.
F1-Confidence Curve.
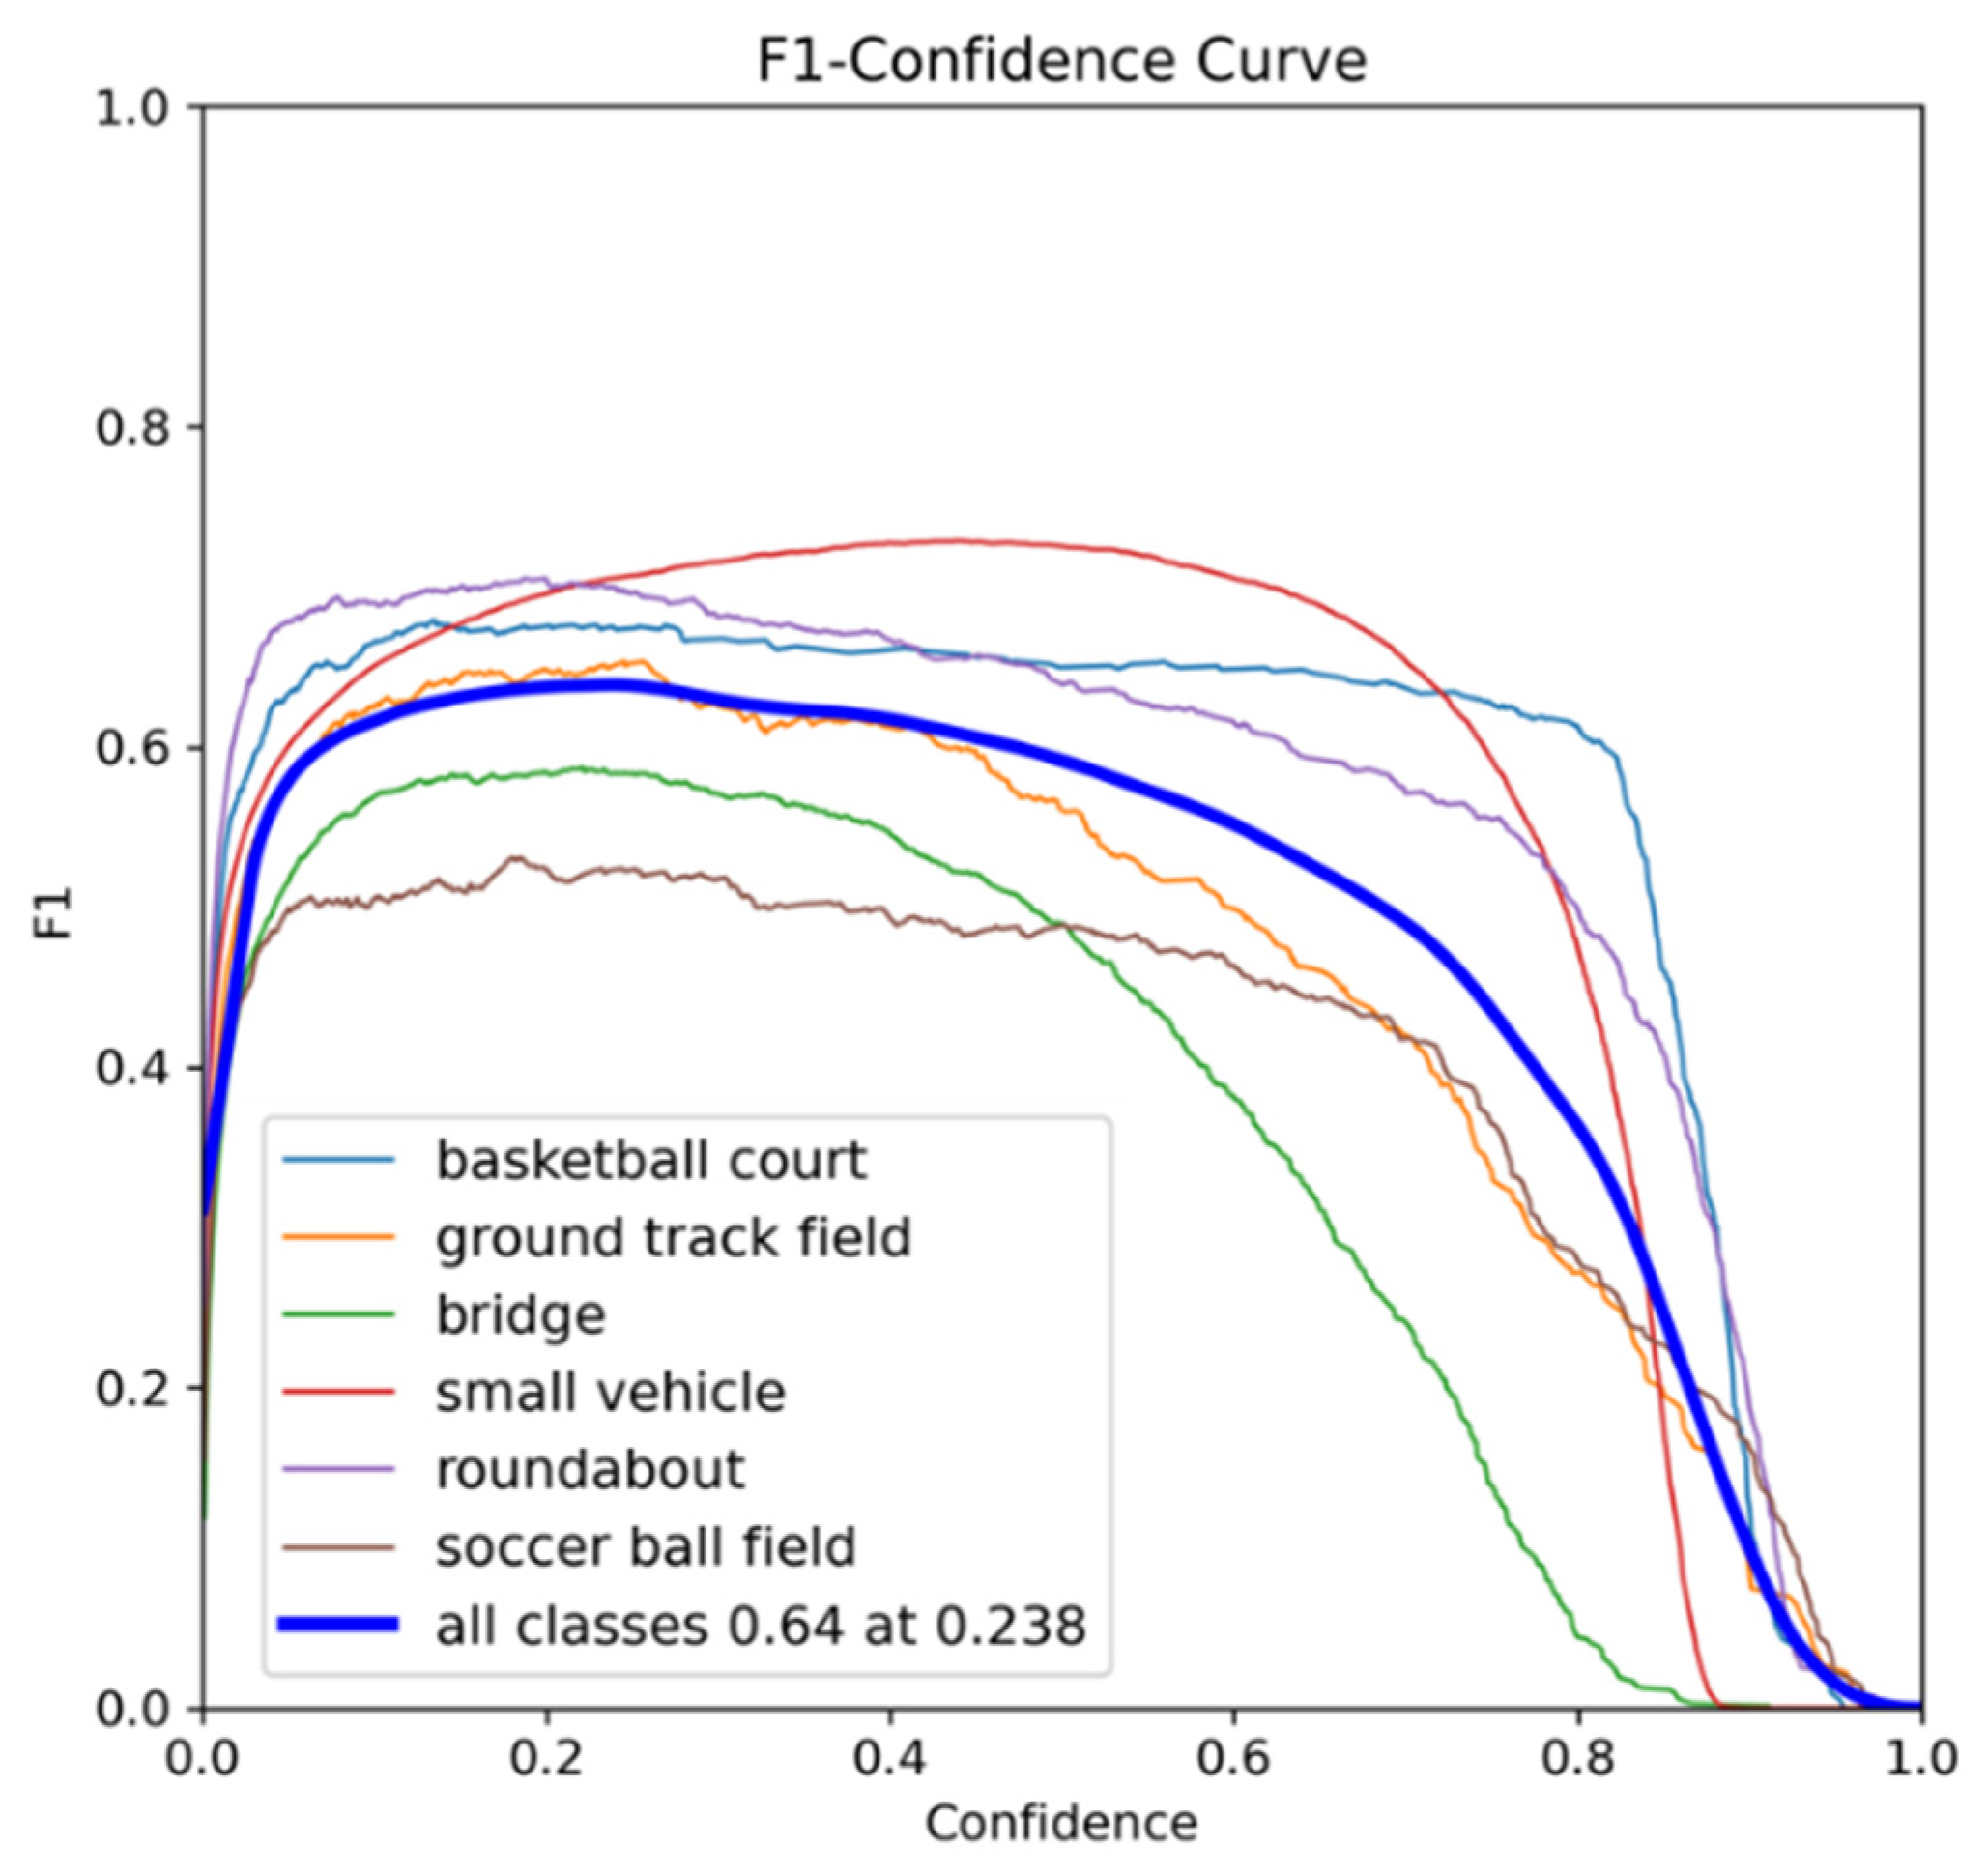
Figure 14.
Precision-Recall Curve.
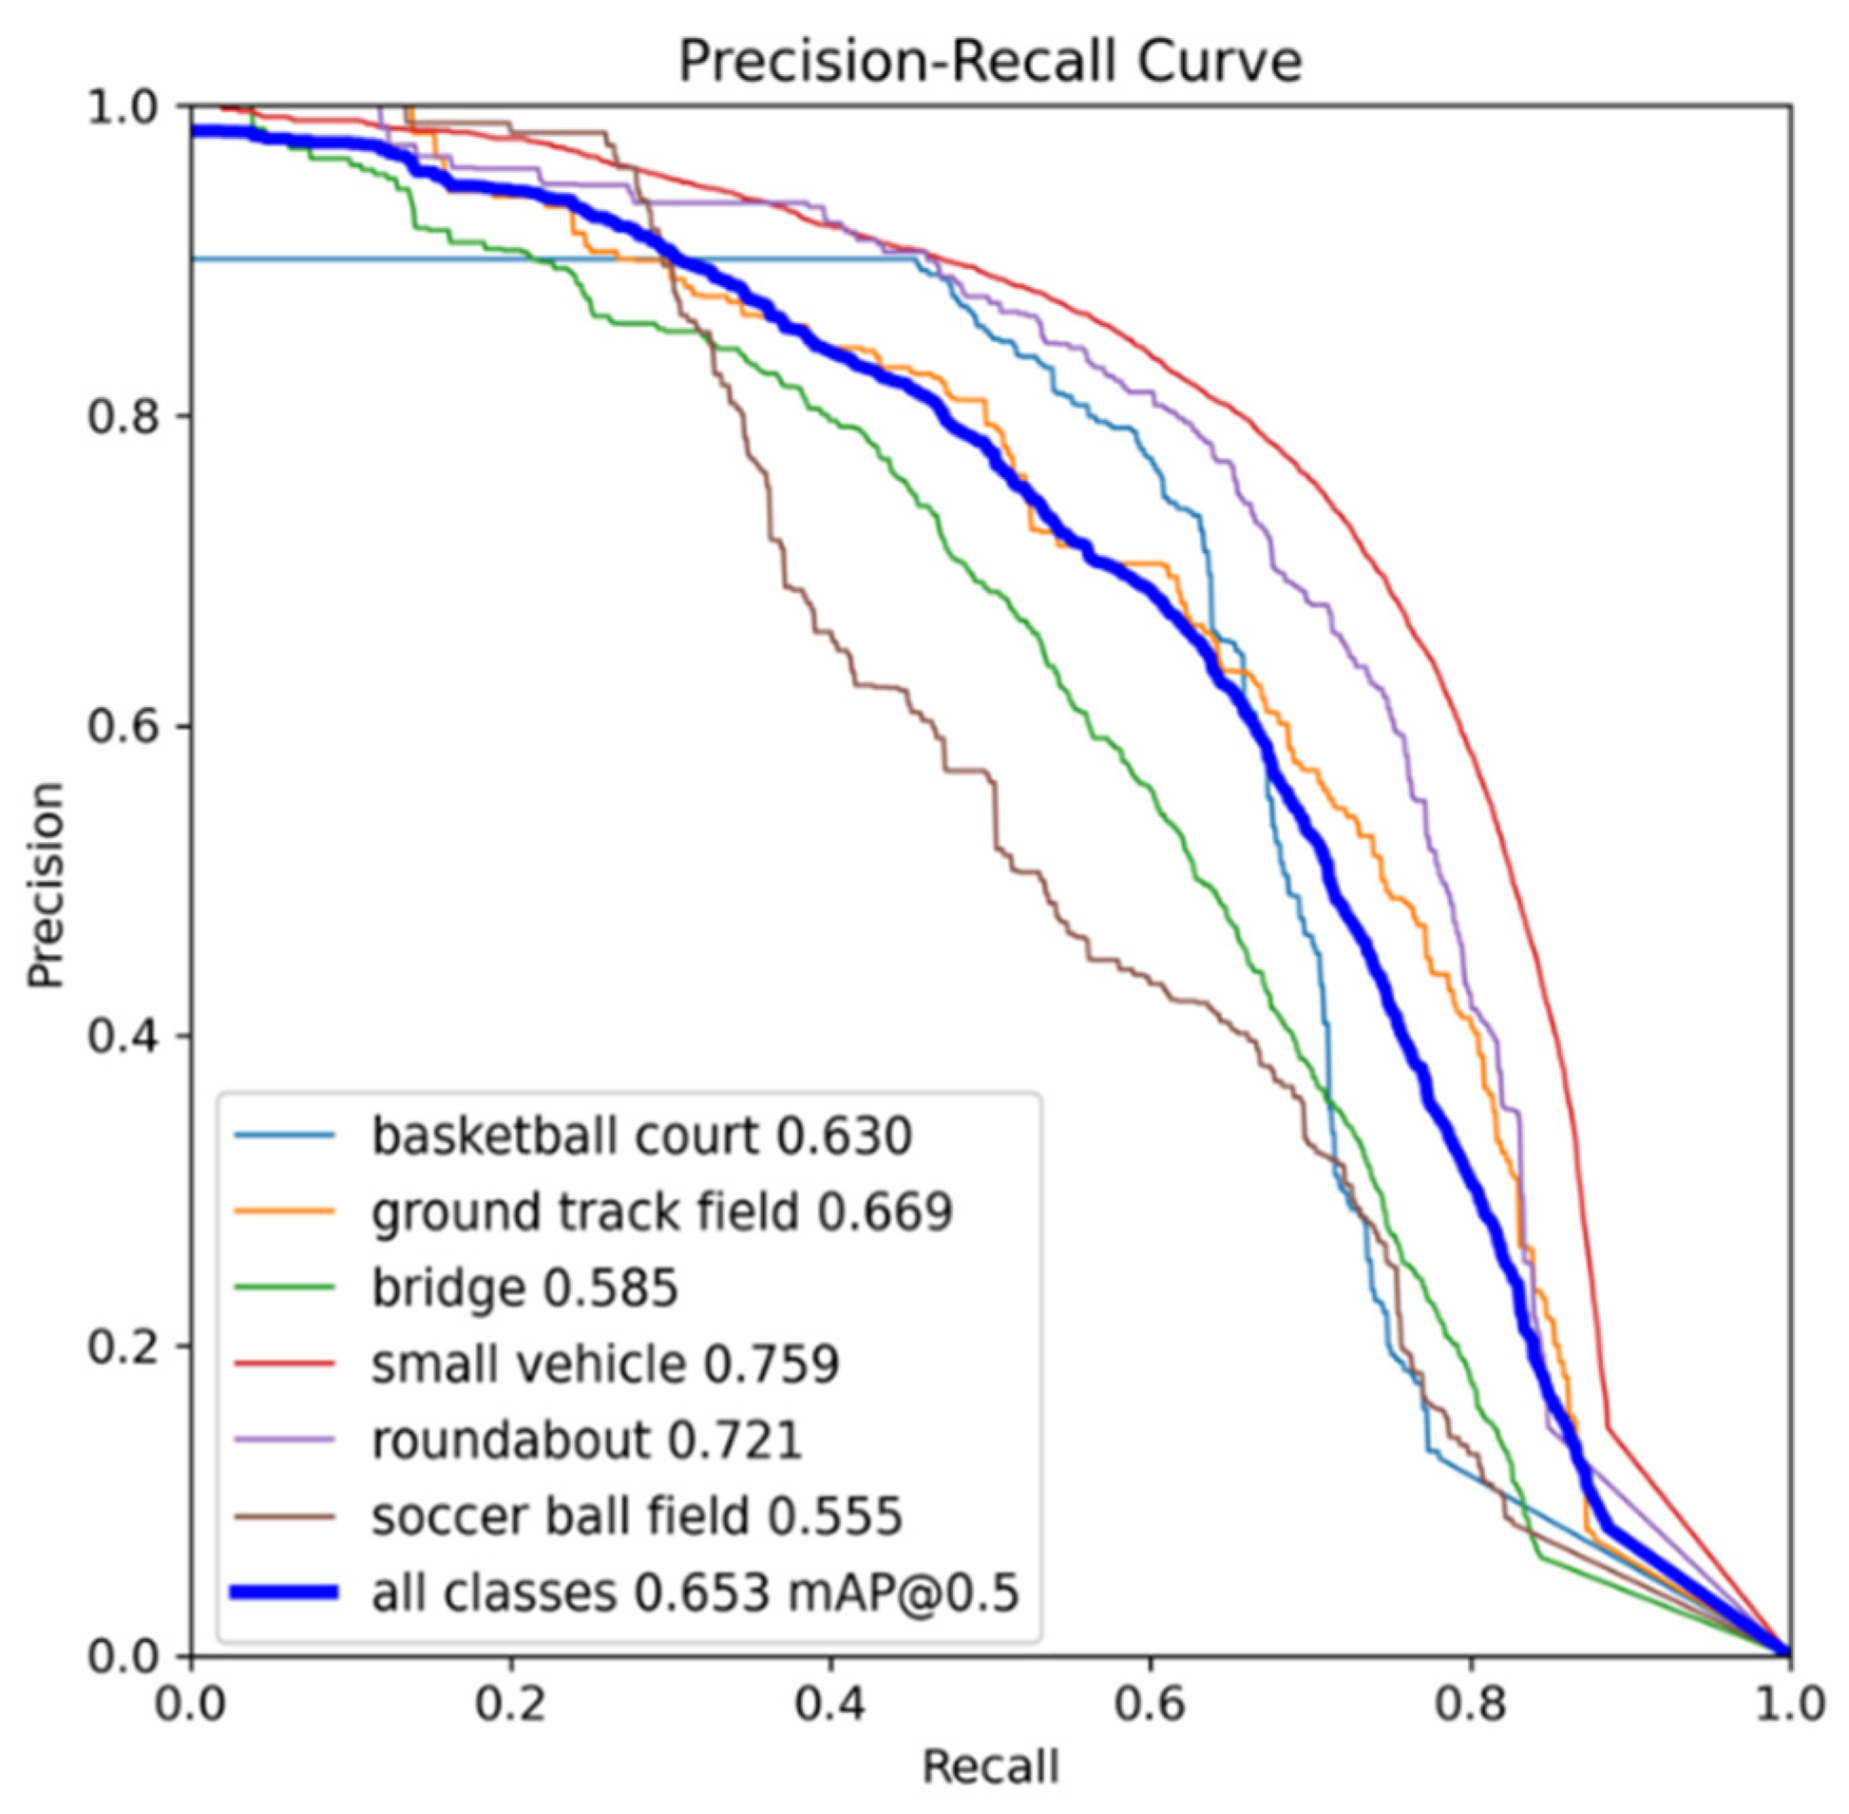
Figure 15.
Some detection results of our improved YOLOv8-obb on the DOTA dataset.
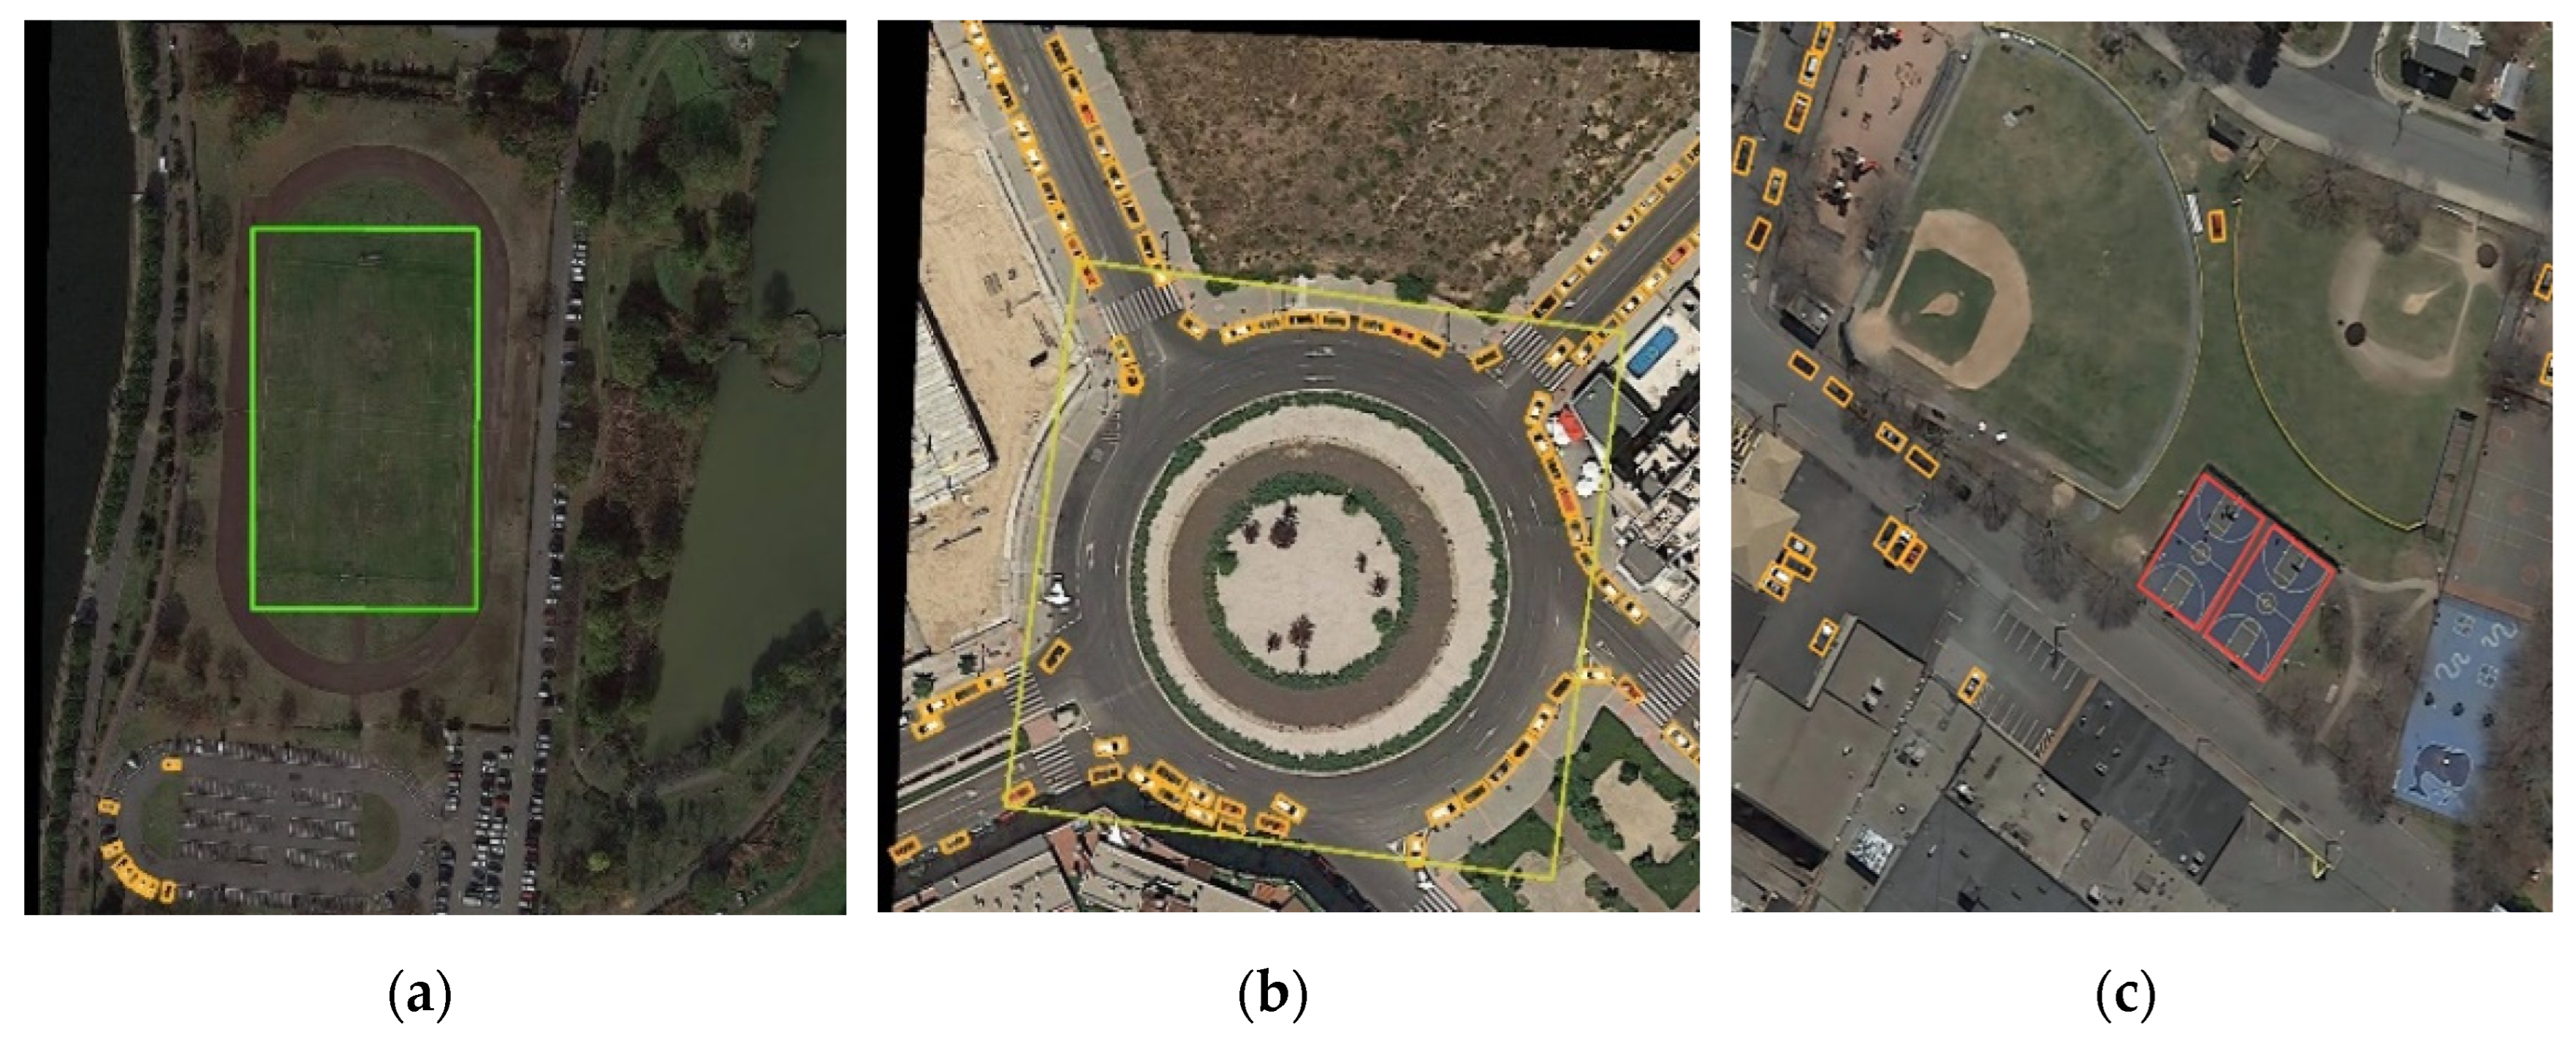
Figure 16.
Detection Results of Improved YOLOv8-obb on the DIOR Dataset.
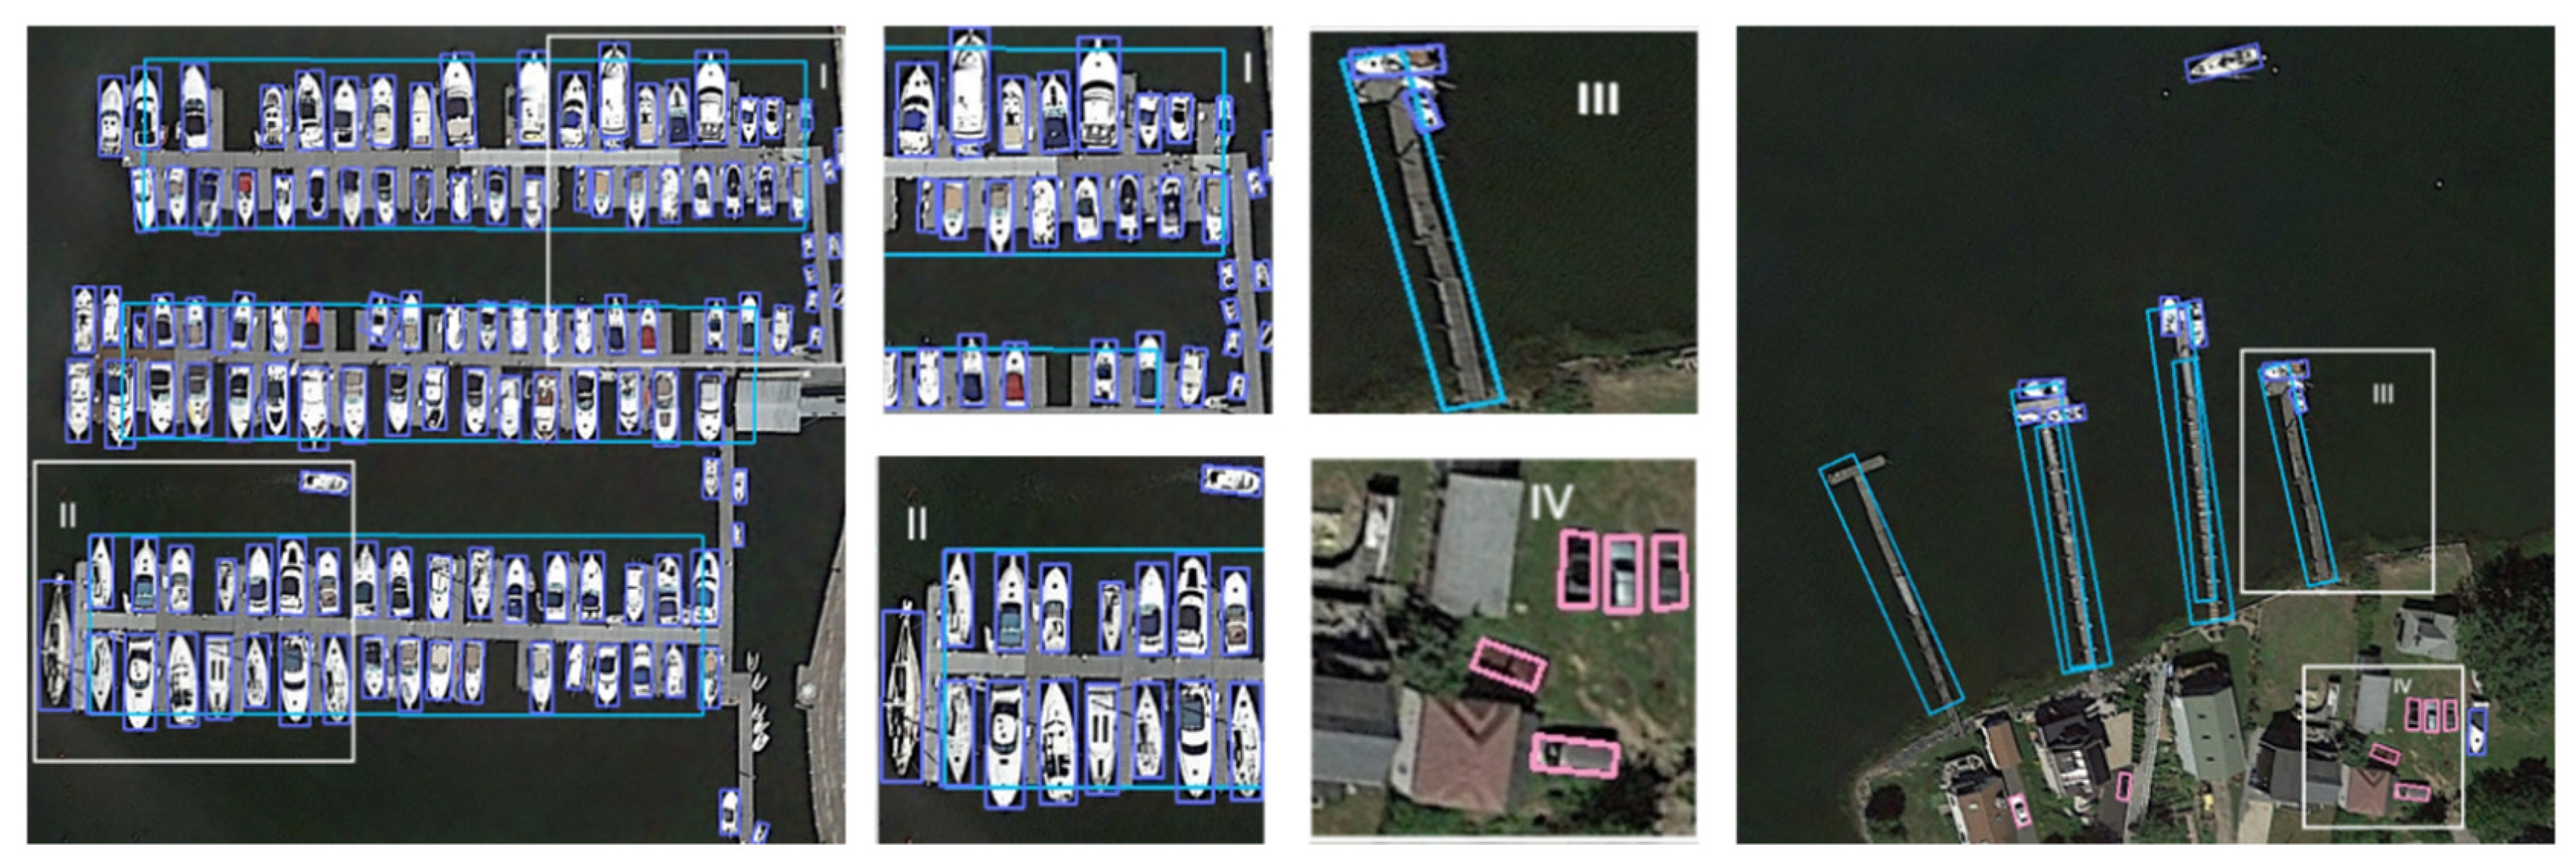
Figure 17.
Heatmap Visualization.
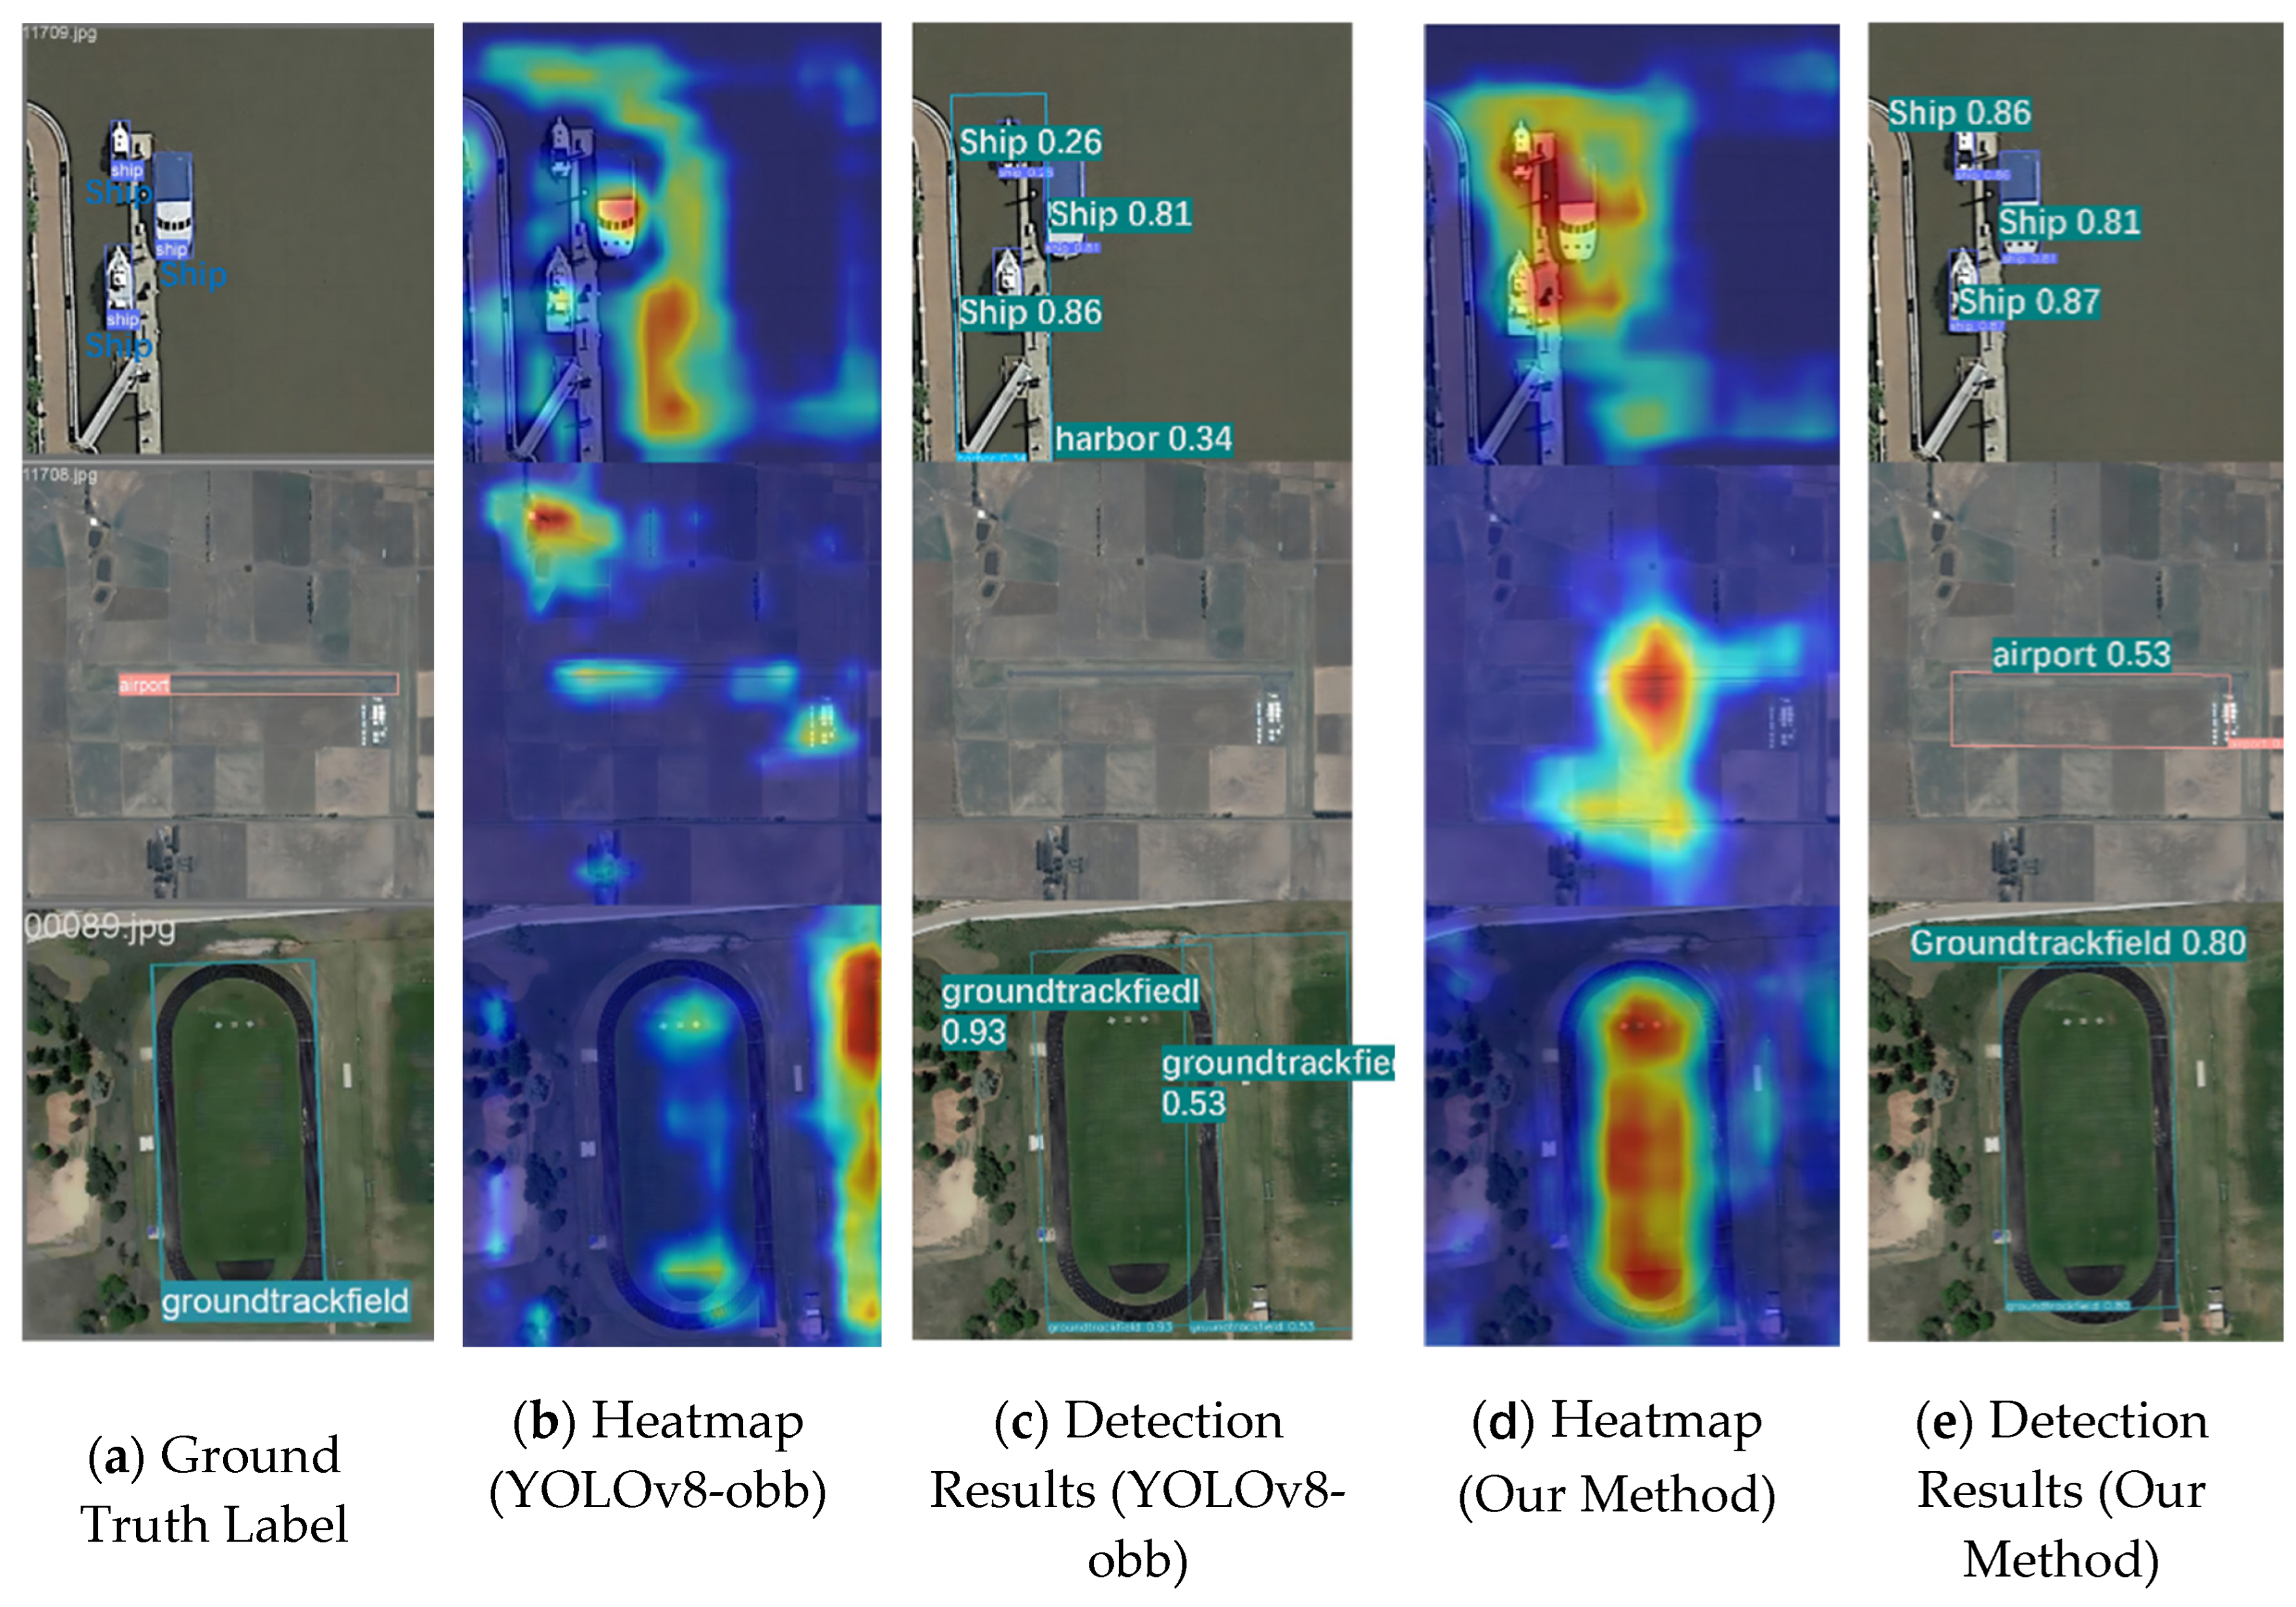

Table 1.
parameter setting of the Improved YOLOv8-obb Architecture.
| ID | From | N | Module | Argvs | Parameters |
| 0 | -1 | 1 | Conv | (3,16,3,2) | 464 |
| 1 | -1 | 1 | Conv | (16,32,3,2) | 4672 |
| 2 | -1 | 1 | RepNCSPELAN | (32,32) | 3472 |
| 3 | -1 | 1 | Conv | (32,64,3,2) | 18560 |
| 4 | -1 | 1 | RepNCSPELAN | (64,64) | 13472 |
| 5 | -1 | 1 | Conv | (64,128,3,2) | 73984 |
| 6 | -1 | 1 | RepNCSPELAN | (128,128) | 53056 |
| 7 | -1 | 1 | Conv | (128,256,3,2) | 295424 |
| 8 | -1 | 1 | RepNCSPELAN | (256,256) | 210560 |
| 9 | -1 | 1 | SPPF | (256,256,5) | 164608 |
| 10 | -1 | 1 | DySample | (256) | 8224 |
| 11 | (-1,6) | 1 | Concat | (1) | 0 |
| 12 | -1 | 1 | RepNCSPELAN | (384,128) | 69440 |
| 13 | -1 | 1 | DySample | (128) | 4128 |
| 14 | (-1,4) | 1 | Concat | (1) | 0 |
| 15 | -1 | 1 | RepNCSPELAN | (192,64) | 17568 |
| 16 | -1 | 1 | MLCA | (64) | 6 |
| 17 | -1 | 1 | Conv | (64,64,3,2) | 36992 |
| 18 | (-1,12) | 1 | Concat | (1) | 0 |
| 19 | -1 | 1 | RepNCSPELAN | (192,128) | 57152 |
| 20 | -1 | 1 | MLCA | (128) | 10 |
| 21 | -1 | 1 | Conv | (128,128,3,2) | 147712 |
| 22 | (-1,9) | 1 | Concat | (1) | 0 |
| 23 | -1 | 1 | RepNCSPELAN | (384,256) | 226944 |
| 24 | -1 | 1 | MLCA | (256) | 10 |
| 25 | (16,20,24) | 1 | OBB | (6,1,(64,128,256)) | 824149 |
Table 2.
Performance of YOLOv8-obb in DOTA dataset.
| Labels | images | instances | Precision | Recall | mAP50 | mAP50-95 |
| all | 9820 | 87257 | 0.762 | 0.753 | 0.784 | 0.611 |
| plane | 9820 | 8581 | 0.905 | 0.951 | 0.964 | 0.853 |
| ship | 9820 | 30496 | 0.908 | 0.874 | 0.913 | 0.751 |
| storage tank | 9820 | 9921 | 0.927 | 0.686 | 0.855 | 0.697 |
| baseball diamond | 9820 | 643 | 0.739 | 0.855 | 0.823 | 0.617 |
| tennis court | 9820 | 1843 | 0.932 | 0.908 | 0.94 | 0.854 |
| basketball court | 9820 | 401 | 0.637 | 0.639 | 0.667 | 0.581 |
| groundtrack field | 9820 | 360 | 0.612 | 0.767 | 0.688 | 0.575 |
| harbor | 9820 | 6046 | 0.844 | 0.824 | 0.859 | 0.581 |
| bridge | 9820 | 1408 | 0.716 | 0.523 | 0.602 | 0.361 |
| large vehicle | 9820 | 11596 | 0.873 | 0.817 | 0.875 | 0.691 |
| small vehicle | 9820 | 13495 | 0.619 | 0.703 | 0.684 | 0.516 |
| helicopter | 9820 | 268 | 0.617 | 0.825 | 0.785 | 0.588 |
| roundabout | 9820 | 541 | 0.769 | 0.63 | 0.693 | 0.516 |
| soccer ball field | 9820 | 431 | 0.555 | 0.548 | 0.587 | 0.459 |
| swimming pool | 9820 | 1227 | 0.776 | 0.74 | 0.819 | 0.522 |
Table 3.
Performance of YOLOv8-obb on Six Categories in the DOTA Datase.
| Labels | images | instances | Precision | Recall | mAP50 | mAP50-95 |
| all | 6601 | 16636 | 0.660 | 0.601 | 0.630 | 0.466 |
| basketball court | 6601 | 401 | 0.743 | 0.576 | 0.592 | 0.481 |
| ground track field | 6601 | 360 | 0.642 | 0.561 | 0.622 | 0.488 |
| bridge | 6601 | 1408 | 0.653 | 0.549 | 0.582 | 0.343 |
| small vehicle | 6601 | 13495 | 0.566 | 0.760 | 0.716 | 0.544 |
| roundabout | 6601 | 541 | 0.758 | 0.651 | 0.722 | 0.522 |
| soccer ball field | 6601 | 431 | 0.600 | 0.508 | 0.549 | 0.418 |
Table 4.
Experimental Component.
| Component | Technical Specification |
| Deep Learning Framework | Pytorch2.2.1 |
| Programming Language | Python3.10.12 |
| GPU | Tesla V100-SXM2 |
| GPU Memory | 16151MiB |
| System Memory | 80G |
Table 5.
Hyperparameters setting.
| Hyperparameter | Value |
| Epoch | 150 |
| Batch size | 16 |
| GPU | Tesla V100-SXM2 |
| Learning rate | 0.01 |
| Optimizer | SGD |
Table 6.
Results of Ablation Experiments.
| Name | Precision | Recall | mAP50(%) | mAP50-95(%) | Params (M) |
| baseline | 66 | 60.1 | 63 | 46.6 | 3.1 |
| +CBAM | 67.6 | 60.2 | 64.5 | 47.5 | 3.1 |
| +MLCA | 67.7 | 60.3 | 64.8 | 47.8 | 3.1 |
| +MLCA+DS(LP) | 67.2 | 60.1 | 63.7 | 47.1 | 3 |
| +MLCA+DS(PL) | 68.3 | 60.5 | 65.2 | 48.1 | 3 |
| +MLCA+DS(PL) + GE | 68.4 | 60.6 | 65.3 | 48.2 | 2.2 |
Table 7.
Performance of improved YOLOv8-obb in 6 categories from DOTA dataset.
| Labels | instances | Precision | Recall | mAP50 | mAP50-95 |
| all | 16636 | 0.684 | 0.606 | 0.653 | 0.482 |
| basketball court | 401 | 0.77 | 0.601 | 0.629 | 0.52 |
| ground track field | 360 | 0.673 | 0.622 | 0.669 | 0.517 |
| bridge | 1408 | 0.658 | 0.528 | 0.585 | 0.347 |
| small vehicle | 13495 | 0.64 | 0.777 | 0.759 | 0.578 |
| roundabout | 541 | 0.782 | 0.634 | 0.721 | 0.511 |
Table 8.
The results of comparison experiments.
| Name | Params (M) | FLOPs(G) | mAP50(%) | Size( (MB) |
| YOLOv5n | 2.5 | 7.2 | 55.2 | 5.4 |
| YOLOv6n | 4.2 | 11.9 | 59.6 | 8.8 |
| YOLOv8n | 3 | 8.2 | 60.8 | 6.3 |
| YOLOv8n-obb | 3.1 | 8.5 | 63 | 6.5 |
| Our YOLOv8n-obb | 2.2 | 6.2 | 65.3 | 4.9 |
Table 9.
Comparison of Performance Between YOLOv8-obb and Improved YOLOv8-obb on the DIOR Dataset.
| Labels | Instances | mAP50 | |
| Baseline | Ours | ||
| all | 19832 | 0.817 | 0.832 |
| airplane | 624 | 0.953 | 0.955 |
| airport | 205 | 0.664 | 0.615 |
| baseballfield | 670 | 0.95 | 0.982 |
| basketballcourt | 338 | 0.889 | 0.859 |
| bridge | 413 | 0.648 | 0.594 |
| chimney | 192 | 0.933 | 0.933 |
| dam | 145 | 0.445 | 0.574 |
| Expressway-service-area | 304 | 0.77 | 0.934 |
| Expressway-toll-station | 189 | 0.774 | 0.819 |
| golffield | 143 | 0.83 | 0.851 |
| groundtrackfield | 342 | 0.84 | 0.897 |
| harbor | 612 | 0.682 | 0.666 |
| overpass | 367 | 0.727 | 0.764 |
| ship | 7586 | 0.969 | 0.974 |
| stadium | 192 | 0.949 | 0.963 |
| storagetank | 894 | 0.883 | 0.84 |
| tenniscourt | 1570 | 0.964 | 0.971 |
| trainstation | 141 | 0.719 | 0.75 |
| vehicle | 4148 | 0.855 | 0.782 |
| windmill | 757 | 0.903 | 0.916 |
Disclaimer/Publisher’s Note: The statements, opinions and data contained in all publications are solely those of the individual author(s) and contributor(s) and not of MDPI and/or the editor(s). MDPI and/or the editor(s) disclaim responsibility for any injury to people or property resulting from any ideas, methods, instructions or products referred to in the content. |
© 2025 by the authors. Licensee MDPI, Basel, Switzerland. This article is an open access article distributed under the terms and conditions of the Creative Commons Attribution (CC BY) license (http://creativecommons.org/licenses/by/4.0/).
Copyright: This open access article is published under a Creative Commons CC BY 4.0 license, which permit the free download, distribution, and reuse, provided that the author and preprint are cited in any reuse.


