
Submitted:
27 June 2024
Posted:
27 June 2024
You are already at the latest version
Abstract
YOLOv8, as an efficient object detection method, can swiftly and precisely identify objects within images. However, traditional algorithms encounter difficulties when detecting small targets in remote sensing images, such as missing information, background noise, and interactions among multiple objects in complex scenes, which may affect performance. To tackle these challenges, we propose an enhanced algorithm
optimized for detecting small objects in remote sensing images, named HP-YOLOv8. Firstly, we design the C2f-D-Mixer (C2f-DM) module as a replacement for the original C2f module. This module integrates both local and global information, significantly improving the ability to detect features of small objects. Secondly, we introduce a feature fusion technique based on attention mechanisms, named Bi-Level Routing Attention in Gated Feature Pyramid Network (BGFPN). This technique utilizes an efficient feature aggregation network and reparameterization technology to optimize information interaction between different scale feature maps, and through the Bi-level Routing Attention (BRA) mechanism, it effectively captures critical feature information of small target objects. Finally, we propose the Smooth Mean Perpendicular Distance Intersection over Union (SMPDIoU) loss function. The method comprehensively considers the shape and size of detection boxes, enhances the model's focus on the attributes of detection boxes and provides a more accurate bounding box regression loss calculation method. To demonstrate our approach's efficacy, we conduct comprehensive experiments across the RSOD, NWPU VHR-10, and VisDrone2019 datasets. The experimental results show that the HP-YOLOv8 achieves 95.11%, 93.05%, and 53.49% in the mAP@0.5 metric, and 72.03%, 65.37%, and 38.91% in the more stringent mAP@0.5:0.95 metric, respectively.
Keywords:
YOLOv8
; Small Object Detection
; Remote Sensing Images
; attention mechanism
; feature 21fusion
1. Introduction
In recent years, with the quantity and quality of remote sensing images have significantly improved, object detection has become crucial for the automated analysis of these images. This technology not only enables rapid and accurate object classification and tracking but also finds extensive applications in civil, commercial, and military domains, such as in drones [1,2,3,4,5], intelligent traffic monitoring [6,7,8,9,10], and aerospace [11,12,13,14]. Currently, within the domain of deep learning, object detection technologies are primarily categorized into two primary categories: region proposal-driven methods, exemplified by R-CNN and its variants, which operate by identifying potential areas of interest for detection; and regression-based strategies, such as the SSD and YOLO series, known for their fast processing speeds and suitability for real-time detection tasks.
Although object detection technologies have seen considerable progress, several challenges still persist. These challenges include complex backgrounds, low image quality, high diversity in target arrangement, and arbitrary target orientations. Especially in images with complex backgrounds, low resolution, and densely distributed targets, the detection of small targets often yields unsatisfactory results.
In response to these issues, researchers have suggested numerous enhancements. For example, scaling and merging feature maps successfully preserved small object information while enhancing feature expressiveness [15]. By combining the deep semantic information with the shallow localization information, the effectiveness of feature fusion was significantly improved [16]. Additionally, existing studies had explored the integration of attention mechanisms, feature embedding, and feature transmission techniques to optimize the feature fusion process [17,18,19]. Significant progress was achieved by applying feature pyramid networks (FPN) [20] and transformer models equipped with self-attention mechanisms [21]. Due to their accuracy and scalability [22], the YOLO algorithm suite had been extensively applied in object detection [23]. By improving the backbone network structure [24,25,26,27,28,29], it was possible to effectively extract attributes from objects with intricate shapes and appearances. The refined feature fusion method [25,30] also contributed to achieving superior detection results. Additionally, adjustments to the bounding box regression loss function [31,32,33,34] substantially enhanced the overall performance of the network. Drawing on these advanced technologies, we propose an improved algorithm named HP-YOLOv8, integrating three core technologies: the C2f-DM module, BGFPN feature fusion technique, and SMPDIoU loss function, focused on enhancing the detection precision of small objects within remote sensing images.
Our main contributions are as follows:
- We design and implement the C2f-DM module as a replacement for the current C2f module. The module efficiently integrates local and global information, significantly improving the ability to capture features of small objects while effectively mitigating detection accuracy issues caused by object overlap.
- We propose a feature fusion technique based on the attention mechanism, named BGFPN. This technique utilizes an efficient feature aggregation network and re-parameterization technology to optimize the interaction of information between feature maps of different scales. Through the BRA mechanism, it effectively captures key feature information of small objects.
- We propose a SMPDIoU loss function. This approach thoroughly accounts for the shape and dimensions of the detection boxes, strengthens the model’s focus on the attributes of detection boxes, and provides a more accurate bounding box regression loss calculation method.
2. Related Work
Within the realm of remote sensing object detection, key technologies primarily encompass feature extraction, feature fusion, and the optimization of bounding box regression loss functions. Feature extraction aims to derive key information from remote sensing images to facilitate accurate target identification to facilitating accurate target identification. Feature fusion enhances the model’s recognition and classification capabilities by integrating features from different levels. Furthermore, the bounding box regression loss function is essential for accurately predicting the position and dimensions of targets. Together, these technologies improve the precision and effectiveness of remote sensing object recognition algorithms.
2.1. Feature Extraction
The architecture of backbone networks is designed to efficiently capture and combine information from multiple scales. For instance, YOLOv2 [35] significantly improved its feature extraction capabilities by substituting its original network with DarkNet-19, which enhanced both detection precision and speed. YOLOv3 [36] implemented a multi-scale prediction approach similar to FPN and introduced a more robust backbone network, DarkNet-53, further boosting the efficiency and accuracy of feature extraction. YOLOv5 integrated Focus and CSP modules into its backbone network, enhancing detection speed and precision through advanced training optimization strategies. LSKNet [37], a lightweight large selective kernel network, dynamically adjusted the spatial receptive field to better accommodate diverse objects in remote sensing images. YOLOv8 replaced the earlier C3 module with the C2f module, maintaining the network’s lightweight structure while facilitating a richer flow of gradient information. Specifically targeting micro unmanned aerial vehicle detection, YOLO-Drone [24] incorporated the SPD-Conv module. In the identification of small objects within remote sensing imagery, LAR-YOLOv8 [25] replaced the C2f modules in the YOLOv8 backbone with DCN-C2f modules. In further research based on the YOLOv8 model, we introduce the C2f-DM module to replace the C2f module before the detection head, significantly enhancing the capability to capture features of small objects and effectively mitigating issues of detection accuracy caused by object overlaps.
2.2. Feature Fusion
FPN effectively integrates features of different resolutions from the backbone network, achieving multi-scale feature fusion and significantly enhancing network performance and robustness. Given the complex backgrounds and noise inherent in remote sensing images, implementing an attention mechanism can more effectively isolate critical features of small target objects. By dynamically learning the distribution or weights of attention, this mechanism enabled the model to adaptively concentrate on essential information as dictated by the context and task requirements, thus greatly enhancing the precision of object detection.
Methods for feature fusion and attention mechanisms have progressed from focusing solely on either spatial or channel attention to incorporating a mix of both channel and spatial attentions, along with the adoption of self-attention mechanisms. For example, TPH-YOLOv5 [38] incorporated the CBAM, successfully pinpointing attention regions in densely populated scenes. Similarly, YOLO-Drone [24] improved drone detection performance by integrating the GAM into the neck section. Moreover, the SuperYOLO [39] fused multimodal data and super-resolution technology, enhancing the ability to detect small objects. LAR-YOLOv8 [25] designed a bi-directional feature pyramid network that effectively extracted shallow features using the attention mechanism and optimized feature fusion. In this paper, we introduce a feature fusion method named BGFPN that utilizes attention mechanisms. This approach leverages an efficient feature aggregation network and reparametrization techniques to enhance the exchange of information across feature maps of varying scales. Additionally, it adeptly captures essential feature information of small target objects using the BRA mechanism.
2.3. Optimization of Bounding Box Regression Loss Function
In tasks related to object detection, the loss function for bounding box regression is crucial. Previously, a widely utilized method was the Intersection over Union (IoU) [40], which evaluates overlap by measuring the ratio of the shared area to the combined area of the predicted and true boxes. However, IoU exhibited clear limitations when addressing small objects, particularly when the predicted and true boxes had no intersection, yielding an IoU value of zero, which could lead to gradient vanishing and hinder the model from effectively learning the features of small objects. To address these issues, researchers proposed several improvements, such as GIoU [41], DIoU [42], and CIoU. GIoU introduced the concept of the smallest enclosing box to compute a non-zero loss value, solving the gradient vanishing issue When no overlap existed between the predicted and further boxes. DIoU and CIoU actual considered the differences in aspect ratio and center distance to enhance regression precision. Additionally, Cascade R-CNN [31] consisted of a series of detectors that used progressively increasing IoU thresholds during training to more stringently exclude neighboring false positives. CenterNet [32] adopted a corner-based keypoint detection approach, thereby circumventing the traditional requirement for anchor boxes. While these methods made progress in handling small objects and bounding boxes with extreme aspect ratios, they primarily focused on the geometric relationships between bounding boxes and overlooked the potential impact of the bounding boxes’ shapes and scales on regression effectiveness. To enhance small object detection further, we introduce a novel approach: SMPDIoU. This method combines the advantages of SioU [43] and MPDIoU [44], comprehensively considering the shape and proportion of bounding boxes, effectively compensating for the shortcomings of IoU and its derivative methods.
3. Fundamentals of the YOLO v8 Model
Since the YOLO model was first introduced, the series has undergone multiple updates and iterations, with continually enhanced performance. As the most recent development in the YOLO model series, the YOLOv8 represents the current pinnacle of technology. Its architecture, depicted in Figure 1, comprises three main components: the Backbone, the Detection Head, and the Neck.
Backbone: This section mainly conducts feature extraction using a sequence of C2f modules, Conv modules, and SPPF modules. YOLOv8 introduces a new C2f module to replace the previous C3 module, which, while maintaining a lightweight structure, promotes richer gradient information flow.
Detection Head: YOLOv8 has added a Decoupled Head module, an innovative design that separates classification and localization tasks, effectively mitigating potential conflicts between these two tasks and thereby enhancing the overall efficacy of the model.
Neck: YOLOv8 follows the PA-FPN design philosophy but simplifies the convolution process in the upsampling stage to enhance performance.
Overall, YOLOv8 not only inherits the efficiency of the YOLO series but also innovates in model structure and algorithm, making it perform exceptionally well in handling complex detection tasks.
4. Methodology
4.1. Framework Overview
YOLOv8 demonstrates outstanding performance across multiple application domains. However, in remote sensing object detection, challenges persist in accurately detecting small objects. These challenges manifest primarily in two aspects: First, when neural networks extract features from images, features of small objects may be obscured by larger surrounding objects, causing a loss of critical information. This can result in small objects being overlooked during the learning phase, thus impacting the precision of detection. Second, in complex scenes with multiple object interactions, Small objects are more susceptible to false positives and omissions. Compared to larger objects, they are more likely to be obscured or overlap with other objects, making visual distinction and localization more difficult. To tackle these challenges, we introduce HP-YOLOv8, an improved version of the YOLOv8 algorithm specifically designed for detecting small objects in remote sensing. (as depicted in Figure 2).
Firstly, we design a continuously stacking and fusing module named C2f-DM (detailed in Section 4.2). The C2f-DM module, by integrating local and global information, enhances the capability to capture features of small objects and effectively alleviates the detection accuracy problems caused by object overlaps. Secondly, we introduce an attention-based feature fusion technique, named BGFPN (detailed in Section 4.3). This technique utilizes an efficient feature aggregation network and reparameterization technology to optimize the interaction of information between feature maps at various scales. Additionally, by introducing the BRA mechanism, BGFPN can more effectively capture critical feature information of small target objects. Lastly, we introduce a novel IoU loss function calculation method named SMPDIoU (detailed in Section 4.4). This method comprehensively considers the shape and size of detection boxes, thereby strengthening the model’s focus on the attributes of detection boxes. It not only adjusts the shape and position of bounding boxes more accurately but also adapts the regression strategy according to the varying sizes of objects. Moreover, SMPDIoU, by considering the perpendicular distance between two target boxes, provides a more precise bounding box regression loss calculation method.
4.2. C2f-DM Module
The YOLOv8 backbone network mainly consists of stacks of simple convolutional modules. This design can cause small object features to be overshadowed by those of larger surrounding objects during image extraction, leading to the loss of crucial information. To improve the network’s capability to process small objects, we have introduced a novel module called C2f-DM which replaces the existing C2f module before the detection head.
As illustrated in Figure 3, the C2f-DM module embeds the Dual Dynamic Token Mixer (D-Mixer) [45] into the bottleneck structure. This configuration merges the benefits of both convolution and self-attention mechanisms while introducing a robust inductive bias for handling uniformly segmented feature segments. It achieves dynamic integration of local and global information, considerably extending the network’s effective field of view. The module processes the input feature map in two segments: one via Input-dependent Depth-wise Convolution (IDConv) and the other through Overlapping Spatial Reduction Attention (OSRA). Subsequently, the outputs of these two parts are merged.
Specifically, consider a feature map X of dimensions . This map is initially split into two sub-maps, , along the channel dimension, each with dimensions . Subsequently, is processed by the OSRA, while is handled by IDConv, resulting in new feature maps of the same dimensions. These maps are subsequently combined along the channel dimension, resulting in the final output feature map with dimensions . Finally, the Compression Token Enhancer (STE) enables efficient local token aggregation. The D-Mixer performs the following sequence of operations:
In the IDConv module, the input feature map X with dimensions initially undergoes adaptive average pooling to gather spatial context and reduce spatial dimensions to . Following this, the map is passed through two consecutive convolution layers to create an attention map of dimensions , where G represents the quantity of attention groups. The map is reshaped to and a softmax function is applied across the G dimension to produce the attention weights A in . These weights A are then multiplied element-wise with a set of learnable parameters P also in , and aggregated over the G dimension to form the tailored deep convolution kernel W in . The entire process of IDConv can be expressed as:
In OSRA, a technique known as Overlapping Space Reduction (OSR) is employed to improve the spatial structure representation within the self-attention mechanism. This technique employs larger, overlapping patches to more effectively capture spatial information near the boundaries of the patches, thus enhancing feature representation. The entire process of OSRA can be expressed as:
where B denotes the relative position bias matrix, d represents the number of channels per attention head, and refers to the Local Refinement Module, implemented using depthwise convolution.
In STE, a depthwise convolution enhances local relationships, convolutions for channel squeezing and expansion reduce computational cost, and a residual connection maintains representational power.STE can be represented as:
This design not only retains the inductive bias advantages of convolutional networks but also enhances the model’s adaptability to input variations. Through embedding the D-Mixer, the DM-bottleneck module combines self-attention mechanisms and input-dependent deep convolutions to achieve dynamic integration of features. This allows the model to adjust its processing strategy based on different inputs, particularly suitable for detecting small objects. By merging local specifics with broader contextual data, this module successfully boosts the identification of small objects, markedly enhancing the precision and efficiency of detecting small objects.
4.3. Bi-Level Routing Attention in Gated Feature Pyramid Network
4.3.1. Improved Feature Fusion Method
FPNs achieve multi-scale feature fusion by aggregating different resolution features from the backbone network. This approach not only boosts network performance but also improves its robustness, and has been proven to be extremely crucial and effective in object detection. Nonetheless, the current YOLOv8 model only adopts the PANet structure. This approach can be easily disrupted by normal-sized targets when processing small-sized targets, potentially leading to a gradual reduction or even complete disappearance of small object information. Additionally, there are issues with the accuracy of target localization in this model. To tackle these challenges, we propose BGFPN, a new feature fusion method.
We incorporate a top-down pathway to transmit high-level semantic feature information, guiding subsequent network modules in feature fusion and generating features with enhanced discriminative capacity. Additionally, a BRA [46] mechanism has been introduced to extract information from very small target layers (as shown in Figure 4). This is a structure that uses sparse operations to efficiently bypass the most irrelevant areas, creating powerful discriminative target features.
BGFPN innovates on the basis of RepGFPN [47] through an efficient feature aggregation network and reparameterization techniques, optimizing the information interaction between different scale feature maps. This architecture improves the model’s handling of multi-scale information and efficiently merges spatial details with low-level high-level semantic information. Although a large number of upsampling and downsampling operations are introduced to enhance interactions between features, a method has been adopted to remove additional upsampling operations that cause significant latency, improving real-time detection speed.
When dealing with feature fusion issues between different scales, the model eliminates traditional 3x3 convolution modules and introduces CSPStage modules with a reparameterization mechanism. This module uses an efficient layer aggregation network connection as a feature fusion block, utilizing Concat operations to connect inputs from different layers. This allows the model to integrate shallow and deep feature maps, thereby obtaining rich semantic and positional information and high pixel points, enhancing the receptive field and improving model precision. RepConv [48], as a representative of the reparameterized convolution module, achieves branch fusion during inference, which not only reduces inference time but also increases inference speed.
Furthermore, to more precisely address the detection of small targets, we have introduced dilated convolution technology [49]. This technology enhances feature extraction capabilities by expanding the convolution kernel’s receptive field without adding extra computational burden. This approach bypasses pooling operations, thus maintaining the high resolution of the feature maps. This is critical to precise localization and identification of small objects within images, greatly enhancing the model’s detection precision in intricate scenes, particularly those with visual noise.
4.3.2. Bi-Level Routing Attention
In remote sensing images, complex backgrounds and severe noise often obscure small target objects. Incorporating an attention mechanism into the network greatly enhances the capture of essential feature information, thus enhancing object detection precision. However, traditional attention mechanisms impose a considerable computational load when dealing with extremely small target layers, especially at high resolutions. To mitigate this, we have integrated a BRA mechanism tailored for vision transformers into the Neck structure of YOLOv8. As shown in Figure 5, this mechanism first filters out irrelevant large-area features at a coarser region level, then focuses at a finer token level, and dynamically selects the most pertinent key-value pairs for each query. This strategy not only saves computational and memory resources but also greatly improves the precision of detecting small objects.
Initially, we divide a two-dimensional input feature map into non-overlapping regions, with each containing feature vectors. This reshapes X into . Linear projections then generate the queries, keys, and values tensors . We proceed to construct a directed graph that maps the attention relations between these regions. We average the regions within Q and K to create region-level queries and keys . The adjacency matrix for the region-to-region affinity graph is subsequently computed by multiplying the transpose of with .
From here, we identify the top-k regions highest similarity for each region in the adjacency matrix through row-wise operations. These indices are then annotated in the region-to-region routing index matrix, where top-k indicates the number of regions of interest within BGFPN.
Utilizing the inter-region routing index matrix , we then implement fine-grained token-to-token attention. Initially, we gather the key and value tensors, denoted as and . Following the integration of Local Context Enhancement (LCE), attention is directed towards these gathered key-value pairs to generate the output:
Depicted in Figure 2, in the BGFPN structure, we incorporate the BRA mechanism after each C2F module during the upsampling process, before downsampling, and before feature fusion. By adding the BRA module before the upsampling step, the features can be focused on earlier, allowing for more precise handling of small object information, significantly enhancing the object’s recognition and localization performance. Moreover, by introducing the BRA module after each C2F module during the downsampling process, it ensures that even after feature simplification, the model can still sensitively capture details, strengthening the recognition of key information. Especially by introducing the BRA module before feature fusion, this can screen key areas at the macro level and conduct in-depth detail attention at the token level, ensuring the network prioritizes key information in the image before integrating features, further improving the detection precision of small objects. This integrated attention mechanism effectively isolates crucial information in intricate settings while amplifying focus on fundamental features, thereby markedly boosting the precision of detecting small objects.
4.4. Smooth Mean Perpendicular Distance Intersection over Union
The bounding box regression loss function is crucial in object detection tasks. Researchers are consistently proposing various improved methods, such as GIoU [41], DIoU [42], and CIoU. While these approaches have enhanced the handling of small objects and bounding boxes with extreme aspect ratios, they still mainly emphasize the geometric relationship between bounding boxes, overlooking the influence of the bounding box’s own shape and scale on regression results.
To enhance small object detection, we introduce a new method called SMPDIoU. This method combines the advantages of SioU [43] and MPDIoU [44], comprehensively considering the shape and scale of the bounding boxes, thus addressing the deficiencies of IoU and its improved versions.Furthermore, SMPDIoU incorporates a detailed regression loss calculation method centered on the vertical distance between two bounding boxes. This approach not only markedly enhances the precision of detecting large objects but also excels in detecting small objects, efficiently addressing prevalent issues in small object detection. The specific calculation formula is provided below:
where, is a weight parameter, used to balance the influences of SIOU and MPDIoU, which can be adjusted according to specific application scenarios. In this model, distance loss () and shape loss () play a key role. By measuring the spatial distance and shape discrepancies between the actual and lpredicted boxes, SMPDIoU effectively reduces the angular differences between the anchor and true boxes in the horizontal or vertical directions, thus accelerating the convergence process of bounding box regression. The distance loss () is defined by the following equation:
where , and is the standardized distance between the centers of the true and predicted bounding boxes, calculated as follows:
As shown in Figure 6, and are the center coordinates of the predicted bounding box, while and are the center coordinates of the true bounding box. Additionally, , , , and denote the respective heights and widths of the predicted and actual bounding boxes. The coefficient related to the angle is calculated by the following equation:
where denotes the Euclidean distance from the center of the predicted bounding box to the center of the true bounding box, calculated as follows:
where represents the discrepancy in the y-axis distances between the minimum and maximum extents of the true and predicted, expresed as:
The equation for shape loss () is given below:
where and represents the proportional variances in height and width across the bounding boxes, calculated in the following manner:
In order to enhance the precision of assessing the spatial alignment between true and predicted bounding boxes, the model integrates the computation of the vertical distance separating their centers.
where is the normalized vertical distance, which varies between 0 and 1. This normalized distance is derived from the Euclidean distance between the true and predicted bounding box centers, relative to the maximum distance that serves as the normalization reference:
5. Experiments
5.1. Experimental Setup
Experimental Environment. All experiments described in this paper are conducted using a defined system setup to ensure effective implementation and reproducibility of outcomes. For detailed specifics, refer to Table 1.
Hyperparameter Settings. During our experimental procedures, throughout the training phase, we apply a learning rate decay method. We perform the training over 200 epochs to maintain stability, during which the learning rate progressively reduces. Additionally, other configurations adhere to the default settings of the original YOLOv8. The specifics of the training hyperparameters can be found in Table 2.

Table 1.
Experimental Environment Configuration Table.
| Configuration Item | Name | Specification |
|---|---|---|
| Hardware environment | GPU | NVIDIA GeForce RTX 3080 |
| CPU | Intel Core i7-11700K | |
| VRAM | 12G | |
| RAM | 64G | |
| Software environment | Operating System | Ubuntu 18.04 |
| Python | 3.8.12 | |
| Pytorch | 1.10.0 | |
| CUDA | 10.4 | |
| cuDNN | 7.6.5 |
Table 2.
Model Training Hyperparameter Settings.
| Hyperparameter Options | Setting |
|---|---|
| Epochs | 200 |
| Initial Learning Rate 0 | 0.01 |
| Learning Rate Float | 0.01 |
| Input Resolution | 640x640x3 |
| Weight_decay | 0.0005 |
| Momentum | 0.937 |
| Batch_size | 4 |
Datasets. In our experiments, we employed three publicly available datasets: RSOD [50], NWPU VHR-10 [51], and VisDrone2019 [52]. These datasets were randomly split into training, validation, and test sets in a 6:2:2 ratio.
The RSOD dataset includes four annotated object categories: airplanes, oil tanks, overpasses, and playgrounds, totaling 976 images. The NWPU VHR-10 dataset originates from Google Earth and focuses on remote sensing applications, containing about 800 images with a resolution of 1000×1000 pixels, covering ten different categories. VisDrone2019 is an aerial drone dataset jointly developed by Tianjin University and the AISKYEYE data mining team, consisting of 288 video clips and 10,209 static images, totaling 261,908 frames. These data were captured by various drones under different angles, scenes, and tasks, including ten distinct categories such as cars, pedestrians, and bicycles.
Evaluation Metrics. For assessing the proposed HP-YOLOv8 model, we utilize three commonly employed metrics in object detection: Recall, Precision, and Mean Average Precision (mAP). The formulas are as follows:
where N denotes the total number of classes. The mAP metric assesses the mean AP across all classes. mAP@0.5 represents the average precision at an IoU threshold of 0.5, while mAP@0.5:0.95 computes the average precision over IoU thresholds from 0.5 to 0.95, incrementally increasing by 0.05. This metric provides a more comprehensive performance evaluation, covering a spectrum from looser to stricter matching criteria.
5.2. Overall Performance of HP-YOLOv8
Classification Evaluation. We extensively experimented with the RSOD dataset to evaluate how the performance of the traditional YOLOv8 model compares to our newly developed HP-YOLOv8 model in remote sensing images. As depicted in Table 3, HP-YOLOv8 outperforms YOLOv8 in all tested categories. Particularly in the Overpass category, HP-YOLOv8 increased the AP from 68.87 to 87.46, an improvement of 18.59 percentage points, demonstrating its high efficiency in handling small and structurally complex objects. Additionally, HP-YOLOv8 raised the AP to 95.82 in the Aircraft category, to 98.25 in the Oiltank category, and to 98.93 in the Playground category, further showcasing the model’s significant advantages in detecting small-sized and hard-to-reconize objects.
Furthermore, to assess the HP-YOLOv8 model’s robustness, we performed experiments on the NWPU VHR-10 and VisDrone2019 datasets, as detailed in Table 4 and Table 5. The experimental results indicate that in the WPU VHR-10 dataset, HP-YOLOv8 significantly outperformed the traditional YOLOv8 model in the detection of most object categories. Particularly in the Ground Track Field, Airplane, Basketball Court, and Vehicle categories, HP-YOLOv8 demonstrated significant performance improvements. For example, in the Ground Track Field category, HP-YOLOv8 increased the AP from 64.73 to 95.45, and in the Airplane category, the AP was raised from 92.54 to 99.33, nearly achieving perfect detection results. Additionally, even in generally moderate-performing categories such as Basketball Court and Vehicle, there were notable improvements, with APs rising from 85.28 to 91.84 and from 67.99 to 88.63, respectively. Although there was a slight performance decline in the Ship and Harbor categories, HP-YOLOv8 overall still demonstrated superior detection capabilities and adaptability.
Convergence Analysis. To assess how well the HP-YOLOv8 model converges on datasets, comprehensive comparisons were conducted between YOLOv8 and HP-YOLOv8 using the RSOD training and validation sets. The investigation centers on evaluating convergence trends for four critical performance metrics: recall, precision, mAP@0.5, and mAP@[0.5:0.95].
As shown in Figure 7, approximately 15 epochs after training begins, HP-YOLOv8 outperforms YOLOv8 across all metrics and stabilizes around 50 epochs. These results clearly demonstrate that HP-YOLOv8 demonstrates superior convergence performance over the traditional YOLOv8 model, providing more stable and reliable performance enhancements. Additionally, the precision-recall (PR) curves offer a direct comparison of model performance, as depicted Figure 8.
5.3. Ablation Experiment
We conducted multiple training sessions and tests using the RSOD dataset to assess how three optimization strategies—namely, the C2f-DM module, BGFPN feature fusion method, and SMPDIoU optimization loss function—affect the performance of the YOLOv8 baseline model. The experimental findings present the performance results of different combinations of modules, detailed in Table 6.
In our study, the incorporation of the C2f-DM into the backbone network led to improvements in the model’s mAP@0.5 from its initial 89.82% to 91.52%, and the mAP@0.5:0.95 also rose from 57.01% to 64.23%. This enhancement validates the efficacy of the C2f-DM module in combining global and local information to enhance the detection of small objects. Substituting the original PANet with BGFPN raised the mAP@0.5 to 92.56% and mAP@0.5:0.95 to 67.78%, while reducing the model’s parameter count by 43.31%. This change demonstrates that BGFPN, with its efficient hierarchical aggregation of network connections, not only significantly boosted mAP performance but also effectively reduced the model’s parameter size. Introducing the SMPDIoU optimization loss function increased the mAP@0.5 to 91.45% and mAP@0.5:0.95 to 64.12%. When combining the C2f-DM module and BGFPN, performance further improved, with mAP@0.5 rising to 93.98% and mAP@0.5:0.95 to 69.78%. By employing all three techniques together, the model achieved its highest performance, with mAP@0.5 reaching 95.11% and mAP@0.5:0.95 reaching 72.03%. These findings demonstrate that HP-YOLOv8 effectively enhances the original YOLOv8 performance. HP-YOLOv8, in contrast to the original YOLOv8, is lighter and more suitable for deployment on hardware-constrained devices.
5.4. Comparison with Other Models
To illustrate the strengths of our proposed HP-YOLOv8 model, we execute comparative experiments utilizing the RSOD dataset, comparing its performance with that of YOLOv8, traditional detection algorithms (such as Dynamic R-CNN [53], CenterNet [32], Fast R-CNN [54], Cascade R-CNN [31]), and algorithms specifically designed for remote sensing object detection (like LSKNet [37], SuperYOLO [39], TPH-YOLO [38], LAR-YOLOv8 [25]). All models are trained and tested under the same conditions, and the comparative outcomes are displayed in Table 7, the evaluation criteria encompass metrics such as mAP@0.5, mAP@0.5:0.95, parameter count, and FPS. Although the FPS of HP-YOLOv8 is slightly lower than that of the TPH-YOLO and YOLOv8, it outperforms other algorithms in this regard. HP-YOLOv8’s parameter count stands at 27.52M, which is lower than many models with higher mAPs, such as Cascade R-CNN and SuperYOLO, demonstrating that our model achieves high-precision detection at a lower computational cost. Importantly, HP-YOLOv8 demonstrates notable advantages in mAP@0.5 and mAP@0.5:0.95, as well as in parameter efficiency. Specifically, in mAP@0.5:0.95, HP-YOLOv8 records a significant increase of 17.58% compared to the least effective model, Faster R-CNN, conclusively establishing our model’s superior performance and practical value.
5.5. Experimental Results Presentation
Ultimately, to visually highlight HP-YOLOv8’s improved detection capabilities, we display the detection outcomes of YOLOv8 and HP-YOLOv8 on the RSOD, NWPU VHR-10, and VisDrone2019 datasets. Reviewing Figure 9, we observe the following points: First, the comparison between Figure a(1) and Figure A(1) reveals that due to the significant resemblance between the object and the background, the YOLOv8 model fails to detect the aircraft. However, the HP-YOLOv8 model demonstrates its enhanced detection capabilities by not only successfully identifying the object but also clearly distinguishing the background from the foreground, showcasing HP-YOLOv8’s significant advantage in handling background noise. Second, the contrast between Figure c(2) and Figure C(2) reveals that due to partial occlusion of some objects, YOLOv8 exhibits certain missed and false detections. However, HP-YOLOv8 effectively resolves this issue, accurately identifying primary objects and detecting small objects partially obscured by crowds, vehicles, and trees, especially in cases of significant overlap between objects. These experimental results convincingly prove the significant effectiveness of our proposed HP-YOLOv8 model in enhancing the precision of remote sensing object extraction.
6. Conclusions
This paper presents a small-size object detection algorithm for remote sensing images, which builds on the existing YOLOv8 framework by incorporating the newly proposed C2f-DM module, BGFPN feature fusion technology, and SMPDIoU loss function. Through these innovations, we have developed HP-YOLOv8 and addressed issues present in YOLOv8 and other current small-size object detection algorithms. Additionally, we conducted extensive testing and comparisons on the RSOD, NWPU VHR-10, and VisDrone2019 datasets. Analysis and experimental validation confirm the effectiveness of each optimized component. HP-YOLOv8 outperforms other detectors in both precison and processing speed, particularly in capturing small objects across various complex scenarios, significantly enhancing the model’s mean mAP Moving forward, we plan to continue our in-depth research on target detection technologies, striving to surpass existing detectors in precision across all object sizes.
Author Contributions
Conceptualization, Guangzhen Yao and And Qi; Data curation, Guangzhen Yao; Formal analysis, Sandong Zhu and Long Zhang; Funding acquisition, And Qi; Investigation, Sandong Zhu and Long Zhang; Methodology, Guangzhen Yao, Sandong Zhu and Long Zhang; Project administration, Guangzhen Yao and And Qi; Resources, And Qi; Software, Guangzhen Yao, Sandong Zhu, Long Zhang and And Qi; Supervision, And Qi; Validation, Guangzhen Yao, Sandong Zhu and Long Zhang; Visualization, Guangzhen Yao, Sandong Zhu and Long Zhang; Writing – original draft, Guangzhen Yao; Writing – review & editing, Guangzhen Yao, Sandong Zhu, Long Zhang and And Qi.
Funding
This work was supported by the Natural Science Basic Research Project of Shaanxi Jilin Province Department of Science and Technology (No.20230201079GX).
Conflicts of Interest
The authors declare no conflict of interest.
References
- Zhang, Z. Drone-YOLO: an efficient neural network method for target detection in drone images. Drones 2023, 7, 526. [Google Scholar] [CrossRef]
- Zhao, D.; Shao, F.; Liu, Q.; Yang, L.; Zhang, H.; Zhang, Z. A Small Object Detection Method for Drone-Captured Images Based on Improved YOLOv7. Remote Sensing 2024, 16, 1002. [Google Scholar] [CrossRef]
- Zhang, J.; Yang, X.; He, W.; Ren, J.; Zhang, Q.; Zhao, Y.; Bai, R.; He, X.; Liu, J. Scale Optimization Using Evolutionary Reinforcement Learning for Object Detection on Drone Imagery. In Proceedings of the AAAI Conference on Artificial Intelligence; 2024; Volume 38, pp. 410–418. [Google Scholar]
- Rostami, M.; Farajollahi, A.; Parvin, H. Deep learning-based face detection and recognition on drones. Journal of Ambient Intelligence and Humanized Computing 2024, 15, 373–387. [Google Scholar] [CrossRef]
- Zeng, S.; Yang, W.; Jiao, Y.; Geng, L.; Chen, X. SCA-YOLO: A new small object detection model for UAV images. The Visual Computer 2024, 40, 1787–1803. [Google Scholar] [CrossRef]
- Lin, C.J.; Jhang, J.Y. Intelligent traffic-monitoring system based on YOLO and convolutional fuzzy neural networks. IEEE Access 2022, 10, 14120–14133. [Google Scholar] [CrossRef]
- Li, A.; Sun, S.; Zhang, Z.; Feng, M.; Wu, C.; Li, W. A multi-scale traffic object detection algorithm for road scenes based on improved YOLOv5. Electronics 2023, 12, 878. [Google Scholar] [CrossRef]
- Ghahremannezhad, H.; Shi, H.; Liu, C. Object detection in traffic videos: A survey. IEEE Transactions on Intelligent Transportation Systems 2023. [Google Scholar] [CrossRef]
- Lai, H.; Chen, L.; Liu, W.; Yan, Z.; Ye, S. STC-YOLO: Small object detection network for traffic signs in complex environments. Sensors 2023, 23, 5307. [Google Scholar] [CrossRef] [PubMed]
- Zhang, L.J.; Fang, J.J.; Liu, Y.X.; Le, H.F.; Rao, Z.Q.; Zhao, J.X. CR-YOLOv8: Multiscale object detection in traffic sign images. IEEE Access 2023, 12, 219–228. [Google Scholar] [CrossRef]
- Skripachev, V.; Guida, M.; Guida, N.; Zhukov, A. Investigation of convolutional neural networks for object detection in aerospace images. International Journal of Open Information Technologies 2022, 10, 54–64. [Google Scholar]
- Shi, Q.; Li, L.; Feng, J.; Chen, W.; Yu, J. Automated Model Hardening with Reinforcement Learning for On-Orbit Object Detectors with Convolutional Neural Networks. Aerospace 2023, 10, 88. [Google Scholar] [CrossRef]
- Noroozi, M.; Shah, A. Towards optimal foreign object debris detection in an airport environment. Expert Systems with Applications 2023, 213, 118829. [Google Scholar] [CrossRef]
- Ma, Y.; Zhou, D.; He, Y.; Zhao, L.; Cheng, P.; Li, H.; Chen, K. Aircraft-LBDet: Multi-Task Aircraft Detection with Landmark and Bounding Box Detection. Remote Sensing 2023, 15, 2485. [Google Scholar] [CrossRef]
- Chen, H.B.; Jiang, S.; He, G.; Zhang, B.; Yu, H. TEANS: a target enhancement and attenuated nonmaximum suppression object detector for remote sensing images. IEEE Geoscience and Remote Sensing Letters 2020, 18, 632–636. [Google Scholar] [CrossRef]
- Hou, L.; Lu, K.; Xue, J.; Hao, L. Cascade detector with feature fusion for arbitrary-oriented objects in remote sensing images. In Proceedings of the 2020 IEEE International Conference on Multimedia and Expo (ICME); IEEE, 2020; pp. 1–6. [Google Scholar]
- Lu, X.; Ji, J.; Xing, Z.; Miao, Q. Attention and feature fusion SSD for remote sensing object detection. IEEE Transactions on Instrumentation and Measurement 2021, 70, 1–9. [Google Scholar] [CrossRef]
- Li, Q.; Mou, L.; Liu, Q.; Wang, Y.; Zhu, X.X. HSF-Net: Multiscale deep feature embedding for ship detection in optical remote sensing imagery. IEEE transactions on geoscience and remote sensing 2018, 56, 7147–7161. [Google Scholar] [CrossRef]
- Dong, R.; Xu, D.; Zhao, J.; Jiao, L.; An, J. Sig-NMS-based faster R-CNN combining transfer learning for small target detection in VHR optical remote sensing imagery. IEEE Transactions on Geoscience and Remote Sensing 2019, 57, 8534–8545. [Google Scholar] [CrossRef]
- Zheng, Z.; Zhong, Y.; Ma, A.; Han, X.; Zhao, J.; Liu, Y.; Zhang, L. HyNet: Hyper-scale object detection network framework for multiple spatial resolution remote sensing imagery. ISPRS Journal of Photogrammetry and Remote Sensing 2020, 166, 1–14. [Google Scholar] [CrossRef]
- Xi, Y.; Jia, W.; Miao, Q.; Feng, J.; Liu, X.; Li, F. Coderainnet: Collaborative deraining network for drone-view object detection in rainy weather conditions. Remote Sensing 2023, 15, 1487. [Google Scholar] [CrossRef]
- Krizhevsky, A.; Sutskever, I.; Hinton, G.E. ImageNet classification with deep convolutional neural networks. Communications of the ACM 2017, 60, 84–90. [Google Scholar] [CrossRef]
- Shen, L.; Lang, B.; Song, Z. DS-YOLOv8-Based Object Detection Method for Remote Sensing Images. IEEE Access 2023, 11, 125122–125137. [Google Scholar] [CrossRef]
- Zhai, X.; Huang, Z.; Li, T.; Liu, H.; Wang, S. YOLO-Drone: An Optimized YOLOv8 Network for Tiny UAV Object Detection. Electronics 2023, 12, 3664. [Google Scholar] [CrossRef]
- Yi, H.; Liu, B.; Zhao, B.; Liu, E. Small Object Detection Algorithm Based on Improved YOLOv8 for Remote Sensing. IEEE Journal of Selected Topics in Applied Earth Observations and Remote Sensing 2023. [Google Scholar] [CrossRef]
- Lin, B.; Wang, J.; Wang, H.; Zhong, L.; Yang, X.; Zhang, X. Small Space Target Detection Based on a Convolutional Neural Network and Guidance Information. Aerospace 2023, 10, 426. [Google Scholar] [CrossRef]
- Sun, Y.; Zhang, Y.; Wang, H.; Guo, J.; Zheng, J.; Ning, H. SES-YOLOv8n: automatic driving object detection algorithm based on improved YOLOv8. Signal, Image and Video Processing 2024, 18, 3983–3992. [Google Scholar] [CrossRef]
- Yang, G.; Wang, J.; Nie, Z.; Yang, H.; Yu, S. A lightweight YOLOv8 tomato detection algorithm combining feature enhancement and attention. Agronomy 2023, 13, 1824. [Google Scholar] [CrossRef]
- Wang, X.; Gao, H.; Jia, Z.; Li, Z. BL-YOLOv8: An improved road defect detection model based on YOLOv8. Sensors 2023, 23, 8361. [Google Scholar] [CrossRef]
- Li, Y.; Fan, Q.; Huang, H.; Han, Z.; Gu, Q. A modified YOLOv8 detection network for UAV aerial image recognition. Drones 2023, 7, 304. [Google Scholar] [CrossRef]
- Cai, Z.; Vasconcelos, N. Cascade r-cnn: Delving into high quality object detection. In Proceedings of the IEEE conference on computer vision and pattern recognition; 2018; pp. 6154–6162. [Google Scholar]
- Law, H.; Deng, J. Cornernet: Detecting objects as paired keypoints. In Proceedings of the European conference on computer vision (ECCV); 2018; pp. 734–750. [Google Scholar]
- Safaldin, M.; Zaghden, N.; Mejdoub, M. An Improved YOLOv8 to Detect Moving Objects. IEEE Access 2024. [Google Scholar] [CrossRef]
- Wu, T.; Dong, Y. YOLO-SE: Improved YOLOv8 for remote sensing object detection and recognition. Applied Sciences 2023, 13, 12977. [Google Scholar] [CrossRef]
- Redmon, J.; Farhadi, A. YOLO9000: better, faster, stronger. In Proceedings of the IEEE conference on computer vision and pattern recognition; 2017; pp. 7263–7271. [Google Scholar]
- Redmon, J.; Farhadi, A. Yolov3: An incremental improvement. arXiv 2018, arXiv:1804.02767. [Google Scholar]
- Li, Y.; Li, X.; Dai, Y.; Hou, Q.; Liu, L.; Liu, Y.; Cheng, M.M.; Yang, J. LSKNet: A Foundation Lightweight Backbone for Remote Sensing. arXiv 2024, arXiv:2403.11735. [Google Scholar]
- Zhu, X.; Lyu, S.; Wang, X.; Zhao, Q. TPH-YOLOv5: Improved YOLOv5 based on transformer prediction head for object detection on drone-captured scenarios. In Proceedings of the IEEE/CVF international conference on computer vision; 2021; pp. 2778–2788. [Google Scholar]
- Zhang, J.; Lei, J.; Xie, W.; Fang, Z.; Li, Y.; Du, Q. SuperYOLO: Super resolution assisted object detection in multimodal remote sensing imagery. IEEE Transactions on Geoscience and Remote Sensing 2023, 61, 1–15. [Google Scholar]
- Rahman, M.A.; Wang, Y. Optimizing intersection-over-union in deep neural networks for image segmentation. International symposium on visual computing. Springer, 2016; pp. 234–244. [Google Scholar]
- Zheng, Z.; Wang, P.; Liu, W.; Li, J.; Ye, R.; Ren, D. Distance-IoU loss: Faster and better learning for bounding box regression. In Proceedings of the AAAI conference on artificial intelligence; 2020; Volume 34, pp. 12993–13000. [Google Scholar]
- Rezatofighi, H.; Tsoi, N.; Gwak, J.; Sadeghian, A.; Reid, I.; Savarese, S. Generalized intersection over union: A metric and a loss for bounding box regression. In Proceedings of the IEEE/CVF conference on computer vision and pattern recognition; 2019; pp. 658–666. [Google Scholar]
- Zhang, H.; Zhang, S. Shape-IoU: More Accurate Metric considering Bounding Box Shape and Scale. arXiv 2023, arXiv:2312.17663. [Google Scholar]
- Siliang, M.; Yong, X. Mpdiou: a loss for efficient and accurate bounding box regression. arXiv 2023, arXiv:2307.07662. [Google Scholar]
- Lou, M.; Zhou, H.Y.; Yang, S.; Yu, Y. TransXNet: Learning both global and local dynamics with a dual dynamic token mixer for visual recognition. arXiv 2023, arXiv:2310.19380. [Google Scholar]
- Zhu, L.; Wang, X.; Ke, Z.; Zhang, W.; Lau, R.W. Biformer: Vision transformer with bi-level routing attention. In Proceedings of the IEEE/CVF conference on computer vision and pattern recognition; 2023; pp. 10323–10333. [Google Scholar]
- Xu, X.; Jiang, Y.; Chen, W.; Huang, Y.; Zhang, Y.; Sun, X. Damo-yolo: A report on real-time object detection design. arXiv 2022, arXiv:2211.15444. [Google Scholar]
- Soudy, M.; Afify, Y.; Badr, N. RepConv: A novel architecture for image scene classification on Intel scenes dataset. International Journal of Intelligent Computing and Information Sciences 2022, 22, 63–73. [Google Scholar] [CrossRef]
- Yu, F.; Koltun, V. Multi-scale context aggregation by dilated convolutions. arXiv 2015, arXiv:1511.07122. [Google Scholar]
- Long, Y.; Gong, Y.; Xiao, Z.; Liu, Q. Accurate object localization in remote sensing images based on convolutional neural networks. IEEE Transactions on Geoscience and Remote Sensing 2017, 55, 2486–2498. [Google Scholar] [CrossRef]
- Cheng, G.; Zhou, P.; Han, J. Learning rotation-invariant convolutional neural networks for object detection in VHR optical remote sensing images. IEEE transactions on geoscience and remote sensing 2016, 54, 7405–7415. [Google Scholar] [CrossRef]
- Zhu, P.; Wen, L.; Bian, X.; Ling, H.; Hu, Q. Vision meets drones: A challenge. arXiv 2018, arXiv:1804.0743. [Google Scholar]
- Zhang, H.; Chang, H.; Ma, B.; Wang, N.; Chen, X. Dynamic R-CNN: Towards high quality object detection via dynamic training. Computer Vision–ECCV 2020: 16th European Conference, Glasgow, UK, 23–28 August 2020; Proceedings, Part XV 16. Springer, 2020; pp. 260–275. [Google Scholar]
- Girshick, R. Fast r-cnn. In Proceedings of the IEEE international conference on computer vision; 2015; pp. 1440–1448. [Google Scholar]
Figure 1.
Structure of YOLOv8.
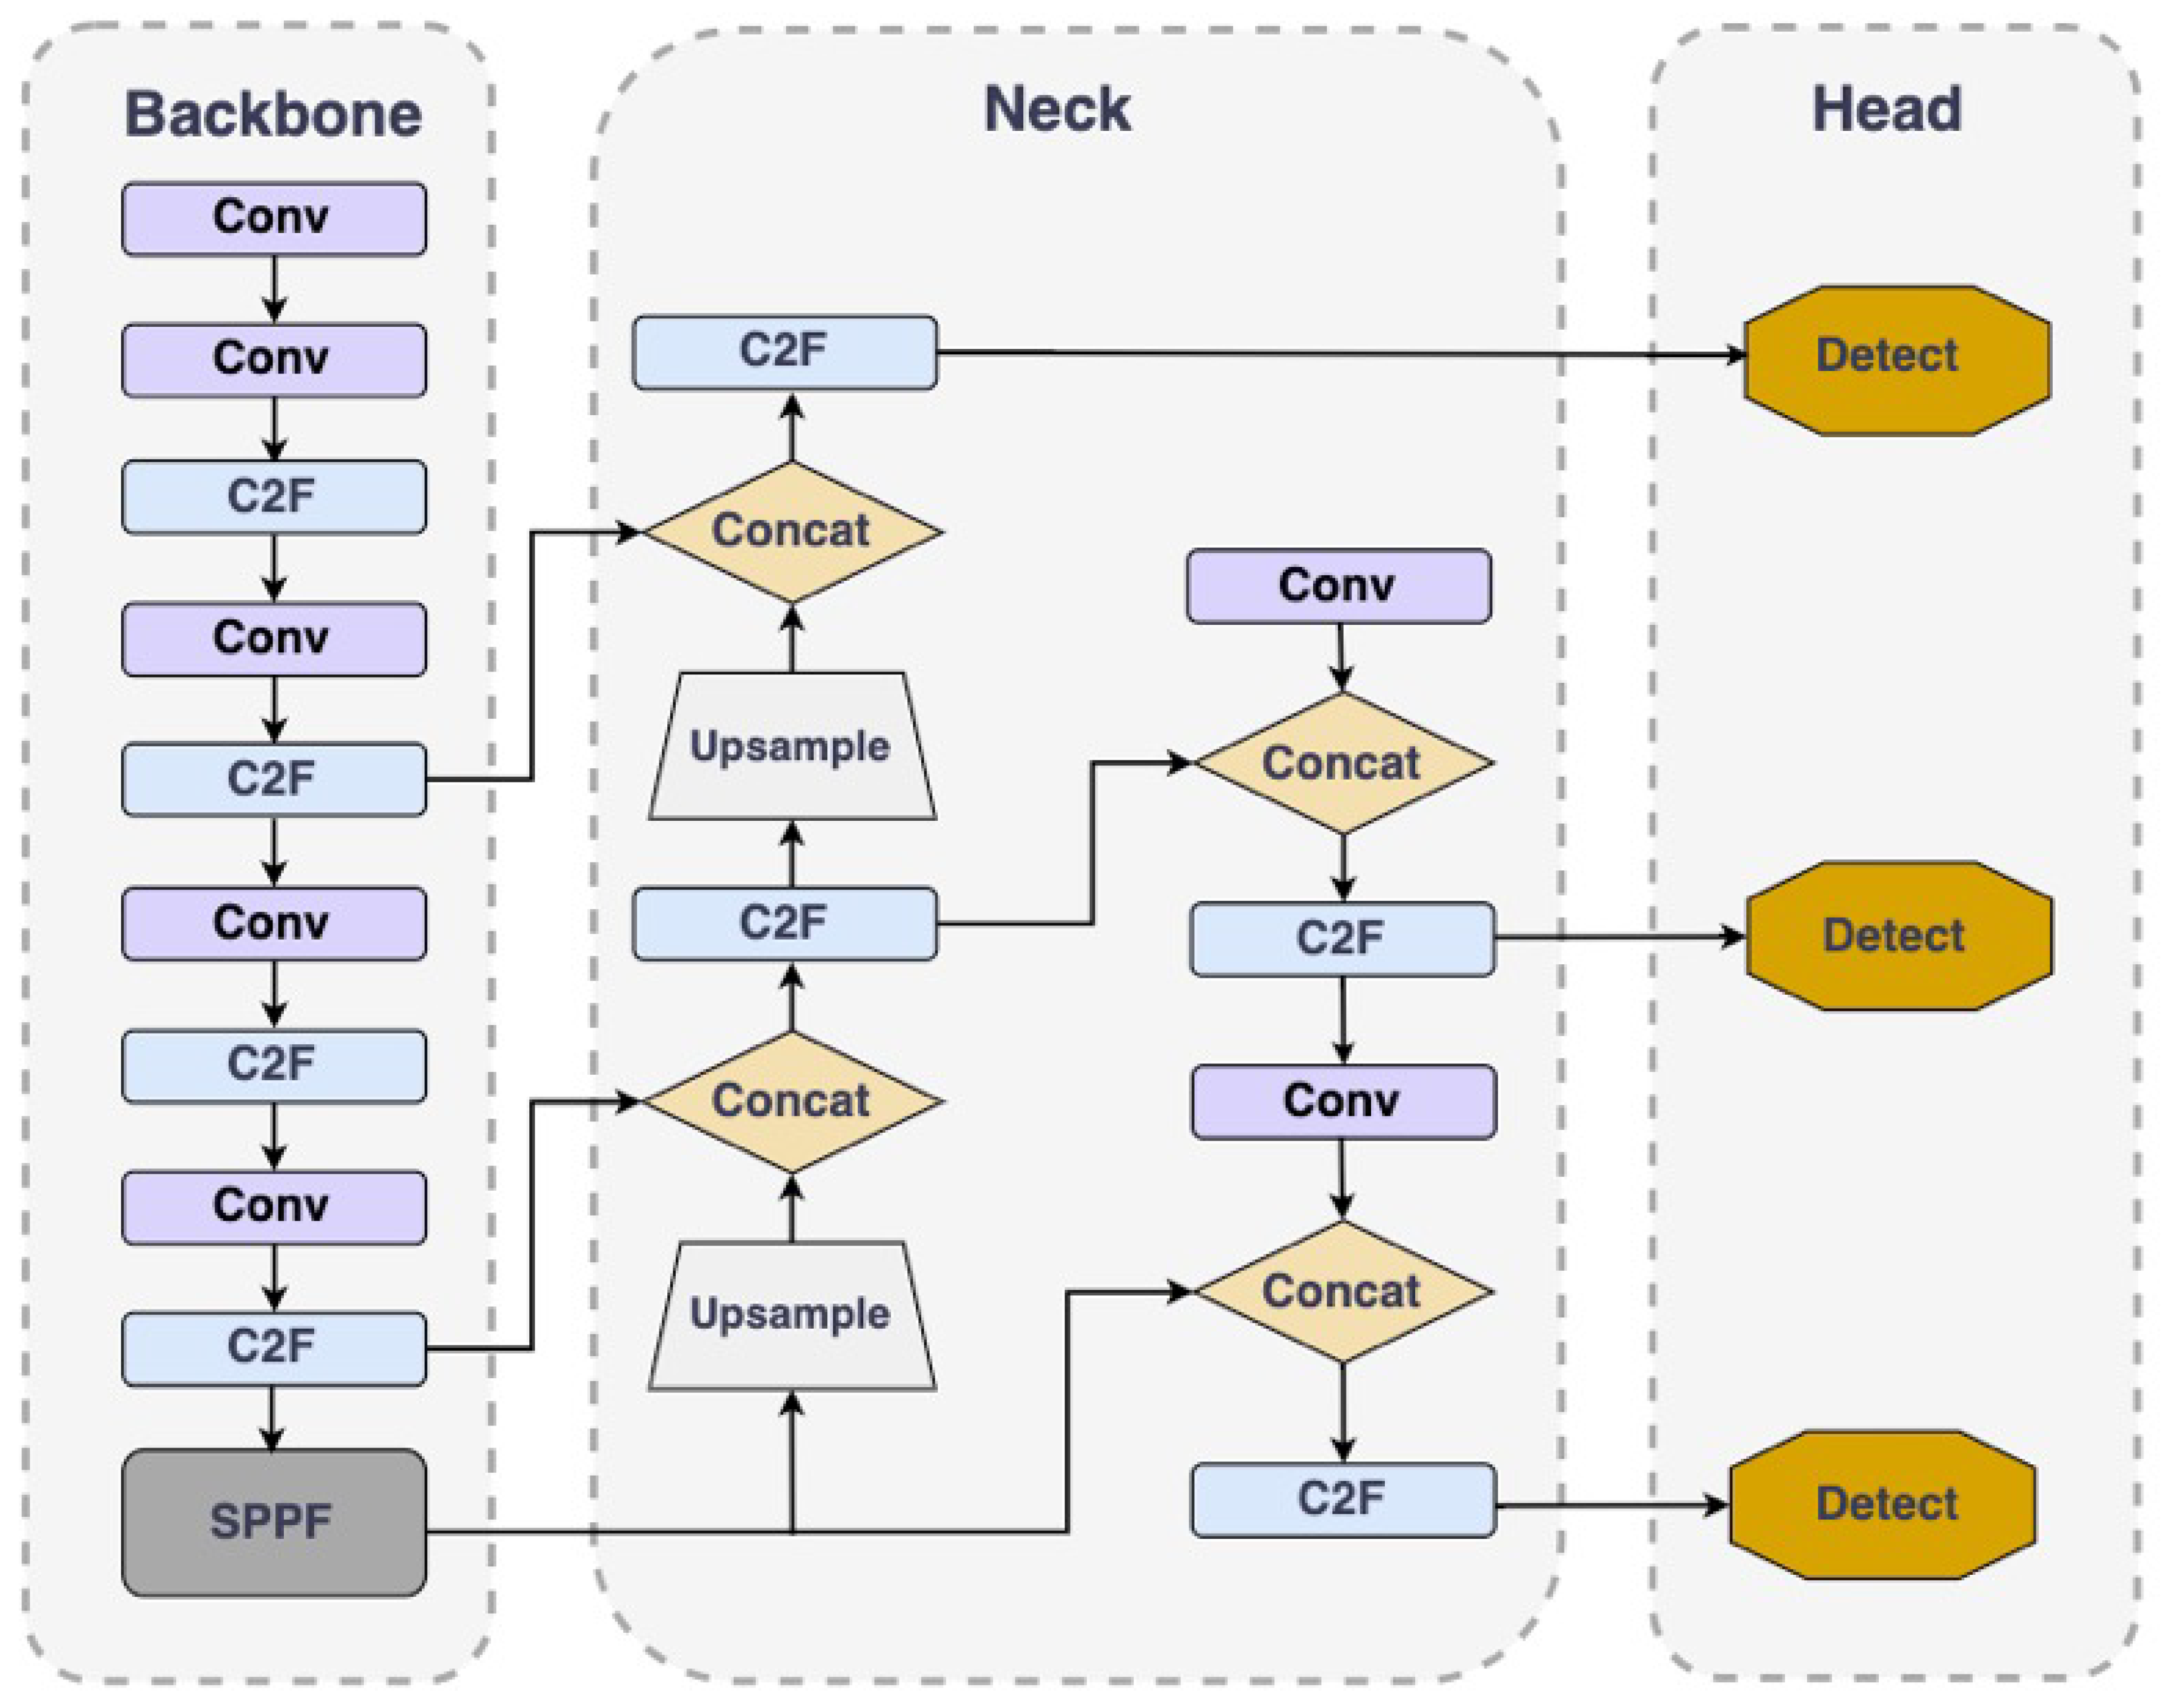
Figure 2.
Structure of HP-YOLOv8.
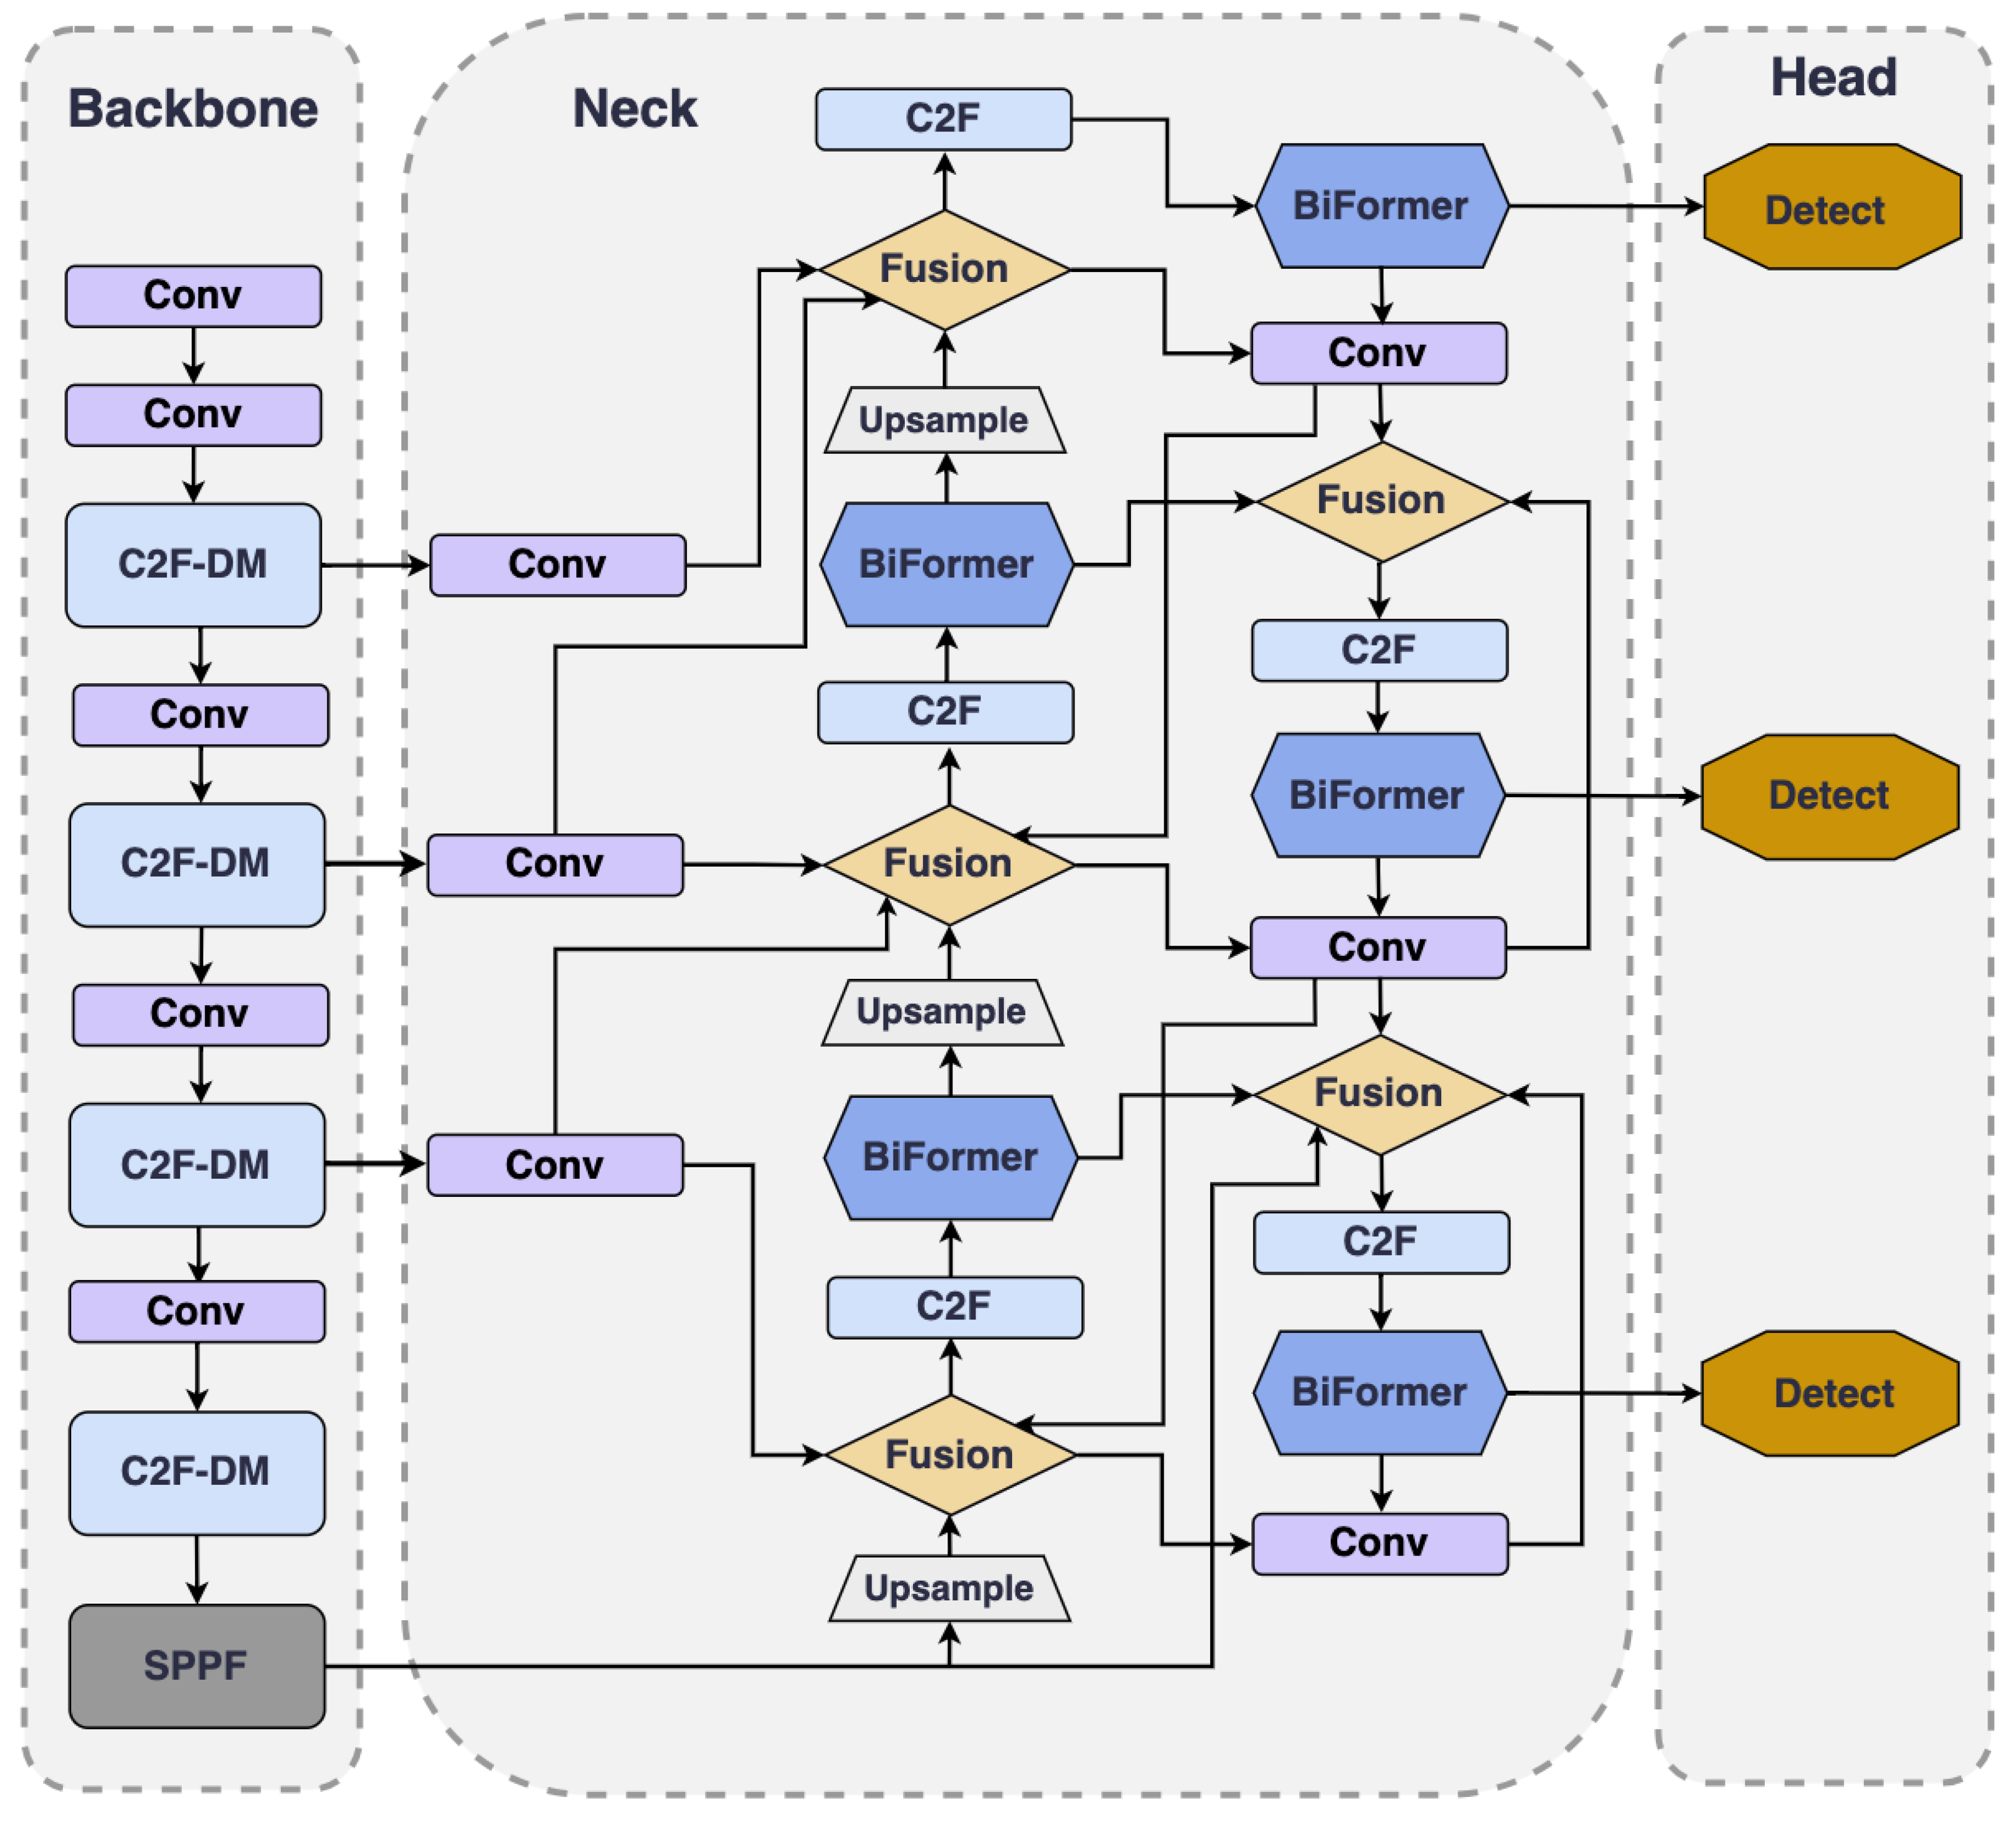
Figure 3.
Comparison of C2f and C2f-DM Structure.
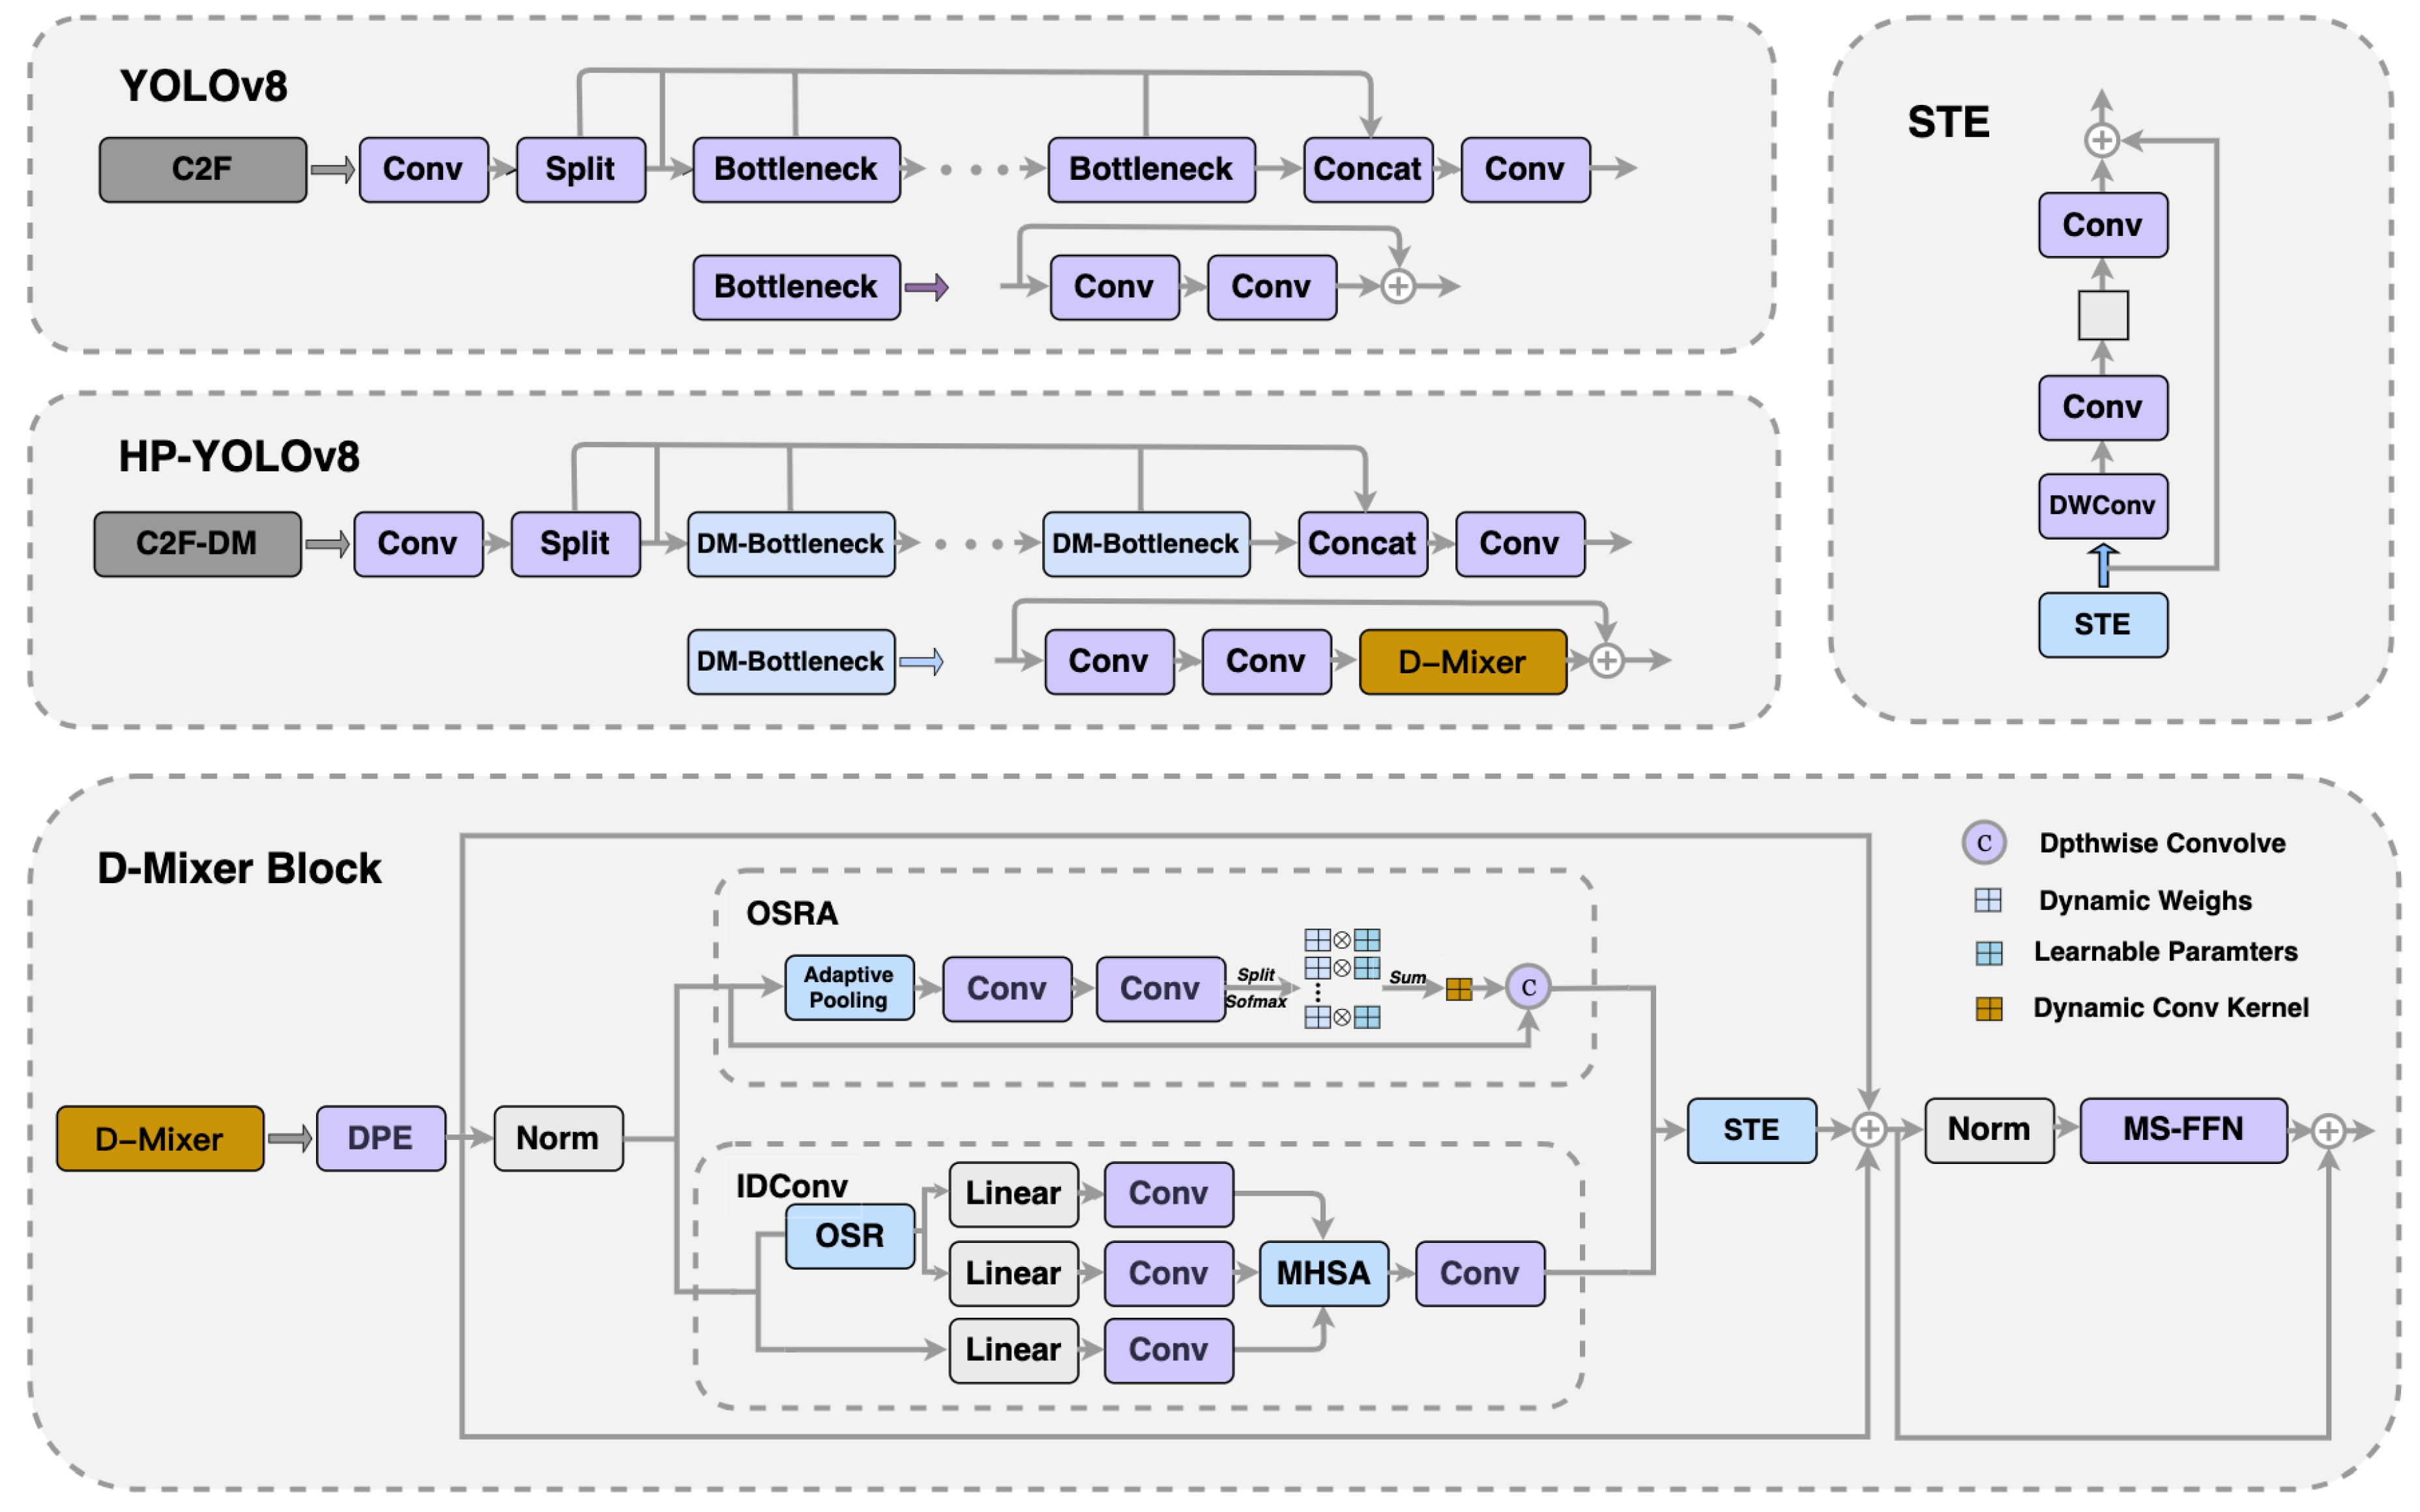
Figure 4.
Bi-Level Routing Attention in Gated Feature Pyramid Network.
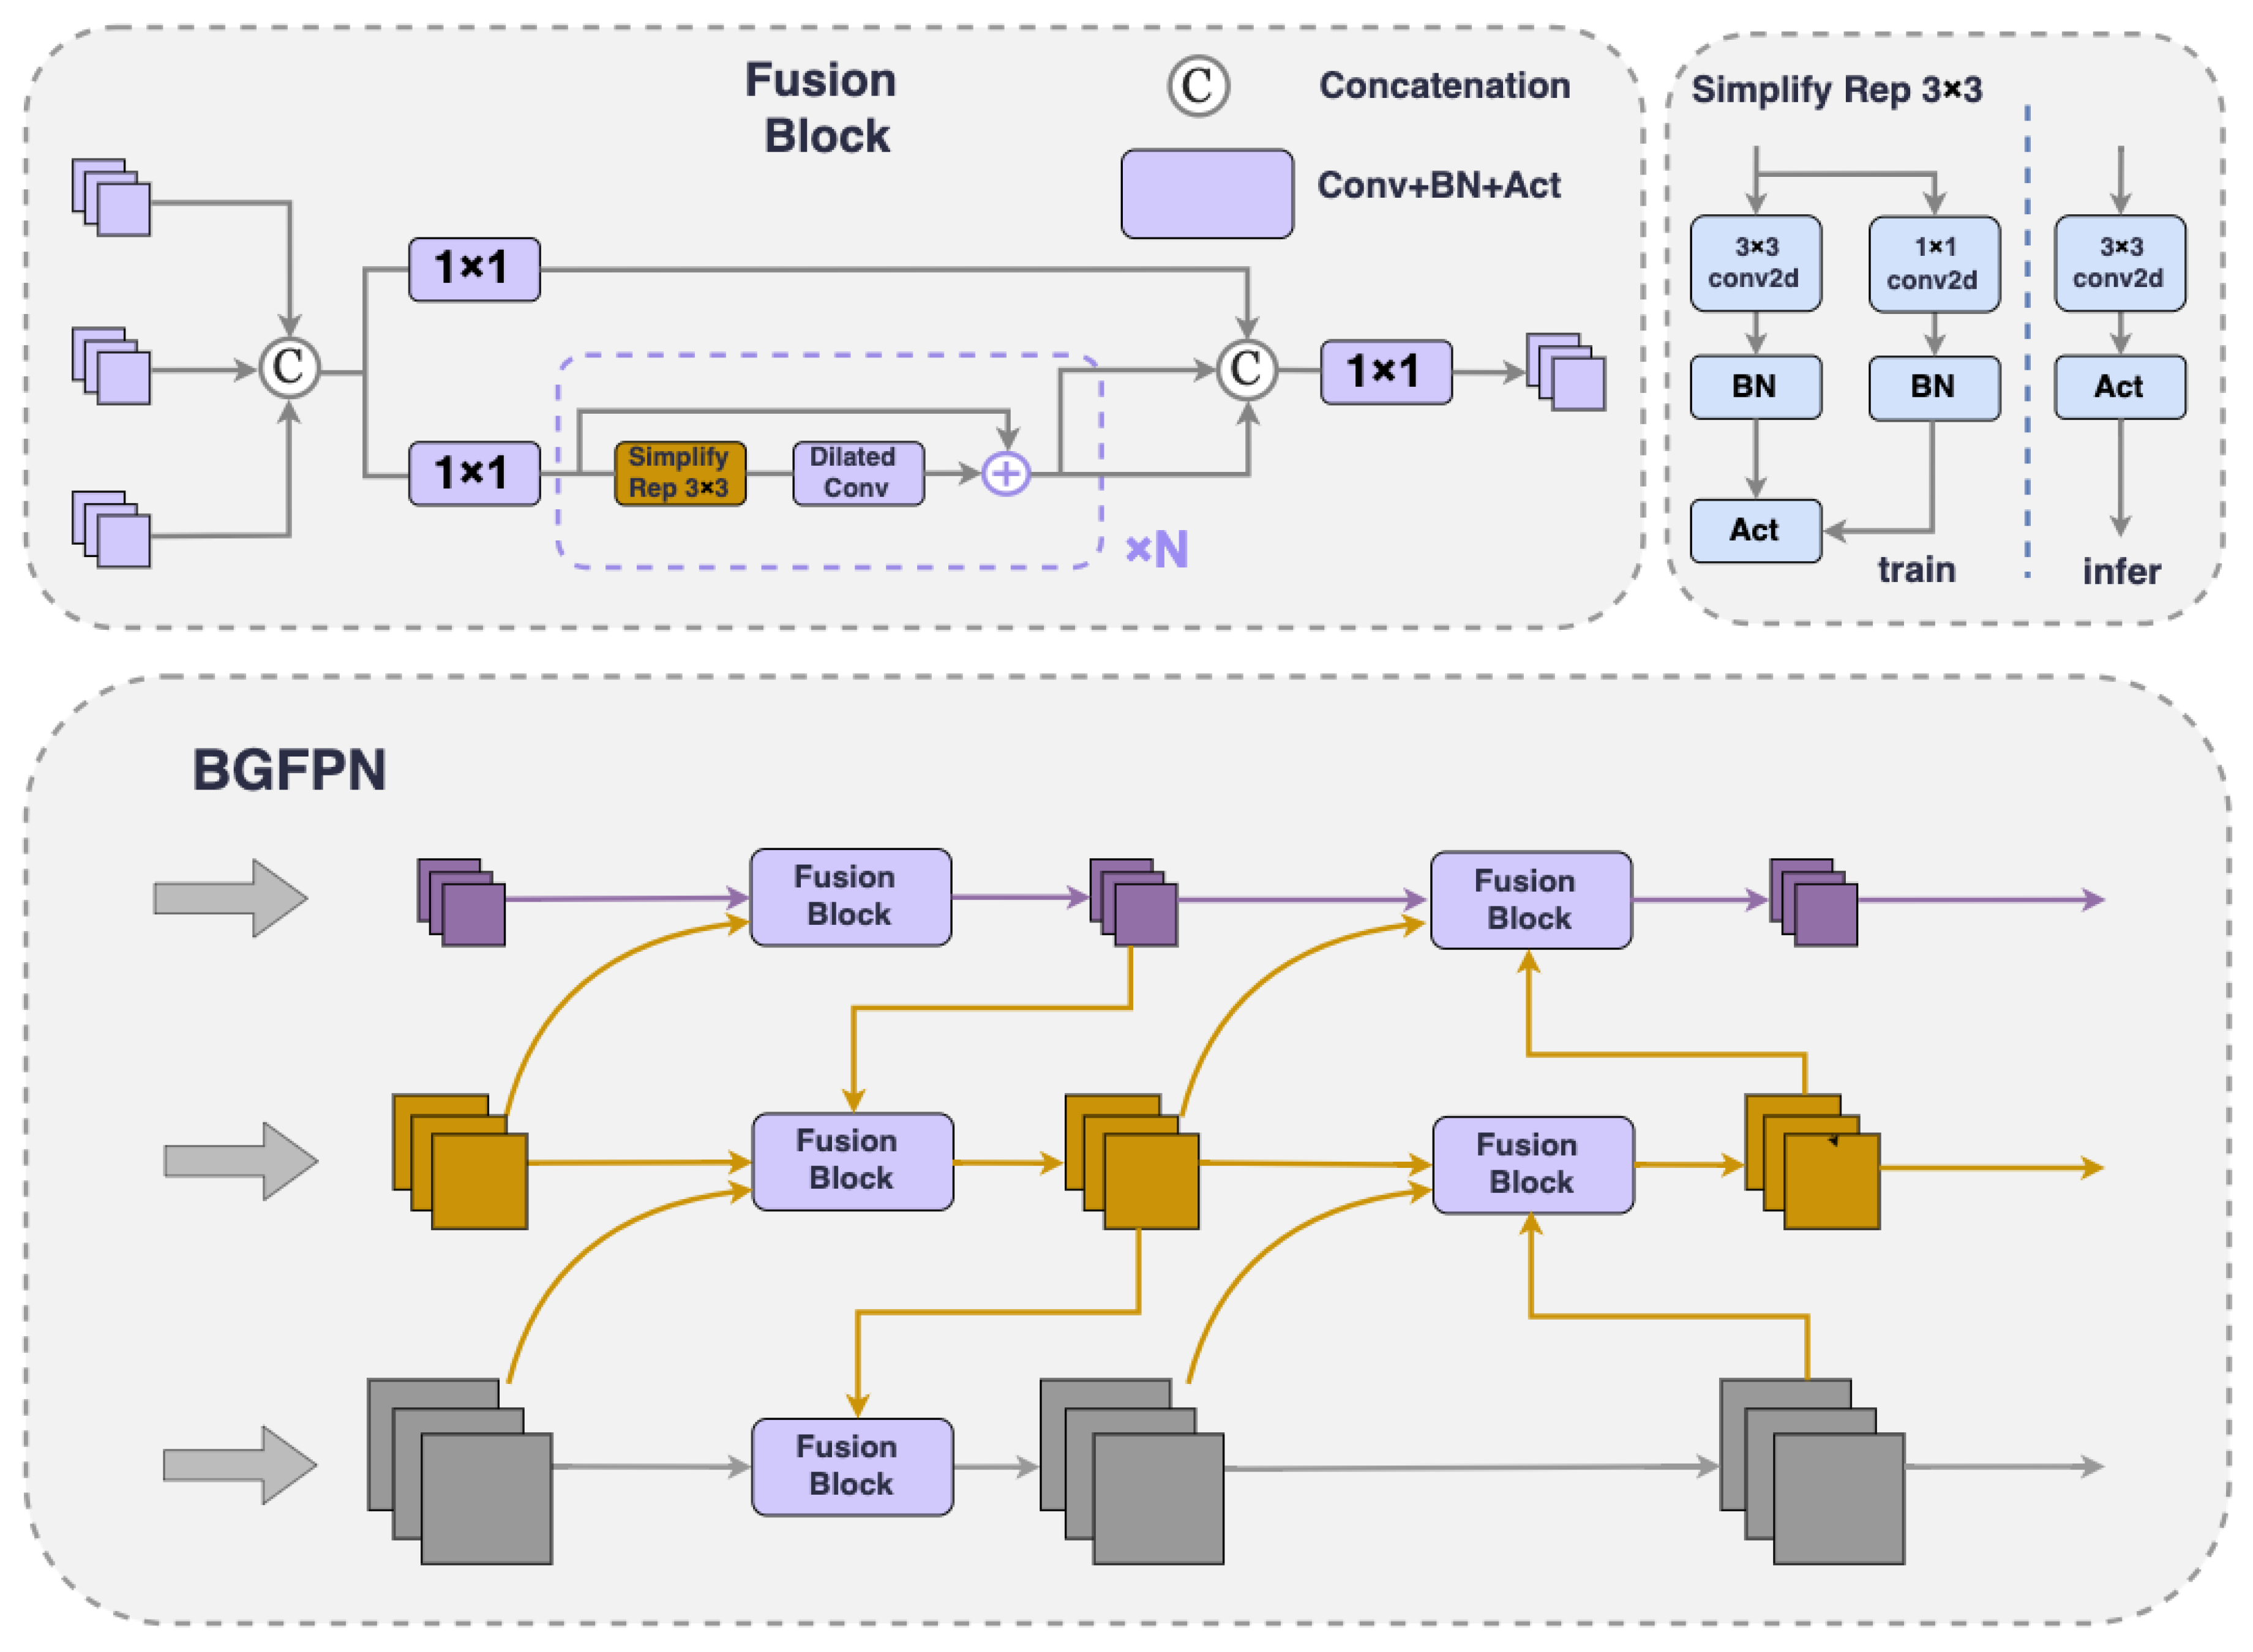
Figure 5.
Bi-Level Routing Attention.
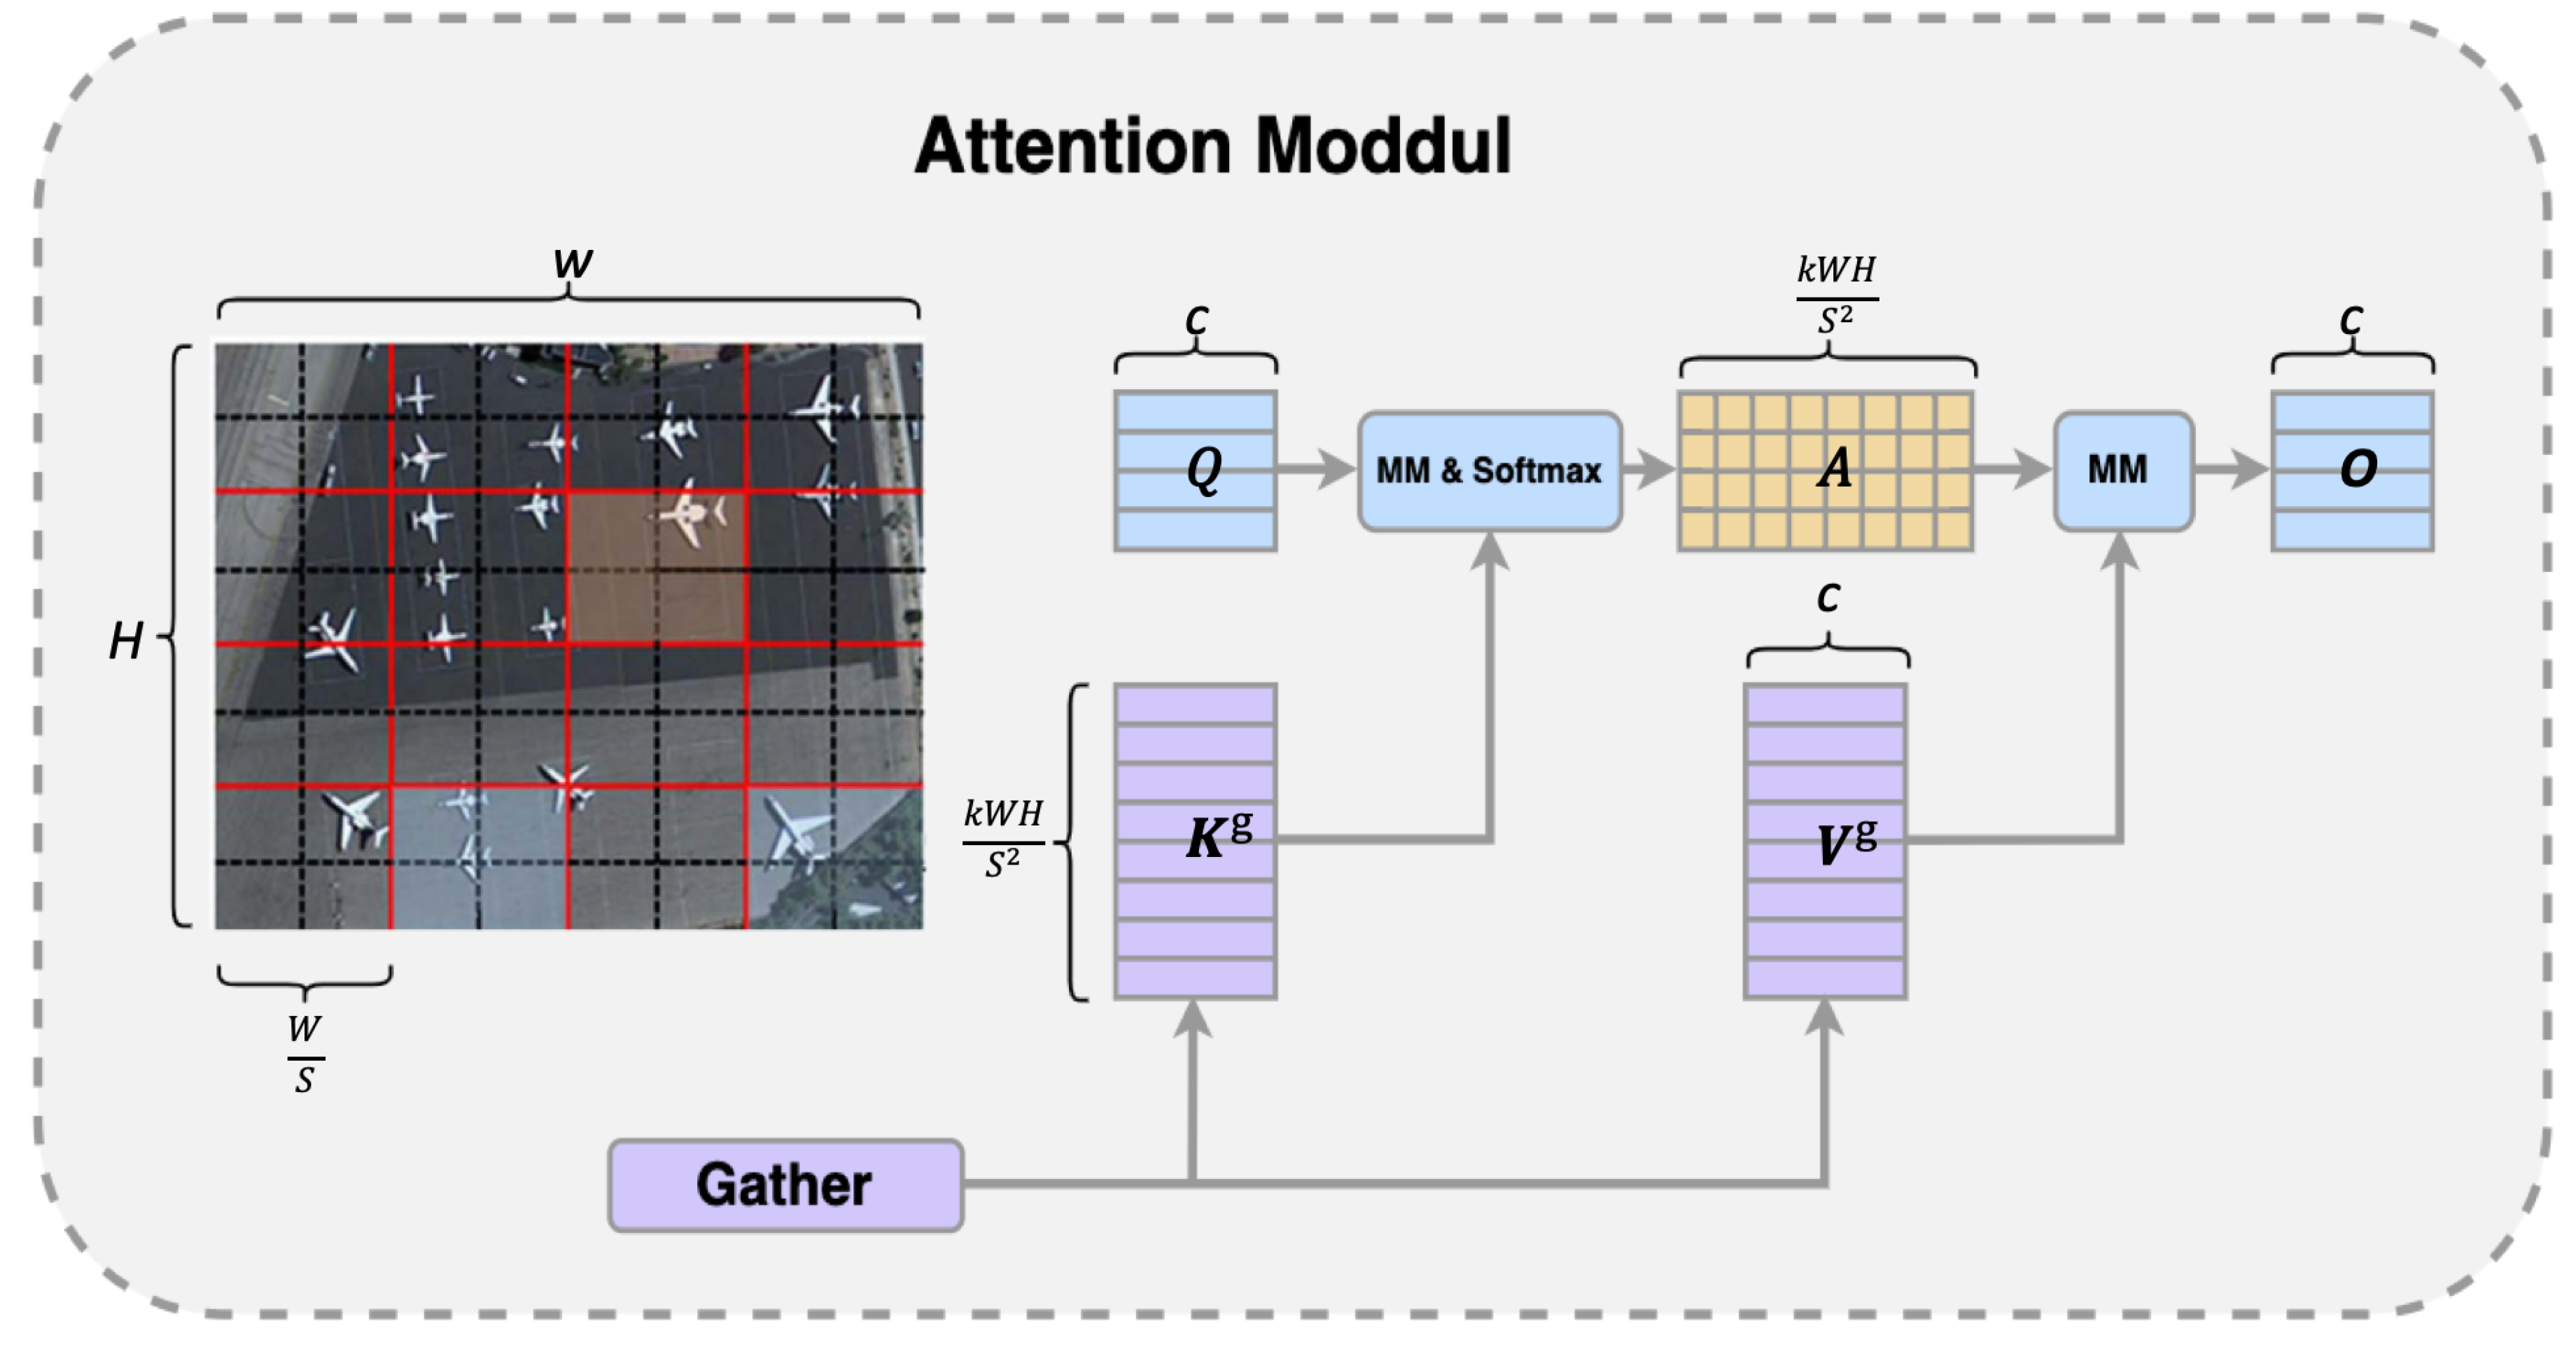
Figure 6.
Distance Loss Diagram and MPD Schematic Diagram.
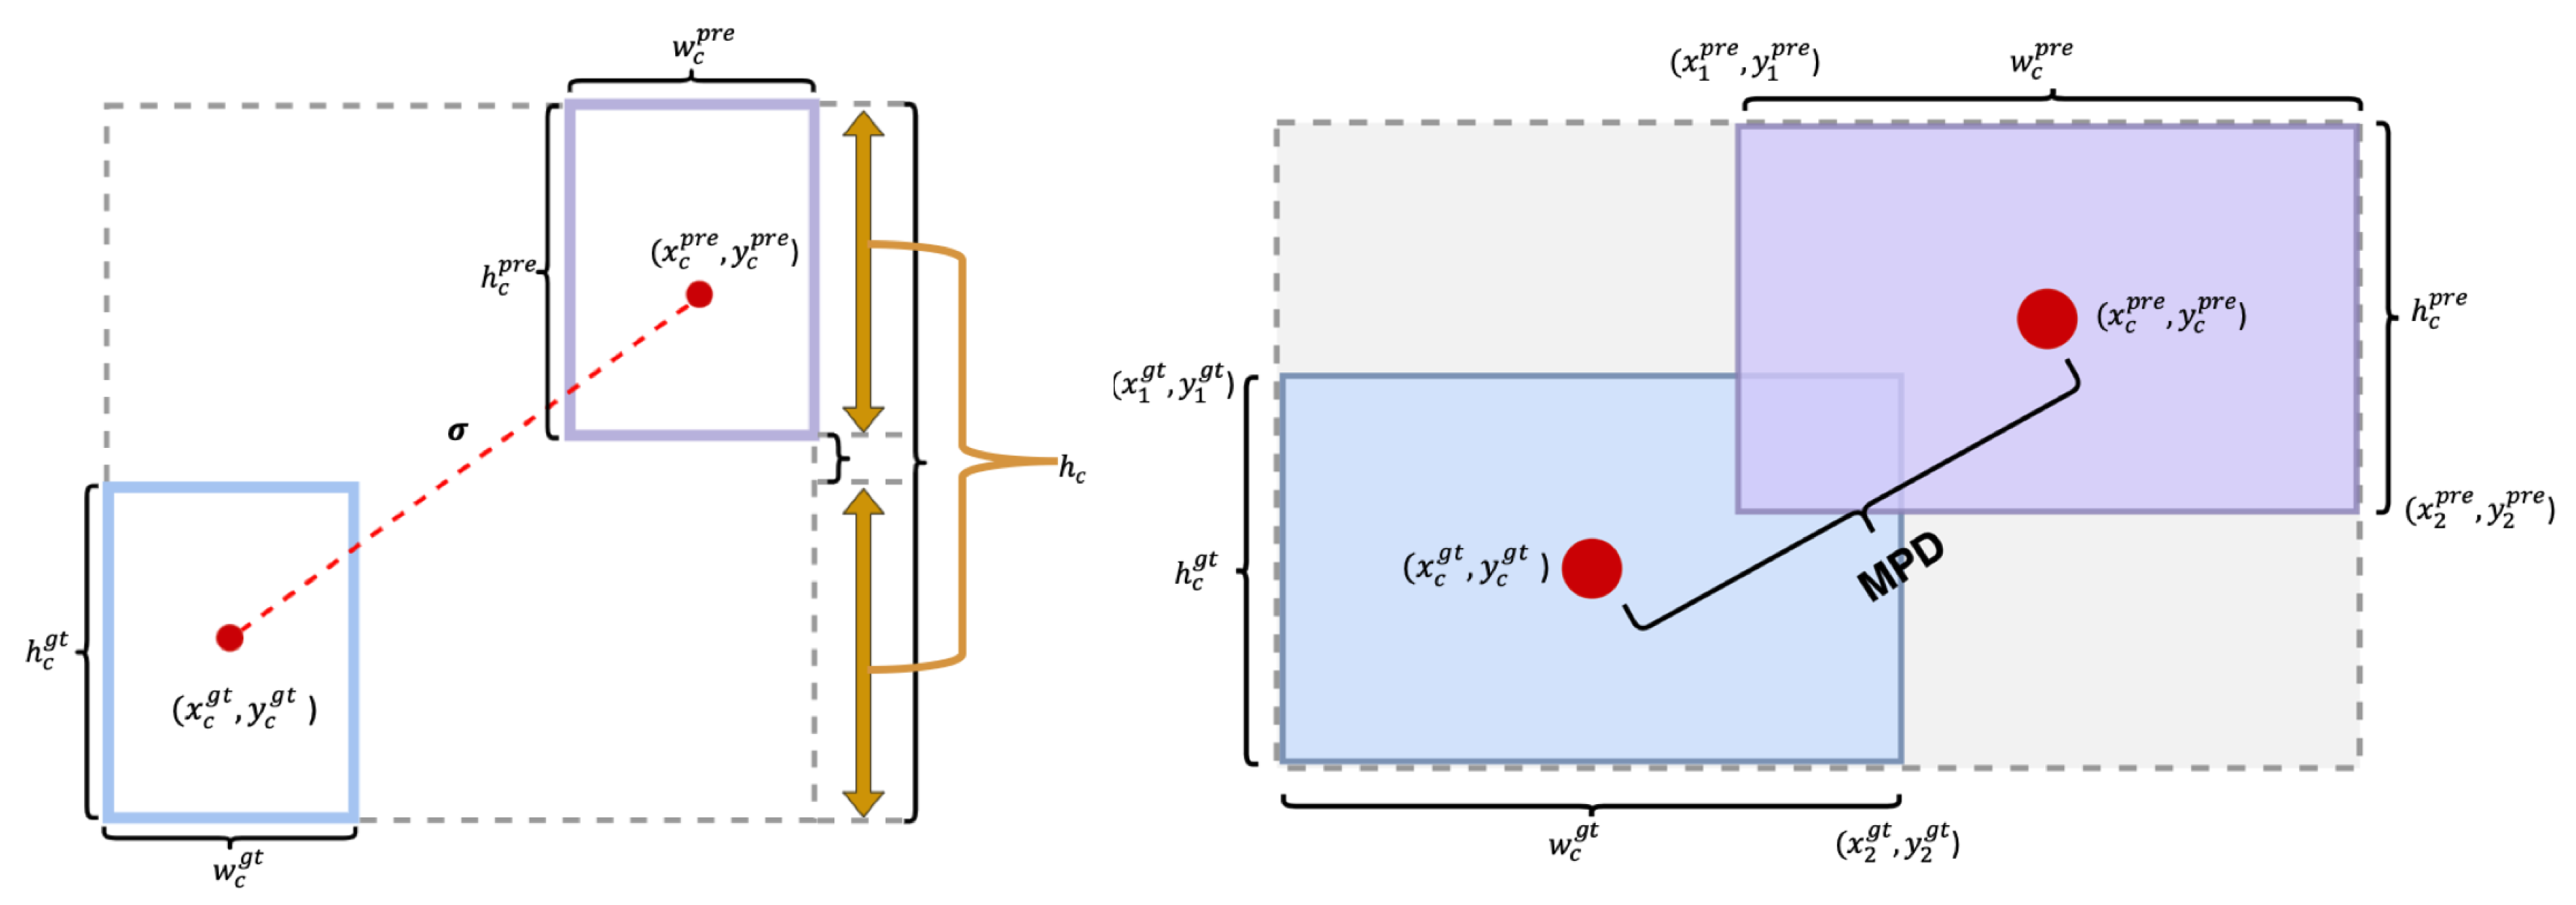
Figure 7.
Evaluation of Trends in Recall, Precision, mAP@0.5, and mAP@[0.5:0.95] for YOLOv8 and HP-YOLOv8 on the RSOD Validation Dataset
Figure 7.
Evaluation of Trends in Recall, Precision, mAP@0.5, and mAP@[0.5:0.95] for YOLOv8 and HP-YOLOv8 on the RSOD Validation Dataset
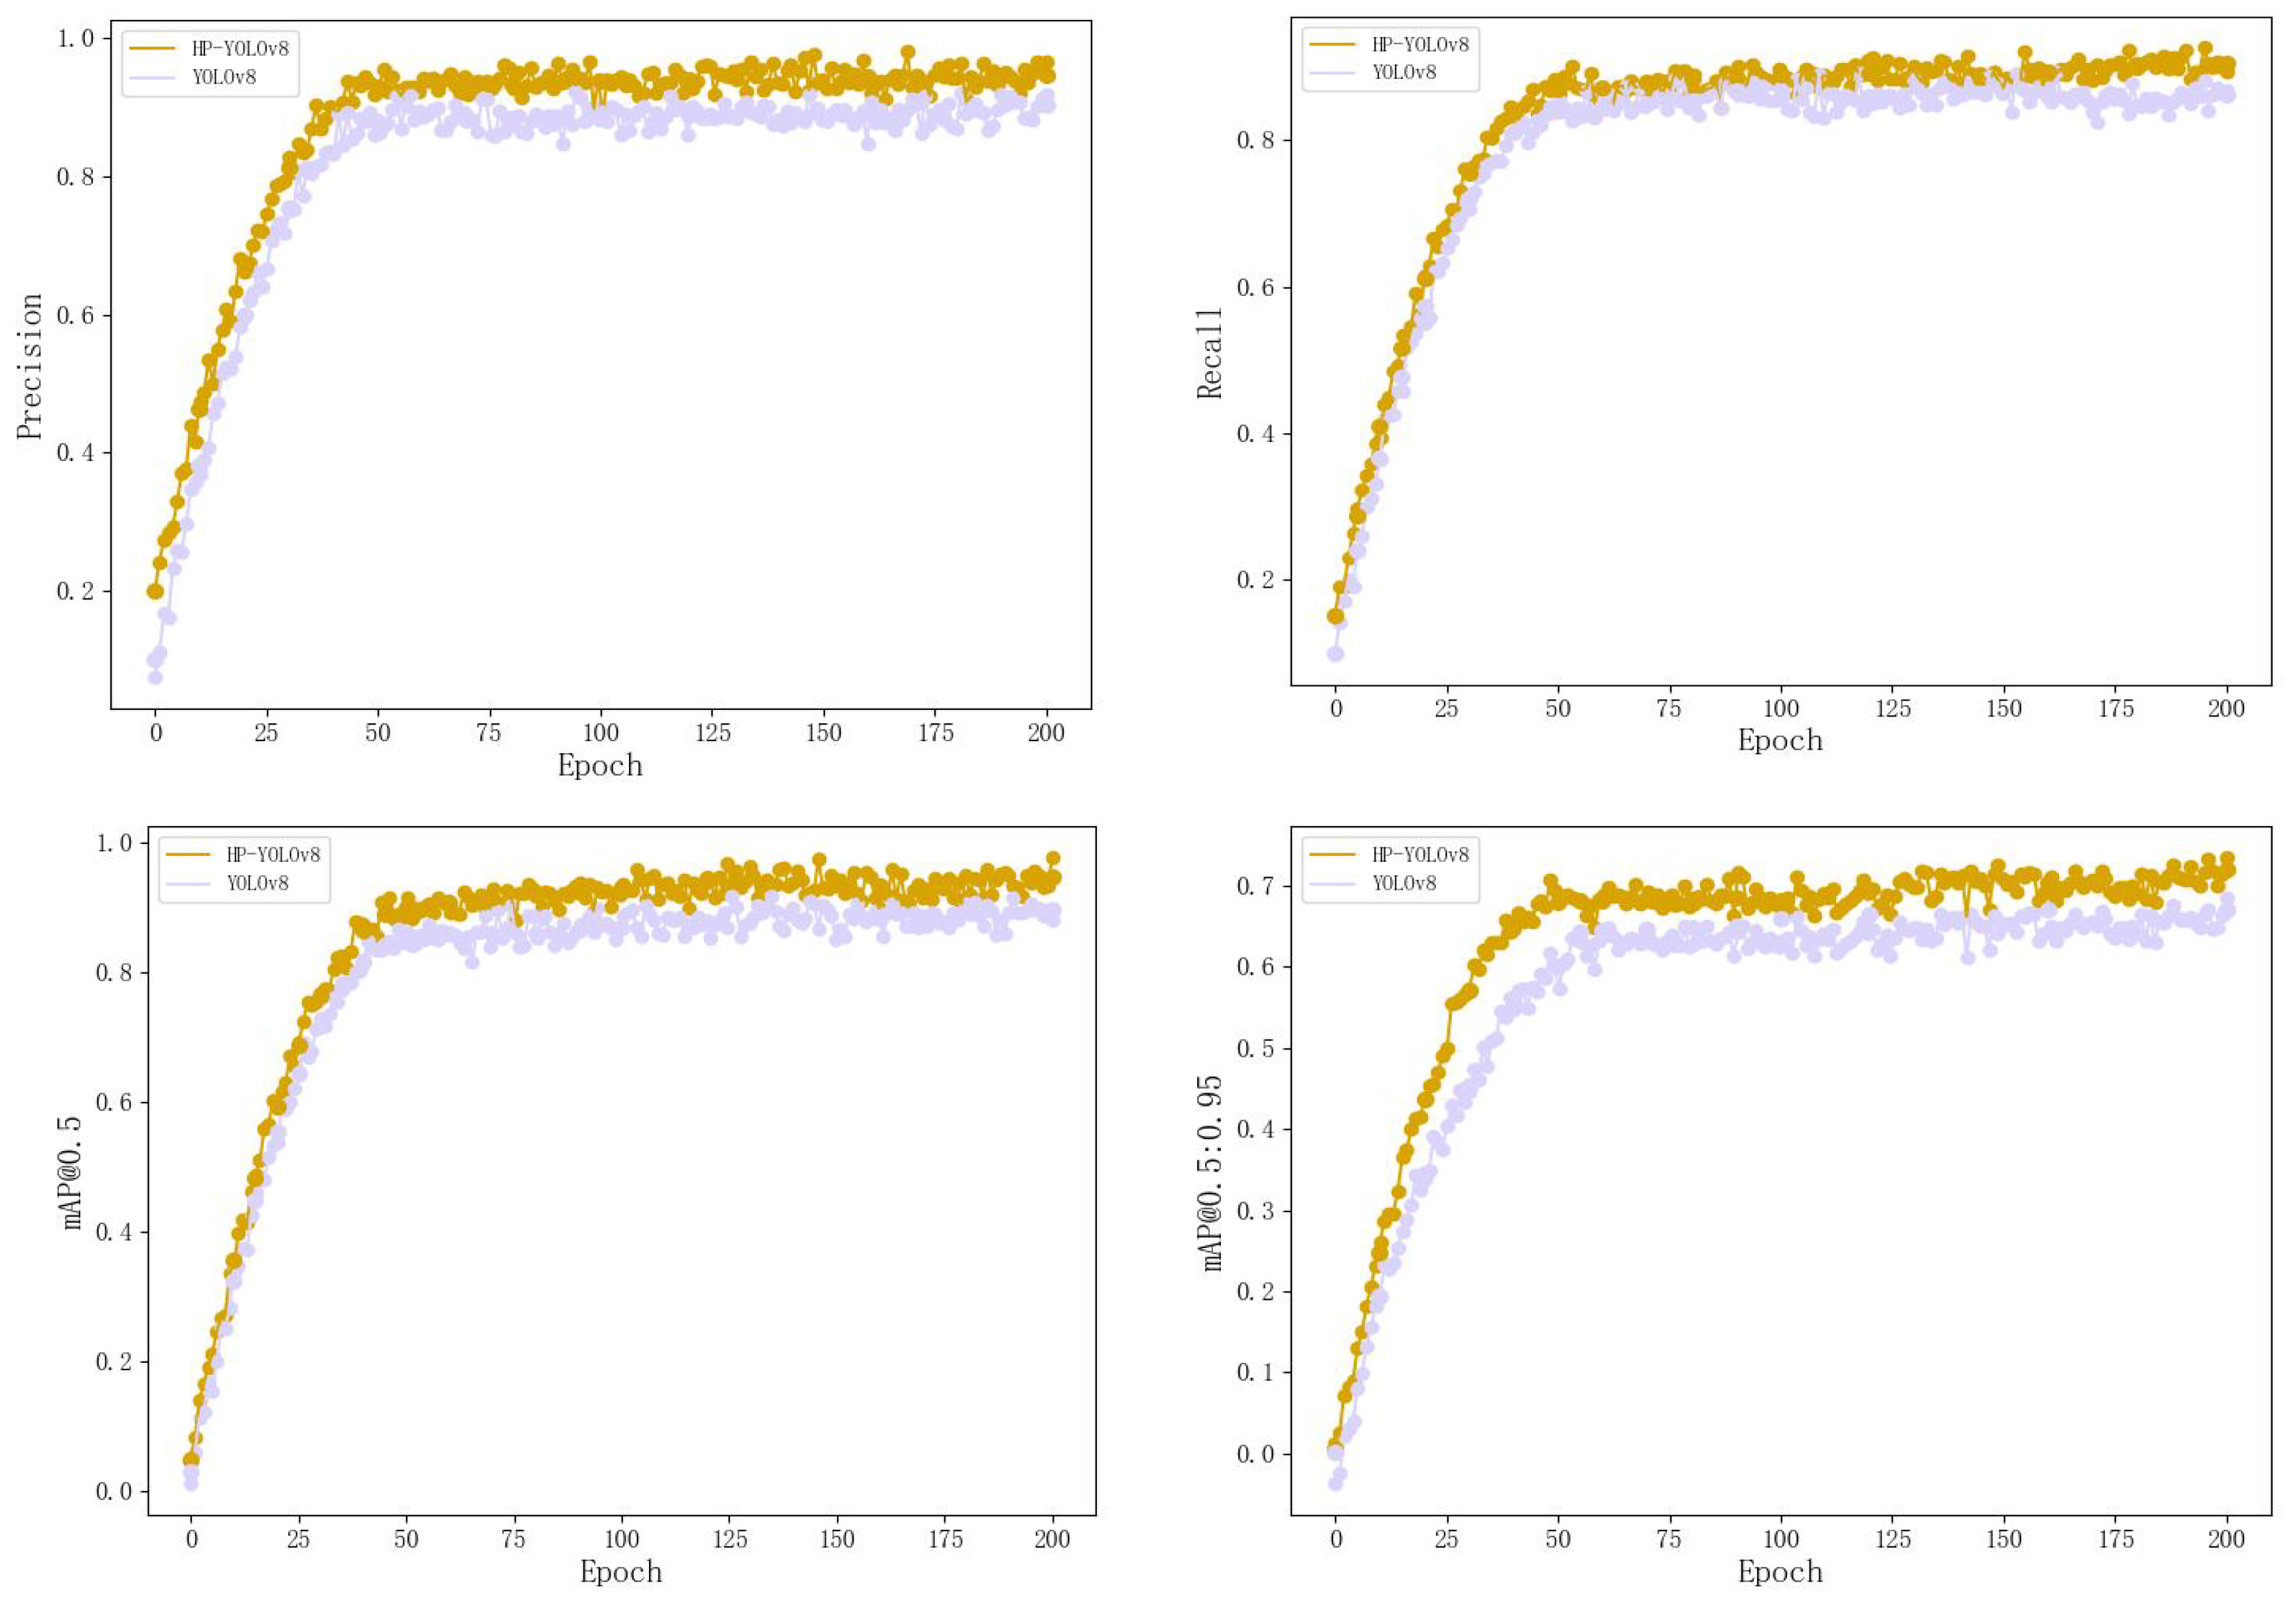
Figure 8.
Precision-Recall Curves for RSOD Datasets.
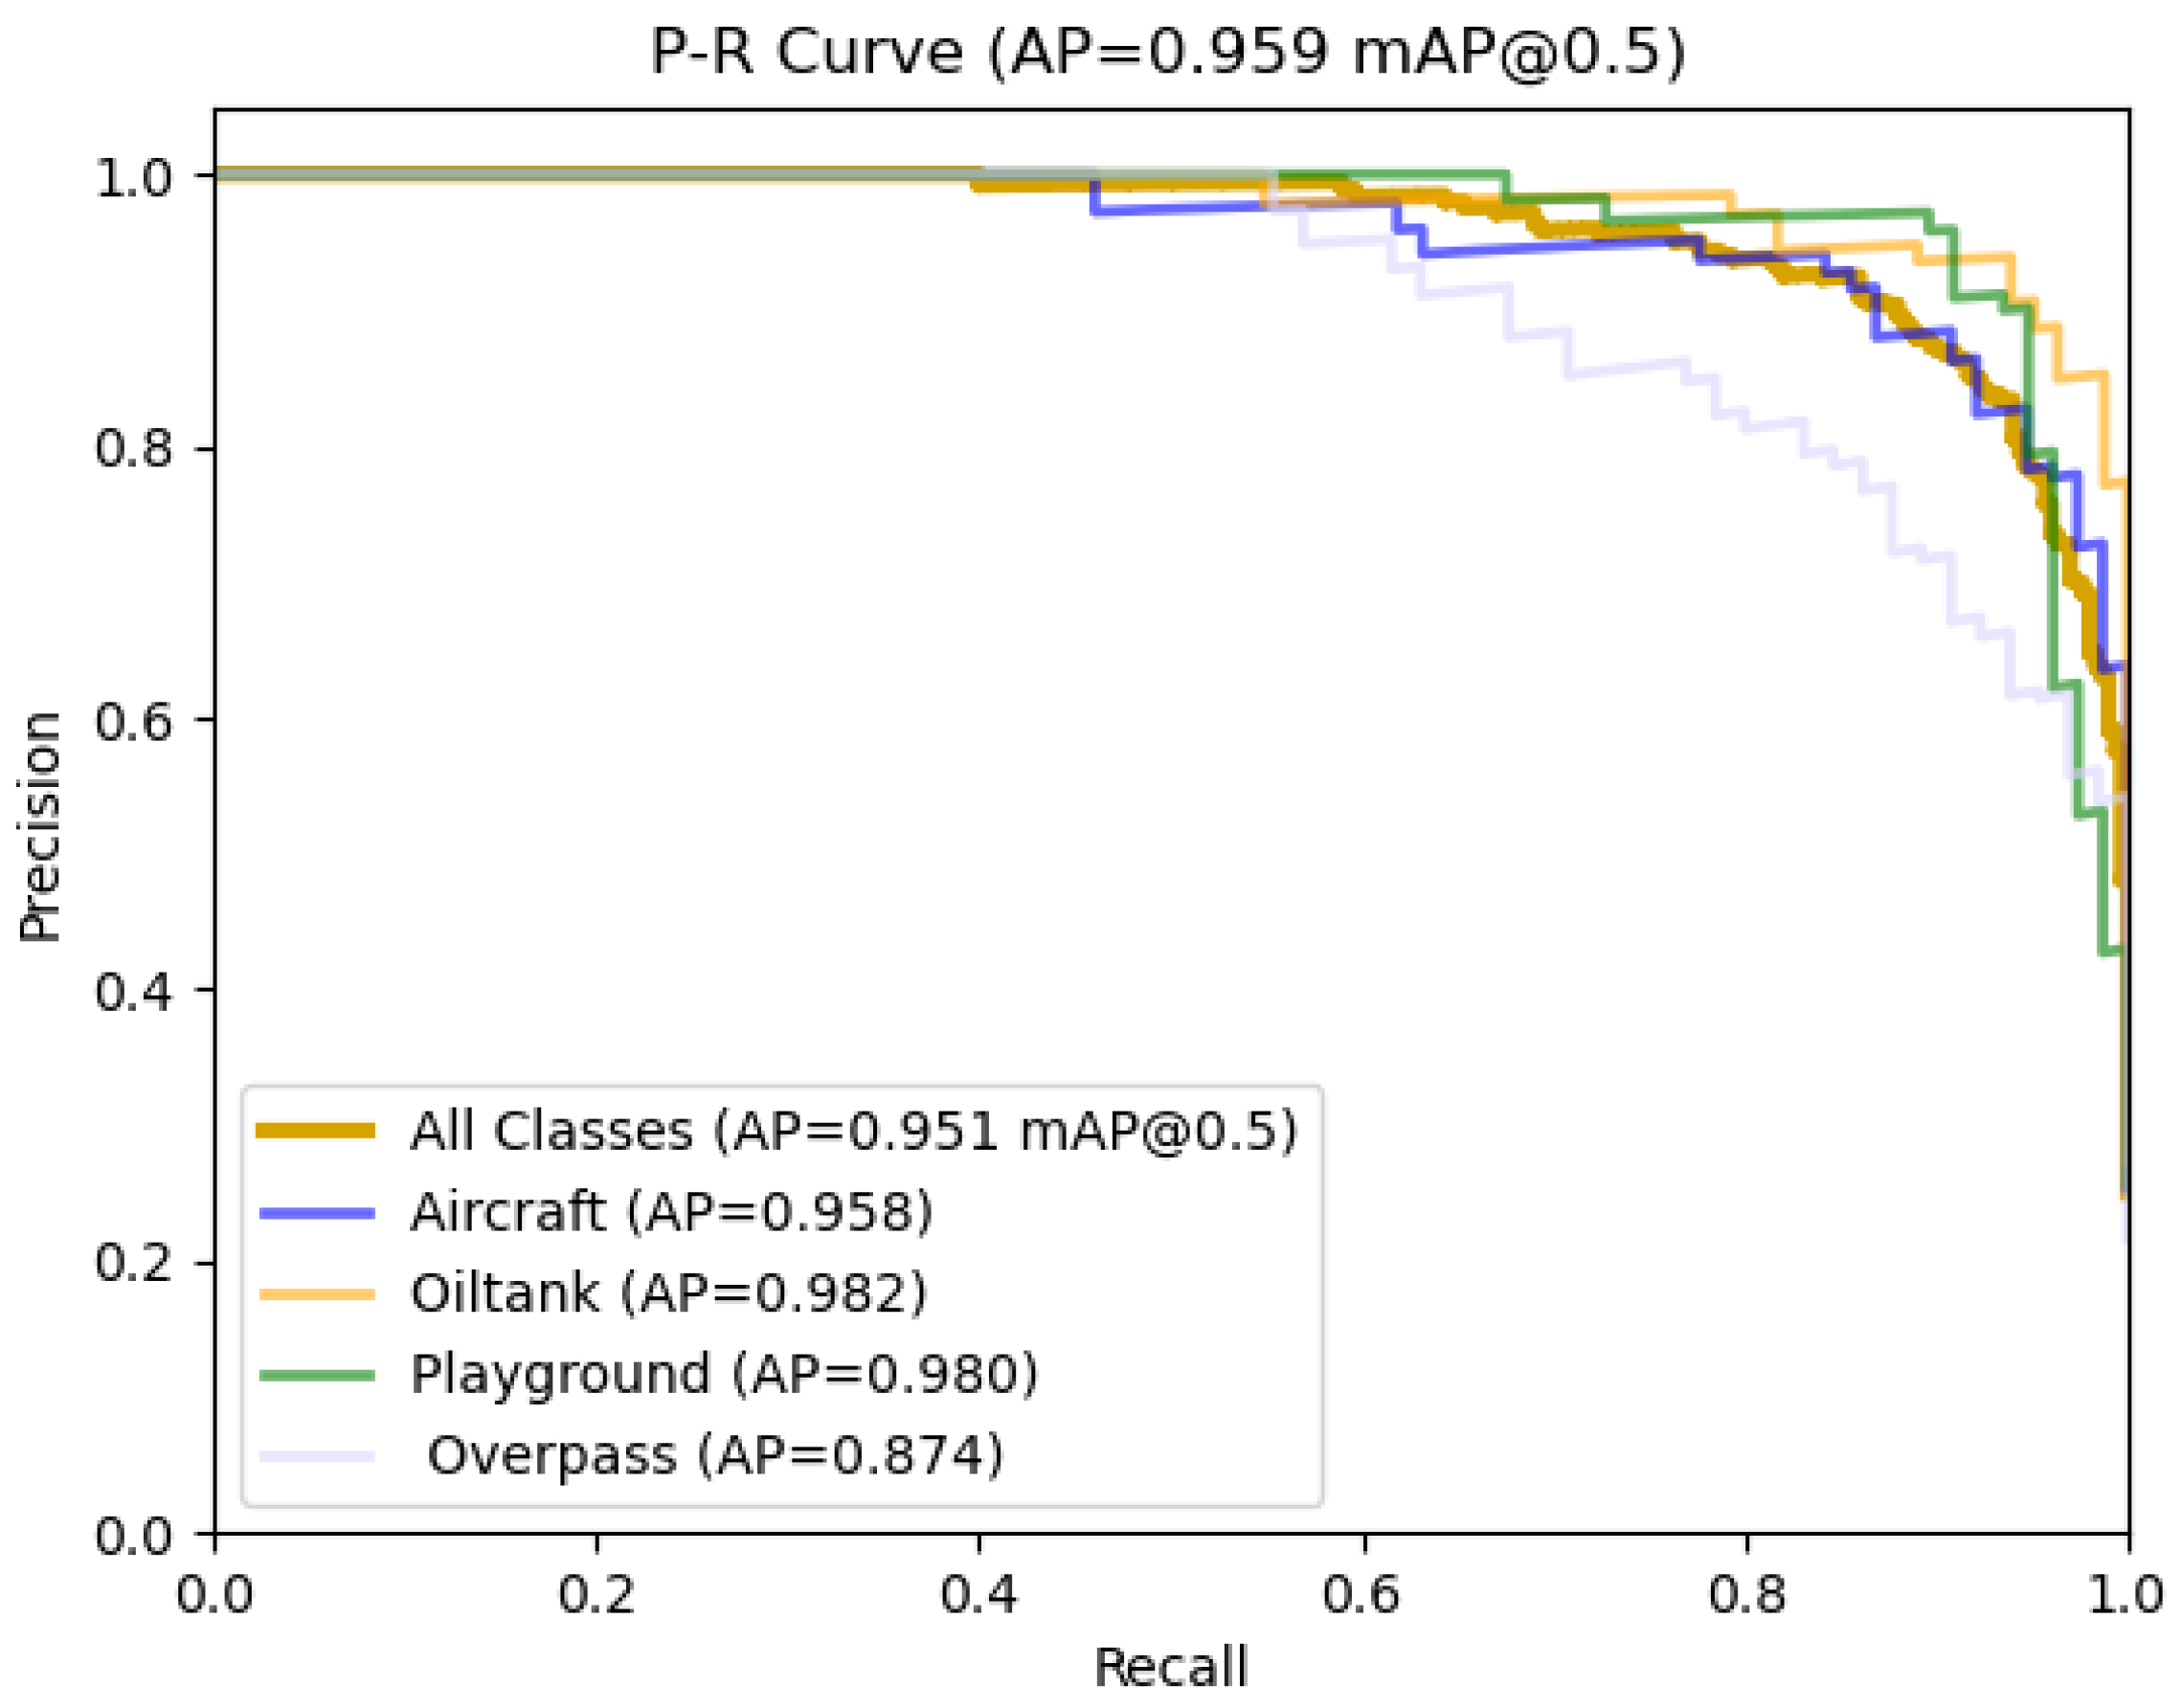
Figure 9.
Detection outcomes on the RSOD, NWPU VHR-10, and VisDrone2019 datasets are depicted. Panels (a), (b), and (c) show the results using YOLOv8, whereas panels (A), (B), and (C) illustrate the results from HP-YOLOv8.
Figure 9.
Detection outcomes on the RSOD, NWPU VHR-10, and VisDrone2019 datasets are depicted. Panels (a), (b), and (c) show the results using YOLOv8, whereas panels (A), (B), and (C) illustrate the results from HP-YOLOv8.
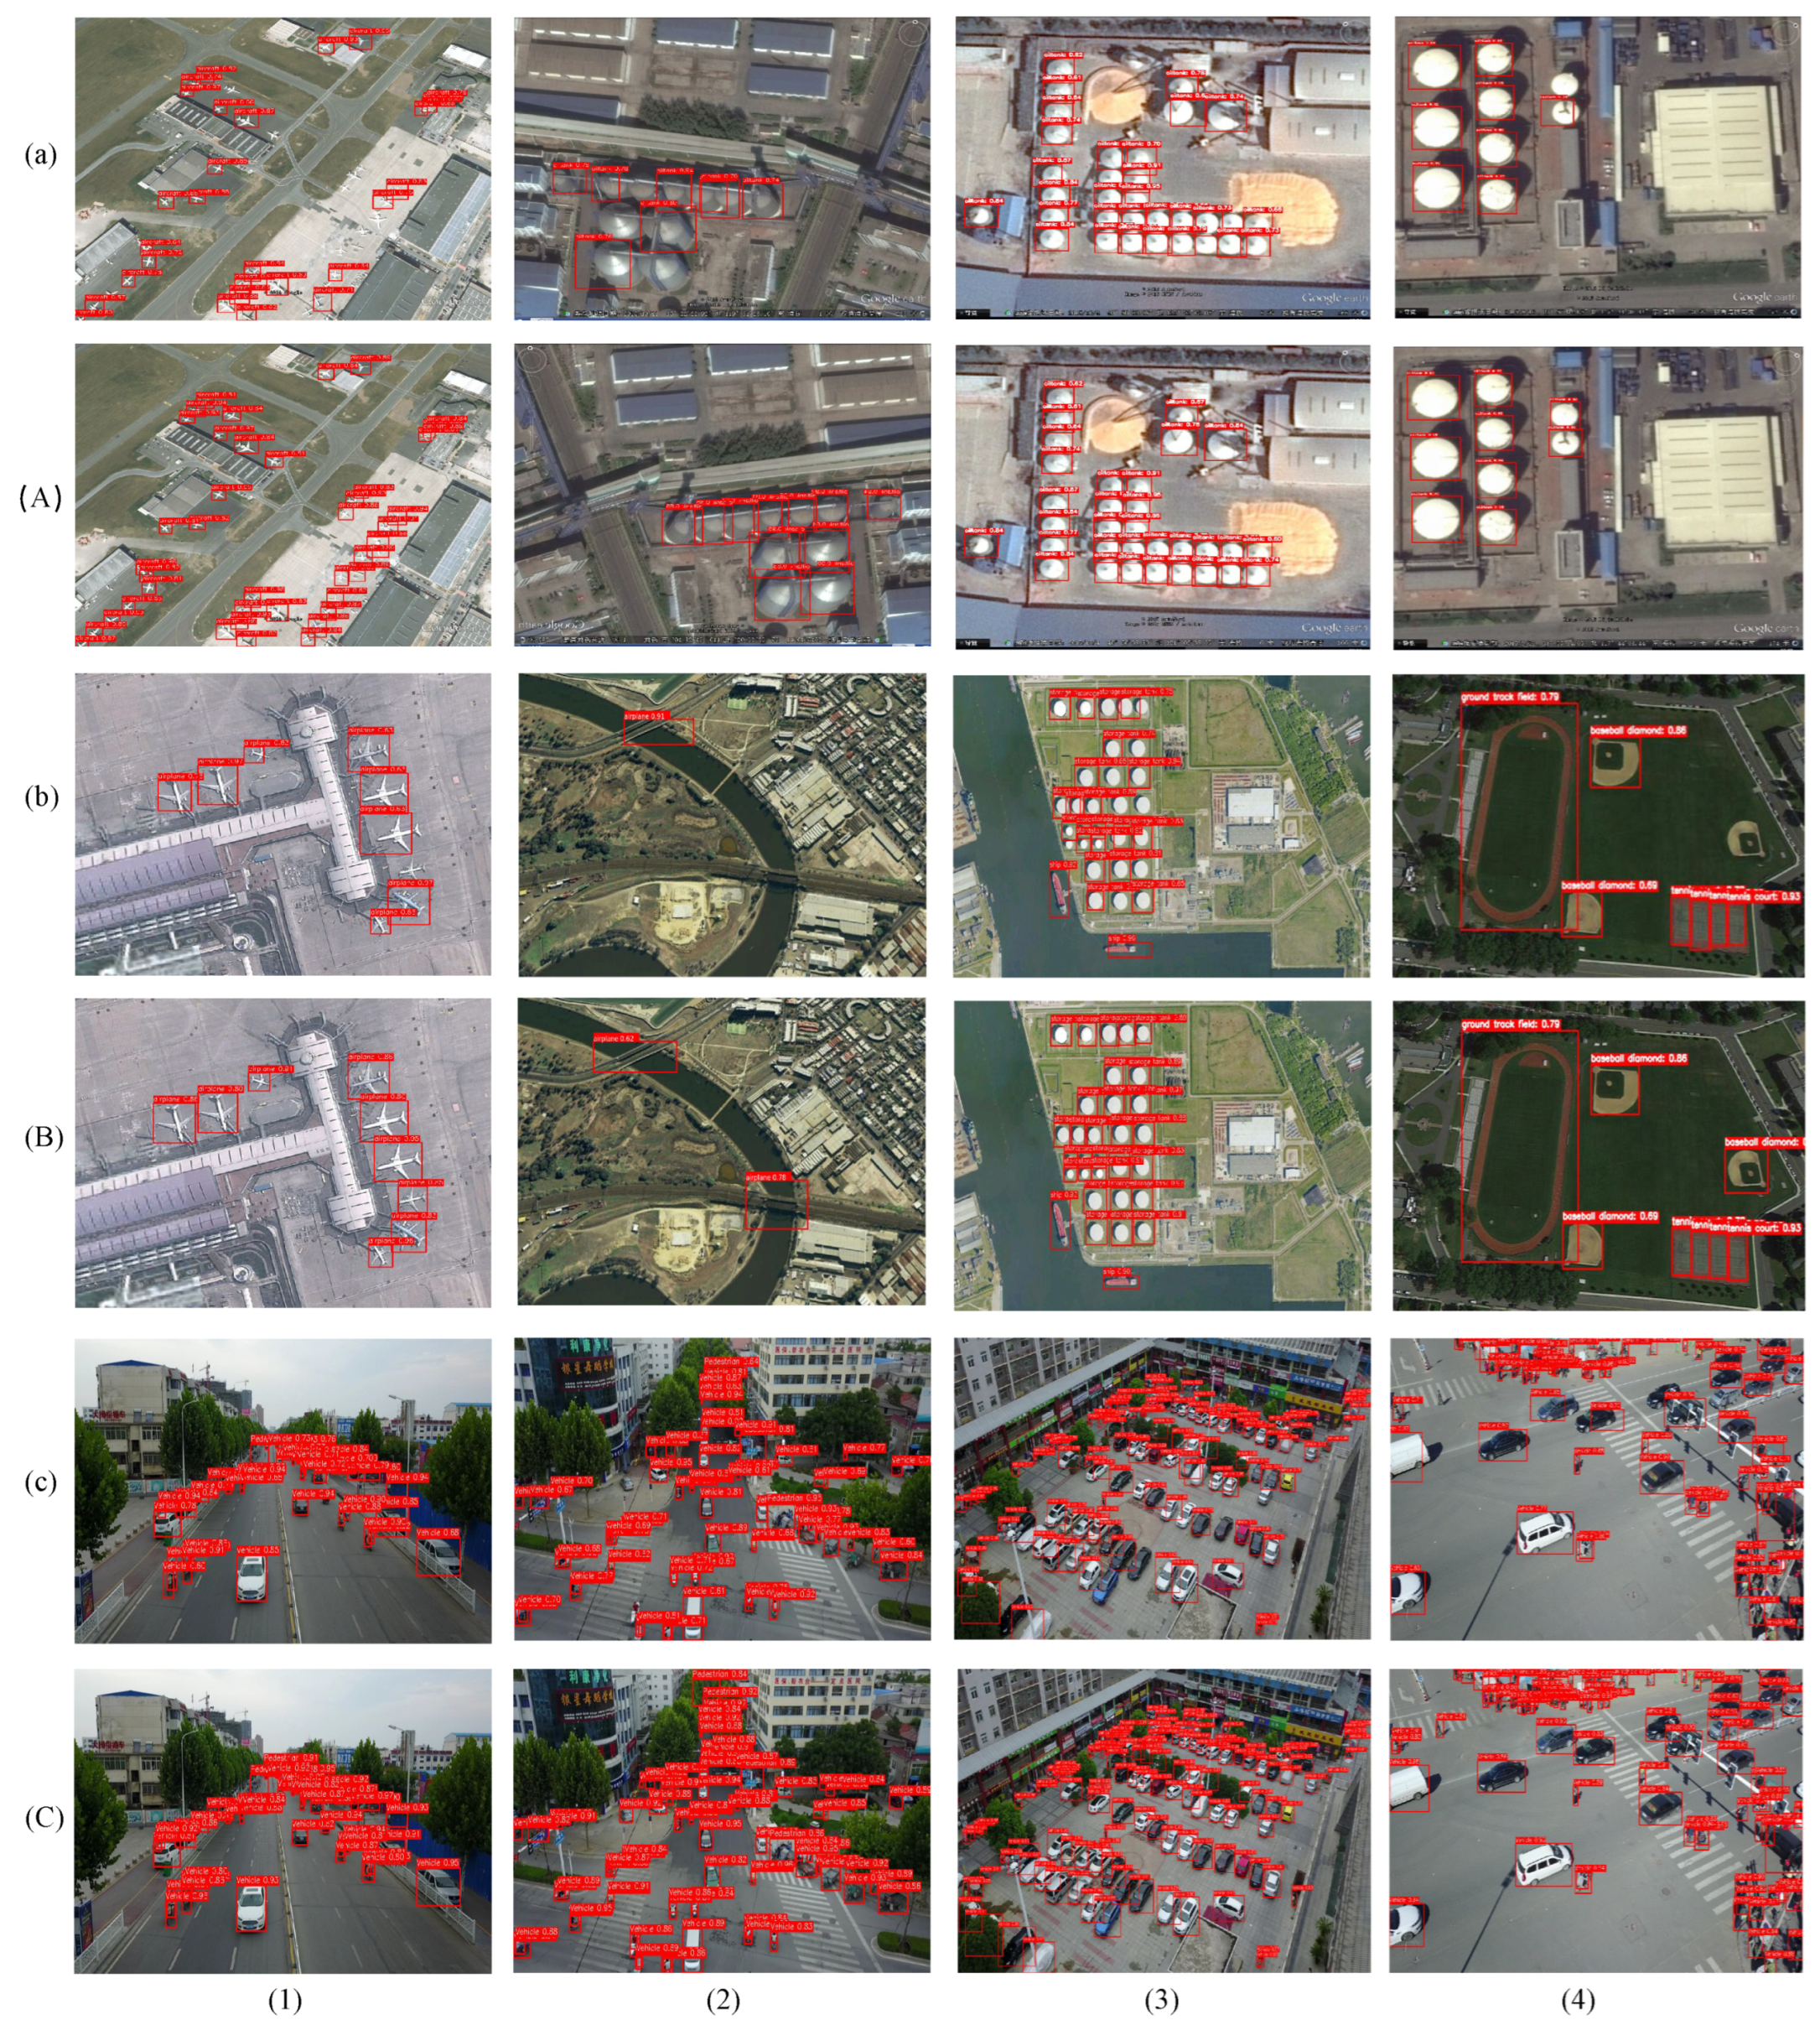
Table 3.
Peformance of HP-YOLOv8 and YOLOv8 on RSOD.
| Model | Class | Aircraft | Oiltank | Overpass | Playground |
|---|---|---|---|---|---|
| YOLOv8 | P | 96.52 | 97.83 | 71.92 | 95.31 |
| R | 91.62 | 94.34 | 70.21 | 96.82 | |
| AP | 95.34 | 97.05 | 68.87 | 98.02 | |
| HP-YOLOv8 | P | 97.23 | 96.85 | 87.42 | 96.65 |
| R | 90.76 | 92.23 | 81.94 | 97.23 | |
| AP | 95.82 | 98.25 | 87.46 | 98.02 |
Table 4.
Peformance of HP-YOLOv8 and YOLOv8 on NWPU VHR-10.
| Model | Class | Bridge | Ground Track Field | Ship | Baseball Diamond | Airplane | Basketball Court | Vehicle | Tennis Court | Harbor | Storage Tank |
|---|---|---|---|---|---|---|---|---|---|---|---|
| YOLOv8 | P | 95.95 | 76.84 | 98.65 | 93.89 | 94.56 | 89.94 | 90.12 | 93.21 | 98.45 | 92.82 |
| R | 80.23 | 54,76 | 94.78 | 92.56 | 85.80 | 70.64 | 64.87 | 85.46 | 99.25 | 82.98 | |
| AP | 90.73 | 64.73 | 99.01 | 95.30 | 92.54 | 85.28 | 67.99 | 91.84 | 96.17 | 86.56 | |
| HP-YOLOv8 | P | 96.87 | 97.56 | 98.4 | 92.34 | 96.45 | 94.87 | 91.96 | 95.45 | 98.78 | 93.71 |
| R | 86.65 | 97.50 | 93.97 | 93.48 | 97.89 | 87.62 | 73.45 | 78.21 | 83.45 | 80.67 | |
| AP | 91.15 | 95.45 | 98.32 | 96.66 | 99.33 | 91.84 | 88.63 | 87.84 | 92.13 | 89.20 |
Table 5.
Peformance of HP-YOLOv8 and YOLOv8 on VisDrone2019.
| Model | Class | Van | Pedestrian | Car | Bicycle | Person | Motor | Bus | Tricycle | Truck | Awning-Tricycle |
|---|---|---|---|---|---|---|---|---|---|---|---|
| YOLOv8 | P | 48.47 | 46.87 | 84.98 | 13.78 | 38.07 | 50.26 | 61.72 | 31.88 | 42.87 | 17.87 |
| R | 38.74 | 35.89 | 71.28 | 8.32 | 26.81 | 41.63 | 52.42 | 23.69 | 30.76 | 10.43 | |
| AP | 42.75 | 41.37 | 76.89 | 11.35 | 29.78 | 44.82 | 56.32 | 26.93 | 35.49 | 14.10 | |
| HP-YOLOv8 | P | 62.86 | 63.56 | 92.43 | 42.65 | 53.78 | 63.41 | 73.90 | 44.98 | 47.88 | 37.65 |
| R | 52.56 | 58.72 | 90.02 | 35.62 | 44.69 | 58.32 | 67.54 | 34.12 | 41.42 | 28.64 | |
| AP | 57.45 | 60.30 | 90.05 | 37.55 | 48.22 | 60.41 | 69.77 | 37.62 | 43.33 | 30.27 |
Table 6.
Ablation Experiment of Different Componets in HP-YOLOv8.
| Model | Params | FPS | P | R | mAP@0.5 | mAP@0.5:0.95 | |||
|---|---|---|---|---|---|---|---|---|---|
| YOLOv8 | C2f-DM | BGFPN | SMPDIoU | ||||||
| ✔ | 43.41M | 75.78 | 89.18 | 89.27 | 89.82 | 57.01 | |||
| ✔ | ✔ | 44.14M | 63.35 | 89.86 | 91.36 | 91.52 | 64.23 | ||
| ✔ | ✔ | 24.61M | 60.49 | 91.78 | 92.41 | 92.56 | 67.78 | ||
| ✔ | ✔ | 43.61M | 75.78 | 90.05 | 91.54 | 91.45 | 64.12 | ||
| ✔ | ✔ | ✔ | 28.52M | 55.46 | 91.89 | 93.78 | 93.98 | 69.78 | |
| ✔ | ✔ | ✔ | ✔ | 28.52M | 55.46 | 92.21 | 94.22 | 95.11 | 72.03 |
Table 7.
Comparison with Different Models.
| Model | mAP@0.5 | mAP@0.5:0.95 | Params | FPS |
|---|---|---|---|---|
| Faster R-CNN [54] | 85.46 | 54.45 | 42.47M | 31.73 |
| Cascade R-CNN [31] | 86.21 | 55.31 | 70.62M | 26.48 |
| CenterNet [32] | 87.79 | 56.14 | 33.34M | 34.37 |
| Dynamic-RCNN [53] | 85.30 | 55.86 | 42.78M | 31.35 |
| LSKNet [37] | 87.74 | 56.35 | 29.88M | 48.75 |
| TPH-YOLO [38] | 90.46 | 57.32 | 53.59M | 56.26 |
| SuperYOLO [39] | 90.78 | 59.30 | 54.66M | 32.21 |
| LAR-YOLOv8 [25] | 92.92 | 61.55 | 28.56M | 54.89 |
| YOLOv8 | 89.82 | 57.76 | 44.60M | 75.78 |
| HP-YOLOv8 (Ours) | 95.11 | 72.03 | 27.52M | 55.46 |
Disclaimer/Publisher’s Note: The statements, opinions and data contained in all publications are solely those of the individual author(s) and contributor(s) and not of MDPI and/or the editor(s). MDPI and/or the editor(s) disclaim responsibility for any injury to people or property resulting from any ideas, methods, instructions or products referred to in the content. |
© 2024 by the authors. Licensee MDPI, Basel, Switzerland. This article is an open access article distributed under the terms and conditions of the Creative Commons Attribution (CC BY) license (http://creativecommons.org/licenses/by/4.0/).
Copyright: This open access article is published under a Creative Commons CC BY 4.0 license, which permit the free download, distribution, and reuse, provided that the author and preprint are cited in any reuse.


