
Submitted:
18 April 2025
Posted:
21 April 2025
You are already at the latest version
Preprints on COVID-19 and SARS-CoV-2
Abstract
The COVID-19 pandemic has significantly transformed the work environment, particularly in the IT sector, where remote and hybrid work models have become prevalent. This research investigates the optimal balance between remote work and office work, focusing on employee well-being, productivity, and burnout. Through surveys conducted with 1003 employees and 252 managers across 46 countries, the study examines the differences in perceptions between employees and managers, the impact of various work modalities on stress and burnout, and the advantages and challenges of remote work. The findings reveal that while remote work offers flexibility and cost savings, it also poses risks such as social isolation and increased stress. The research highlights the importance of a hybrid work model that combines the benefits of both remote and office work, suggesting that employees work from home about 40-50% of the time and spend the remaining days in the office. This approach not only enhances productivity and job satisfaction but also mitigates the negative psychological effects of prolonged remote work. Additionally, the study delves into and proves that hybrid work modalities are not uniform but depend on factors such as job role, age, company size, and other variables. This comprehensive analysis provides practical guidelines for companies to implement effective hybrid work models and support employee well-being in the post-pandemic era.
Keywords:
COVID-19
; Hybrid work
; Public opinion
; Research
; Employee wellbeing
; Burnout
; Organizational Sustainability
; IT Sector
; Communication
1. Introduction
1.1. Research Statement and Its Significance
The COVID-19 pandemic has brought unprecedented changes to the way organizations operate, accelerating the transition to remote work and hybrid work models [1]. The IT sector, known for its digital orientation and agility, quickly adapted to the new circumstances, adopting new forms of work that brought numerous positive effects: increased flexibility, better work-life balance, time and cost savings, enhanced productivity, and access to a broader talent pool [2]. However, the transition to remote work also brought challenges such as social isolation, burnout syndrome, inequality in resource access, and difficulties in maintaining organizational culture [3]. Additionally, the blurring of boundaries between work and private life, hindered communication, and increased workload can lead to chronic stress, negatively affecting employees' physical and mental health [4]. Clearly, understanding the optimal balance between remote work and office work is crucial for creating a sustainable work modality and work environment.
1.2. State of the Art and Research Gap
Although there is a significant body of research on remote work and hybrid work models, most studies focus on the period during the COVID-19 pandemic [5] and immediately after it [6], while very few of them have addressed this issue even before the pandemic [7]. There is as well not enough research that deals with the long-term effects and optimal work models in the post-pandemic period, especially in the context of the IT sector [8]. Additionally, many studies do not take into account the specific needs of companies as well as challenges managers face in relation to employees, nor do they thoroughly address the impact of remote work on stress and burnout.
Existing literature shows numerous benefits of remote work – from home [9], including increased productivity [10] and flexibility [11], but also points to potential negative consequences of isolation [7], hindered communication [12], and conflicts between work obligations and family life [13]. Research has also confirmed the link between remote work and increased stress and burnout [14], while studies on balancing work and private obligations have highlighted the advantages of this form of work [15].
However, most existing research papers lack a comprehensive analysis of the optimal balance between remote work and office work, integrating psychological aspects – especially stress and burnout, as well as differences in perception between employees and managers, across areas of work engagement. The research presented in this paper aims to fill these gaps in the literature, providing a deeper understanding of remote work and hybrid models in the IT sector after the pandemic, with particular attention to the differences in roles in the company and their area of engagement. This research gap represents the motivation for our study.
1.3. Objectives and Expected Contributions of the Research
This research aims to:
- Identify the optimal balance between remote work and office work in the IT sector, considering factors such as productivity, job satisfaction, and employee well-being.
- Examine the differences in perceptions of work modalities between employees and managers responsible for achieving the company's business objectives, given their different responsibilities and communication needs.
- Determine the impact of remote work on stress and burnout among employees based on different roles that they have in the company.
- Analyze the challenges, advantages, and disadvantages of different work modalities.
Based on data collected from 1003 employees and 252 managers from 46 countries (March–October 2024), achieving the set objectives would result in two main contributions:
- A comprehensive evaluation of the benefits and challenges associated with various work modalities in the IT sector, offering critical insights for companies and employees to optimize productivity, well-being, and operational efficiency.
- Identification of factors that contribute to a sustainable work environment resilient to potential future crises and adaptable to the company's business challenges in the post-pandemic era.
The results of this research can contribute to improving the understanding between employees and employers in the IT sector, creating a sustainable work environment through the adoption of modern work modalities.
1.4. Structure of the Paper
The paper is organized into several key chapters. The research methodology, including the description of the sample, data collection, and analysis methods, is presented in Chapter 2. Chapter 3 presents the research results, including the analysis of the frequency of office attendance, work modality preferences among employees and managers, and the integration of data on stress and burnout. Chapter 4 focuses on the interpretation of the findings, highlighting the advantages and challenges of remote work, and discusses specific factors influencing the optimal balance. The discussion also includes a critical analysis of the sample limitations, particularly due to the "snowball sampling" method and geographical constraints and provides recommendations for creating sustainable and resilient work environments in the post-pandemic era. The conclusion summarizes the key findings and contributions of the research, as well as suggestions for future research. The list of references includes the sources used, scientific papers from the mentioned fields, and reference studies and analyses.
Through this research, we aim to contribute to the increasingly relevant literature on remote work and hybrid work models, providing a comprehensive insight into the challenges and advantages of these models, and laying the foundation for further research and practical guidelines for the IT sector.
2. Methodology
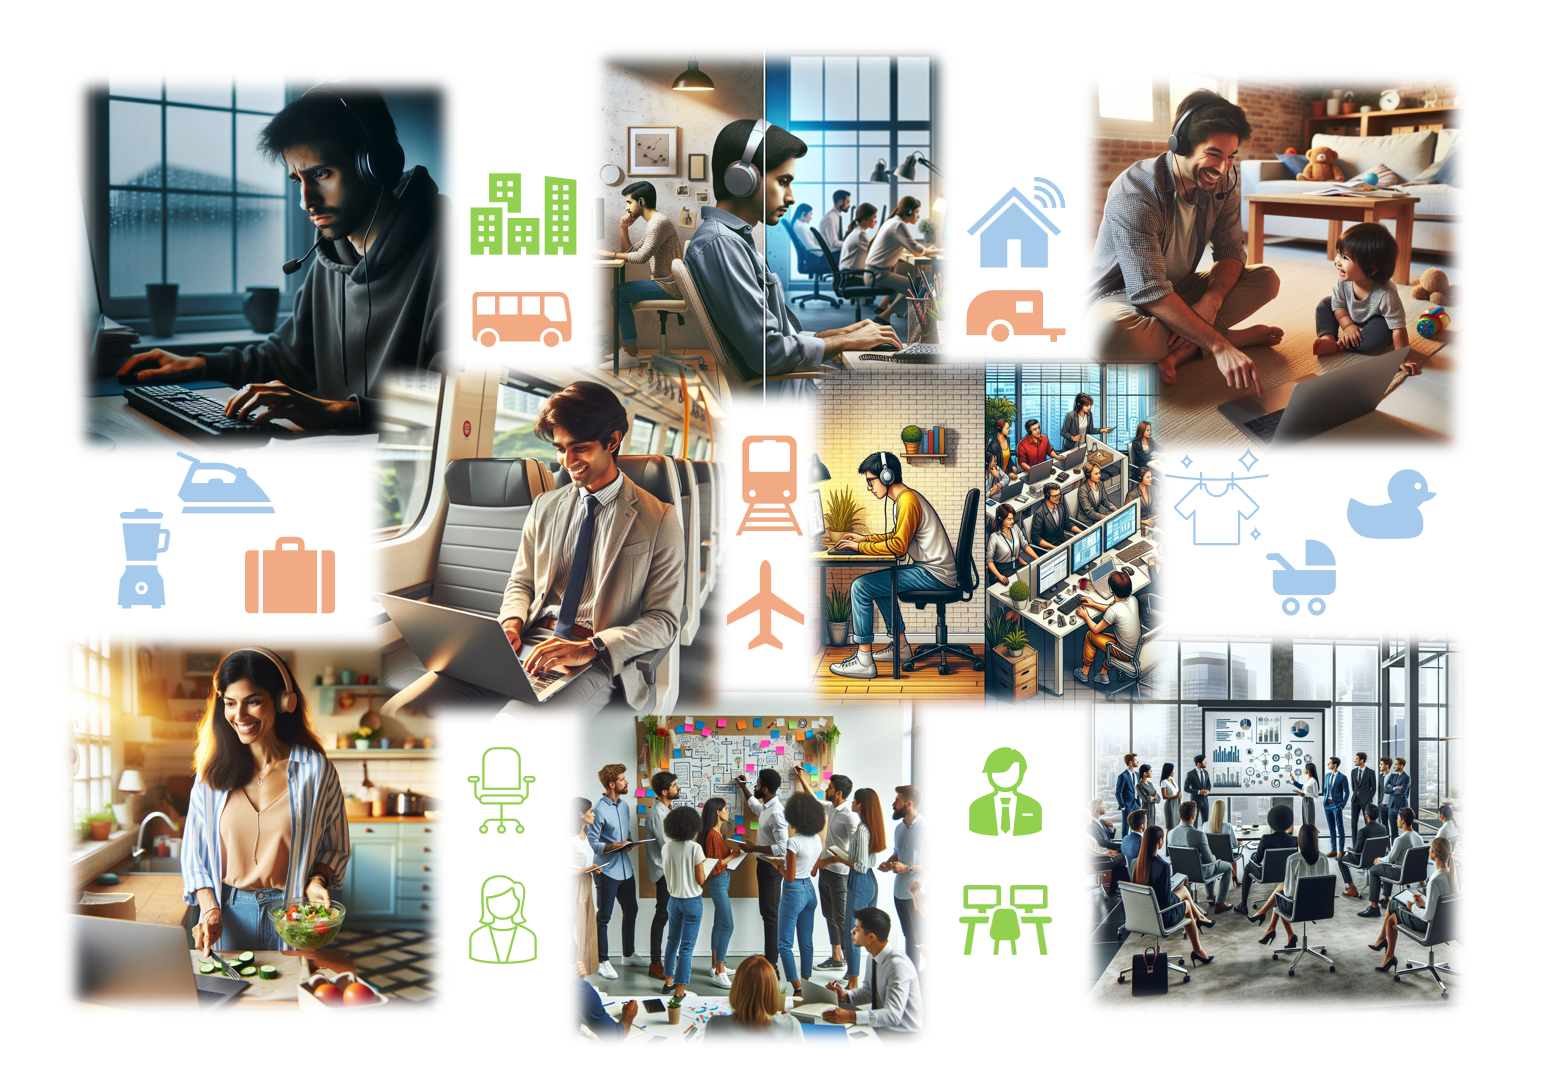
For the purposes of this study, two surveys were conducted. The first survey focused on the diverse experiences of employees in the IT sector, ranging from increased flexibility, comfort of "working from home," time and cost savings, to challenges in separating work and private life and social isolation. The second survey included decision-makers (managers, owners, co-owners) in companies who responded to questions about how their companies adapted to these changes. The surveys were conducted to provide a comprehensive analysis of the effects of "working from home" or "remote work" in the IT sector, specifically in balancing between the strategic goals of companies and optimizing employee engagement and wellbeing.
Both surveys were conducted simultaneously, from March to October 2024. The surveys included 1003 respondents from the "employees" category and 252 respondents from the "managers" category. The research was conducted through an online survey in 46 countries using the SnowBall sampling method until the mapped quotas were met according to territorial dispersion and area of engagement in the IT sector. The territorial structure of respondents from the "managers" category was balanced with the territorial structure of respondents from the "employees" category using weighting, i.e., correcting up to ±2.5%. All manager respondents were from different companies, and the responses pertained to 252 companies.
2.1. Sample Plan Through the Lenses of Country Maturity
The sample plan included the representation of respondents according to the following territorial units: USA, EU, EU candidate countries, and other countries. Based on available sources for the year 2024, the following distribution of employees in the IT sector was derived:
- USA & Canada: ~35–40%; The USA has the largest share of the global IT workforce, with over 9.6 million engaged in various IT fields.
- European Union (EU): ~25–30%; The EU has 9.8 million ICT professionals. It is estimated that globally, the EU accounts for 25–30% of the IT workforce, considering a broader definition of ICT professionals, including those on the user side (e.g. IT department in a bank or manufacturing company).
- EU candidate countries: ~5–7%; EU access candidates constitute a smaller but rapidly growing segment of the global IT sector. Their contribution is estimated at around 5-7% of the global IT workforce, thanks to growing outsourcing markets.
- Other countries (Asia, Latin America, Africa): ~25–30%; This includes IT canters like India, China, and Latin America, which together make up about 25-30% of the global sector. India leads in the outsourcing industry, while Africa and Latin America are experiencing rapid growth due to the rise of freelancing platforms and accelerated digital transformation.
Considering different levels of aggregation and categorization of terms in individual studies, the structure of the IT workforce share according to these mapped territorial units was derived based on the following sources:
- CompTIA State of the Tech Workforce | Cyberstates 2024: This study focuses on the IT industry in the USA [16].
- Publication ICT Specialists in Employment - Statistics Explained From 2013 to 2023 (Statistics Explained, 2024): This provides insights into the scope and structure of IT professionals for EU countries and candidate countries. According to the methodology in this study, IT professionals are individuals capable of developing, managing, and maintaining ICT systems, for whom ICT represents the main part of their job (OECD, 2004), regardless of whether they are employed in IT sector or use IT technologies to perform professional activities in other sectors [17].
- Publication ISC2 Cybersecurity Workforce Study 2024: Global Cybersecurity Workforce Prepares for an AI-Driven World: This study provides an analysis of global trends, especially in the field of cybersecurity [18].
- Deloitte Global Workforce Trends 2024: This study is based on aggregated data and estimates, considering territorial differences in the development of the IT industry and digital transformation [19].
Despite the lack of reliable data on the global distribution of IT professionals by territorial units, or a reliable sampling framework for the global population of IT industry employees, the results presented are sufficiently indicative and provide a good basis for drawing conclusions according to the defined research objectives.
In this regard, all research results are presented according to the development of the IT sector in the countries from which the respondents come, and following Digital Maturity Model [20] as follows:
- Digital Leaders (DA): USA, Canada, Germany, Netherlands, United Kingdom, France, Sweden, Norway, Finland, Switzerland, Singapore, Australia, Ireland, Denmark, Hong Kong, Estonia, United Arab Emirates (UAE), and New Zealand. Countries with the most advanced IT infrastructure, innovation ecosystems, tech exports, and digital economies. They have high internet penetration, strong cybersecurity frameworks, and world-leading tech companies.
- Digital Adopters (DA): Austria, Slovenia, Croatia, Brazil, Poland, Belgium, Portugal, Czech Republic, Slovakia, Hungary, Italy, Romania, India, and Qatar. Countries with well-developed IT sectors and growing digital industries but not yet at the forefront of global tech leadership. They may rely on foreign technologies or have emerging innovation hubs.
- Emerging Digital Nations (EDN): Serbia, Montenegro, Bosnia and Herzegovina, Albania, Russia, Greece, Mexico, Costa Rica, South Africa, Peru, Bulgaria, Puerto Rico, and Brazil. Countries that are rapidly developing their IT sectors but still face challenges in infrastructure, skilled workforce, or digital inclusion. Their tech industries are growing but not globally competitive yet.
Given that countries with advanced indicators show faster IT industry growth due to innovations, government policies, and access to capital [21] [22], the following indicators were used to classify countries by IT industry development: technological infrastructure, investments in research and development, quality of education in STEM fields, success of the startup ecosystem, government support, and global position in the IT industry [23]:
Technological infrastructure: The quality and availability of telecommunications networks (broadband, 5G), digital connectivity, and internet access. Countries with advanced infrastructure usually have better conditions for IT sector development.
Innovations and research: Investments in research and development (R&D), number of patents, and the presence of innovative technologies such as cloud technologies, artificial intelligence (AI), blockchain, big data analytics, quantum computing and others. Countries with a strong R&D base tend to develop the IT industry faster [23].
Education in STEM fields (Science, Technology, Engineering, Mathematics): The quality of the education system, availability of technical education and IT talents, and the number of graduates in relevant fields. A high level of education fosters technological innovations and workforce competence [24]. The quality of technical education and the number of graduates in IT fields significantly impact IT sector development. Countries like China, India, and the USA produce a large number of STEM graduates, which is a key factor for technological development [25].
Startup ecosystem: The number and success of tech startups, access to investments, venture capital funds, and support for entrepreneurship. Dynamic startup ecosystems often indicate rapidly growing IT sectors [22]. The success of startups and access to investments also play an important role. Countries with strong startup ecosystems, such as the USA and Israel, attract significant investments in the IT sector, thanks to support from venture capital funds [26].
Government support and policies: Government policies and strategies focused on digitalization, smart cities, innovations, and technological development. Countries that actively support the IT industry through subsidies, tax incentives, and regulations tend to have faster IT sector growth [21]. Government policies focused on digitalization, smart cities, and technological development enable accelerated IT industry growth. Initiatives such as the American "Raise the Bar" program for improving STEM education represent key strategies for strengthening the IT sector [25].
Global position in the IT industry: The presence of large international technology companies (Amazon Wen Services, Facebook, Google, Microsoft...), technology hubs, and participation in the global IT market [27].
2.2. Sample Plan Through the Lenses of Area of Engagment (Type of the Job) and Gender
The sample plan included the representation of respondents according to the area of their work engagement: Software development, System Architecture, Project Management, Sales/Commercial/Marketing, and Administration/Finance/Resource Management. Globally, the IT sector has the following percentage distribution of job types, based on industry trends, global employment statistics, and market research:
Software (development/programming): ~45-50%. Globally, software development dominates as it is the primary driver of technological advancement. This includes not only developers but also related positions such as QA testers, DevOps and UX engineers, security specialists, etc.
System Architecture: ~10-15%. These roles are crucial in large companies and technology leaders that rely on complex systems. An increasing number of companies are investing in system architecture and design to optimize their operations.
Project Management: ~10-15%. The number of people engaged in project management in IT companies primarily depends on the size and complexity of active projects.
Sales/Commercial/Marketing: ~20-25%. Sales and marketing are globally significant, especially for IT companies that produce software solutions (B2B, B2C, B2G). This percentage tends to grow.
Administration/Finance/Resource Management: ~5-10%. These roles are less represented but necessary to support core functions. Their representation increases with the size of the company, but processes in administration and finance are becoming increasingly automated, reducing the need for the number of employees in these sectors.
This global distribution is derived from available sources and may vary by region. Given that there is no precise statistical distribution of employees by area of work engagement in the IT sector, for the purposes of this study, an estimate was made based on the following sources:
CompTIA (2024). State of the tech workforce 2024 [16]: This report provides a comprehensive overview of the global IT workforce. It focuses on the distribution of technical and business roles in the industry and contains data on employment, skill needs, and growing segments such as software development and security. Key insights: 45% of technical professionals work in IT companies, while 55% work in non-IT sectors using technology. The highest demand is for software developers, data specialists, and IT infrastructure management.
KPMG (2024). Global tech report 2024: Beyond the hype [28]: The report analyses how global technology companies balance between innovation, security, and value in a dynamic environment. The focus is on employment strategies and the distribution of work roles in sectors such as software development, cloud systems, and project management. It particularly highlights the increasing importance of resource management in IT companies and adaptation to new technologies and challenges in hiring qualified professionals.
World Economic Forum (2023). The future of jobs report 2023 [29]: Although broader in focus, this report provides relevant insights into future employment trends in the IT sector, including roles in software development, marketing, and digital transformation, potentials of AI and cloud technology. The analysis includes predictions about future demand for software development and project management.
The study considered reports: Eurostat (2023). ICT specialists in employment - Statistics Explained; Eurostat (2024). ICT sector - value added, employment and R&D and European Institute for Gender Equality. (2023). Employment prospects in the ICT sector and platform work on the structure of employees in the IT sector. According to these sources [17] [30]:
Percentage of employees in the ICT sector: In 2023, 9.8 million people in the EU work in ICT professions, accounting for 4.8% of total employment. The highest share of ICT specialists was recorded in Sweden (8.7%), Luxembourg (8.0%), and Finland (7.6%), while the lowest shares were in Greece (2.4%), Romania (2.6%), and Slovenia (3.8%).
Distribution by sectors: The majority of employees in the ICT sector are engaged in software development, while a smaller part works in telecommunications and ICT equipment manufacturing.
Gender representation: Women make up about 20% of ICT specialists in the EU, with the highest shares in Bulgaria (29.1%), Estonia (26.8%), and Romania (26.0%).
Employment growth: From 2011 to 2021, employment in ICT services increased by 52.8%, while employment in ICT equipment manufacturing decreased by 10.7%.
Although there are no statistically reliable measures of the number and structure of employees in the IT sector globally, data from UNDP (United Nations Development Programme) and ITU (International Telecommunication Union) ITU & UNDP (2024) is very indicative. SDG Digital unlocks commitments to leverage innovation and emerging technologies for a more sustainable, inclusive and responsible future focus on digital transformation and global demand growth for specific skills such as programming, data management, and cybersecurity. Also, for the assessment of the structure of employees in the IT sector, the following sources were considered: UNDP Digital Strategy 2022–2025 (UNDP, 2022) and SDG Digital Agenda (2024) [31] [32].
2.3. Sample Plan Through the Lenses of Company Size
For the purposes of this study, companies were classified by the number of employees based on international standardization set by the European Commission in 2003 (Commission Recommendation of 6 May 2003 concerning the definition of micro, small and medium-sized enterprises (2003/361/EC). Official Journal of the European Union, L 124, 36–41.) as follows:
Small enterprises: Companies with 1 to 49 employees.
Medium-sized enterprises: Companies with 50–249 employees.
The classification of large enterprises into "mid-sized large enterprises" (250 – 1000 employees) and "conglomerates", "multinational corporations" or "corporate giants" (1000+ employees) is not defined by formal internationally adopted statistical categories, but based on the OECD report from 2021 (Entrepreneurship at a glance 2021: Large enterprises and employment distribution. Paris: OECD) and UNCTAD report from 2022 (United Nations Conference on Trade and Development. World Investment Report: Large multinational enterprises and their role in global employment. Geneva 2022.) and for the purposes of this study, large enterprises are classified as follows:
Mid-sized large enterprises (MSLE) with more than 250 employees.
Multinational corporations (MNCs) or "corporate giants" with thousands of employees and a significant share in the global market. They often have a complex structure with branched offices worldwide.
2.3. Sample Plan - Managers
In the research conducted with IT company managers, the management structure separates ownership and executive functions from other management levels [33]. Management levels are determined as follows:
Chief Executive Officer (CEO), often the owner or co-owner. The highest level of responsibility and authority, a special category of management above the classic management levels.
Strategic management implements the goals set by the CEO, owners, and co-owners (regional director, sector director, financial director, operations director).
Tactical management coordinates at the sector level (sales manager, production manager).
Operational management focuses on daily task execution and directly supervises employees (supervisor, team leader).
In all tables, the first row marked with N indicates the sample size or the size of the subsample to which the displayed values in the columns refer. For testing statistical significance within the mapped categories, the Chi-square test was used. In the row marked sig., the Chi-square values are shown. If the Chi-square is less than 0.05, the colored cells contain values that are statistically significantly different from the average (the average refers to the total population and is shown in all tables in the first column Total (%)).
Sample

Table 1.
Employees.
| Company business model | Company according to the number of employees | State / region | Developments of the IT sector | ||||||||||||
| SAMPLE Variables related to companies / environment |
Total | B2C | B2B | Both | Small enterprises | Medium-sized enterprises | Mid-sized large enterprises (MSLE) | Multinational corporations (MNCs) | USA | EU | EU candidates | Other | Most developed | Medium developed | Less developed |
| N | 1003 | 78 | 279 | 646 | 180 | 111 | 153 | 558 | 351 | 301 | 100 | 251 | 598 | 282 | 123 |
| % | 100.0 | 7.8 | 27.8 | 64.4 | 18.0 | 11.1 | 15.3 | 55.6 | 35.0 | 30.0 | 10.0 | 25.0 | 59.7 | 28.1 | 12.2 |
Table 2.
Managers.
| Gender | Age | Management level | Mode of work in the previous year | State / region | Company according to the number of employees | ||||||||||||||||
| SAMPLE |
Total | Male | Female | 27 - 35 | 36 - 45 | 46 - 65 | CEO, owner, co-owner | Strategic | Tactical | Operational | From home | Hybrid | From the company premises | USA | EU | EU candidates | Other | Small enterprises | Medium-sized enterprises | Mid-sized large enterprises (MSLE) | Multinational corporations (MNCs) |
| N | 252 | 153 | 99 | 22 | 106 | 124 | 19 | 49 | 85 | 98 | 40 | 125 | 87 | 88 | 76 | 25 | 63 | 37 | 46 | 75 | 94 |
| % | 100 | 60.8 | 39.2 | 8.8 | 42.0 | 49.2 | 7.6 | 19.5 | 33.9 | 39.0 | 16.0 | 49.5 | 34.4 | 35.0 | 30.0 | 10.0 | 25.0 | 14.8 | 18.2 | 29.6 | 37.4 |
3. Results
As a key research question, we have identified:
What is the optimal balance between remote work and office work in the IT sector?
In analyzing the answers to this question, we considered the frequency of working from home and company premises, employee preferences, the impact of different work modalities on productivity, job satisfaction, and employee well-being, as well as potential differences in the perception of the optimal balance between employees and managers. We also examined the existence of differences in the optimal balance depending on the type of job, company size, or other factors.
According to the research results, employees in the IT sector currently (at the time of the research - from March to October 2024) come to work on average seven times out of approximately 20 working days per month (Chart 1).
We record statistically significant differences according to all observed characteristics of the IT sector employee population, namely gender, age, education, area of work engagement, and time required for commuting. Thus, men go to work on average 7.5 times a month, while women go 6.2 times a month.
The largest differences are recorded according to the age of employees. In addition to the linear decrease in the frequency of going to work with age (18 to 25 years: 11.4 times; 26 to 35 years: 8.5 times; 26 to 45: 6.2 times; 46 to 65 years: 3.8 times), we emphasize that employees from the youngest category go to work / work from company premises exactly three times more days compared to the oldest group.
Employees with a secondary education go to work on average 11.2 times a month, which is twice as much compared to the categories of further (5.5 times) and higher education (5.8 times).
We also record significant differences according to the area of work engagement (type of the role): Employees in administration, finance, and resource management go to work the most (11.6 times a month). They are followed by those engaged in system architecture and design (8.3 times), software development (7.2 times), sales/commercial/marketing (5.8 times). Program/project managers are the least present in company premises (4.3 times a month).
The frequency of going to work linearly decreases with the time required for commuting. Employees who spend up to 30 minutes commuting daily go to work 11.2 times a month, which is significantly more compared to those who need up to 60 minutes (10.0 times), up to 90 minutes (9.2 times), and more than 90 minutes (8.0 times).
In addition to variables related to employees themselves, we also record significant differences in the frequency of going to work according to company characteristics and the broader business environment (Table 3).
As we can see, significantly fewer employees go to work in companies with more than 1000 employees (3.9 times a month) compared to smaller companies (up to 50 employees: 10.5 times a month; 51 to 300 employees: 10.8 times a month; 301 to 1000 employees: 11.4 times a month).
Territorially, the least work is done from company premises in the USA, on average 4.2 times a month, and the most in EU candidate countries (11.6 times a month). Employees in the IT sector in EU member states go to work 8.7 times a month, while in other countries from this scope, they go to work 7.2 times a month.
The frequency of working from company premises linearly decreases with the degree of IT sector development in the observed countries. According to the results of this research, it can be concluded with statistical reliability that the more developed the IT sector, the more oriented it is towards remote work. According to the degree of IT sector development, in countries from the "less developed" category (Emerging Digital Nations – EDN), employees go to work 10.6 times a month, from the "moderately developed" category (Digital Adopters – DA) 8.4 times, and from the "most developed" category (Digital Leaders – DL) only 5.6 times a month.
On the other hand, employees in the IT sector on average state that the optimal (according to them) number of days going to work, i.e., the one they prefer, is about 8.1 days a month (practically one day more than they currently do) (Table 4).
The optimal number of days going to work varies by gender (men 8.4 days; women 7.5 days) and linearly decreases with age (up to 26 years 11.7 days; up to 35 years 9.2 days; up to 45 years 7.2 days; over 46 years 5.6 days) and the time needed for commuting (up to 30 minutes 12.3 days; up to 60 minutes 11.1 days; up to 90 minutes 6.3 days; more than 90 minutes 6.3 days).
Overall, fewer days at work would be optimal for those engaged in system architecture (-0.3 days) and those who need more than 90 minutes for commuting (-1.7 days). Also, fewer working days from company premises would be optimal for those who already work from company premises 11 to 15 times (-0.3 days) or 16 to 20 times (-3.8 days) a month.
The largest positive difference, i.e., the assessment that more working days from company premises would be optimal, is recorded in sales/commercial/marketing (3.6 days) and among those who now come to work up to five times a month (3.1 days).
Territorially, employees in the IT sector worldwide estimate that more days at work would be optimal for them than they currently work, the most in the USA (1.3 days).
Also, employees in countries with the most developed IT industry, who now work from company premises on average 5.6 days a month, estimate that the monthly optimum for them is 6.9 days at work.
Managers in the IT sector go to work on average 12.9 days a month (Chart 2). The frequency of going to work linearly decreases with the age of managers (from 27 to 35 years: 14.4 times a month, from 36 to 45 years: 13.9 times a month; from 46 to 65 years: 11.8 times a month) and the level of management (general director/owner/co-owners: 9.6 times a month; strategic level: 11.5 times a month; tactical level: 12.2 times a month; operational level: 14.8 times a month).
Territorially, just like employees, managers come to work the least in the USA (10.9 times a month), and the most in EU candidate countries (15.8 times a month). Managers in the IT sector in EU member states go to work 14.0 times a month.
Managers also stated how many times a month it would be optimal for employees to work from company premises (Table 5).
According to the surveyed managers, it would be optimal for companies if employees in sales/commercial/marketing and administration/resource management were "physically present" or worked from company premises 13.6 times, employees in project management 12.4 times, in system architecture 11.2 times, and in software development 8.8 times a month.
The opinion that greater "physical presence" is optimal for the company is particularly emphasized in the category of operational management and those managers who predominantly work from the office themselves, as well as among managers from EU candidate countries.
Comparing the results of how many working days a month from company premises would be most suitable for employees, and how many would be optimal for the company according to managers, a general conclusion can be drawn that the interests of employees and the interests of the company regarding "physical presence" mostly do not coincide (Chart 3).
The difference between the current "physical presence" of employees monthly and the optimal according to the company's interests is the smallest in the area of software development (7.3: 8.8) and administration and resource management (11.6: 13.6), somewhat larger in the area of system architecture (8.0: 11.2), and drastically different in sales, commercial and marketing (5.8: 13.6) and project management (4.3: 12.4).
To determine the optimal balance between remote work and office work in the IT sector, we considered that these results should be supplemented with key data and findings related to the assessment of stress and burnout.
By integrating data on stress and burnout into the analysis of the optimal balance between remote work and office work, we can better understand how social aspects affect the preferences of employees in the IT sector and how negative effects can be minimized through hybrid work models. Here is how this integrated analysis is formulated:
3.1. Connection Between Stress, Burnout, and Work Modality Preferences
Research results indicate that employees who work exclusively from home benefit from the flexibility of the workplace, working hours, and life without commuting. However, due to prolonged remote work, 40.9% of employees in this category experience symptoms of depression, laziness, and inertia (Table 6), indicating a higher level of stress and the possibility of burnout. According to the results of this research, employees who work exclusively from home would prefer to go to work at least three times a month (on average) precisely due to the lack of direct business communication and social interaction.
3.2. Connection Between the Frequency of Working from Home and the Level of Burnout Risk
Statistical analyses indicate that employees who work from home too often may have a higher risk of burnout, especially younger employees and those with lower levels of education (where, for example, negative effects in Table 6 are described as a linear function - the younger, the more negative symptoms). On the other hand, employees who successfully apply stress management strategies (Table 7), such as regular breaks, hobbies, and setting boundaries between work and free time, show a greater tendency to work from home, as these measures help them mitigate negative psychological effects and maintain a balance between work and private life.
3.3. Differences Between Employees and Managers
The analysis shows that managers, who on average come to the office 12.9 times a month, have a different experience of stress and burnout compared to employees (who come 7 times a month). This difference, confirmed statistically (p < 0.05), indicates that managers, due to their function requiring more intensive direct communication and control, favour remote work less, and a greater number of days spent in the office allows them to maintain team synergy and reduce psychological burden.
According to the views of managers who represent the company's interests, greater physical presence of employees is needed to achieve better interaction and team dynamics. At the same time, most employees in the IT sector have lost the habit of coming to office every day. When asked what would motivate employees to "return to the office," those who regularly or occasionally work from home (81%) answered, while those who work from company premises every or almost every day were not asked (Table 8).
Out of the total number of employees who regularly or occasionally work from home, almost a third (32.3%) do not mention anything that would bring them back to the office, i.e., they are satisfied with that work modality.
What would primarily attract others to return to the office are new ideas and new projects (41.3%), team buildings (33.4%), and meetings with management about the company's development directions (33.1%). Financial incentives (paid hours spent commuting, paid transportation costs, paid meals, coffee, etc.) would motivate 31.1% of employees.
Financial incentives would mostly motivate younger employees under 26 years old (67%) and those with only a high school diploma (60%) to come to the office more often, so it is assumed that these are precisely the groups that earn less than others in the IT industry.
Additional education would motivate 26% of employees who regularly or occasionally work from home, significantly more women (31%) and younger employees under 26 years old (65%). Business trips would be a motivation for 21.2%, and "casual Friday" would attract 12.6% of those who regularly or occasionally work from home to be more present in company premises.
3.4. Recommendations for Optimal Balance
By integrating the presented research results, it can be concluded that the optimal work balance in the IT sector should combine the advantages of both modalities: a hybrid work model, where employees work about 40-50% of days from home, while the remaining days (about 8 days a month for employees and about 13 days a month for managers) come to the office.
This model allows for the benefits of flexibility and time savings while minimizing the negative social and psychological effects of remote work. Additionally, companies are recommended to support employees in stress management, provide adequate equipment for remote work, and offer emotional/mental wellbeing support & trainings - contributing to reducing burnout and improving overall job satisfaction.
Based on the analysis of responses on what would motivate employees who regularly or occasionally work from home to work more often from company premises, it can be concluded that ambition (new ideas, new projects 41.3%, involvement in company development 33.1%, additional education 26%) has more weight than the social aspect (team buildings 33.4%, business trips 21.2%, and "casual Friday" 12.6%).
In this way, integrating data on stress and burnout into the analysis of the optimal work balance allows for a more comprehensive understanding of the factors affecting employee satisfaction and productivity, which is of utmost interest to the company.
Research results rely on standard statistical methods to prove differences between groups and confirm conclusions about the optimal work balance. Here are some key examples:
- In the research tables, the Chi-square test was applied to compare variables such as the number of days going to work, age groups, education level, and company size. For example, significant differences were observed when comparing the average number of days going to work - younger employees (18-25 years) come to the office on average 11.4 times a month, while older employees (46-65 years) only 3.8 times. These differences, where the p-value is less than 0.05, confirm the statistical significance of the findings.
- Similar statistical evidence was obtained by comparing employees in different types of companies. For example, employees in smaller companies (up to 50 employees) are present in the office on average about 10.5 times a month, while in large companies (over 1000 employees) this number drops to 3.9 times, which is confirmed by the Chi-square test (p < 0.05) and indicates significant differences in perception and practice.
- Additionally, statistical analyses show that managers, who have different functional requirements, come to the office on average 12.9 times a month, which is statistically significantly higher compared to employees (7 times a month). This difference is also supported by statistical tests showing p-values below 0.05.
Based on everything above, using the Chi-square test (as well as analysis of variance - ANOVA, where applicable), the research statistically confirmed that there is a significant difference in the frequency of going to the office among different groups (by age, type of job, company size, etc.). This forms the basis for the conclusion that the hybrid work model, where remote work is combined with a limited number of days in the office, is optimal in the IT sector, as it allows for a balance between flexibility, productivity, and the need for direct communication [34].
These statistical proofs - given the significant differences confirmed by p-values below 0.05 - provide a reliable basis for the claim that the optimal work balance is not uniform but depends on specific factors such as age, area of work engagement, company size, etc.
3.5. Remote Work and Environmental Impact
In addition to analyzing the impact of “working from home” on employees and the sustainability of IT companies, the study also incorporated questions concerning environmental impact. Given that IT companies are predominantly concentrated in large urban areas, the research placed particular emphasis on the issue of commuting and its effects on the environment.
A total of 73% of employees who commute to work at least once a month responded to questions regarding the distance between their home and workplace, the amount of time they spend commuting daily, and the modes of transportation they use.
On average, the distance amounts to 24.3 kilometers (Table 9), while employees spend 72 minutes per day commuting, which represents a significant time burden (Table 10). Given that time is the only non-renewable resource and that modern individuals increasingly lack it, flexible or hybrid work models undeniably have a positive impact on overall quality of life.
- Public transportation vehicles (bus, trolleybus, tram, train, metro) are used by 50.5% of the observed population. The use of public transportation decreases linearly with age: 78% among those aged 18–25, 47% among those aged 26–35, 38% among those aged 36–45, and 35% among those over 46 years old. Slightly more than half (51.7%) commute using a private car (Table 8), with notably higher usage among individuals over 46 years of age (64%) and employees in EU candidate countries (69%). A company car is used for commuting by 9.5%, with significantly higher usage among individuals over 46 years (18%), those with a university degree (15%), and those employed in EU countries (15%). Taxi services are used by 5.8%.
- Given that the question regarding transportation type allowed for multiple responses, aggregated data show that nearly two-thirds (61.8%) of the observed population regularly or occasionally use a car (private, company, or taxi).
- Two-wheelers (bicycles, motorcycles, or scooters) are used by 10.7%.
- Only 1.8% of the observed population have the privilege of walking to work.
According to the results of this study, the total observed population of employees in the IT sector commutes to work an average of 7 times per month, of which 23% work exclusively remotely, meaning they do not commute. Regularly or occasionally working from the company’s premises is reported by 73% of employees, who, on average, commute 9.7 times per month. In this context, it is indisputable that remote work, at the recorded intensity (compared to the usual 20 working days per month), has a significant positive ecological effect. This conclusion primarily stems from the estimate that nearly two-thirds (61.8%) of those who commute to work have the habit of using cars for transportation.
Given that the average distance from home to work is 24.3 km, this means the average employee travels approximately 50 km daily. A fossil-fuel-powered car emits an average of 120 to 150g of CO₂ per kilometer traveled, or 6 to 7.5 kg of CO₂ daily. An average tree (mature, healthy, and of moderate growth) absorbs about 20 kg of CO₂ per year [35]. For comparison, to neutralize 1.4 tons of CO₂, 70 trees would need to “work” for a year to absorb the amount of CO₂ produced by just one employee who commutes to work by fossil fuel-powered car for 220 days annually [36].
Electric vehicles do not emit exhaust gases, significantly reducing local pollution; however, their carbon footprint during operation depends on how the electricity and batteries are produced. If the batteries are charged with energy from coal (as is the case in many parts of the world), they indirectly contribute to CO₂ emissions, as thermal power plants are pollutants [37]. The largest carbon footprint of electric vehicles arises from the production of lithium-ion batteries, which involves the mining of lithium, cobalt, and nickel, accompanied by high energy consumption and the transportation of raw materials and parts. In this context, hybrid and remote work models directly contribute to the reduction of the carbon footprint both for individuals and organizations, as well as for the broader community.
When it comes to resources, cost savings (transportation expenses, clothing, breakfast/lunch at work, etc.) are significant for nearly three-quarters (72.7%) of employees who regularly or occasionally work remotely (Chart 4).
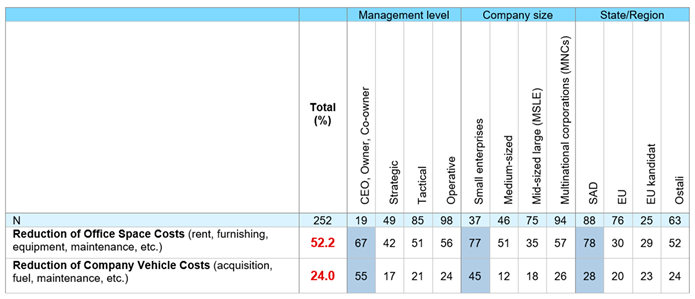
From the managerial perspective, for approximately every second company (52.2%), cost savings related to office space are considered significant, while for one in four companies (24%), savings on company vehicles (acquisition, fuel, maintenance) are relevant. These advantages of remote work are of greatest importance for small companies with up to 50 employees (Table 12).
Synergy represents one of the key factors in the sustainable development of a company, as only through the coordinated efforts of all actors within the business system can results be achieved that exceed the sum of individual contributions. In this context, the same question was posed to both employees and their managers. The question was: “Which work schedule modality is most suitable for achieving a synergistic effect in your company?”
The results indicate that the most common response was the hybrid work model. Furthermore, the data show an almost complete alignment between employees (49%) and their managers (50%) in identifying the hybrid work model as the most favorable for achieving a synergistic effect.
The findings of this research indicate that remote work within the IT sector exerts a demonstrably positive influence on environmental sustainability, which aligns with the broader interests of society. In the post-COVID era, where the majority of employees have largely abandoned the practice of daily commuting, the hybrid work model — when implemented at a level that balances the needs of both employers and employees — emerges as a viable strategy for promoting the sustainable development of companies.
Moreover, this model offers a pathway to maintaining high levels of employee satisfaction and engagement over the long term, while simultaneously contributing to the reduction of the ecological footprint associated with conventional work arrangements.
4. Discussion
The research aimed to determine the optimal balance between remote work and office work in the IT sector, considering the frequency of working from home, employee and manager preferences, the impact on productivity, job satisfaction, and employee well-being. Despite the sample limitations (snowball sampling method and geographical constraints), the obtained results provide valuable insights into how the IT sector adapts to new working conditions in the post-pandemic period.
4.1. Hybrid Work Model and Preferences
The hybrid work model, which combines the advantages of both modalities, working from home and working in company premises, allows employees to benefit from flexibility, particularly time savings, which is of exceptional importance for the modern, urban individual. At the same time, the hybrid work modality does not compromise the necessary direct communication and team dynamics. This model has proven to be particularly effective in reducing the negative psychological effects of prolonged remote work, such as stress and burnout.
In addition to confirming these general benefits of the hybrid model, the research provided some specific insights:
- Differences in perception between employees and managers: Employees, on average, come to the office 7 times a month, preferring 8.1 days of office work per month (on average). The research results indicate that managers and employees are not aligned regarding the frequency of office work. According to managers, it would be optimal for companies if employees in sales/commercial/marketing and administration/resource management worked from company premises 13.6 times, project management employees 12.4 times, system architecture employees 11.2 times, and software employees 8.8 times a month. These differences highlight the need for a flexible approach and hybrid models tailored to specific roles and tasks.
- Impact of age and stress management strategies: Younger employees and those with less developed stress management strategies are more susceptible to the negative effects of remote work. This underscores the importance of investing in employee wellbeing support programs and developing healthy work habits.
- Importance of formal interactions: The research results indicate that employees would be significantly more motivated to increase their physical presence if they were involved in the development of new ideas, new projects, additional education, and the overall development of the company.
- Importance of informal interactions: The research confirmed that the lack of informal interactions can negatively impact team cohesion and innovation. Companies should encourage informal interactions through social gatherings, team-building activities, and other events.
Differences in preferences also arise depending on age structure, functional role (employee's job position), and commuting time. For example, younger employees (up to 26 years old) tend to prefer office work more frequently, while older employees (over 46 years old) and those with longer commuting times prefer remote work.
4.2. Advantages and Disadvantages of Remote Work
- Advantages of Remote Work:
- Greater flexibility in working hours and better work-life balance.
- Time and cost savings, particularly due to reduced or eliminated commuting.
- Of particular importance to companies, especially in the globally oriented IT sector, is the ability to access a broader talent pool.
Disadvantages of Remote Work:
- Limited communication and lack of informal interactions, which can negatively impact team synergy and innovation.
- Increased feelings of isolation and loneliness, especially for those who do not have adequate conditions for working from home.
- Blurring of boundaries between work and free time, which can lead to increased stress and burnout.
4.3. Impact on Stress and Burnout
A special value of this research is the finding that 40.9% of respondents report negative psychological symptoms (depression, laziness, inertia) when working exclusively from home for extended periods. This finding indicates that, although remote work brings numerous benefits, insufficient social interaction and prolonged periods of isolation can lead to increased stress. At the same time, employees who apply effective stress management strategies (regular breaks, hobbies, clear boundaries between work and private life) show a greater tendency to work from home. Managers, due to more complex tasks and the need for team coordination, also experience different levels of stress but prefer a greater number of days spent in the office to maintain team dynamics and personal contact.
4.4. Research Limitations
Limitations of the obtained results:
- The methodology includes the sampling method ("snowball sampling") and potential limitations regarding representativeness. A more detailed discussion of these limitations and their impact on results and conclusions follows.
Reasons why the sample is not fully representative:
- Snowball sampling: This sampling method can lead to bias in the sample, as respondents are recruited through personal contacts and networks.
- Self-selection: Respondents decided for themselves whether to participate in the research, which can lead to bias in favor of those more interested in the research topic.
- Limited geographical coverage: Although the research covered 46 countries, predominantly from the USA, Canada, and Europe, the results cannot be considered globally representative, as a significant portion of the IT population in, for example, India, China, and parts of Asia were not included.
Despite not being fully representative, this research still makes a significant contribution to understanding remote work and hybrid work models in the IT sector. Here are some key points highlighting the significance of the research:
- Sample size: Despite limitations in representativeness, the sample of 1003 employees and 252 managers is still a significant dataset for analysis.
- Expected homogeneity within mapped categories: The research design and sampling plan mapped groups of respondents where homogeneity in attitudes towards research questions was expected (gender, age, education level, area of work engagement, work modality, degree of IT sector development).
- Relevance of the topic: Remote work and hybrid work models are highly prevalent in the IT sector, and this research provides valuable information on experiences, challenges, and benefits of these work models. Several IT giants (e.g., Amazon Web Services, Tesla, etc.) have introduced a new office work policy in 2024. and now employees must come to the office every day, eliminating any possibility of hybrid work. Based on the research, we can conclude that such an extreme is also not the best solution. On the other hand, many companies are struggling to bring employees back to the office, making this topic increasingly interesting for further research.
- Focus on long-term implications: The research not only focuses on the current state but also on the implications of remote work and hybrid work models on organizational culture, employee well-being, and the future of work in the IT sector.
4.5. Summary of the Discussion
By integrating all of the obtained findings, it can be concluded that the hybrid work model provides an effective compromise between flexibility and the need for direct communication. Additionally, companies are recommended to:
- Invest in stress management strategies – Regular breaks, adequate equipment for working from home, emotional support, and training on employee mental well-being protection and preservation.
- Flexible implementation of the hybrid model – Adjusting work modalities according to age structure, type of job, company size, and geographical conditions.
- Maintaining team synergy – Regular in-person meetings and informal interactions, especially for teams where innovation and collaboration are essential.
By integrating the presented results, it can be unequivocally concluded that at this level of development of information and communication technologies and the lifestyle of the modern individual, where time is an extremely important resource, the hybrid work model represents the optimal approach in the IT sector.
In this regard, for a sustainable work environment resilient to crises and business challenges in the IT sector, it is necessary to combine the benefits of remote work and office work, continuously adapting to job specifics. These findings provide a basis for further development of practices that will optimize productivity, job satisfaction, and the overall well-being of the IT sector.
With the implementation of the hybrid work model, companies are recommended to invest in stress management strategies and mental wellbeing practices for employees.
This study contributes to the growing body of literature on remote work and hybrid work models in the IT sector. The research results have practical implications for companies, managers, and employees, providing guidelines for successful implementation and management of remote work. The limitations of the research open space for further studies that would address specific aspects of remote work and hybrid work models in the IT sector, particularly in the context of different cultures, legal regulations, and technology availability.
4.6. Future Research Directions
This research opens space for further studies that would address specific aspects of remote work and hybrid work models in the IT sector. Here are some future research directions:
Expanding the sample and methods: Future research should be based on a broader range of IT sector employees to include different cultural and legal contexts (e.g. China & India). This would enable a deeper understanding of the impact of cultural and legal factors on the optimal balance between remote work and office work.
Long-term consequences: It is necessary to monitor the effects of hybrid work over a longer period, with a particular focus on professional development, creativity, and innovation. Longitudinal studies would provide valuable information on the impact of work modalities on individuals and organizations.
Role of leadership and organizational culture: Further research can delve deeper into how leadership styles and organizational culture influence the implementation of different work modalities in practice.
The authors of this research aim to contribute to the creation of sustainable work strategies in the IT sector based on flexibility, psychological well-being, and effective team coordination through their conclusions, proposals, and recommendations.
5. Conclusions
This research aimed to identify the optimal balance between remote work and office work in the IT sector, considering various factors such as the frequency of working from home, employee preferences, areas of work engagement, job satisfaction, and employee well-being. Through the analysis of data collected from 1003 employees and 252 managers from 46 countries, the research provided valuable insights into the experiences and preferences of employees and managers in the IT sector regarding remote work and office work. Despite the limitations in terms of complete representativeness of the "snowball sampling" method, the findings offer important insights into how the IT sector adapts to modern working conditions.
What we did:
- Identified key factors influencing work preferences – age structure, employee role, company size, and IT sector development.
- Examined differences between employees and managers, particularly regarding the optimal frequency of office attendance.
- Included psychological aspects of remote work (stress and burnout), analyzing their connection with different work modalities.
Key findings of the research indicate the following:
- The hybrid work model, which combines remote work and office work, represents the optimal approach for most employees and managers in the IT sector.
- The optimal balance is not uniform but depends on specific factors such as demographic variables of IT sector employees, employee role, company size, and geographical characteristics.
- Managers and employees have different preferences regarding the balance between remote work and office work, with managers more frequently preferring office work.
- Remote work can have positive effects on flexibility and work-life balance, but also negative effects on employees, particularly in terms of stress and burnout.
- We demonstrated that this model, besides benefiting the quality of life of employees, does not compromise their productivity.
- Offered practical guidelines for companies regarding the implementation of the hybrid model, emphasizing the importance of stress management strategies, clear communication, and adaptation to the specific needs of different teams.
Based on these findings, the research provided the following recommendations:
- IT sector companies should implement or adapt the existing hybrid work model, considering the specific needs of their employees.
- It is important to invest in adequate equipment for remote work, stress management strategies, and mental wellbeing support.
- Regular in-person meetings, formal and informal interactions should be encouraged, especially in project development phases where innovation and collaboration are essential.
Author Contributions
Milos Loncar: Conceptualization, Investigation, Project administration, Writing - original draft, Writing - review & editing, Jovanka Vukmirovic: Data curation, Formal analysis, Investigation, Writing - review & editing; Aleksandra Vukmirovic: Data curation, Project administration, Visualization; Dragan Vukmirovic: Conceptualization, Methodology, Supervision; Ratko Lasica: Methodology, Validation
Funding
“This research received no external funding”
Institutional Review Board Statement
The study was conducted in accordance with the Declaration of Helsinki, and approved by the Institutional Review Board of Faculty of Organizational Sciences, University of Belgrade, Serbia (Reference No: 05-02 no. 3/156 Date: February 15, 2024 in Belgrade).
Informed Consent Statement
Informed consent was obtained from all participants involved in the study.
Data Availability Statement
The data presented in this study are available upon request from the corresponding author
Acknowledgments
The authors would like to thank everyone who contributed to this study.
Conflicts of Interest
The authors declare no conflict of interest.
References
- Yang, E.; Kim, Y.; Hong, S. Does working from home work? Experience of working from home and the value of hybrid workplace post-COVID-19. J. Corp. Real Estate 2023, 25, 50–76. [Google Scholar] [CrossRef]
- Shankar, K. The impact of COVID-19 on IT services industry-expected transformations. British Journal of Management, 2020, 31, 450. [Google Scholar] [CrossRef]
- Al-Habaibeh, A.; Watkins, M.; Waried, K.; Javareshk, M.B. Challenges and opportunities of remotely working from home during Covid-19 pandemic. Glob. Transit. 2021, 3, 99–108. [Google Scholar] [CrossRef] [PubMed]
- Xiao, Y.; Becerik-Gerber, B.; Lucas, G.; Roll, S.C. Impacts of working from home during COVID-19 pandemic on physical and mental well-being of office workstation users. J. Occup. Environ. Med. 2021, 63, 181–190. [Google Scholar] [CrossRef] [PubMed]
- Dockery, M.; Bawa, S. Working from Home in the COVID-19 Lockdown. BCEC 2020, 19, 1–5. [Google Scholar]
- McPhail, R.; Chan, X.W.; May, R.; Wilkinson, A. Post-COVID remote working and its impact on people, productivity, and the planet: An exploratory scoping review. The International Journal of Human Resource Management, 2024, 35, 154–182. [Google Scholar] [CrossRef]
- Green, N.; Tappin, D.; Bentley, T. Working from home before, during and after the Covid-19 pandemic: Implications for workers and organisations. New Zealand J. Employ. Relat. 2020, 45, 5–16. [Google Scholar] [CrossRef]
- De Vries, K.; Erumban, A.; van Ark, B. Productivity and the pandemic: Short-term disruptions and long-term implications: The impact of the COVID-19 pandemic on productivity dynamics by industry. Int. Econ. Econ. Policy 2021, 18, 541–570. [Google Scholar] [CrossRef]
- Alipour, J.V.; Fadinger, H.; Schymik, J. My home is my castle–The benefits of working from home during a pandemic crisis. Journal of Public Economics 2021, 196. [Google Scholar] [CrossRef]
- Bloom, N.; Liang, J.; Roberts, J.; Jenny Ying, Z. Does Working from Home Work? Evidence from a Chinese Experiment. The Quarterly Journal of Economics 130.
- Williamson, S.; Pearce, A. COVID-normal workplaces: Should working from home be a ‘collective flexibility’? J. Ind. Relat. 2022, 64, 461–473. [Google Scholar] [CrossRef]
- Bodenheimer, M.; Leidenberger, J. COVID-19 as a window of opportunity for sustainability transitions? Narratives and communication strategies beyond the pandemic. Sustain. : Sci. Pract. Policy 2020, 16, 61–66. [Google Scholar] [CrossRef]
- Laß, I.; Wooden, M. Working from Home and Work–Family Conflict. Work Employ. Soc. 2023, 37, 176–195. [Google Scholar] [CrossRef]
- Hayes, S.W.; Priestley, J.L.; Moore, B.A.; Ray, H.E. Perceived stress, work-related burnout, and working from home before and during COVID-19: An examination of workers in the United States. Sage Open 2021, 11, 21582440211058193. [Google Scholar] [CrossRef]
- Graham, M.; Weale, V.; Lambert, K.A.; Kinsman, N.; Stuckey, R.; Oakman, J. Working at home: The impacts of COVID 19 on health, family-work-life conflict, gender, and parental responsibilities. J. Occup. Environ. Med. 2021, 63, 938–943. [Google Scholar] [CrossRef] [PubMed]
- CompTIA. Avaiable online: https://www.comptia.org/content/research/state-of-the-tech-workforce. (accessed on 14.03.2025).
- Eurostat. ICT specialists in employment – Statistics Explained, 2023.
- ISC2 Cybersecurity Workforce Study, Global Cybersecurity Workforce Prepares for an AI-Driven World, 2024.
- Deloitte, 2024 Global Workforce Trends, 2024.
- Digial Maturity Model, Achieving digital maturity to drivengrowth. Deloitte. 2018.
- Ragnedda, M.; Muschert, G. The Digital Divide The Internet and Social Inequality in International Perspective, Publisher: Taylor & Francis. 2013.
- Granata, G.; Scozzese, G. The Actions of e-Branding and Content Marketing to Improve Consumer Relationships. European Scientific Journal 2019, 15. [Google Scholar] [CrossRef]
- Kuzior, A.; Kwilinski, A. Cognitive Technologies and Artificial Intelligence in Social Perception. Management Systems in Production Engineering 2022, 30, 109–115. [Google Scholar] [CrossRef]
- Wenger, E. Communities of practice: Learning, meaning, and identity. Cambridge University Press, 1988. [Google Scholar] [CrossRef]
- U.S. Department of Education, 2022.
- SpringerOpen, Advancing the transition to open access (OA), Springer Nature’s 2022 OA Report, 2022.
- Ardley, B.; McIntosh, E. Business strategy and business environment: The impact of virtual communities on value creation. Wiley Online Library, Volume 28, Issue5. Special Issue:Firms after the Financial Crisis, 2019. [CrossRef]
- KPMG. Global tech report 2024: Beyond the hype. 2024.
- World Economic Forum. The future of jobs report. 2023.
- Eurostat. ICT sector – value added, employment and R&D, 2024.
- UNDP, UNDP Digital Strategy 2022–2025, 2022.
- SDG Digital Agenda, 2024.
- Robbins, S.P.; Coulter, M. Management. Publisher: Pearson, ISBN: 9781292215839, 2018.
- Parent-Thirion, A.; Fernández Macías, E.; Hurley, K.; Vermeylen, G. Europian Foundation for the Improvement of Living and Workspace Conditions, Fourth European Working Conditions Survey, 2007.
- U.S. Environmental Protection Agency.Greenhouse Gas Equivalencies Calculator https://www.epa.gov/energy/greenhouse-gas-equivalencies-calculator, (2016).
- European Environment Agency.Average CO₂ emissions from newly registered motor vehicles https://www.eea.europa.eu/en/newsroom/news/average-co2-emissions-from-newly, (2022).
- International Energy Agency. (2020). Global EV Outlook 2020: Entering the decade of electric drive? IEA. https://www.iea.org/reports/global-ev-outlook-2020.
Chart 1.
EMPLOYEES: Out of (approximately) 20 working days, how many times per month do they go to workplace / work in the company's premises (average).
Chart 1.
EMPLOYEES: Out of (approximately) 20 working days, how many times per month do they go to workplace / work in the company's premises (average).
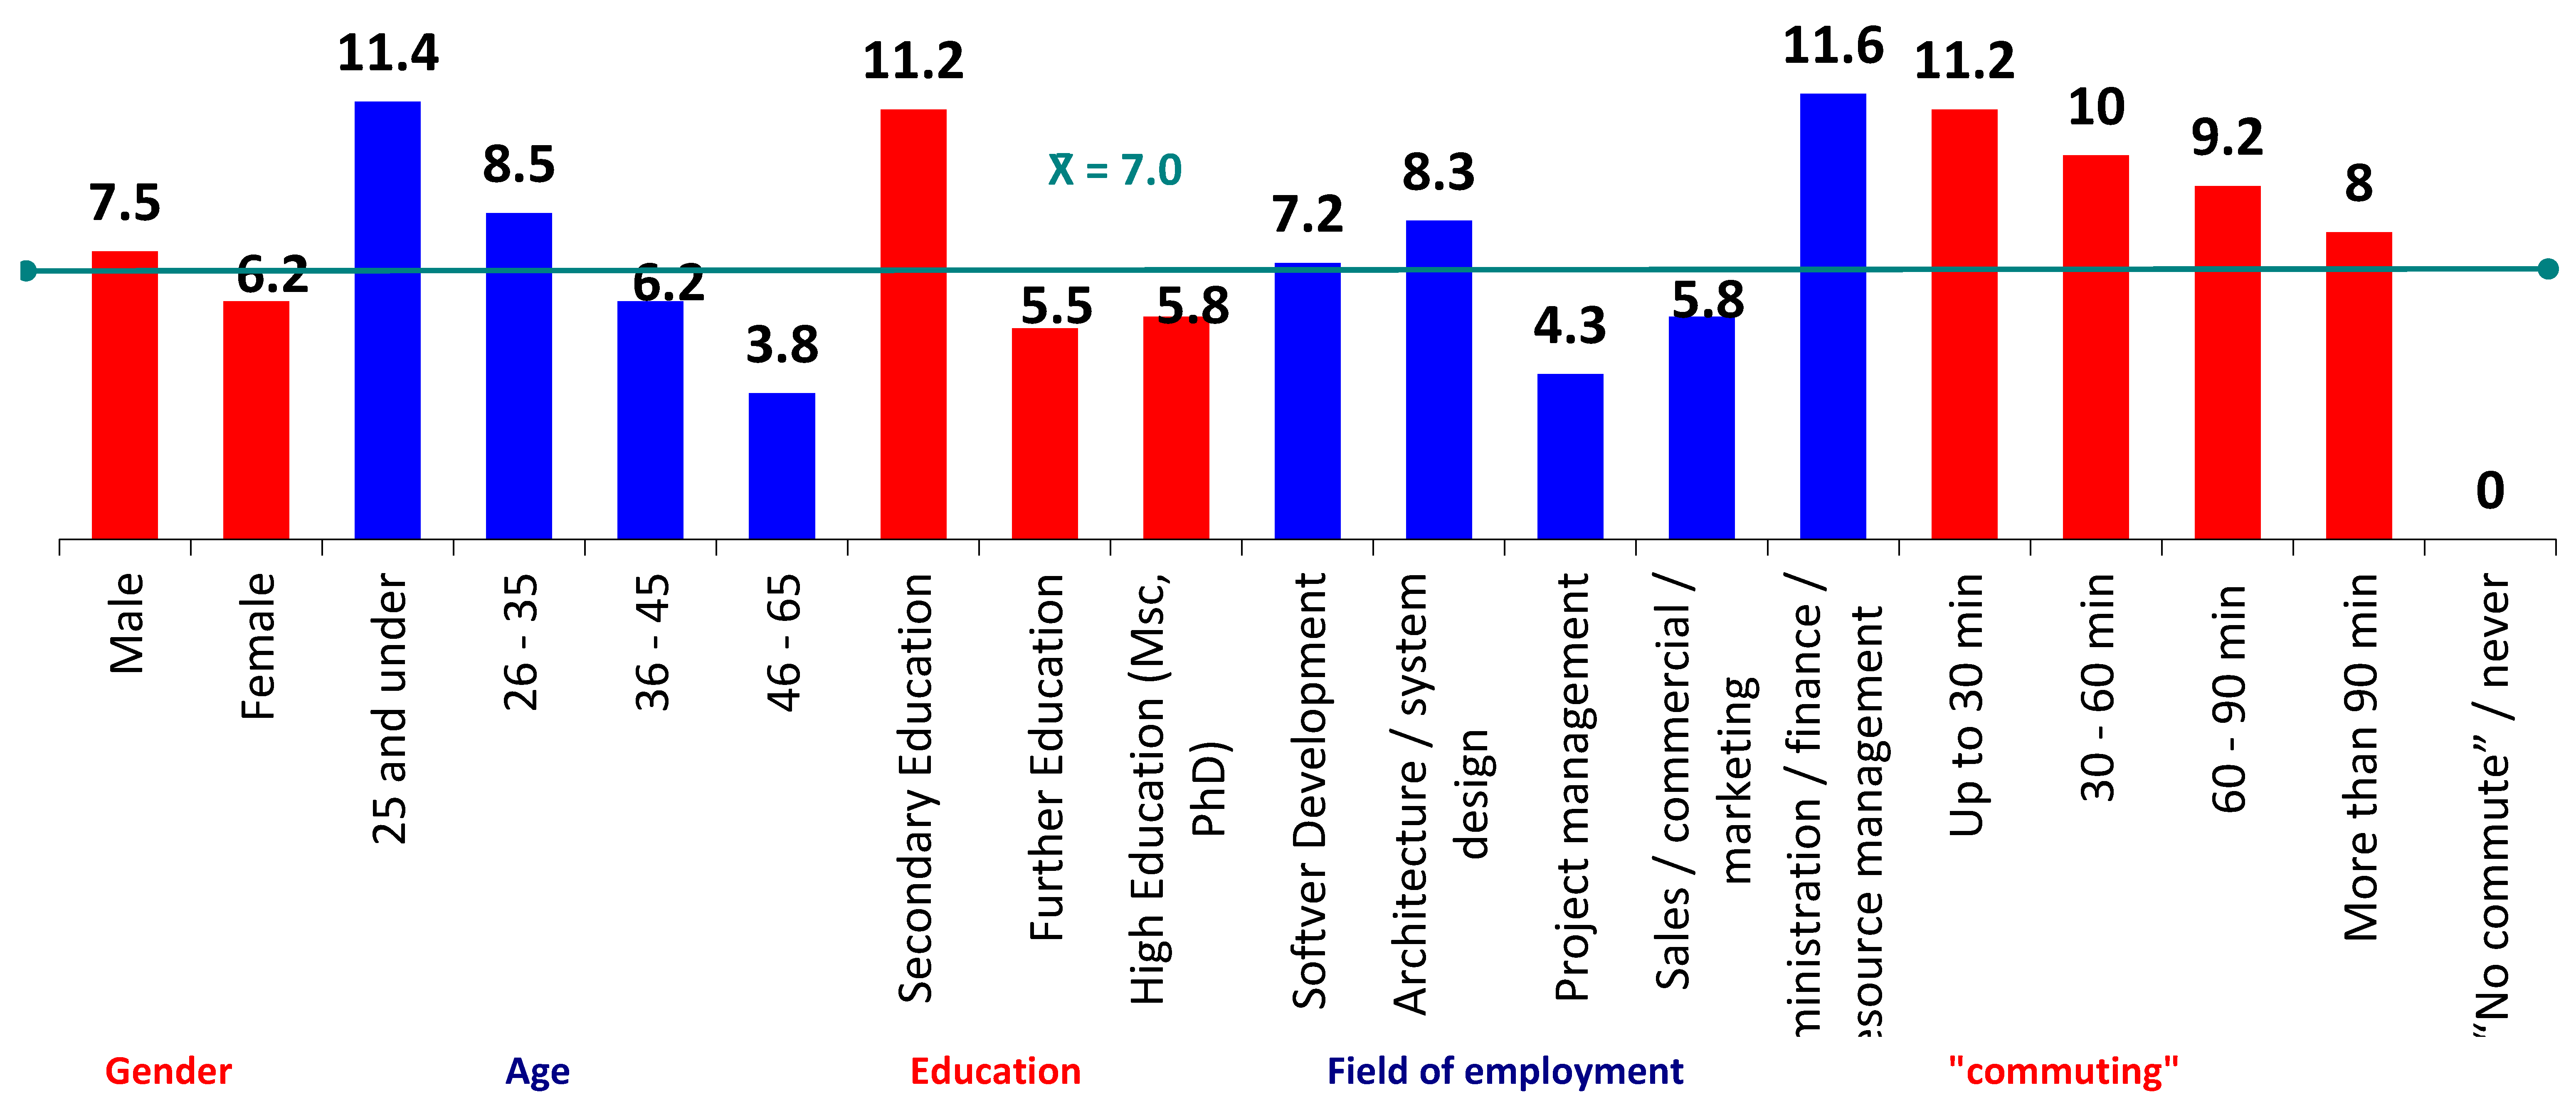
Chart 2.
MANAGERS: Out of (approximately) 20 working days, how many times per month do they go to work / work in the company's premises (average).
Chart 2.
MANAGERS: Out of (approximately) 20 working days, how many times per month do they go to work / work in the company's premises (average).
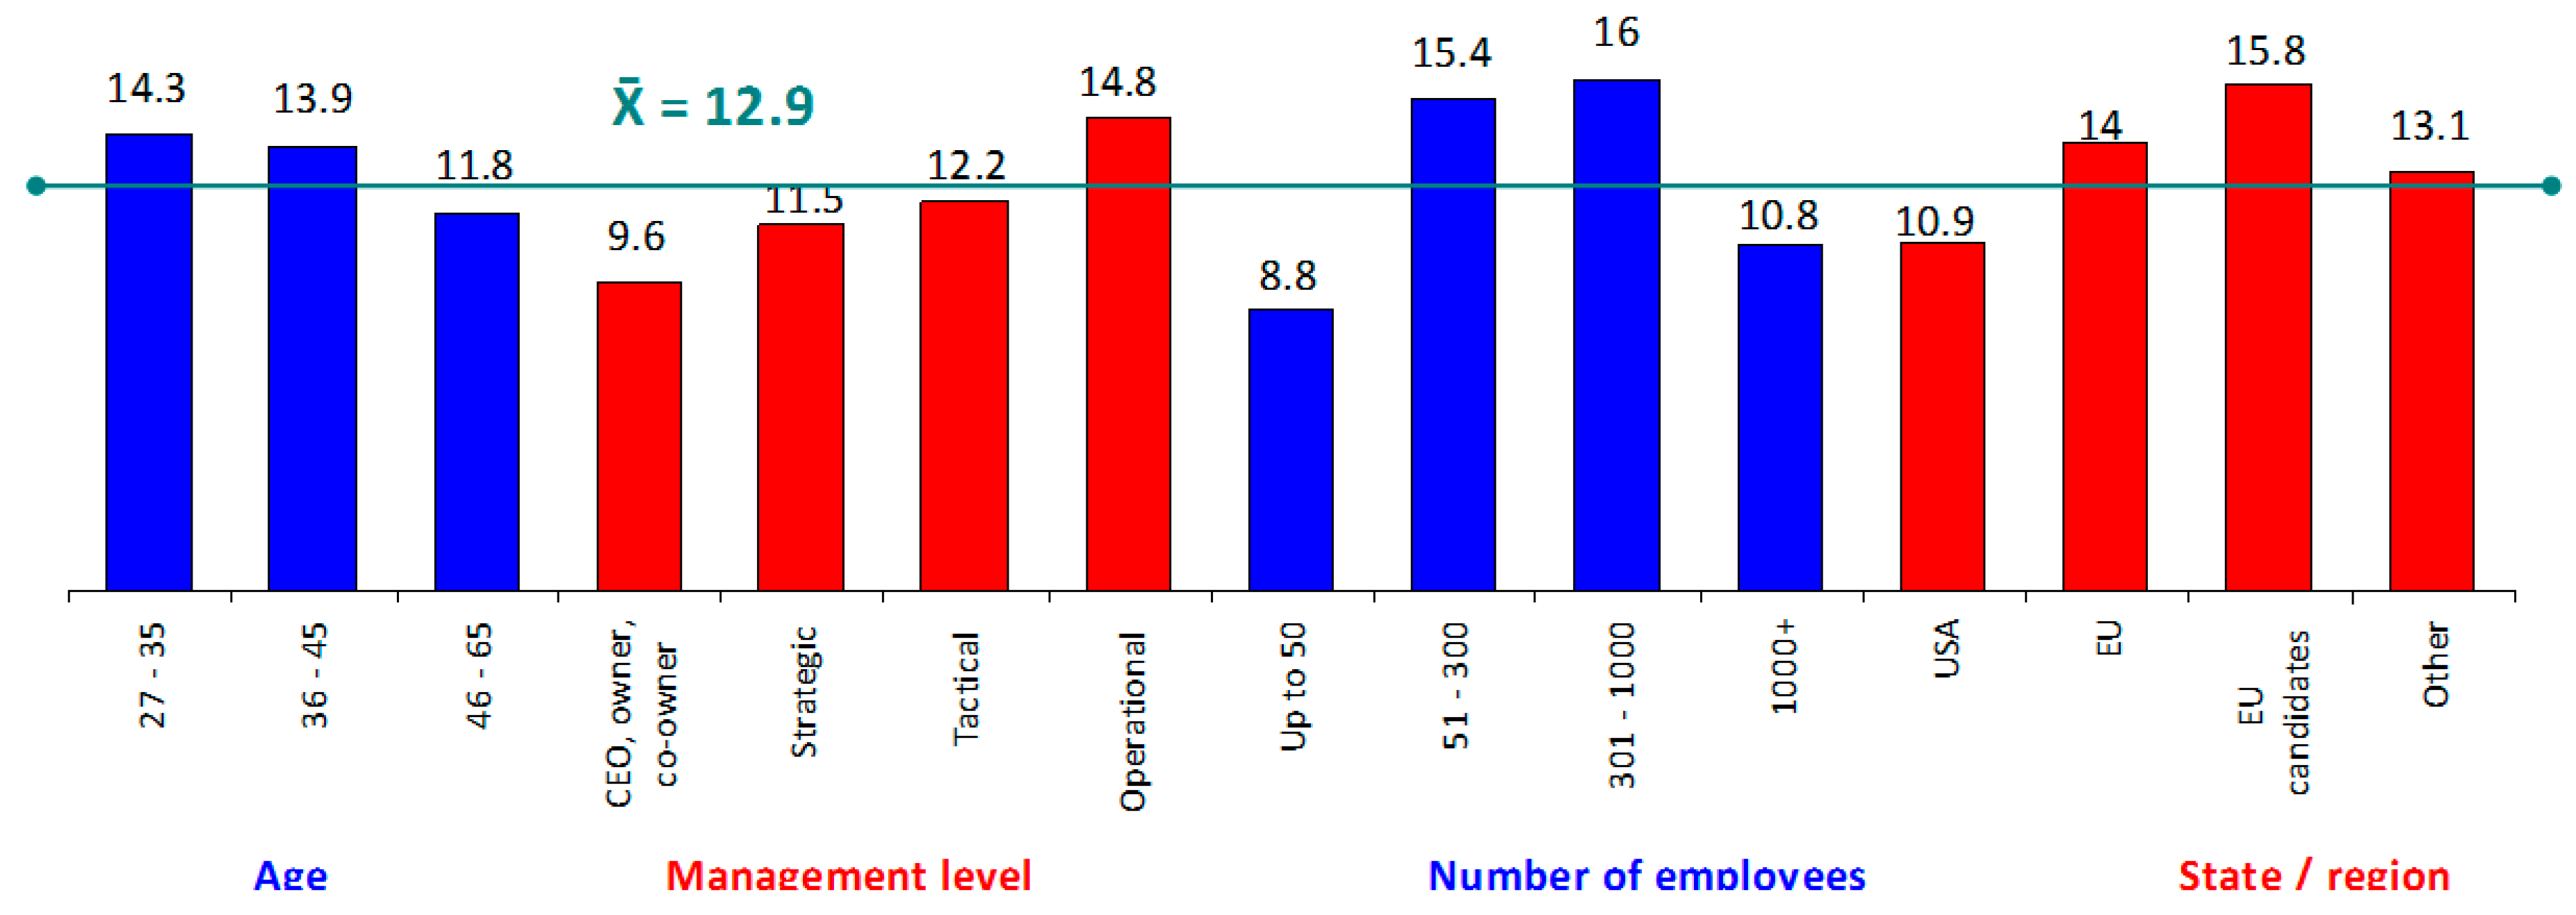
Chart 3.
EMPLOYEES vs MANAGERS; Optimal number of working days per month in the company's premises by areas of work engagement (x̄).
Chart 3.
EMPLOYEES vs MANAGERS; Optimal number of working days per month in the company's premises by areas of work engagement (x̄).
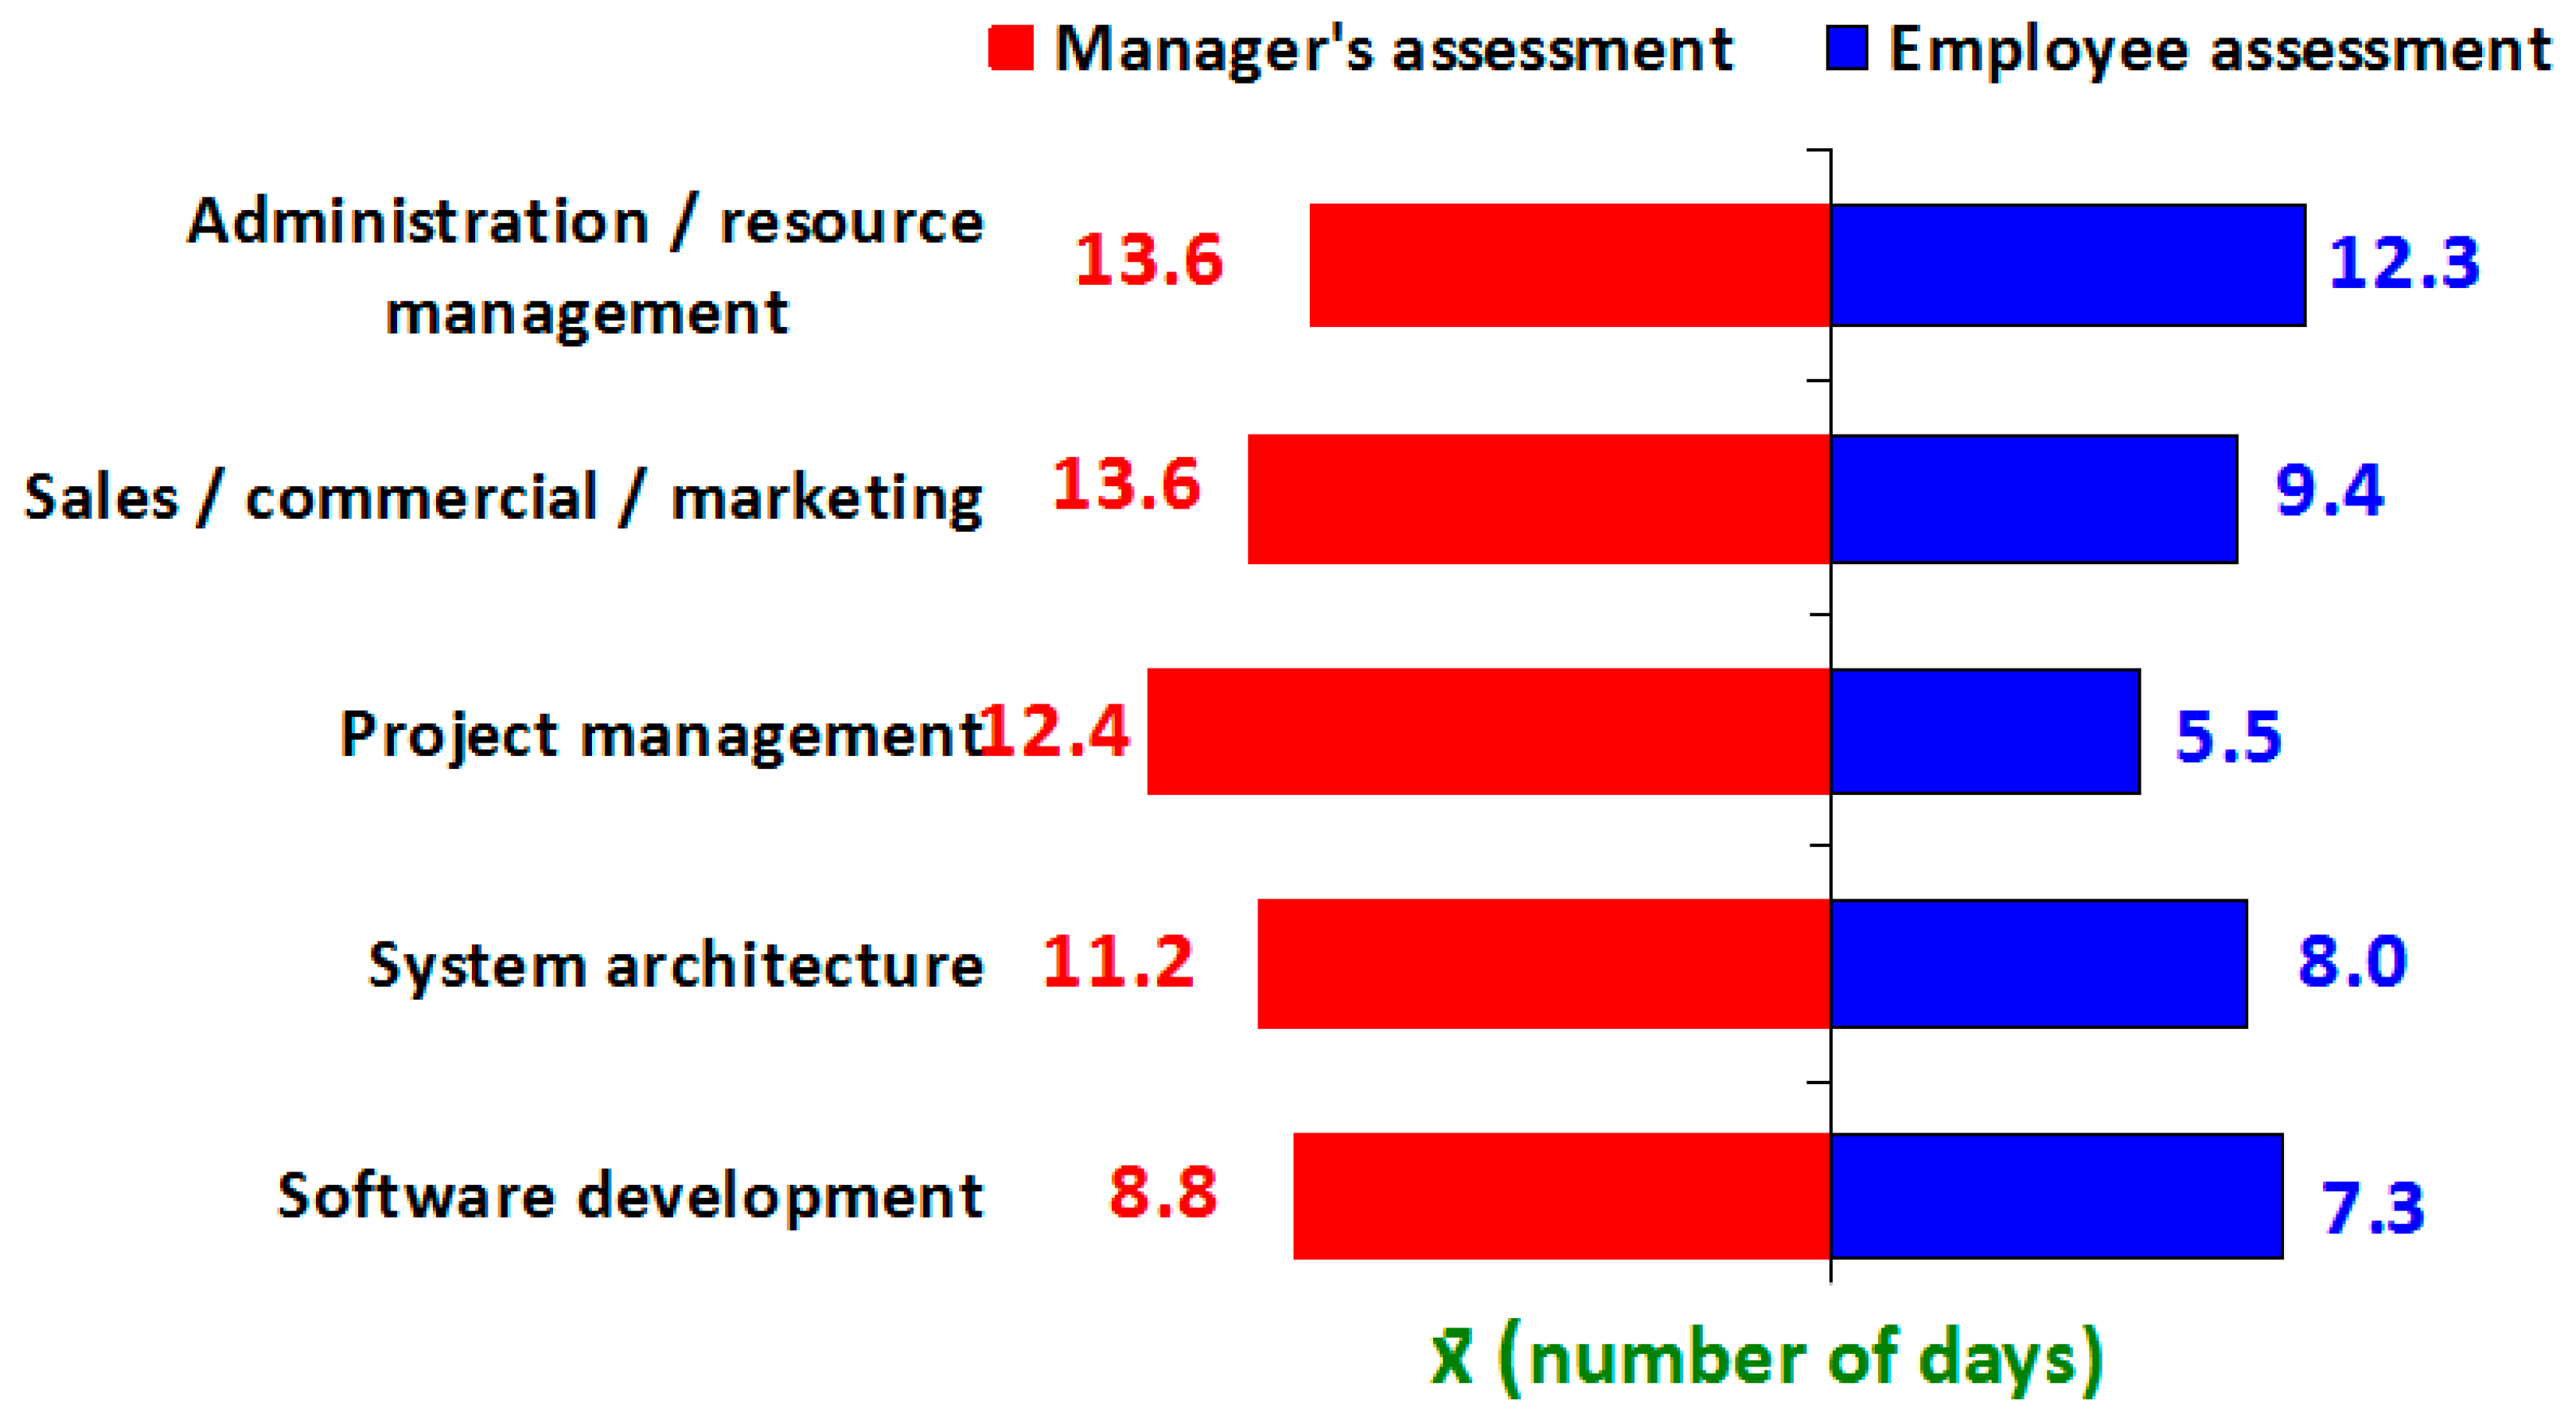
Chart 4.
EMPLOYEES; (98% of Total Population / All Except Those Who Work Exclusively from Company Premises): Importance of Cost Savings (Transportation, Clothing, Breakfast/Lunch at Work, etc.) When Working Remotely.
Chart 4.
EMPLOYEES; (98% of Total Population / All Except Those Who Work Exclusively from Company Premises): Importance of Cost Savings (Transportation, Clothing, Breakfast/Lunch at Work, etc.) When Working Remotely.
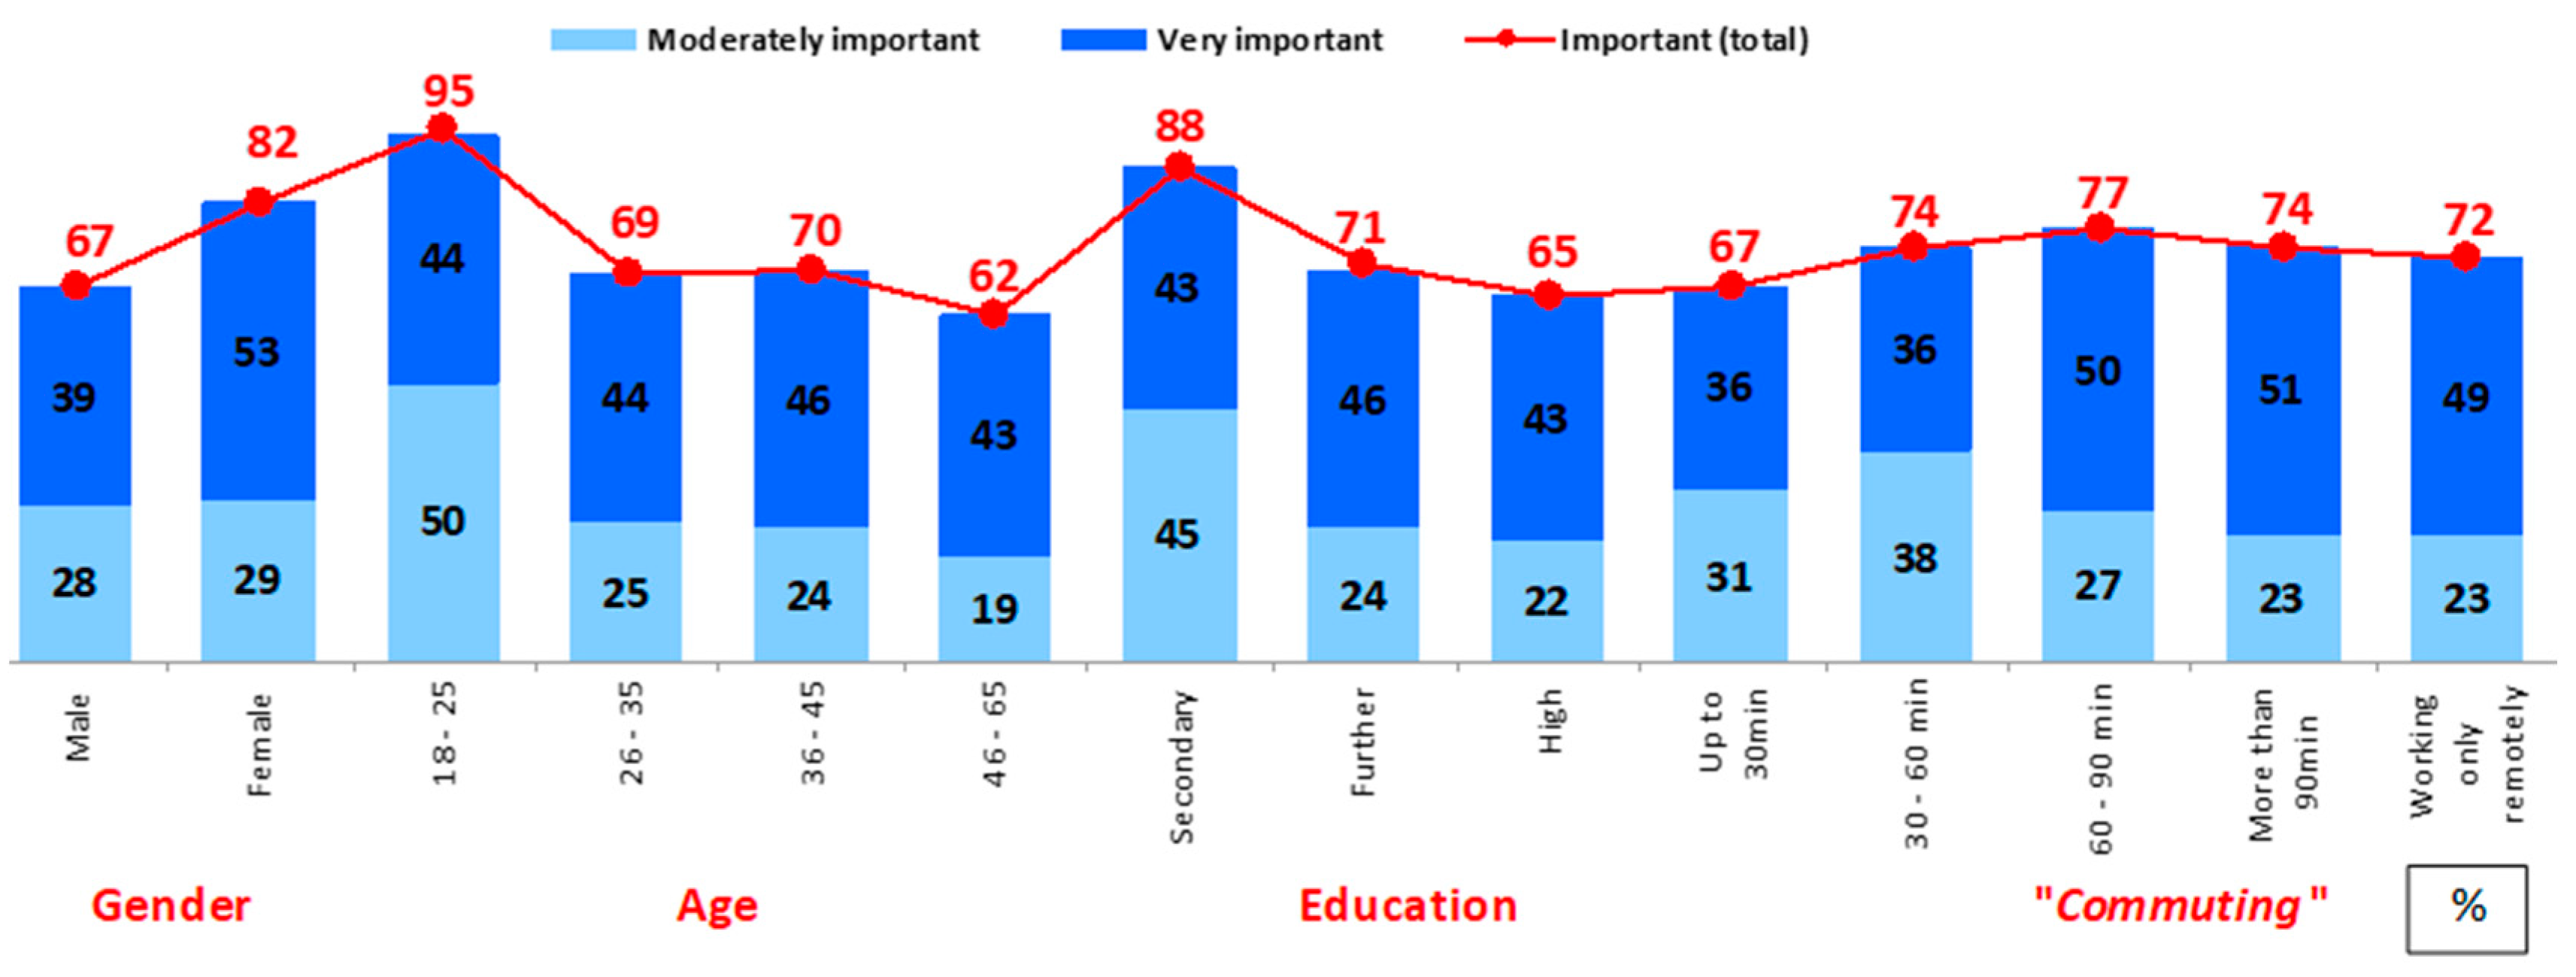
Chart 5.
EMPLOYEES vs MANAGERS; Preferred Work Schedule Modality for Achieving a “Synergistic Effect” (%).
Chart 5.
EMPLOYEES vs MANAGERS; Preferred Work Schedule Modality for Achieving a “Synergistic Effect” (%).
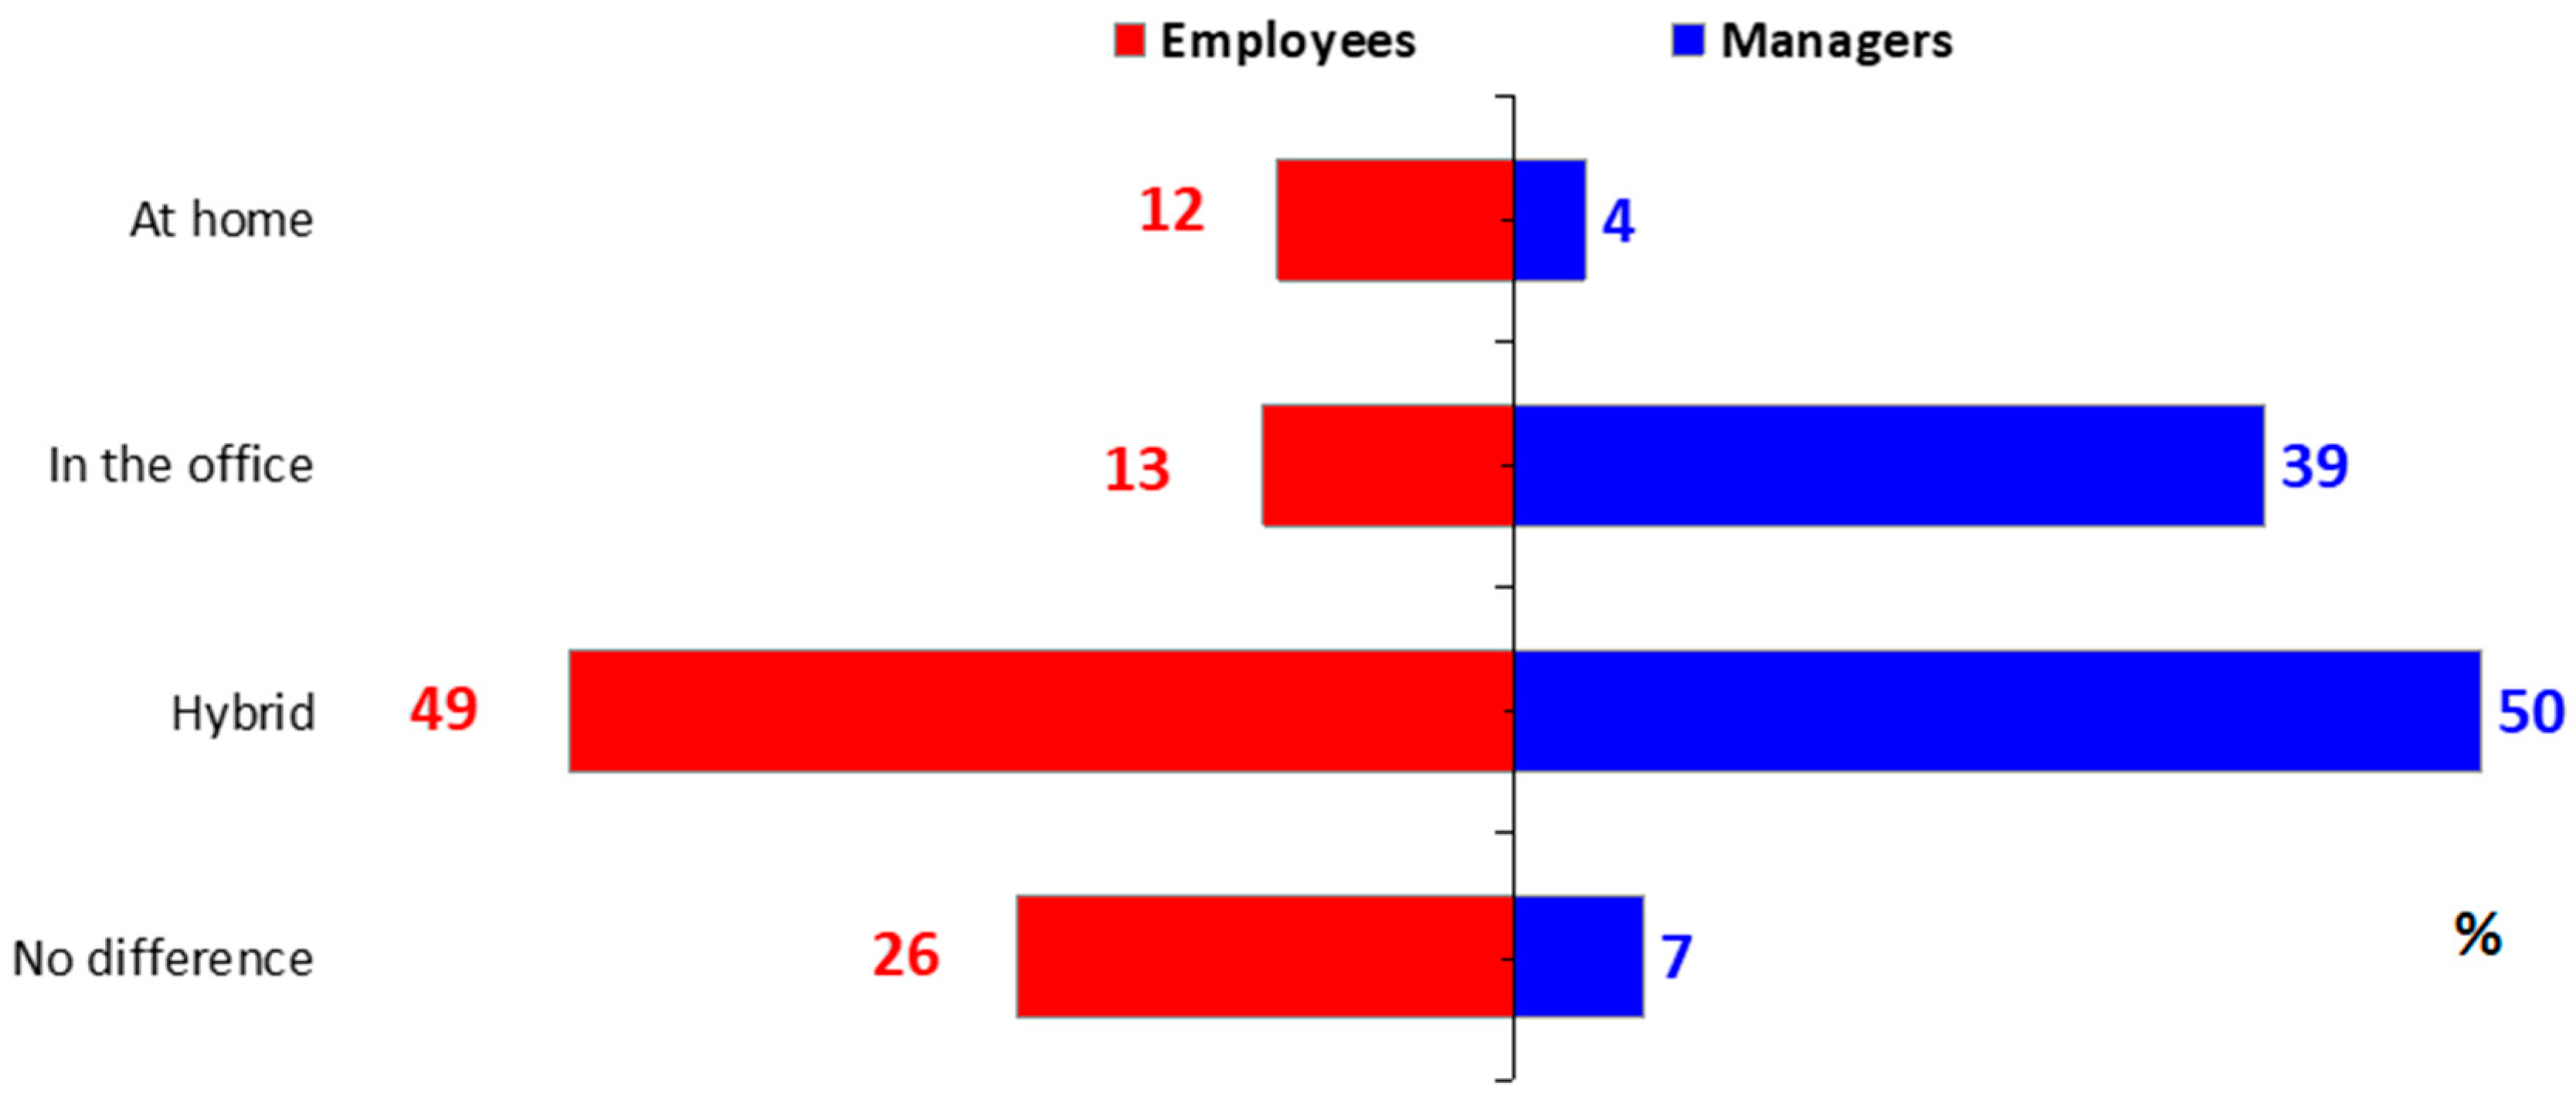
Table 3.
Frequency of going to work / working from company premises; Employees: Total
| Total | Company according to the number of employees | State / region | Developments of the IT sector | |||||||||
| Variables related to companies / environment | Average (days) |
Small enterprises | Medium-sized | Mid-sized large (MSLE) | Multinational corporations (MNCs) | USA | EU | EU candidates | Other | Most developed | Medium developed | Less developed |
| N | 1003 | 180 | 111 | 153 | 558 | 351 | 301 | 100 | 251 | 598 | 282 | 123 |
| going to workplace / working in the company's premises | 7 | 10.5 | 10.8 | 11.4 | 3.9 | 4.2 | 8.7 | 11.6 | 7.2 | 5.6 | 8.4 | 10.6 |
Table 4.
Number of working days at work optimal / current; Employees: Total.
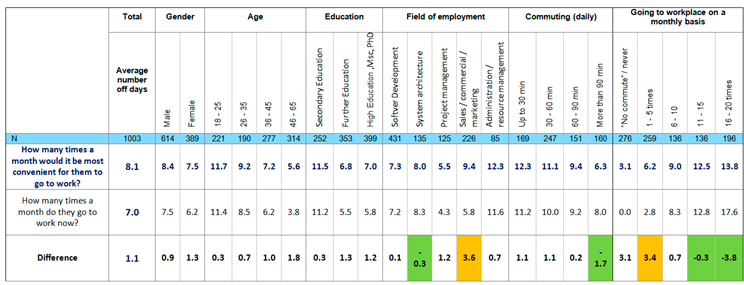 |
Table 5.
Optimal number of "physical presence" of employees per month according to the interests of the company (by areas of work engagement); Managers
Table 5.
Optimal number of "physical presence" of employees per month according to the interests of the company (by areas of work engagement); Managers
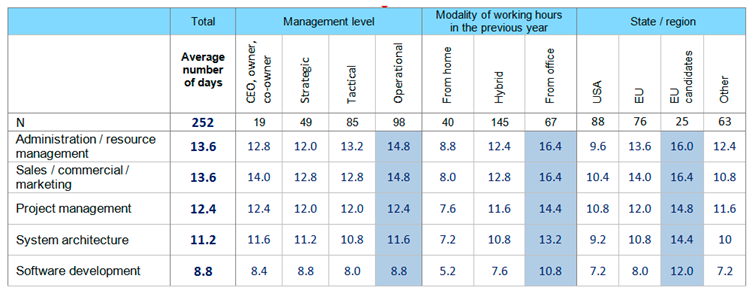 |
Table 6.
Is there a feeling of depression, laziness, inertness due to isolation when they worked / work from home for a long time?; Employees: total.
Table 6.
Is there a feeling of depression, laziness, inertness due to isolation when they worked / work from home for a long time?; Employees: total.
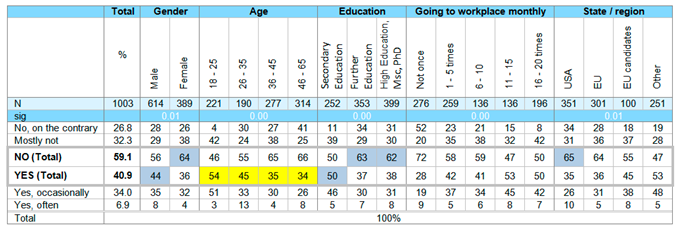 |
Table 7.
Do they apply some of the listed ways to manage stress when working from home; Employees: 98%, all except those who exclusively work from the company's premises.
Table 7.
Do they apply some of the listed ways to manage stress when working from home; Employees: 98%, all except those who exclusively work from the company's premises.
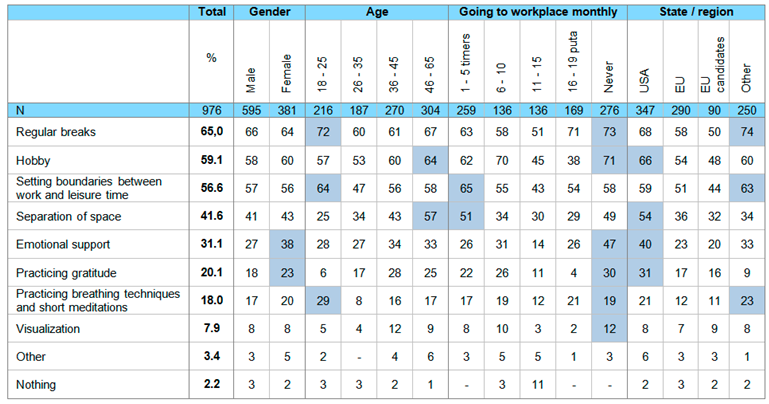 |
Table 8.
What would motivate them to "return to the office"; Employees: 81% of the total population, all except those who work every day or almost every day from the office (multiple answers).
Table 8.
What would motivate them to "return to the office"; Employees: 81% of the total population, all except those who work every day or almost every day from the office (multiple answers).
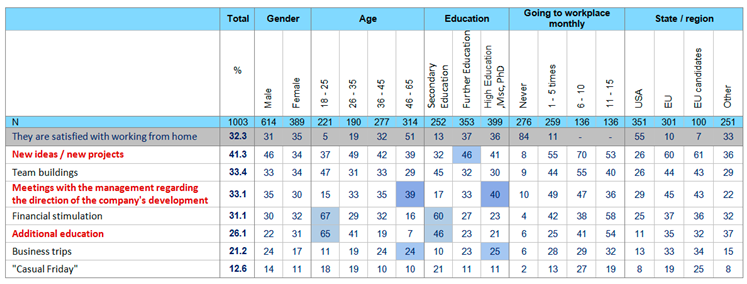 |
Table 9.
Commuting Distance. Employees: 73% who commute to work at least once a month.
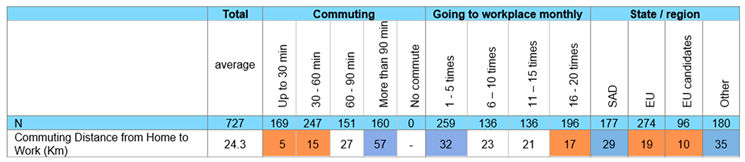 |
Table 10.
Commuting Distance. Employees: 73% who commute to work at least once a month.
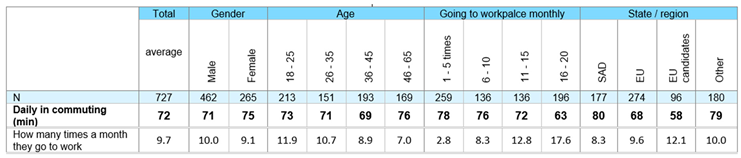 |
Table 11.
Types of Transportation Used for Commuting (Multiple Responses Allowed). Employees: 73% who commute to work at least once a month.
Table 11.
Types of Transportation Used for Commuting (Multiple Responses Allowed). Employees: 73% who commute to work at least once a month.
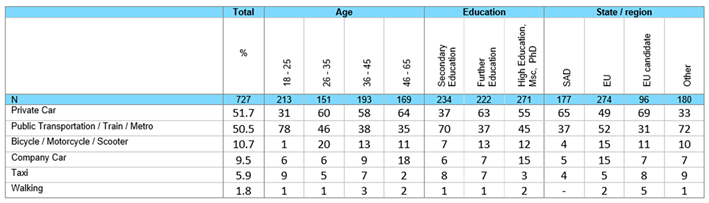 |
Table 12.
Managers. Companies for Which the Advantages (Cost Savings) of Remote Work Are Important.
 |
Disclaimer/Publisher’s Note: The statements, opinions and data contained in all publications are solely those of the individual author(s) and contributor(s) and not of MDPI and/or the editor(s). MDPI and/or the editor(s) disclaim responsibility for any injury to people or property resulting from any ideas, methods, instructions or products referred to in the content. |
© 2025 by the authors. Licensee MDPI, Basel, Switzerland. This article is an open access article distributed under the terms and conditions of the Creative Commons Attribution (CC BY) license (http://creativecommons.org/licenses/by/4.0/).
Copyright: This open access article is published under a Creative Commons CC BY 4.0 license, which permit the free download, distribution, and reuse, provided that the author and preprint are cited in any reuse.


