
Submitted:
18 April 2025
Posted:
18 April 2025
You are already at the latest version
Abstract
This study examines the effects of sustainability and annual report readability on information asymmetry and firm value in high-profile industries. Using multiple regression analysis on 217 high-profile firms listed on the Indonesian Stock Exchange from 2017 to 2020, we assessed the relationships using FRE to measure readability scores and weighted least squares regression. Our findings indicate that both sustainability and annual report readability positively influence information asymmetry while negatively affecting firm value. We further validated these findings with non-linear and robustness tests, revealing non-linear relationships between the variables. This study bridges a gap in the relatively new field of readability of sustainability and CSR reporting in Asia, particularly in Indonesia. The results are useful for companies looking to adopt sustainability in their business models and improve report readability, thus aiding investors in accurately understanding company conditions. The study is context-specific to Indonesia, with limitations including the measurement of readability using FRE only on certain report sections. Future research could explore other readability indicators, variables affecting firm value, and a broader dataset.
Keywords:
Sustainability report readability
; annual report readability
; asymmetry information
; firm value
1. Introduction
Companies need to increase their competitive advantage to attract stakeholders and investors due to increasingly fierce competition and globalization [1,2,3,4]. Hence one of the ways for companies to enhance their competitive advantage is by adopting sustainability and disclose corporate social responsibility (CSR) in their business practices [5,6]. According to [5] although studies related on sustainability are still relatively few, several studies found company’s value can be increased by adding sustainability practices and CSR disclosure in company’s reports, which this information can be utilized in the decision-making process [7]. In addition, companies are able to take advantage from non-financial activities, such as environmental or social practices disclosed in in stand-alone sustainability report or in part of annual report [6]. Sustainability and annual reports can provide stakeholders with beneficial information for their decision-making and forecasting purposes [7,8]. Sustainability report and CSR disclosure in annual reports have become essential for capital market to make investment considerations and decisions [9]. However, the sustainability and annual report will not have an optimal function if it is not prepared and presented properly [5].
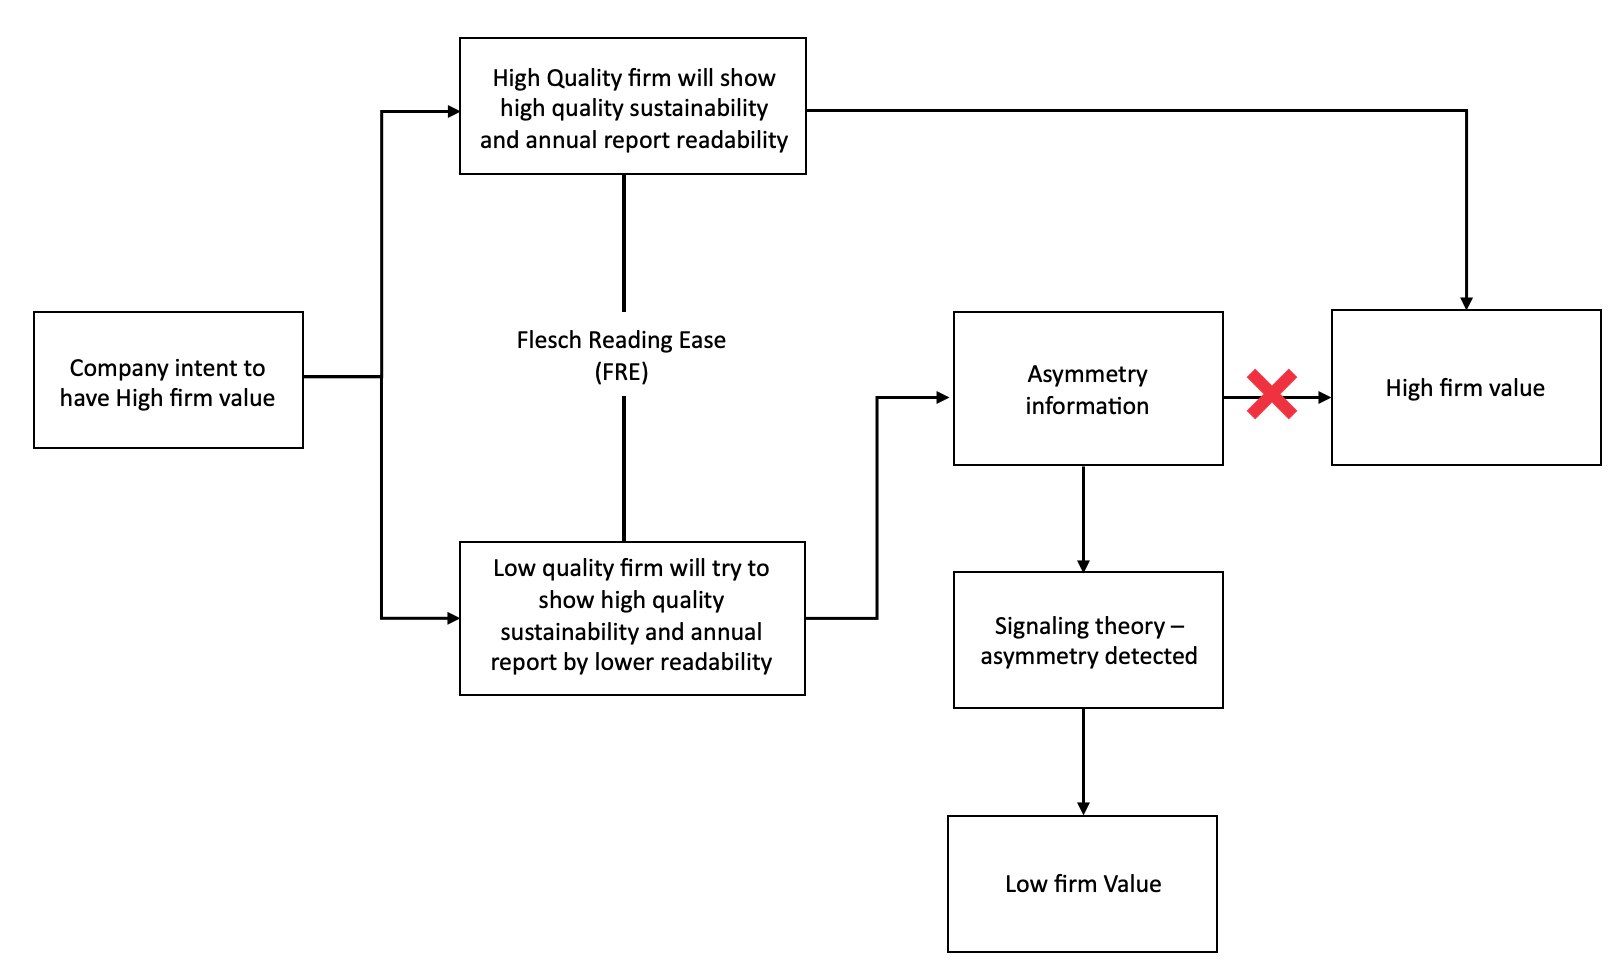
Therefore, a quality of report can be described as a report that has high level of readability level, that is easy to understand the context and condition of the company [10,11].Thus, high level of reports readability may minimize asymmetry information. In addition a quality of firm’s report demonstrate corporate transparency, strong risk management, enhance stakeholder engagement, and improve communication with stakeholders [12]. According to [13] a good quality of any report can be determined from the level of readability and understandability without any asymmetry information [10,11]. Quality of sustainability and annual reports may represent company value without asymmetry information [14]. Asymmetry information is a condition with any differences in perceptions between company management and shareholders [15]. According to [13], asymmetry information existence is assumed to have responsibility for inefficient investment and reducing firm value. According to Omran et al. (2021) dan Cohen et al. (2011) easy-to-read report can reduce asymmetry information between managers and shareholders.
On the other hand, firm’s reports that are prepared without paying attention to language clarity and articulation of sentences potentially increase the occurrence of asymmetry information and potentially harm the company since company's performance information may not be conveyed optimally [14,17]. This condition causes investors and stakeholders realize that profits merely are not enough to represent the firm's value [18]. Consistent with signaling theory which stated that a low level of readability and asymmetry information can be used as a sign that the company is not doing well [14]. [19] promoting sustainability reports and CSR activities in the annual report may show transparency and may give a good impact on the company. IFAS No. 1 states that the company can disclose additional reports such as reports on the environment and value-added reports, especially for companies that consider that environmental factors and employees play an essential role in the report [20]. This is supported by government regulations that can stimulate companies to report sustainability and CSR reports [1]. According to [21] reporting on environmental and social performance should be carried out, specifically on companies that have a higher impact on the environment or which can be classified in a high profile companies that have to report more extensive information than companies with lower impact [22].
For example, the case of PT Freeport showed that stakeholders prefer companies with a positive image yet share price plummets on the Wall Street exchange [23]. This phenomenon supports [24] findings on sustainability reports prepared by high profile companies were easier to read; this may be due to higher pressure from the stakeholder to reveal their environmental and social activities and responsibilities for high profile compare to low profile companies [25]. This phenomena can also be explained through legitimacy theory because companies need legitimacy from the environment and society for their existence [26]. Legitimate company is assumed to have good values of the company [14]. [27] also found that sustainability report disclosure can reduce asymmetry information between managers and investors, thereby firm value increased. [14] revealed that sustainability and CSR reports with a high level of readability could reduce asymmetry information and build company value.
Therefore, the readability level of the firm’s report can reduce asymmetry information and help the company get a better positioning among its competitors because reports with a high level of readability can affect the reputation and value of the company and give a good image as a company that obeys the rules and contributes to the environment and social [14]. On the other hand, the low level of readability will reduce the communication function of the company's report to stakeholders [14]. Hence, the issue of readability has increasingly become a focus in the capital market in recent years as changes to the company's information disclosure requirements have resulted in a significant increase in the amount of information disclosed [13].
This research give contribution to literature in a way that sustainability and CSR disclosure is a relatively new topic in Asia, only a limited number of studies have been done in the region [5,28] especially in Indonesia. According to Financial Services Authority of Indonesia Regulation, sustainability reporting is voluntary disclosure until 2020 while CSR disclosure in annual reporting has been mandatory since 2012. To the best our knowledge, there is limited research in developing countries including Indonesia on the readability in companies’ reports [29]. This paper examines the relationship between the readability of sustainability and annual reports on asymmetry information and firm value. After the introduction section, this paper reviews existing literature on the relationship between voluntary and mandatory disclosure which represented by sustainability report and annual report. Based on the literature, we discuss the theories and hypothesis development. The next section explains the methodology, followed by the empirical results and analysis. In the last two parts, we highlight the implications and limitations of this study.
2. Literature Review and Hypothesis Development
2.1. The Relationship Between the Readability of Sustainability and Annual Reports and Firm Value
Company’s reports are able to provide, not only broader information about companies with environmental and social responsibility, but also can provide a comprehensive picture of long-term performance from various perspectives [30]. Several studies found that environmental and social disclosures have a positive impact on firm value if they presented in readability easy-to-read level so that the information included is fully understood by users [24]. The readability of sustainability and annual reports could be defined as how easy a report can be understood by its readers [29]. Company’s reports with high readability are usually written and articulated of effective and efficient sentences [5], therefore it is important for companies to prepare their reports as well as possible with a high level of readability so that users can interpret and understand the contents in their reports properly [31].
From the perspective of legitimacy theory, it explains the environmental and social disclosures which describe companies’ activities based on a value system that is commensurate with the value system owned by the community [26]. The establishment of legitimacy from the community has a positive influence on firm value [32]. So that through this report, company’s disclosure could increase the value of the company since it may give a good impression as a company that obeys the rules and contributes to the environment and society [14]. From the signaling theory perspective, disclosing readable environmental and social issues to the public is a good signal. It explains that the company is actively involved in environmental strategies [24]. Therefore, company’s reports with high readability can provide a positive signal and make the company to be more attractive to investors in the stock market [33].
Research conducted by [34] and [35] found that sustainability and social disclosures could provide better company’s value and competitiveness. The readable reports is easy to accept and understand by a readers [13]. Thus, more readable sustainability and annual report may increase firm value due to easy-to-read information [24]. Given this, we propose our hypotheses as follow:
Hypothesis 1.
There is a positive relationship between readability of sustainability report and firm value.
Hypothesis 2.
There is a positive relationship between readability of annual report and firm value.
2.2. The Relationship Between the Readability of Sustainability and Annual Reports, and Asymmetric Information
Asymmetry information is a condition where differences in perceptions between company management and stakeholders exists [30]. Thus, corporate disclosure with high readability level can be important to reduce asymmetry information [9]. However, if the company's reports do not have high level readability, may cause asymmetry information and become barrier communication process between companies and stakeholders [5]. Therefore, a high quality report is a report that has a high readability level for which it understandable because it is easier to stakeholder understand the company's conditions without any asymmetry information [10,11]. In line with signaling theory, low readability level of company’s report could give a negative signal because the company my try to hide information by writing complex reports. As a result, investors cannot understand the information properly [13]. Therefore, company must provide readable information without any asymmetry information [10,11]. Study conducted by [36] suggest that company may deliver understandable information to mitigate asymmetry information. In line with Luo et al. (2018) which found that the higher company’s report readability, the lower asymmetry information However, [30] revealed that a quality of sustainability report has insignificant relationship with asymmetry information. Thus, inconsistent research results exist report readability impact on asymmetry information. According to [9] and [7] understandable reports could contribute to reduce asymmetry information between managers and stakeholders. This opinion supports research findings [37] that companies’ reports with high readability level has negatively influence on asymmetry information. Given this, our hypotheses are as follows:
Hypothesis 3.
There is a negative relationship between readability of sustainability report and asymmetry information.
Hypothesis 4.
There is a positive relationship between readability of annual report and asymmetry information.
2.3. The Relationship Between Information Asymmetric and Firm Value
Asymmetry information is a situation where one party has greater information awareness than other parties [38]. Stakeholders may think the internal parties know more about the company than outsiders. This perception causes inefficient investment activity and has an impact on reducing the firm value [3,13]. Therefore, increasing asymmetry information may indicate a wrong signal to stakeholders because the company may cover something [24]. Otherwise, low asymmetry formation may indicate a good signal. As a result, it stimulates investment activities and resulting maximum profit [33].
[14] explain that asymmetry information harms firm value. The findings supported by [34] found that the low asymmetry information may lead to better investment decisions. Therefore, asymmetry information is responsible for inefficient investment activities and has an impact on reducing firm value [13]. Given this, we propose our hypothesis as follow:
Hypothesis 5.
There is a negative relationship between Asymmetry information and firm value.
2.4. The Relationship Between THE Readability of Sustainability and Annual Reports and Firm Value
Companies that choose to report their social and environmental responsibility to lower asymmetry information between companies and stakeholder could provide good signal to the market through its reports [39]. Understandable reports may reduce the level of asymmetry information faced by stakeholders, which allows them to evaluate the company's performance [13]. Stakeholders tend to rely on information in company reports to interpret the company's current and future performance, and it is important to identify how information should be disclosed [40]. Therefore, a quality report is a report that has a high level of readability and is easy to understand for investors to use it in investment decision making process which eventually can enhance company’s value [10,11,13].
From the perspective of legitimacy theory, company that choose to disclose their environmental and social performance can increase the value of the company because they gain legitimacy status from stakeholder for good impression as an environmentally and socially good performer company [14,32].
In addition, from the perspective of signaling theory, the low level of readability of company reports can increase asymmetry information may give a negative signal since it can be assumed that company is trying to hide some information by writing complex reports that leads to asymmetry information and may decrease firm value as a consequences [13,14].
[24] found a significant relationship between reporting quantity and information readability where quality reports provide information that is easier to read and helps investors in making investment decisions. This finding is supported by research conducted by [31] where a low level of readability will reduce the quality of company reports, thereby reducing understanding and making it difficult for investors to interpret the information contained in the report which will have an impact on company value. However, different results were found in the study according to [41] that found the quality of report disclosure through readability had no effect on firm value. This also supports the research conducted by [14] which did not find a direct impact on firm value but there is a significant negative relationship between the submission of corporate report disclosures and asymmetry information.
Given this, we propose our hypotheses as follow:
Hypothesis 6.
There is a positive relationship between readability of sustainability report and firm value, with information asymmetric as intervening variable.
Hypothesis 7.
There is a positive relationship between readability of annual report and firm value, with information asymmetric as intervening variable
Furthermore, the all relationship between predictor and predicted variable can illustrated in proposed model as following Figure 1.
3. Methodology
3.1. Data Collection and Sample
This study was performed using quantitative approach to see the effect of readability levels on sustainability reports and annual reports on all companies engaged in industries belonging to high profile industries and listed on the Indonesia Stock Exchange (IDX) during the 2017-2020 period on firm value. The researcher used purposive sampling method to get samples that matched the research criteria, so 217 data were selected that met the criteria and had a complete sustainability report and annual report, so that they could be used as samples in this study. Of the total companies listed on the Indonesia Stock Exchange in 2017-2020 the number of companies classified as high-profile industries is 641 companies. From 641 companies, there were 568 companies that did not issue a sustainability report during 2017-2020, so that the remaining 73 companies could be used as research samples. However, from 73 companies with a reporting period of 2017-2020, the annual report and sustainability report that can be used as research samples are 292. Besides that, not all companies publish sustainability reports in 2017-2020 regularly and use English which is one of the criteria in the study. This is because the readability index can only be measured on reports published in English. Therefore, from 292 research samples, 61 sustainability reports were not published in 2017-2020 and 14 reports were not published in English, so the sample studied became 217 samples that met the criteria.
3.2. Operational Variables and Measurement
The company report provides a broader picture of a new company with independent social responsibility towards an annual report that provides a comprehensive picture of long-term performance from various perspectives, business models, and value creation [30]. The ease of readability of company reports can increase understanding of the company because the information received can be more effective and efficient to understand so that it can be used for strategic decision making [13]. So with an easier readability level, the company helps investors make decisions and increases the value of the company. The calculated score on the Flesch Reading Ease (FRE), indicates the minimum level of education required to understand the subject matter. Similar to the Gunning's Fox Index, the FRE index uses the average sentence length, but then uses the average number of syllables per word to calculate the score [42]. With this consistency, it implies that the research can use one of the confidence calculation methods and use reliable results even though there are many indicators in calculating the level of readability, but basically most of the readability formulas are based on two common elements, words and sentence length [24]. Therefore, because of its wide use in research and ease of calculation, this study chose the FRE Score calculated in Microsoft Word to evaluate the readability of the annual reports of sample companies.
The dependent variable in this study is the firm value which can be defined as the public's perception of the company which can be reflected through the stock price because the stock price reflects the bargaining power of the shares, if the company is estimated to be a company that has good prospects in the future, the share value will be high, and vice versa if the company is judged to have no future prospects, then the stock price will be weak [5]. Tobin's Q is used for measuring this variable because it is the market value of the company divided by the replacement value of its assets [6]. In addition, according to [43] Tobin's Q is a more comprehensive proxy for calculating firm value because it reflects the market value of shares divided by total assets. Tobin's Q is measured as the total of market capitalization, liabilities, preferred equity and minority interest over total assets. Tobin's q size is a company's performance that meets or exceeds the expectations of its stakeholders; therefore, this measurement can illustrate the value creation will lead to company-specific improvements over time. to time [34]
Asymmetry information used as an intervening variable in this study is defined as a situation where one party has greater information awareness related to effective participation in certain situations relative to the participation of others [44]. Asymmetry information arises when managers in a company know more about all information in the company and the company's prospects in the future than [14]. Asymmetry information can be measured by using the bid ask spread which is the difference in the highest purchase price that causes investors to be willing to buy certain shares with the lowest selling price which causes investors to be willing to sell their shares [45]
In this study, researchers used firm size, capital structure and market growth as control variables in this study because companies with larger firm sizes tend to have an influence on increasing profitability and firm value [46]. According to [18] the size of the company is enough to affect the level of profitability of a company and larger companies will be relatively stable and able to generate profits. This study measures the firm size variable with total asset ownership as an indicator of its calculation. Furthermore, the capital structure is a description of the form of the company's financial proportions, namely between capital sourced from long-term debt and own capital which is used as a source of financing for a company [47]. Companies with a good level of business development in the long term will provide large profits to investors. The optimal capital structure will directly affect the firm value [47]. This study measures the capital structure variable using the debt-to-equity ratio. In addition, company growth is how far the company puts itself in the overall economic system or the economic system for the same industry. Company growth is highly expected by internal and external parties of a company because it can provide a positive aspect for them [30]. From an investor's point of view, the growth of a company is a sign that the company has a profitable aspect and they expect the rate of return on their investment to provide better returns [39]. This study measures the market growth variable with the market to book value.
This study adopted a measurement variable from prior research through the following Table 1:
3.3. Regression Model
The hypothesis in this study was tested using multiple regression models. The independent variables to be studied consist of the Readability Level of the Sustainability Report and Annual Report. While the intervening variable is asymmetry information and the dependent variable is firm value and the control variables are firm size, capital structure and market growth. Multiple regression models are generally used to test the effect of two or more independent variables with interval or ratio measurement scales in a linear equation [51]. Therefore, a multivariate analysis was performed through as follow in regression model:
FV = α+ β1RoSit + β2RoAit + β3IAit + β4FSit + β5CSit + β6MGit + ε
In term of statistics technique, this study had performed linear regression and quadratic regression to understand non-linear relationship. A quadratic regression was performed due to the non-constant assumption or will fluctuate over time and that will not necessarily be linear. This study provided the 2D and 3D plot to show the findings easily. In the end, this study had performed robustness test to validity our finding.
4. Methodology
4.1. Descriptive Analysis
Descriptive statistics and classical assumptions for the variables observed are presented in Table 2.
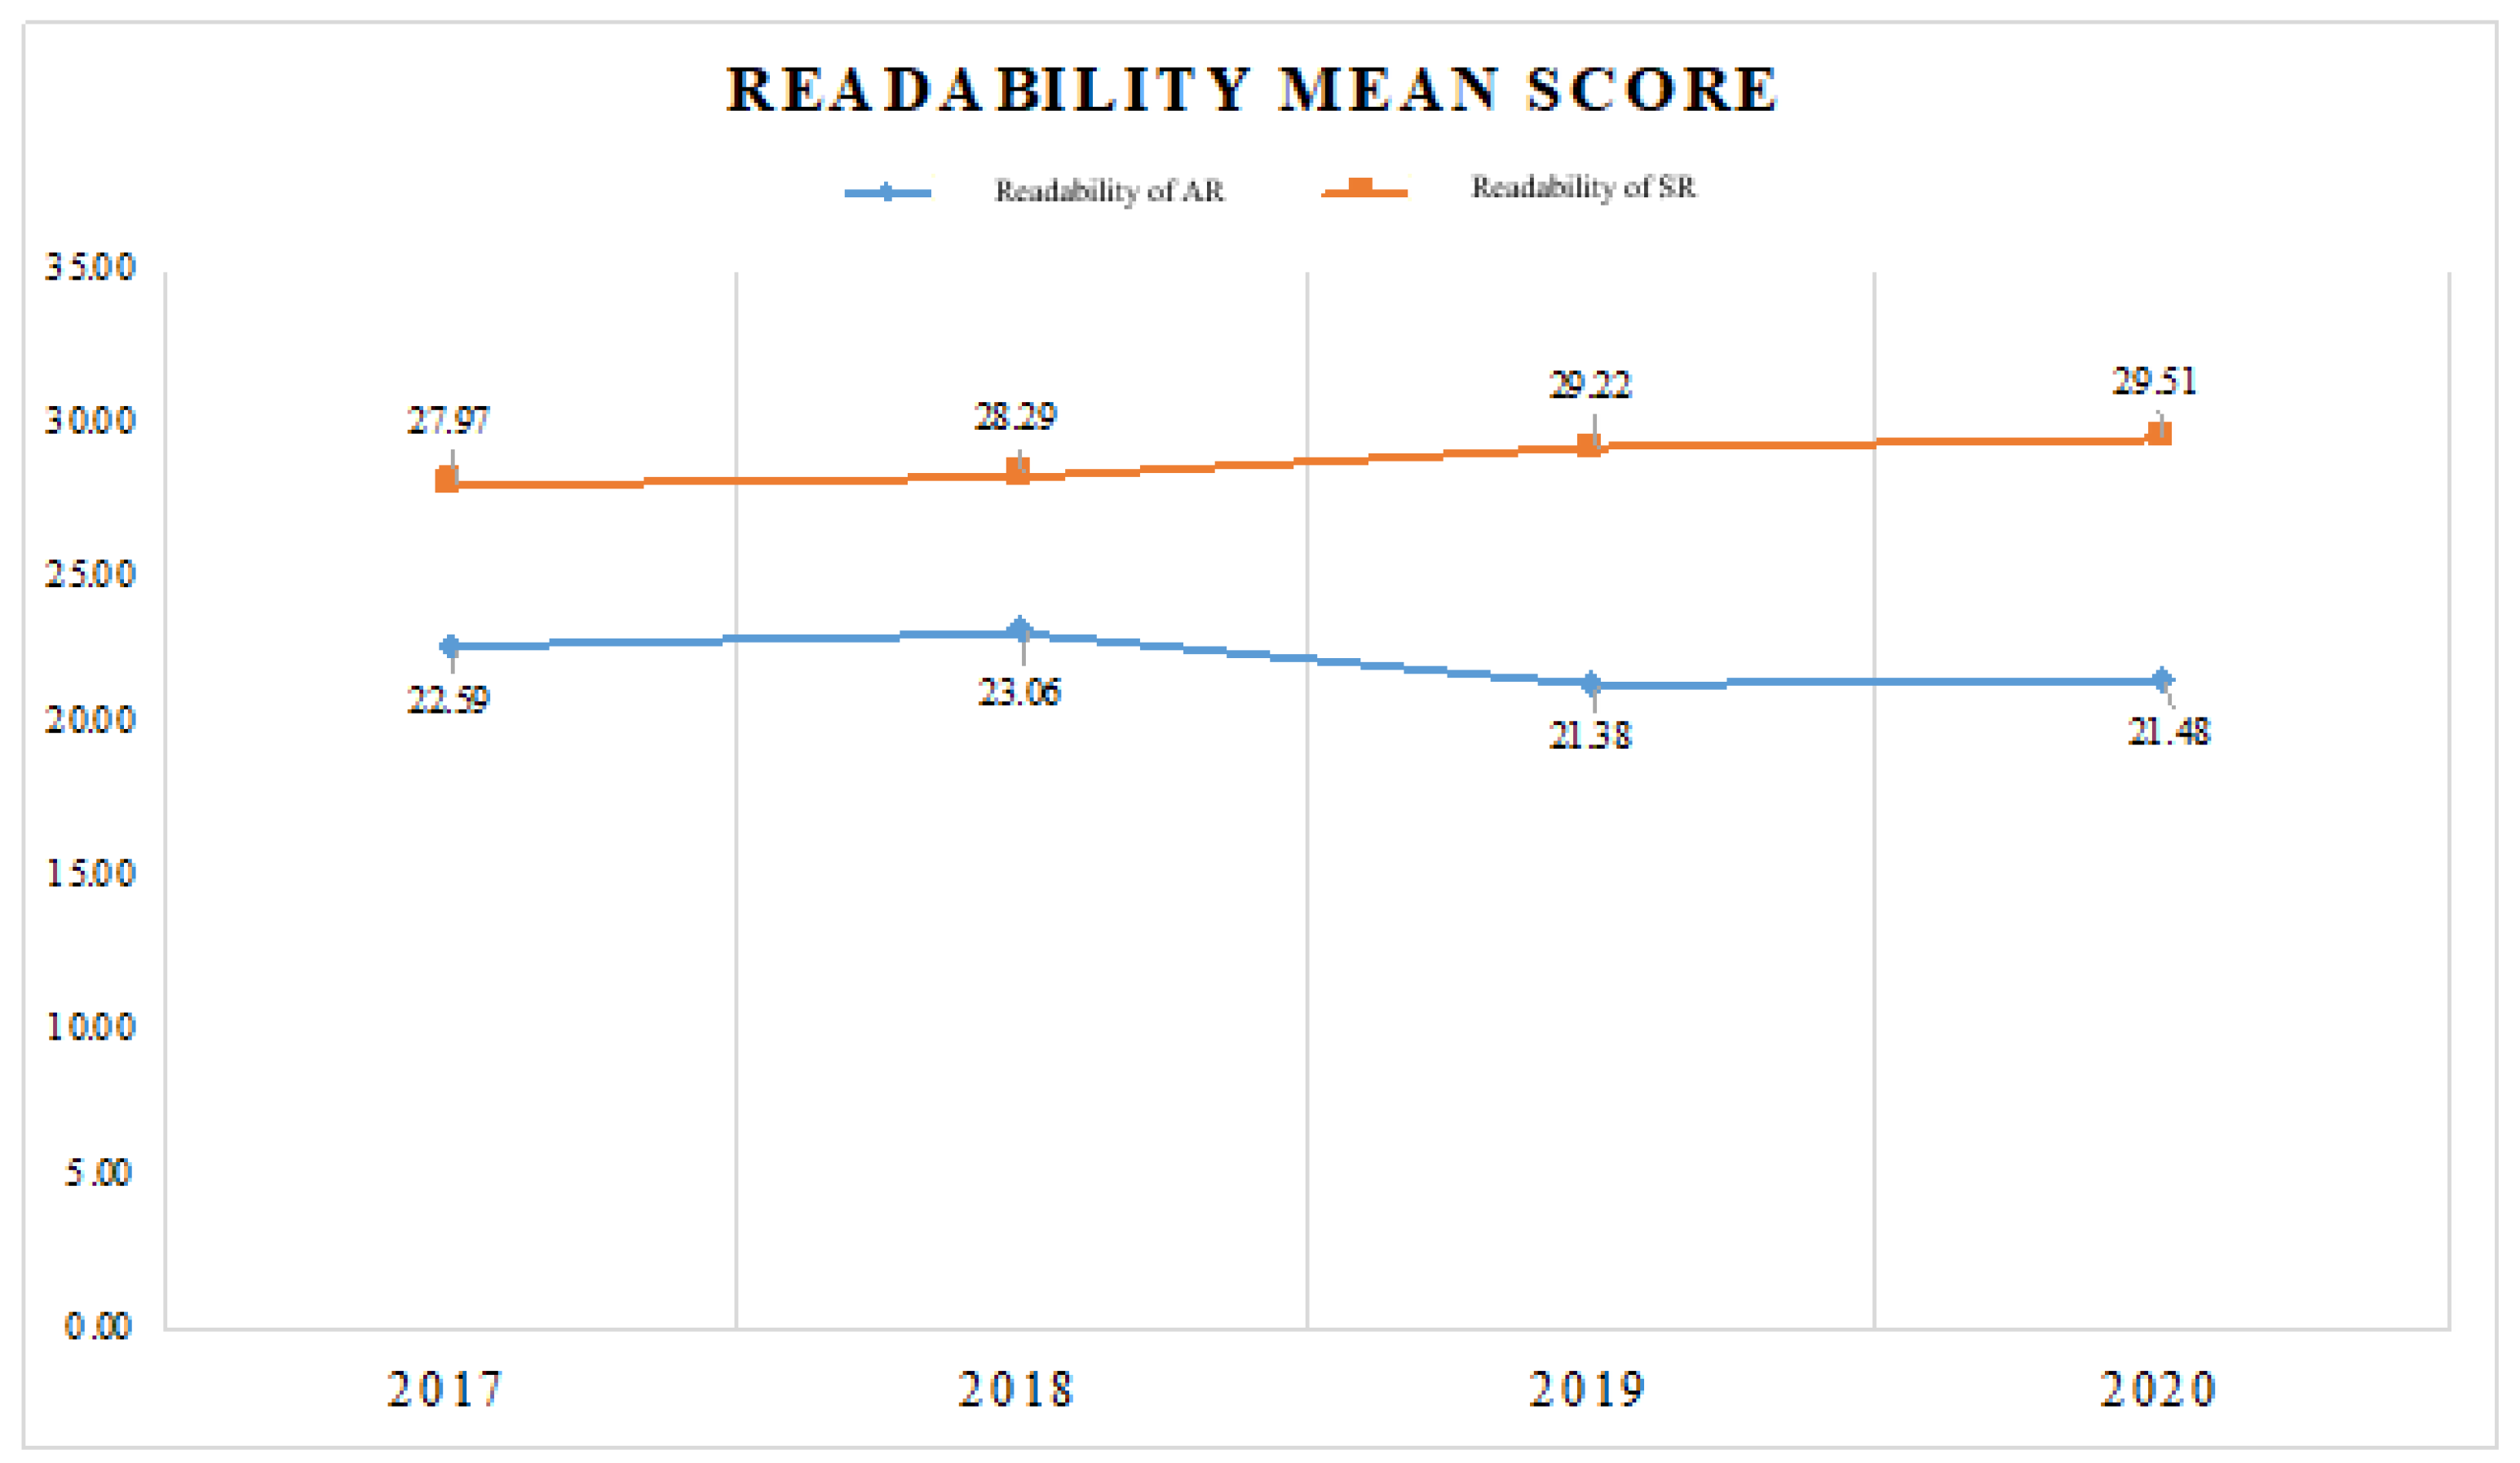
Table 2 present that mean score of annual and sustainability report readability are classified as very difficult readability level (Score: 0 – 30) refers to FRE index which means a difficult readability report requiring people to have at least a Bachelor's degree to understand the text [52]. This finding revealed a phenomenon that company has not considered the readability while sustainability and annual report information are needed to be clear and observable since any information will benefit readers [24]. However, the readability of sustainability report has increased and the readability of annual report is the opposite.
Figure 2.
The readability score of CSR and sustainability report.
Afterward, asymmetry information in this study is considered high. Since asymmetry information is measured by bid ask spread, while the mean score of 0.195 higher than a middle line of spread (median). The score spread from -1.470 to 1.95 with > median score (0.142). This result indicates that published information for external parties was bias or asymmetry. Furthermore, the firm value in this study is considered overvalued. According to Lang et al. (1989) if Tobin’s q higher than 1 means the return exceed it cost and the asset is considered worth. The firm size of company in this study is considered small with the mean score of 1.761 or log (IDR 2.099B). Refers to the classification of firm asset by Indonesia Financial Service authority, the firm is classified small if total asset < IDR 50B. Market growth in this study is considered high. The market growth in this study is 2.34% per year, this number is higher than Jakarta composite Index growth whereas only 0.35% per year. However, a comparation of market growth and composite index growth are excellent sources for investor assesses company performance [14]. Lastly, capital structure in this study were classified high because higher than 2. This finding indicate that the company drives financing from the debt or shareholder equity. High capital structure indicates high risk [47]. In term of classical assumption, there is no classical assumption issues in this study.
4.2. Hypothesis Analysis
Table 3 present the result of regression test. According to Table 3, this paper has not been able to find evidence of the effect of readability of sustainability reports on firm value (H1), the influence of readability of sustainability report on firm value (H1) was insignificant even though the research object was readability. This finding is consistent with relevant previous report by [33] which revealed that most investors cannot easily use companies’ sustainability report to formulate investment decisions and advice accurately. Moreover, sustainability report has not mandatory report in Indonesia which means many investors will not focused on sustainability report ([4]. The finding indicates that low readable sustainability report will not affect firm value refers to market reaction [29].
However, this study did find evidence of a negative effect of readability of annual reports on firm value (H2). A negatively influence of annual report is consistent with relevant previous research [30]. Firm value is reduced by lower readable text which constrains investors’ understanding of annual reports and their willingness to extract information from such disclosures [19], a previous study focused on stock market behavior revealed that less readable and lengthy 10-K filings are followed by noticeable market underreactions [53]. For instance, less readable text is strongly related with higher effort [54] and the forecast error increases when analysts deal with less readable text [48].
On other hand, this finding confirmed the readability of annual report has negative affect asymmetry information (H4), nevertheless this study has not been able to find the effect of sustainability report towards asymmetry information (H5). This finding rejected the proposed hypothesis. This means more complicated the text (more word and sentence) will reduce the asymmetry information. Furthermore, these findings are different with previous research [24] which revealed that the readability is high or complicated if has a long word or sentence. The long word or sentence is considered difficult because requiring educated person to understand. A negatively influence of readability of annual report and sustainability report on asymmetry information was acceptable result. FRE method is measured by an average of word length and sentence [42]. However, high readable text is also determined by disclosure format which affect the evaluation, acquisition, and weighting of disclosed information [10,11]. Awhile, FRE method is not considered the weighting disclosed information although it may critical information in the length of word. Thus, it is an acceptable reason to understand why low readability of report reduce the asymmetry information [55].
Our next finding confirmed that asymmetry information has negatively influence on firm value (H5). Firm value is reduced by inefficient investment due to asymmetry information [13]. Asymmetry information has a negatively influence on the sensitivity of stock prices to investment then reduce firm value [56].
The further analysis, this study performed a mediating test by comparing the regression coefficient between direct and indirect effect [57]. The regression coefficient of indirect effect of annual in amount -.000 (H6) and sustainability report readability in amount 0.02 (H7). Refers to the result in Table 3, indirect effect coefficient for readability of annual report was higher than direct effect regression coefficient in amount -.001, however for the readability for sustainability lower than direct effect. It means, H6 were accepted and H7 were rejected. In short, less readable annual report will increase the imbalance perceptions between company management and shareholders. Thus, the imbalance perceptions may impact on how judgements and decisions of firm value are shaped [32]. Asymmetry information is responsible to risky investment yet most investors are focused on how to reduce the risk [14,47]. After all, our control variable is considered significant. It means, our result may have different implication and application due to firm size, market growth and capital structure. Although this study failed to find evidence regarding the effect of readability levels on sustainability reports on firm value through asymmetry information as an intervening variable, the quality of voluntary disclosure tends to be worse than mandatory disclosure because the company will focus more on disclosures required by regulatory agencies and applicable accounting standards [47]. to avoid sanctions or fines due to violations of these rules or standards [30,31]. From the management side, companies must publish quality reports even though they are voluntary because companies should not rule out voluntary reporting and prioritize mandatory reporting on the grounds of their complementary nature [19].
This study performed advanced analysis to explore and validate the robustness of our findings. First, we illustrated the result by plot diagram as following Figure 3. The plot diagram used polynomial or quadratic regression to understand the actual prediction following the assumption that the influence is not always linear [58]. We examined the influence of sustainability and the high-low annual report readability on asymmetry information. In the following Figure 3, we found that the readability of sustainability report and the readability of annual report negatively influence asymmetry information. It indicates that more word and sentence will reduce asymmetry information.
On the other hand, more complicated text (low readability) will reduce asymmetry information. This result is consistent with the assumption that highly readable text is also determined by a weighting of disclosed information [59]. The FRE method is not considered the weighting of disclosed information, although it may have critical information in the length of the word. Otherwise, the influence of the readability of sustainability reports and high readability of annual reports tend to be positive. It indicates that in Indonesia, fewer words will increase asymmetry information.
In Figure 4, quadratic regression results are different from linear regression. We examined the influence of annual and high-low sustainability report readability on asymmetry information. We found that annual and sustainability report readability negatively influence asymmetry information. However, annual report and high sustainability report readability (less complicated or fewer words and sentences) have lower asymmetry information than annual report and sustainability report readability.
Figure 5 presented the comparation between quadratic and linear regression of asymmetry information and firm value. In linear regression, asymmetry information negatively influences firm value. Firm value is reduced if there is more asymmetry information. However, the result of quadratic regression is totally different. The relationship between asymmetry information and firm value is U-shaped curvilinear. At first, asymmetry information is negatively related to firm value, then after that, it is positively correlated with firm value. Figure 5 shows that low asymmetry information may create high firm value. The increasing of asymmetry information will reduce the firm value. The existence of asymmetry information does hamper an individual’s ability to extract and understand the information, it may still affect how judgments and decisions of firm value are shaped [60].
However, the influence of asymmetry information on firm value changes to be positive. This phenomenon could be understood from a psychological perspective. From a psychological perspective, it was demonstrated that complicated information resulting in asymmetry information could serve as a ‘desirable difficulty’ in improving long-term learning and retention through the disfluency effect [61]. Increasing perceived difficulty (e.g., via less readable information) associated with a cognitive task activates the more analytic elaborative thinking mode [13]. Therefore, in the long term, investors will understand that asymmetry information is a helpful way to protect the firm value [62]. This finding is consistent with [63] posits about investors processing fluency. An investor may have favorable judgment when asymmetry information is high because the bad news is covered very well [64]. Quadratic regression proved that in real case the relationship of asymmetry information was non-linear.
Figure 5 illustrated that the relationship between asymmetry information and firm value was U shape curvilinear. Moreover, this study performed advance analysis with separate asymmetry information into low and high level of asymmetry information (Figure 6). In highlight, different with low asymmetry information which pure negatively influence on firm value, instead high information has U shape relationship which the relationship is negative in beginning and change to be positive in certain level [58]. This phenomenon could be a reason of opportunistic company to create high asymmetry information.
Finally, this study summarizes the factors influencing firm value in the 3D graph in Figure 7. This figure shows that the company needs to simultaneously improve the readability of annual and sustainability reports and reduce asymmetry information to realize high firm value.
5. Conclusions
This study was conducted to determine the effect of the readability level of the annual and sustainability reports on firm value, as well as the role of asymmetry information as an intervening variable on the relationship between these variables of interests in companies classified as high-profile companies. Based on the analysis results show readability level of the sustainability report has no effect on the value of the company due to the fact that sustainability report was still voluntary during period of 2017-2020 therefore companies tend to focus on mandatory reports [65,66,67]. Furthermore, companies consider voluntary reports as a complement and overrides the quality of such reporting [19].
The readability level of the annual report negatively affects firm value. This may be because mandatory disclosures, which are typically better regulated by accounting standards and supervisory bodies, tend to be of higher quality than voluntary ones. While high readability can enhance report quality, it may also mask poor performance if not backed by substantive information [68,69]. The investors' understanding related to risk assessment in the company in the future increases. It impact on investors' hesitation [70,71], making it difficult for the decision-making process because the information contained in the report can be a reference in long-term decision making [24,30,31]. Moreover, the level of readability of the sustainability report has no effect on asymmetry information. The concept of sustainability report is still relatively new in Indonesia and the sample taken for this report is still voluntary so that the market may not pay too much attention to this reporting trend [29,30].
This study also found that higher readability in annual reports can reduce asymmetry information. However, this may occur because companies use clear and polished language to create a positive image, even when actual performance is weak. As a result, the reports appear credible but lack depth, leading investors to misinterpret the company’s true condition [55,62]. Asymmetry information does not affect the value of the company because the disclosures made by the company are still not maximized [72]. Asymmetry information leads to inefficient investment decisions, which in turn reduces firm value. In addition, external factors such as inflation, media coverage, and market growth also play a significant role in influencing company value [13,47].
Similarly, the readability level of sustainability reports does not influence firm value through asymmetry information. This is likely because voluntary disclosures are often of lower quality than mandatory ones, as companies tend to prioritize meeting regulatory requirements to avoid sanctions, rather than focusing on the quality of voluntary reporting [30,31]. However, this study found that the readability level of annual reports negatively affects firm value through asymmetry information as an intervening variable. This suggests that while mandatory reporting improves transparency and clarity—making information easier for stakeholders to understand—readability alone can have mixed effects. When reports are too polished without substance, investors may misjudge the company's true condition. Nonetheless, clearly written reports can still reflect effective risk management and a company’s commitment to meeting stakeholder expectations, helping stakeholders better interpret the intended message [19,24].
5.1. Research Limitation
In the implementation of this research, there are several limitations experienced by the author and it is hoped that these limitations will not reduce the benefits to be achieved. The researcher is aware that this research is far from perfect and has several weaknesses, both technically and theoretically. This study only obtained data from companies classified as high-profile companies in 2017-2020 in the annual report and sustainability report, so this research lacks secondary data. In addition, the measurement of the level of readability by using the measurement of FRE which is applied to the corporate social responsibility section of the annual report and the disclosure of environmental responsibility to the sustainability report, so that research has limitations in measuring the level of readability in the entire report. Another thing, this study only succeeded in proving the effect of 2 models out of 7 models, namely the level of readability in the annual report has a negative effect on firm value, the level of readability of the annual report has a negative effect on asymmetry information, and the level of readability in the annual report has a negative effect on firm value through asymmetry information as an intervening variable. Furthermore, this study only uses control variables using financial variables and financial ratios, namely debt to equity ratio, growth and firm size.
5.2. Suggestion for Future Research
Future researchers are expected to be able to use other indicators outside of this research, for example, the readability index of SMOG, Gunning Fog, or Flench-Kincaid in measuring readability. In addition, further research can use other non-financial variables to measure other variables that affect firm value such as compliance, risk management, or good corporate governance. Furthermore, further research is expected to expand data acquisition not only limited to companies classified as high-profile industries, increase the number of years and enlarge the research population in all reports published by companies.
5.3. Implication
Companies are expected to be able to reduce or avoid asymmetry information in company reporting by compiling quality reports without discriminating between mandatory and voluntary reports to maintain commitment in conveying the true state of the company through content and content so that it has a good impact on company value. In addition, for regulators, this research can be considered as a basis for making a basic framework or advice related to voluntary disclosure so that companies remain standard and not random in submitting voluntary disclosures by paying attention to and considering relevant content so that the information provided is in accordance with the needs of report users. At the same time, investors are expected to be able to choose a company by not only looking at the financial aspect and not simply believing that companies that have issued various reports are not indicated to be biasing information through the way the company conveys content and content through the narratives contained in the company's published reports, so that if the investment decisions made can be carried out with an optimal process.
Data Availability Statement
The data supporting the findings of this study are available from the corresponding author, Yudhistira Pradhipta Aryoko in Email address: d11322015@yuntech.edu.tw, upon reasonable request.
Acknowledgments
The authors would like to thank to Universitas Muhammadiyah Purwokerto and National Yunlin University of Science and Technology which supported and collaborated into this research.
Conflicts of Interest
The authors declare that there are no potential conflicts of interest regarding the publication of this article.
References
- T. Tiep Le and V. K. Nguyen, “The impact of corporate governance on firms’ value in an emerging country: The mediating role of corporate social responsibility and organisational identification,” Cogent Bus. Manag., vol. 9, no. 1, 2022. [CrossRef]
- E. Brigham and J. Houston, Basics of financial management. Salemba Empat, 2006.
- K. H. Titisari, Moeljadi, K. Ratnawati, and N. K. Indrawati, “The roles of cost of capital, corporate governance, and corporate social responsibility in improving firm value: Evidence from Indonesia,” Invest. Manag. Financ. Innov., vol. 16, no. 4, pp. 28–36, 2019. [CrossRef]
- S. N. Sulistyawati and A. W. Suryani, “Achieving Operational Efficiency through Risk Disclosure,” Asian J. Bus. Account., vol. 15, no. 1, pp. 149–178, 2022. [CrossRef]
- L. Loh, T. Thomas, and Y. Wang, “Sustainability reporting and firm value: Evidence from Singapore-listed companies,” Sustain., vol. 9, no. 11, pp. 1–12, 2017. [CrossRef]
- Ilyas, I.M.; Osiyevskyy, O., “Exploring the impact of sustainable value proposition on firm performance,” Eur. Manag. J., vol. 40, no. 5, pp. 729–740, 2022. [CrossRef]
- J. Cohen, L. Holder-webb, and D. Wood, “Retail Investors’ Perceptions Of The Decision-Usefulness Of Economic Performance, Governance And Corporate Social Responsibility Disclosures,” Behav. Res. Account., vol. 23, no. 1, pp. 109–129, 2011.
- D. S. Dhaliwal, S. Radhakrishnan, A. Tsang, and Y. G. Yang, “Nonfinancial disclosure and analyst forecast accuracy: International evidence on corporate social responsibility disclosure,” Account. Rev., vol. 87, no. 3, pp. 723–759, 2012. [CrossRef]
- Dwekat, A.; Meqbel, R.; Seguí-Mas, E.; Tormo-Carbó, G., “The role of the audit committee in enhancing the credibility of CSR disclosure: Evidence from STOXX Europe 600 members,” Bus. Ethics, Environ. Responsib., vol. 31, no. 3, pp. 718–740, 2022. [CrossRef]
- J. A. Nazari, K. Hrazdil, and F. Mahmoudian, “Assessing social and environmental performance through narrative complexity in CSR reports,” J. Contemp. Account. Econ., vol. 13, no. 2, pp. 166–178, 2017. [CrossRef]
- G. C. Biddle, G. Hilary, and R. S. Verdi, “How does financial reporting quality relate to investment efficiency?,” J. Account. Econ., vol. 48, no. 2–3, pp. 112–131, 2009. [CrossRef]
- S. Berthelot, C. Francoeur, and R. Labelle, “Corporate governance mechanisms, accounting results and stock valuation in Canada,” Int. J. Manag. Financ., vol. 8, no. 4, pp. 332–343, 2012. [CrossRef]
- J. hui Luo, X. Li, and H. Chen, “Annual report readability and corporate agency costs,” China J. Account. Res., vol. 11, no. 3, pp. 187–212, 2018. [CrossRef]
- Al Natour, A.R.; Meqbel, R.; Kayed, S.; Zaidan, H., “The Role of Sustainability Reporting in Reducing Information Asymmetry: The Case of Family-and Non-Family-Controlled Firms,” Sustain., vol. 14, no. 11, 2022. [CrossRef]
- Risman, A.; Salim, U.; Sumiati, S.; Indrawati, N.K., “Commodity prices, exchange rates and investment on firm’s value mediated by business risk: A case from Indonesian stock exchange,” Eur. Res. Stud. J., vol. 20, no. 3, pp. 511–524, 2017. [CrossRef]
- M. S. Y. Omran, M. A. A. Zaid, and A. Dwekat, “The relationship between integrated reporting and corporate environmental performance: A green trial,” Corp. Soc. Responsib. Environ. Manag., vol. 28, no. 1, pp. 427–445, 2021. [CrossRef]
- N. Shroff, A. X. Sun, H. D. White, and W. Zhang, “Voluntary disclosure and information asymmetry: Evidence from the 2005 securities offering reform,” J. Account. Res., vol. 51, no. 5, pp. 1299–1345, 2013. [CrossRef]
- M. Hirdinis, “Capital structure and firm size on firm value moderated by profitability,” Int. J. Econ. Bus. Adm., vol. 7, no. 1, pp. 174–191, 2019. [CrossRef]
- C. Arena, L. Ronald, and V. Petros, “Carrot or stick: CSR disclosures by Southeast Asian Companies,” Sustain. Accounting, Manag. anad Policy J., vol. 9, no. 4, pp. 422-454., 2018.
- F. Tocchini and G. Cafagna, “Institute of Indonesia Chartered Accountants. 2018”.
- D. van de Burgwal and R. J. O. Vieira, “Environmental disclosure determinants in Dutch listed companies,” Rev. Contab. Finanças - USP, vol. 25, no. 64, pp. 60–78, 2014.
- J. Roberts, “The possibilities of accountability,” Accounting, Organ. Soc., vol. 16, no. 4, pp. 355–368, 1991. [CrossRef]
- Tempo.com,.
- Nilipour, A.; De Silva, T.A.; Li, X., “The readability of sustainability reporting in new zealand over time,” Australas. Accounting, Bus. Financ. J., vol. 14, no. 3, pp. 86–107, 2020. [CrossRef]
- D. M. Patten, “Exposure, legitimacy, and social disclosure,” J. Account. Public Policy, vol. 10, no. 4, pp. 297–308, 1991. [CrossRef]
- J. Dowling and J. Pfeffer, “Pacific Sociological Association Organizational Legitimacy: Social Values and Organizational Behavior,” Source Pacific Sociol. Rev., vol. 18, no. 1, pp. 122–136, 1975.
- F. Hourneaux, M. L. da S. Gabriel, and D. A. Gallardo-Vázquez, “Triple bottom line and sustainable performance measurement in industrial companies,” Rev. Gest., vol. 25, no. 4, pp. 413–429, 2018. [CrossRef]
- Ioannou, I.; Serafeim, G., “The Consequences of Mandatory Corporate Sustainability Reporting,” SSRN Electron. J., pp. 1–49, 2012. [CrossRef]
- D. Adhariani and E. du Toit, “Readability of sustainability reports: evidence from Indonesia,” J. Account. Emerg. Econ., vol. 10, no. 4, pp. 621–636, 2020. [CrossRef]
- D. Sriani and D. Agustia, “Does voluntary integrated reporting reduce information asymmetry? Evidence from Europe and Asia,” Heliyon, vol. 6, no. 12, 2020. [CrossRef]
- Dadashi, I.; Norouzi, M., “Investigating the Mediating Effect of Financial Reporting Readability on the Relationship between Earnings Management and Cost of Capital,” J. Account. Knowl., vol. 11, no. 1, 2020. [CrossRef]
- R. Gray, M. Javad, D. M. Power, and C. D. Sinclair, “Social and environmental disclosure and corporate characteristics: A research note and extension,” J. Bus. Financ. Account., vol. 28, no. 3–4, pp. 327–356, 2001. [CrossRef]
- W. Przepiorka and J. Berger, “Teori Persinyalan Berkembang: Sinyal dan Tanda Dapat Dipercaya dalam Pertukaran Sosial,” Soc. Dilemmas, Institutions, Evol. Coop., pp. 373–392, 2017.
- W. M. W. Mohammad and S. Wasiuzzaman, “Environmental, Social and Governance (ESG) disclosure, competitive advantage and performance of firms in Malaysia,” Clean. Environ. Syst., vol. 2, no. January, p. 100015, 2021. [CrossRef]
- B. Tjahjadi, N. Soewarno, and F. Mustikaningtiyas, “Good corporate governance and corporate sustainability performance in Indonesia: A triple bottom line approach,” Heliyon, vol. 7, no. 3, p. e06453, 2021. [CrossRef]
- Z. Wang, T. S. Hsieh, and J. Sarkis, “CSR Performance and the Readability of CSR Reports: Too Good to be True?,” Corp. Soc. Responsib. Environ. Manag., vol. 25, no. 1, pp. 66–79, 2018. [CrossRef]
- J. Cheng, J. Zhao, C. Xu, and H. Gong, “Annual Report Readability and Earnings Management: Evidence from Chinese Listed Companies,” vol. 181, no. Icsshe, pp. 794–797, 2018. [CrossRef]
- J. S. Hughes, J. Liu, J. Liu, and E. Org, “UCLA Recent Work Title Information, Diversification, and Cost of Capital Permalink https://escholarship.org/uc/item/82j2d59r Publication Date,” 2005, [Online]. Available: https://escholarship.org/uc/item/82j2d59r.
- Rehman, I.U.; Naqvi, S.K.; Shahzad, F.; Jamil, A., “Corporate social responsibility performance and information asymmetry: the moderating role of ownership concentration,” Soc. Responsib. J., vol. 18, no. 2, pp. 424–440, 2022. [CrossRef]
- M. Noh, “Culture and annual report readability,” Int. J. Account. Inf. Manag., vol. 29, no. 4, pp. 583–602, 2021. [CrossRef]
- Harymawan, I.; Nasih, M.; Putra, F.K.G., “External Assurance On Sustainability Report Disclosure And Firm Value: Evidence From Indonesia And Malaysia,” Entrep. Sustain. Issues, vol. 7, no. 3, pp. 1484–1499, 2020. [CrossRef]
- D. S. adillah Maylawati, Y. J. Kumar, F. B. Kasmin, and M. A. Ramdhani, “Readability Evaluation Metrics for Indonesian Automatic Text Summarization: A Systematic Review,” J. Eng. Sci. Technol. Rev., vol. 17, no. 5, pp. 199–210, 2024. [CrossRef]
- Habib, A.; Bhatti, M.I.; Khan, M.A.; Azam, Z., “Cash Holding and Firm Value in the Presence of Managerial Optimism,” J. Risk Financ. Manag., vol. 14, no. 8, 2021. [CrossRef]
- C. Clarkson, “Covariant approach for perturbations of rotationally symmetric spacetimes,” Phys. Rev. D - Part. Fields, Gravit. Cosmol., vol. 76, no. 10, 2007. [CrossRef]
- E. Su and K. Tokmakcioglu, “A comparison of bid-ask spread proxies and determinants of bond bid-ask spread,” Borsa Istanbul Rev., vol. 21, no. 3, pp. 227–238, 2021. [CrossRef]
- T. M. Almomani, M. I. S. Obeidat, M. A. Almomani, and N. M. A. M. Y. Darkal, “Capital Structure and Firm Value Relationship: The Moderating Role of Profitability and Firm Size Evidence from Amman Stock Exchange,” WSEAS Trans. Environ. Dev., vol. 18, pp. 1073–1084, 2022. [CrossRef]
- H. Hasbi, “Islamic Microfinance Institution: The Capital Structure, Growth, Performance and Value of Firm in Indonesia,” Procedia - Soc. Behav. Sci., vol. 211, pp. 1073–1080, 2015. [CrossRef]
- S. Gu and R. N. A. Dodoo, “The Impact of Firm Performance on Annual Report Readability,” Int. Res. J. Bus. Stud., vol. 14, no. 1, pp. 59–68, 2021. [CrossRef]
- H. Muhammad, S. Migliori, and A. Consorti, “Corporate governance and R&D investment: does firm size matter?,” Technol. Anal. Strateg. Manag., vol. 36, no. 3, pp. 518–532, 2024. [CrossRef]
- L. G. R. V. De Silva and Y. K. W. Banda, “Impact of CEO Characteristics on Capital Structure: Evidence from a Frontier Market,” Asian J. Bus. Account., vol. 15, no. 1, pp. 71–101, 2022. [CrossRef]
- Ghozali, I., “Aplikasi Analisis Multivariate Dengan Pogram IBM SPSS,” Sembilan. Universitas Diponegoro Semarang, 2018.
- W. H. DuBay, “The principles of readability: A brief introduction to readability research,” Impact Inf., no. 949, pp. 1–72, 2004.
- C. Kim, K. Wang, and L. Zhang, “Readability of 10-K Reports and Stock Price Crash Risk,” Contemp. Account. Res., vol. 36, no. 2, pp. 1184–1216, 2019. [CrossRef]
- S. Wang, X. Liu, and J. Zhou, Readability is decreasing in language and linguistics, vol. 127, no. 8. Springer International Publishing, 2022. [CrossRef]
- M. Jayasree and R. Shette, “Readability of Annual Reports and Operating Performance of Indian Banking Companies,” IIM Kozhikode Soc. Manag. Rev., vol. 10, no. 1, pp. 20–30, 2021. [CrossRef]
- D. Kong, T. Xiao, and S. Liu, “Asymmetric information, firm investment and stock prices,” China Financ. Rev. Int., vol. 1, no. 1, pp. 6–33, 2011. [CrossRef]
- M. Hair, J. F., Hult, G. T. M., Ringle, C. M., & Sarstedt, “A Primer on Partial Least Squares Structural Equation Modeling (PLS-SEM). Thousand Oaks,” Sage, p. 165, 2017.
- R. Ramanathan, “Understanding Complexity: the Curvilinear Relationship Between Environmental Performance and Firm Performance,” J. Bus. Ethics, vol. 149, no. 2, pp. 383–393, 2018. [CrossRef]
- H. Scott Asay, W. Brooke Elliott, and K. Rennekamp, “Disclosure readability and the sensitivity of investors’ valuation judgments to outside information,” Account. Rev., vol. 92, no. 4, pp. 1–25, 2017. [CrossRef]
- E. Besuglov and N. Crasselt, “The effect of readability and language choice in management accounting reports on risk-taking: an experimental study,” J. Bus. Econ., vol. 91, no. 1, pp. 5–33, 2021. [CrossRef]
- T. Seufert, F. Wagner, and J. Westphal, “The effects of different levels of disfluency on learning outcomes and cognitive load,” Instr. Sci., vol. 45, no. 2, pp. 221–238, 2017. [CrossRef]
- Khatali, A., “Identifying Effects of Information Asymmetry on Firm Performance,” Int. J. Econ. Financ. Manag. Sci., vol. 8, no. 2, p. 75, 2020. [CrossRef]
- Santra, I.K.; Wirga, I.W.; Sanjaya, I.B.; Yasa, I.K.; Waelan, “How the Information Asymmetry Determine Firm Value? A Case Study on Real Estate Company in IDX 2020-2022,” Int. J. Business, Econ. Manag., vol. 6, no. 2, pp. 88–93, 2023.
- X. C. Cui, “Calisthenics with words: The effect of readability and investor sophistication on investors’ performance judgment,” Int. J. Financ. Stud., vol. 4, no. 1, pp. 1–14, 2016. [CrossRef]
- Anggara, A.A.; Aryoko, Y.P.; Dewandaru, R.O.; Kharismasyah, A.Y.; Fatchan, I.N., "Does Maintaining Resources, Diversification, and Internationalization Matter for Achieving High Firm Performance? A Sustainable Competitiveness Strategy for China Taipei Firms," Sustainability., vol. 17, no. 4, pp. 1576, 2025. [CrossRef]
- E. Handayani, A. A. Anggara, and I. Hapsari, "Developing an Instrument and Assessing SDGs Implementation in Indonesian Higher Education," International Journal of Sustainable Development & Planning., vol. 19, no. 2, 2024. [CrossRef]
- Anggara, A.A.; Weihwa, P.; Khananda, R.W.V.; Randikaparsa, I., "How Do Indonesia Firms Encounter Covid-19 Pandemic? An Evidence of Transformation of the Roots of Competitive Advantage from EMDE Country," Quality-Access to Success., vol. 25, no. 198, 2024. [CrossRef]
- F. Fatchan, P. H. P. Mahandani, I. N. Fatchan, and F. Achyani, "Family and Politics to Related Party Transaction in Indonesia’s Mining Companies: Does Corporate Governance Matter?", Riset Akuntansi dan Keuangan Indonesia, vol. 8, no. 2, pp. 202-217, 2023. https://doi.org/10.23917/reaksi.v8i2.2902.
- F. Achyani, L. Lovita, and E. Putri, "The Effect of Good Corporate Governance, Sales Growth, and Capital Intensity on Accounting Conservatism: Empirical Study on Manufacturing Companies Listed on the Indonesia Stock Exchange 2017-2019," Riset Akuntansi dan Keuangan Indonesia, vol. 6, no. 3, pp. 255-267, 2021. [CrossRef]
- F. H. Fatchan and A. K. Widagdo, "Perplexity in Accounting Conservatism: A Critical Review," Riset Akuntansi dan Keuangan Indonesia, vol. 6, no. 1, pp. 42-53, 2021. [CrossRef]
- Z. Zulfikar, A. D. B. Bawono, M. Mujiyati, and S. Wahyuni, "Sharia Corporate Governance and Financial Reporting Timeliness: Evidence of the Implementation of Banking Regulations in Indonesia," Banks and Bank Systems, vol. 15, no. 4 pp. 179, 2020. [CrossRef]
- R. Trisnawati, S. D. Wardati, and E. Putri, "The Influence of Majority Ownership, Profitability, Size of the Board of Directors, and Frequency of Board of Commissioners Meetings on Sustainability Report Disclosure," Riset Akuntansi Dan Keuangan Indonesia, vol. 7, no. 1, pp. 94-104, 2022. [CrossRef]
Figure 1.
Proposed model.
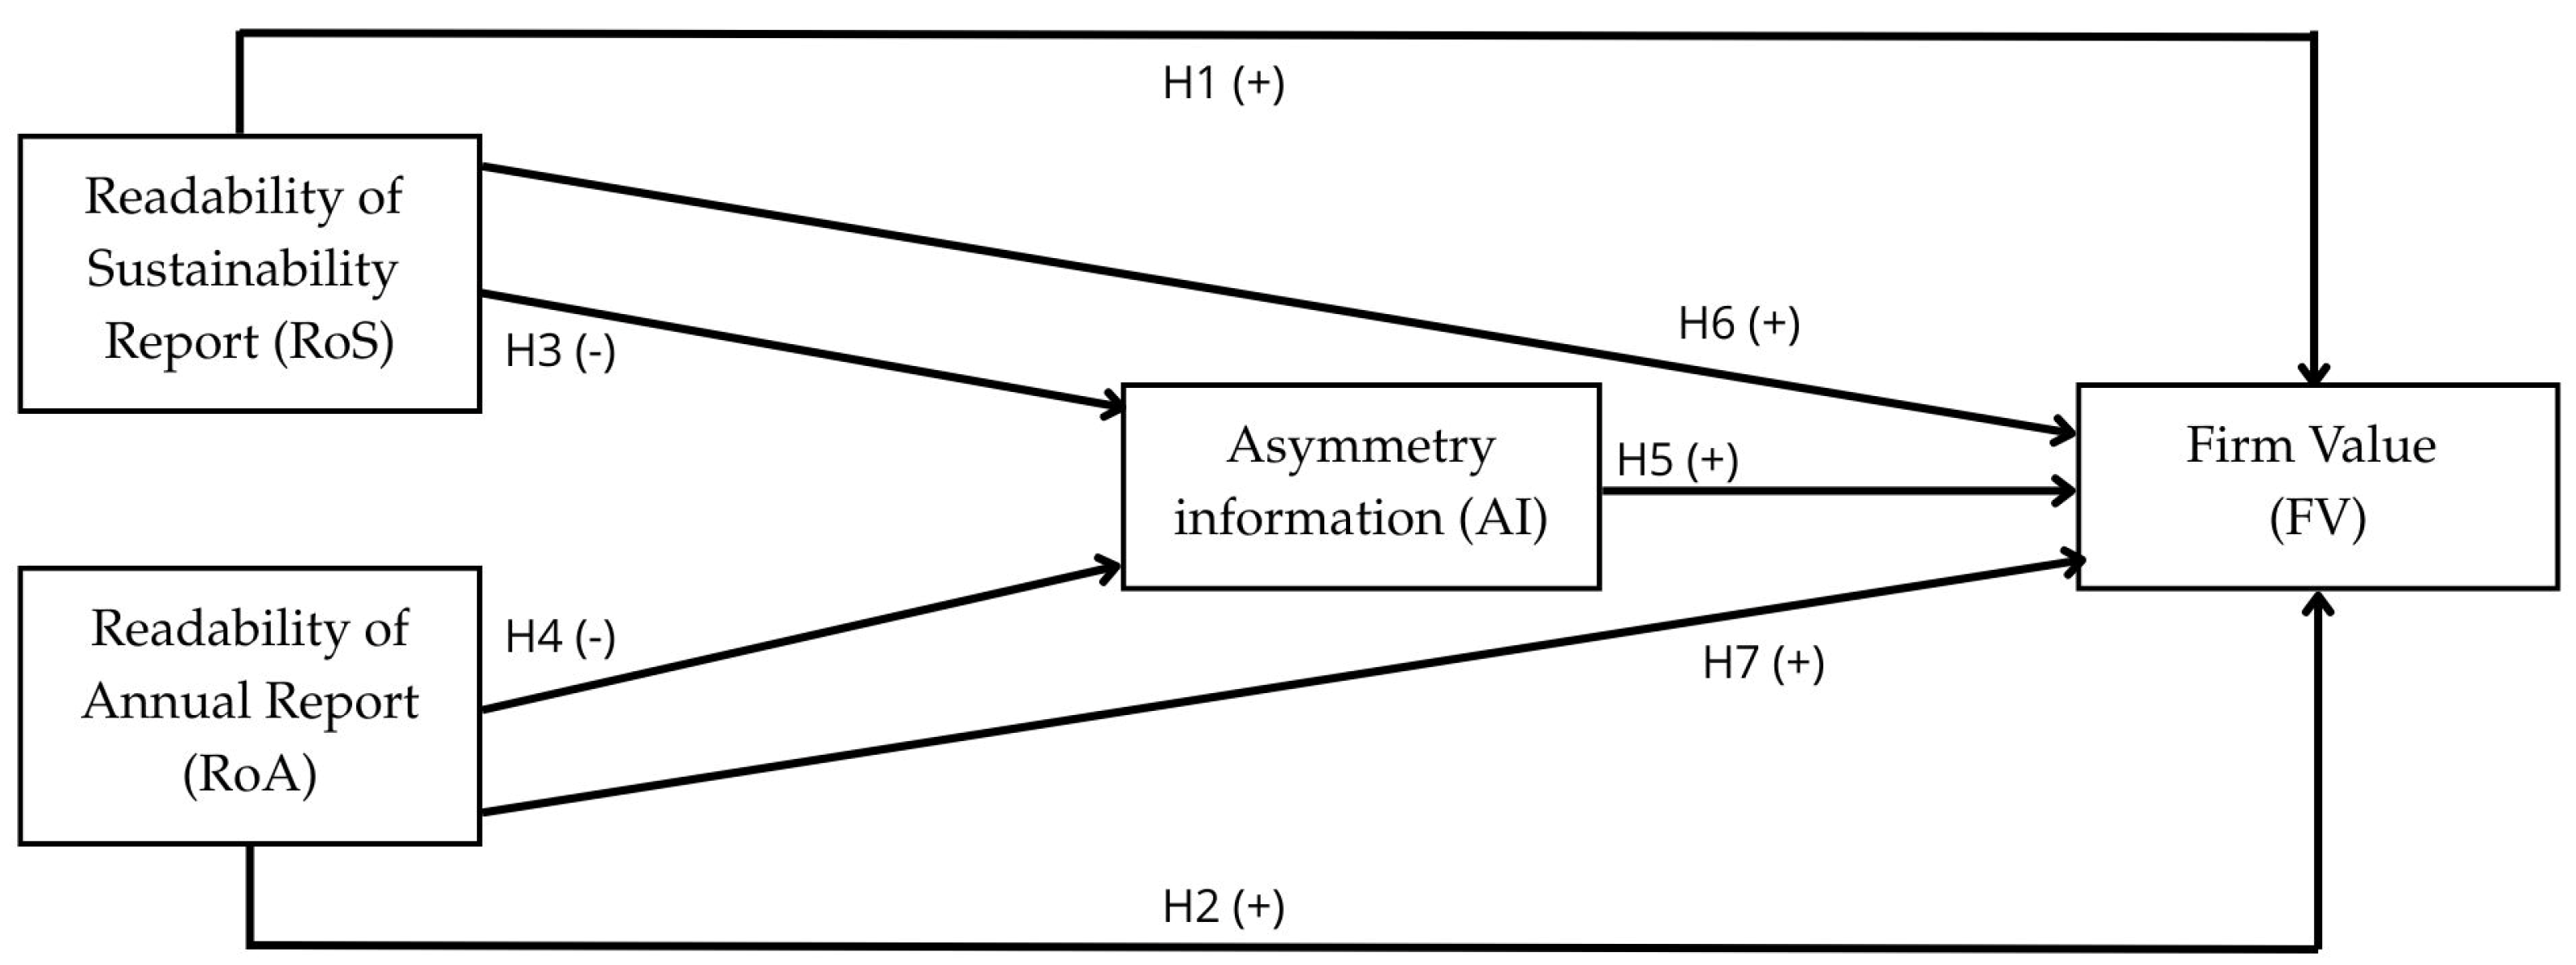
Figure 3.
The relationship of readability of sustainability report and high-low readability of annual report on asymmetric information.
Figure 3.
The relationship of readability of sustainability report and high-low readability of annual report on asymmetric information.
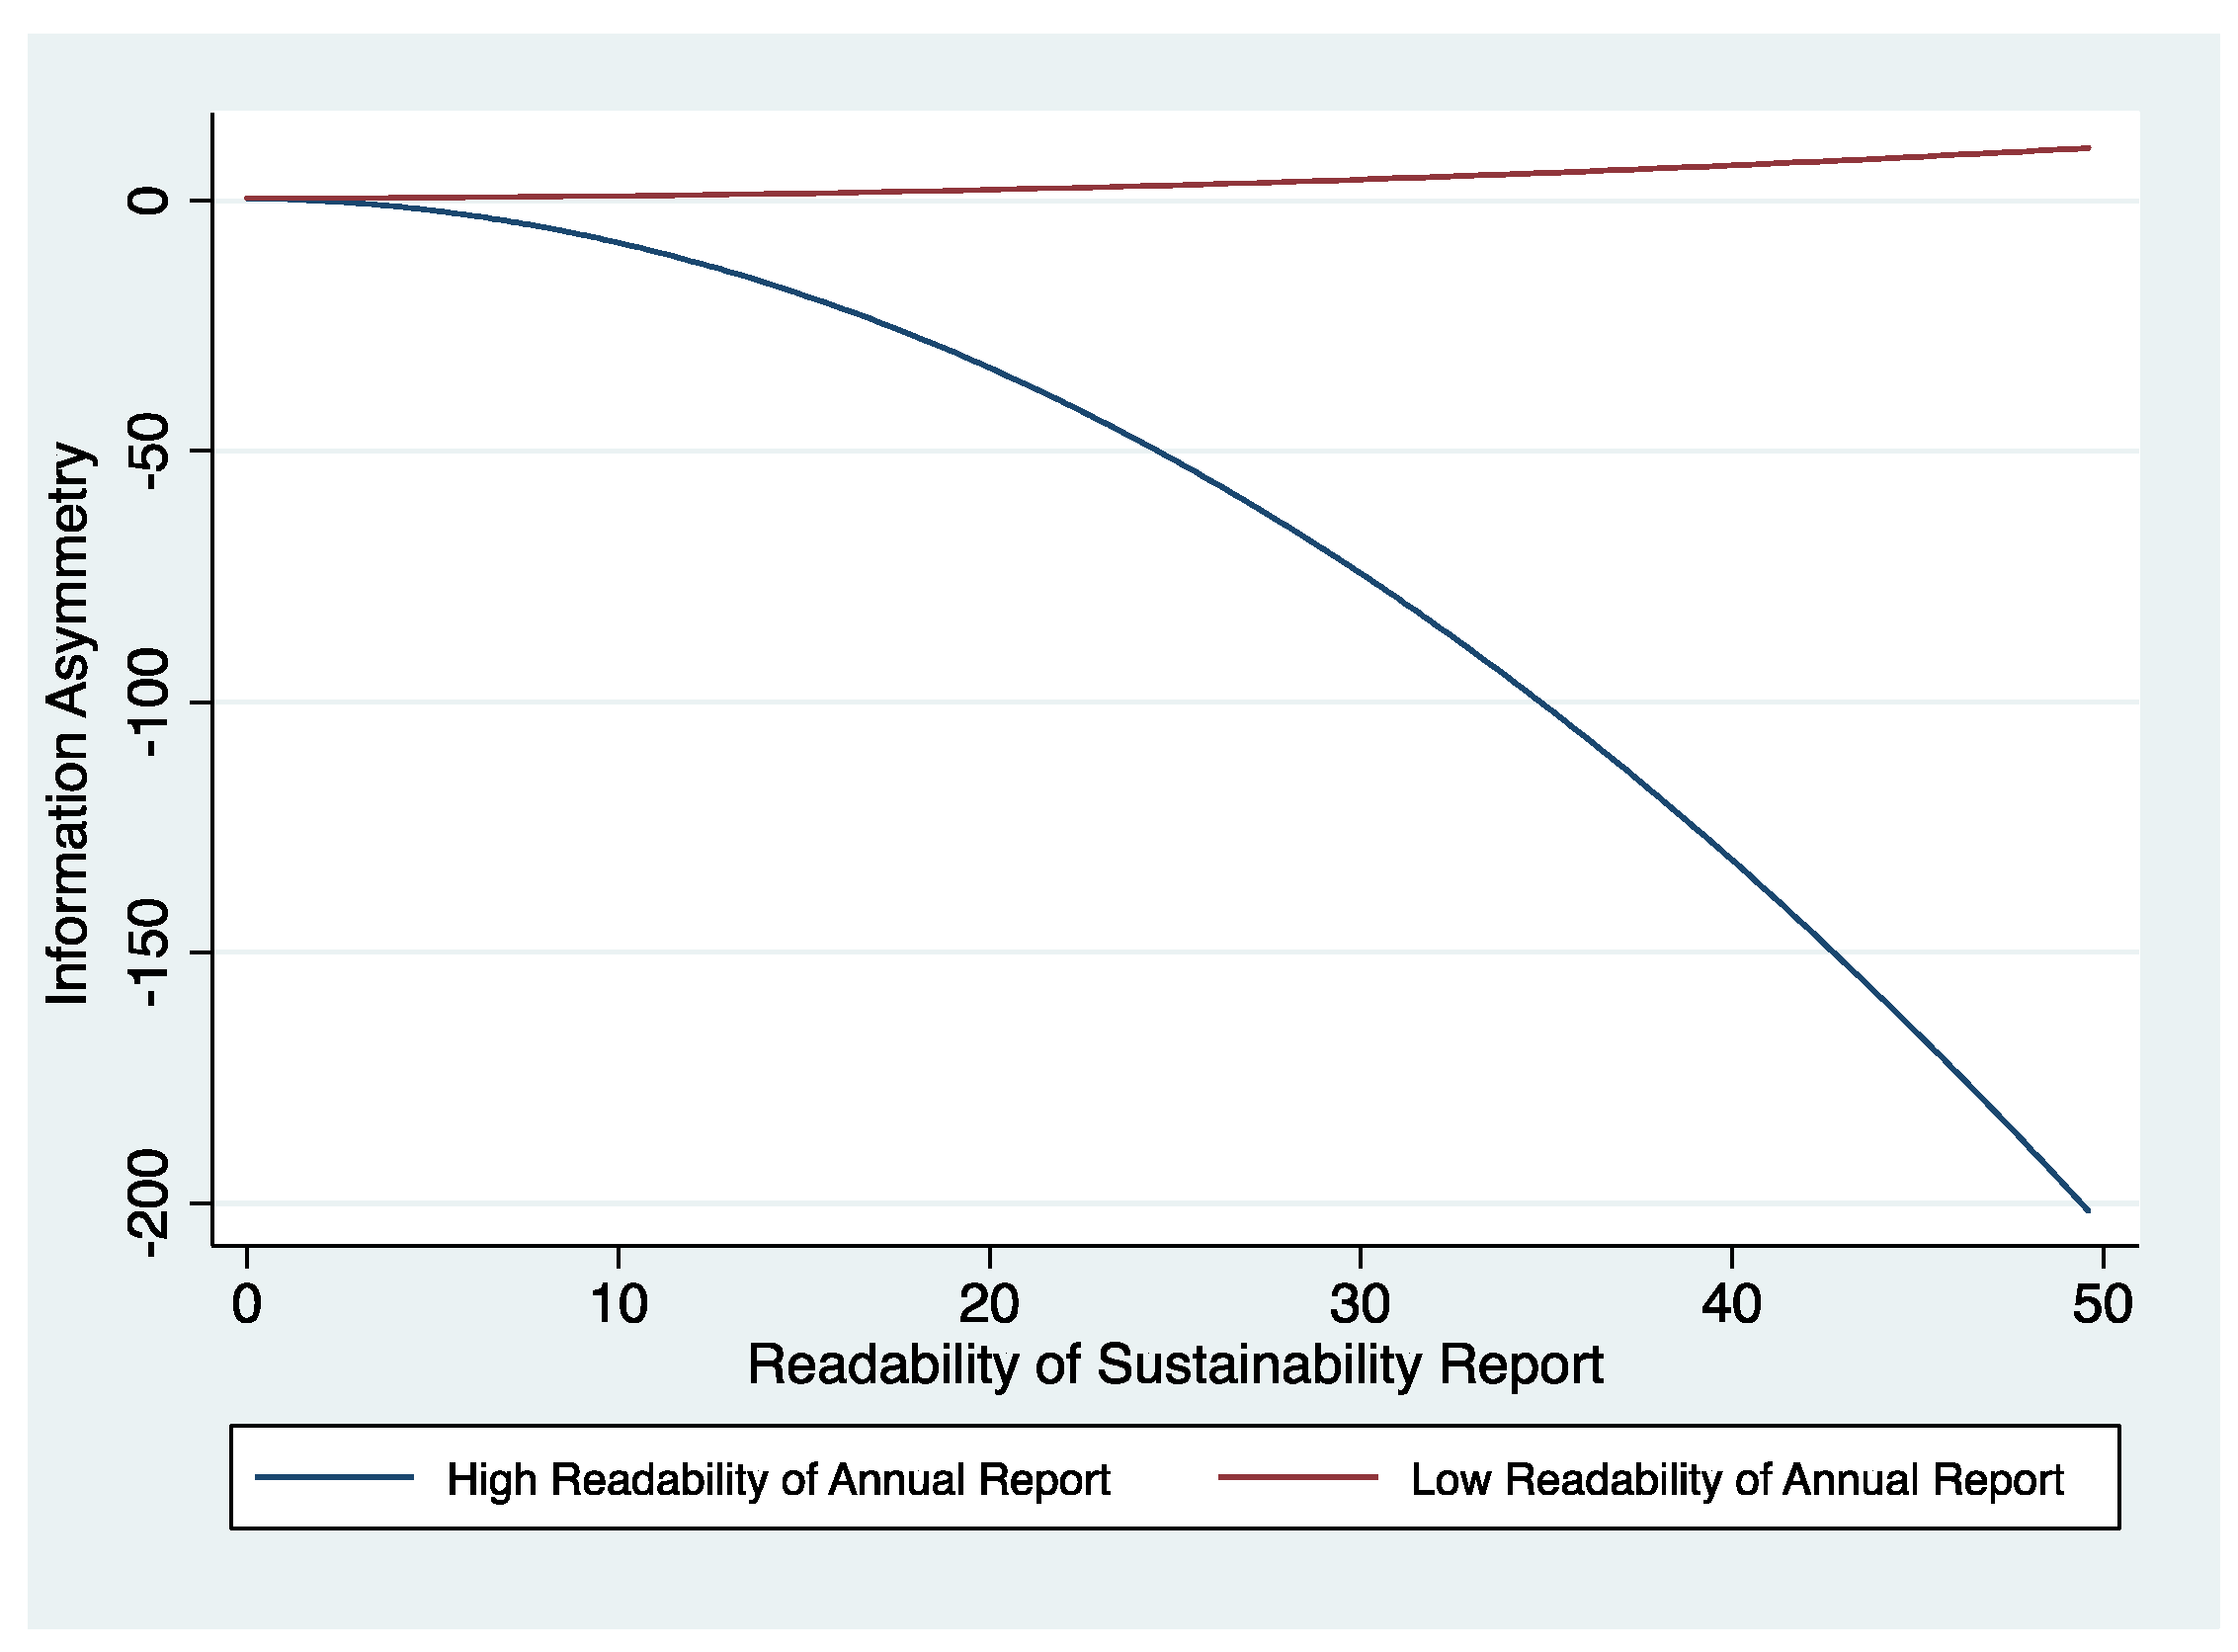
Figure 4.
The relationship of readability of annual report and high-low readability of sustainability report on asymmetric information.
Figure 4.
The relationship of readability of annual report and high-low readability of sustainability report on asymmetric information.
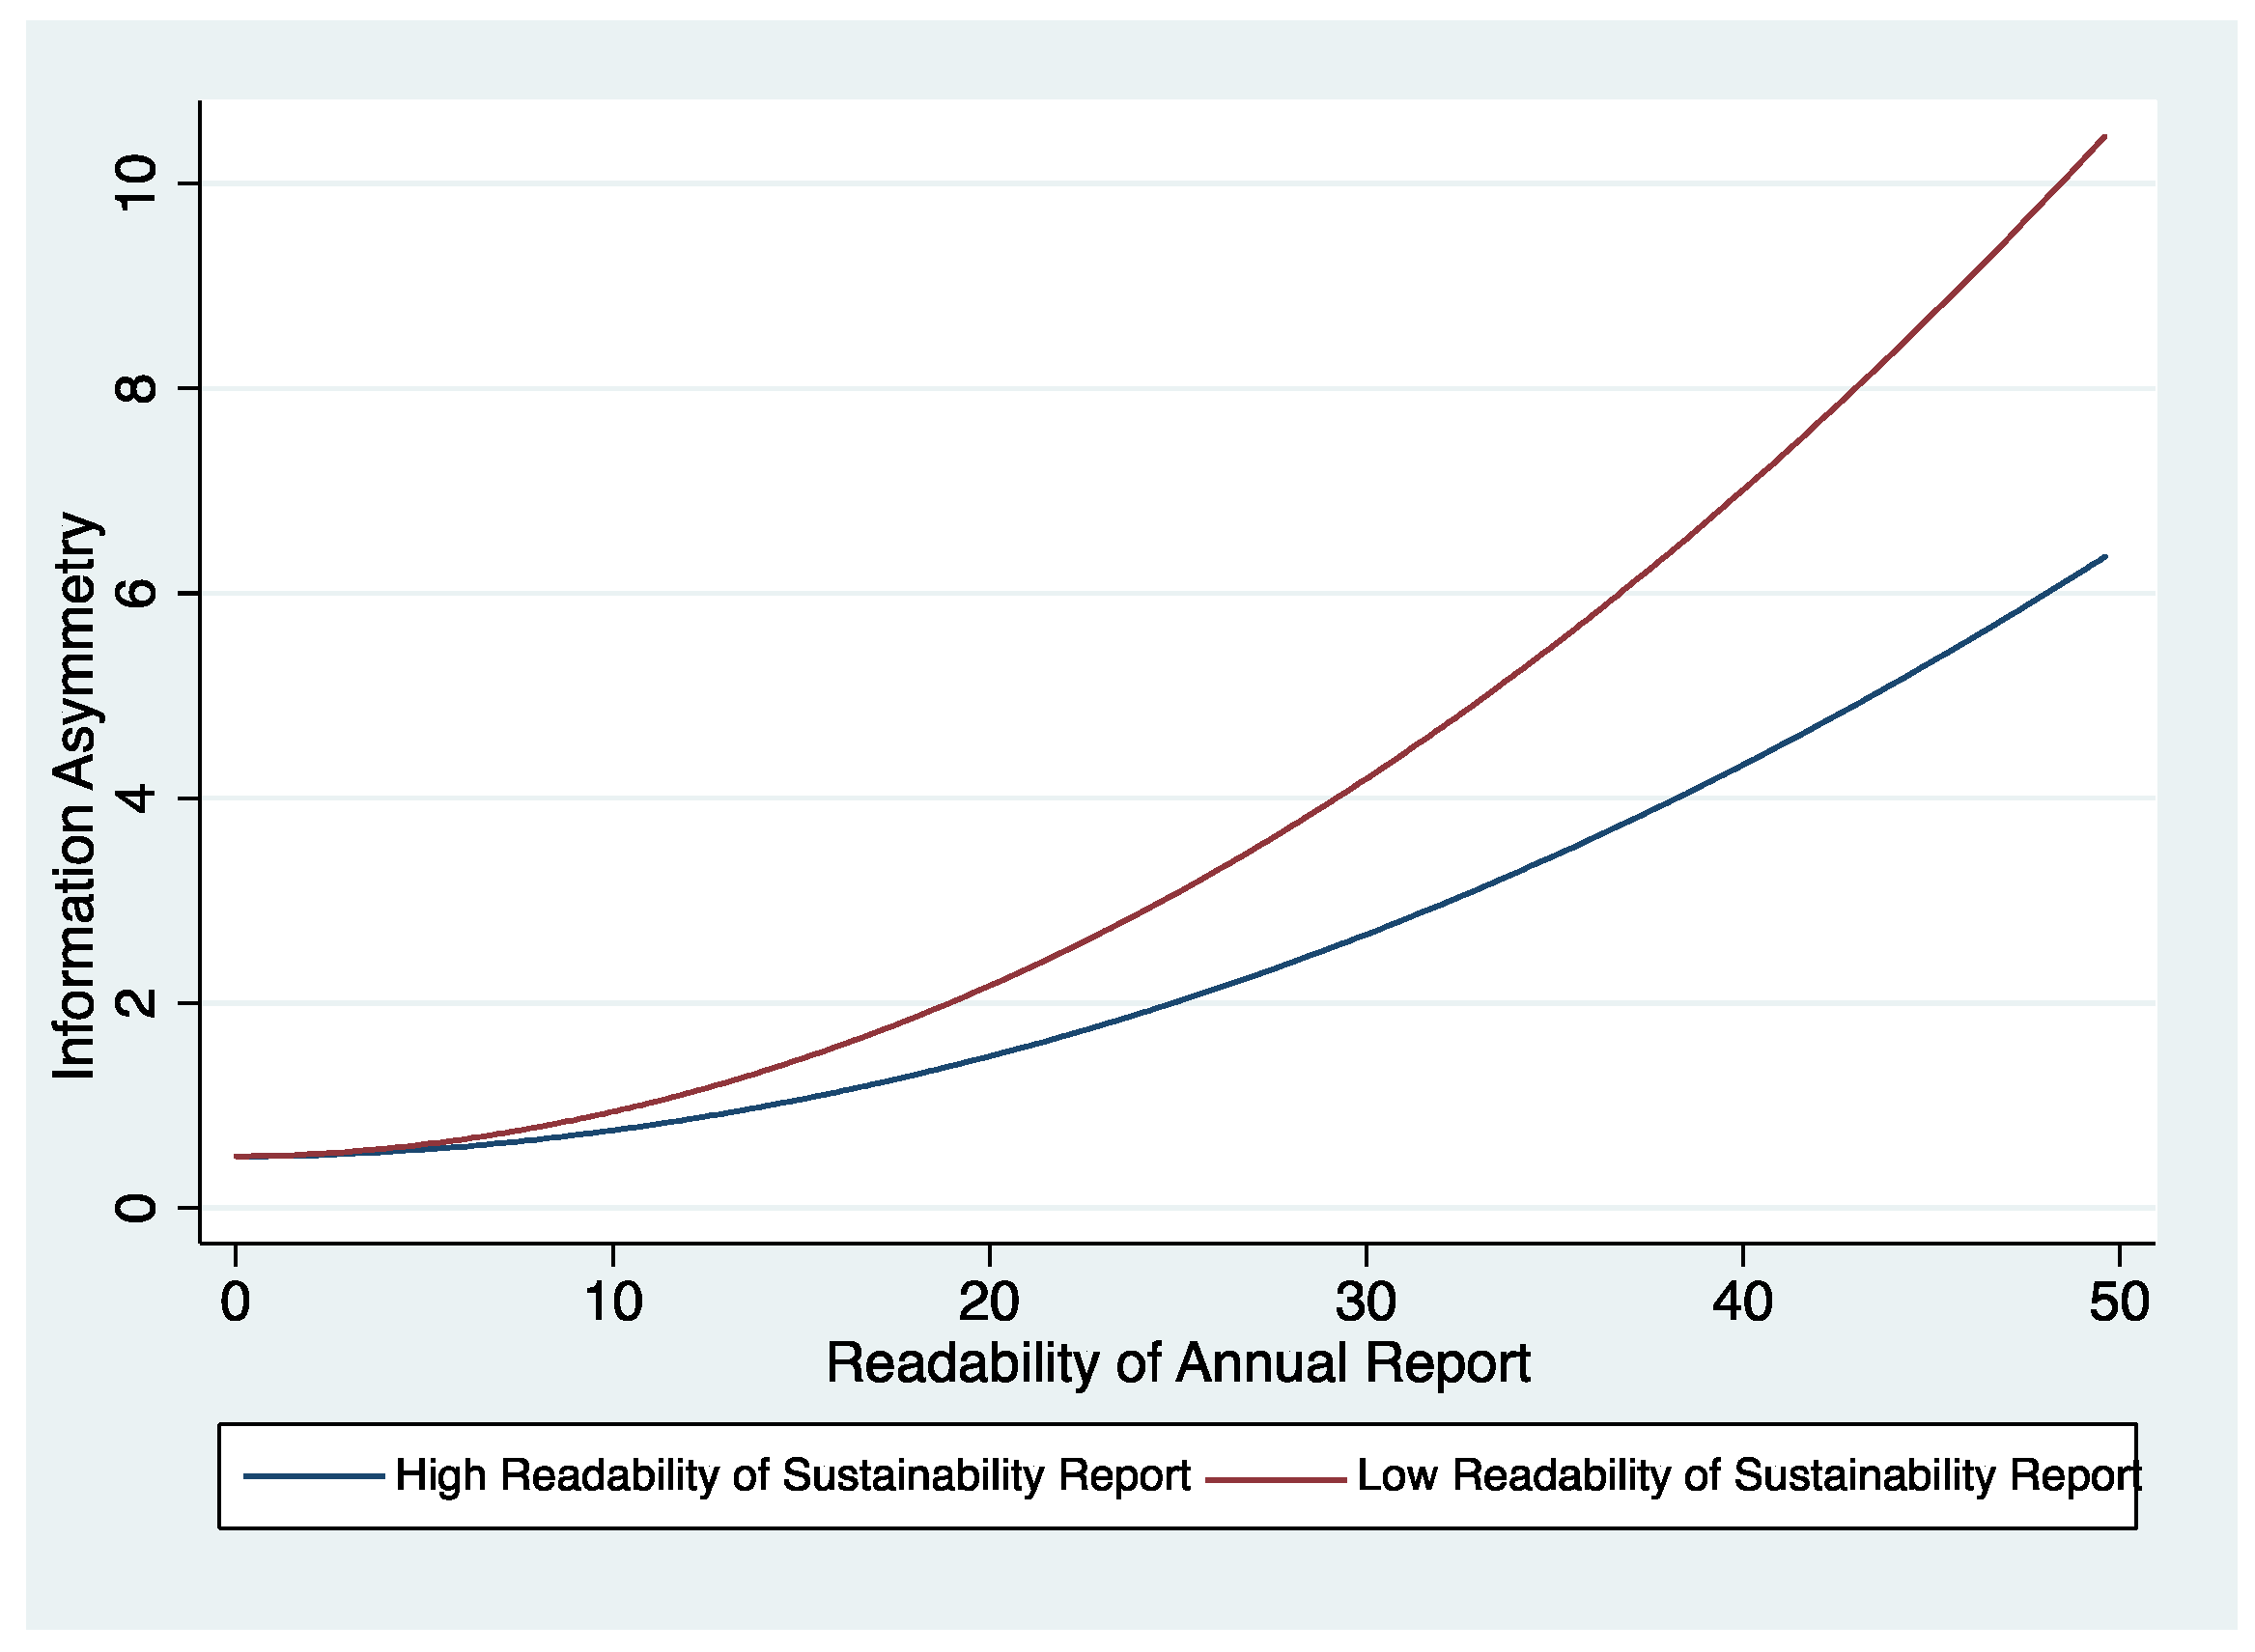
Figure 5.
Quadratic vs linier regression (U shape curvilinear).
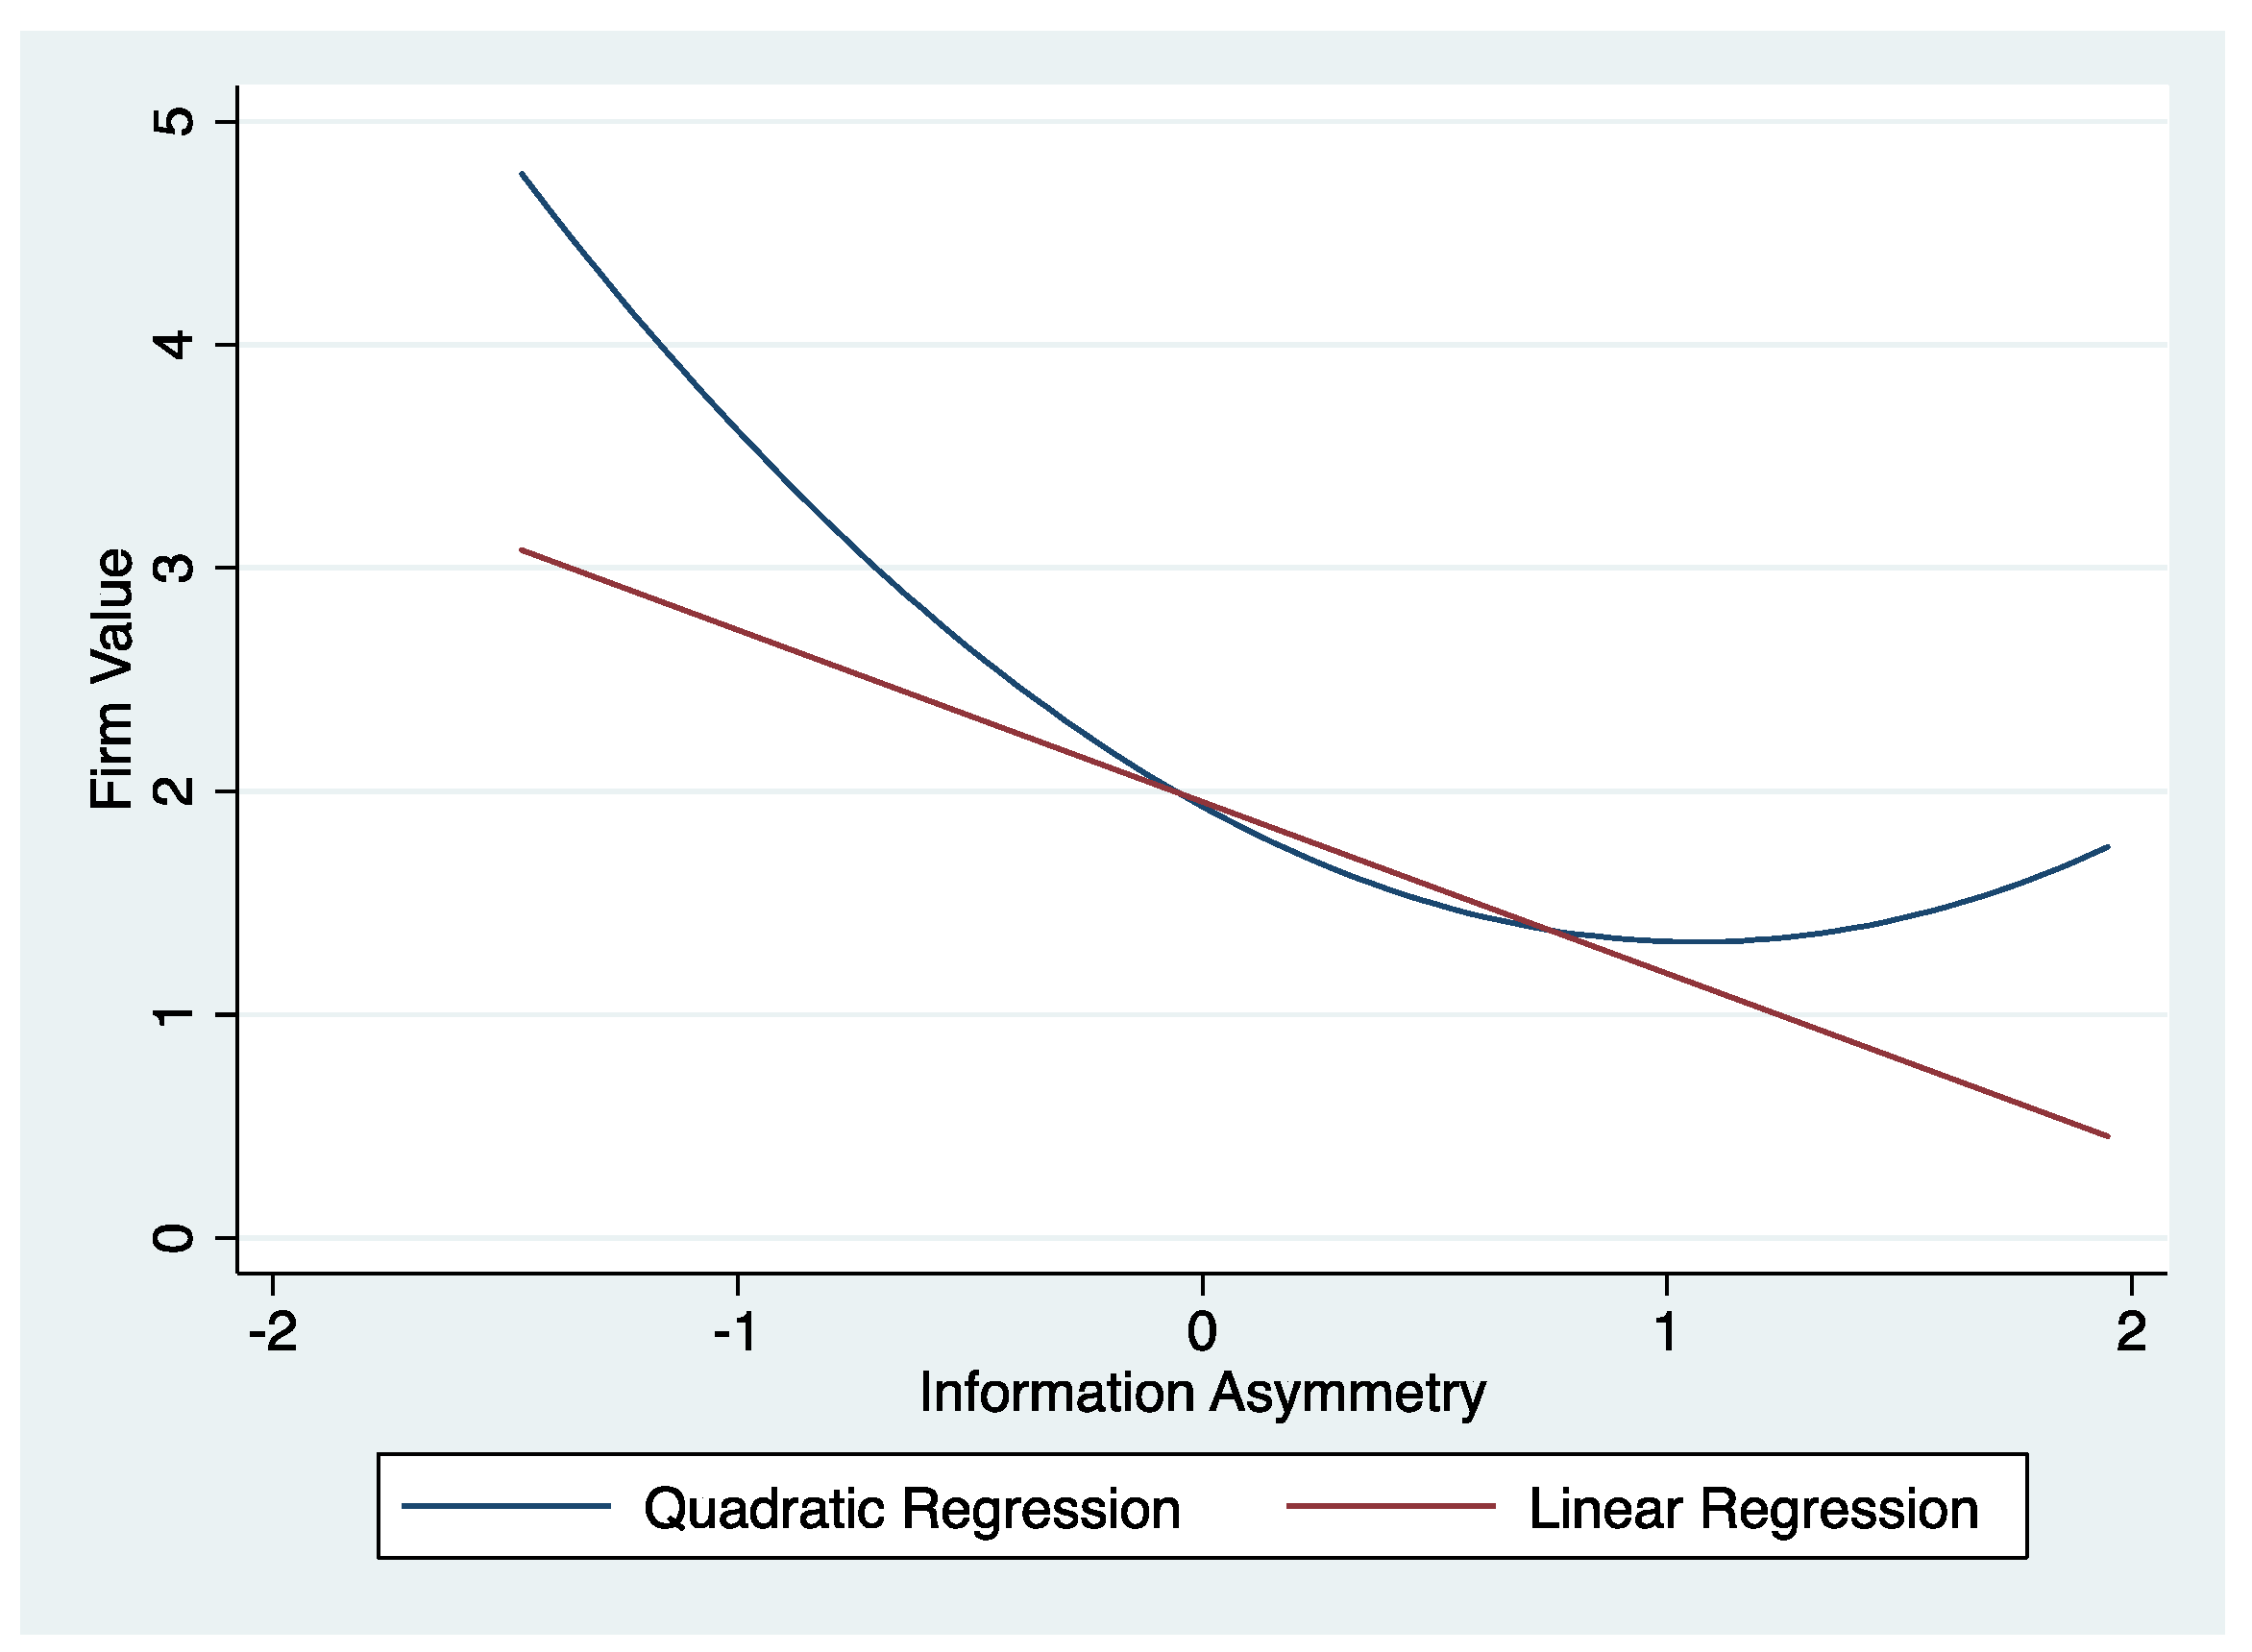
Figure 6.
The influence of high and low asymmetric information on firm value.
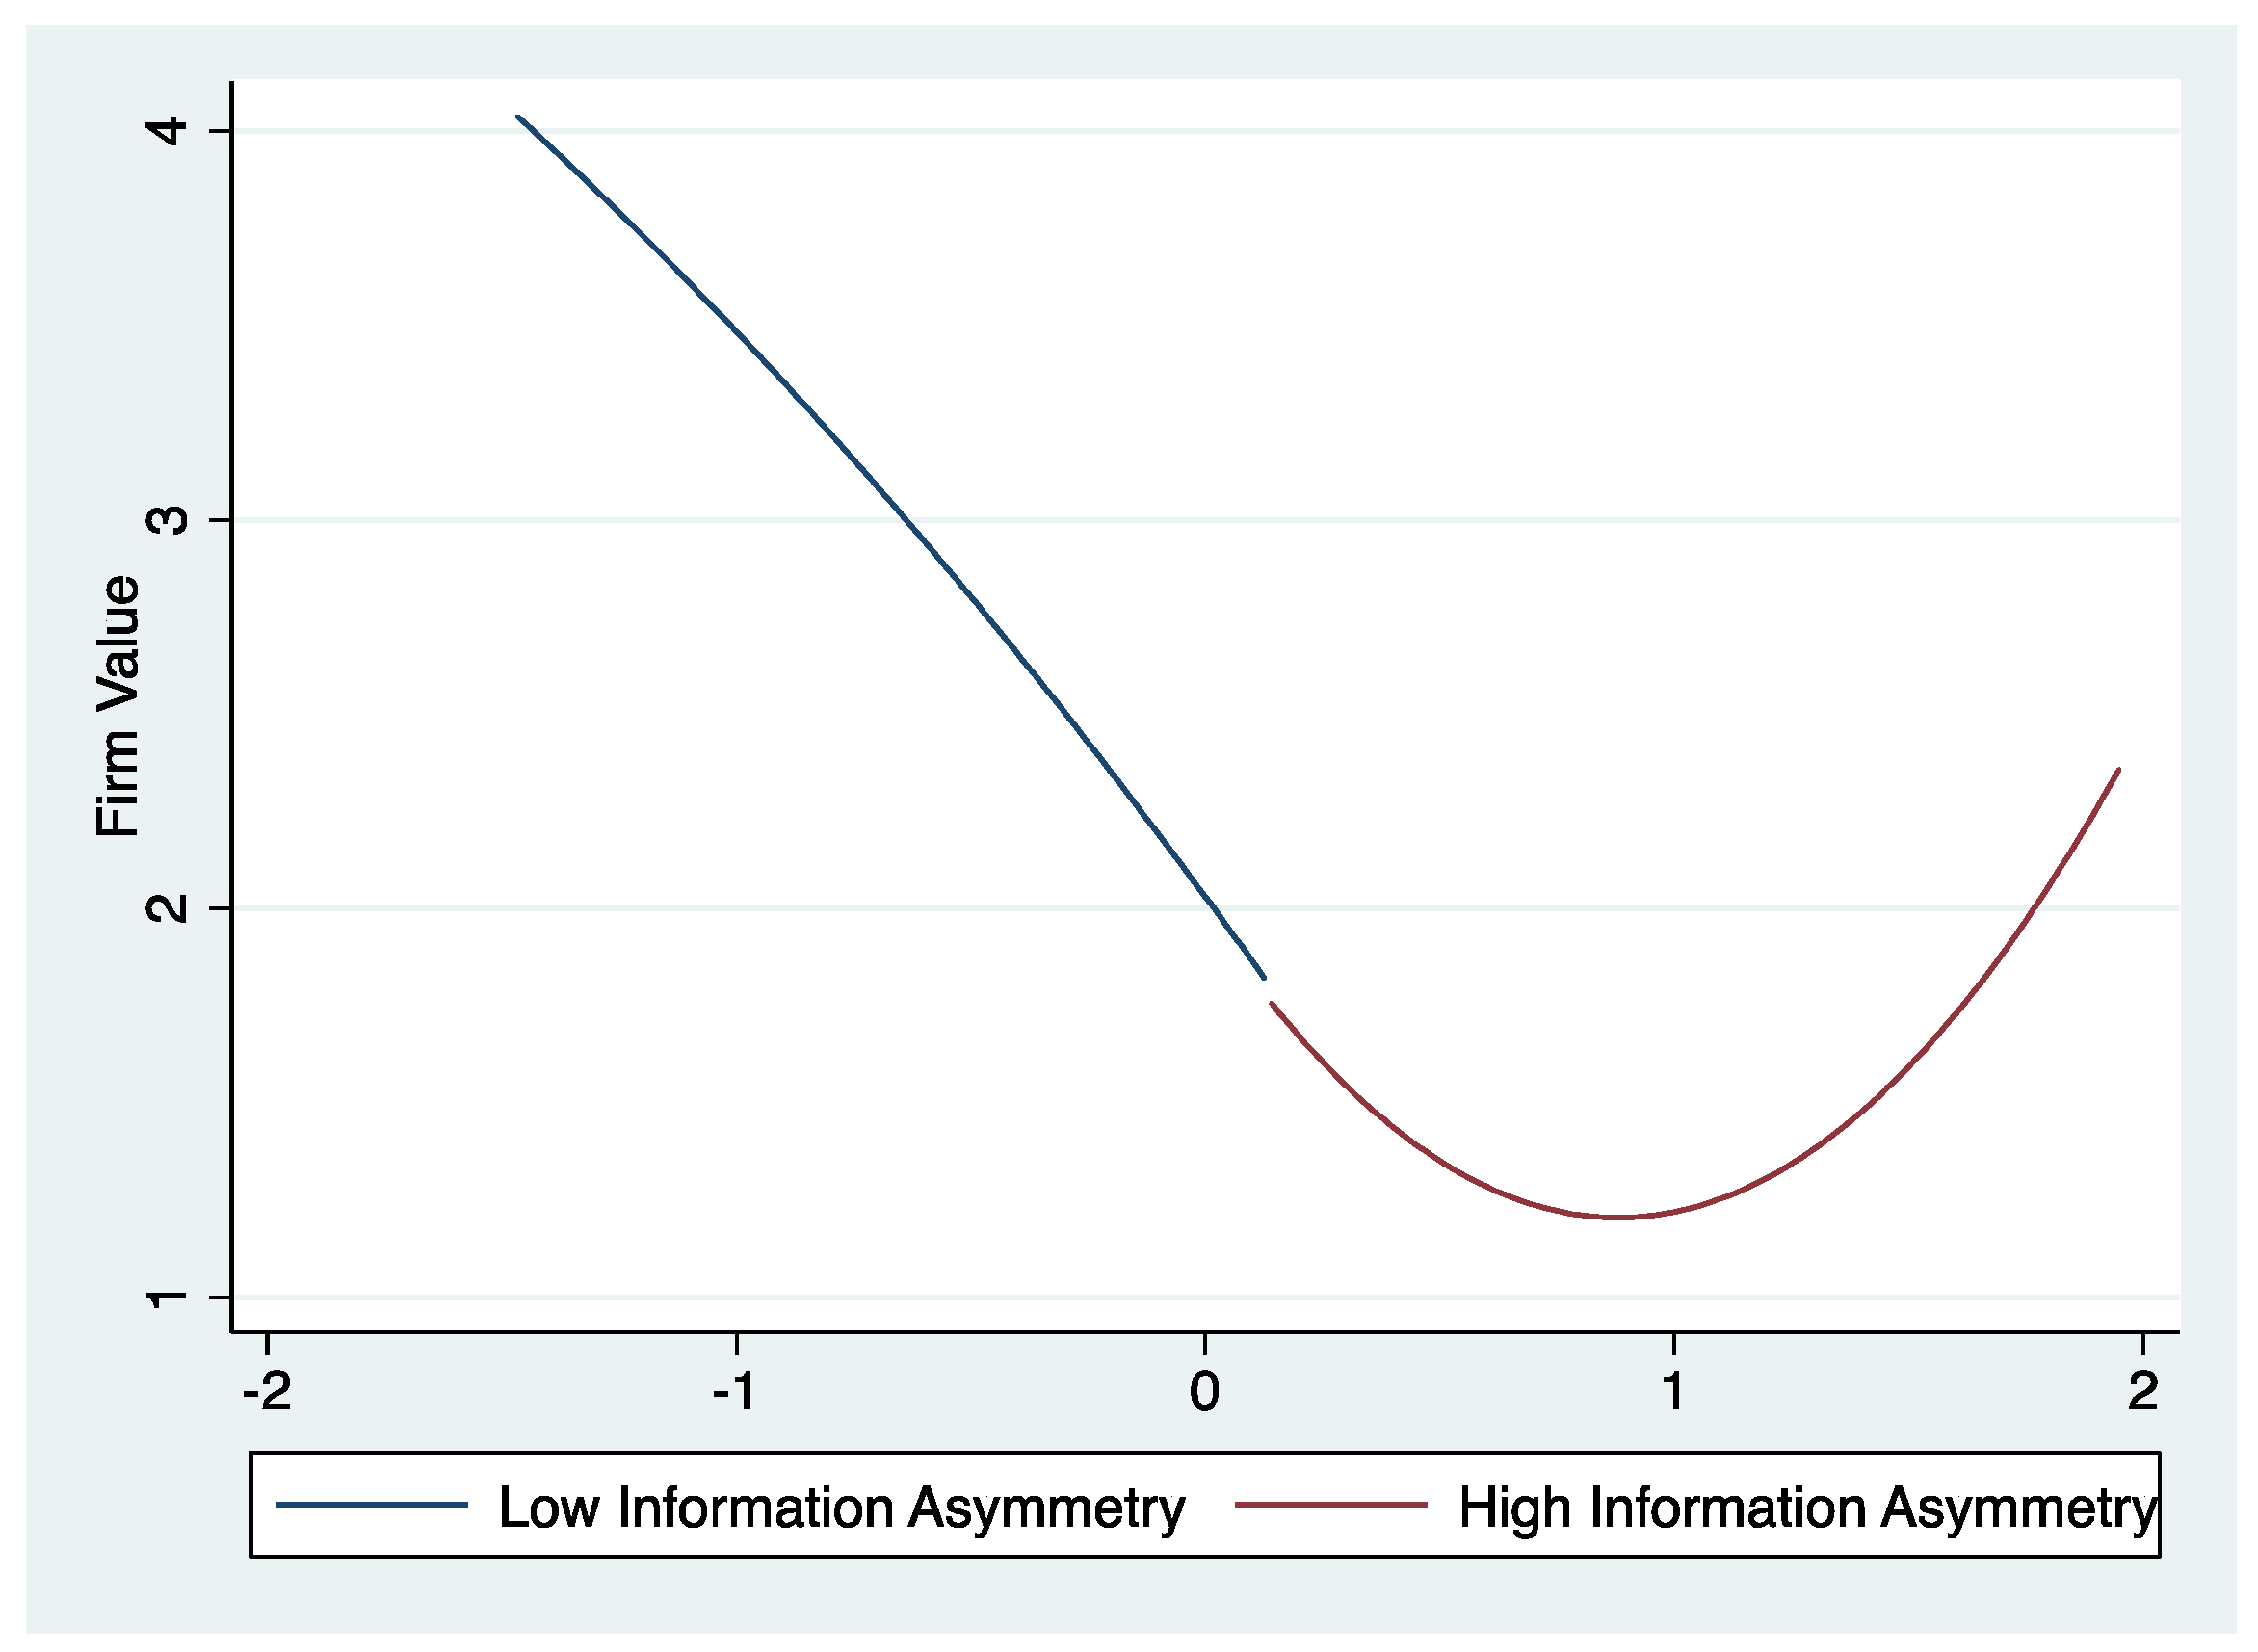
Figure 7.
The 3D projection of relationship of readability of CSR report, asymmetric information, readability of sustainability report on firm value.
Figure 7.
The 3D projection of relationship of readability of CSR report, asymmetric information, readability of sustainability report on firm value.
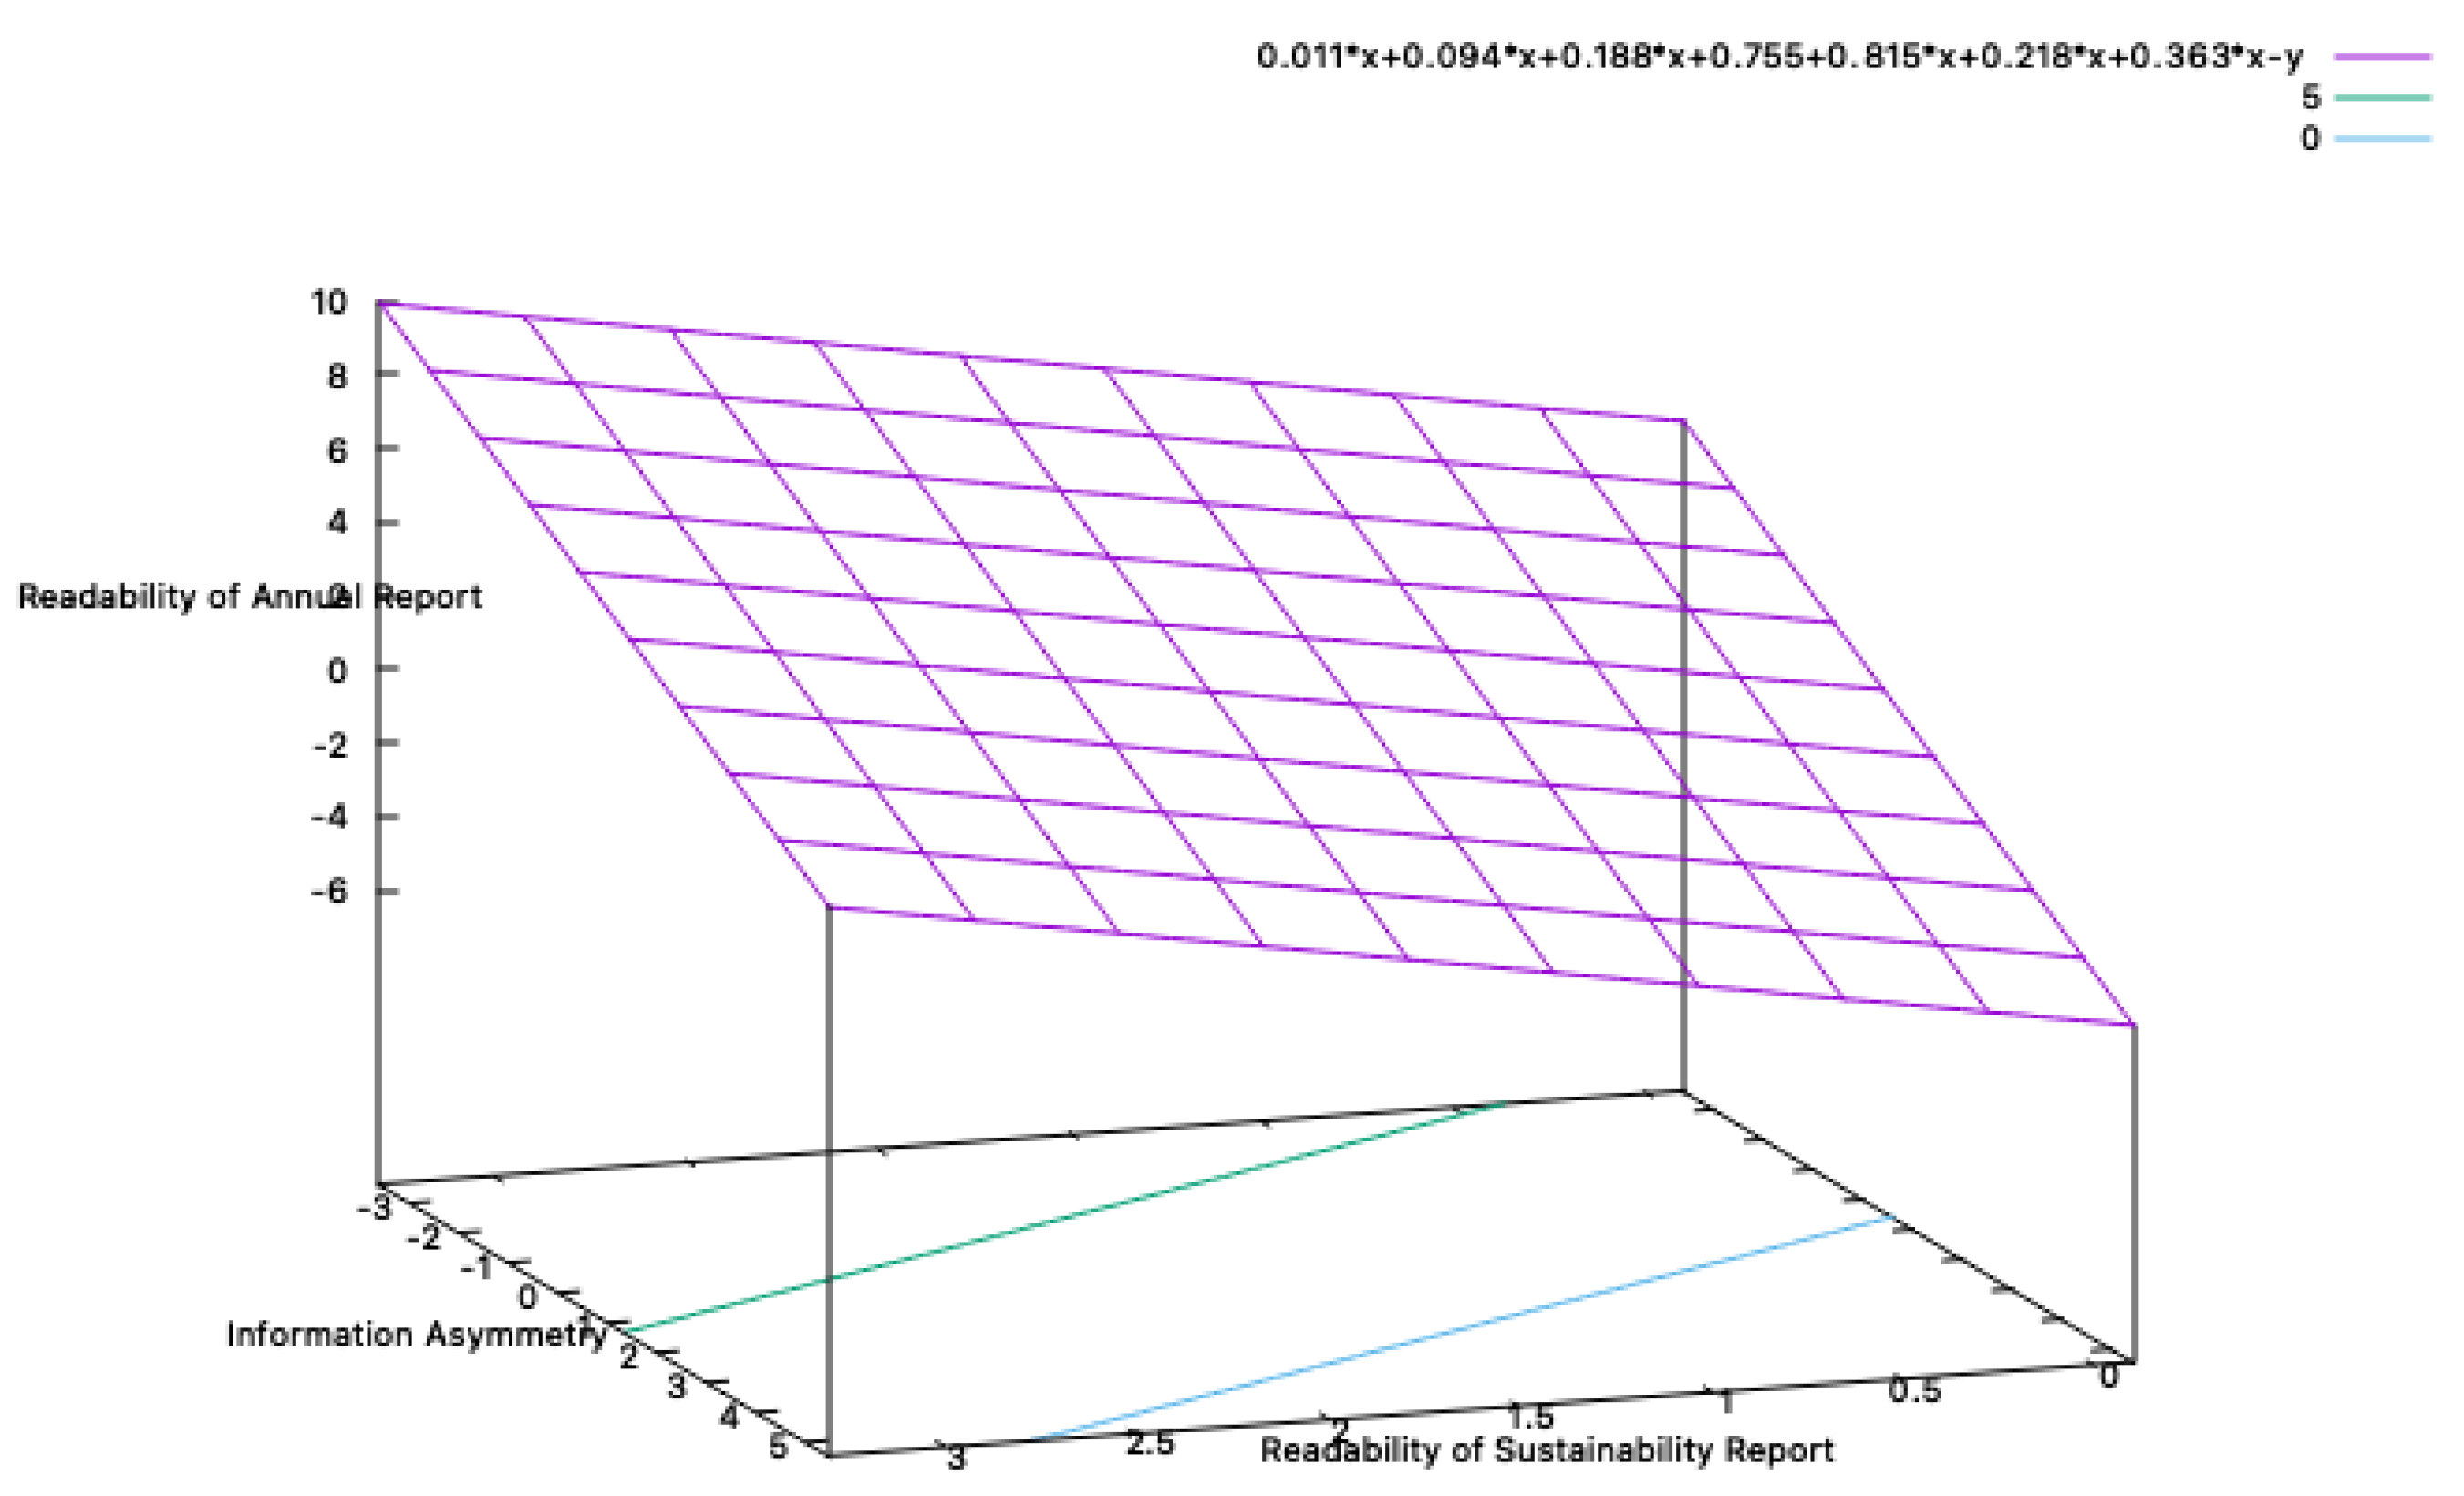

Table 1.
Variables definition and measurement.
| Variable | Definition | Measurement |
|---|---|---|
| Readability of Annual Report (AR) and Sustainability report (SR) | How complicated to understand sustainability report refers to linguistic approach [48] | Flesch Reading Ease (FRE) on the environmental disclosure in the sustainability report and CSR disclosure in annual report [13] |
| Asymmetry information (AI) |
Imbalance perceptions between management and shareholders [45] | Relative bid-ask spread [34] |
| Firm Value (FV) | How investor perceptions on company according to economic measure [6] | Tobin’s Q ([34] |
| Firm Size (FS) | The scale of firm [49] | Ln (Total Assets) [49] |
| Capital Structure (CS) | the various funds as a capital [47]. | Debt to Equity Ratio (DER) [47]. |
| Market Growth (MG) | How good is the company's growth opportunities against its position in the stock market [30] | Market to book value [50] |
Table 2.
Descriptive and classical assumption.
| Minimum | Maximum | Median | Mean | Heteroscedasticity | Multicollinearity | |
|---|---|---|---|---|---|---|
| RoA | .000 | 38.500 | 21.500 | 21.993 | Sig. 0.950 | VIF 1.275 |
| RoS | .000 | 49.600 | 30.000 | 28.889 | Sig. 0.340 | VIF 1.224 |
| IA | -1.470 | 1.950 | 0.142 | .195 | Sig. 0.755 | VIF 1.010 |
| FV | .000 | 8.600 | 1.281 | 1.801 | Sig. 0.685 | VIF 1.013 |
| FS | .000 | 67.850 | 0.885 | 1.761 | Sig. 0.204 | VIF 1.475 |
| MG | .000 | 9.870 | 1.589 | 2.340 | Sig. 0.066 | VIF 1.484 |
| CS | 5.970 | 14.020 | 10.444 | 10.533 | Sig. 0.950 | VIF 1.275 |
| Normality | Sig. 0.200 | |||||
| Autocorrelation | Sig. 0.528 | |||||
Table 3.
Hypothesis test.
| Asymmetry information | Firm Value | |
|---|---|---|
| Readability of SR | -.000*** | -.927 |
| Readability of AR | -.961 | -.000*** |
| Asymmetry information | -.179** | |
| Firm Size | .000*** | |
| Market Growth | .000*** | |
| Capital Structure | -.000*** | |
| Indirect Effect | ||
| Readability of SR | -0.021** | |
| Readability of AR | -0.000*** | |
| R Square | 0.556 | 0.935 |
| F Statistic | .000*** | .000*** |
***Significant level at 0.001. **Significant level at 0.01. *Significant level at 0.5. +Significant level at 0.1.
Disclaimer/Publisher’s Note: The statements, opinions and data contained in all publications are solely those of the individual author(s) and contributor(s) and not of MDPI and/or the editor(s). MDPI and/or the editor(s) disclaim responsibility for any injury to people or property resulting from any ideas, methods, instructions or products referred to in the content. |
© 2025 by the authors. Licensee MDPI, Basel, Switzerland. This article is an open access article distributed under the terms and conditions of the Creative Commons Attribution (CC BY) license (http://creativecommons.org/licenses/by/4.0/).
Copyright: This open access article is published under a Creative Commons CC BY 4.0 license, which permit the free download, distribution, and reuse, provided that the author and preprint are cited in any reuse.


