Submitted:
16 April 2025
Posted:
18 April 2025
You are already at the latest version
Abstract
Background and Objectives: Healthcare payment systems face challenges from fraud and overbilling, often requiring costly and resource-intensive detection tools. In response, the utility of simple statistical tests was explored in this study as a practical alternative for identifying irregularities in dermatology services payments within the Health Insurance Institute of Slovenia (HIIS). Materials and Methods: Ten-year-old anonymized billing data from 30 dermatology providers in Slovenia (population 2 million) were analyzed to evaluate the effectiveness of the methodology while avoiding reputational harm to current providers. The dataset from 2014 included variables such as the “number of services charged”, “total number of points charged” (under Slovenia's point-based tariff system at the time), “number of points per examination”, “average examination values (€)”, “number of first examinations”, and “total number of first/follow-up examinations”. Data credibility was assessed using Benford's Law (calculating χ2 values and testing null hypothesis rejection at the 95% level), and Grubbs'/Hampel's/T-tests were used to identify outliers. Results: Benford's Law analysis revealed significant deviations for the “number of services charged” (p<0.005), “total number of points charged” (p<0.01), “number of points per examination” (p<0.0005), and “average examination values (€)” (p<0.005), suggesting anomalies. Conversely, data on the numbers of “first” (p<0.7) and “total first/follow-up examinations” (p<0.3) aligned with Benford's Law, indicating authenticity. Outlier detection consistently identified two institutions with unusually high values for points per examination and average examination monetary value. Conclusions: Simple statistical tests can effectively identify potential irregularities in healthcare payment data, providing a cost-effective screening method for further investigation. Identifying outlier providers highlights areas needing detailed scrutiny to understand anomaly causes.
Keywords:
healthcare services payments
; claims data
; data credibility
; fraud detection
; outlier detection
; Benford's Law
; Grubbs'/Hampel's/T-tests
; dermatology
1. Introduction
Healthcare systems worldwide face significant challenges from fraud, overbilling and waste which can lead to substantial financial losses and compromise patient care quality [1,2]. The detection of such irregularities is crucial for maintaining the integrity and efficiency of healthcare services. However, modern fraud detection methods used in developed countries often rely on complex and resource-intensive technologies, which can be costly and inaccessible to many healthcare systems [2,3,4]. These advanced technologies require substantial resources and infrastructure due to their cost and complexity, thus limiting their accessibility. Conversely, some practical and simple statistical tests may offer a cost-effective alternative for identifying potential anomalies in healthcare payment data.
Benford’s Law is particularly useful for assessing data credibility and authenticity by identifying deviations in the expected frequency distribution of leading digits in datasets. This method can act as a first-line tool for detecting potential fraud by highlighting data that do not conform to natural patterns [5,6,7]. Additionally, outlier detection methods such as Grubbs’, Hampel’s, and T-tests are designed to identify extreme values in datasets. These tests help pinpoint data points that significantly deviate from the norm, which may again indicate anomalies or irregularities in billing practices [8].
Despite their potential, simple statistical methods like Benford’s Law and some of the outlier detection tests have been underutilized in healthcare fraud detection [8]. These methods may provide quick insights into large datasets and can serve as an initial screening tool to identify potential irregularities. By leveraging these simple yet effective tools, healthcare systems could enhance their ability to detect anomalies without relying on expensive technologies, ultimately improving the efficiency and integrity of healthcare services.
This study evaluates the practicality and usefulness of Benford’s Law and simple statistical tests, including Grubbs’, Hampel’s, and T-tests, for detecting irregularities in dermatology services payments within HIIS. The decision to use anonymized historical billing data from 2014 was strategic, providing a controlled environment for testing these methods without risking reputational harm to current providers. By analyzing historical data, the study enabled a retrospective evaluation of fraud detection techniques, offering insights into how fraud patterns may have evolved over time. This approach not only informs future strategies for improving healthcare payment systems but also highlights the potential of these methods as cost-effective initial screening tools for identifying anomalies and billing errors.
The main conclusions of the study highlight the potential of simple statistical tests to identify outliers and anomalies in healthcare payment data, possibly providing a practical and useful approach for healthcare systems with limited resources.
2. Materials and Methods
The dataset analyzed in this study consisted of billing data submitted to HIIS in 2014 by 30 dermatology providers operating in Slovenia during that year. The dataset included variables such as the “number of services charged”, “total number of points charged” (calculated under Slovenia’s point-based tariff system at the time), “number of points per examination”, “average examination values in euros (€)”, “number of first examinations”, and “total number of first and follow-up examinations”. The data were collected from existing records and anonymized to ensure compliance with ethical standards and protect provider confidentiality. This comprehensive dataset provided a robust foundation for applying statistical methods to detect anomalies and assess billing practices.
Benford’s Law was used to evaluate the distribution of leading digits in the dataset. It predicts that the leading digits in naturally occurring datasets should follow a specific logarithmic distribution [5,6,7]. The analysis was conducted using the Miller-Nigrini Excel Benford Tester [9], which calculates the observed probability of each leading digit and compares it with the expected probability according to Benford’s Law. The chi-square (χ²) test was applied to determine if the observed distribution significantly deviates from the expected distribution at 95% confidence levels. The p-values from Benford’s Law analysis determined whether the observed data distributions aligned with the expected logarithmic pattern. A p-value greater than 0.05 indicated alignment with Benford’s Law, while a p-value less than 0.05 signaled statistically significant deviations from the expected distribution.
Grubbs’ test was employed to detect outliers in the dataset by identifying data points that significantly deviate from the mean. It assumes that the data are normally distributed and is particularly suitable for small to moderate-sized datasets. It measures how far the suspected outlier lies from the mean in terms of standard deviations. The calculated GG value is then compared to a critical threshold derived from the t-distribution to determine whether the data point is statistically significant at a specified confidence level (α = 0.05). The simplicity of Grubbs’ test makes it widely applicable in various fields, including healthcare fraud detection, where identifying anomalies in payment data can reveal irregularities or billing errors [8,10,11].
Hampel’s test is a statistical method for outlier detection that relies on the median and median absolute deviation (MAD) instead of the mean and standard deviation and is effective for datasets that do not follow a normal distribution or contain skewed data. The test involves calculation of the median which is used as a measure of central tendency because it is less sensitive to outliers compared to the mean, computation of the MAD, and determining a threshold multiplier. A commonly used threshold is k=4.5, which corresponds to approximately three standard deviations in a normal distribution. A data point is thus considered an outlier if it exceeds 4.5 times the MAD from the median [8,12].
The T-test for outlier detection was used to identify whether a suspected outlier significantly distorts the distribution of the dataset. This approach assumes the data are approximately normally distributed. The procedure begins by calculating the mean and standard deviation of the full dataset, including the suspected outlier. After excluding the outlier, the mean and standard deviation are recalculated for the trimmed dataset. The deviation between the suspected outlier and the trimmed mean is then computed. This deviation is compared to a threshold derived from a T-test reference table, which accounts for the sample size and desired confidence level. If the deviation exceeds this threshold, the data point is considered a statistically significant outlier [8,13,14].
The statistical analyses for detecting outliers in the dataset described above were conducted using Excel 2010, which provided an accessible platform for performing calculations and verifying results. Prior to applying the tests, the dataset was carefully examined for missing values and inconsistencies to ensure the reliability of the analysis.
3. Results
This study analyzed dermatology service payments using Benford’s Law and outlier detection methods. The results showed significant deviations from expected distributions for certain billing categories, indicating potential anomalies. Outlier detection consistently identified specific providers with unusually high values for different billing categories.
3.1. Benford’s Law Analysis
The application of Benford’s Law to the dataset revealed varying levels of compliance across different categories of data.
- “Number of services charged”: The observed distribution of leading digits in this category significantly deviated from the expected Benford distribution, with a χ2 value of 26.302 (eight degrees of freedom) and a p-value between 0.0005 and 0.005 (Figure 1, Table 1). This deviation suggests potential anomalies in the billing process.
Figure 1.
Leading digit test - comparison between the observed and Benford probability of the frequency distribution of leading digits in the “Number of services charged” data.
Figure 1.
Leading digit test - comparison between the observed and Benford probability of the frequency distribution of leading digits in the “Number of services charged” data.
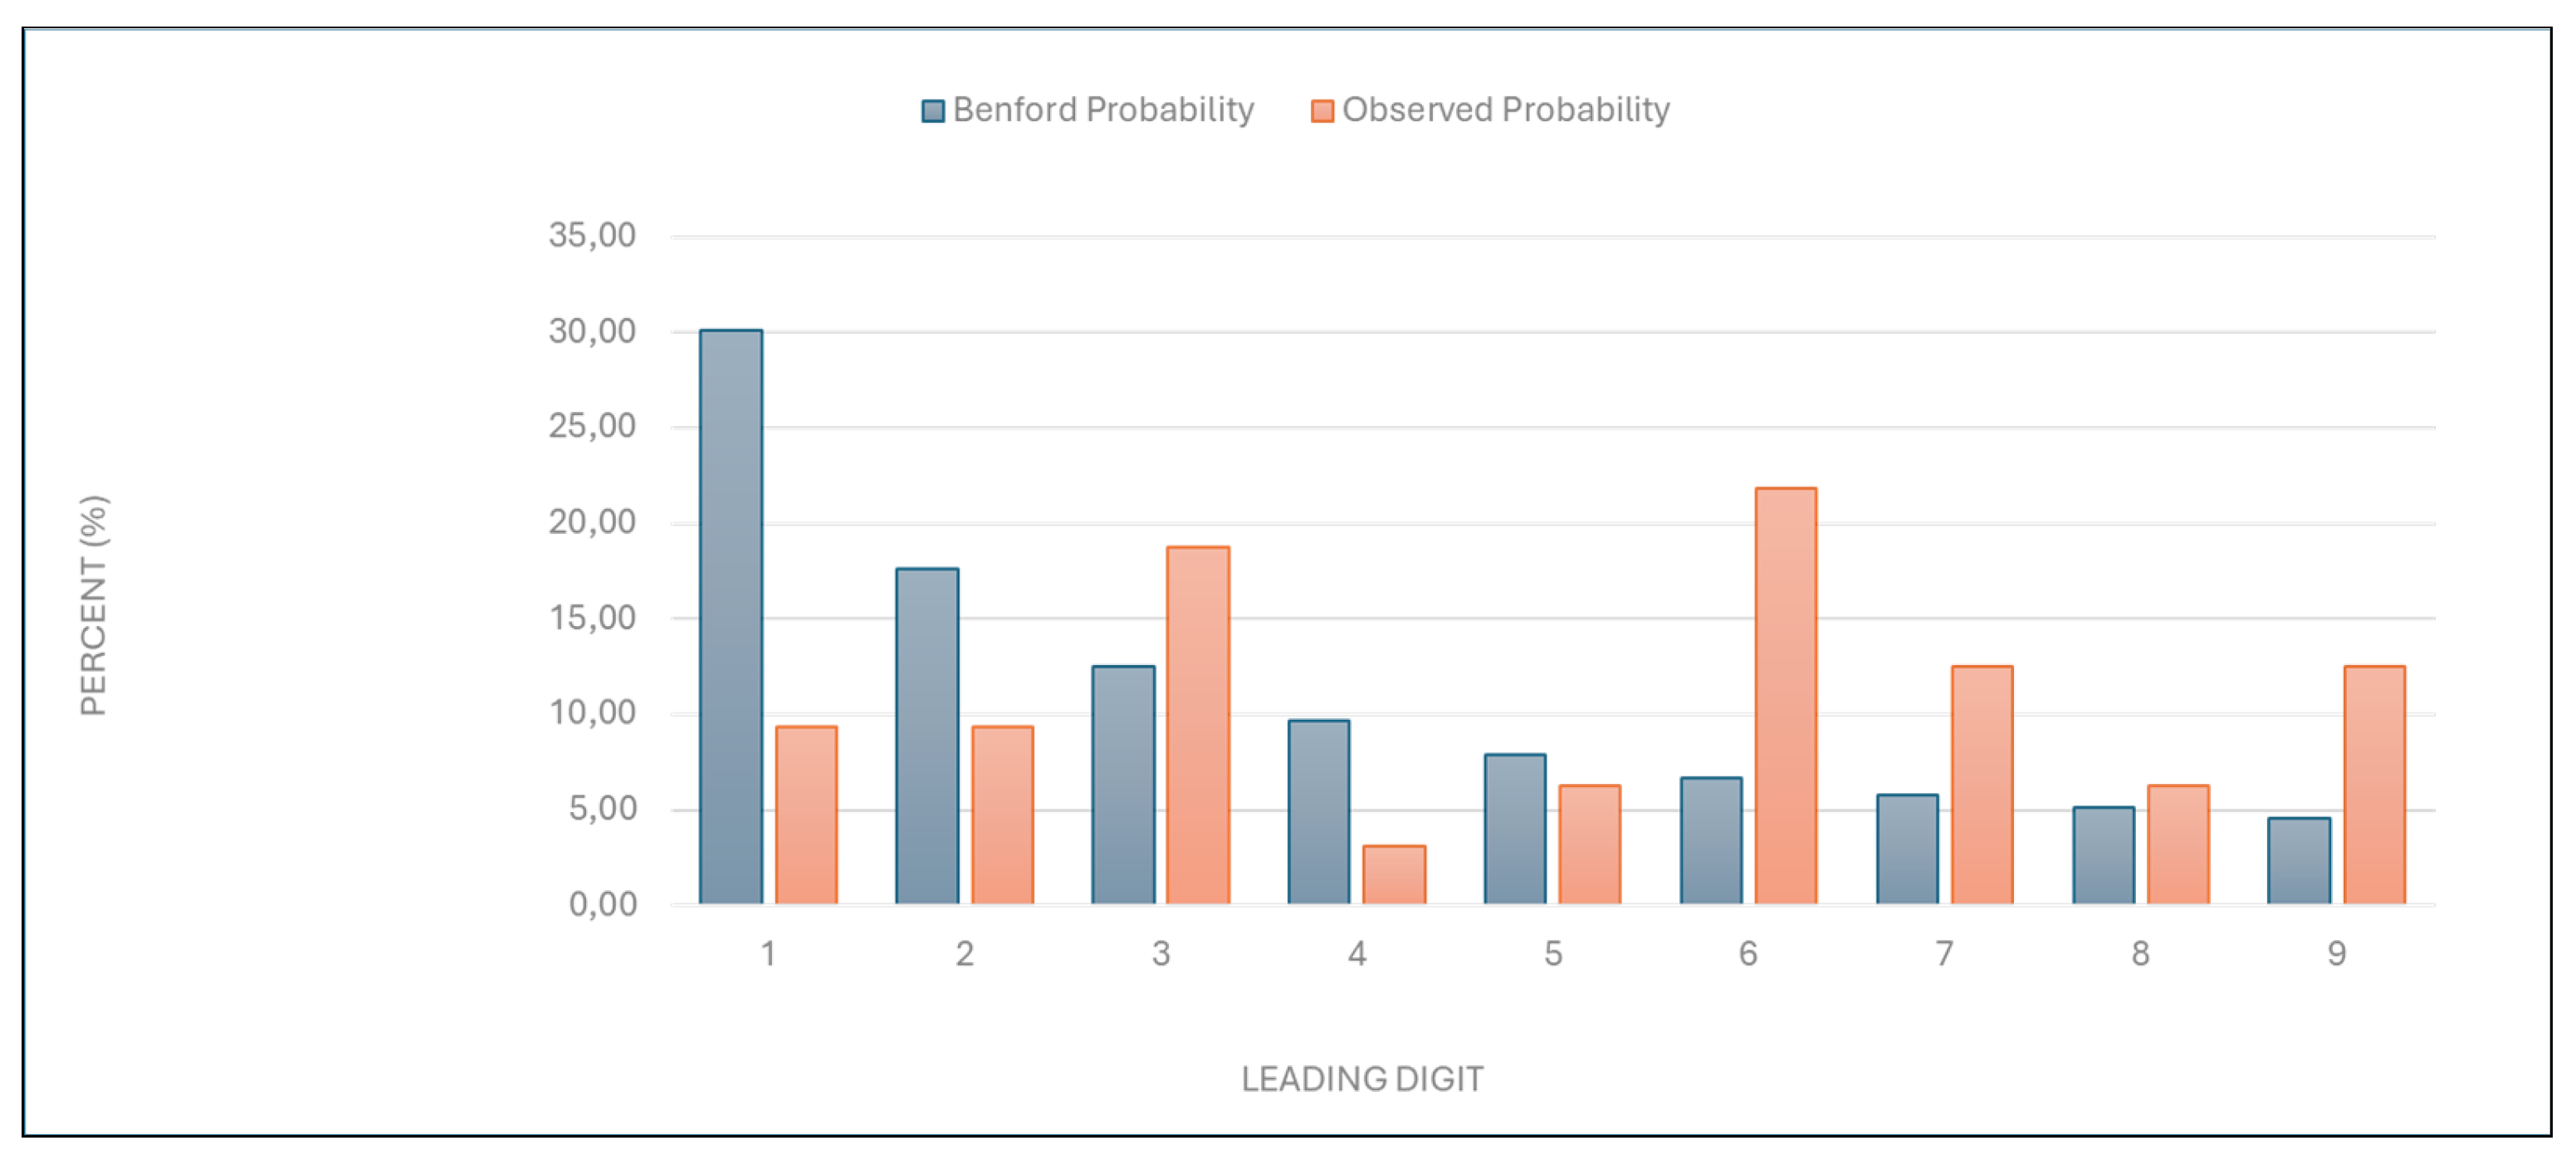

Table 1.
Leading digit test - comparison between the observed and Benford probability of the frequency distribution of leading digits in the “Number of services billed” data.
Table 1.
Leading digit test - comparison between the observed and Benford probability of the frequency distribution of leading digits in the “Number of services billed” data.
| Leading digit | Benford probability | Observed probability |
|---|---|---|
| 1 | 30,10 | 9,38 |
| 2 | 17,61 | 9,38 |
| 3 | 12,49 | 18,75 |
| 4 | 9,69 | 3,13 |
| 5 | 7,92 | 6,25 |
| 6 | 6,69 | 21,88 |
| 7 | 5,80 | 12,50 |
| 8 | 5,12 | 6,25 |
| 9 | 4,58 | 12,50 |
Figure 2.
Leading digit test - comparison between the observed and Benford probability of the frequency distribution of leading digits in the “Total number of points charged” data.
Figure 2.
Leading digit test - comparison between the observed and Benford probability of the frequency distribution of leading digits in the “Total number of points charged” data.
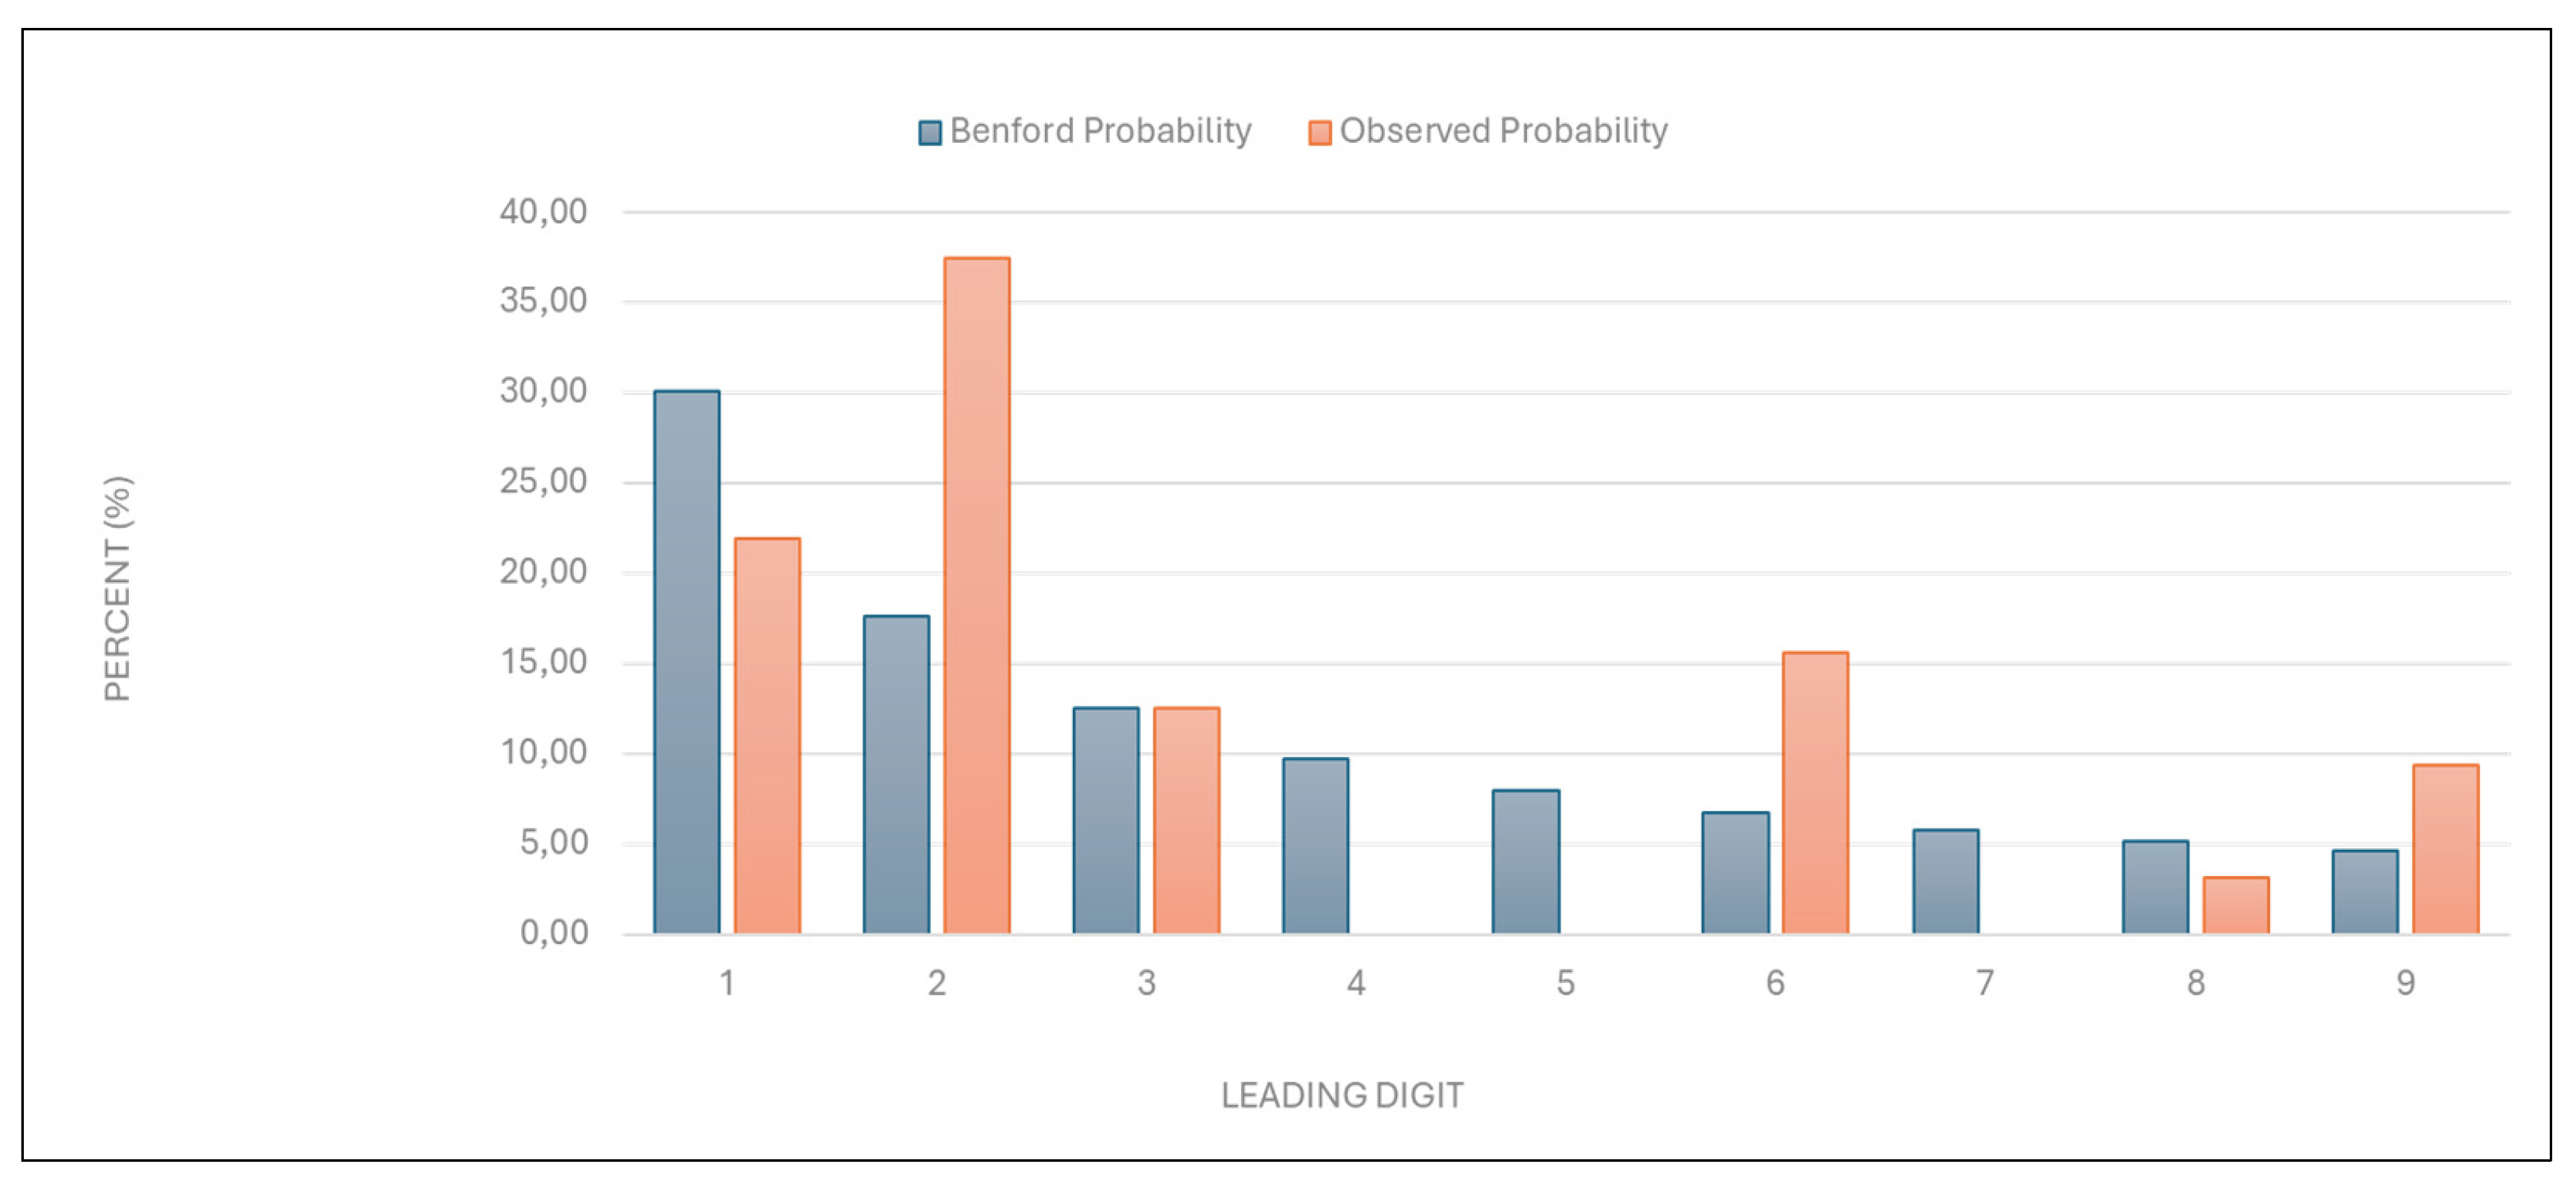
Table 2.
Leading digit test - comparison between the observed and Benford probability of the frequency distribution of leading digits in the “Total number of points charged” data.
Table 2.
Leading digit test - comparison between the observed and Benford probability of the frequency distribution of leading digits in the “Total number of points charged” data.
| Leading digit | Benford probability | Observed probability |
|---|---|---|
| 1 | 30,10 | 21,88 |
| 2 | 17,61 | 37,50 |
| 3 | 12,49 | 12,50 |
| 4 | 9,69 | 0,00 |
| 5 | 7,92 | 0,00 |
| 6 | 6,69 | 15,63 |
| 7 | 5,80 | 0,00 |
| 8 | 5,12 | 3,13 |
| 9 | 4,58 | 9,38 |
Figure 3.
Leading digit test - comparison between the observed and Benford probability of the frequency distribution of leading digits in the “Number of points per examination” data.
Figure 3.
Leading digit test - comparison between the observed and Benford probability of the frequency distribution of leading digits in the “Number of points per examination” data.
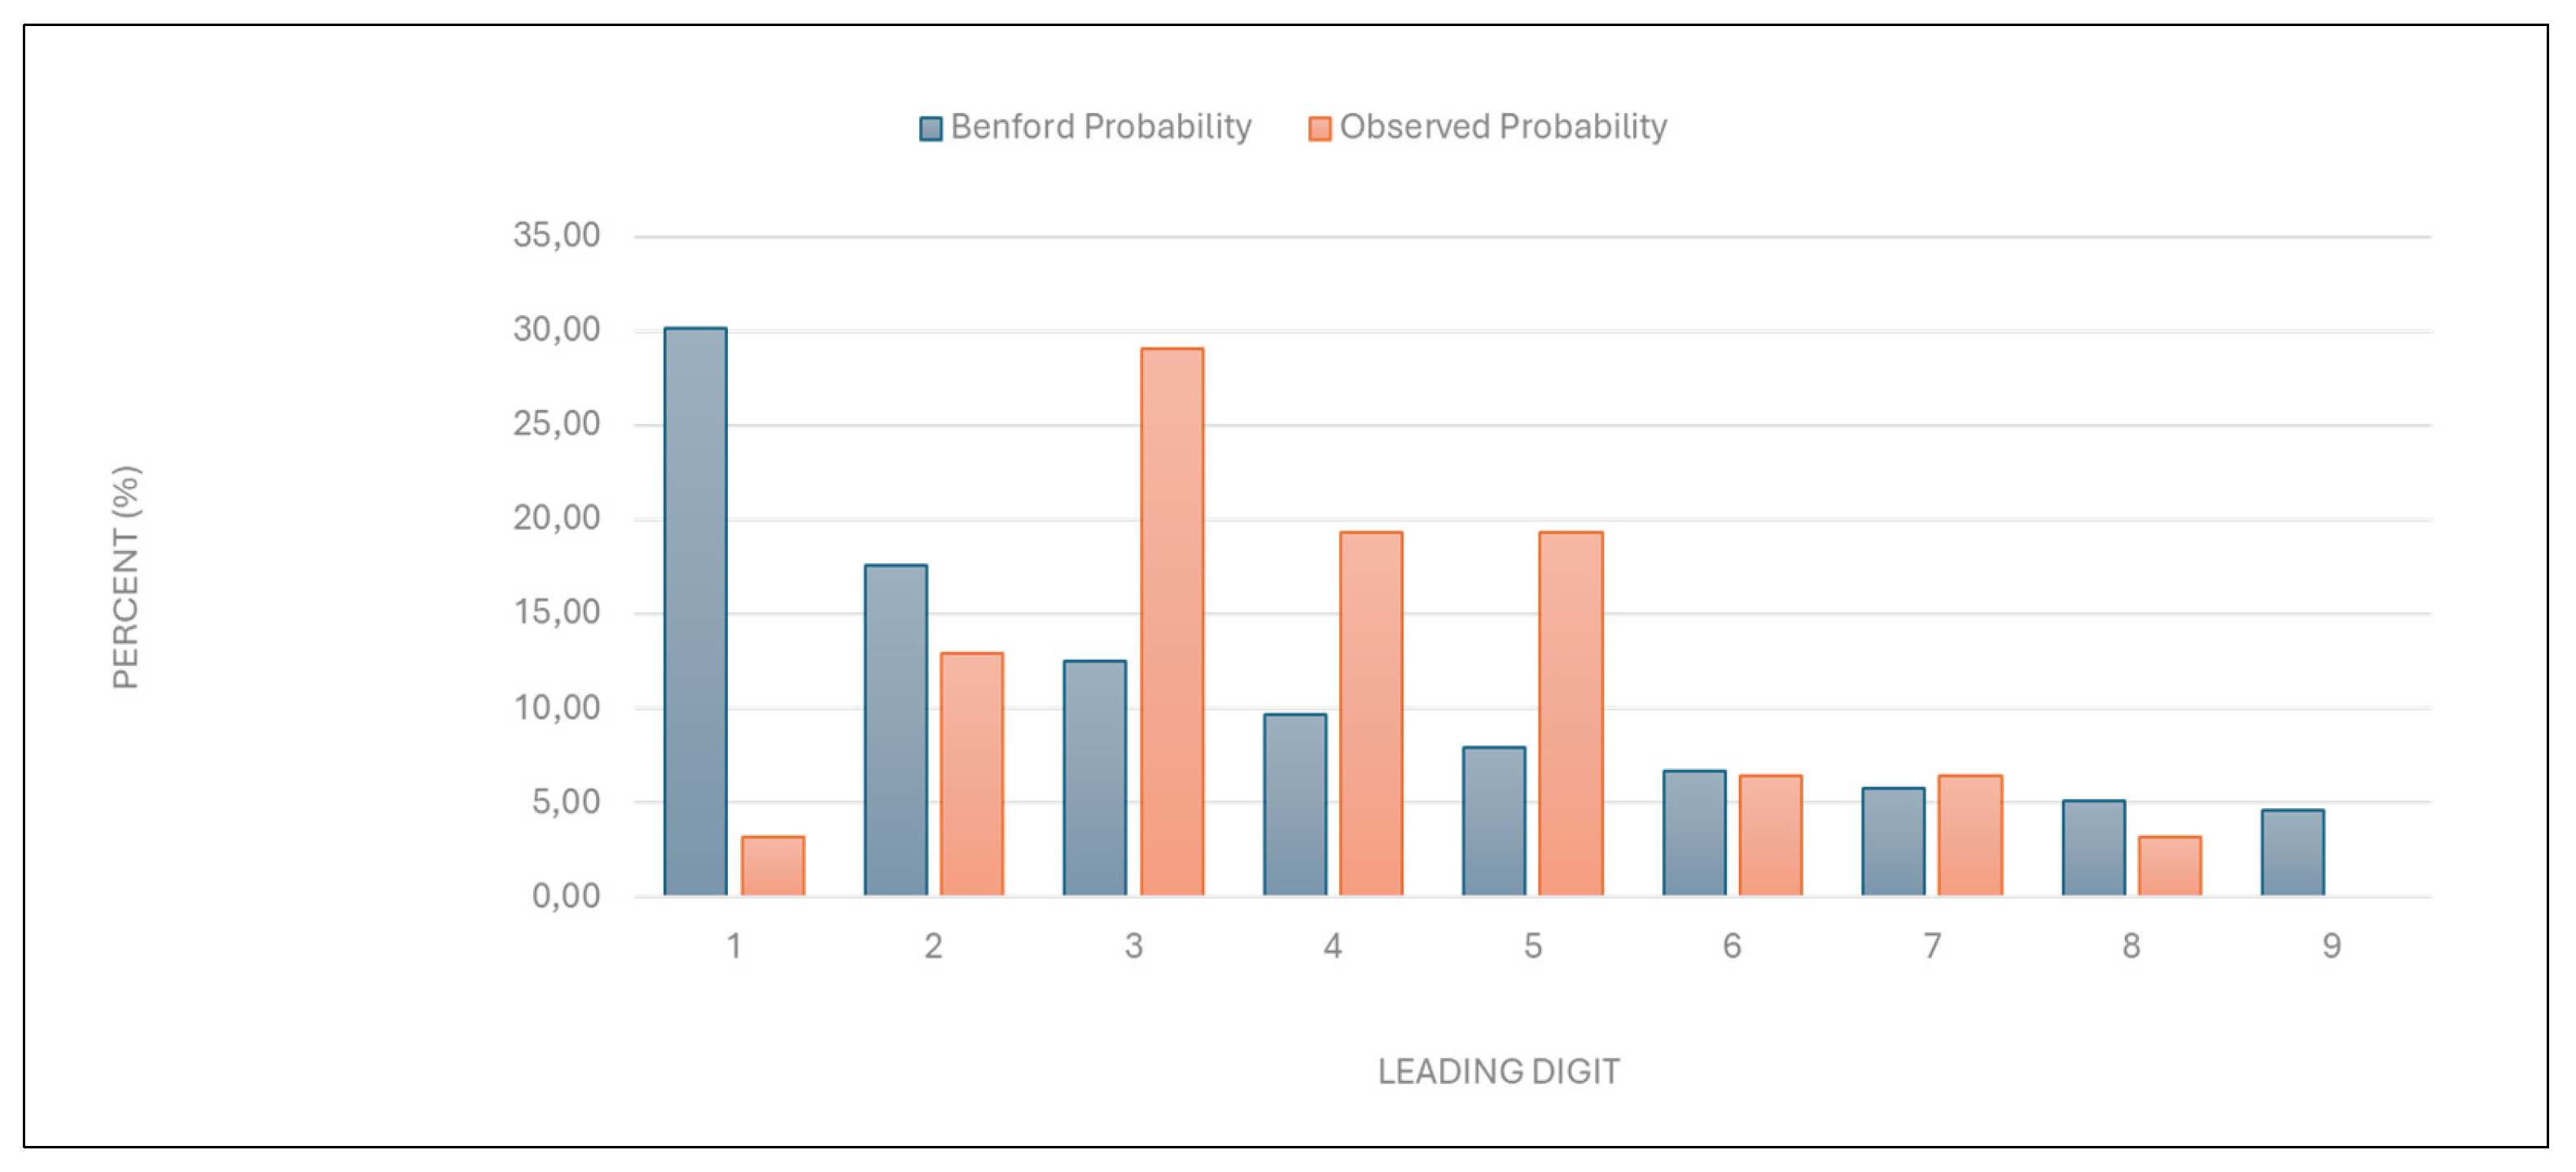
Table 3.
T. Leading digit test - comparison between the observed and Benford probability of the frequency distribution of leading digits in the “Number of points per examination” data.
Table 3.
T. Leading digit test - comparison between the observed and Benford probability of the frequency distribution of leading digits in the “Number of points per examination” data.
| Leading digit | Benford probability | Observed probability |
|---|---|---|
| 1 | 30,10 | 3,23 |
| 2 | 17,61 | 12,90 |
| 3 | 12,49 | 29,03 |
| 4 | 9,69 | 19,35 |
| 5 | 7,92 | 19,35 |
| 6 | 6,69 | 6,45 |
| 7 | 5,80 | 6,45 |
| 8 | 5,12 | 3,23 |
Figure 4.
Leading digit test - comparison between the observed and Benford probability of the frequency distribution of leading digits in the “Average examination value (€)” data.
Figure 4.
Leading digit test - comparison between the observed and Benford probability of the frequency distribution of leading digits in the “Average examination value (€)” data.
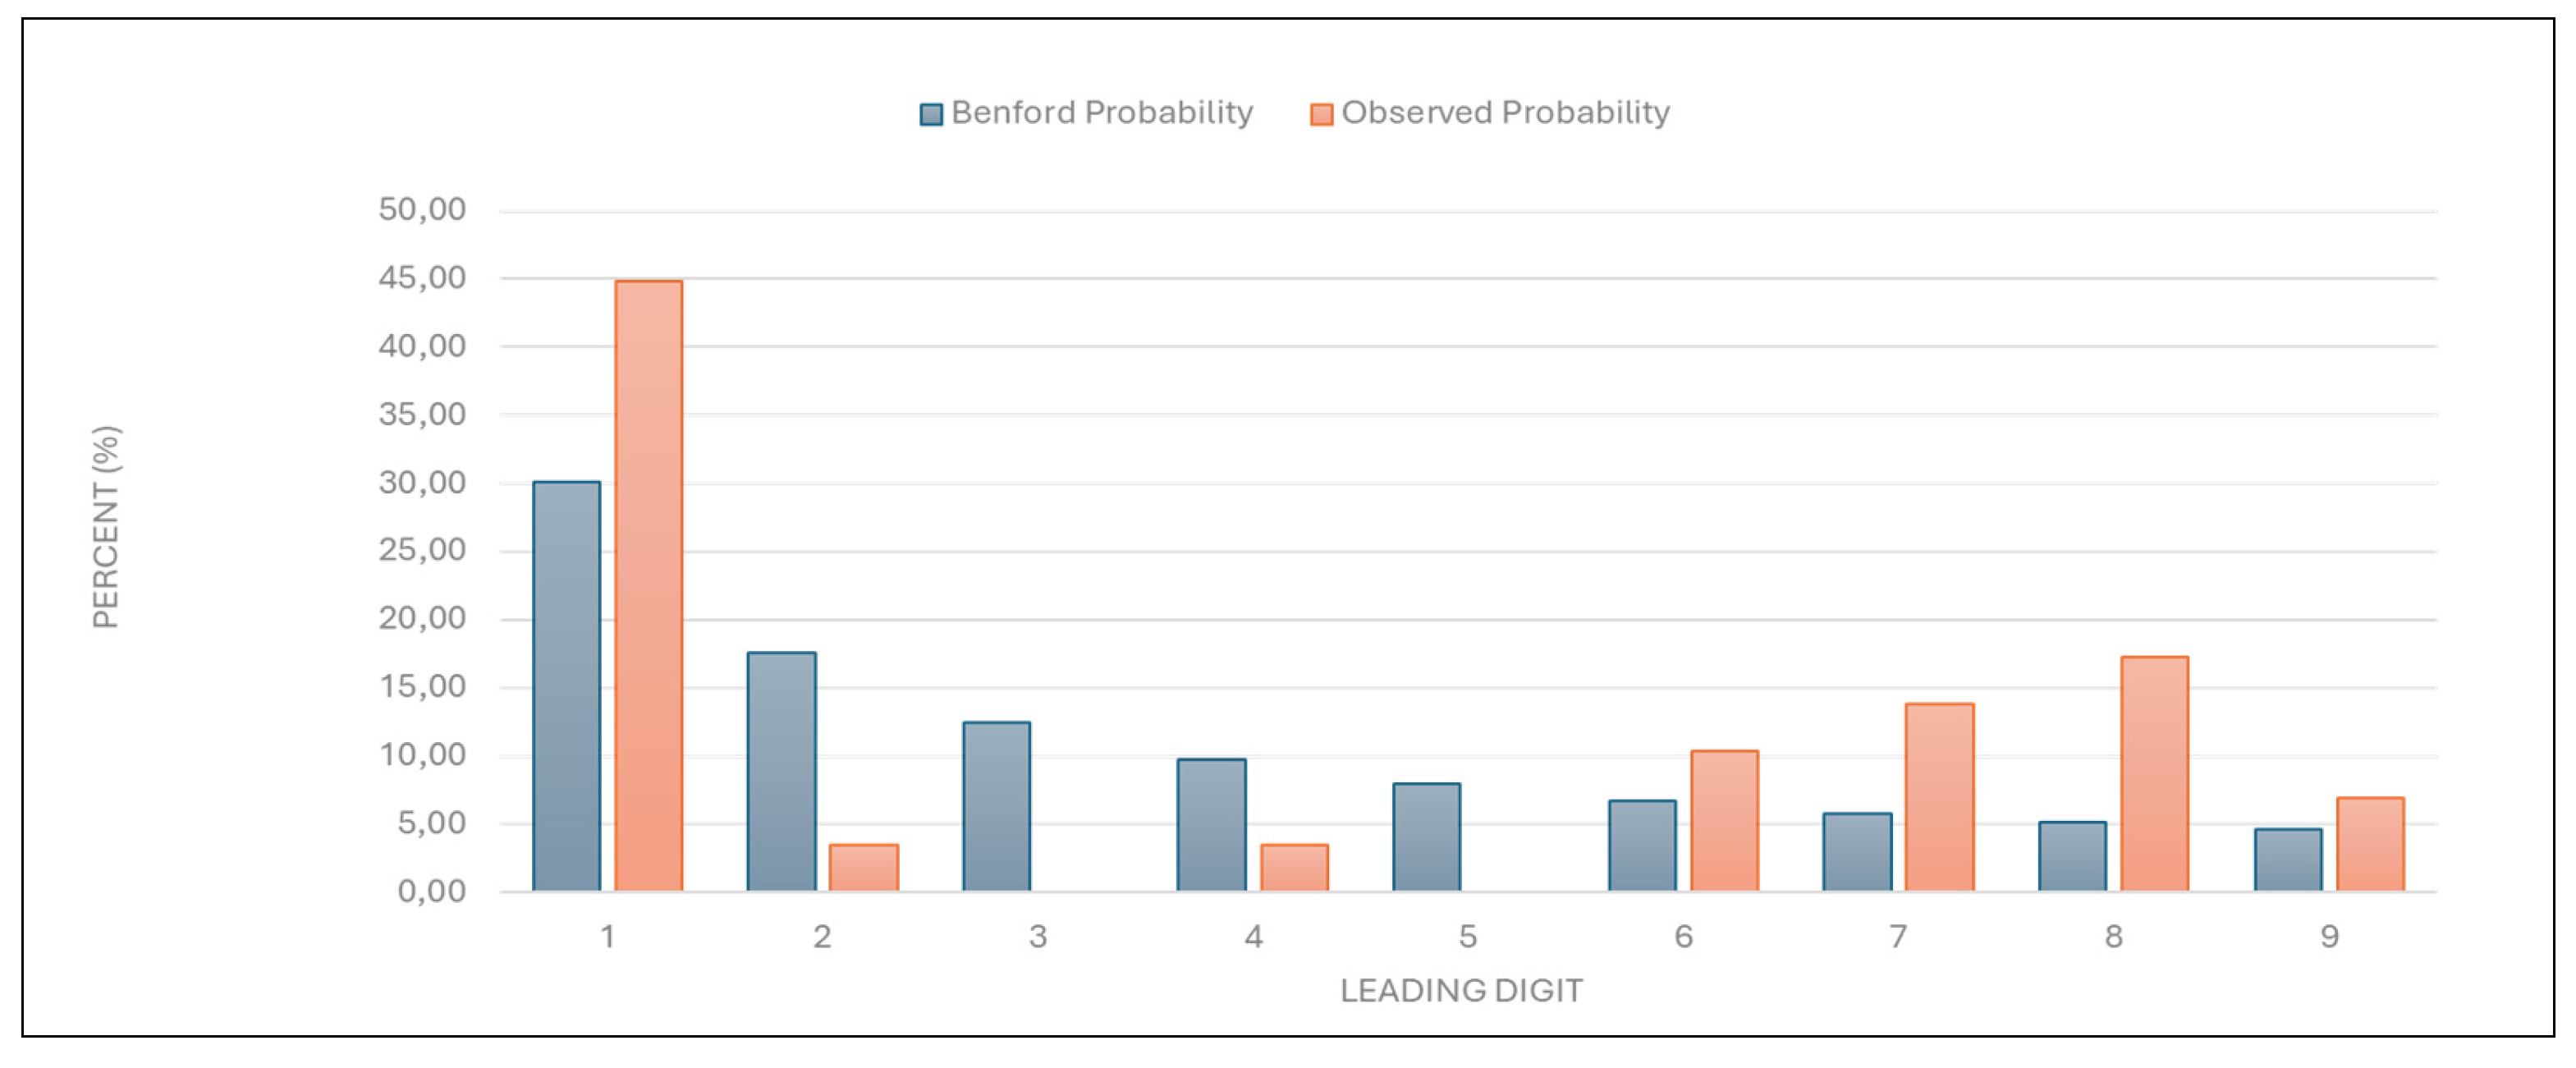
Table 4.
Leading digit test - comparison between the observed and Benford probability of the frequency distribution of leading digits in the “Average examination value (€)” data. .
Table 4.
Leading digit test - comparison between the observed and Benford probability of the frequency distribution of leading digits in the “Average examination value (€)” data. .
| Leading digit | Benford probability | Observed probability |
|---|---|---|
| 1 | 30,10 | 41,94 |
| 2 | 17,61 | 3,23 |
| 3 | 12,49 | 0,00 |
| 4 | 9,69 | 3,45 |
| 5 | 7,92 | 0,00 |
| 6 | 6,69 | 10,34 |
| 7 | 5,80 | 13,79 |
| 8 | 5,12 | 17,24 |
| 9 | 4,58 | 6,90 |
Figure 5.
Leading digit test - comparison between the observed and Benford probability of the frequency distribution of leading digits in the “Number of first examinations data.”.
Figure 5.
Leading digit test - comparison between the observed and Benford probability of the frequency distribution of leading digits in the “Number of first examinations data.”.
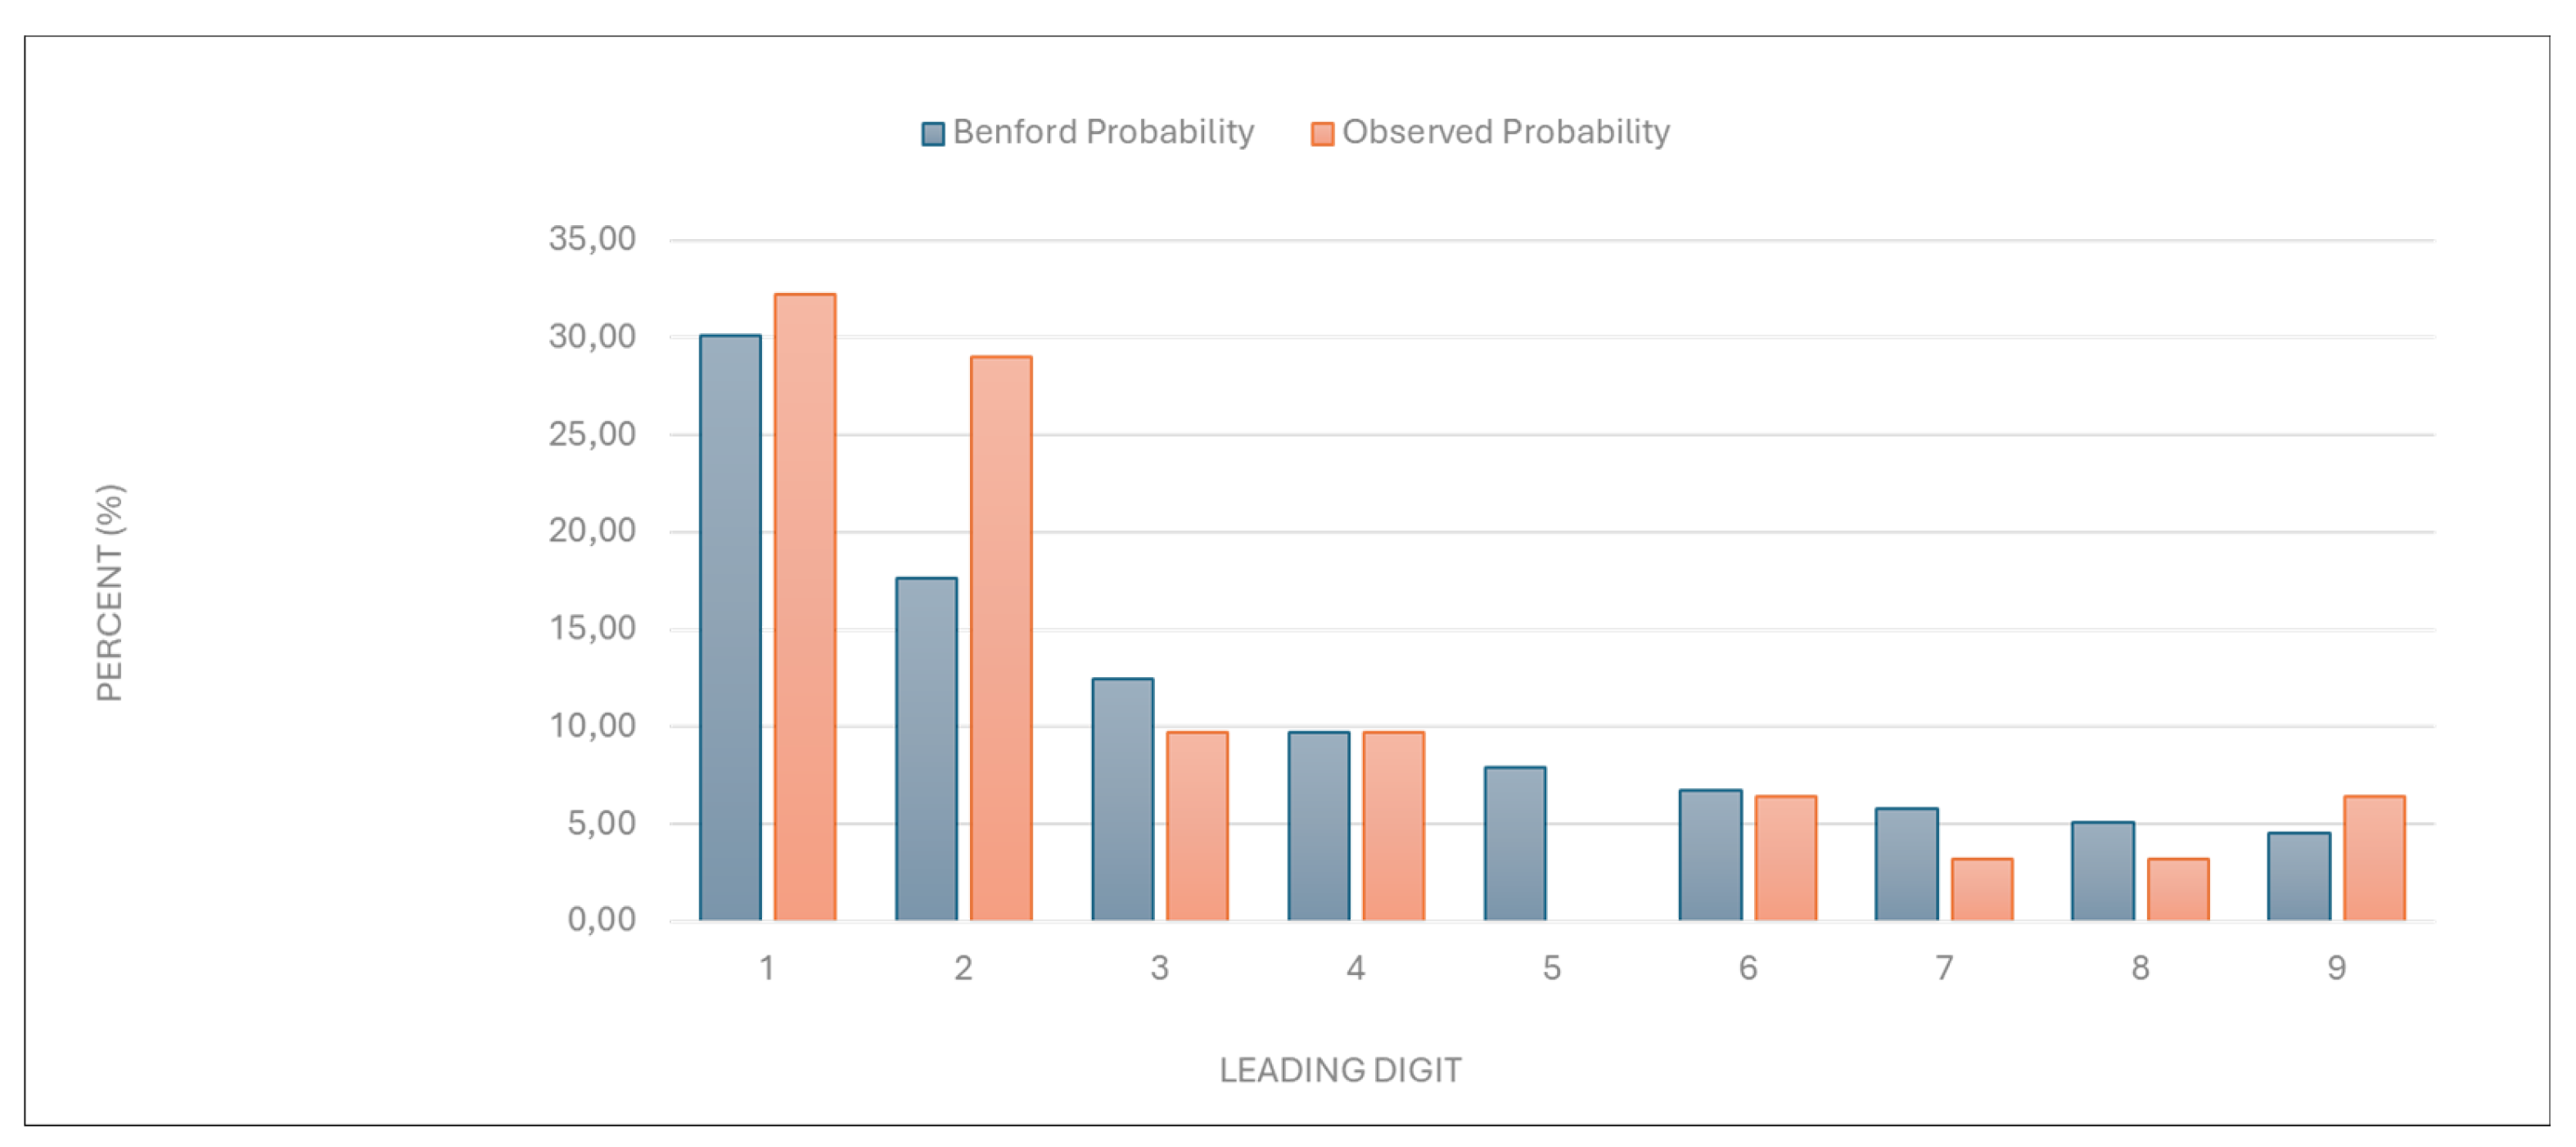
Table 5.
Leading digit test - comparison between the observed and Benford probability of the frequency distribution of leading digits in the “Number of first examinations” data.
Table 5.
Leading digit test - comparison between the observed and Benford probability of the frequency distribution of leading digits in the “Number of first examinations” data.
| Leading digit | Benford probability | Observed probability |
|---|---|---|
| 1 | 30,10 | 32,26 |
| 2 | 17,61 | 29,03 |
| 3 | 12,49 | 9,68 |
| 4 | 9,69 | 9,68 |
| 5 | 7,92 | 0,00 |
| 6 | 6,69 | 6,45 |
| 7 | 5,80 | 3,23 |
| 8 | 5,12 | 3,23 |
| 9 | 4,58 | 6,45 |
Figure 6.
Leading digit test - comparison between the observed and Benford probability of the frequency distribution of leading digits in the “ Total number of first and follow-up examinations” data.
Figure 6.
Leading digit test - comparison between the observed and Benford probability of the frequency distribution of leading digits in the “ Total number of first and follow-up examinations” data.
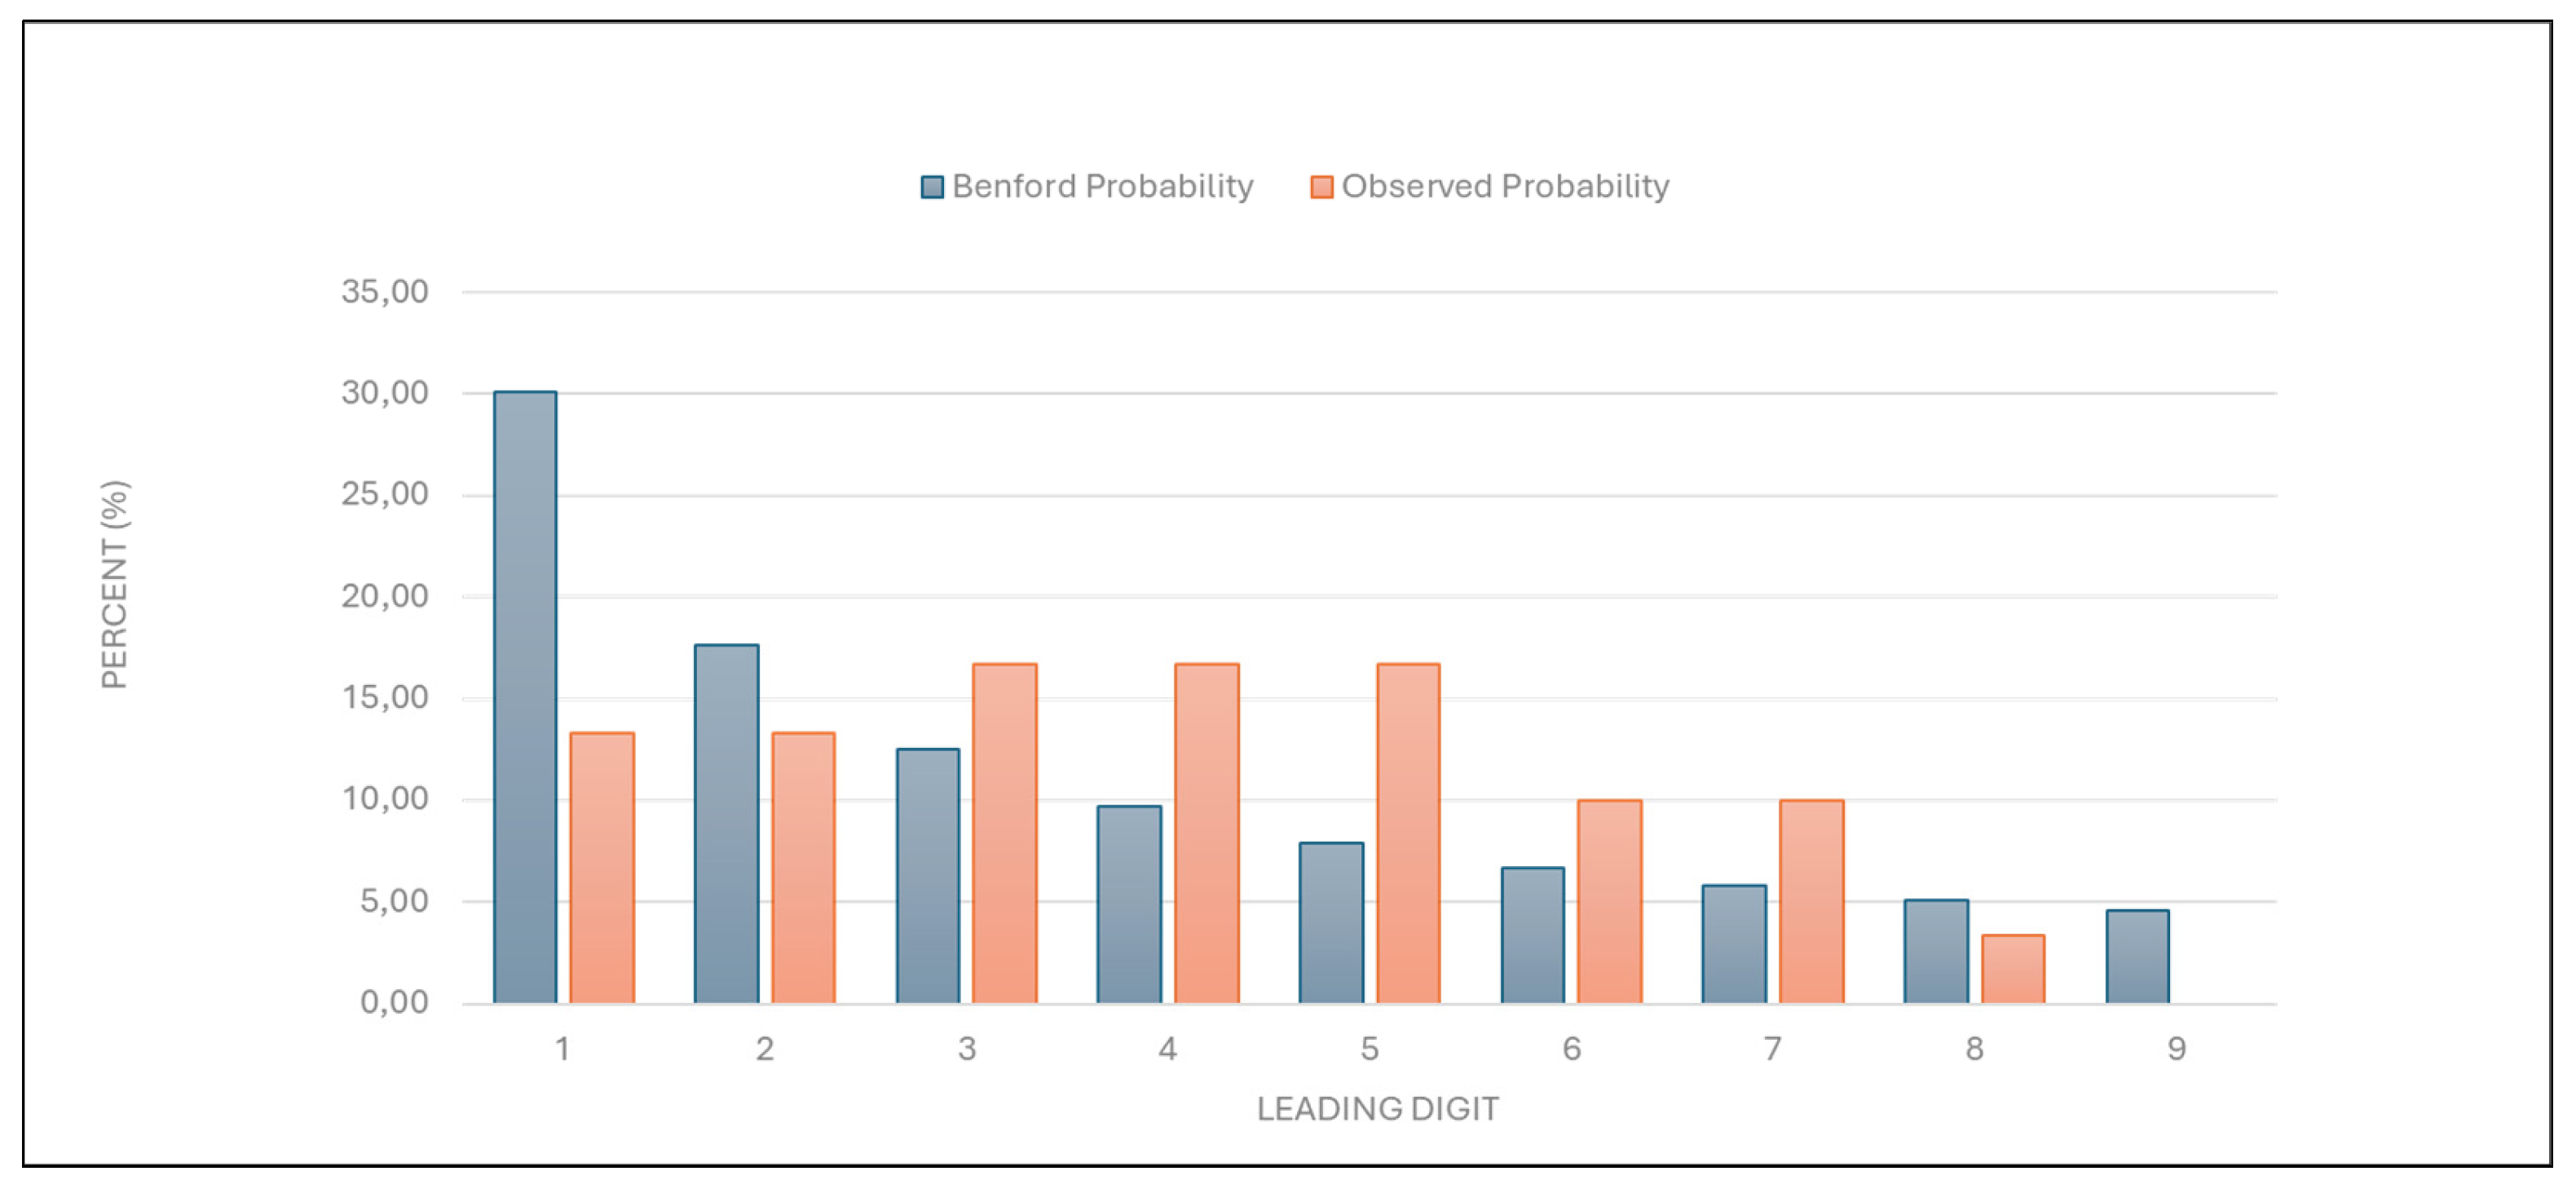
Table 6.
Leading digit test - comparison between the observed and Benford probability of the frequency distribution of leading digits in the “ Total number of first and follow-up examinations” data.
Table 6.
Leading digit test - comparison between the observed and Benford probability of the frequency distribution of leading digits in the “ Total number of first and follow-up examinations” data.
| Leading digit | Benford probability | Observed probability |
|---|---|---|
| 1 | 30,10 | 13,33 |
| 2 | 17,61 | 13,33 |
| 3 | 12,49 | 16,67 |
| 4 | 9,69 | 16,67 |
| 5 | 7,92 | 16,67 |
| 6 | 6,69 | 10,00 |
| 7 | 5,80 | 10,00 |
| 8 | 5,12 | 3,33 |
| 9 | 4,58 | 0,00 |
3.2. Outlier Detection
Outlier detection was performed using Grubbs’, Hampel’s, and T-tests to identify providers with unusually high values for various billing categories.
3.2.1. Grubbs’ Test
- “Number of services charged”: One of two large university health centers in the country was identified as an outlier, with a GG-value of 4.906761. This result suggests that its billing practices differ significantly from the norm, possibly due to factors like its size, patient demographics, potentially including a larger number of elderly patients, or unique billing practices.
- “Total number of points charged”: The same large university healthcare center as mentioned above was identified as an outlier, with a GG-value of 4.955756, indicating unusual point billing practices.
- “Number of points per examination”: A specialized privately owned dermatology center was identified as an outlier, with a GG-value of 4.494556, indicating unusually high number of points per examination.
- “Average examination value (€)”: The same specialized dermatology center was an outlier, with a GG-value of 6.243344, suggesting unusually high examination values. Another dermatology clinic within a primary healthcare center in a major city was also identified as an outlier, with a GG-value of 3.062068.
- “Number of first examinations”: The same specialized dermatology center was again identified as an outlier, with a GG-value of 4.680405, suggesting unusually high first examination numbers.
- “Total number of examinations”: The same specialized dermatology center as mentioned previously was identified as an outlier, with a GG-value of 4.458205, suggesting unusually high total examination numbers with a larger number of follow-up examinations.
3.2.2. Hampel’s Test
- 7.
- “Number of services charged”, and “total number of points charged”: No outliers were detected using Hampel’s test for these categories.
- 8.
- “Number of points per examination”: A specialized privately owned dermatology center and a primary healthcare center in a major city, both mentioned previously, were identified as outliers. This result suggests that these centers charge an unusually high number of points per examination.
- 9.
- “Average examination value (€)”: A specialized privately owned dermatology center was again identified as an outlier, with the primary healthcare center in a major city also being close to the outlier threshold.
- 10.
- “Number of first examinations”: The same one of the two large university health centers mentioned previously was identified as an outlier. This suggests that the center’s first examination numbers are unusually high compared to others.
- 11.
- “Total number of examinations”: The large university health center was again identified as an outlier. This suggests that the center may have a high number of follow-up examinations due to a larger number of elderly patients, or unique billing practices.
3.2.3. T-Test
- 12.
- “Number of services charged”: The large university health center was identified as an outlier. This again suggests that the center’s service billing practices differ significantly from the norm.
- 13.
- “Total number of points charged”: No outliers were detected.
- 14.
- “Number of points per examination”: The specialized privately owned dermatology center mentioned previously was identified as an outlier. This again indicates that the center charges an unusually high number of points per examination.
- 15.
- “Average examination value (€)”: The specialized privately owned dermatology center was consistently identified as an outlier. This suggests that the center’s average examination value is significantly higher than expected.
- 16.
- “Number of first examinations”: The large university health center was again identified as an outlier. This indicates that its first examination numbers are unusually high.
- 17.
- “Total number of examinations”: The large university health center mentioned previously was an outlier. This suggests that the center may also have had an unusually high number of follow-up examinations.
4. Discussion
This study evaluated the practicality and usefulness of Benford’s Law and outlier detection tests (Grubbs’, Hampel’s, and T-tests) for identifying irregularities in healthcare billing data. Benford’s Law demonstrated significant utility in flagging deviations from expected digit distributions, signalling potential anomalies and casting doubt on data credibility and authenticity. The outlier detection tests complemented this analysis by pinpointing specific providers with anomalous billing patterns.
The accessibility of these methods makes them practical tools for healthcare systems with limited resources, enabling rapid identification of irregularities in large datasets without complex analytical infrastructure. Benford’s Law served as a first-line screening tool, while the outlier detection tests additionally provided a clear focus for further investigation by isolating extreme values that may indicate fraudulent or irregular practices.
This systematic approach highlights the complementary strengths of these methods, enhancing transparency in healthcare systems and enabling early detection of anomalies. The simplicity and practicality of these tools make them especially valuable for resource-constrained settings, where advanced analytical expertise may not be readily available. By combining Benford’s Law with outlier detection tests, this study offers a cost-effective strategy for enhancing transparency in healthcare systems, informing targeted approaches to mitigate financial losses.
4.1. Strategic Use of Historical Data for Evaluating Fraud Detection Methods in Healthcare Billing
The study strategically utilized historical billing data from 2014 to evaluate the effectiveness of Benford’s Law and Grubbs’, Hampel’s, and T-tests, in identifying anomalies within healthcare billing practices. The decision to use data from 2014 was deliberate, as it provided a controlled environment for testing these statistical methods without posing reputational risks to current healthcare providers. By focusing on historical real-world data, the study ensured that its primary objective was methodological evaluation rather than the identification of present-day fraudsters.
Evaluating historical data may be particularly relevant in Slovenia, where healthcare financing relies on a combination of fee-for-service, capitation, and diagnosis-related group (DRG) reimbursement models, all of which are influenced by historical expenditure patterns [15,16,17]. Additionally, historical datasets often feature suitable sample sizes and fewer biases, such as nonresponse or incomplete records, which can compromise the validity of analyses [18,19,20,21]. These characteristics made the 2014 dataset an ideal candidate for evaluating the applicability and reliability of Benford’s Law and outlier detection tests in healthcare billing systems [15,16].
4.2. Assessing Data Credibility and Authenticity with Benford’s Law: Practicality and Usefulness in Healthcare Fraud Detection
Benford’s Law demonstrated its utility as a preliminary screening tool for checking the credibility and authenticity of the data, suggesting potential manipulation or overbilling. It detected anomalies in healthcare billing data in most of the variables in the study, such as “number of services charged,” “total number of points charged,” “number of points per examination,” and “average examination values (€)”. Conversely, compliance with Benford’s Law in categories like “number of first examinations” and “total number of examinations” indicates that these data are likely authentic, reinforcing the method’s reliability for distinguishing between genuine and anomalous patterns. Deviations from expected digit distributions in these variables signalled potential irregularities, consistent with prior studies applying Benford’s Law to fraud detection. Its application has already proven effective in identifying billing anomalies and manipulated data elsewhere [1,2,3,5,6,7,8].
However, the limitations of Benford’s Law become apparent when applied to smaller datasets or those with constrained ranges, such as the “number of first examinations” and “total number of first and follow-up examinations.” In such cases, compliance with the Benford’s law may not necessarily confirm data authenticity, as smaller sample sizes reduce the reliability of Benford’s conformity testing [22]. This aligns with the findings elsewhere, which emphasize that Benford’s Law is most effective when applied to datasets with more than 100 data points spanning multiple orders of magnitude [6,22]. While its simplicity and low implementation cost make it an attractive tool for fraud detection, it may perhaps best be used as a first-step analysis method to flag anomalies for further investigation using more robust techniques [5,6,22,23]. These findings underscore the value of combining Benford’s Law with complementary methods, such as outlier detection tests, to enhance fraud detection accuracy and reliability in healthcare datasets.
Easy accessibility of Benford’s Law allows healthcare systems lacking advanced analytical infrastructure to identify potential anomalies quickly [9,22,23]. However, as noted in this study, Benford’s Law is best used combined with complementary methods such as outlier detection tests as in this study (Grubbs’, Hampel’s and T-test). Combined use enhances fraud detection accuracy and reliability by addressing its limitations and providing a more robust framework for anomaly detection [5,6,7,8]. Such integration aligns with recent advances in fraud detection methodologies, where hybrid models incorporating machine learning and simple statistical techniques have shown improved sensitivity and precision [5,6,7].
4.3. Pinpointing Anomalies with Outlier Detection Tests: Practicality and Usefulness of Grubbs’, Hampel’s, and T-Tests in Healthcare Billing Analysis
The findings of this study confirm the practicality and usefulness of Grubbs’, Hampel’s, and T-tests as robust tools for identifying irregularities in healthcare billing data. These methods demonstrated complementary strengths Benford’s Law in detecting outliers across diverse billing categories, highlighting their adaptability to different data distributions and institutional contexts. Grubbs’, Hampel’s, and T-tests proved straightforward to implement, offering a practical and cost-effective means of preliminary screening.
Grubbs’ test proved particularly effective for normally distributed data categories, such as evaluated in this study, where it identified prominent outliers with high statistical significance. For example, a specialized dermatology center was consistently flagged for unusually high “points per examination” and “average examination values,” aligning with previous applications of Grubbs’ test in healthcare fraud detection [8,10]. The method’s reliance on mean and standard deviation makes it ideal for initial screening in small to moderate-sized datasets, though its sensitivity to normality assumptions limits its utility in skewed distributions. Recent advancements, such as data transformation techniques to enhance Grubbs’ outlier detection power in sequential data, further validate its adaptability to complex billing patterns [10].
Hampel’s test addressed non-normal distributions, such as “number of points per examination,” where median-based thresholds (k = 4.5) robustly identified outliers without distortion from extreme values. This method flagged the same specialized dermatology center as Grubbs’ test, corroborating results across methodologies. Hampel’s reliance on MAD ensures resilience against skewed datasets, a feature critical in healthcare billing analyses where fee structures or patient demographics may inherently distort means [8,24]. For instance, its application in detecting geopolitical shocks in agri-food sector revenue anomalies demonstrates its utility in distinguishing contextual irregularities from inherent variability—a principle transferable to healthcare billing [25].
T-test provided a critical validation layer by comparing trimmed and full dataset means, confirming outliers such as the large university health center’s unusually high “number of services charged.” This method’s ability to quantify an outlier’s impact on central tendency ensures targeted scrutiny of high-risk providers. Its simplicity aligns with findings from proficiency testing studies, where T-tests efficiently identified outliers in interlaboratory comparisons of clinical measurements [8,12,13,14].
A key advantage of these tests lies in their computational efficiency and interpretability. They were implemented using Excel 2010, underscoring their accessibility for healthcare systems lacking advanced analytical infrastructure [9]. This aligns with microcontroller-based sensor studies, where Grubbs’ test improved measurement accuracy in resource-constrained environments [25]. Similarly, hybrid frameworks combining outlier detection with machine learning, as seen in photovoltaic fault detection [26], suggest future potential for integrating these tests into automated healthcare fraud detection pipelines without sacrificing transparency.
However, limitations must be acknowledged. Grubbs’ test requires iterative application for multiple outliers, while Hampel’s test may overlook subtle anomalies in small samples. The T-test’s dependence on normality assumptions limits its standalone use. Despite these constraints, their combined application in this study, consistent with methodologies using Benford’s Law in COVID-19 test fraud detection [23,27], enhanced detection accuracy by triangulating results across methods. For example, the specialized dermatology center’s outlier status across all three tests reduced false-positive risks, a critical consideration in fraud investigations.
4.4. Future Research Directions
Future research should continue validating the methods tested in this study, using contemporary datasets to assess their adaptability to evolving billing practices [1,5]. Automated systems integrating Benford’s Law with outlier detection tests could enhance real-time monitoring of healthcare real-data payments, enabling faster anomaly detection and reducing reliance on manual audits [4,6].
Hybrid approaches combining simple statistical methods with advanced technologies like machine learning and artificial intelligence hold promise for improving sensitivity and precision in fraud detection [4,5,6,7]. For instance, ensemble learning techniques or neural network-based models could complement Benford’s Law by identifying complex patterns of manipulation in healthcare data [28]. Integrating these tools with clinical guidelines could also align billing practices with evidence-based care standards, enhancing both financial integrity and patient outcomes.
The findings in this study align with broader research on fraud detection and data integrity, emphasizing the importance of accessible tools for resource-constrained healthcare systems. Expanding the application of these methods to other healthcare systems and reimbursement models, such as capitation or DRG schemes, would provide valuable insights into their generalizability across diverse contexts [15,16,17]. By leveraging historical data alongside innovative computational techniques, future studies can refine fraud detection frameworks and contribute to optimizing resource allocation in healthcare systems.
5. Conclusions
This study highlights the practicality and usefulness of simple statistical methods, including Benford’s Law and outlier detection tests (Grubbs’, Hampel’s, and T-tests), for identifying irregularities in healthcare billing data. These methods provided a systematic and accessible framework for detecting anomalies, offering a cost-effective alternative to resource-intensive fraud detection systems. Benford’s Law effectively served as a first-line screening tool to assess data credibility by identifying deviations from expected digit distributions, signalling potential anomalies in key billing categories. Its simplicity and low implementation cost make it particularly suitable for resource-constrained healthcare systems.
Outlier detection tests complemented Benford’s Law by pinpointing specific providers with anomalous billing patterns. Grubbs’ test excelled in identifying outliers in normally distributed datasets, while Hampel’s test proved robust for non-normal data, and the T-test validated findings by quantifying the impact of outliers on central tendency. Together, these methods mitigated individual limitations and have shown the possible provision of efficient allocation of investigative resources.
The strategic use of historical billing data from 2014 allowed for a controlled evaluation of these methods without reputational risks to current providers. This approach aligns with Slovenia’s mixed reimbursement model, where historical expenditure patterns inform policy adjustments. By leveraging these simple tools, healthcare systems can enhance transparency, detect anomalies early, and mitigate financial losses without relying on complex analytical infrastructure.
Future research should validate these methods with contemporary datasets to assess their adaptability to evolving billing practices. Integrating these tools into automated systems or hybrid models incorporating machine learning could further enhance real-time fraud detection capabilities. By combining simplicity with scalability, these methods offer significant potential for improving the integrity and efficiency of healthcare payment systems.
Author Contributions
Conceptualization, A.F.P. and P.J.; methodology, A.F.P.; formal analysis, A.F.P., N.B.B., and P.J.; writing—original draft preparation, A.F.P.; writing—review and editing, A.F.P., N.B.B., and P.J. All authors have read and agreed to the published version of the manuscript.
Funding
This research received no external funding.
Institutional Review Board Statement
Not applicable.
Informed Consent Statement
Not applicable.
Conflicts of Interest
The authors declare no conflicts of interest.
Abbreviations
The following abbreviations are used in this manuscript:
| HIIS | Health Insurance Institute of Slovenia |
| MAD | Median absolute deviation |
| DRG | Diagnosis-related group |
References
- Najar AV, Alizamani L, Zarqi M, Hooshmand E. A global scoping review on the patterns of medical fraud and abuse: integrating data-driven detection, prevention, and legal responses. Arch Public Health, 2025; 83: 43. [CrossRef]
- Herland M, Bauder RA, Khoshgoftaar TM. Approaches for identifying U.S. medicare fraud in provider claims data. Health Care Manag Sci, 2020; 23: 2–19. [CrossRef]
- Hamid Z, Khalique F, Mahmood S, Daud A, Bukhari A, Alshemaimri B. Healthcare insurance fraud detection using data mining. BMC Med Inform Decis Mak, 2024; 24: 112. [CrossRef]
- Johnson JM, Khoshgoftaar TM. Data-Centric AI for Healthcare Fraud Detection. SN Comput Sci, 2023; 4: 389. [CrossRef]
- Antunes AM, Teixeira D, Sousa F. Benford’s Law: the fraud detection’s left hand. 2023 18th Iberian Conference on Information Systems and Technologies (CISTI). Aveiro, Portugal: IEEE, 2023.
- Orita M, Hagiwara Y, Moritomo A, Tsunoyama K, Watanabe T, Ohno K. Agreement of drug discovery data with Benford’s law. Expert Opin Drug Discov, 2013; 8: 1–5. [CrossRef]
- Goh, C. Applying visual analytics to fraud detection using Benford’s law. J Corp Accounting Finance, 2020; 19 31: 202–8. [CrossRef]
- Zhang, F. Using Outliers Detection in Policy Analysis: A Pilot Case Study of the Detection and Analysis of Average Healthcare Expense in China. Health Systems and Policy Research, 2015; 2.
- No authors listed: https://www.google.com/search?q=Miller-Nigrini+Excel+Benford+Tester&rlz=1C1GCEB_enSI923SI923&oq=Miller-Nigrini+Excel+Benford+Tester&gs_lcrp=EgZjaHJvbWUyBggAEEUYOTIGCAEQIxgnMgYIAhAjGCcyBwgDEAAY7wUyBwgEEAAY7wUyBwgFEAAY7wUyBwgGEAAY7wUyCggHEAAYgAQYogTSAQkxNzE5ajBqMTWoAgCwAgA&sourceid=chrome&ie=UTF-8.
- Adikaram KKLB, Hussein MA, Effenberger M, Becker T. Data Transformation Technique to Improve the Outlier Detection Power of Grubbs’ Test for Data Expected to Follow Linear Relation. Journal of Applied Mathematics, 2015; 2015: 1–9. [CrossRef]
- Urvoy M, Autrusseau F. Application of Grubbs’ test for outliers to the detection of watermarks. Proceedings of the 2nd ACM workshop on Information hiding and multimedia security. Salzburg Austria: ACM, 2014.
- Tripathy, SS. Comparison of Statistical Methods for Outlier Detection in Proficiency Testing Data on Analysis of Lead in Aqueous Solution. AJTAS, 2013; 2: 233. [CrossRef]
- Skaik, YA. The bread and butter of statistical analysis “t-test”: Uses and misuses. Pak J Med Sci, 1969; 31. [CrossRef]
- Ben-Gal, I. Outlier Detection. In: Maimon O, Rokach L, eds. Data Mining and Knowledge Discovery Handbook. Boston, MA: Springer US, 2009.
- Albreht T, Polin K, Pribaković Brinovec R, et al. Slovenia: Health System Review. Health Syst Transit, 2021; 23: 1–183.
- OECD, European Commission. Health at a Glance: Europe 2024: State of Health in the EU Cycle. OECD, 2024. [CrossRef]
- Prevolnik Rupel V, Došenović Bonča P. Is Value-Based Health Care Just the Latest Fad or can it Transform the Slovenian Health Care System? Slovenian Journal of Public Health, 2023; 62: 55–8.
- European Central Bank. A methodology for automatised outlier detection in high-dimensional datasets: an application to euro area banks’ supervisory data. LU: Publications Office, 2018. https://data.europa.eu/doi/10.2866/357467 (accessed 1 Apr 2025).
- Teitcher JE, Bockting WO, Bauermeister JA, Hoefer CJ, Miner MH, Klitzman RL. Detecting, preventing, and responding to “fraudsters” in internet research: ethics and tradeoffs. J Law Med Ethics, 2015; 43: 116‐33.
- Kilicoglu, H. Biomedical text mining for research rigor and integrity: tasks, challenges, directions. Brief Bioinform, 2018; 19: 1400‐1414. [CrossRef]
- Zhaksylyk A, Zimba O, Yessirkepov M, Kocyigit BF. Research Integrity: Where We Are and Where We Are Heading. J Korean Med Sci, 2023; 38: e405. [CrossRef]
- Azevedo CDS, Gonçalves RF, Gava VL, Spinola MM. A Benford’s law based method for fraud detection using R Library. MethodsX, 2021; 8: 101575. [CrossRef]
- Bosnjak M, Dahm S, Kuhnert R, Weihrauch D, Rosario AS, Hurraß J, Schmich P, Wieler LH. Potential COVID-19 test fraud detection: Findings from a pilot study comparing conventional and statistical approaches. J Health Monit, 2024; 9: e12100. PMCID: PMC11262742. [CrossRef] [PubMed]
- Auzins A, Aboltins A, Lismanis A. Identification of external shock impact on agri-food sector by applying outlier detection tests: case of Latvia. 2024. [CrossRef]
- Kokolanski Z, Dimcev V. Outlier Detection Approach in Sensor-to-Microcontroller Interfaces. 2024 XV International Symposium on Industrial Electronics and Applications (INDEL). Banja Luka, Bosnia and Herzegovina: IEEE, 2024.
- Ding K, Zhang J, Ding H, Liu Y, Chen F, Li Y. Fault detection of photovoltaic array based on Grubbs criterion and local outlier factor. IET Renewable Power Gen, 2020; 14: 551–9. [CrossRef]
- Ayinoluwa Feranmi Kolawole, Shukurat Opeyemi Rahmon. Designing secure data pipelines for medical billing fraud detection using homomorphic encryption and federated learning. Int J Sci Res Arch, 2024; 10: 1210–22. [CrossRef]
- Chouhan N, Kediya S, Wagh U, Deshpande P, Karmore P, Das D. A Meta-Analysis of AI in Fraud Detection: Evaluating the Effectiveness of Different Algorithms and Data Sources. 2024 2nd DMIHER International Conference on Artificial Intelligence in Healthcare, Education and Industry (IDICAIEI). Wardha, India: IEEE, 2024.
Disclaimer/Publisher’s Note: The statements, opinions and data contained in all publications are solely those of the individual author(s) and contributor(s) and not of MDPI and/or the editor(s). MDPI and/or the editor(s) disclaim responsibility for any injury to people or property resulting from any ideas, methods, instructions or products referred to in the content. |
© 2025 by the authors. Licensee MDPI, Basel, Switzerland. This article is an open access article distributed under the terms and conditions of the Creative Commons Attribution (CC BY) license (http://creativecommons.org/licenses/by/4.0/).
Copyright: This open access article is published under a Creative Commons CC BY 4.0 license, which permit the free download, distribution, and reuse, provided that the author and preprint are cited in any reuse.


