Submitted:
12 April 2025
Posted:
17 April 2025
You are already at the latest version
Abstract
The analysis of asymmetries in the countermovement jump (CMJ) is a potentially useful tool for the prevention of injuries in elite soccer players. This study analyzes the relationship between biomechanical asymmetries in the CMJ on landing (% Peak Landing Force Assymetry) and the risk of musculoskeletal injuries. Through the use of force platforms (ForceDecks, Valdperformance) and 4 machine learning models, data from 29 AFC Champions League elite level professional soccer players were analyzed during a regular season (with a total of 1265 jumps analyzed, during the days md+1, md+2 and md-1). The results indicate that the average asymmetries (0.82% +- 13.66) in the peak landing force are not predictive of the risk of injury, while the % Coefficient of variation (323–1827) of that asymmetry was related and could have a predictive nature regarding the risk of injuries. Furthermore, there is a moderate positive correlation (r = 0.447) between % COV Assymetry and the appearance of injuries, which is statistically significant (p = 0.017). The odds ratio of 2.4 indicates that players with higher than average COV asymmetry are 2.4 times more likely to suffer an injury. These findings highlight the importance of the CMJ as part of injury monitoring and injury reduction programs.
Keywords:
countermovement jump
; injuries
; prediction
; machine learning
; asymmetry
1. Introduction
Injuries in elite football are a matter of capital importance. According to a 2023 publication in the British Journal of Sports Medicine (1,2), the incidence of hamstring injuries in professional football has risen markedly over the past two decades. Analyzing data from 21 seasons (2001/02–2021/22), the study found that these injuries now represent 24% of all injuries in elite men’s football—twice as many as the 12% recorded at the beginning of the observed period.
The relationships between internal and external load (measured with force platforms) have been established as key to understanding how athletes respond to workloads and how it can be related to the risk of injury. (3)
Recent references (4) have shown within the analysis of CMJ asymmetries that they are not always predictive of the risk of injury although they can potentially increase that risk. Thus, asymmetries above 10-15% could be associated, although it all depends on the athlete and the demands of the sport (4,5)
However, other meta-analytic reviews (6) have shown that there is no statistical association between asymmetries and risk of injury (analyzing 31 studies with a total of 6397 participants). Asymmetries in the field of high sports performance are common, as shown by certain studies (7) (study where the vertical jump is analyzed in volleyball players and where 40% claim to identify their strongest dominant leg), so even if asymmetries exist, neither it can be concluded with a statistical association between asymmetry and injury risk.
The analysis of fatigue and its relationship with the injury rate has been studied (8,9). Thus, it has been shown that different metrics evaluated with the CMJ (analyzed with the COV and the minimum relevant change (SWC) have acceptable reliability (CV < 5%) and good sensitivity (CV < SWC). Other studies (9), comparing with other fatigue tests (such as the 20m sprint vs CMJ) showed that the CMJ showed one of the greatest consistency in the COV (3%), being one of the reference tests to detect fatigue in athletes in team sports.(8)
Regarding the validity and reliability of force platforms as a gold standard of evaluation, recent references (10) show that the ForceDecks model has a reliability and validity comparable to laboratory force platforms, with a large intraclass correlation coefficient (ICC) and standard errors of measurement (SEM), reaffirming this reliable tool for monitoring athletes.
Other studies (11) have shown that in unilateral tests and to detect asymmetries, force platforms are a useful tool when compared with data obtained with platforms under controlled laboratory conditions.
This study pretends analyzes the relationship between biomechanical asymmetries in the CMJ on landing (% Peak Landing Force Asymmetry) and the risk of musculoskeletal injuries, analyzing the % COV Asymmetry (coefficient of variation of asymmetry) and predict the injury risk using 4 different Machine Learning Models.
2. Method
2.1. Study Participants
This prospective cohort study, incorporating predictive analysis through machine learning, involved a group of 29 elite soccer players from a Malaysian professional club competing in the AFC Asian Champions League during the 2024–2025 season. The participants had an average age of 29 years (±2.1), height of 1.78 meters (±3.5), BMI of 22.3 (±1.98), body fat percentage of 14.5% (±1.1), and a body weight of 75.4 kg (±2.9). On average, the athletes had accumulated 7.9 years of experience at the professional level.
All participants were drawn from a single team, selected intentionally due to their affiliation with the club under investigation during the specified season. The study employed a convenience sampling method, meaning subjects were chosen based on their immediate availability and relevance to the study’s focus. As is typical of non-probabilistic sampling methods, no randomization or stratification procedures were applied in the selection process.
Each player was thoroughly informed about the objectives and procedures of the study before agreeing to participate. They were assured that all personal and performance-related data would be handled with strict confidentiality, accessible only to the club’s medical and technical staff.
Initial health assessments were carried out through brief medical interviews conducted by the medical and performance team, which included one physician, three physiotherapists, and three strength and conditioning coaches. The medical staff verified the provided information using routine clinical assessments, including medical imaging, player health histories, and direct clinical evaluations.

Table.
Data from the study sample. Age: Chronological age in years; Height: Height measured in centimeters (cm); Weight: Body mass measured in Kilograms (Kg); BMI: Body Mass Index; % Fat: Percentage of body fat mass.
Table.
Data from the study sample. Age: Chronological age in years; Height: Height measured in centimeters (cm); Weight: Body mass measured in Kilograms (Kg); BMI: Body Mass Index; % Fat: Percentage of body fat mass.
| Age | 29 +- 2.1 years |
| Height | 1.78+-3.5cm |
| Weight | 75.4 +- 2.9kg |
| BMI | 22.3 +- 1.98 |
| % Fat | 14.5 +- 1.1 |
| Professional years | 7.9 years |
2.2. Procedures
To assess neuromuscular performance, the study utilized the Neuromuscular Assessment and Monitoring System (ValdPerformance ForceDecks®), which was specifically employed to evaluate the Countermovement Jump (CMJ). This system is designed to measure muscular strength and detect potential asymmetries or imbalances between limbs. The data collected through the ForceDecks® was analyzed using ValdPerformance and ValdHub software, which automatically identifies valid repetitions, peak force outputs, averages, and asymmetry values, while excluding any attempts that fall outside of protocol parameters.
Measurements were systematically conducted throughout the entire competitive season (12 months), specifically on MD+1, MD+2, and MD-1 training days. All assessments were performed before the main training session and immediately after completing a standardized warm-up, maintaining a consistent session structure for every test across the season. All procedures followed previously established protocols (12,13).
Each player completed the CMJ test following a single, standardized evaluation procedure, initiated exactly five minutes after a warm-up that included 5 minutes of cycling and 5 minutes of dynamic mobility exercises focused on the lower limbs (14,15). Prior to testing, players received a clear demonstration of the movement, followed by a practice attempt to ensure proper technique.
During testing, athletes performed three maximal effort jumps, with a 15-second rest between each repetition (12). Standardized verbal cues were provided throughout the test to encourage maximal intensity in jump performance (12).
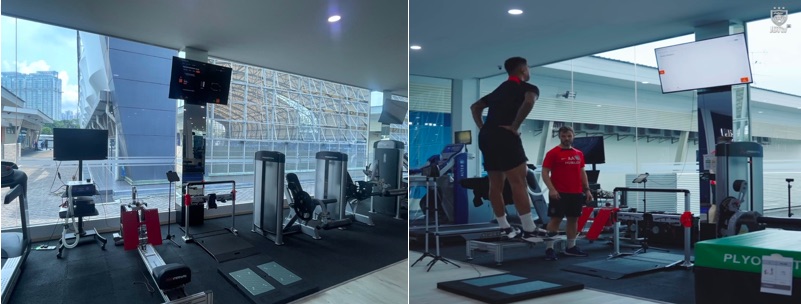
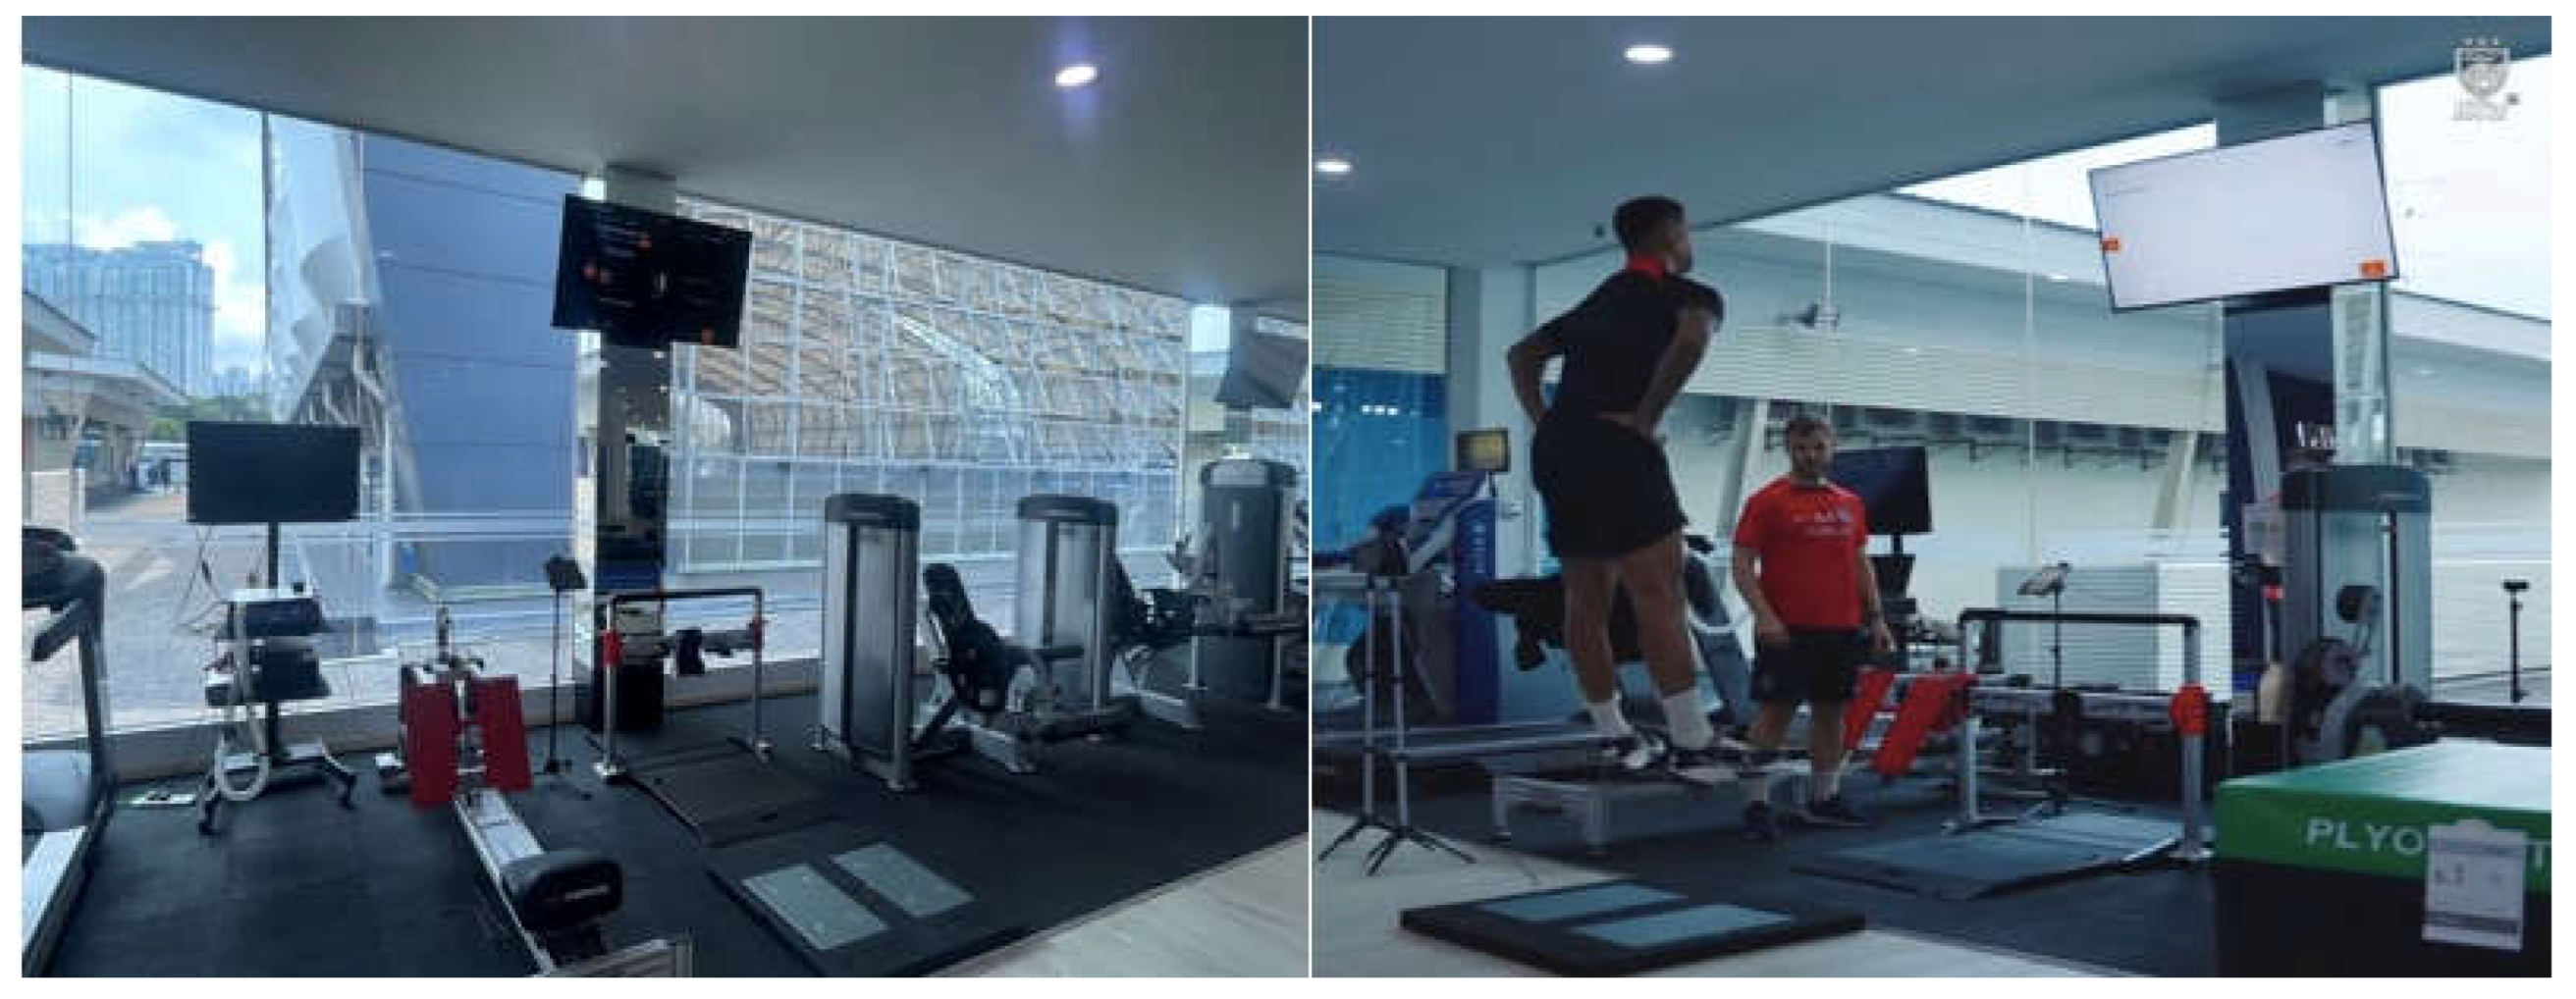
Figure 1.
Neuromuscular Assessment and monitoring System (Forcedecks ®, Valdperformance, VALD, Brisbane, Australia).
Figure 1.
Neuromuscular Assessment and monitoring System (Forcedecks ®, Valdperformance, VALD, Brisbane, Australia).
For data processing, the specific ValdPerformance Software and ValdHub cloud system (APP ForceDecks, Apple Store, Vald Performance Pty Ltd © 2014-2024,Version 2.1.0) was used, using the default configuration. This analysis involved self-detection of the repetitions and the maximum force values, averages and asymmetries. The repetitions that were not performed accordingly to the protocol and standards, were eliminated from subsequent analysis (10)
2.3. Statistic Analysis
The data were first analyzed to determine accuracy of data collection, missing values, and outliers.
For the statistical analysis, the limb asymmetry index (IA%) was calculated using the formula (Figure 2), where D and I represent the values of the dominant and no dominant leg, respectively.
In addition, logistic regression models were applied to assess the association between asymmetries and injuries. Four Machine Learning algorithms (Decision Tree, Random Forest, Logistic Regresion and XGBoost) using Julius AI Analyltics Software (© 2024 Caesar Labs, Inc) and Python ™ Copyright ©2001-2024.
(Figure 3, Figure 4) were trained and used to identify critical asymmetry thresholds. Three risk groups were established based on the % COV, with cut-off points based on percentiles. The error rates (False Positives and False Negatives) were also analyzed (Figure 5), and curve ROC (Receiver Operating Characteristic Curve) and Precision Recall were analyzed (Figure 6).
Ethical aspects were carefully addressed to ensure the protection of participants’ rights and overall well-being within the context of sports science research. The study adhered to core ethical principles, including respect for autonomy, the safeguarding of confidentiality, and the commitment to avoid causing harm (non-maleficence).
3. Results
The results of the analysis of Countermovement Jump variables related with asymmetries (% Peak Force Landing and % COV Asymmetry) in elite soccer players show important differences to analyze.
3.1. % Peak Landing Force Asymmetry
The scatter plot for Assym_Ave_LR shows a weaker relationship compared to COV_Assy, with a less pronounced trend line. (Figure 7)
The correlation coefficient indicates a weaker association, suggesting that asymmetry might not be as strong a predictor of injury risk as COV_Assy.
3.2. % Coefficient of Variation (COV) of Peak Landing Force Asymmetry
The highest proportion of players is located in the levels with the lowest % COV, as can be seen in the frequency diagram (Figure 9)
The scatter plot shows a positive trend between COV_Assy and injury risk probability, as indicated by the upward-sloping trend line. (Figure 7)
Players with higher COV_Assy values tend to have a higher probability of injury, suggesting that variability in COV_Assy might be a significant factor in predicting injury risk.(Figure 10)
The correlation coefficient (displayed on the plot) quantifies this relationship, showing a moderate to strong positive correlation. (Figure 7)
There is a moderate positive correlation (r = 0.447) between % COV Assy and injury occurrence (Figure 11), which is statistically significant (p = 0.017)
The odds ratio of 2.4 indicates that players with above-median COV asymmetry are 2.4 times more likely to have an injury. Injury distribution in relation to COV asymmetry levels: 9 players with low asymmetry without injury vs 5 with injury; 6 players with high asymmetry without injury vs 8 with injury.
Injured players (group 1) have higher COV Assy values on average (574.3 vs 175.2) (Figure 12). However, the Mann-Whitney U test (p=0.17) suggests that the difference is not statistically significant, possibly due to the small sample size.
3.3. Dominant Side vs No Dominant Side
Average asymmetry (% Assym Ave L-R) is moderately correlated with the dominant leg (r = 0.557) with a negative correlation with the risk of injury (r = -0.343). However dominant leg does not appear to correlate significantly with the risk of injury (r ≈ 0.000). (Figure 13)
3.4. Predictions Based on Different Models of Machine Learning
The logistic regression model shows moderate performance with an accuracy of 67%. The precision and recall for both classes (injured and not injured) are balanced, but the model could benefit from more data or additional features for improved prediction. The probability plot indicates how the likelihood of injury increases with higher COV Assy values
The decision tree model (Figure 14) obtained the following results when predicting injuries:
Overall accuracy: 66.7%
Classification report:
Class 0 (No injury):
• Accuracy: 100%
• Recall: 33%
• F1-score: 50%
Class 1 (Injury):
• Accuracy: 60%
• Recall: 100%
• F1-score: 75%
Although the model identifies injured players well (100% recall), it has problems correctly identifying non-injured players. This may be due to the small size of the data set.
The analysis successfully established 3 risk thresholds (Figure 15) based on percentiles of the COV_Assy variable and evaluated the performance of three classification models (Random Forest, SVM, and Decision Tree) using cross-validation ( Low risk: < 146.73; Medium risk: 146.73 - 232.68; High risk: > 232.68). Accuracy of different models (cross-validation) are Random Forest (0.674; +/- 0.325), SVM (0.641; +/- 0.124), Decision Tree (0.674 +/- 0.325).
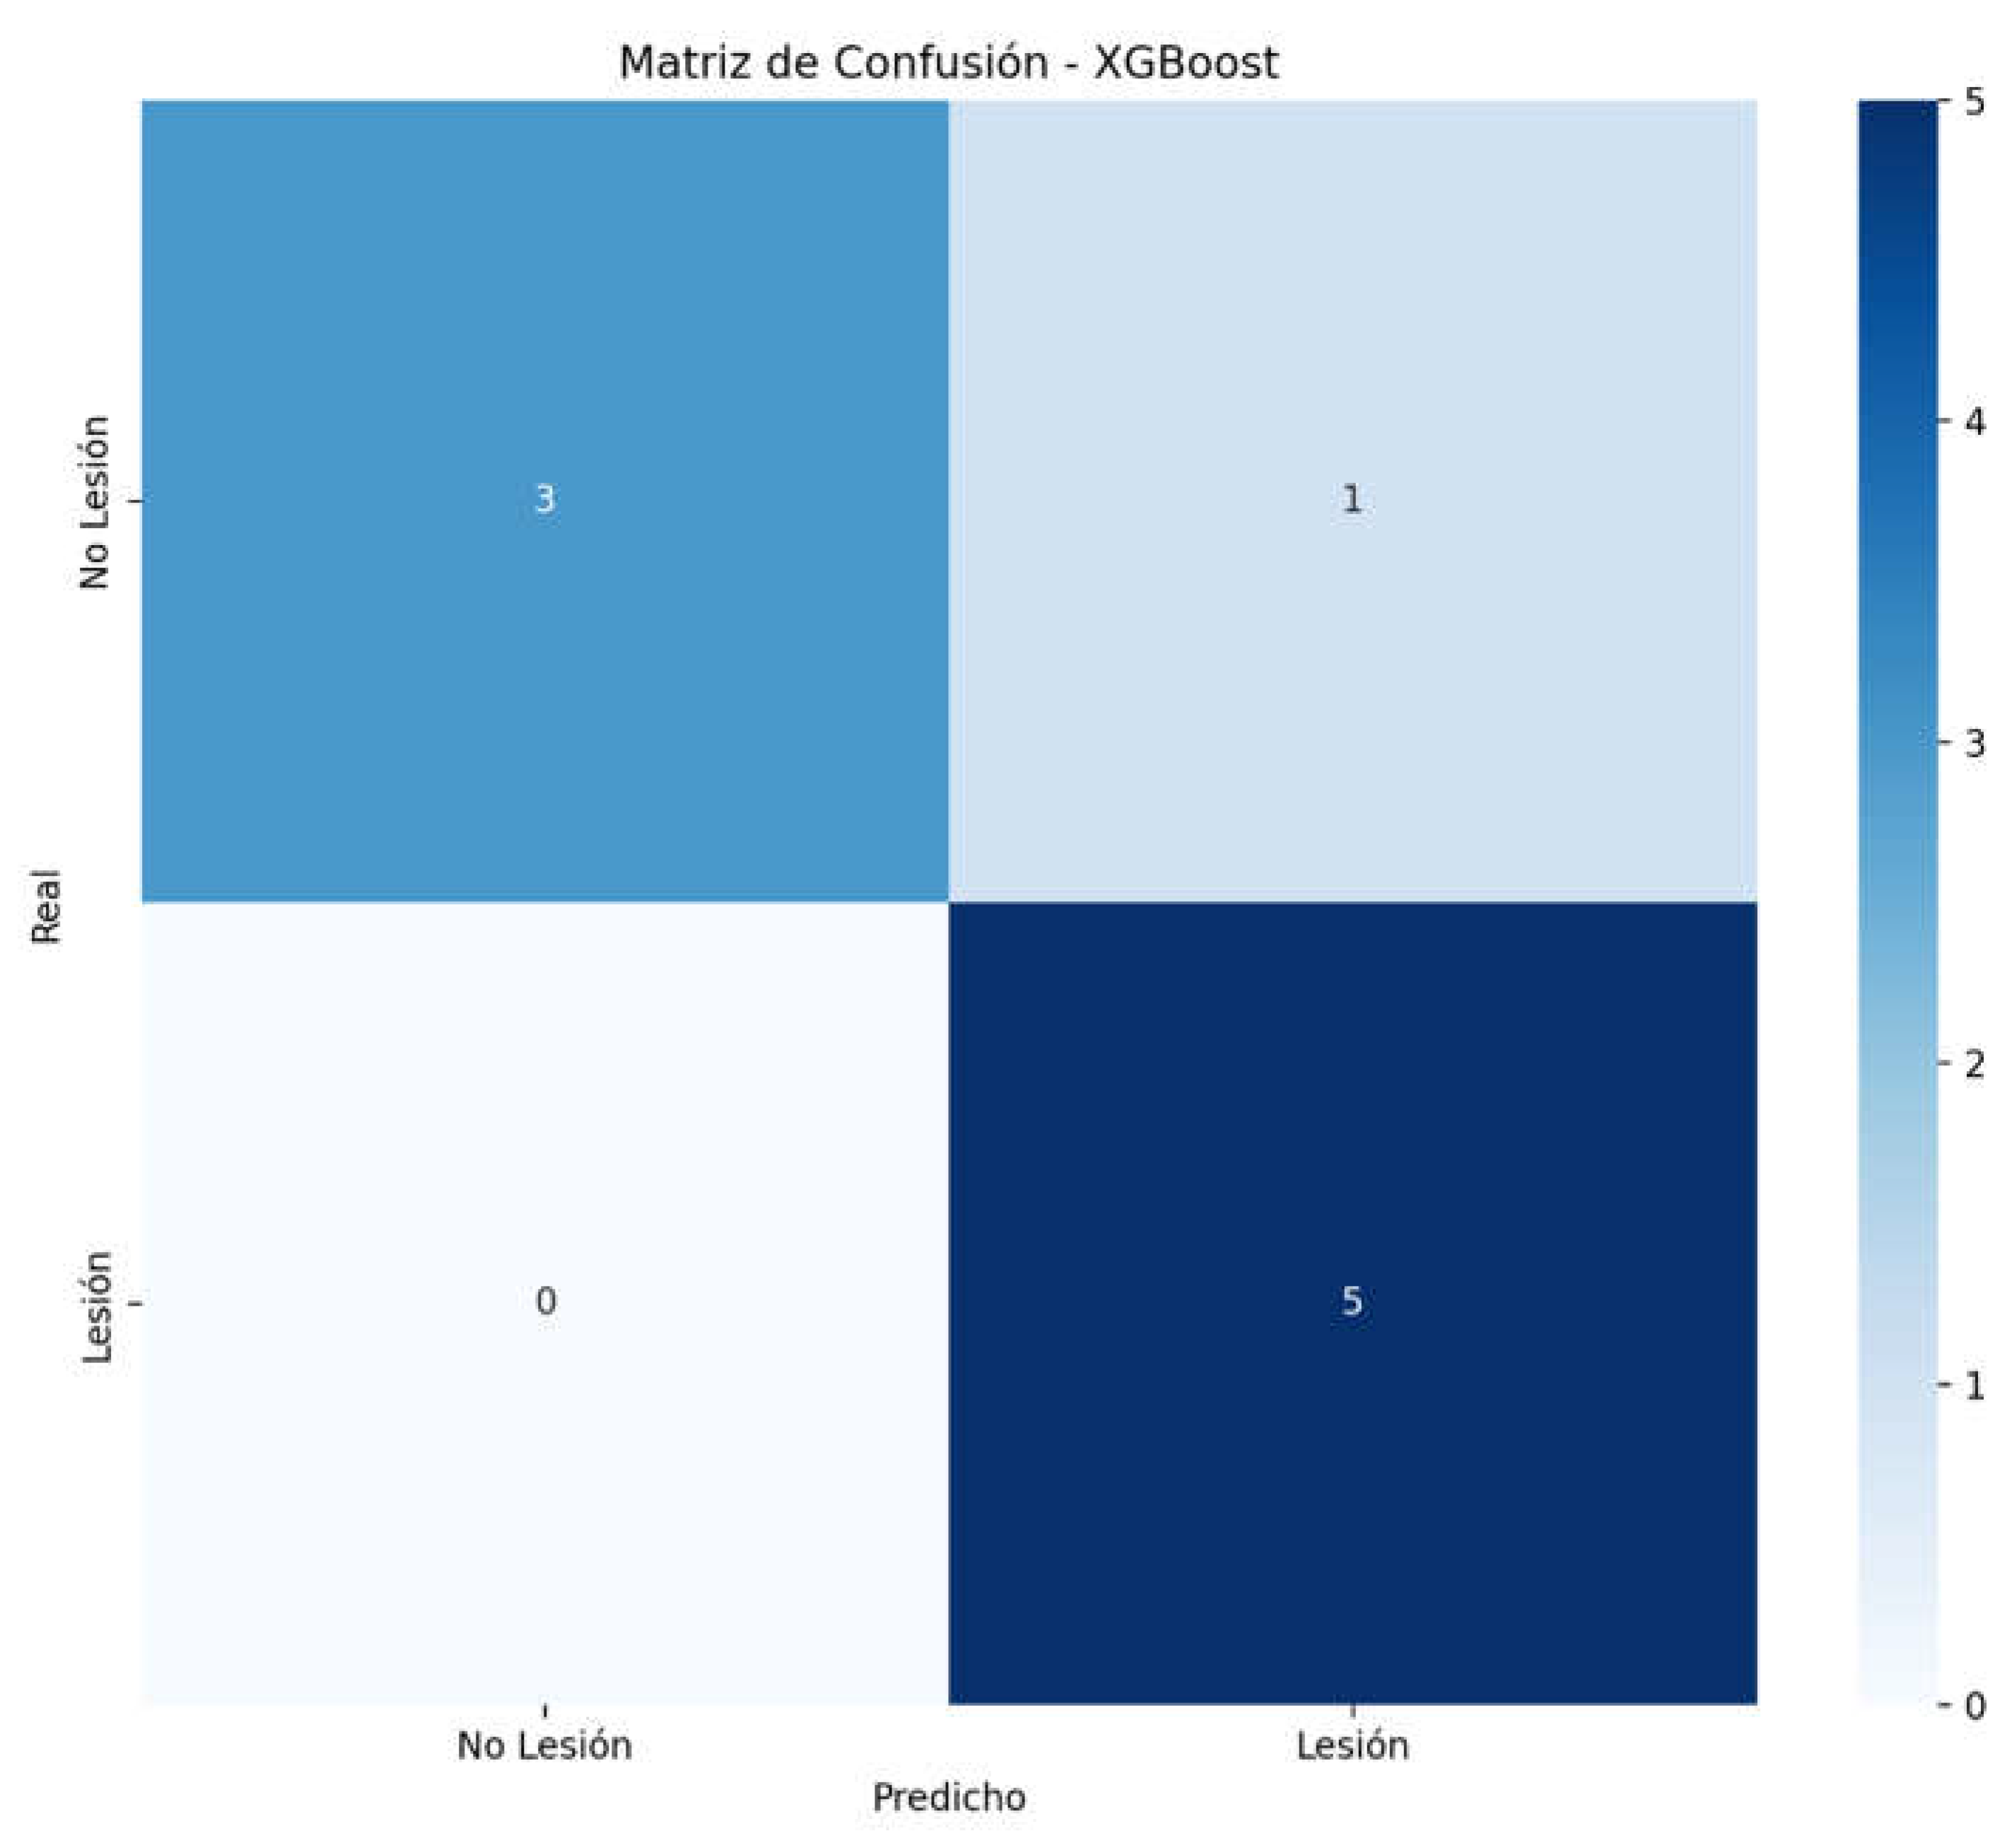
The XGBoost model (Figure 16) shows an accuracy 0.444, Precision 0.400, Recall 0.500, F1-Score 0.444 and Feature Importance % COV Assy: 1.The Error Rates of model are: False Positive Rate: 0.0% and False Negative Rate: 25.0%
There are no false positives (0%), meaning the model does not overestimate injury risk (Figure 17). The false negative rate is 25%, indicating the model missed some real injuries. Players with false negatives have COV values between 65 and 321, below the cutoff. The model is 75% accurate overall, with better performance in detecting non-injuries (recall of 1.00) than in detecting injuries (recall of 0.50). This suggests it might be beneficial to adjust the COV cutoff to better balance injury detection, possibly lowering it to capture more positive cases.
Cut-off points divide risk levels into low, medium, and high, while the Random Forest and Decision Tree models show similar performance. The model’s performance is moderate, with asymmetry being a significant predictor of injury risk.
There are references in the literature (19) that both the previous injury history and related variables such as imbalances and asymmetries can contribute to the risk of injury. In addition, in these same references, it is shown how predictive models based on Machine Learning achieved a moderately high level of precision, which reaffirms the usefulness of using these algorithms.
Other studies have shown, along the same lines, that models based on algorithms such as Random Forest and Gradient Boosting are effective, achieving high levels of precision and sensitivity in the detection of injury risk (20).
Countermovement jump (CMJ) asymmetries have been extensively investigated in the literature (21,22,23), with numerous studies suggesting a link between significant asymmetries and both elevated injury risk and reduced athletic performance. While the findings of our study do not identify asymmetry as a decisive risk factor, previous research has indicated that CMJ asymmetries exceeding 10–15% could be associated with a higher likelihood of injury (24).
When comparing unilateral and bilateral testing methods, the bilateral CMJ has emerged as one of the most frequently used assessments in sports-specific contexts. Utilizing dual force plate systems, this test enables real-time data collection and analysis, providing detailed force–time variables that reflect neuromuscular function and asymmetries between limbs (25). It’s important to note that variability in movement and physical output is a natural aspect of human biomechanics, and bilateral asymmetries are often considered a normal result of this variability (26).
Several studies suggest that injury risk may become more pronounced when asymmetry exceeds 15%, while more recent recommendations propose 10% as a more conservative threshold (27). In our investigation, the percentage of asymmetry observed in the sample generally remained below these thresholds, supporting the conclusion—aligned with machine learning model predictions—that asymmetry alone may not be the primary factor influencing injury risk.
An additional factor often examined in relation to asymmetry is leg dominance. However, our findings revealed no significant differences in force magnitudes between the dominant and non-dominant leg during the landing phase of the CMJ. While prior research (28) has identified differences between limbs during the impulse phase of the jump, the landing phase did not present meaningful disparities in vertical jump variables.
These results align with one of the key conclusions of our study: leg dominance does not appear to be a determining factor in injury risk. Given that landing forces are among the most critical metrics for assessing injury potential in CMJ testing, the absence of asymmetry in this phase further supports the notion that dominance is not directly associated with a higher risk of injury.
Considering one of the central elements of this study—specifically the coefficient of variation (%COV)—previous research (28) has reported seasonal trends regarding both the magnitude and direction of inter-limb asymmetries. Findings indicated that while the magnitude of asymmetry remained relatively stable across the competitive season, the direction of asymmetry showed notable variability, although there was a considerable level of consistency between jump tests over time.
Similarly, another study (29) observed that asymmetry-related variables during unilateral CMJ testing generally exhibited poor or unacceptable reliability, along with low to moderate agreement in direction. In contrast, bilateral CMJ tests typically demonstrated acceptable reliability and higher agreement levels in asymmetry direction. These outcomes indicate that although unilateral CMJs may allow for more accurate assessment of single-leg performance, bilateral CMJs tend to offer more reliable and stable measurements when evaluating inter-limb asymmetries.
In conclusion, the results indicate that the average asymmetries (0.82% +- 13.66) in the peak landing force are not predictive of the risk of injury, while the % Coefficient of variation (323–1827) of that asymmetry was related and could have a predictive nature regarding the risk of injuries. Furthermore, there is a moderate positive correlation (r = 0.447) between % COV Assymetry and the appearance of injuries, which is statistically significant (p = 0.017). The odds ratio of 2.4 indicates that players with higher than average COV asymmetry are 2.4 times more likely to suffer an injury. These findings highlight the importance of the CMJ as part of injury monitoring and injury reduction programs.
One of the main limitations of this study lies in the sample size, which may not be large enough to allow for generalization of the findings to the wider population of elite soccer players. The limited number of participants could reduce the statistical power of the analysis and restrict the extent to which the results can be applied beyond the specific group evaluated.
4. Practical Implications
The study has several interesting practical applications for the sports field, especially in injury prevention and monitoring in elite soccer players. Below I highlight some key applications based on the study findings:
Incorporating CMJ into Injury Prevention Programs:
• Using countermovement jump (CMJ) analysis to monitor force asymmetry on landing as an indicator of injury risk.
• Integrating coefficient of variation (% COV Asymmetry) as a primary metric to identify players most likely to be injured.
Using Force Platforms
• Implementing tools such as ForceDecks® force platforms to assess muscle imbalances and detect changes in neuromuscular performance throughout the season.
• Performing regular measurements on specific training days (MD+1, MD+2, MD-1) to obtain consistent and relevant data.
Injury Prediction with Machine Learning
• Apply machine learning models (e.g., Random Forest, Decision Tree) to analyze data and establish risk thresholds based on % COV Asymmetry.
• Use predictive models to identify players at low, medium, or high risk levels for injury, allowing for personalized interventions
References
- Ekstrand, J.; Bengtsson, H.; Waldén, M.; Davison, M.; Khan, K.M.; Hägglund, M. Hamstring injury rates have increased during recent seasons and now constitute 24% of all injuries in men’s professional football: the UEFA Elite Club Injury Study from 2001/02 to 2021. British Journal of Sports Medicine 2023, 57, 292–298. [Google Scholar] [CrossRef] [PubMed]
- Ekstrand, J.; Hägglund, M.; Walden, M. Injury incidence and injury patterns in professional football: The UEFA injury study. British Journal of Sports Medicine 2011, 45, 553–558. [Google Scholar] [CrossRef] [PubMed]
- Impellizzeri, F.M.; Marcora, S.M.; Coutts, A.J. Internal and external training load: 15 years on. International Journal of Sports Physiology and Performance 2019, 14, 270–273. [Google Scholar] [CrossRef] [PubMed]
- Bishop, C.; Read, P.; Lake, J.; Chavda, S.; Turner, A.; Loturco, I. Interlimb asymmetries: The need for an alternative approach to data analysis. Journal of Strength and Conditioning Research 2018, 32, 1242–1249. [Google Scholar]
- Badau, A.; Cengiz, Ş.Ş.; Karesi, H.; Er, B. The Effect of Hamstring Eccentric Strength and Asymmetry on Acceleration and Vertical Jump Perfor-mance in Professional Female Soccer Players. Retos: Nuevas Tendencias en Educación Física, Deporte y Recreación 2024, 57, 355–361. [Google Scholar] [CrossRef]
- Helme, M.; Tee, J.; Emmonds, S.; Low, C. Does lower-limb asymmetry increase injury risk in sport? A systematic review. Physical therapy in sport 2021, 49, 204–213. [Google Scholar] [CrossRef]
- Fort-Vanmeerhaeghe, A.; Gual, G.; Romero-Rodríguez, D.; Unnitha, V. Lower limb neuromuscular asymmetry in volleyball and basketball players. Journal of Human Kinetics 2016, 50, 135–143. [Google Scholar] [CrossRef]
- Roe, G.; Darrall-Jones, J.; Black, C.; Shaw, W.; Till, K.; Jones, B. Between-day reliability and sensitivity of common fatigue measures in rugby players. International Journal of Sports Physiology and Performance 2017, 12, 607–613. [Google Scholar] [CrossRef]
- Gathercole, R.; Sporer, B.; Stellingwerff, T.; Sleivert, G. Comparison of the capacity of different jump and sprint field tests to detect neuromuscular fatigue. Journal of Strength and Conditioning Research 2015, 29, 2522–2531. [Google Scholar] [CrossRef]
- Collings, T.J.; Lima, Y.L.; Dutaillis, B.; Bourne, M.N. Concurrent validity and test–retest reliability of VALD ForceDecks strength, balance, and movement assessment tests. Journal of Science and Medicine in Sport 2024. [Google Scholar] [CrossRef]
- Meras Serrano, H.; Mottet, D.; Caillaud, K. Validity and Reliability of Kinvent Plates for Assessing Single Leg Static and Dynamic Balance in the Field. Sensors 2023, 23, 2354. [Google Scholar] [CrossRef] [PubMed]
- Bagchi, A.; Raizada, S.; Thapa, R.K.; Stefanica, V.; Ceylan, H.İ. Reliability and Accuracy of Portable Devices for Measuring Countermovement Jump Height in Physically Active Adults: A Comparison of Force Platforms, Contact Mats, and Video-Based Software. Life 2024, 14, 1394. [Google Scholar] [CrossRef] [PubMed]
- McMahon, J.J.; Ripley, N.J.; Comfort, P. Force plate-derived countermovement jump normative data and benchmarks for professional rugby league players. Sensors 2022, 22, 8669. [Google Scholar] [CrossRef]
- Steinman, D.; Shirley, M.; Fuller, M.; Reyes, C. Validity and reliability of countermovement vertical jump measuring devices. International Journal of Exercise Science: Conference Proceedings 2019, 8, 38. [Google Scholar]
- O’Grady, M.W.; Young, W.B.; Talpey, S.W.; Behm, D.G. Does the warm-up effect subsequent post activation performance enhancement. J. Sport Exerc. Sci 2021, 5, 302–309. [Google Scholar]
- Espada, M.C.; Jardim, M.; Assunção, R.; Estaca, A.; Ferreira, C.C.; Pessôa Filho, D.M.; Santos, F.J. Lower Limb Unilateral and Bilateral Strength Asymmetry in High-Level Male Senior and Professional Football Players. Healthcare 2023, 11, 1579. [Google Scholar]
- Badby, A.J.; Mundy, P.D.; Comfort, P.; Lake, J.P.; McMahon, J.J. The validity of Hawkin Dynamics wireless dual force plates for measuring countermovement jump and drop jump variables. Sensors 2023, 23, 4820. [Google Scholar] [CrossRef]
- Merrigan, J.J.; Stone, J.D.; Galster, S.M.; Hagen, J.A. Analyzing force-time curves: Comparison of commercially available automated software and custom MATLAB analyses. J. Strength Cond. Res. 2022, 36, 2387–2402. [Google Scholar] [CrossRef]
- Ruddy, J.D.; Shield, A.J.; Williams, M.D.; Opar, D.A. Predicting hamstring strain injury in elite athletes. Medicine & Science in Sports & Exercise 2018, 50, 828–836. [Google Scholar]
- Oliver, J.L.; Ayala, F.; Croix, M.B.D.S.; Lloyd, R.S.; Myer, G.D.; Read, P.J. Using machine learning to improve our understanding of injury risk and prediction in elite male youth football players. Journal of science and medicine in sport 2020, 23, 1044–1048. [Google Scholar] [CrossRef]
- Hart, N.H.; Nimphius, S.; Spiteri, T.; Newton, R.U. Leg strength and lean mass symmetry influences kicking performance in Australian football. Journal of sports science & medicine 2014, 13, 157. [Google Scholar]
- Hewit, J.K.; Cronin, J.B.; Hume, P.A. Asymmetry in multi-directional jumping tasks. Physical Therapy in Sport 2012, 13, 238–242. [Google Scholar] [CrossRef] [PubMed]
- Bishop, C.; Turner, A.; Read, P. Effects of inter-limb asymmetries on physical and sports performance: A systematic review. Journal of sports sciences 2018, 36, 1135–1144. [Google Scholar] [CrossRef]
- Parkinson, A.O.; Apps, C.L.; Morris, J.G.; Barnett, C.T.; Lewis, M.G. The calculation, thresholds and reporting of inter-limb strength asymmetry: A systematic review. Journal of Sports Science & Medicine 2021, 20, 594. [Google Scholar]
- Menzel, H.J.; Chagas, M.H.; Szmuchrowski, L.A.; Araujo, S.R.; de Andrade, A.G.; de Jesus-Moraleida, F.R. Analysis of lower limb asymmetries by isokinetic and vertical jump tests in soccer players. The Journal of Strength & Conditioning Research 2013, 27, 1370–1377. [Google Scholar]
- Bromley, T.; Turner, A.; Read, P.; Lake, J.; Maloney, S.; Chavda, S.; Bishop, C. Effects of a competitive soccer match on jump performance and interlimb asymmetries in elite academy soccer players. The Journal of Strength & Conditioning Research 2021, 35, 1707–1714. [Google Scholar]
- Thomas, C.; Jones, P.A.; Dos’ Santos, T. Countermovement jump force–time curve analysis between strength-matched male and female soccer players. Int. J. Environ. Res. Public Health 2022, 19, 3352. [Google Scholar] [CrossRef]
- Yanci, J.; Camara, J. Bilateral and unilateral vertical ground reaction forces and leg asymmetries in soccer players. Biology of sport 2016, 33, 179–183. [Google Scholar] [CrossRef]
- Bishop, C.; Read, P.; Chavda, S.; Jarvis, P.; Brazier, J.; Bromley, T.; Turner, A. Magnitude or direction? Seasonal variation of interlimb asymmetry in elite academy soccer players. The Journal of Strength & Conditioning Research 2022, 36, 1031–1037. [Google Scholar]
Figure 2.
Limb Asymmetry Index Formula (IA%).
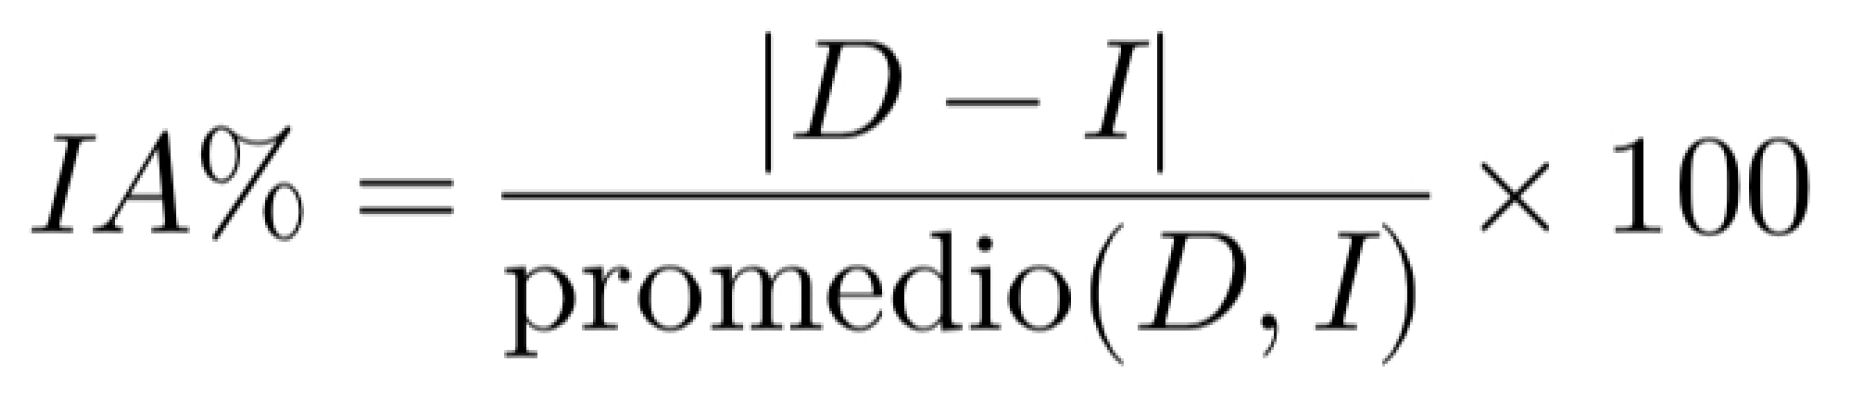
Figure 3.
Machine Learning Algorithms (Decision Tree, Random Forest and Logistic Regression).
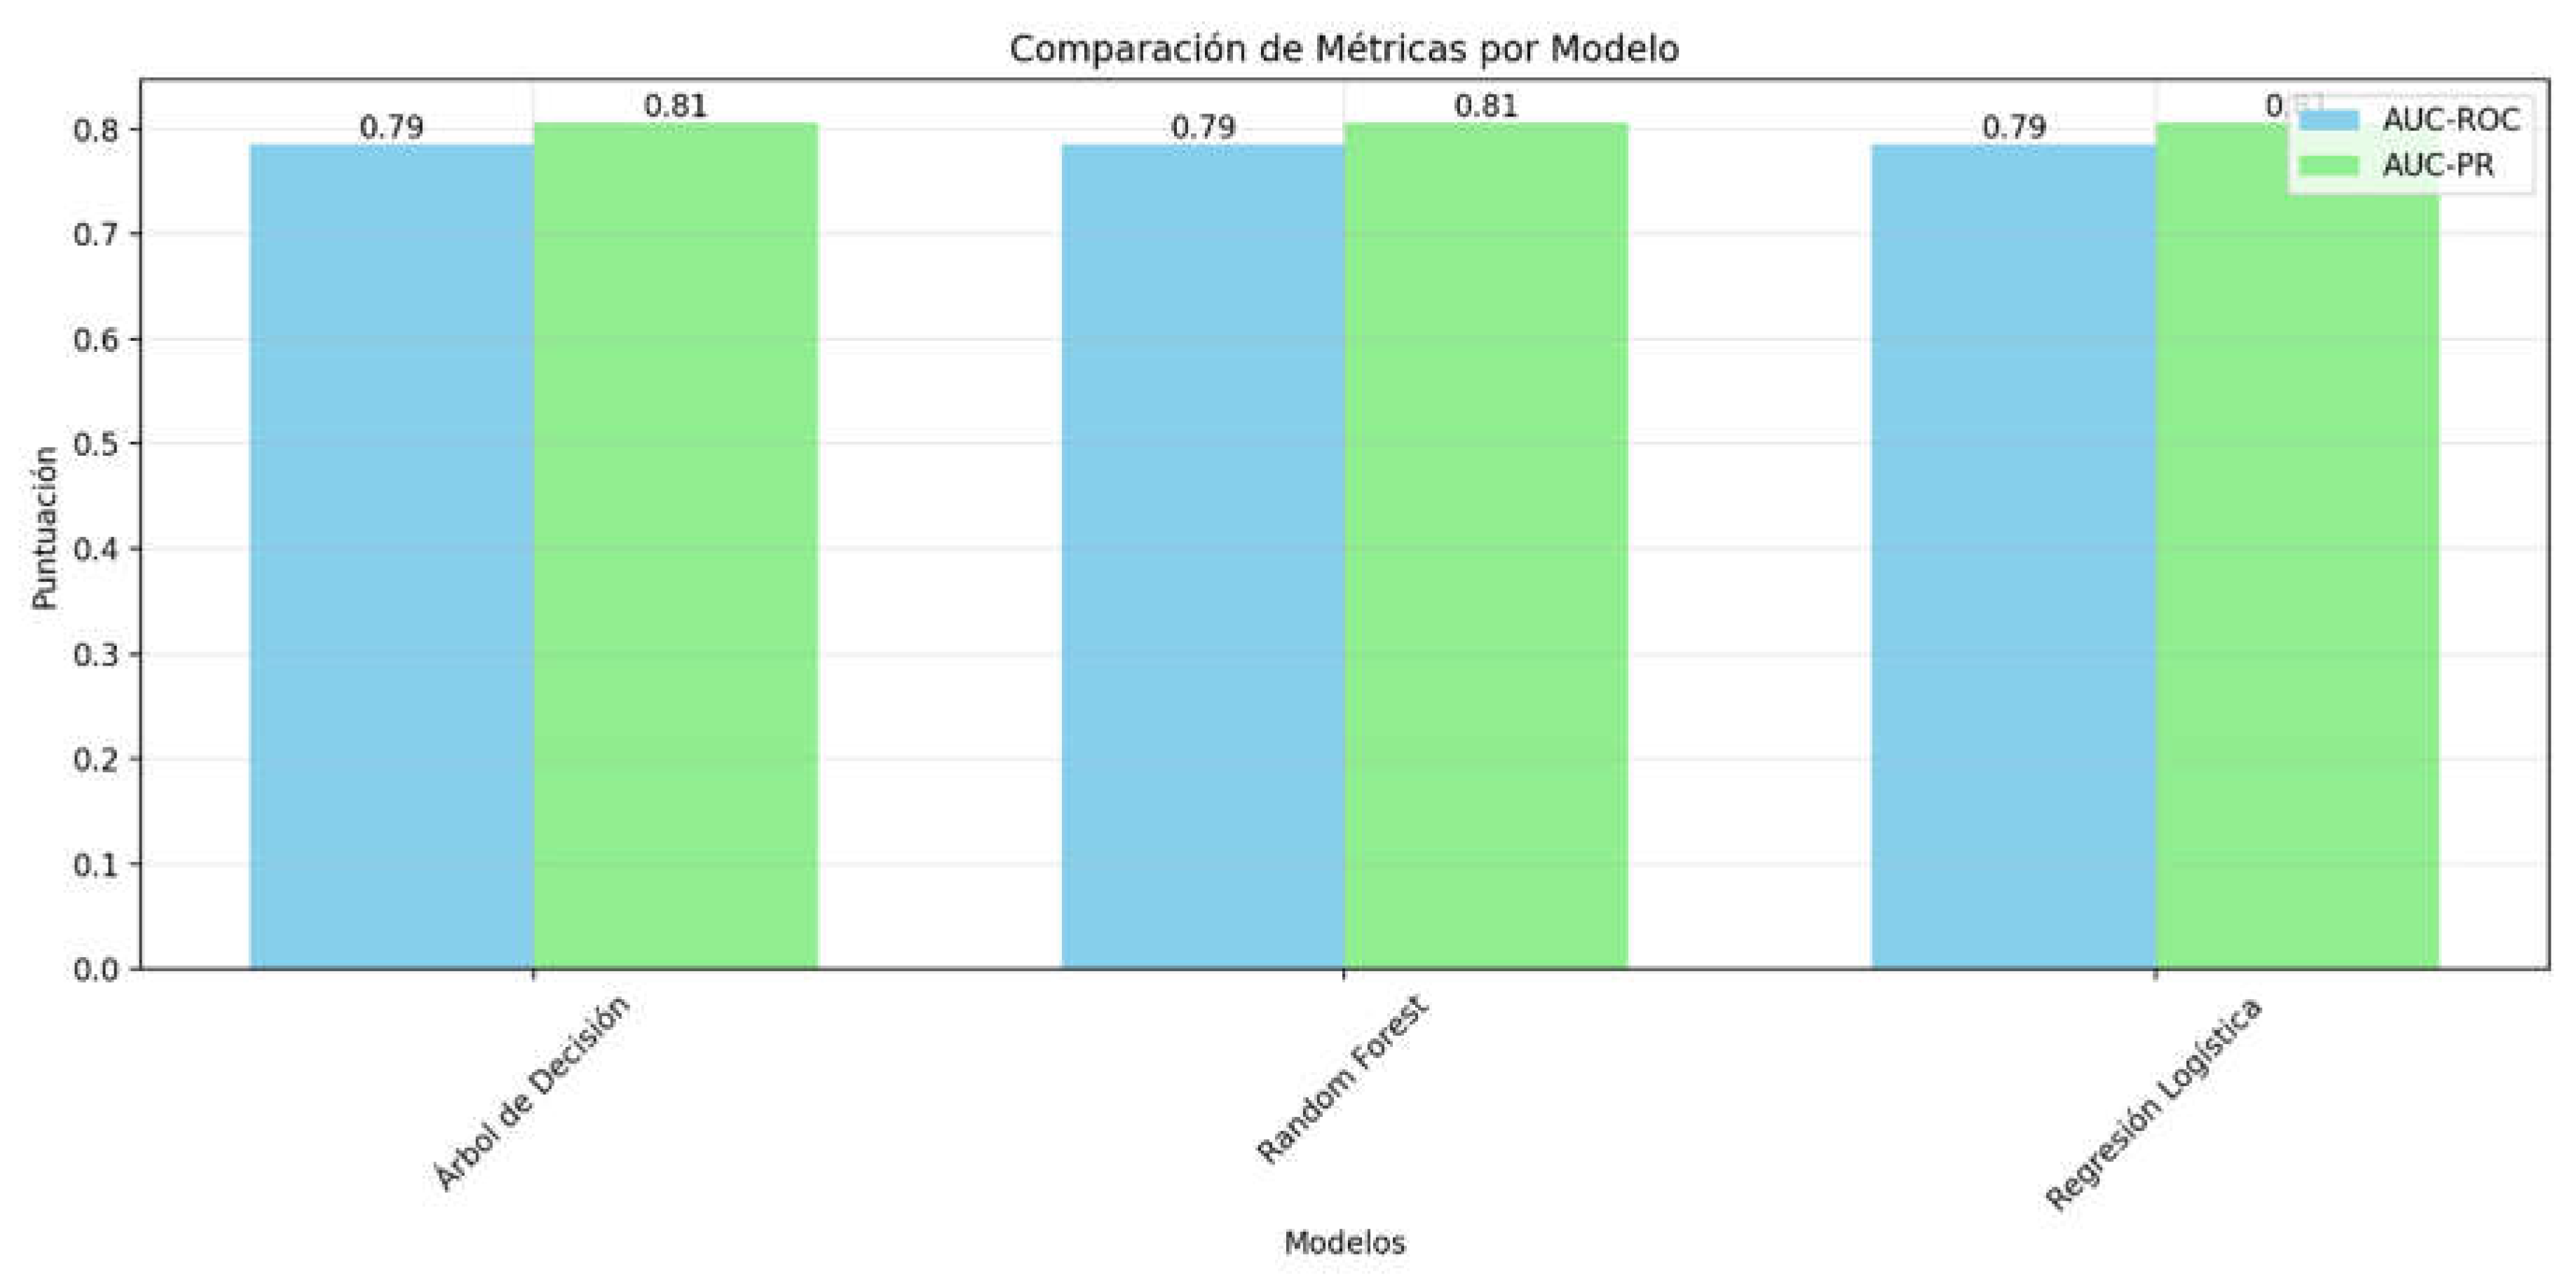
Figure 4.
Machine Learning Algorithms (XG Boost Prediction vs Real Data).
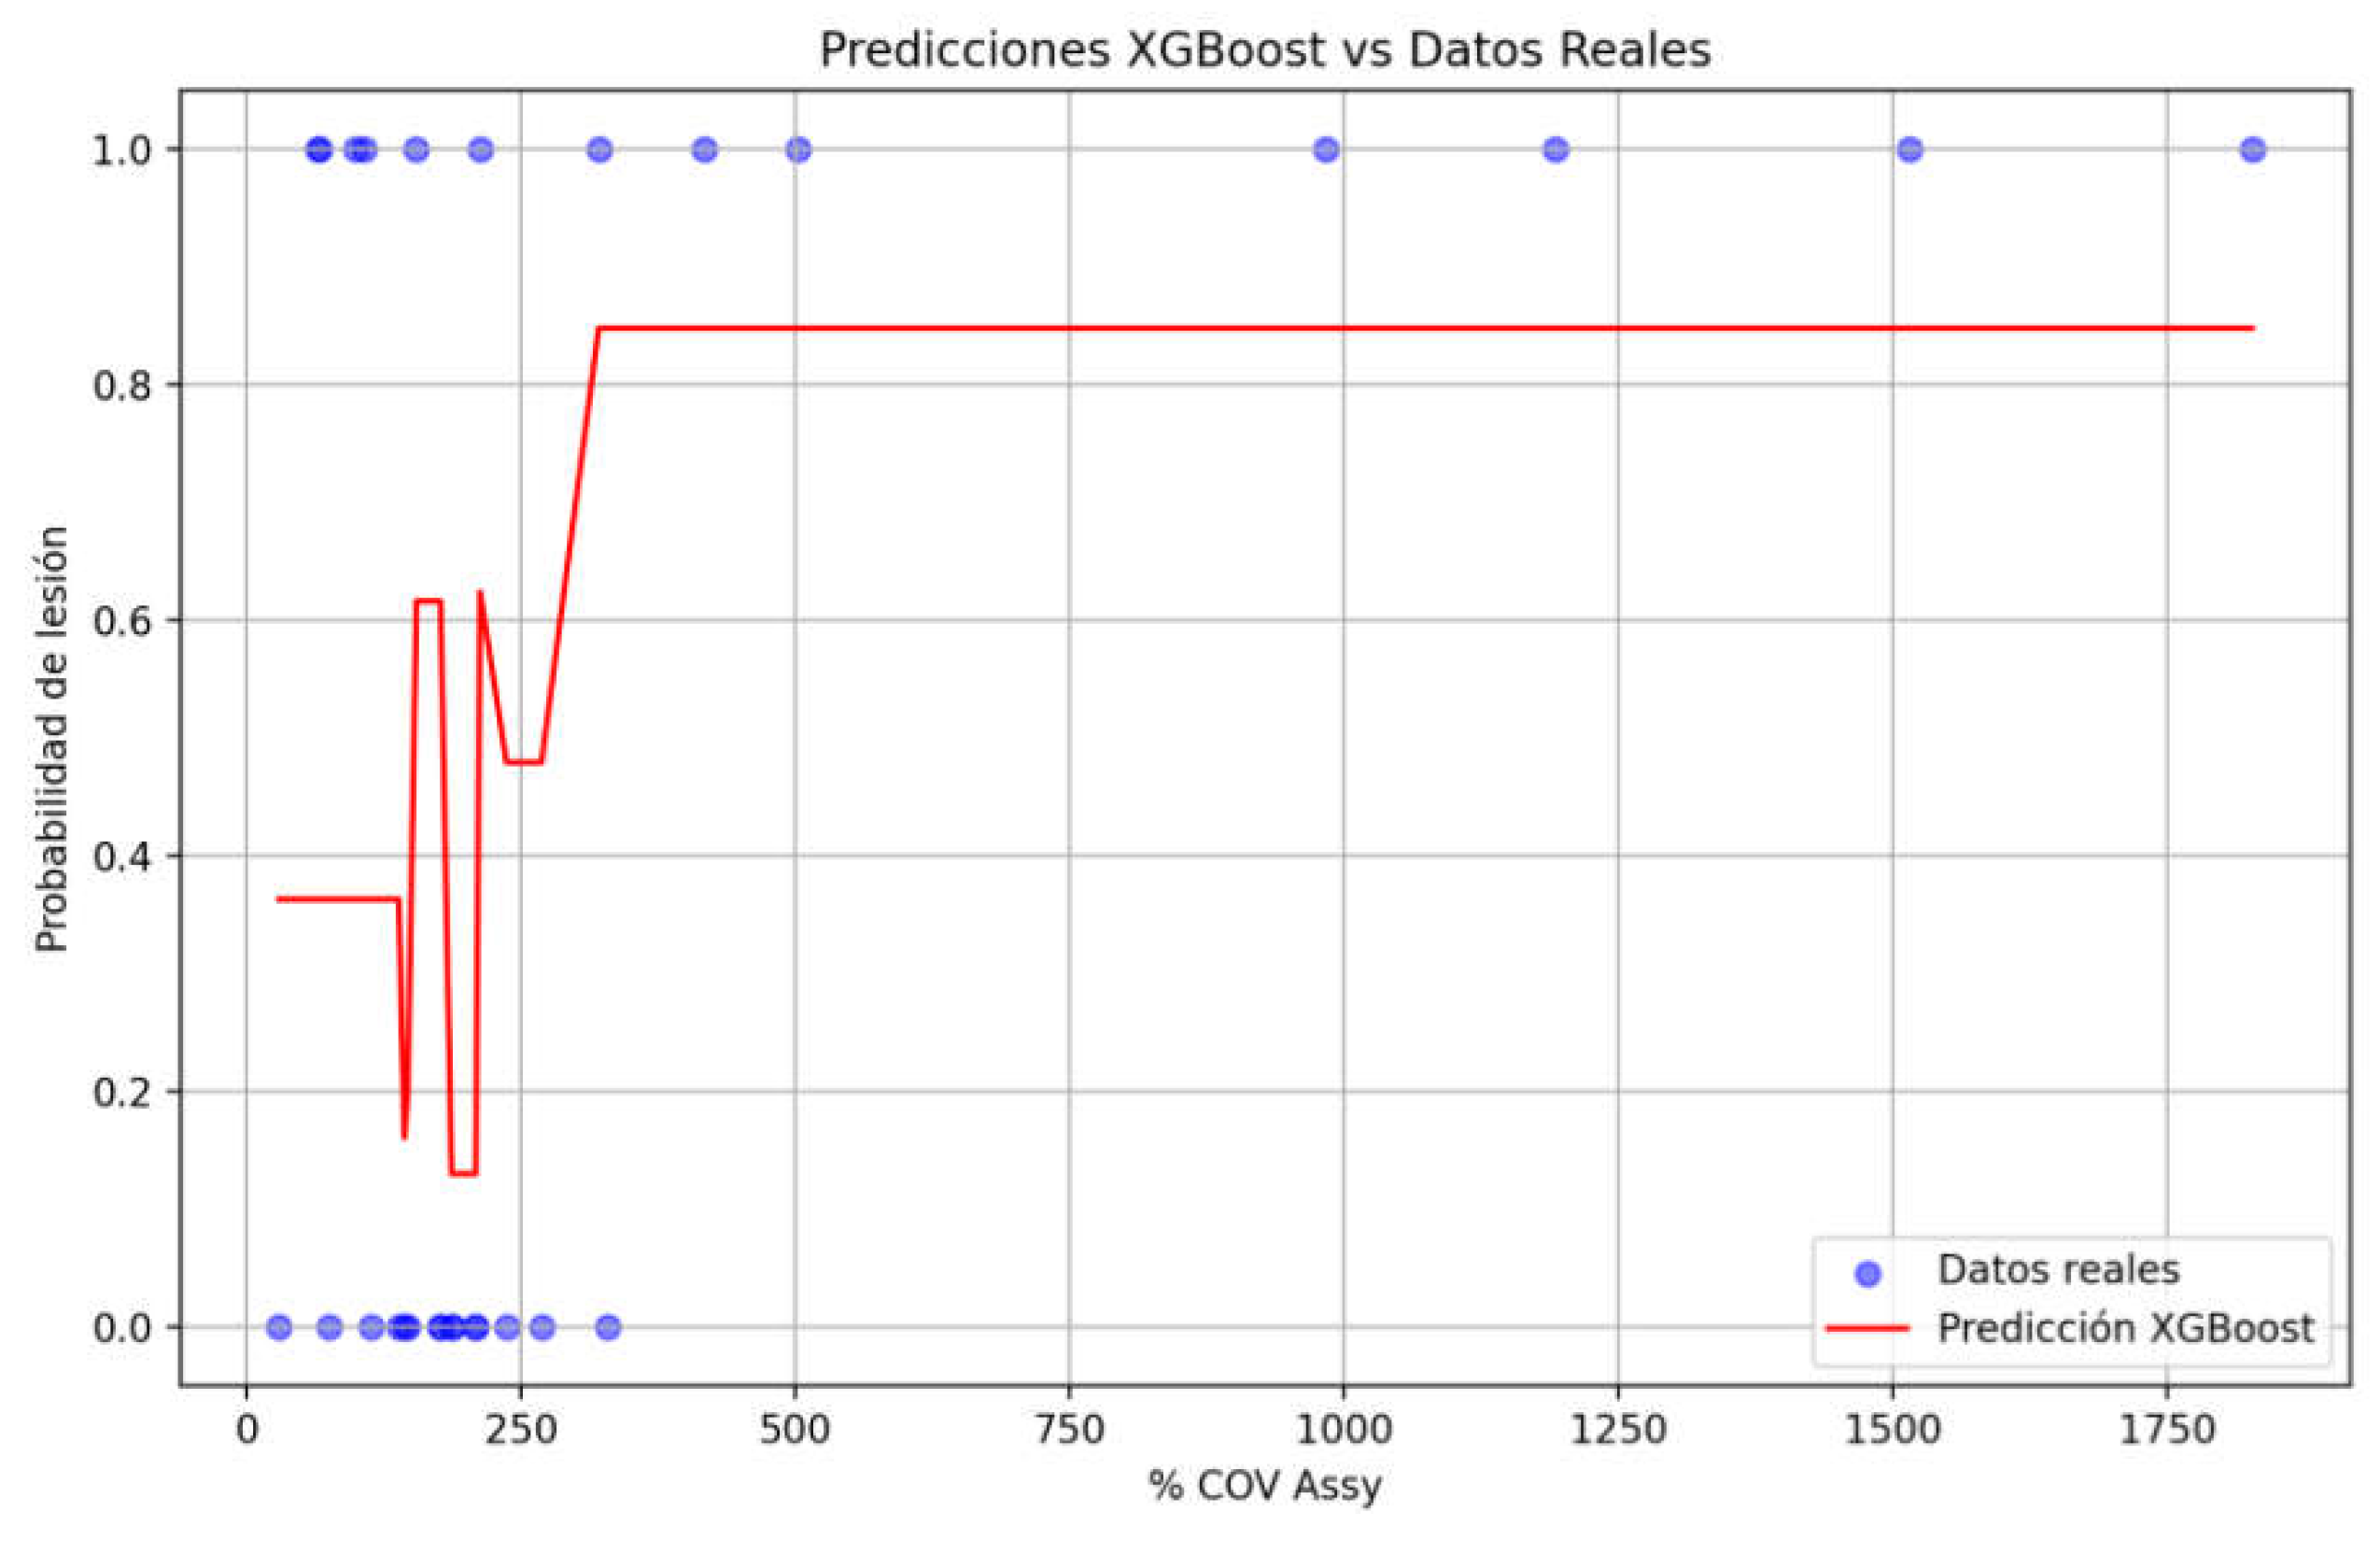
Figure 5.
Contingency Matrix (True and false Positives).
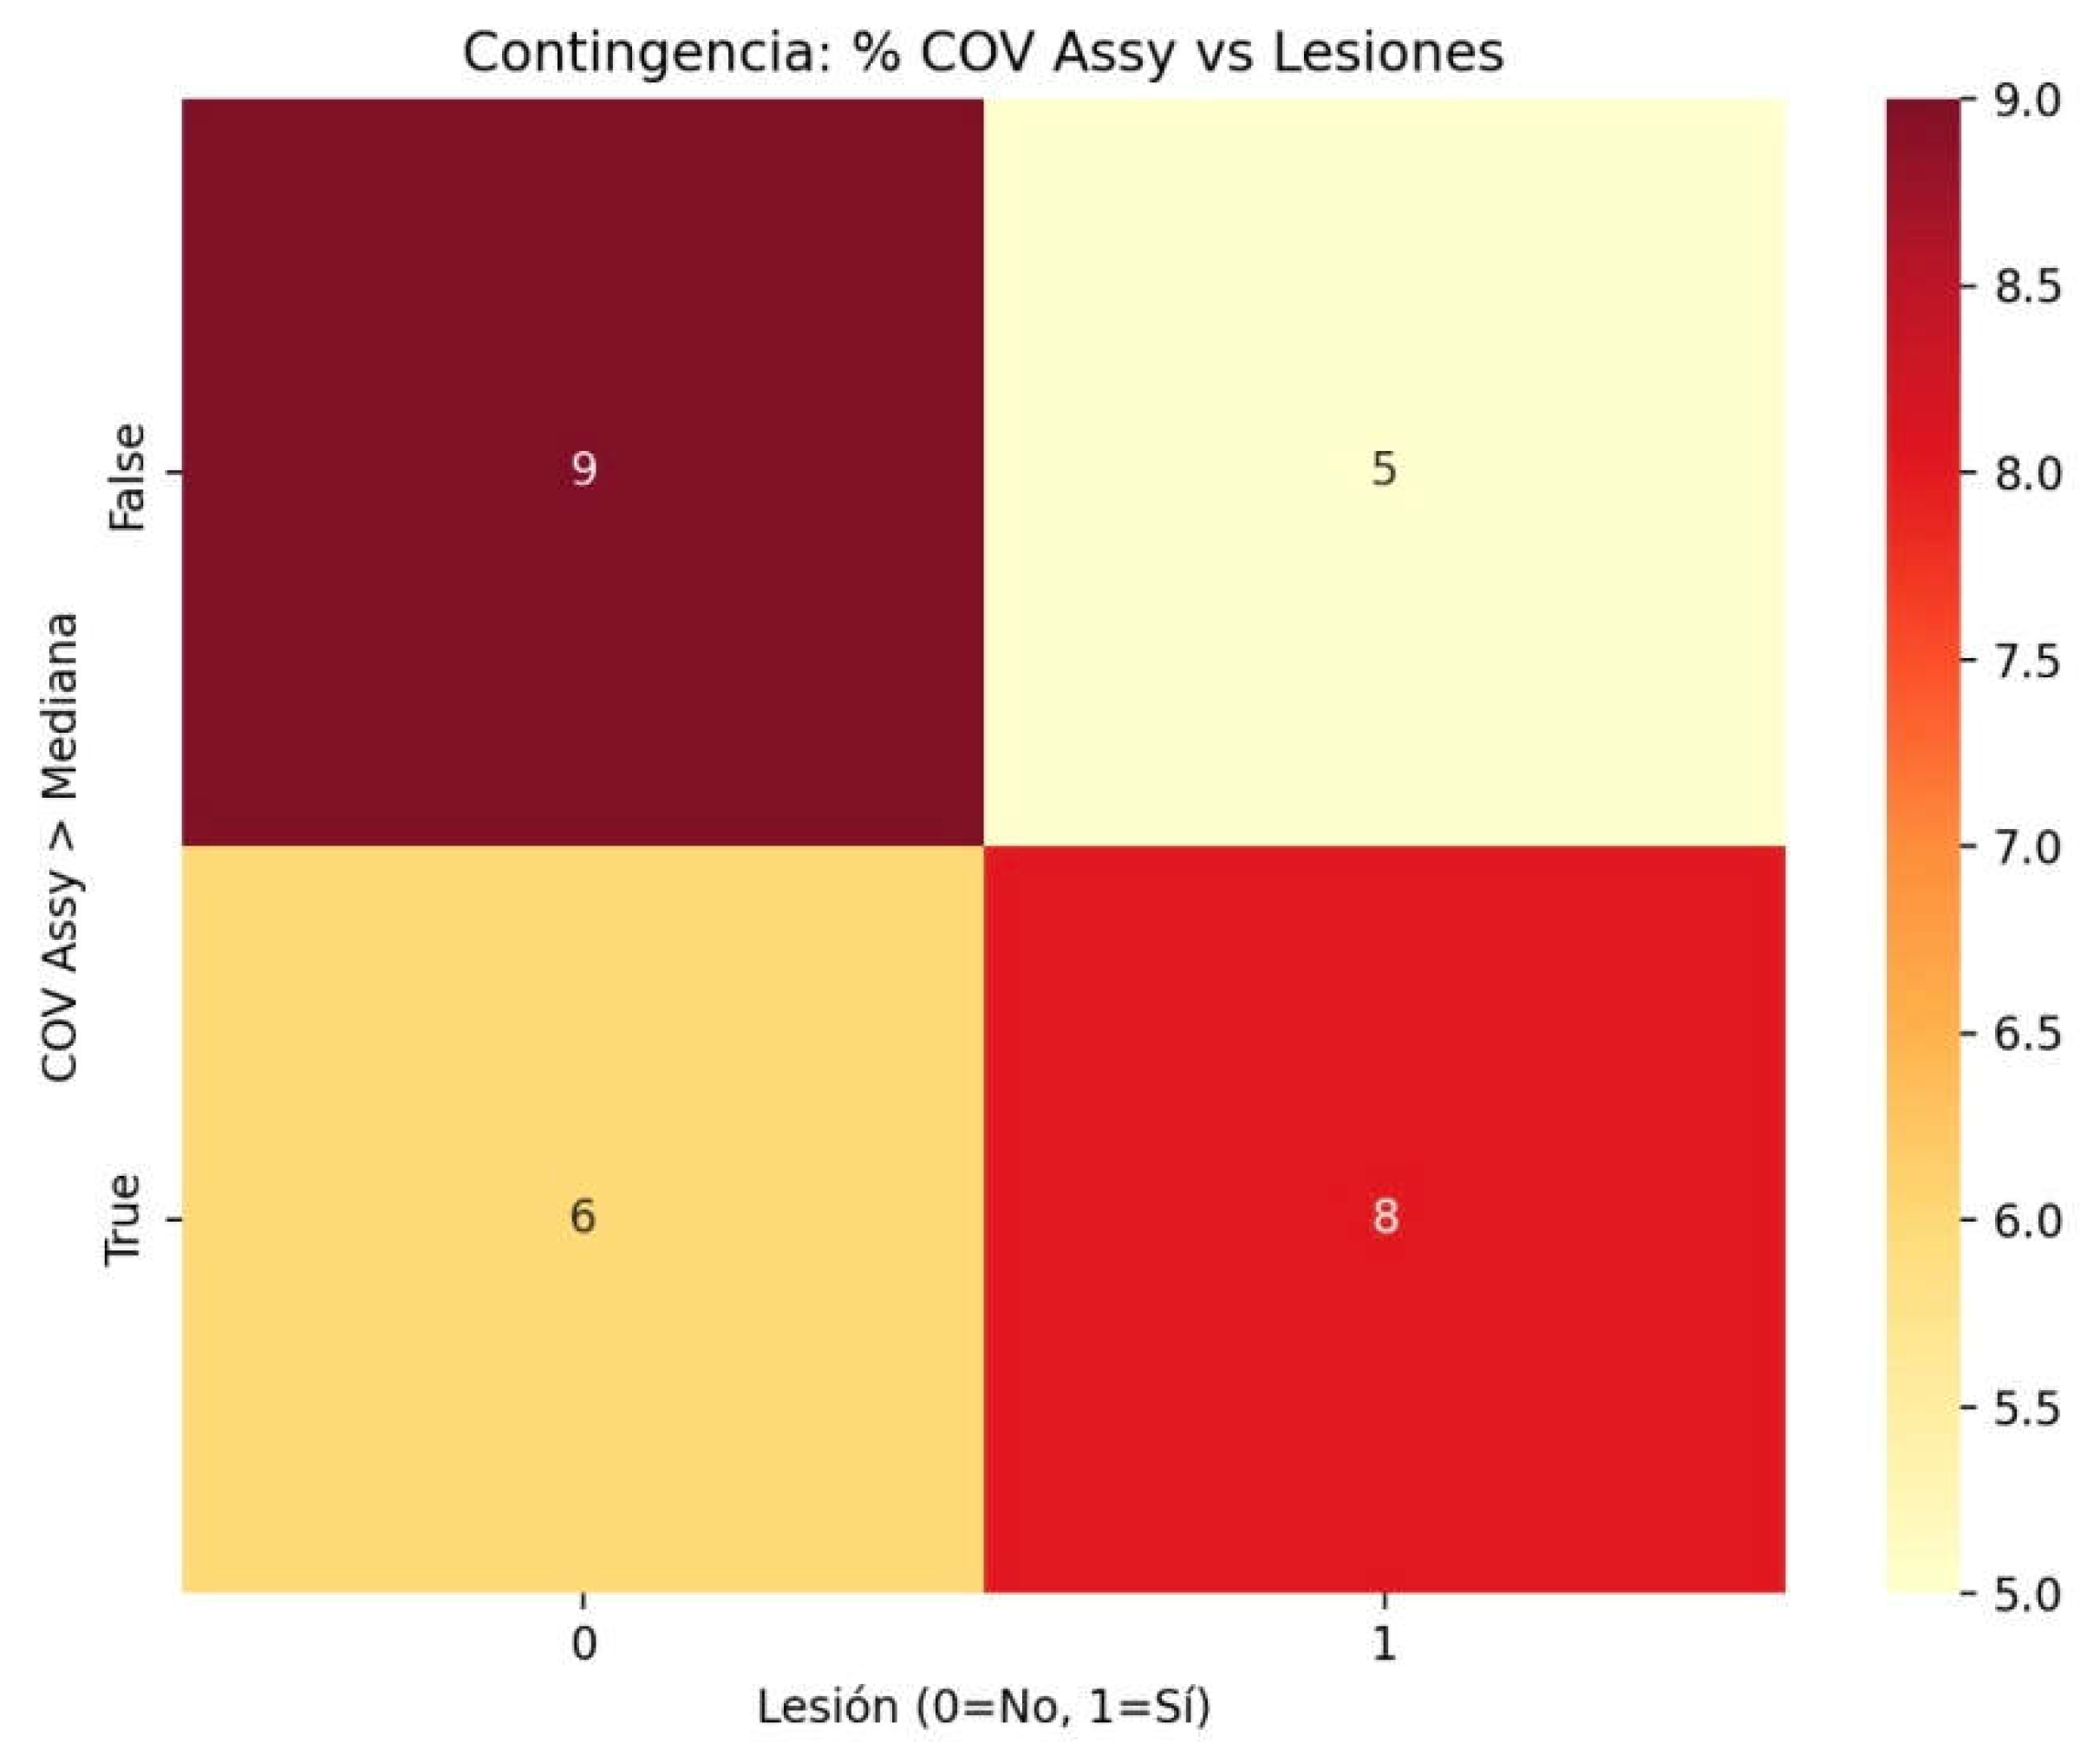
Figure 6.
Curve ROC and Precision Recall of Machine Learning Algorithms.
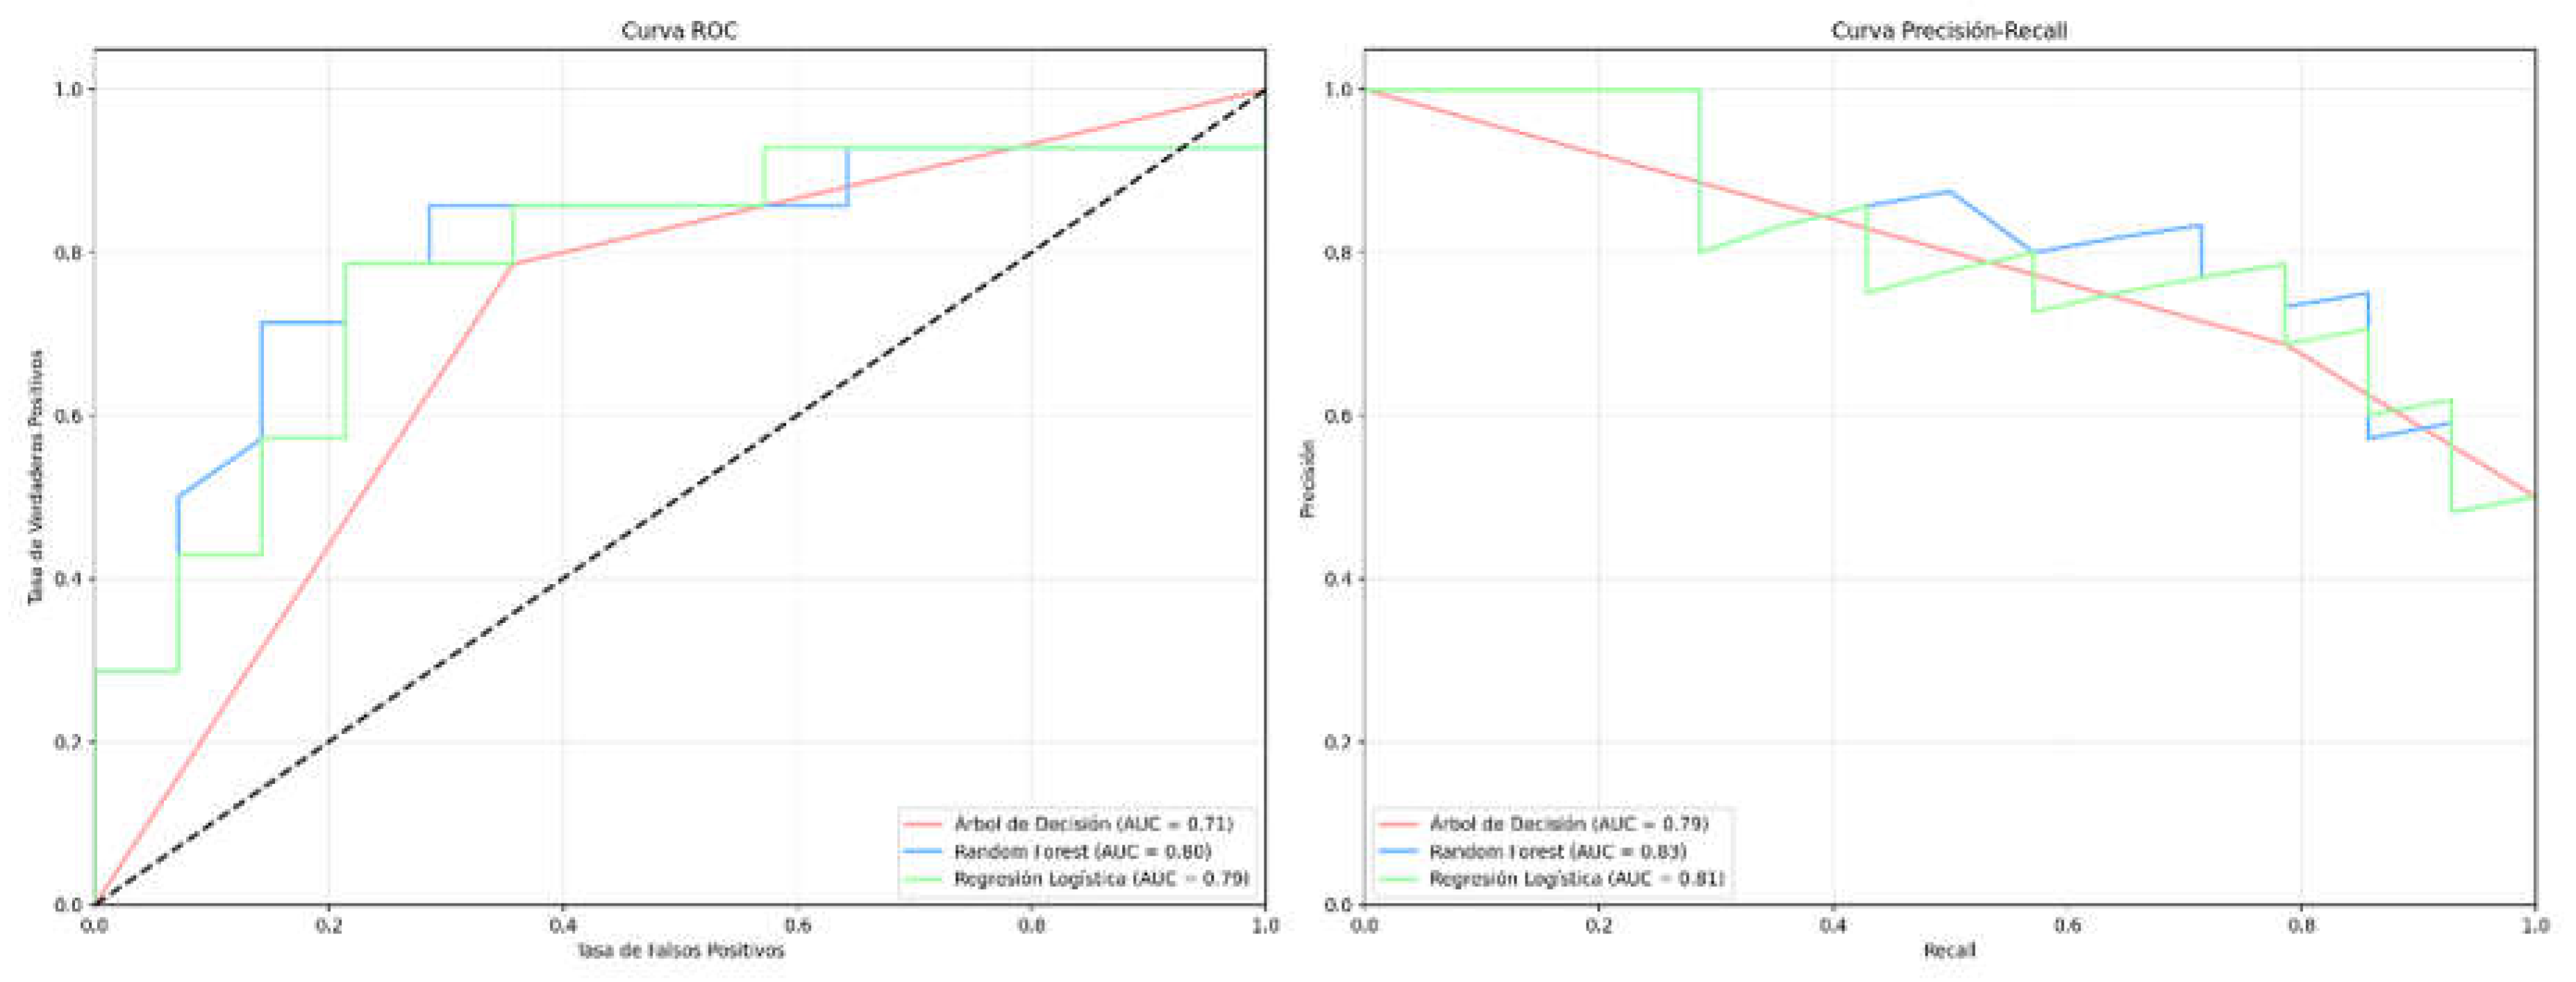
Figure 7.
Scatter Plot for Assym_Ave_LR and correlation with injury risk (Right side) and for % COV (Left side).
Figure 7.
Scatter Plot for Assym_Ave_LR and correlation with injury risk (Right side) and for % COV (Left side).
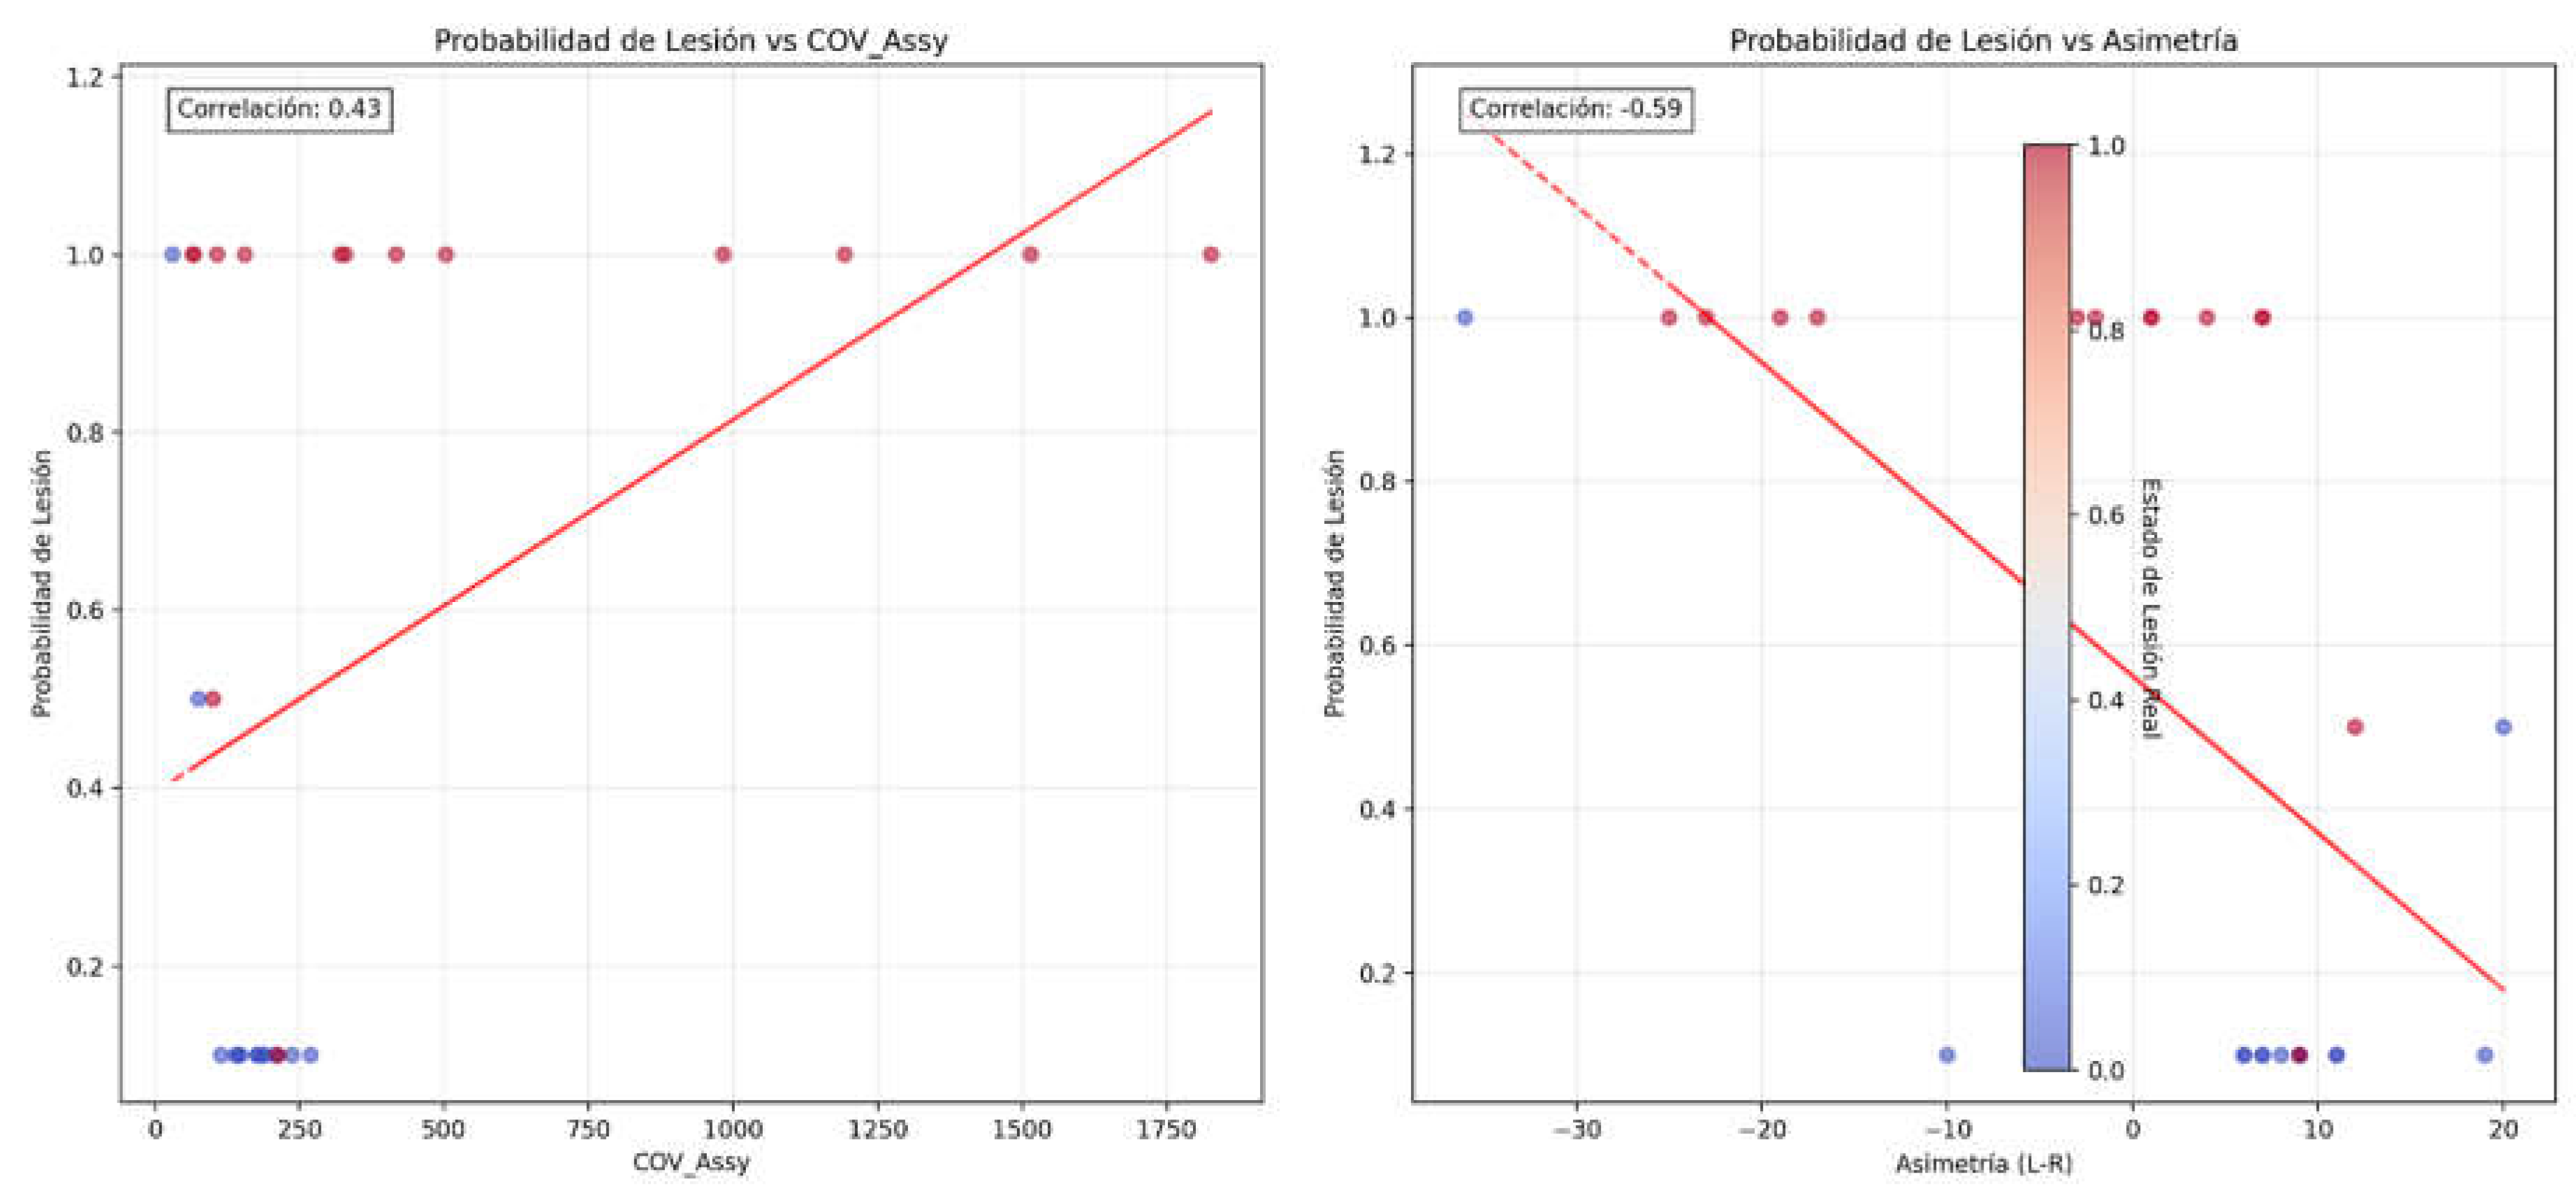
Figure 8.
a. Values of Assymmetry (L-R) and injury probability (Left Side) / Figure 8b. Extreme Values of Asymmetry (L-R) and injury status (0= No injury; 1= Injury) (Right Side).
Figure 8.
a. Values of Assymmetry (L-R) and injury probability (Left Side) / Figure 8b. Extreme Values of Asymmetry (L-R) and injury status (0= No injury; 1= Injury) (Right Side).
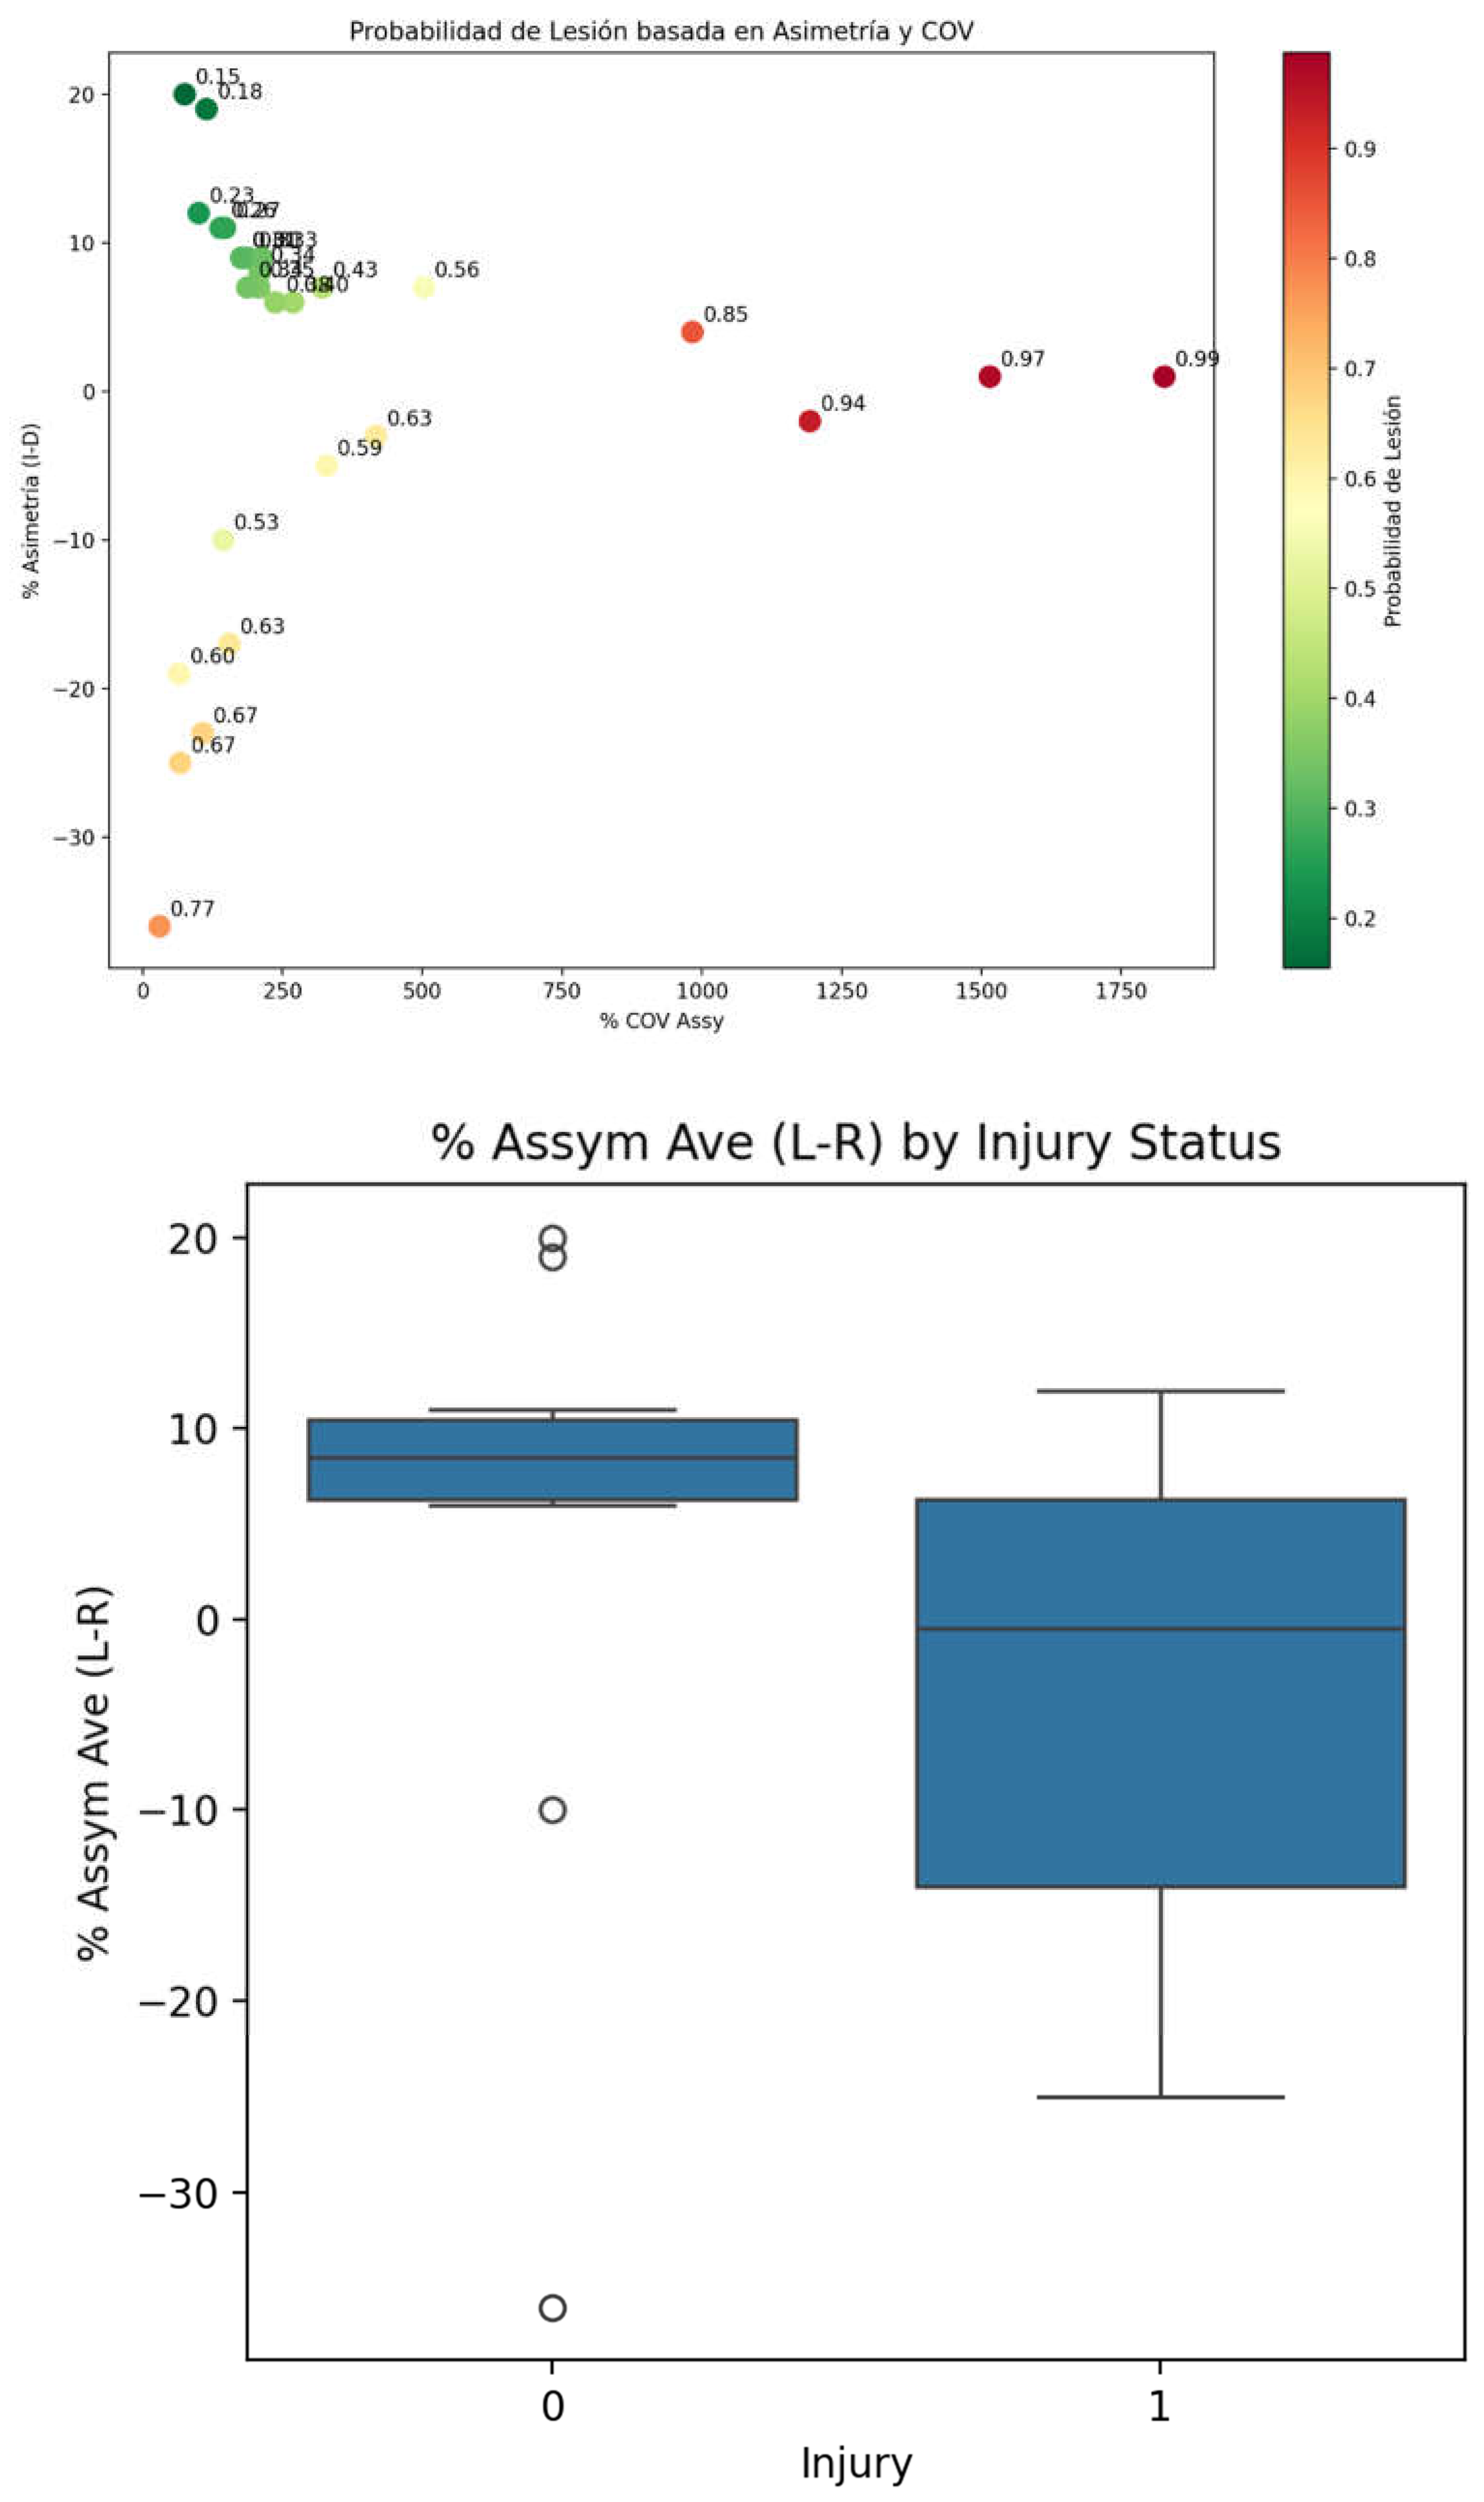
Figure 9.
Distribution of % COV Asymmetry and frequency.
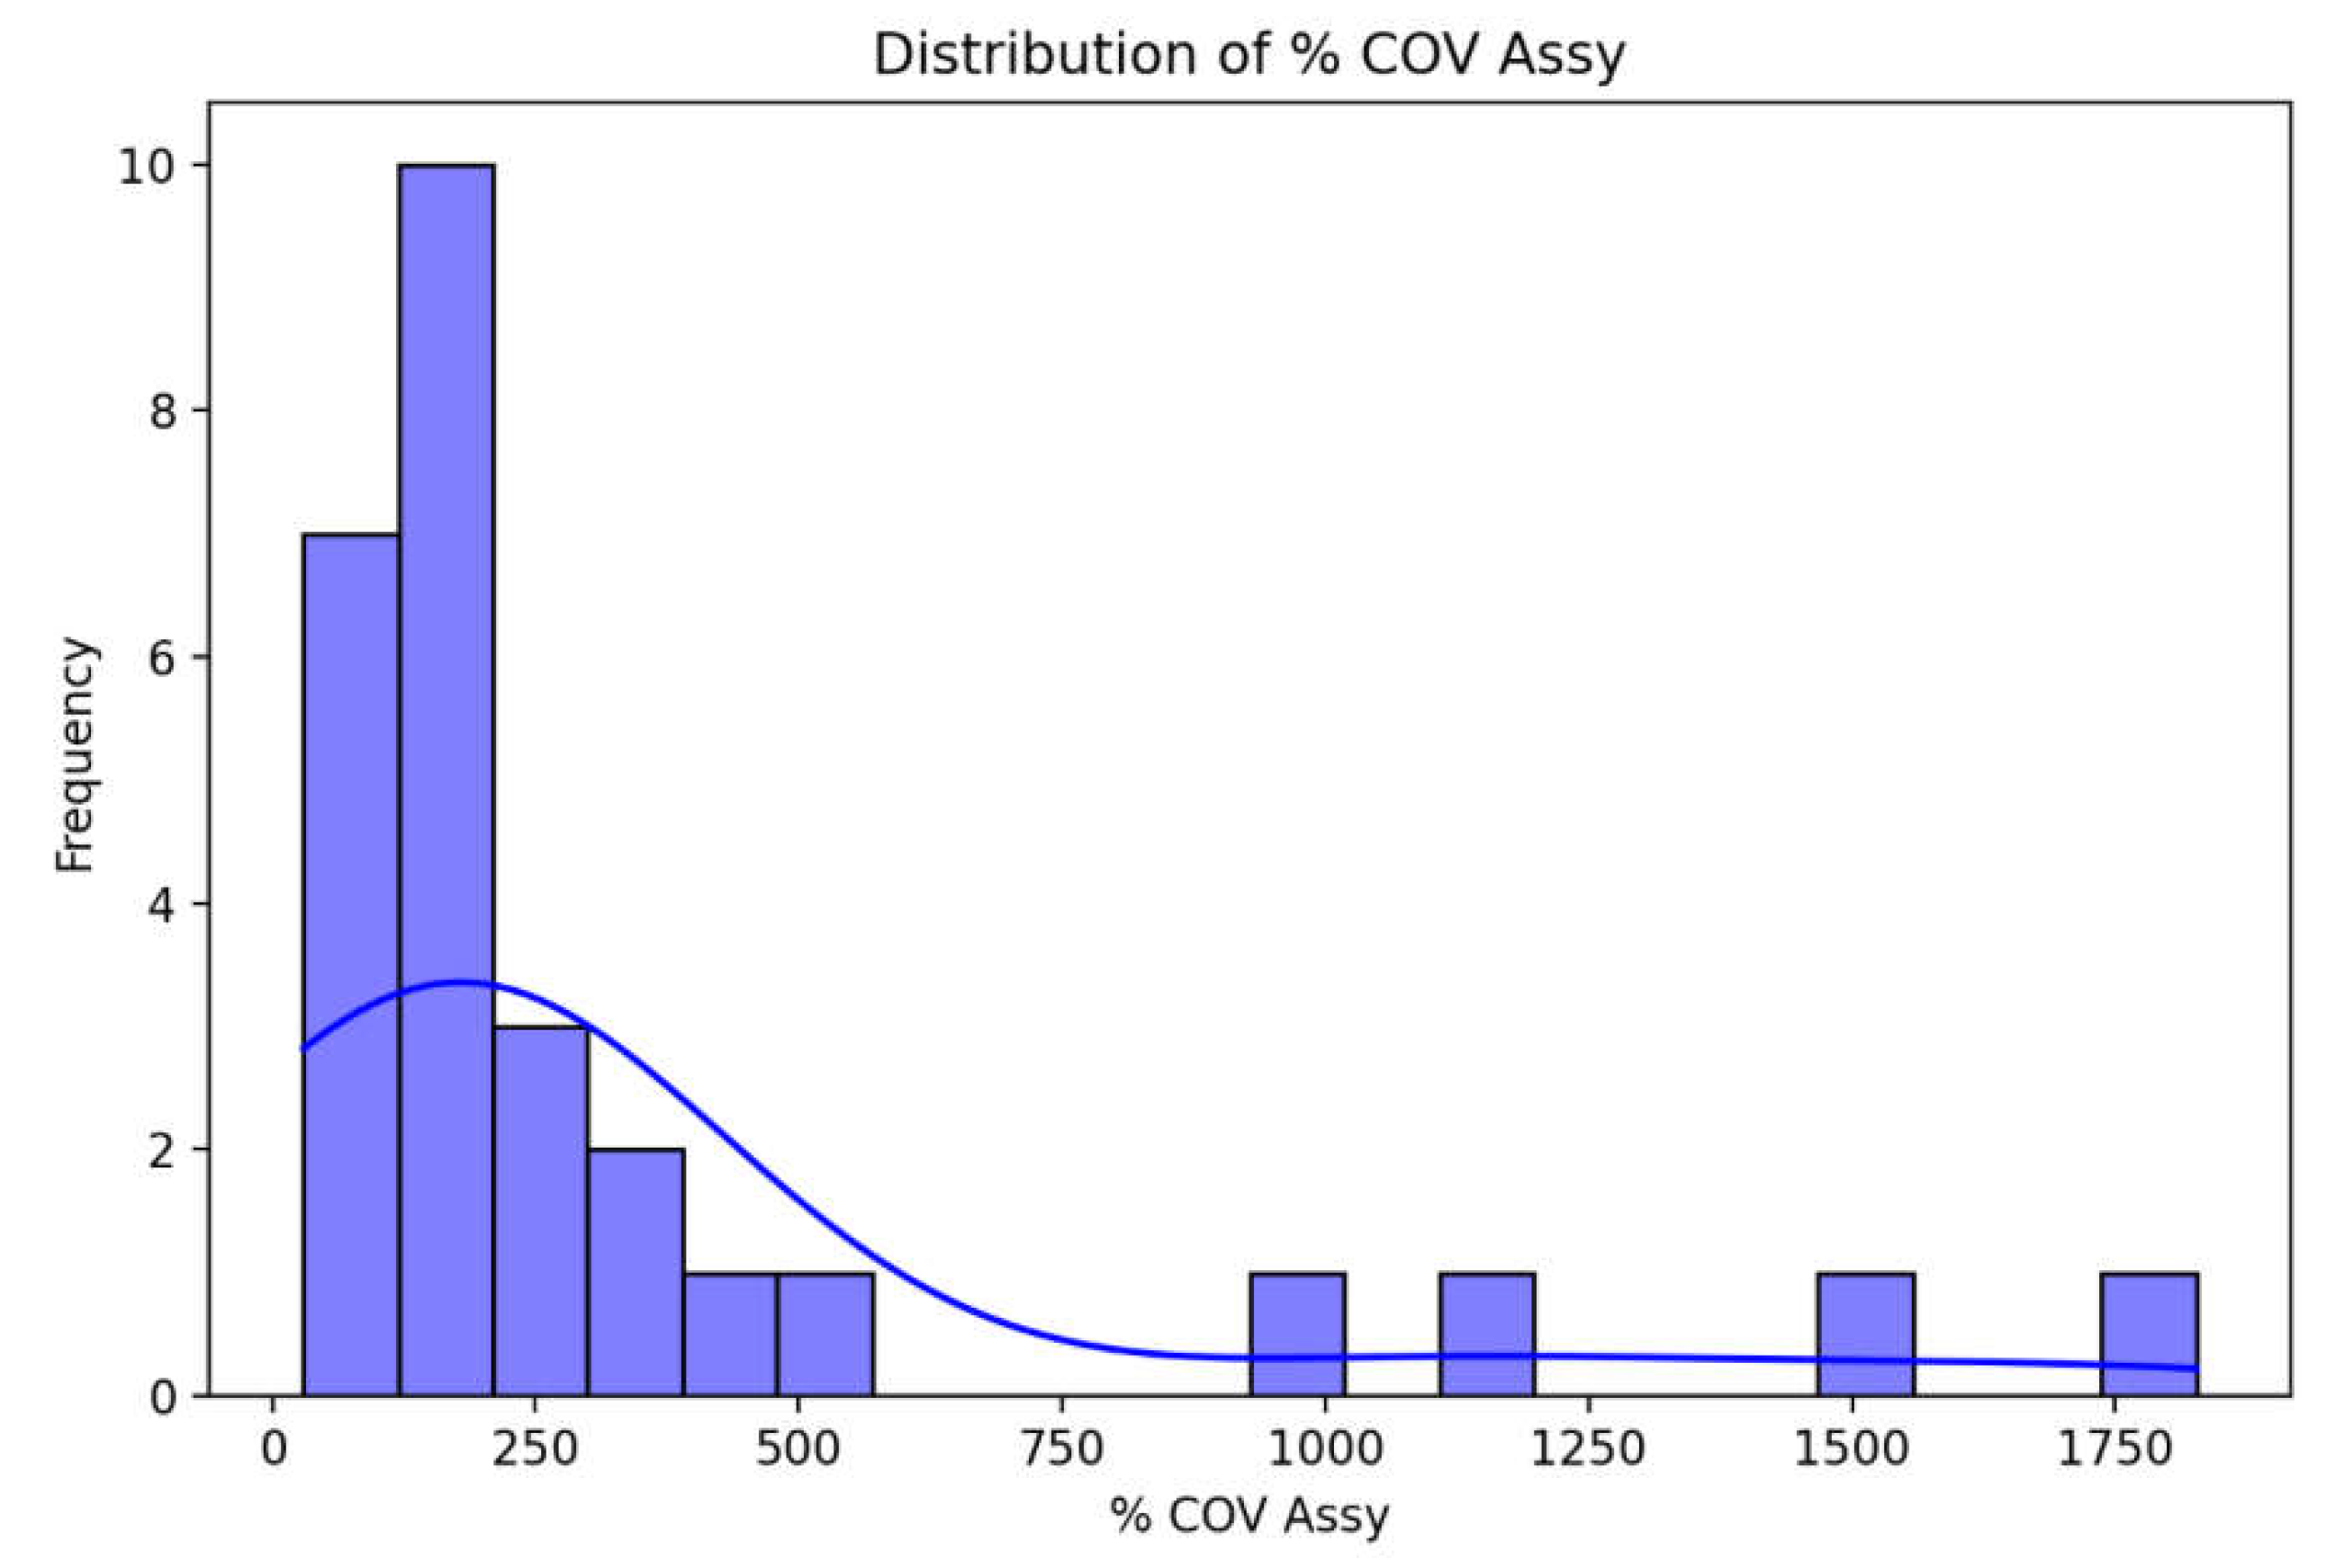
Figure 10.
Injury Probabilities based on % COV.
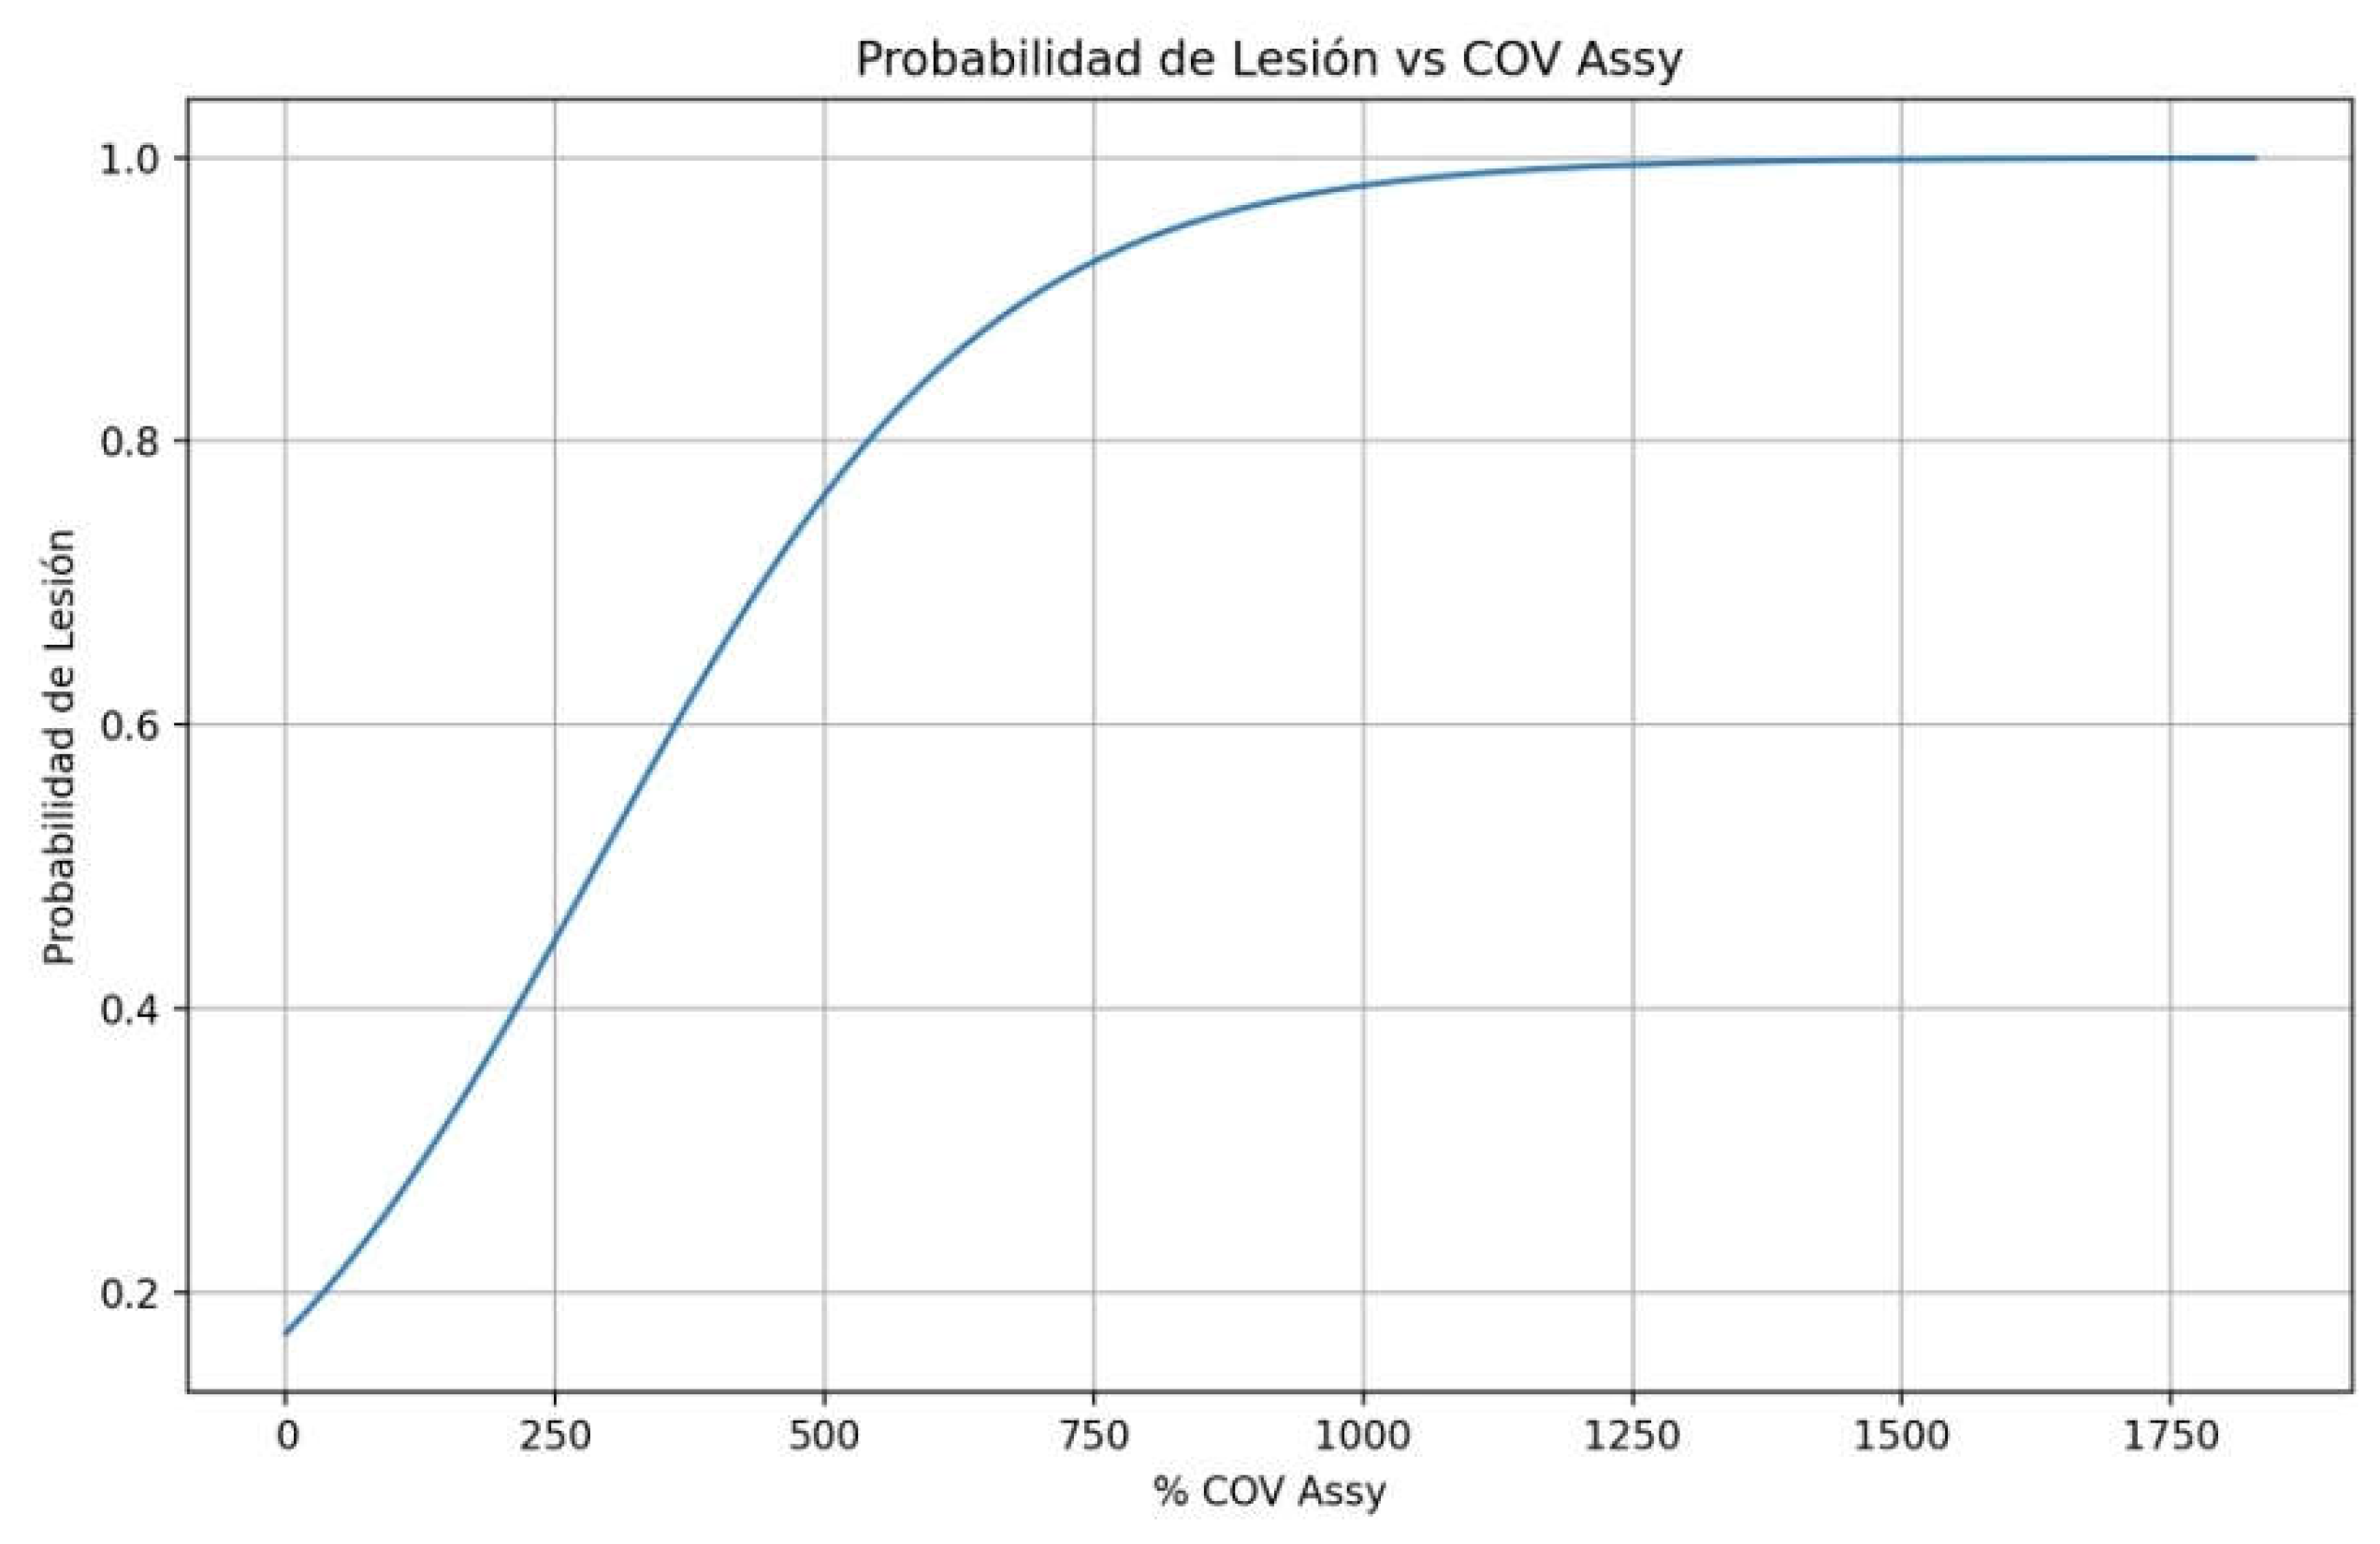
Figure 11.
Matrix correlation Injury – Assymmetry _L_R and % COV Assym.
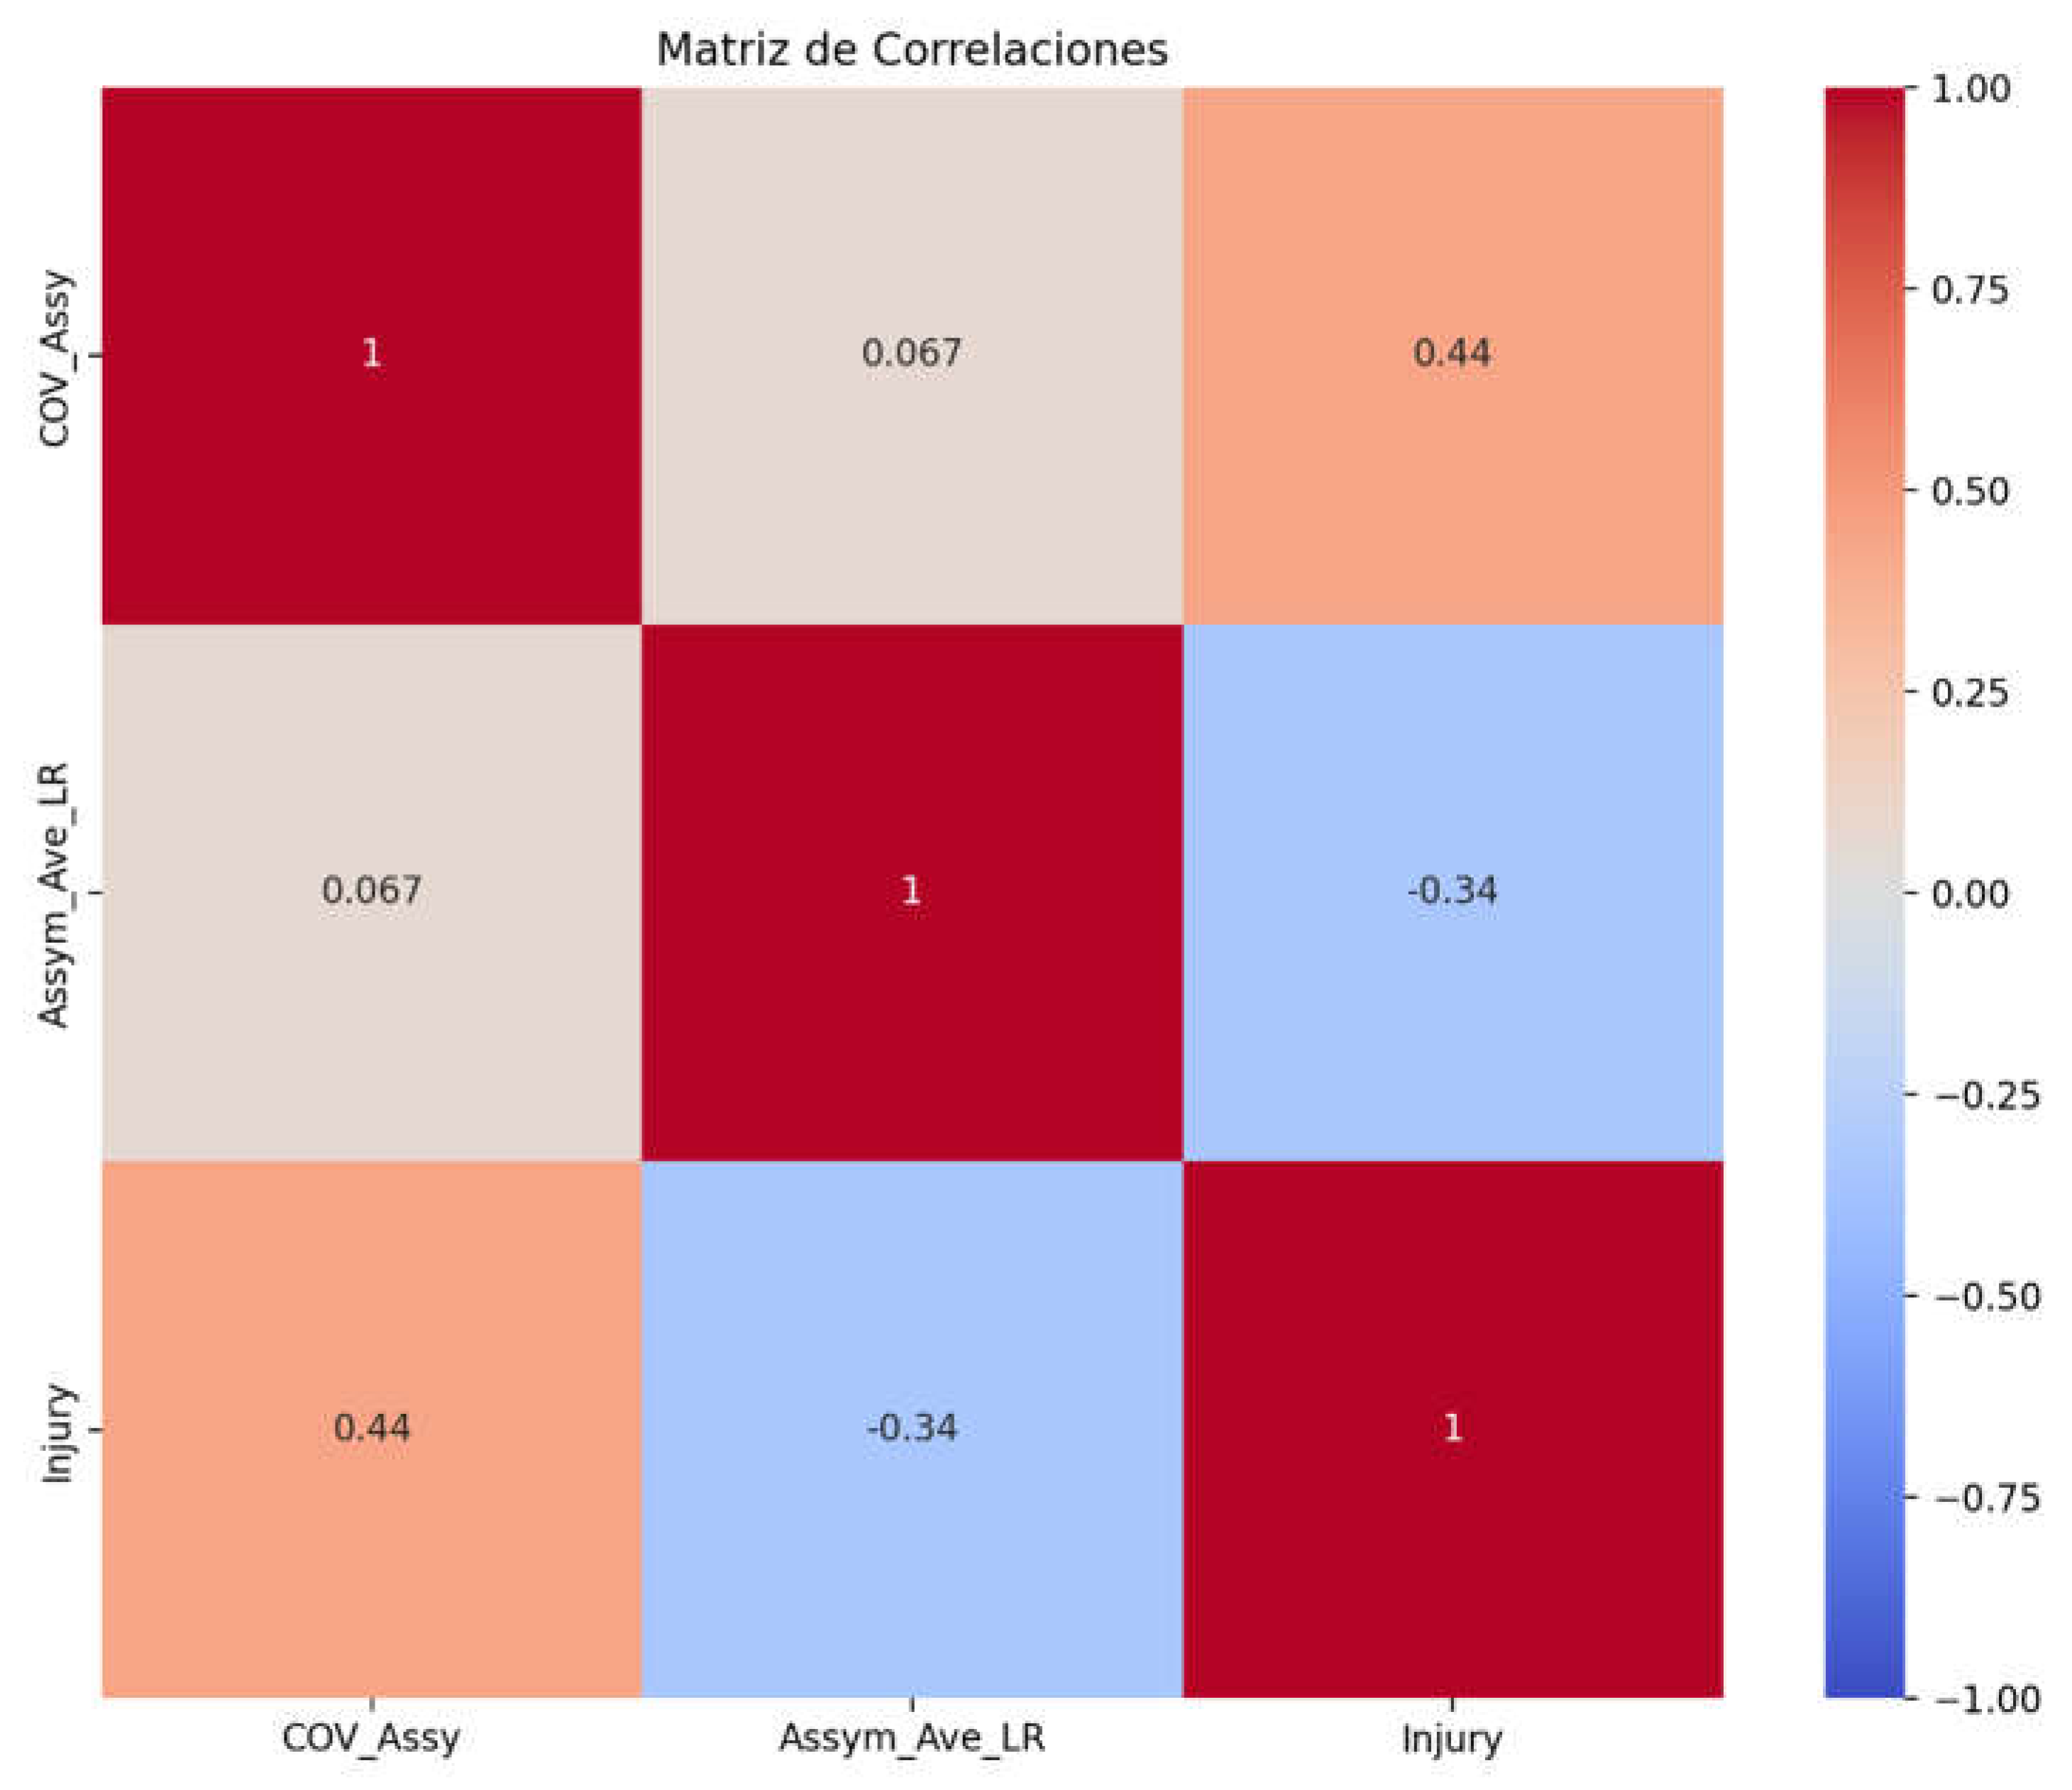
Figure 12.
Distribution groups (1= Injured- 0= non injured) based on % COV Assym.
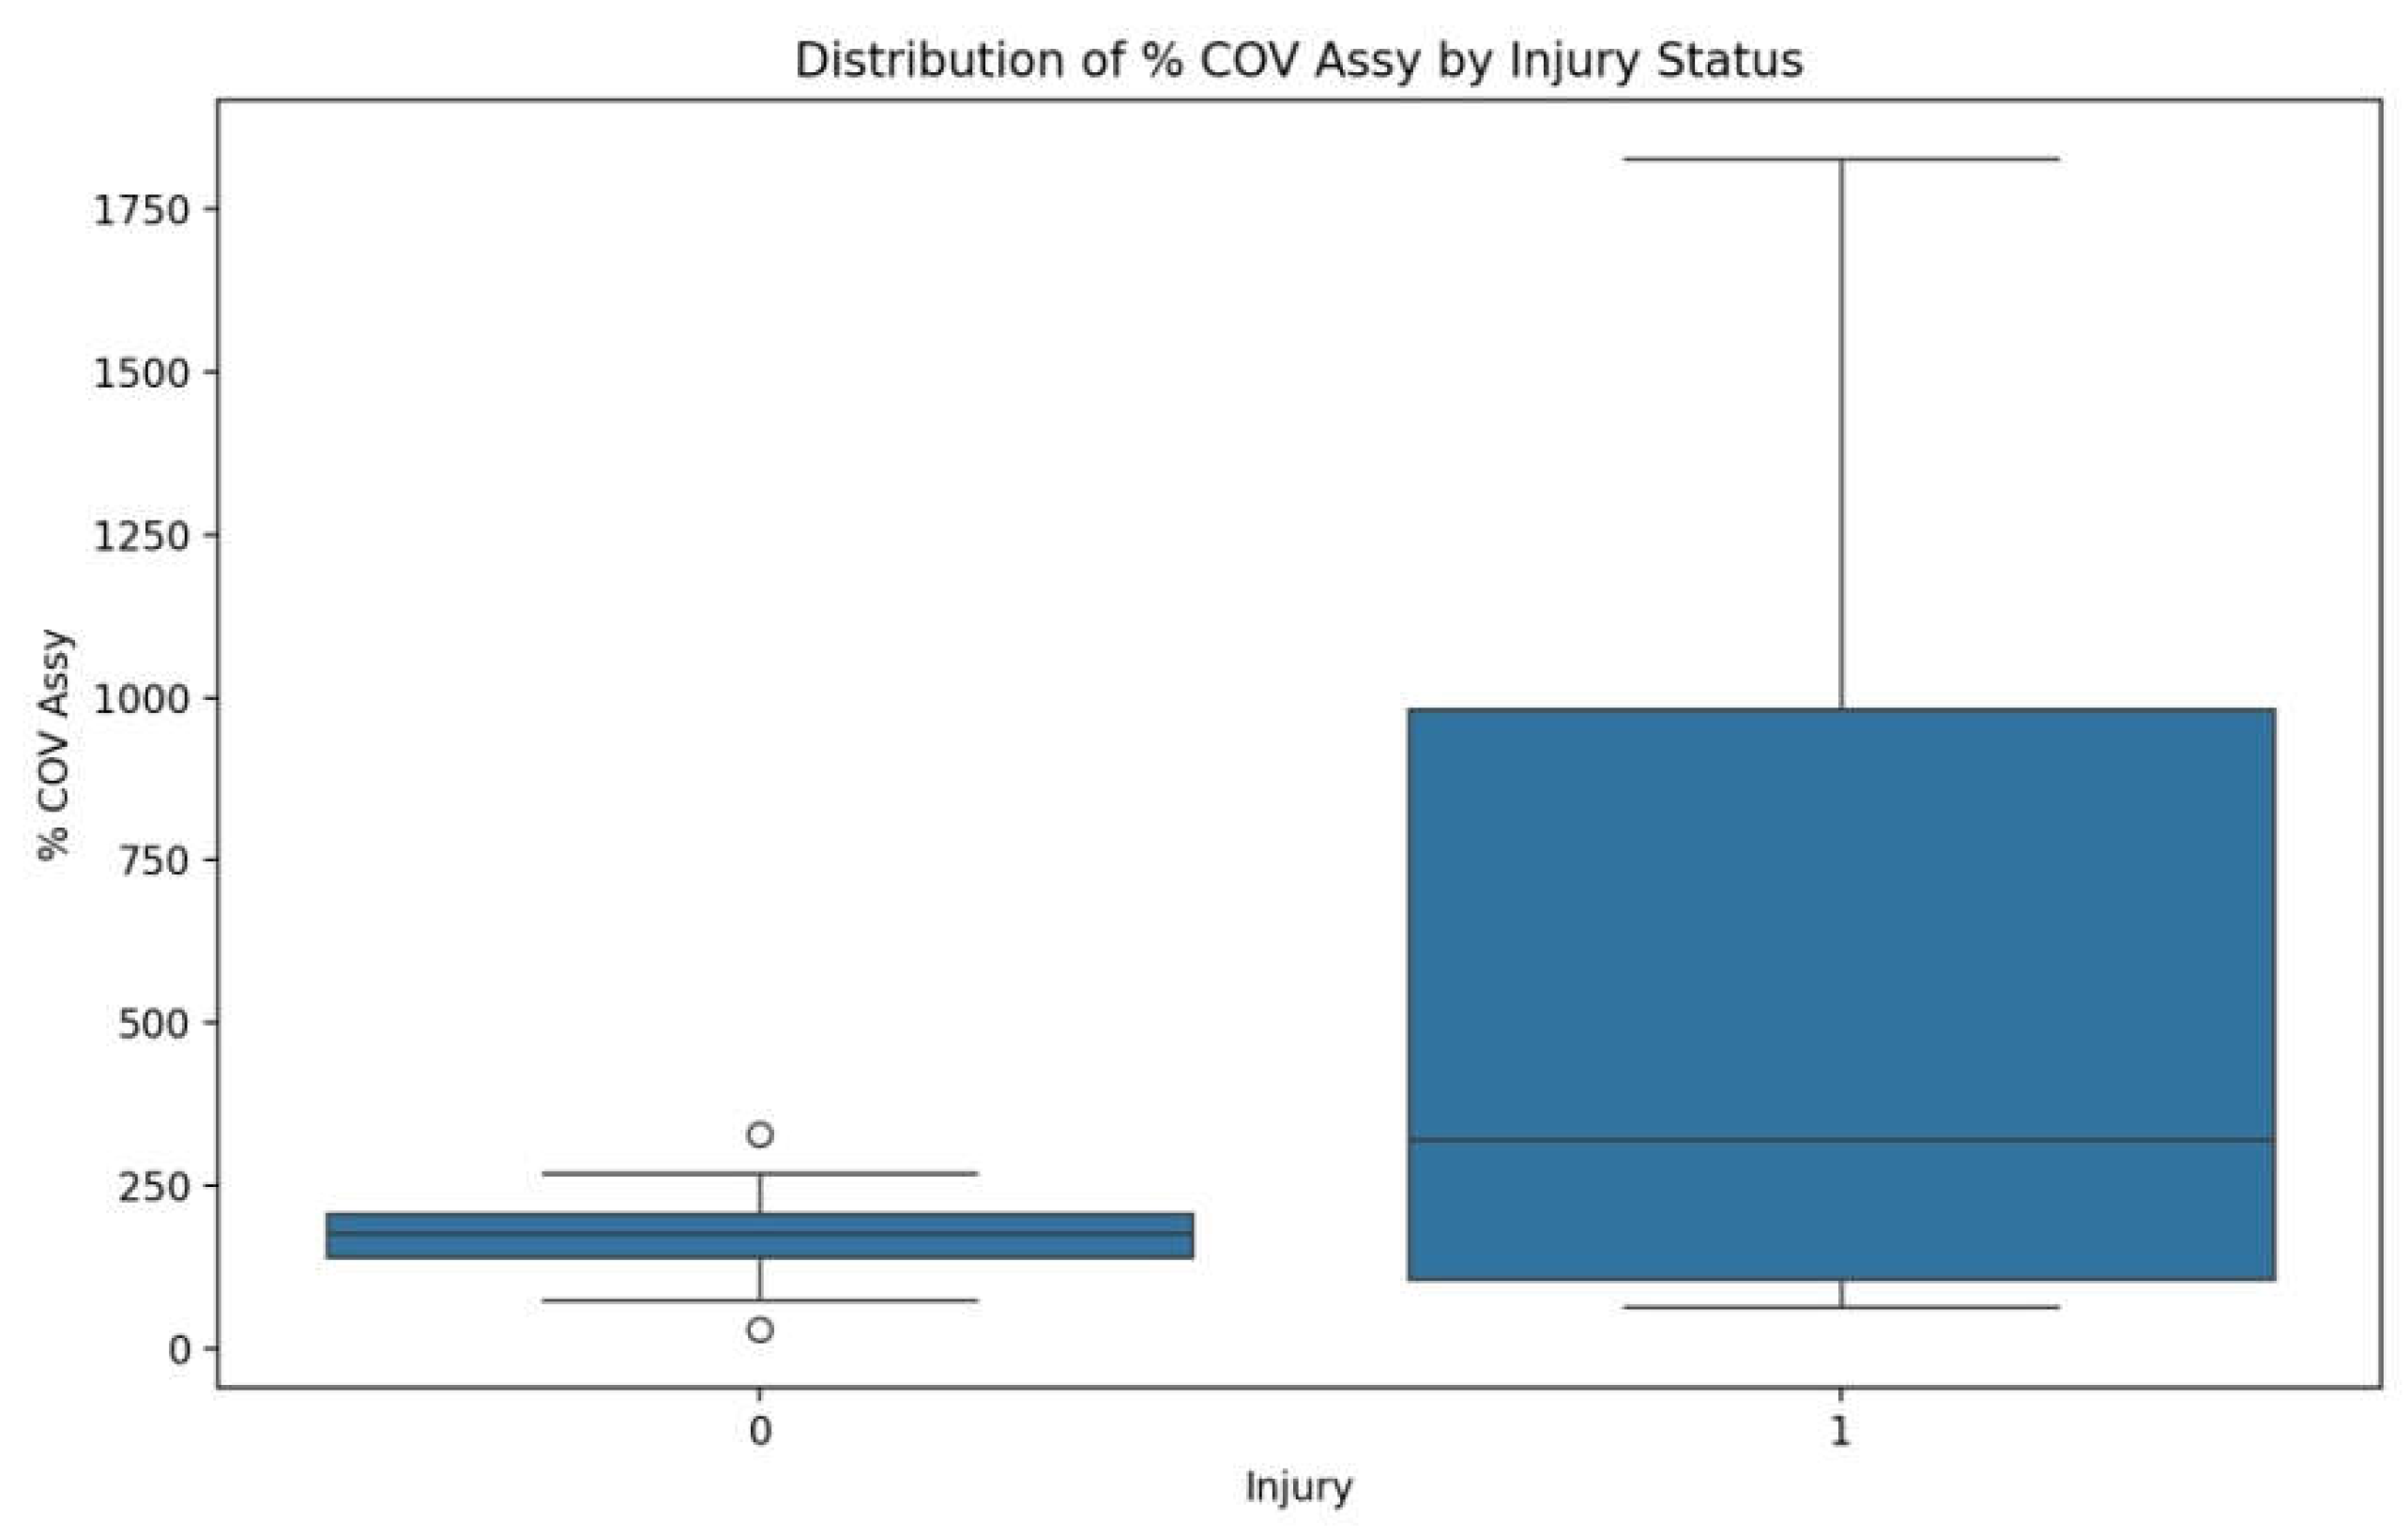
Figure 13.
Matrix correlation Dominant Side, % COV Assy, % Assym Ave (L-R) and Injury.
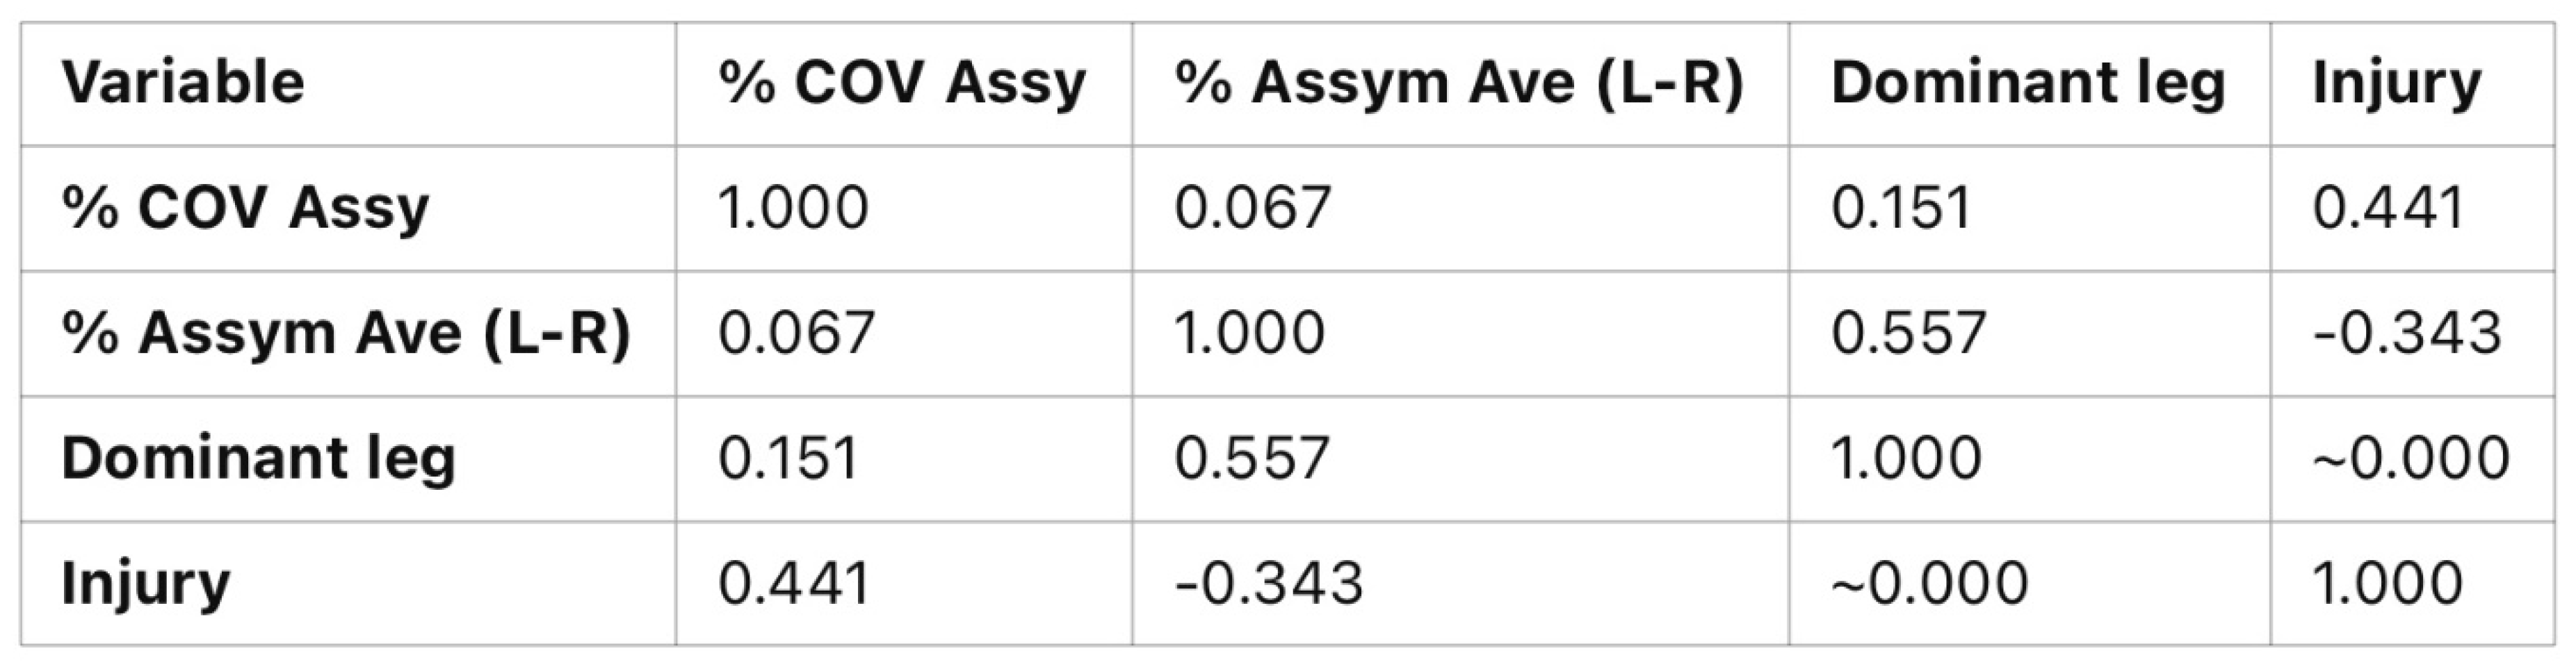
Figure 14.
Decision Tree Machine Learning Algorithm Model.
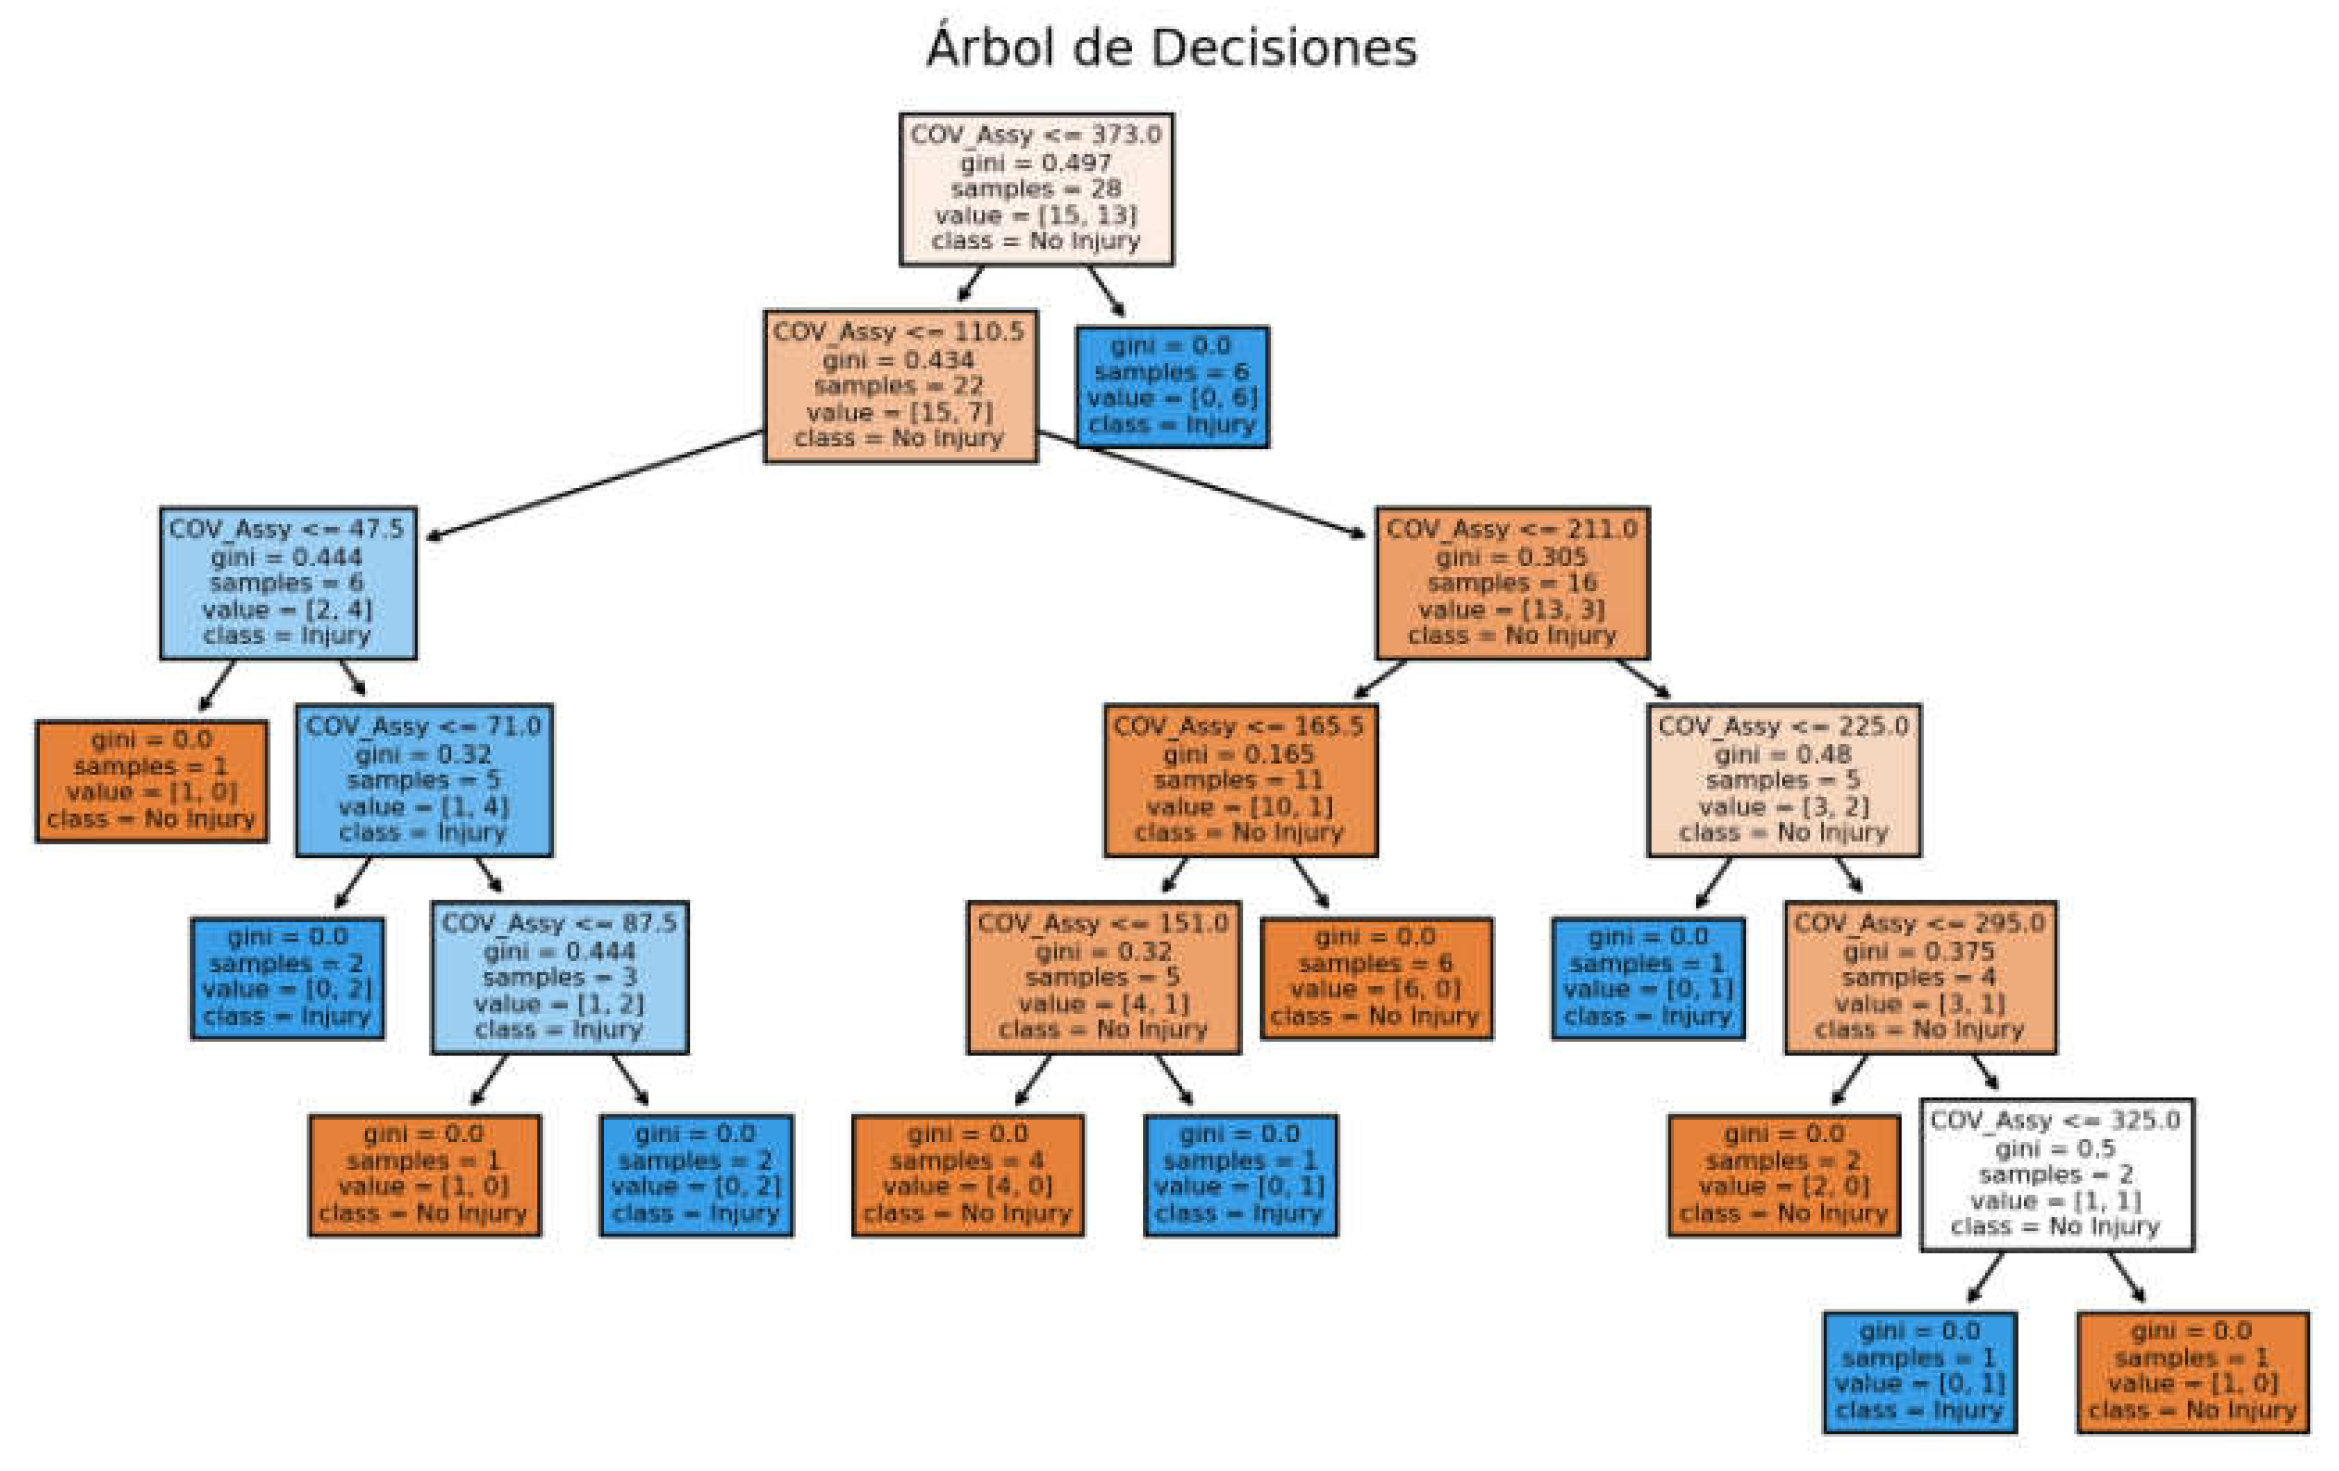
Figure 15.
3 Injury Risk Thresholds based on % COV Assy of 3 Machine Learning Models..
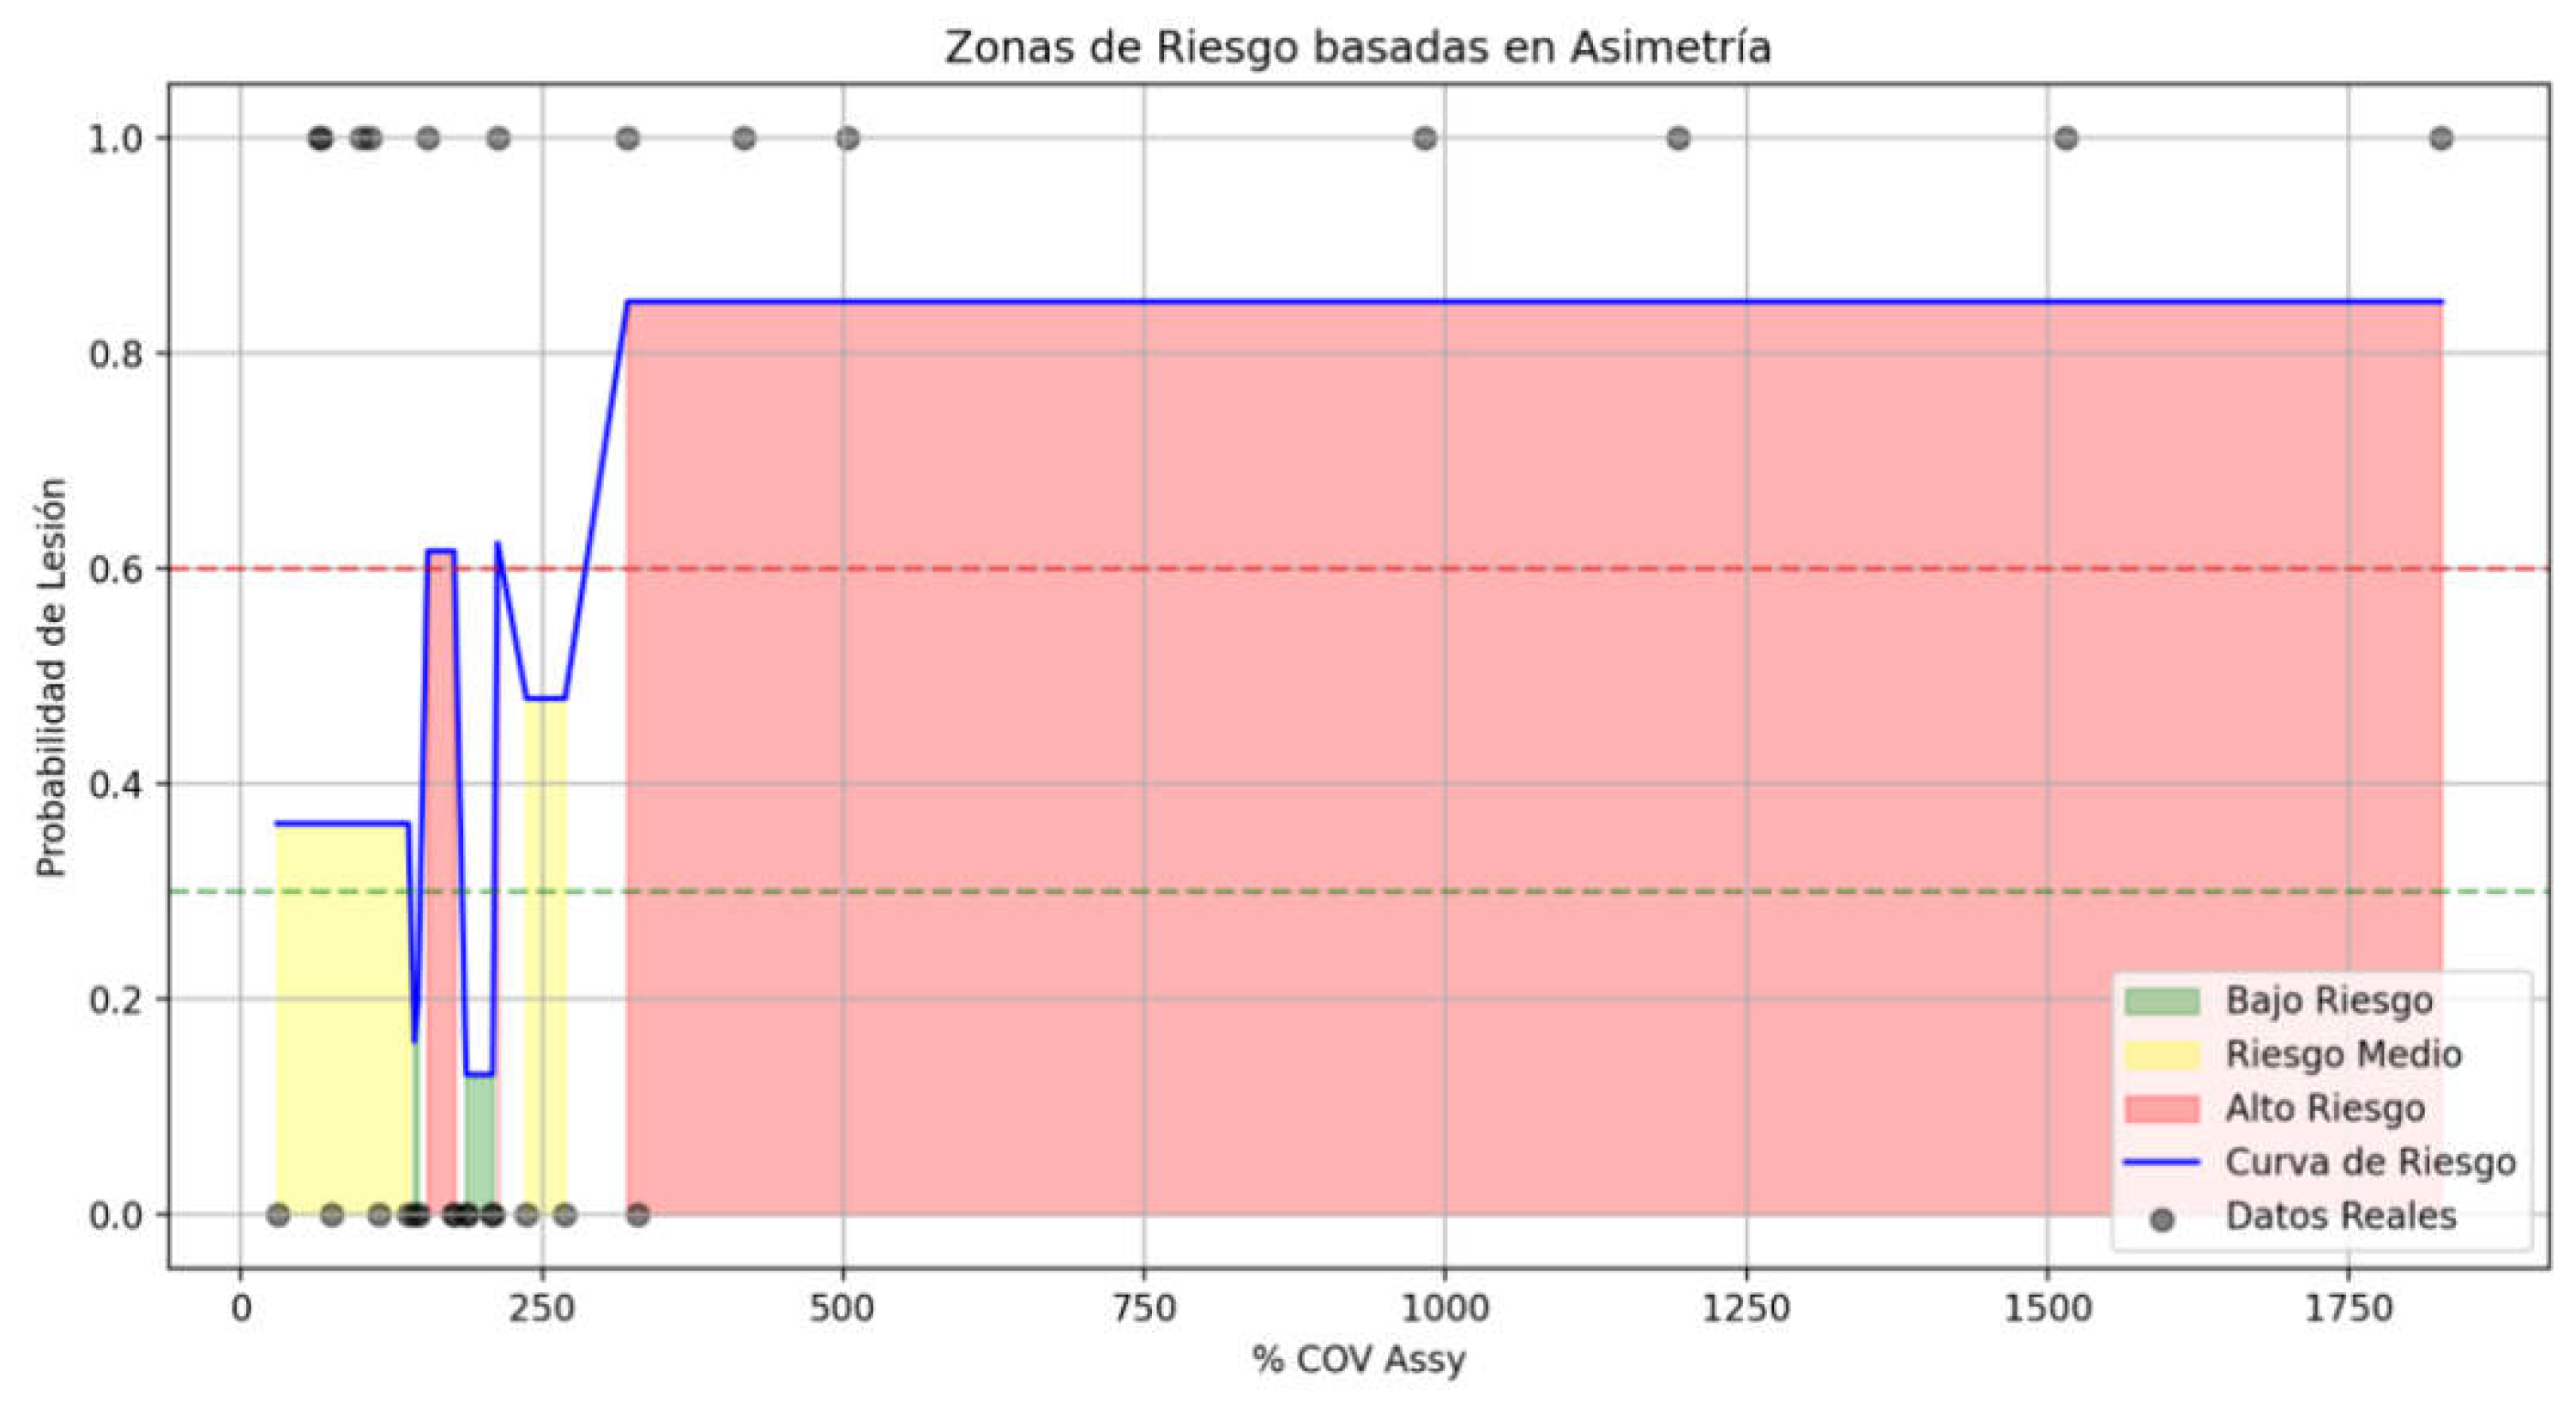
Figure 16.
XG Boost Machine Learning Model.
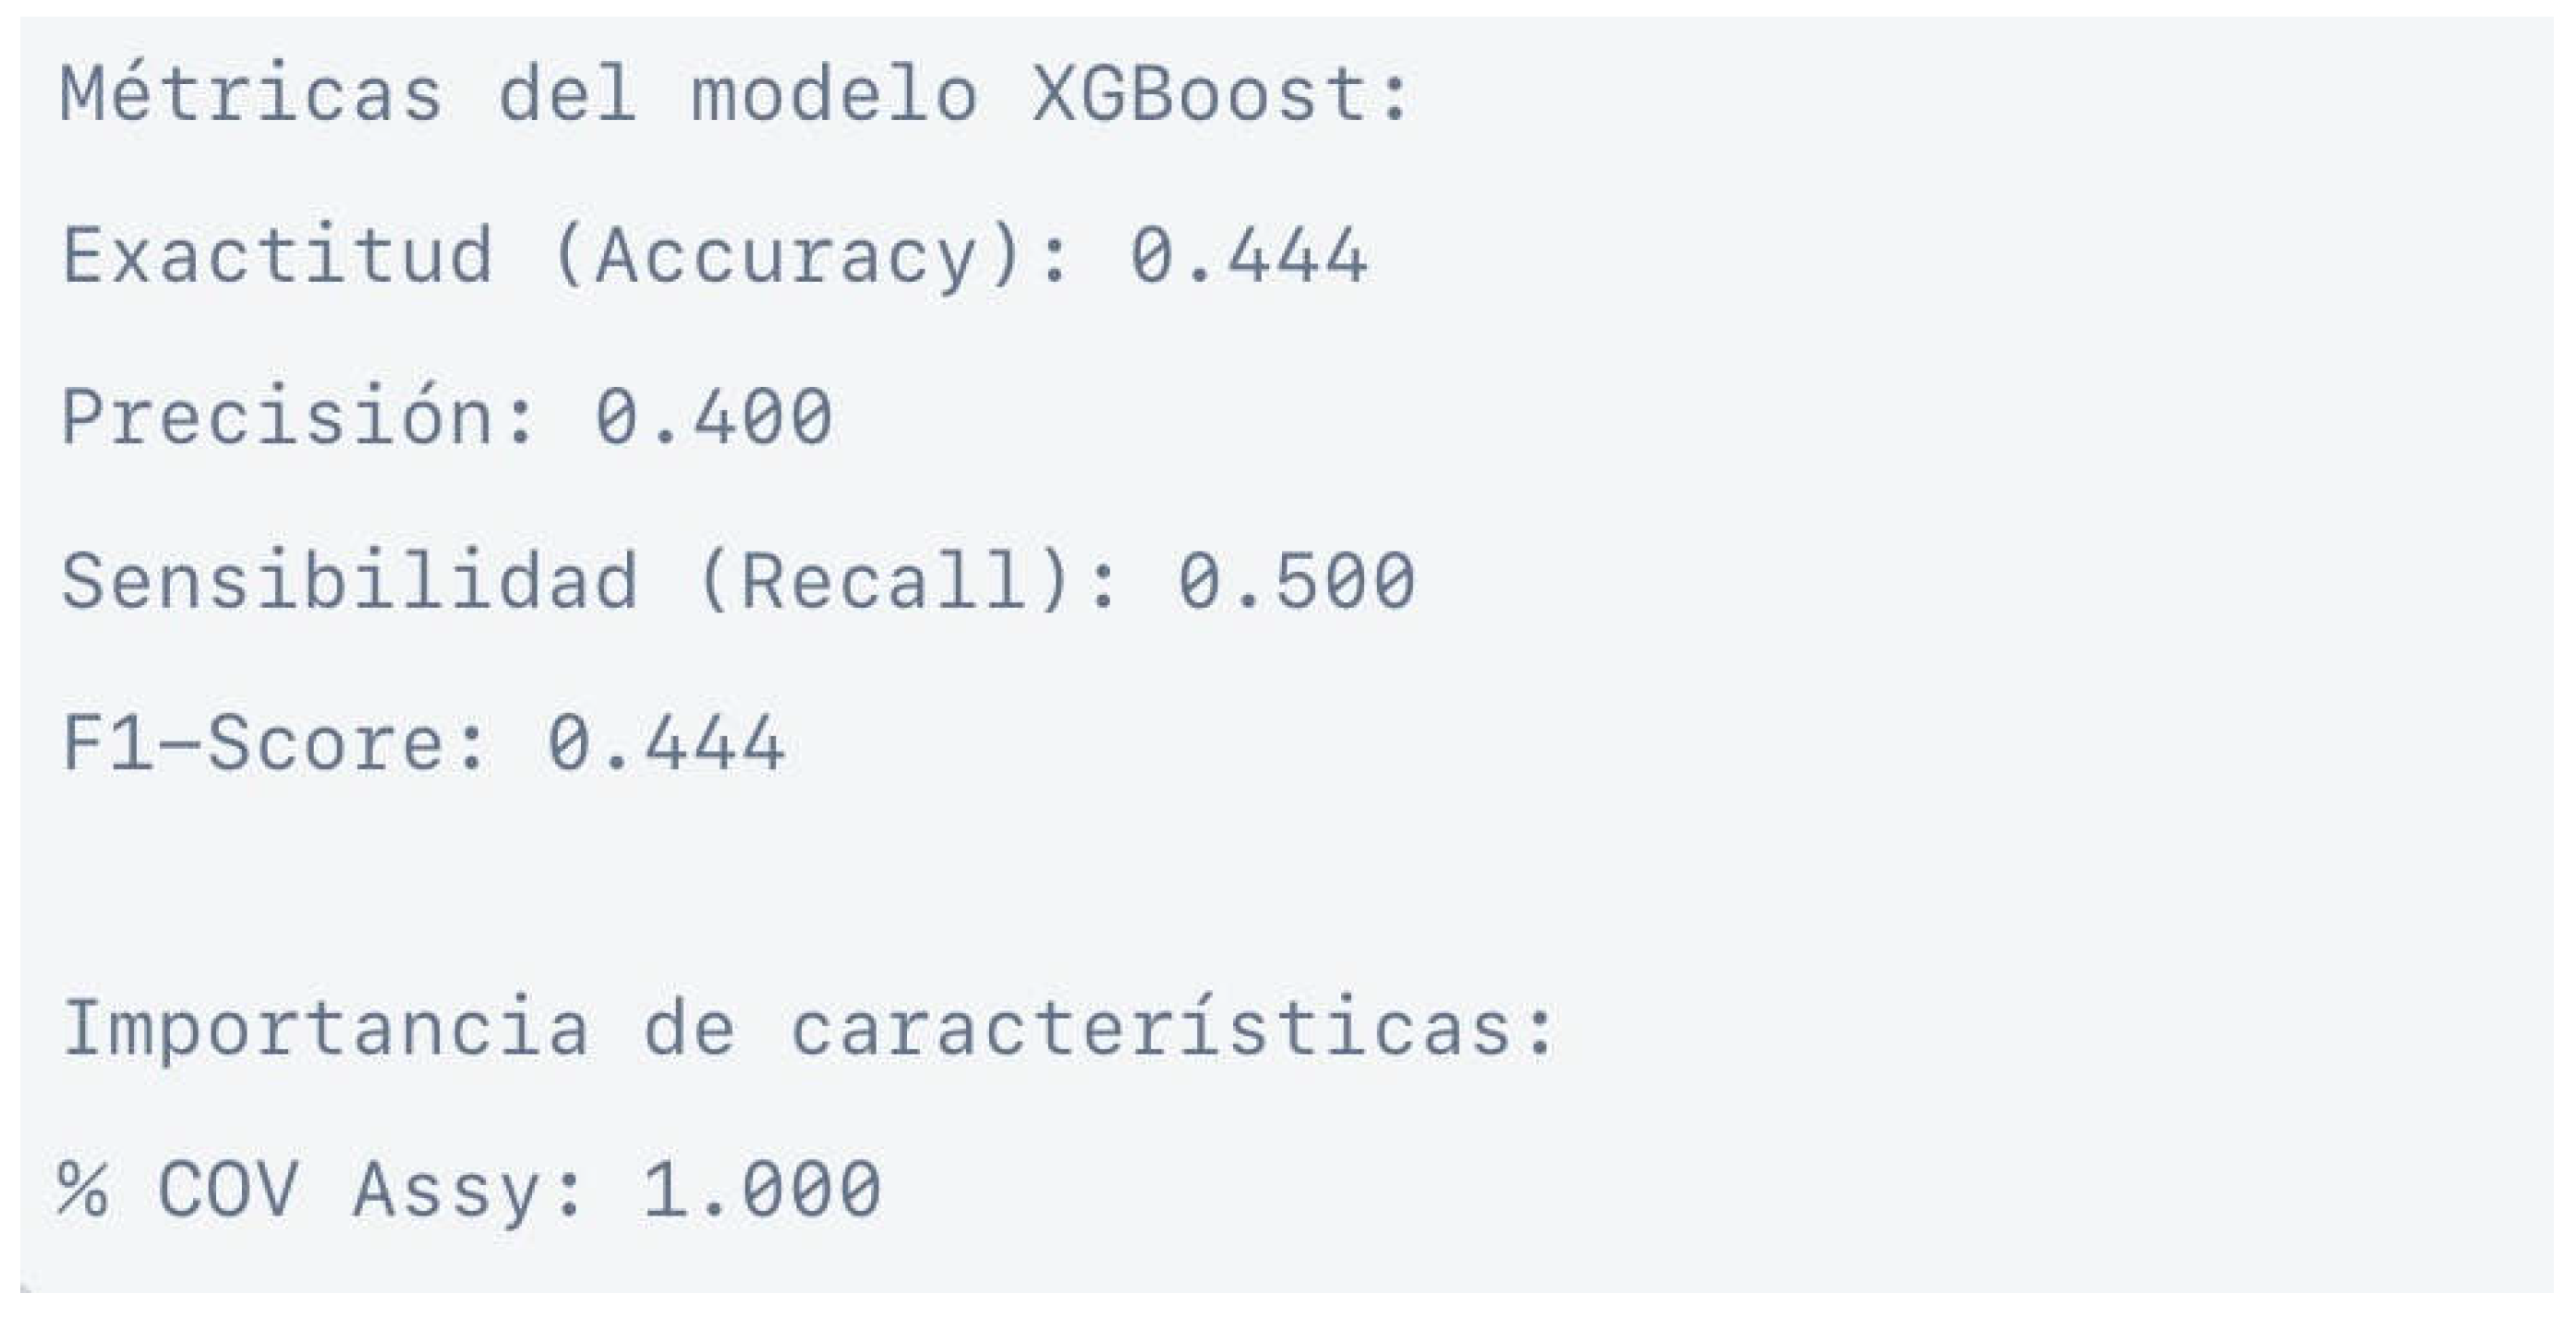
Figure 17.
In the same line, multiple research reports have testified to the solid validity and reliability of technology for the assessment of CMJ kinetic and kinematic performance parameters using force plates (17,18).
Figure 17.
In the same line, multiple research reports have testified to the solid validity and reliability of technology for the assessment of CMJ kinetic and kinematic performance parameters using force plates (17,18).
Disclaimer/Publisher’s Note: The statements, opinions and data contained in all publications are solely those of the individual author(s) and contributor(s) and not of MDPI and/or the editor(s). MDPI and/or the editor(s) disclaim responsibility for any injury to people or property resulting from any ideas, methods, instructions or products referred to in the content. |
© 2025 by the authors. Licensee MDPI, Basel, Switzerland. This article is an open access article distributed under the terms and conditions of the Creative Commons Attribution (CC BY) license (http://creativecommons.org/licenses/by/4.0/).
Copyright: This open access article is published under a Creative Commons CC BY 4.0 license, which permit the free download, distribution, and reuse, provided that the author and preprint are cited in any reuse.


