
Submitted:
16 April 2025
Posted:
18 April 2025
You are already at the latest version
Abstract
This paper investigates the offloading of image segmentation tasks and the allocation of corresponding computing resources for the Internet of Vehicles (IoV) supported by edge intelligence. With the convergence of 5G technology and artificial intelligence, the demand for high-precision sensors and navigation in smart connected vehicles is growing. Image segmentation technology, a crucial component of autonomous driving systems, requires substantial computing power and communication bandwidth. Faced with the shortage of onboard computing power and rising costs, edge computing offers a solution by offloading computing tasks to roadside servers close to the data source, i.e., connected cars, thereby alleviating network bandwidth and power consumption pressures and reducing system latency. This paper constructs an efficient edge computing resource allocation system based on an improved model-free Soft Actor-Critic (iSAC) algorithm with maximum entropy, and enhances the offloading efficiency by employing an integrated computing and networking scheduling framework to minimize task completion time. By incorporating Prioritized Experience Replay (PER), the iSAC algorithm accelerates the learning process while maintaining stability and improving the efficiency and accuracy of computation offloading. Simulation experiments compare the performance of iSAC with baseline algorithms, demonstrating its advantages in reducing error rates and optimizing task completion time. Future research will investigate task diversity and priority requirements in IoV.
Keywords:
edge computing
; image segmentation
; task offloading
; computation resource allocation
; deep reinforcement learning
; soft actor-critic
; prioritized experience replay
1. Introduction
Under the synergistic influence of 5G wireless and artificial intelligence (AI), transportation systems are undergoing a profound transformation toward connected intelligence. The integration of vehicle communication, the 5G technology and edge computing marks the paradigm shift of intelligent transportation [1]. The high-speed and low-latency characteristics of 5G, when combined with AI, have driven the rapid development of heterogeneous vehicular networking technologies, endowing smart vehicles with enhanced perception capabilities. Environment perception technology is the most important part of driverless technology, and driverless vehicles need to realize decision planning and control by virtue of perception feedback [2]. Connected cars rely on high-precision sensors to detect and perceive external information, which, after fusion and analysis, provides a basis for subsequent decision-making and control processes [3]. For instance, autonomous driving systems are the core of smart vehicles, as they can detect lane, distance, and speed information through cameras, lidars, and other sensors [4], creating two-dimensional or three-dimensional databases. Then vehicle terminal algorithms analyze these image databases to guide the decision-making of the autonomous driving systems. Image segmentation is one of the key technologies in autonomous driving,autonomous driving require high-precision semantic image segmentation technology to identify and understand the content of each pixel in the images [5]. It can separate different objects in an image, which is crucial for understanding the environment around the vehicle, recognizing pedestrians, other vehicles, traffic signs, etc.
The intelligent systems of vehicles rely on sustained and robust computing power. Image segmentation, in particular, consumes a significant amount of computing and storage resources. Vehicles generate hundreds of high-definition images per second through cameras and lidars. Although onboard computing power is provided by powerful GPUs and processing chips, the increasing demand for image segmentation and other intelligent applications will cause severe shortages in onboard computing power and raise computing overheads and costs. For instance, automotive-grade chips need to support the calculations and processing of massive sensor data by a vast array of intelligent algorithms and application services [6], which leads to an increase in the costs of onboard computing hardware. To reduce user costs while providing high-quality computing services, edge computing [7] has emerged. Edge computing is the deployment of core cloud computing functions closer to the data source, i.e., at the network edge. It is a new architecture that provides computational support for vehicle-road interconnectivity and related compute-intensive computer vision applications. Unlike cloud computing, which places user tasks on remote cloud servers, leading to significant service latency, energy consumption, and poor real-time performance, edge computing offloads tasks to edge servers, e.g., roadside units, close to the vehicle for computation, processing large amounts of data at the network edge without uploading them to the cloud [8]. This greatly alleviates the pressure on core networks and power consumption, significantly reducing service latency.
As the number of connected cars continues to grow, computing tasks exhibit salient characteristics of significant diversity, large data volume, and resource demands.Nowadays, autonomous vehicles are equipped with more than a hundred sensors, generating 1GB of data per second and up to 11TB of task data daily [9]. Without an effective task scheduling strategy, it is impossible to achieve the goal of real-time task processing by edge servers. To address this issue, we analyzed mainstream task allocation and resource scheduling algorithms and constructed a more efficient edge computing resource allocation system based on the model-free deep reinforcement learning algorithm with maximum entropy, i.e., Soft Actor-Critic (SAC) [10]. Our proposed iSAC algorithm optimizes the allocation of computing resources based on the principles of time priority and resource priority within the edge computing network. Through an integrated computing and bandwidth scheduling framework, iSAC achieves unified scheduling of the computing network, enhancing the rational allocation of resources. The main contributions of this paper are as follows:
1) Computing resource allocation for connected cars involves decisions in discrete action spaces, while the SAC algorithm is designed for continuous action spaces. To adapt the SAC algorithm for discrete action spaces, we modified it to iSAC. Additionally, we introduced the Prioritized Experience Replay (PER) [11] method to accelerate the learning process while maintaining stability, improving the efficiency and accuracy of computation offloading, and enhancing the resource utilization rate of the edge computing network for intelligent vehicles.
2) We designed and implemented a simulation environment that encompasses the random variations of vehicles and tasks, communication links, and edge servers, achieving unified management of global information variables. This simulation environment can simulate the transmission process of tasks (transmission medium, path, and distance) and also the time that the tasks reside on servers (queuing and computation time). To validate the reliability of the system, we also simulated the server energy consumption and loads.
3) Within the simulation experimental environment, we tested and compared the performance of the iSAC, PER-iSAC, the original SAC, and several other offloading strategies using common DRL algorithms in terms of task offloading, and conducted an in-depth analysis and gave some insights into the results.
2. Related Work
In recent years, numerous studies on resource scheduling have emerged across various fields. These studies have provided some reference methods and inspiration for our research.
For instance, in power grid systems, [12] presents a novel optimization scheduling strategy using the Improved Bare-Bones Multi-Objective Particle Swarm Optimization (IBBMOPSO) algorithm, effectively reducing charging costs for electric vehicles amidst uncertainties in wind and solar power outputs, while enhancing the operational stability of microgrids. [13] proposed an online optimization strategy for microgrids based on deep reinforcement learning, which can achieve a linear increase in the number of neural network outputs with the addition of distributed battery storage systems, demonstrating excellent scalability, performance, and capability of operating without relying on any renewable energy and power load prediction method. Reference [14] presents an online scheduling method for residential microgrids that is based on Monte Carlo Tree Search and a learning model. This approach does not rely on predictive models to forecast future photovoltaic/wind power and load sequences; instead, it employs reinforcement learning techniques to achieve economic operation of the microgrid. [15] proposed a smart grid demand response coordination method based on ultra-reliable low-latency communications and the MuZero algorithm. This paper emphasizes the importance of improving decision-making reliability and response time in the smart grid environment for effective demand response planning. By accurately predicting power grid demand nearly in real time, consumers can be better prepared to optimize the overall energy utilization.
In the field of computing task scheduling, [16] proposed a scheduling model based on goal programming and linear programming to optimize the time and cost in job shops. The researchers analyzed the case of Surabaya Container to discuss how to design regulatory activities to minimize total time and distribution costs. The results indicate that through job shop scheduling, activities can be formed more effectively and costs can be minimized compared to flow shop scheduling. [17] proposes a new Hadoop scheduling model named the Adaptive Scheduler, which introduces Service Level Agreements to standardize the agreements between vendors and consumers, thereby enhancing the reliability of job completion and optimizing resource allocation.
In energy management, Li et al. [18] introduces a novel entropy-tuned soft actor-critic (SAC) algorithm-based energy management system (EMS) for plug-in hybrid electric vehicles (PHEVs) to enhance fuel economy by balancing energy efficiency and driving cycle adaptability. Liu et al. [19] proposes a day-ahead optimization scheduling strategy for Integrated Energy Systems (IES) considering virtual heat storage and electric vehicles, which is validated through case studies to effectively improve the operational economy of IES and promote the consumption of renewable energy.
In vehicular edge computing, Saleem et al. [20] addressed the impact of terminal device mobility on task scheduling strategies in mobile edge computing scenarios and proposed an improved mobility-aware algorithm, taking into account the influence of resource attributes and device distribution on energy, achieving rational vehicular resource scheduling. Han et al. [21] proposed a task scheduling method that considers the computing time of all tasks and their impacts on user experience, aiming to minimize the weighted processing time of all tasks. Zhang et al. [22] conducted research on the Energy-Efficient Computation Offloading (EECO) mechanism in 5G heterogeneous networks for MEC, considering the energy consumption of task computation and file transfer, and proposed an optimization method aimed at minimizing the energy consumption of the computational offloading system. The designed EECO scheme for offloading and radio resource allocation leverages the multi-access characteristics of 5G heterogeneous networks to achieve minimal energy consumption under latency constraints. Li et al. [23] optimized the flight paths and computation resource allocation of multiple unmanned aerial vehicles (UAVs) to minimize the energy consumption. Ullah et al. [24] aims to optimize task offloading and resource allocation in the edge-cloud computing environment by using deep reinforcement learning and a Double Deep Q-Network (DDQN) algorithm, in order to minimize latency and meet the demands for computation and communication, while dynamically analyzing resource utilization, task constraints, and the current status of the edge-cloud network, to achieve superior resource utilization, task offloading, and task rejection rates compared to traditional heuristic methods.
The aforementioned studies have primarily focused on reducing time and energy consumption, but they have not taken into account the accuracy rate of task and resource allocation. When tasks are allocated to servers with high loads, it can lead to poor timing and execution efficiency, indicating resource mismatches in task allocation. To address this issue, a task offloading system that integrates the PER method and the iSAC algorithm has been designed in this paper. Experimental results demonstrate that PER-iSAC can achieve better resource utilization rates compared to baseline offloading strategies, ensuring the full utilization of computing resources and a lower error rate.
3. System Architecture
3.1. Computing Power Network
With the widespread deployment of edge computing servers and intelligent roadside units, it has become more convenient and accessible for connected cars to utilize these vast distributed computing resources.Edge computing has witnessed remarkable advancements in recent years, enabling users to access a wide range of applications and services on their mobile devices [25]. However, an individual edge server has limited computing power, and for compute-intensive tasks, this can lead to increased computational loads and prolonged task processing time. Moreover, the lack of an effective collaborative mechanism between edge nodes and cloud computing nodes results in low efficiency and utilization of computing resources. How to more efficiently utilize these computing resources has become an urgent problem to solve. Consequently, the computing power network [26] emerges, connecting distributed edge nodes to form a much more powerful network and allocating resources through a unified scheduling algorithm. The research presented in this paper is set within the scenario of a computing power network, utilizing scheduling algorithms to enable image segmentation tasks to better acquire computing resources.
The computing power network consists of three layers: cloud, edge, and terminal. The terminal devices are at the bottom layer, closest to the users, and are primarily responsible for data collection and preprocessing. Edge servers are in the middle edge layer, situated between the cloud and the terminal layers, and are responsible for processing the computational tasks uploaded from terminal devices. Cloud servers are at the top layer. Edge servers are close to the vehicles at the terminal layer, resulting in small transmission delays, but their storage capacity and computing power are less than those of the cloud layer. Cloud servers have strong computing capabilities and large storage capacities, enabling them to efficiently handle computing tasks. However, cloud servers are far from the terminal layer, leading to significant data transmission delays [27]. The three-tier architecture of the computing power network is shown in Figure 1.
3.2. Computing Power Allocation System
Given the high real-time requirements and huge computational demands of image segmentation tasks in smart vehicles, coupled with the insufficiency of terminal computing power, this study has designed a computing power allocation system within the computing power network. The system composition is shown in Figure 2. This computing power allocation system is not only highly adaptable and compatible but also stable and reliable. Through this system, it is possible to significantly enhance edge computing efficiency, reduce the energy consumption of connected cars, ensure the timeliness of task completion, and improve the overall capability of edge computing in various IoV computing power allocation scenarios.
Each server acts as both a computing node and a computing power allocation model. The computing power allocation system is deployed on edge servers. As shown in Figure 2, the overall architecture of the system consists of several key components, each designed to enhance the efficiency and rational allocation of computing power. First, the system initializes and manages environmental parameters, which include server performance metrics, communication line performance metrics, and the size of task data, among other specific simulation settings. This is to ensure the rationality of resource allocation, enabling our proposed PER-iSAC to function more effectively in the real world. Second, in this paper, we simulate a real-world cloud-edge network architecture. Its role is to mimic the actual network environment to generate environmental parameter data. Specifically, it simulates the working scenarios of vehicles, tasks, servers, and communication links. In this environment, PER-iSAC can dynamically obtain parameter data, forming a state space. The vehicular and roadside agents make decisions based on the state space and action space parameters, and PER-iSAC provides agents with rewards and states for the next time slot based on the actions taken by them. Additionally, the agent is the core of decision-making. It is designed to accommodate various algorithms and this paper takes the PER-iSAC algorithm as an example, which can generate the optimal allocation strategy through experience replay and environmental state analysis, thereby reducing time consumption and ensuring that vehicle demands are met, while also enhancing edge computing power. Moreover, PER-iSAC can also perceive the changes in the environment after an agent makes a move. Finally, the agent adjusts the allocation strategy in real time based on the rewards returned by the environment, gradually improving the overall optimization effect of PER-iSAC.
The allocation of computing power is essentially a data transfer process, which involves reasonably assigning tasks to various edge servers and cloud servers based on task requirements. Taking image segmentation tasks as an example, the specific process is as follows. First, the vehicle collects a certain batch of images through its sensing devices (such as cameras and lidars for 3D point clouds) and performs preliminary processing. Since the vehicle has some computing power, it can handle preliminary processing tasks such as image denoising and cropping. The size of the preprocessed image data, selected model, and computing power requirements are then uploaded to the nearest edge server as the task parameter information. Second, after receiving the task parameters, the edge server converts it with the server information into state space data. Third, the agent makes the current optimal edge server selection strategy based on the current state. Fourth, the system returns the optimal strategy to the vehicle, and the vehicle sends the batch of image data to the edge server determined by the computing power allocation strategy for image segmentation. Fifth, the edge server executes the image segmentation task and returns the results to the vehicle. Finally, the system rewards or punishes the PER-iSAC agent based on the reward mechanism.
4. Model Establishment
4.1. Problem Formulation
The actual edge computing power network scenario is as follows. First, each image segmentation task requires computing resources on the edge nodes (GPU and memory resources), and the allocated tasks must not affect the normal operation of other tasks on the same edge node. Second, due to the uniqueness of the vehicle and edge server, e.g., the different geographical locations and communication bandwidths of each vehicle, the time cost and energy expenditures for each task vary. Third, the requirements for each task are diverse. Factors like the task type and image data size lead to varying demands on computing resources. Therefore, the task allocation scheme should ensure that each task receives the optimal computing resources, thereby reducing the completion time and costs of image segmentation tasks.
This paper views the task allocation problem as a classic resource scheduling optimization problem. Tasks can be considered as image data that need processing, and edge and cloud servers are the computational resources that handle these tasks. The main objective is to find the optimal task allocation strategy so that the distribution of computational resources among tasks across various servers is optimized.
4.2. Computing Power Model
Computing power is defined as the capability required to accomplish certain tasks, including logical/parallel computing, neural network acceleration, etc. The main hardware for computing includes Central Processing Units (CPUs), Graphics Processing Units (GPUs), Tensor Processing Units (TPUs), Neural Processing Units (NPUs), etc. CPUs are suitable for logical calculations/operations and general-purpose computing hardware with poor parallel processing capabilities, and struggling with large-scale high-definition image data. In contrast, GPUs have a large number of computing units and a pipeline-style workflow, offering strong parallel processing capabilities and is well-suited for graphic and image processing. The basic unit of measurement for computing power is FLOPS1, which stands for the number of floating-point operations per second. Considering an actual computing power network, the most widely used combination of computing hardware is CPU plus GPU, with GPUs excelling in image processing and matrix operations. Therefore, this paper considers GPUs as the hardware for computing power modeling.
4.3. Objective Function
(1)To achieve the rational allocation of computing power in the edge computing power network for IoV, it is necessary to consider entities such as vehicles, servers, tasks, and network links. Let the set of servers be S, the set of tasks be T, and the set of network links be L. Let denote the set of tasks in the computation queue at server s. To minimize task completion time, minimize energy consumption, and maximize resource utilization, the comprehensive optimization objective function is:
where , , and are weights to balance latency, energy consumption, and computational resource utilization. This objective function encapsulates the goals of optimizing the allocation of computing resources in such a way that it balances the efficiency of task completion, the conservation of energy, and the maximization of the use of available resources within the network.
1) The total latency is the total time from when the task data is sent from the vehicle terminal, processed by the roadside edge server, and the result is returned to the vehicle. It includes transmission delay, queuing delay, and processing delay. The transmission delay includes the task upload delay and the task download delay, where the sizes of data uploaded and downloaded are different, and the links they traverse also differ. The transmission delay is defined as:
where is the size of task data, and is the bandwidth of the link from the vehicle j to the server i. is the size of the task result, and is the bandwidth overheads of downloading the task result from the server to the vehicle. represents the link length for task uploading, represents the link length for the return of task completion results, and v is the propagation speed of the signal. The processing delay is the time costs for the edge server to provide computing resources based on the task requirements, denoted as (unit: ms, milliseconds), defined as follows. is the task’s computing resource requirement and is the total computing power of the edge server.
Due to hardware limitations, edge servers have a maximum limit on the number of computing tasks they can handle. Assuming that an edge server receives a task and finds that it has reached the maximum number of tasks, the task will enter a queue, potentially increasing the task’s latency. The queuing delay is recorded using system time steps: if a system time step is set to 0.001 seconds, then queuing delay W is equivalent to the number of time steps the task waits in the queue.
To ensure the reliability of the computing power scheduling model, we consider an edge computing power network scenario where servers are fully loaded when modeling the extended task processing time. The total time is then given by:
2) Energy consumption is determined by the power of the edge server during task processing and the time spent on processing the task. The power of the edge server varies between idle and loaded states; the higher the power, the greater the energy consumption and the higher the costs incurred by the server. This paper uses to denote the power consumption in the idle state, to denote the power under full loads, and to denote the resource utilization rate (ranging from 0 to 1). The energy consumption for computing task t on edge server s is defined as follows:
where the current power per unit time of the edge server is given by:
3) The resource utilization rate is used to measure the current usage of the edge server, including the weighted average of the utilization rates of computing power and memory:
The computing power utilization rate is determined by the total computing power demand of all tasks currently allocated to server s divided by the total computing power of s under full load, which is defined as follows:
Similarly, let denote the size of memory occupied by the task, and let denote the total memory capacity of the edge server. The memory utilization rate is then given by:
Then the comprehensive resource utilization rate can be obtained by:
The weights for each type of resource must respect
(2) Constraints are as follows:
In the computing power network, let denote task t allocated to edge server s, where S is the set of servers. For task t and server s, it is necessary to ensure that the total computing power and memory requirements of the tasks allocated to the server do not exceed the server’s total computing power and memory capacity. These constraints can be expressed as:
Each task can only be assigned to one server. To ensure that this constraint is met, the scheduling algorithm must be designed to prevent any task from being duplicated across multiple servers. This is crucial for maintaining the integrity of the system and ensuring that resources are allocated efficiently. This approach helps to avoid conflicts and ensures that each server operates at its maximum potential without overloading, which could lead to decreased performance or system failures.
The transmission time for each task must not exceed the predetermined maximum latency:
Adhering to this constraint is essential for ensuring that tasks are completed within the required timeframes, which is particularly important in IoVs where real-time processing is often a critical factor. Exceeding the maximum latency can lead to delays in task execution, which may have cascading effects on downstream processes and ultimately impact the overall performance of the IoV system. Therefore, the scheduling algorithm must efficiently manage the allocation of tasks to edge servers, taking into account the bandwidth limitations and the current network conditions. This optimization not only helps in meeting the latency requirements of IoV but also enhances the responsiveness of the computing power network, which is vital for maintaining the quality of service and user satisfaction in time-sensitive IoV applications. The physical distance between the vehicle and the edge server must not exceed the coverage range of the link, and the distance from the vehicle to the server must be less than the length of the transmission link as follows:
This constraint ensures that the communications between the vehicle and the edge server is feasible. The distance limitation is crucial for maintaining signal integrity and reducing the potential for data loss or corruption that can occur over long transmission distances. Additionally, this constraint helps ensure that edge servers are strategically placed to service the vehicles within their coverage area and that the overall network remains efficient and scalable. The total completion time for task T must not exceed the maximum completion time allowed for the task, i.e., its deadline, as follows:
The resource utilization rate of an edge server must be less than 1:
This constraint ensures that no edge server is overloaded beyond its capacity, which is crucial for preventing system crashes and maintaining the stability and performance of the computing power network.
5. Improved SAC (iSAC) Algorithm
5.1. Algorithm Architecture
In deep reinforcement learning, an agent must learn the optimal policy through interactions with the environment. During this process, the agent faces two main tasks: exploration and exploitation. Exploration refers to the agent’s attempt to try different actions to discover new, potentially better strategies, whereas exploitation refers to the agent’s selection of actions based on the currently known optimal policy. The SAC algorithm balances these two tasks by maximizing an entropy.
Entropy, a measure of the uncertainty or randomness of a system, is also used in information theory to gauge the uncertainty of information. In reinforcement learning algorithms that maximize entropy, the goal is not only to maximize accumulated rewards but also to maximize the entropy of the policy. This means that the algorithm is encouraged to explore a variety of different actions, even if these actions do not appear to be the optimal choice at the current moment.
The original SAC algorithm achieves the maximization of the entropy by introducing an entropy term in the objective function. Specifically, the objective function of SAC consists of two parts: one is the expectation of accumulated rewards, and the other is the expectation of the policy entropy. By adjusting the weights of these two parts, SAC can maximize accumulated rewards while maintaining the randomness of the policy, thus avoiding the premature convergence to local optima. The following equation represents the overall maximization goal of SAC,where is the discount factor, and is the hyperparameter that balances the trade-off between rewards and the entropy, also known as the temperature coefficient.
In the SAC algorithm, the policy network is responsible for generating the probability distribution of actions, while the value network is responsible for estimating the state-action value function. The agent interacts with the environment according to the current policy, collecting information such as states, actions, rewards, and new states, which are used to update the value network and the policy network. When updating the policy network, SAC considers not only maximizing the expected reward but also maximizing the policy entropy, as shown in Figure 3. This is achieved by computing the policy gradient and updating the weights of the policy network.
An important feature of the SAC algorithm lies in its ability to adaptively adjust the entropy weight. During the training process, entropy weight is automatically adjusted by another parameter, which allows SAC to automatically balance exploration and exploitation in different tasks and environments without manual interventions. Additionally, SAC is off-policy, which means it can utilize past data through a replay buffer for repeated training. This off-policy updating method offers greater stability compared to online algorithms like A3C.
The improvements made in this study to the SAC algorithm mainly involve the following aspects:
1) Since the SAC algorithm is a reinforcement learning algorithm suitable for continuous action spaces, and the task offloading problem in IoV belongs to discrete space decision-making, we proposed iSAC, which is applicable to discrete space decisions. As shown in Figure 3, the original actor network only had fully connected layers and ReLU activation functions. We have added normalization layers and softmax activation functions. The normalization layer standardizes the output, thereby enhancing the model’s representing power. The main reason for using a normalization layer in the output is to prevent the softmax function’s output from being singular.
The softmax activation function transforms the policy output by SAC into a probability distribution vector, and then edge servers can be sampled randomly according to these probabilities.
2) Based on the characteristics of the computing power network and the purpose of computation offloading in IoV, the state space and reward function are redefined. The state space mainly includes the remaining resources and the load status of edge servers. Since it is necessary to obtain the time tasks spend on edge servers, rewards may be delayed. Therefore, the reward function is divided into immediate decision rewards and deferred rewards.
3) Introducing Prioritized Experience Replay (PER). The traditional experience replay mechanism uses uniform sampling and thus may overlook some critical samples, and not all samples contribute equally to the update of the value function. The core idea of PER is to prioritize the sampling of experiences with larger Temporal Difference (TD) errors. The TD error is a measure of the deviation between the current value estimate and the target value, defined as:
where r is the immediate reward, is the discount factor, is the current value estimate, and is the value estimate of the next state. The priority of a sample is related to the TD error:
is a positive number that approaches 0 and samples with higher priority are more likely to be sampled.
5.2. MDP Engineering
Since Deep reinforcement learning (DRL) methods possess stronger generalization capabilities and applicability, for the optimization of computing resource allocation problems addressed in this paper, applying Markov Decision Process (MDP) modeling enables the more efficient discovery of optimal solutions.
5.2.1. State Description
In the context of IoV, a computing power allocation process encompasses the processes of task offloading, task queuing, task computing, and result returning. In the preset scenario, the state space consists of six scores: {0, 0, 0, 0, 0, 0}, corresponding to the six servers in the action space. Initially, the system needs to collect server load and task information. Then, a score is assigned. If the remaining storage capacity of the server is greater than the storage requirement of the task, add 1 to the corresponding position in the state space set, otherwise do not add. If the server’s remaining computing power is greater than the task’s computing power requirement, add 1 to the corresponding position in the state space set, otherwise do not add. Finally, the system will calculate the transmission time and computation time overhead (excluding task queuing time and communication delay) of the computing task to each server, and select the server with the minimum time cost to add 1 to its score. Such a state space not only expresses the size of the task, the computing power requirements, the server load, and the task time components, but also reduces the dimensionality of the state space, thereby accelerating the convergence of the algorithm.Therefore, state space S can be represented as:
5.2.2. Action Description
The agent in iSAC will make a decision to select an edge server based on the current state and task requirements. In the IoV in this paper, a total of 6 edge servers with different performance parameters are set up, so the action space consists of all the optional edge servers.
5.2.3. Reward Engineering
The core objective of designing the reward function for image segmentation tasks in the IoV is to optimize task allocation to achieve a comprehensive optimum in terms of task completion time and allocation error rate. Integrating the previous optimization objectives and constraints, the following reward function can be designed:
1) Reward function. iSAC will estimate the total computation and transmission time for image segmentation tasks on each edge server by synthesizing global information and selecting the server with the shortest task completion time as the reference edge server. If the selection matches well, the agent will receive a reward of 0.5.
2) Penalty factor. If the total time exceeds the maximum completion time , it will affect the performance of the computing power network for IoV and be deemed as an incorrect allocation by the resource and task allocation system.
If the edge server is overloaded and unable to accommodate the current task, it will result in an allocation error and the system will immediately impose a penalty as follows:
Finally, the overall reward function can be obtained as:
5.3. Algorithm Implementation
First, the environment, deep neural network, and experience pool are initialized. Hyperparameters are set, and the deep neural network adopts He initialization for parameters. When the experience buffer is empty, the default priority of experiences is set to 1.0. Before the experience pool reaches the batch size, random actions are obtained using the actor network for decision-making, and states, actions, rewards, and the next states are stored in the experience pool. Once the experience pool reaches the batch size, every task will sample n experiences based on the priority of the samples in the experience pool, and then train the samples, updating the policy network and value network. Finally, temperature coefficient and the priority of the sampled n experiences are updated.
| Algorithm 1 PER-iSAC |
| Input: discount factor , temperature coefficient , soft update coefficient , batch size n, learning rate |
| Output: policy |
| 1: Initialize Actor and Q Net 1, Q Net 2, Target Q Net 1, Target Q Net 2, hyper parameters |
| 2: Initialize Replay Buffer |
| 3: for each do |
| 4: Initialize environment |
| 5: for each do |
| 6: |
| 7: |
| 8: = sampling from action space based on |
| 9: = environment exec |
| 10: save () in Replay Buffer |
| 11: compute the priority p in Replay Buffer |
| 12: if > n then |
| 13: sample n samples from Replay Buffer according to p |
| 14: train with n samples |
| 15: update Q Net 1, Q Net 2, Actor with |
| 16: update Target Q Net 1, Target Q Net 2 |
| 17: update , p |
| 18: end if |
| 19: end for |
| 20: end for |
6. Experiment Results
6.1. Simulation Settings
Based on the cloud-edge-terminal network structure, a simulation environment is constructed. In this study, all experiments are implemented using the Python language and Gym and PyTorch frameworks. The Python version is 3.8, the PyTorch version is 2.4.0, and the Gym version is 0.26.1. The simulation environment runs on a computer equipped with an Intel Core i9-14900K processor, 32GB of memory, and an NVIDIA RTX 4090 graphics card. The simulation experiments include 6 servers {S0, S1, S2, S3, S4, S5} and multiple vehicle terminals. Each vehicle terminal has at least one communication link connected to an edge server. Since image segmentation is related to image processing, handling image data with GPUs is much faster than with CPU computations, so GPU is the most important hardware component for measuring the algorithms in this paper. The main performance indicators of the edge servers are shown in Table 1.
In addition to edge server parameters, we also consider task information and communication link parameters. Task information describes the algorithm models used by tasks and the sizes of task data; communication link parameters include length and bandwidth, mainly for calculating the transmission time of tasks. They are all necessary in an IoV system, as shown in Table 2.
For image segmentation tasks, the computing resource requirements mainly depend on the deep learning models used. The task offloading of smart vehicles has very high requirements for network latency; typically, an image captured by a vehicular camera is directly transmitted to the edge server for computation. With each vehicle equipped with 6 to 8 cameras, a total of 6 to 8 images are generated at the same time. The floating-point operations required (in FLOPs) for processing a single image by deep learning models (such as U-Net, DeepLabV3+) multiplied by the number of images serves as the task’s computing power requirement. The computing power required for a task, which is the computational capability needed during the task execution, depends on factors such as the number of input images for the task and the computational load per image.
For the parameter settings in the iSAC algorithm, the actor network has 2 hidden layers with 512 and 256 neurons respectively, the critic network has 2 hidden layers with 256 and 128 neurons respectively, the gradient descent optimizer is the Adam optimizer, the learning rate is set to 0.0001, the target network uses soft updates, update parameter tau is set to 0.005, the size of the experience replay buffer is 10,000, the initial entropy is 1.5, and the reward discount factor is 0.99.
6.2. Experimental Results
To simulate real-world IoV scenarios, the simulation data used in the experiments are randomly generated within a specified range, and multiple simulations are conducted to avoid random errors. In the simulation environment, each experiment will randomly generate a total of 100,000 tasks, with a task arrival rate of 10,000 tasks per second. The results are compared and analyzed using the following 3 scheduling strategies:
Method 1. The scheduling strategy using the PER-iSAC algorithm.
Method 2. The scheduling strategy using the SAC algorithm.
Method 3. The scheduling strategy using the PPO algorithm [28].
According to Figure 4. Through the reward value curve in (a), it can be observed that PER-iSAC’s total rewards rise rapidly in the initial phase just as quickly as those of Method 2, then level off. This indicates that both methods quickly improve performance during the early learning stage. Moreover, both algorithms converge faster, with smaller and more stable fluctuations. Method 3’s total rewards increase slowly at first and with greater fluctuations, but begin to grow steadily after the 10th episode, eventually reaching a relatively stable state. According to (b), (c), and (d), the average queue rate, error rate, and completion time for all algorithms decrease rapidly in the initial phase. This suggests that the algorithms quickly refine their allocation strategy through the system’s reward mechanism during the early learning stage. Overall, Method 1 is faster than Methods 2 and 3 in terms of reducing time and decreasing error rates. The main reason for this phenomenon is the introduction of the PER skill in Method 1, which enhances iSAC’s utilization of experiences that are of particularly high value but have a small sample size, thereby enabling Method 1 to explore actions that yield greater value earlier.
According to Figure 5, all methods select servers in descending order of performance, with higher-performing servers being chosen more frequently, which aligns with the server performance settings in the predefined scenario. However, Method 3 has a significantly higher number of selections on Server 0 compared to the other algorithms, likely due to its better performance on that server and the acquisition of more rewards. This also implies that Method 3 tends to select specific servers and does not distribute its selections as evenly across all servers as the other algorithms do. This could be due to Method 3’s preference for certain servers during the learning process or its insufficient learning of how to effectively utilize all servers. The reason for Method 3’s fluctuation could be that it has not achieved the optimal balance between exploring new strategies and exploiting known strategies. This could lead to it not fully utilizing all servers or not making the most optimal scheduling decisions in certain situations, resulting in instability during the training process.
Figure 6 presents a comparison of the average task completion times for three methods under varying task sizes. It is evident that as the task size increases, the average completion times for all three algorithms also rise. At smaller task sizes (20MB to 80MB), the average completion times for all three algorithms are relatively low and the growth is gradual. When the task size reaches 80MB, the average completion time for Method 3 begins to increase significantly, while Methods 1 and 2 exhibit a slower rate of increase. At the largest task size (150MB), Method 3 has the highest average completion time, nearing 500ms, whereas Methods 1 and 2 have average completion times of approximately 200ms and 300ms, respectively. With smaller task sizes, there is minimal difference in performance among the three algorithms. As the task size grows, Method 3 experiences the most rapid decline in performance, with the most significant increase in completion time. Method 1 demonstrates superior performance across all task sizes, with the lowest average completion time.
7. Conclusions and Futrue Works
This paper primarily investigates the offloading and allocation of image segmentation tasks for connected cars in IoVs supported by computing power networks. The experiments take into account the task transmission delays under varying link bandwidths and transmission distances in 5G and optical networks, as well as the computational delays and queuing delays of servers. Additionally, the data size and model size of image segmentation tasks on smart vehicles, along with their computing power requirements, are considered. We designed a PER-iSAC algorithm to implement server selection so as to optimize task completion time while maintaining a low error rate in decision-making. The simulation experiments confirm that PER-iSAC is effective and more efficient than the PPO and standard SAC algorithms. A limitation of PER-iSAC lies in its lack of task diversity and priority requirements, which may not meet the needs of diverse applications in future IoVs.
Concluding our analysis, we arrived at a fundamental insight: the true value of edge servers within the Internet of Vehicles (IoV) context extends far beyond mere computational acceleration through task offloading. Their pivotal role lies in enabling the infrastructure for cooperative vehicle behavior, actualized via V2X (Vehicle-to-Everything) communications. These servers act as local coordination and computation hubs, providing the ultra-low latency essential for exchanging safety-critical information between vehicles (V2V), infrastructure (V2I), pedestrians (V2P), and the network (V2N).
This facilitates a paradigm shift from a model where each vehicle relies solely on its onboard sensors and processing power to one of collective intelligence. Data aggregation at the edge servers fuses information (video streams, LiDAR/radar data, GPS coordinates, vehicle status) from numerous road users and infrastructure elements. Based on this enriched, comprehensive view of the traffic environment (akin to a “digital twin” of the local road segment), movement coordination becomes feasible: synchronizing speeds for platooning, optimizing intersection passage, warning about beyond-line-of-sight hazards, and enabling collaborative maneuver planning.
Consequently, an integrated transport network (or grid) is formed, where decisions are made not just at the individual vehicle level, but also at a system level to optimize overall performance. This leads to significant enhancements in safety (reducing collision probability through extended awareness) and traffic efficiency (mitigating congestion, optimizing routes, reducing fuel/energy consumption). Within this complex ecosystem, video information processing, whether performed locally or at the edge, serves as a crucial but not solitary component – it is one data stream feeding the larger process of cooperative transport system management orchestrated by the edge infrastructure.
Author Contributions
Conceptualization, B.Y., W.Z.; methodology, W.Z.; software, W.Z.; validation, W.Z., B.Y.; formal analysis, W.Z.; investigation, B.Y., W.Z.; resources, B.Y.; data curation, W.Z., A.R.; writing—original draft preparation, W.Z. and B.Y.; writing—review and editing, W.Z., B.Y., U.V., A.G. and S.P.; funding acquisition, H.Y. All authors have read and agreed to the published version of the manuscript.
Funding
This work was supported by the Science and Technology Research Program of Chongqing Municipal Education Commission (Grant No. KJ202301165), the Innovation and Development Joint Fund of Natural Science Foundation of Chongqing (CSTB2024NSCQ-LMX0010), the Scientific Research Foundation of Chongqing University of Technology (Grant No. 0121230236), and the Higher Education Research Project of Chongqing University of Technology (Grant No. 2024YB09). The APC was funded by the Innovation and Development Joint Fund of Natural Science Foundation of Chongqing (CSTB2024NSCQ-LMX0010).
Institutional Review Board Statement
Not applicable.
Informed Consent Statement
Not applicable.
Data Availability Statement
Data are contained within the article;further inquiries can be directed to the corresponding author.
Acknowledgments
We would like to express our sincere appreciation to the anonymous reviewers for their insightful comments, which have greatly aided us in improving the quality of the paper.
Conflicts of Interest
The authors declare no conflicts of interest.
Abbreviations
The following abbreviations are used in this manuscript:
| AI | Artificial Intelligence |
| SAC | Soft Actor-Critic |
| PER | Prioritized Experience Replay |
| A3C | Asynchronous Advantage Actor Critic |
| PPO | Proximal Policy Optimization |
| TD | Temporal Difference |
References
- Merzougui, S.E.; Limani, X.; Gavrielides, A.; Palazzi, C.E.; Marquez-Barja, J. Leveraging 5G Technology to Investigate Energy Consumption and CPU Load at the Edge in Vehicular Networks. World Electr. Veh. J. 2024, 15, 171. [Google Scholar] [CrossRef]
- Huo, Y.; Zhang, C. A Review of Key Technologies for Environment Sensing in Driverless Vehicles. World Electr. Veh. J. 2024, 15, 290. [Google Scholar] [CrossRef]
- Ministry of Industry and Information Technology. Vehicle Network (Intelligent Connected Vehicles) Industry Development Action Plan. Vehicle Network (Intelligent Connected Vehicles) Industry Development Action Plan. 2018, December 25, 2018.
- Dai, Z.; Guan, Z.; Chen, Q.; Xu, Y.; Sun, F. Enhanced Object Detection in Autonomous Vehicles through LiDAR—Camera Sensor Fusion. World Electr. Veh. J. 2024, 15, 297. [Google Scholar] [CrossRef]
- Cui, H.; Lei, J. An Algorithmic Study of Transformer-Based Road Scene Segmentation in Autonomous Driving. World Electr. Veh. J. 2024, 15, 516. [Google Scholar] [CrossRef]
- Lu, S.; Shi, W. Vehicle Computing: Vision and Challenges. Journal of Information and Intelligence. 2022. [Google Scholar] [CrossRef]
- Abbas, N.; Zhang, Y.; Taherkordi, A.; Skeie, T. Mobile Edge Computing: A Survey. IEEE Internet of Things Journal. 2018, 5, 450–465. [Google Scholar] [CrossRef]
- Chougule, S.B.; Chaudhari, B.S.; Ghorpade, S.N.; Zennaro, M. Exploring Computing Paradigms for Electric Vehicles: From Cloud to Edge Intelligence, Challenges and Future Directions. World Electr. Veh. J. 2024, 15, 39. [Google Scholar] [CrossRef]
- Lu, S.; Yao, Y.; Shi, W. CLONE: Collaborative Learning on the Edges. IEEE Internet of Things Journal 2021, 8, 10222–10236. [Google Scholar] [CrossRef]
- Haarnoja, T.; Zhou, A.; Abbeel, P.; Levine, S. Soft Actor-Critic: Off-Policy Maximum Entropy Deep Reinforcement Learning with a Stochastic Actor. ArXiv. 2018, abs/1801.01290.
- Schaul, T.; Quan, J.; Antonoglou, I.; Silver, D. Prioritized Experience Replay. CoRR. 2015, abs/1511.05952.
- Pang, X.; Jia, W.; Li, H.; Gao, Q.; Liu, W. A Bi-Objective Optimal Scheduling Method for the Charging and Discharging of EVs Considering the Uncertainty of Wind and Photovoltaic Output in the Context of Time-of-Use Electricity Price. World Electr. Veh. J. 2024, 15, 398. [Google Scholar] [CrossRef]
- Shuai, H.; Li, F.F.; Pulgar-Painemal, H.; Xue, Y. Branching Dueling Q-Network-Based Online Scheduling of a Microgrid With Distributed Energy Storage Systems. IEEE Transactions on Smart Grid. 2021, 12, 5479–5482. [Google Scholar] [CrossRef]
- Shuai, H.; He, H. Online Scheduling of a Residential Microgrid via Monte-Carlo Tree Search and a Learned Model. IEEE Transactions on Smart Grid. 2020, 12, 1073–1087. [Google Scholar] [CrossRef]
- Hossain, M.B.; Pokhrel, S.R.; Choi, J. Orchestrating Smart Grid Demand Response Operations With URLLC and MuZero Learning. IEEE Internet of Things Journal. 2024, 11, 6692–6704. [Google Scholar] [CrossRef]
- Meidyani, B.; Sarno, R.; Nurlaili, A.L. Time and cost optimization using scheduling job shop and linear goal programming model. 2018 International Conference on Information and Communications Technology (ICOIACT). 2018, 555–560. [Google Scholar]
- Nayak, D.; Martha, V.S.; Threm, D.; Ramaswamy, S.; Prince, S.; Fahrnberger, G. Adaptive scheduling in the cloud - SLA for Hadoop job scheduling. 2015 Science and Information Conference (SAI). 2015, 832–837. [Google Scholar]
- Li, T.; Cui, W.; Cui, N. Soft Actor-Critic Algorithm-Based Energy Management Strategy for Plug-In Hybrid Electric Vehicle. World Electr. Veh. J. 2022, 13, 193. [Google Scholar] [CrossRef]
- Liu, Y.; Zhu, Y.; Yu, S.; Wang, Z.; Li, Z.; Chen, C.; Yang, L.; Lin, Z. Optimal Scheduling of Integrated Energy System Considering Virtual Heat Storage and Electric Vehicles. World Electr. Veh. J. 2024, 15, 461. [Google Scholar] [CrossRef]
- Saleem, U.; Liu, Y.; Jangsher, S.; Li, Y.; Jiang, T. Mobility-Aware Joint Task Scheduling and Resource Allocation for Cooperative Mobile Edge Computing. IEEE Transactions on Wireless Communications. 2021, 20, 360–374. [Google Scholar] [CrossRef]
- Han, Z.; Tan, H.; Li, X.; Jiang, S.H.; Li, Y.; Lau, F. OnDisc: Online Latency-Sensitive Job Dispatching and Scheduling in Heterogeneous Edge-Clouds. IEEE/ACM Transactions on Networking. 2019, 27, 2472–2485. [Google Scholar] [CrossRef]
- Zhang, K.; Mao, Y.; Leng, S.; Zhao, Q.; Li, L.; Peng, X.; Pan, L.; Maharjan, S.; Zhang, Y. Energy-Efficient Offloading for Mobile Edge Computing in 5G Heterogeneous Networks. IEEE Access. 2016, 4, 5896–5907. [Google Scholar] [CrossRef]
- Li, Y.Y.; Fang, Y.; Qiu, L. Joint Computation Offloading and Communication Design for Secure UAV-Enabled MEC Systems. In 2021 IEEE Wireless Communications and Networking Conference (WCNC). IEEE Press. 2021, 1–6.
- Ullah, I.; Lim, HK.; Seok, YJ. Optimizing task offloading and resource allocation in edge-cloud networks: a DRL approach. J Cloud Comp. 2023, 12, 112. [Google Scholar] [CrossRef]
- Nam, D. H. A Comparative Study of Mobile Cloud Computing, Mobile Edge Computing, and Mobile Edge Cloud Computing. Proceedings of CSCE 60160. 2023. [Google Scholar] [CrossRef]
- Tang, X.; Cao, C.; Wang, Y.; Zhang, S.; Liu, Y.; Li, M.; He, T. Computing power network: The architecture of convergence of computing and networking towards 6G requirement. China Communications 2021, 18, 175–185. [Google Scholar] [CrossRef]
- Andriulo, F.C.; Fiore, M.; Mongiello, M.; Traversa, E.; Zizzo, V. Edge Computing and Cloud Computing for Internet of Things: A Review. Informatics 2024, 11, 71. [Google Scholar] [CrossRef]
- Schulman, J.; Wolski, F.; Dhariwal, P.; Radford, A.; Klimov, O. Proximal Policy Optimization Algorithms. ArXiv. 2017, abs/1707.06347.
| 1 | Computing Power Units:1 KFLOPS = FLOPS, 1MFLOPS = FLOPS, 1GFLOPS = FLOPS, 1TFLOPS = FLOPS,1PFLOPS = FLOPS, 1EFLOPS = FLOPS |
Figure 1.
System Architecture.
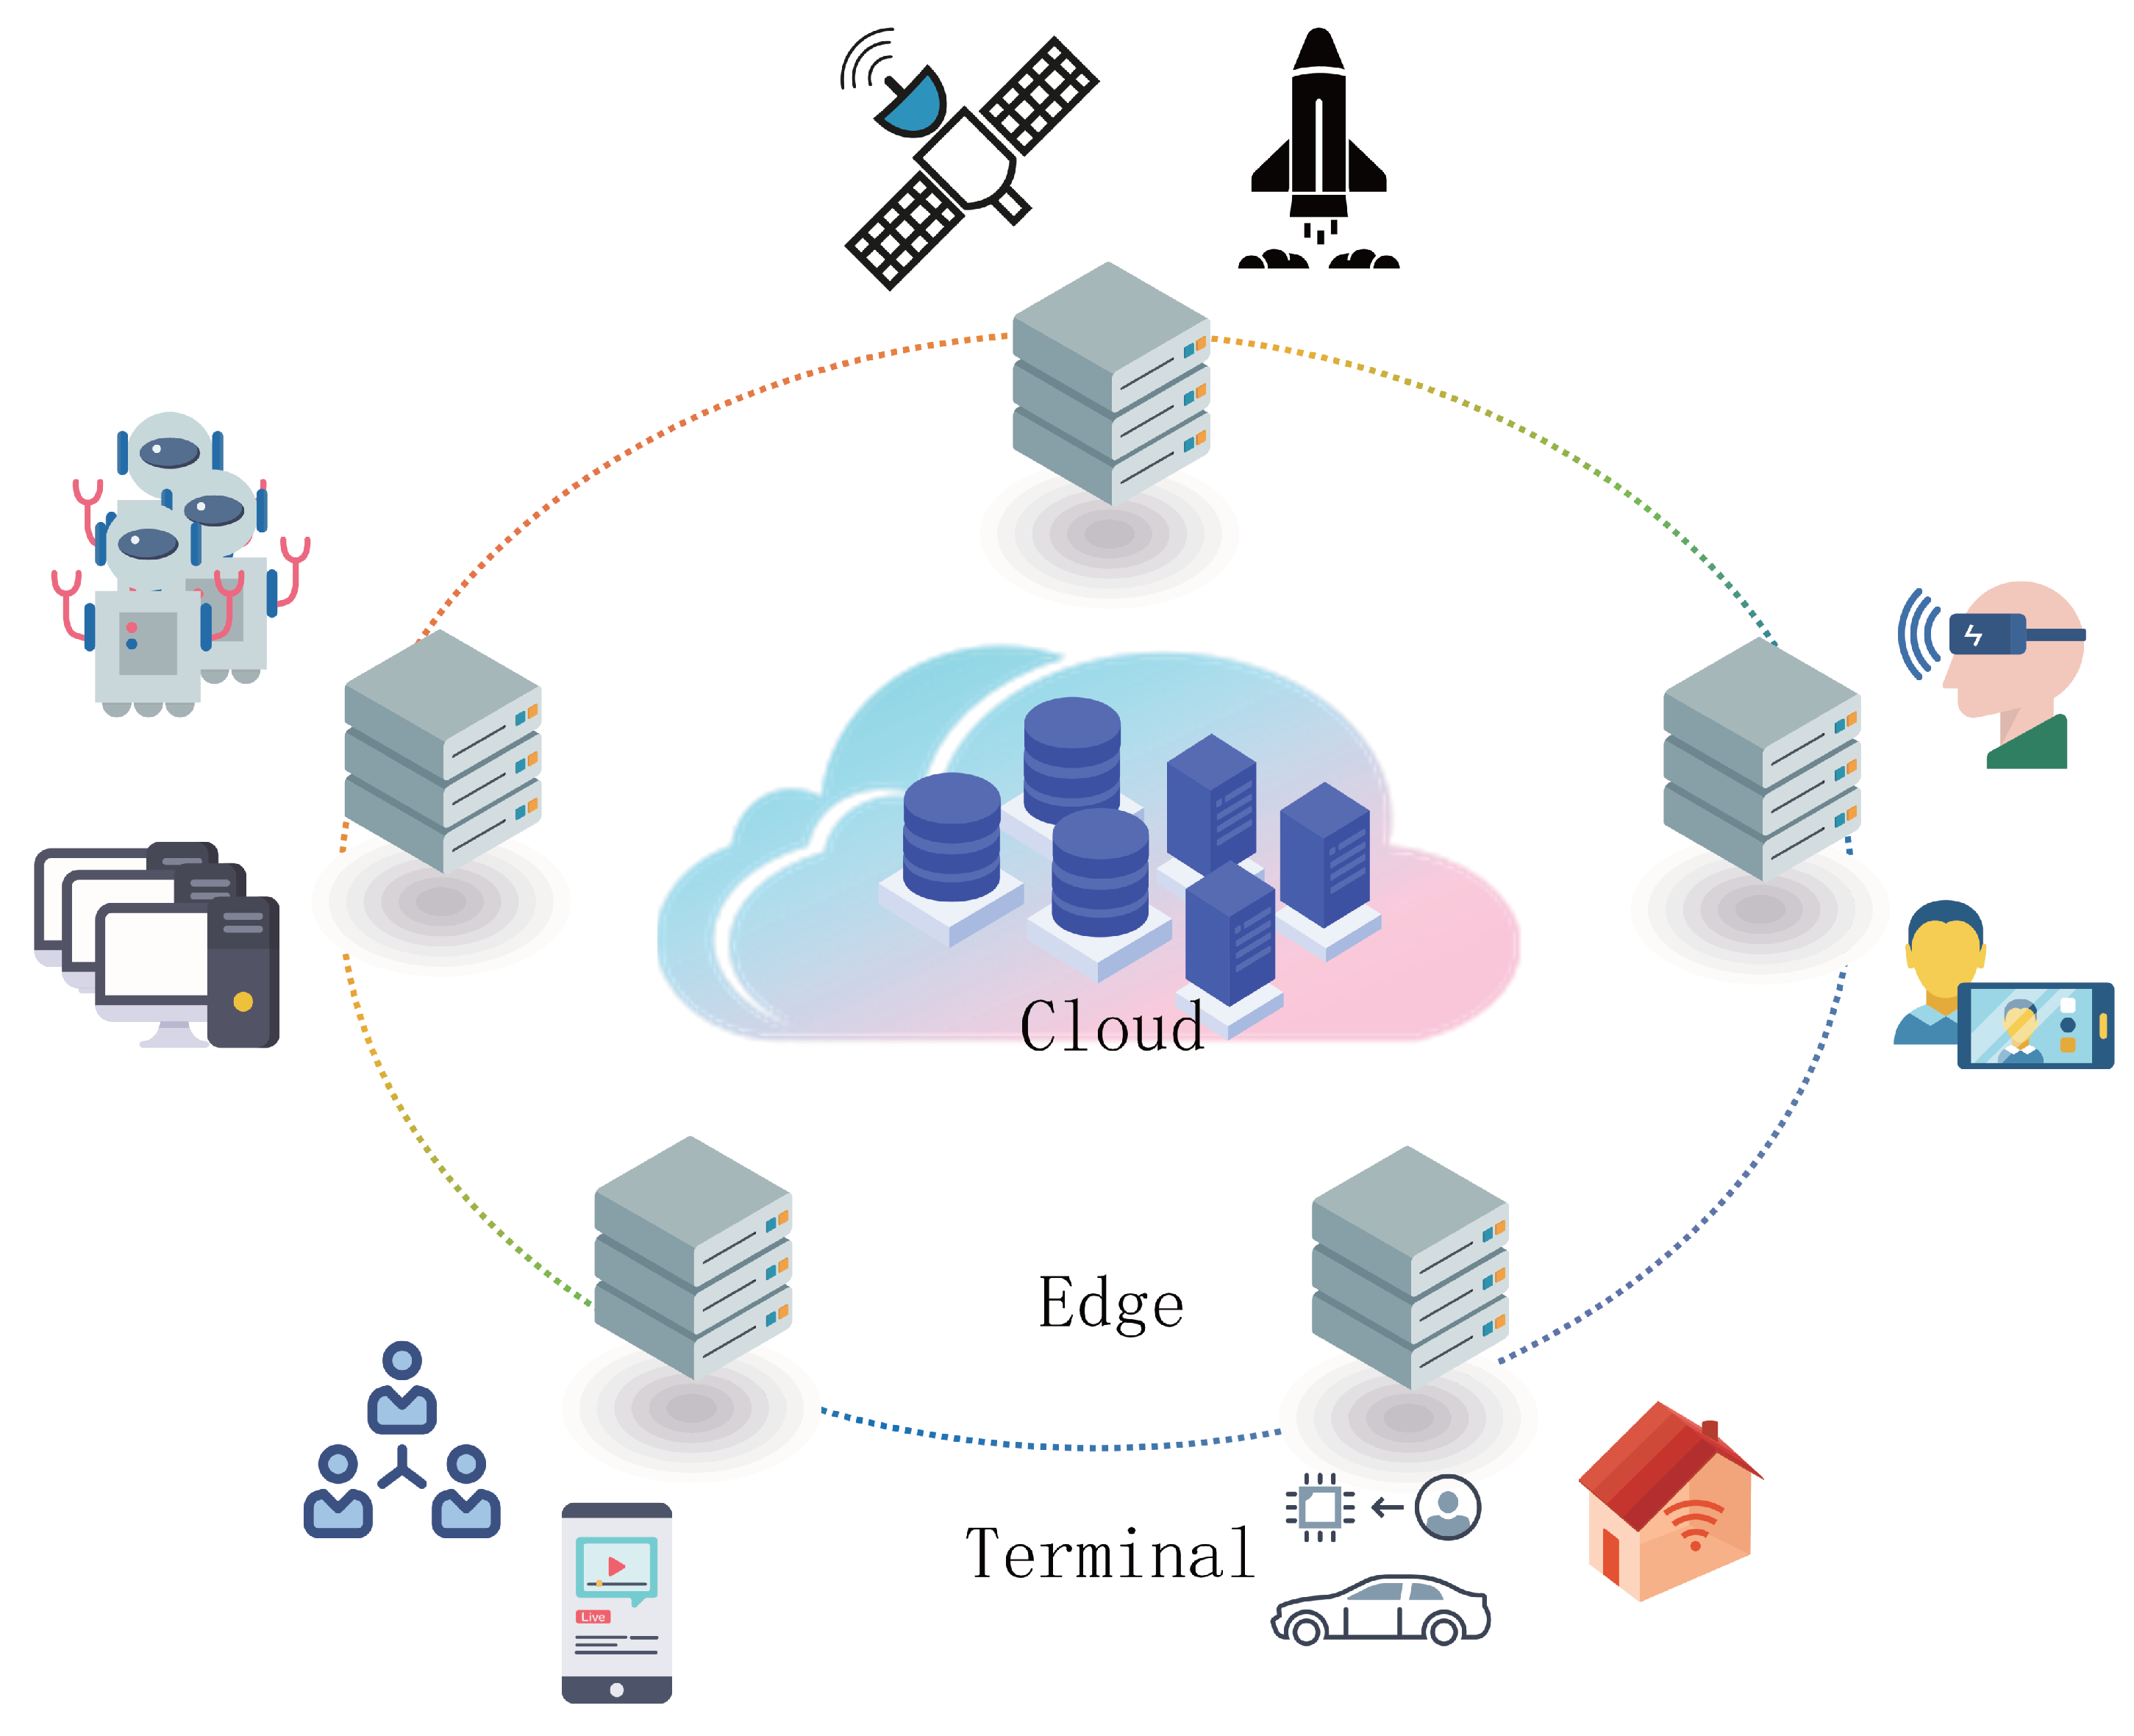
Figure 2.
Computing Power Allocation System.
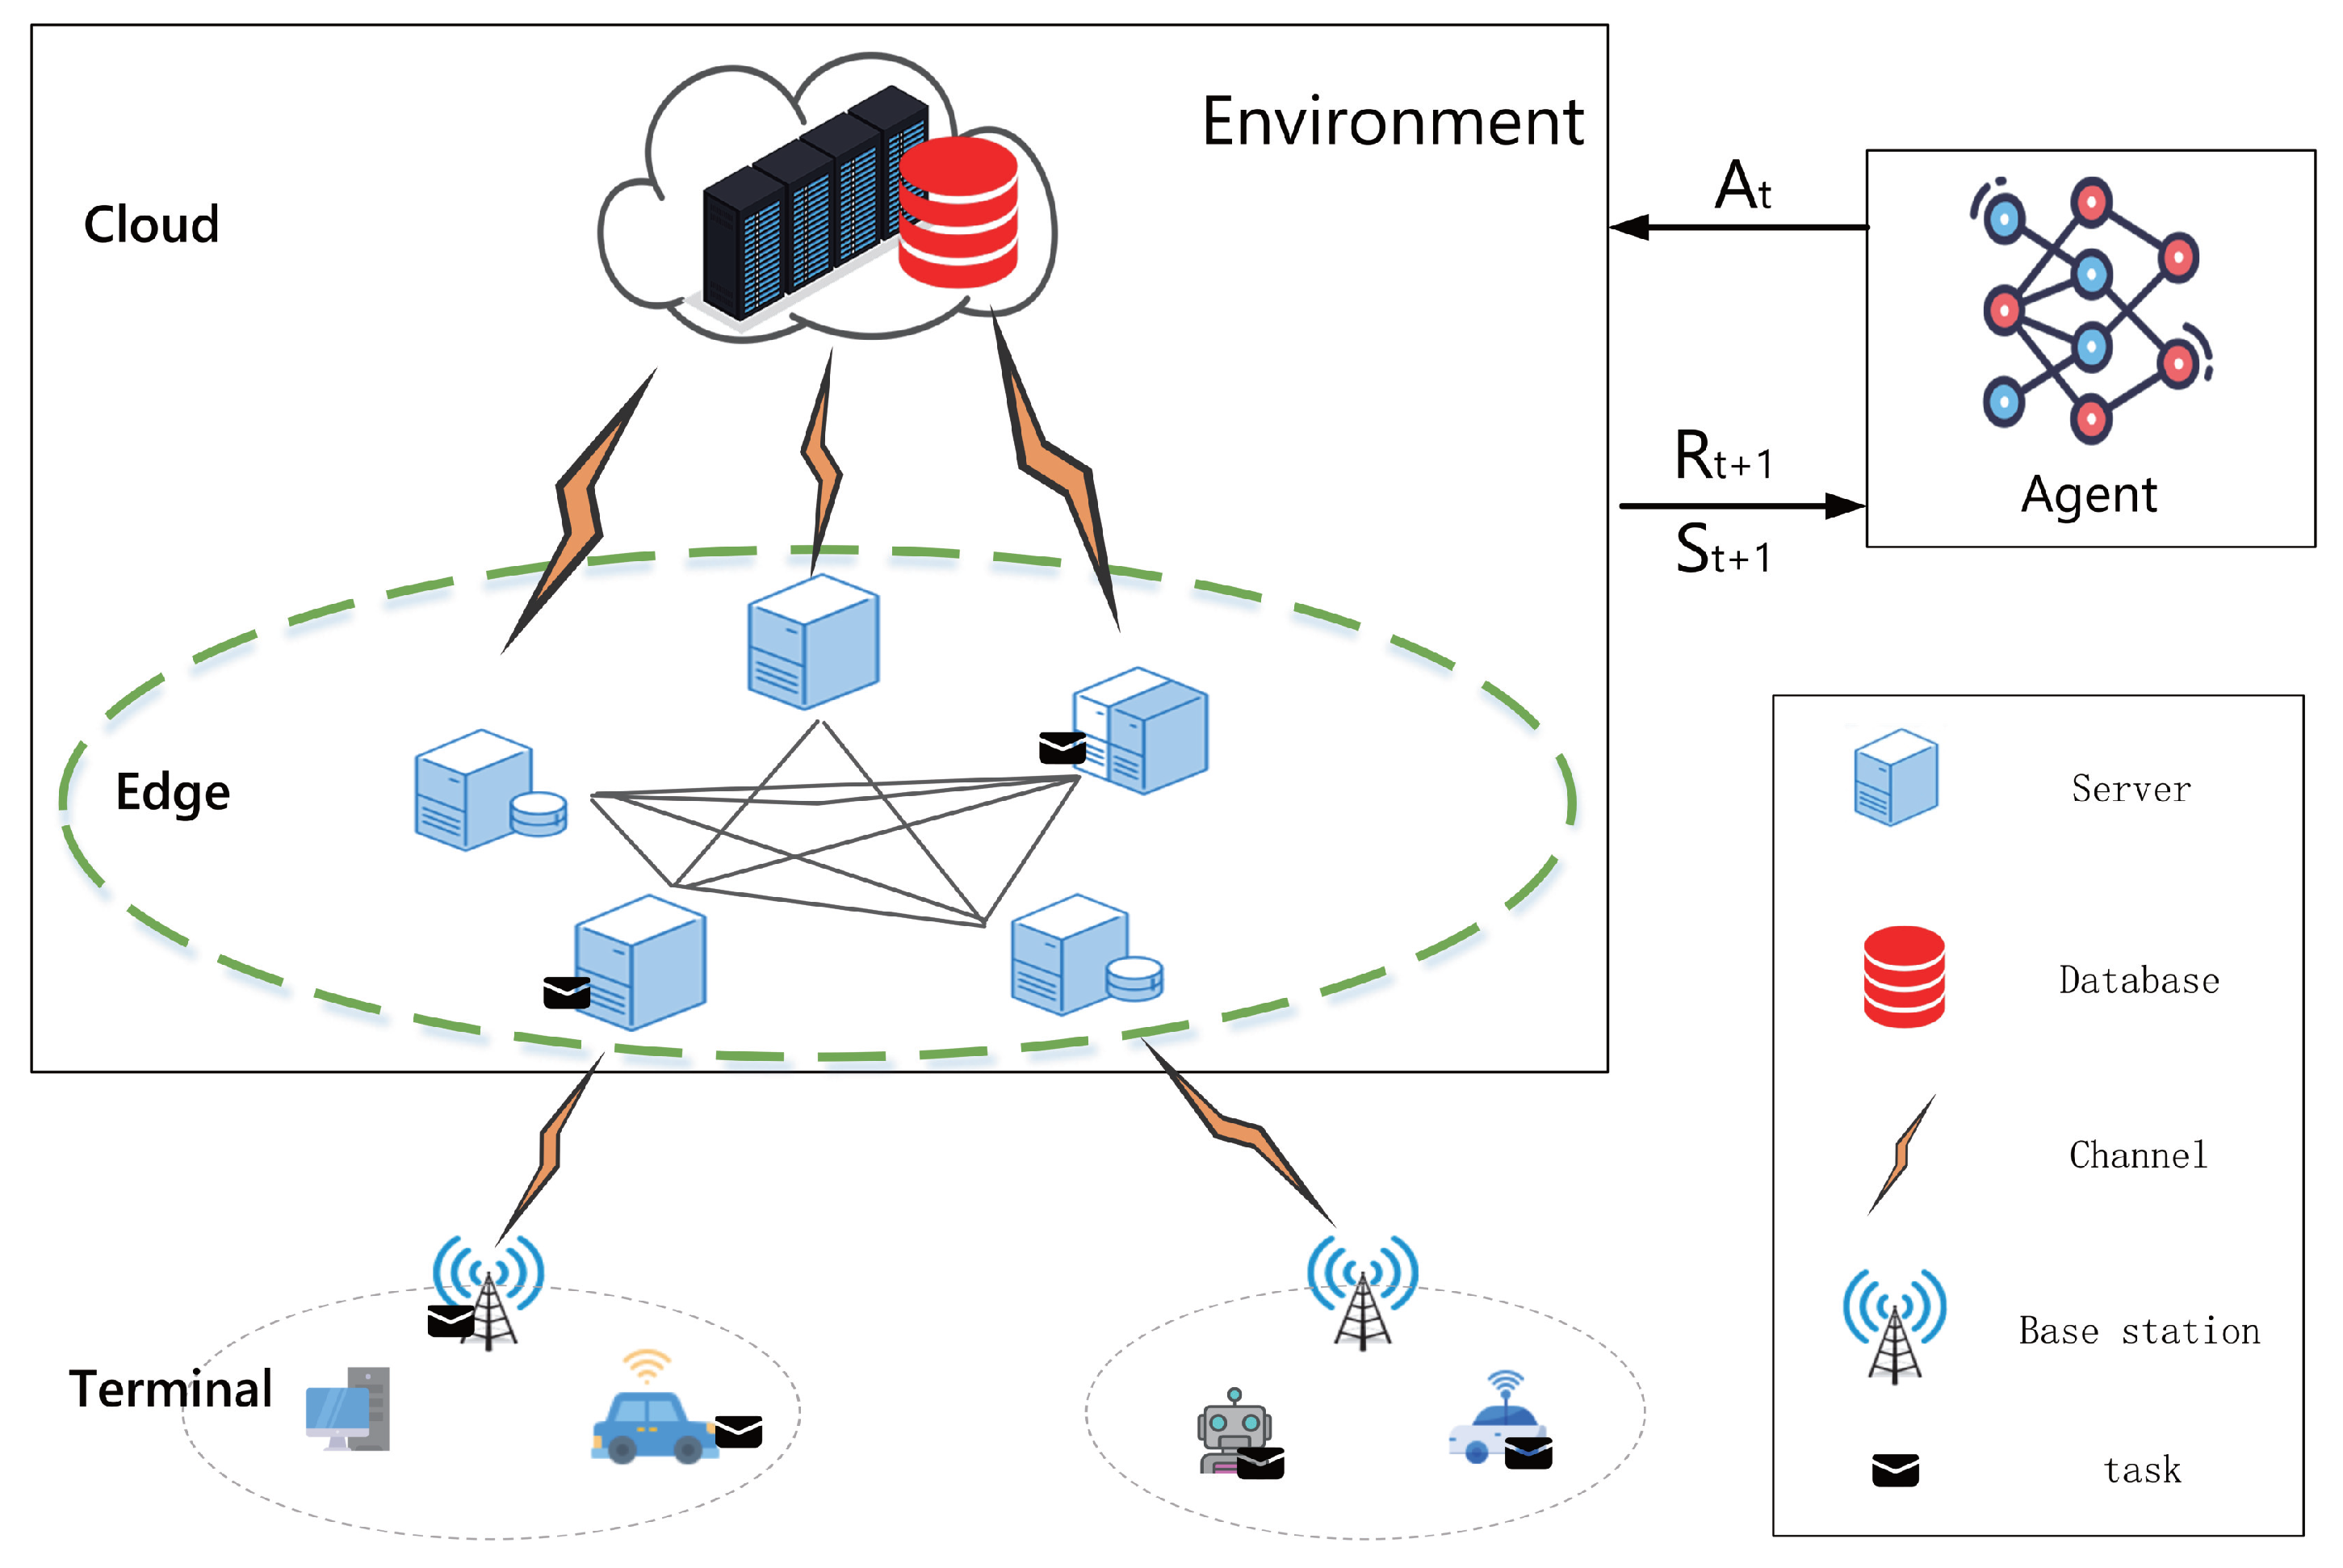
Figure 3.
iSAC Algorithm Architecture.
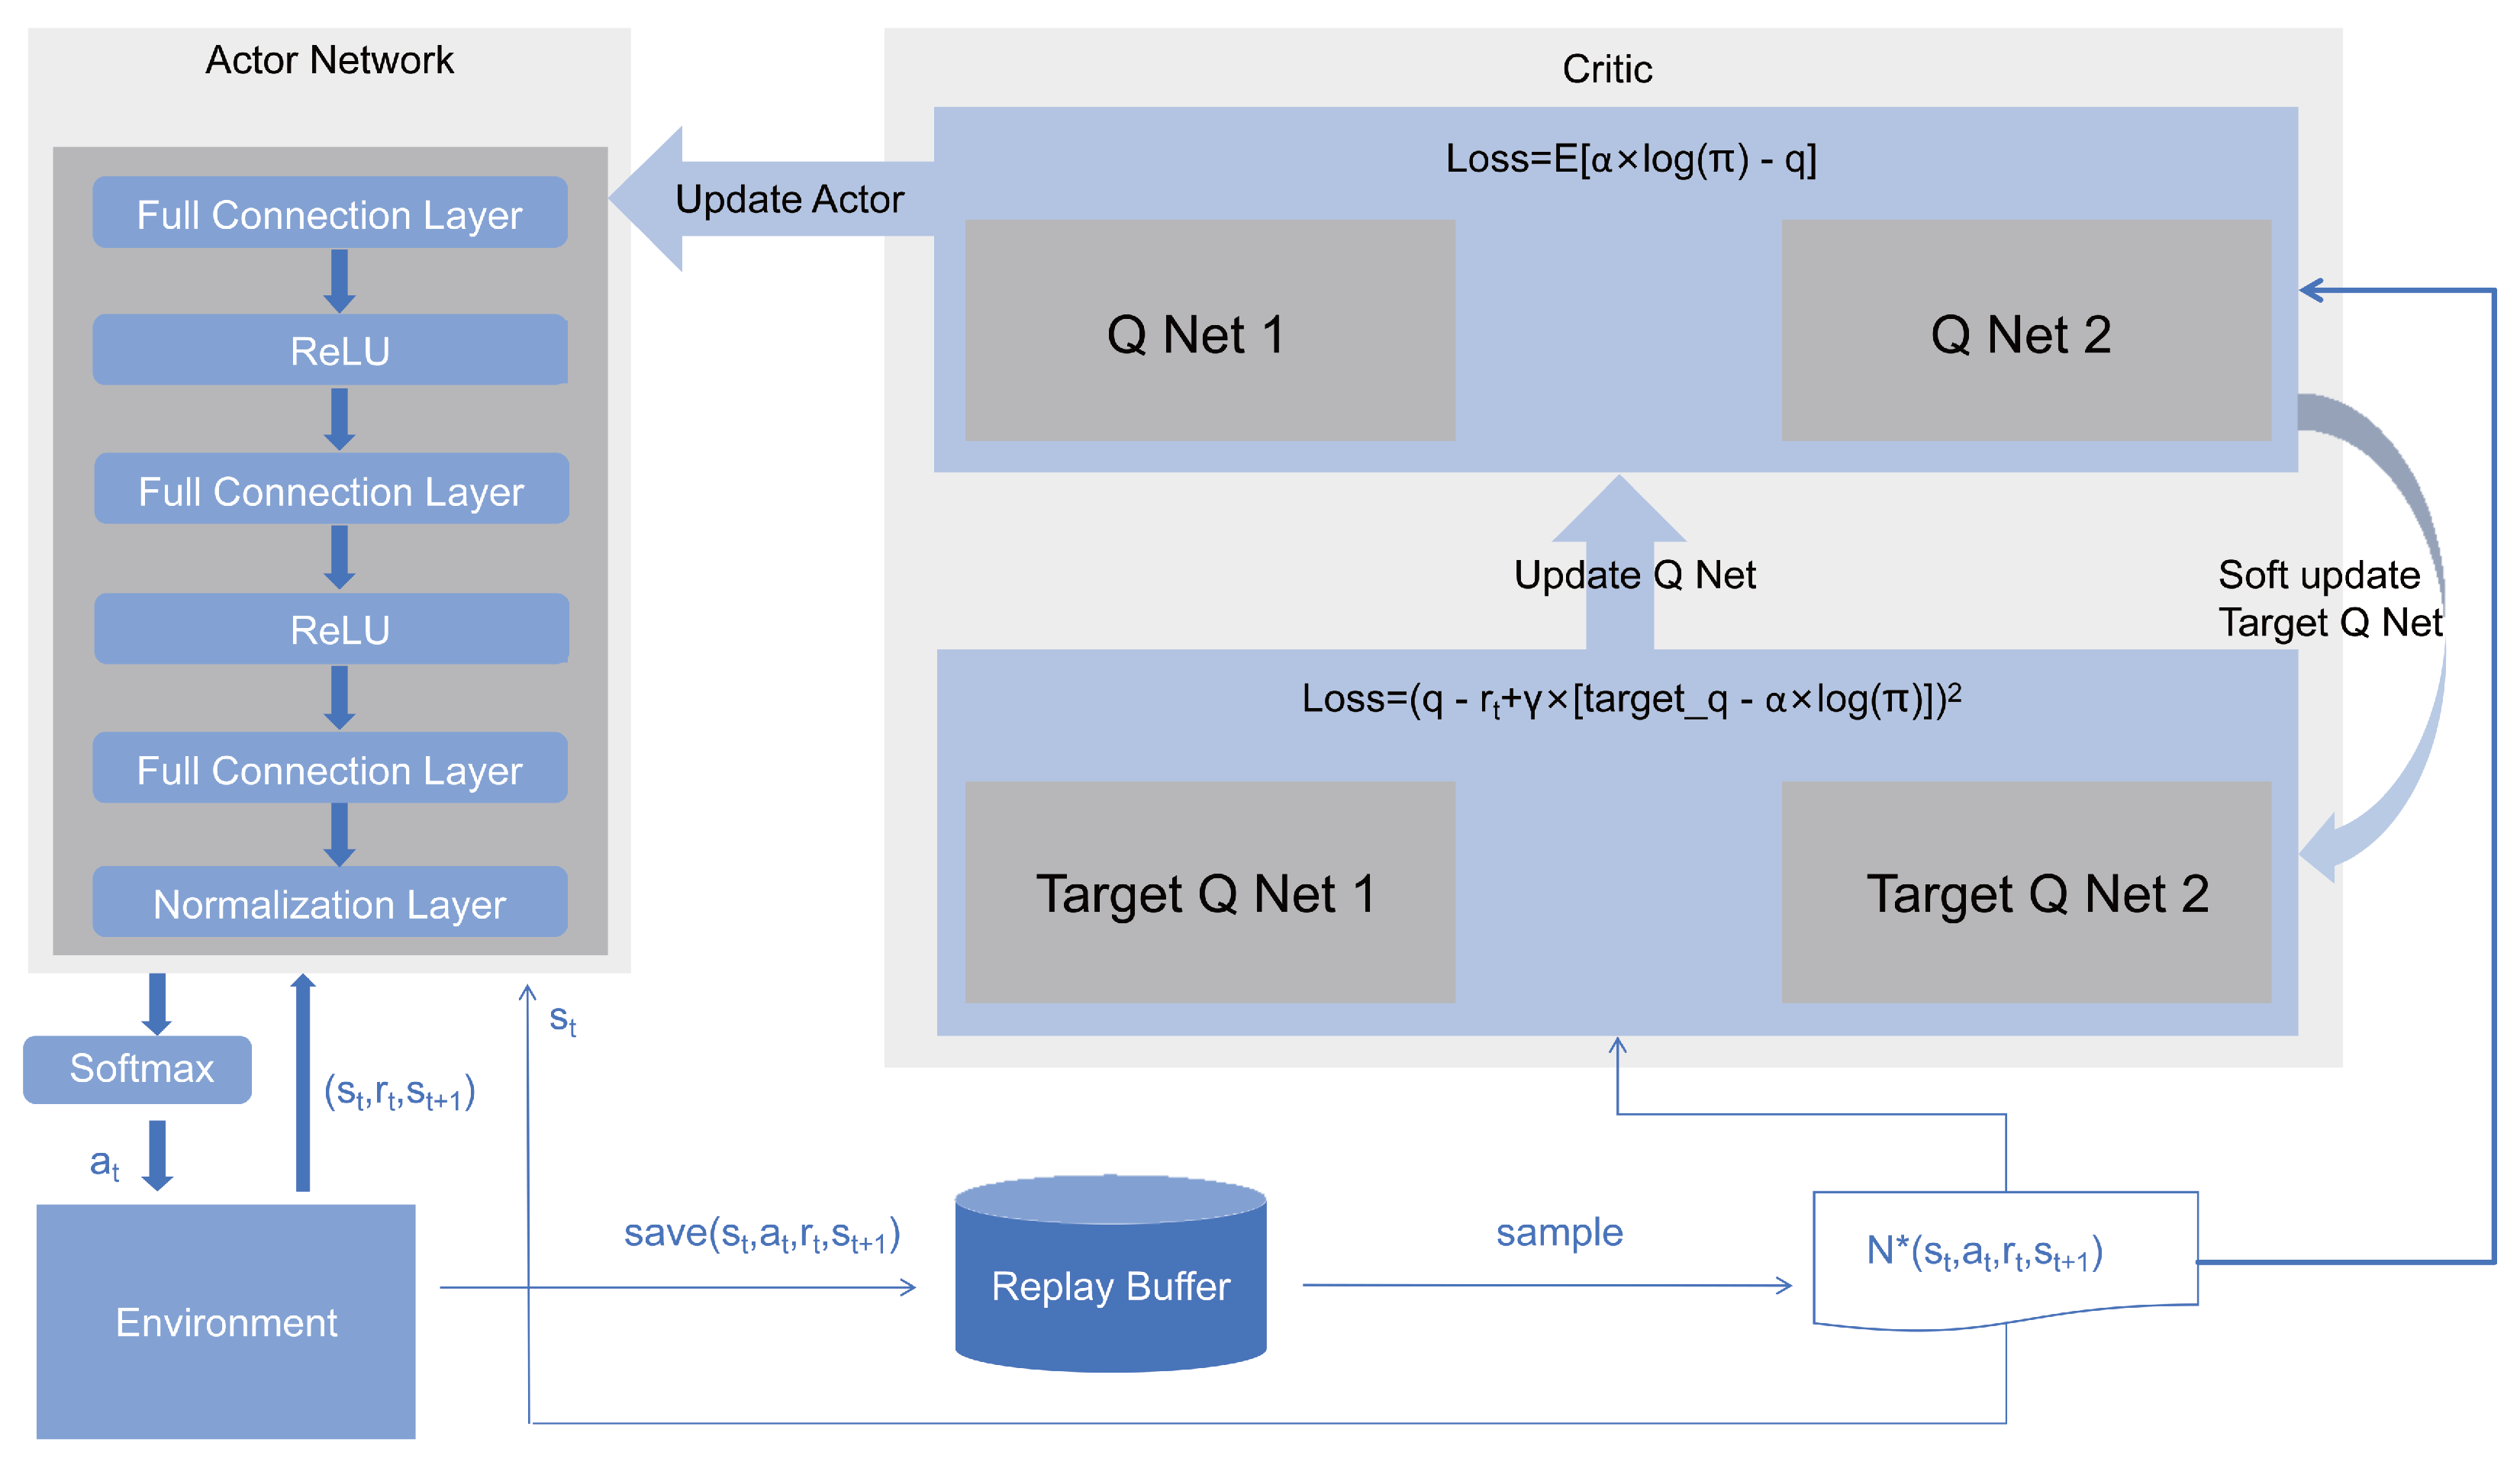
Figure 4.
Training Convergence Plot.
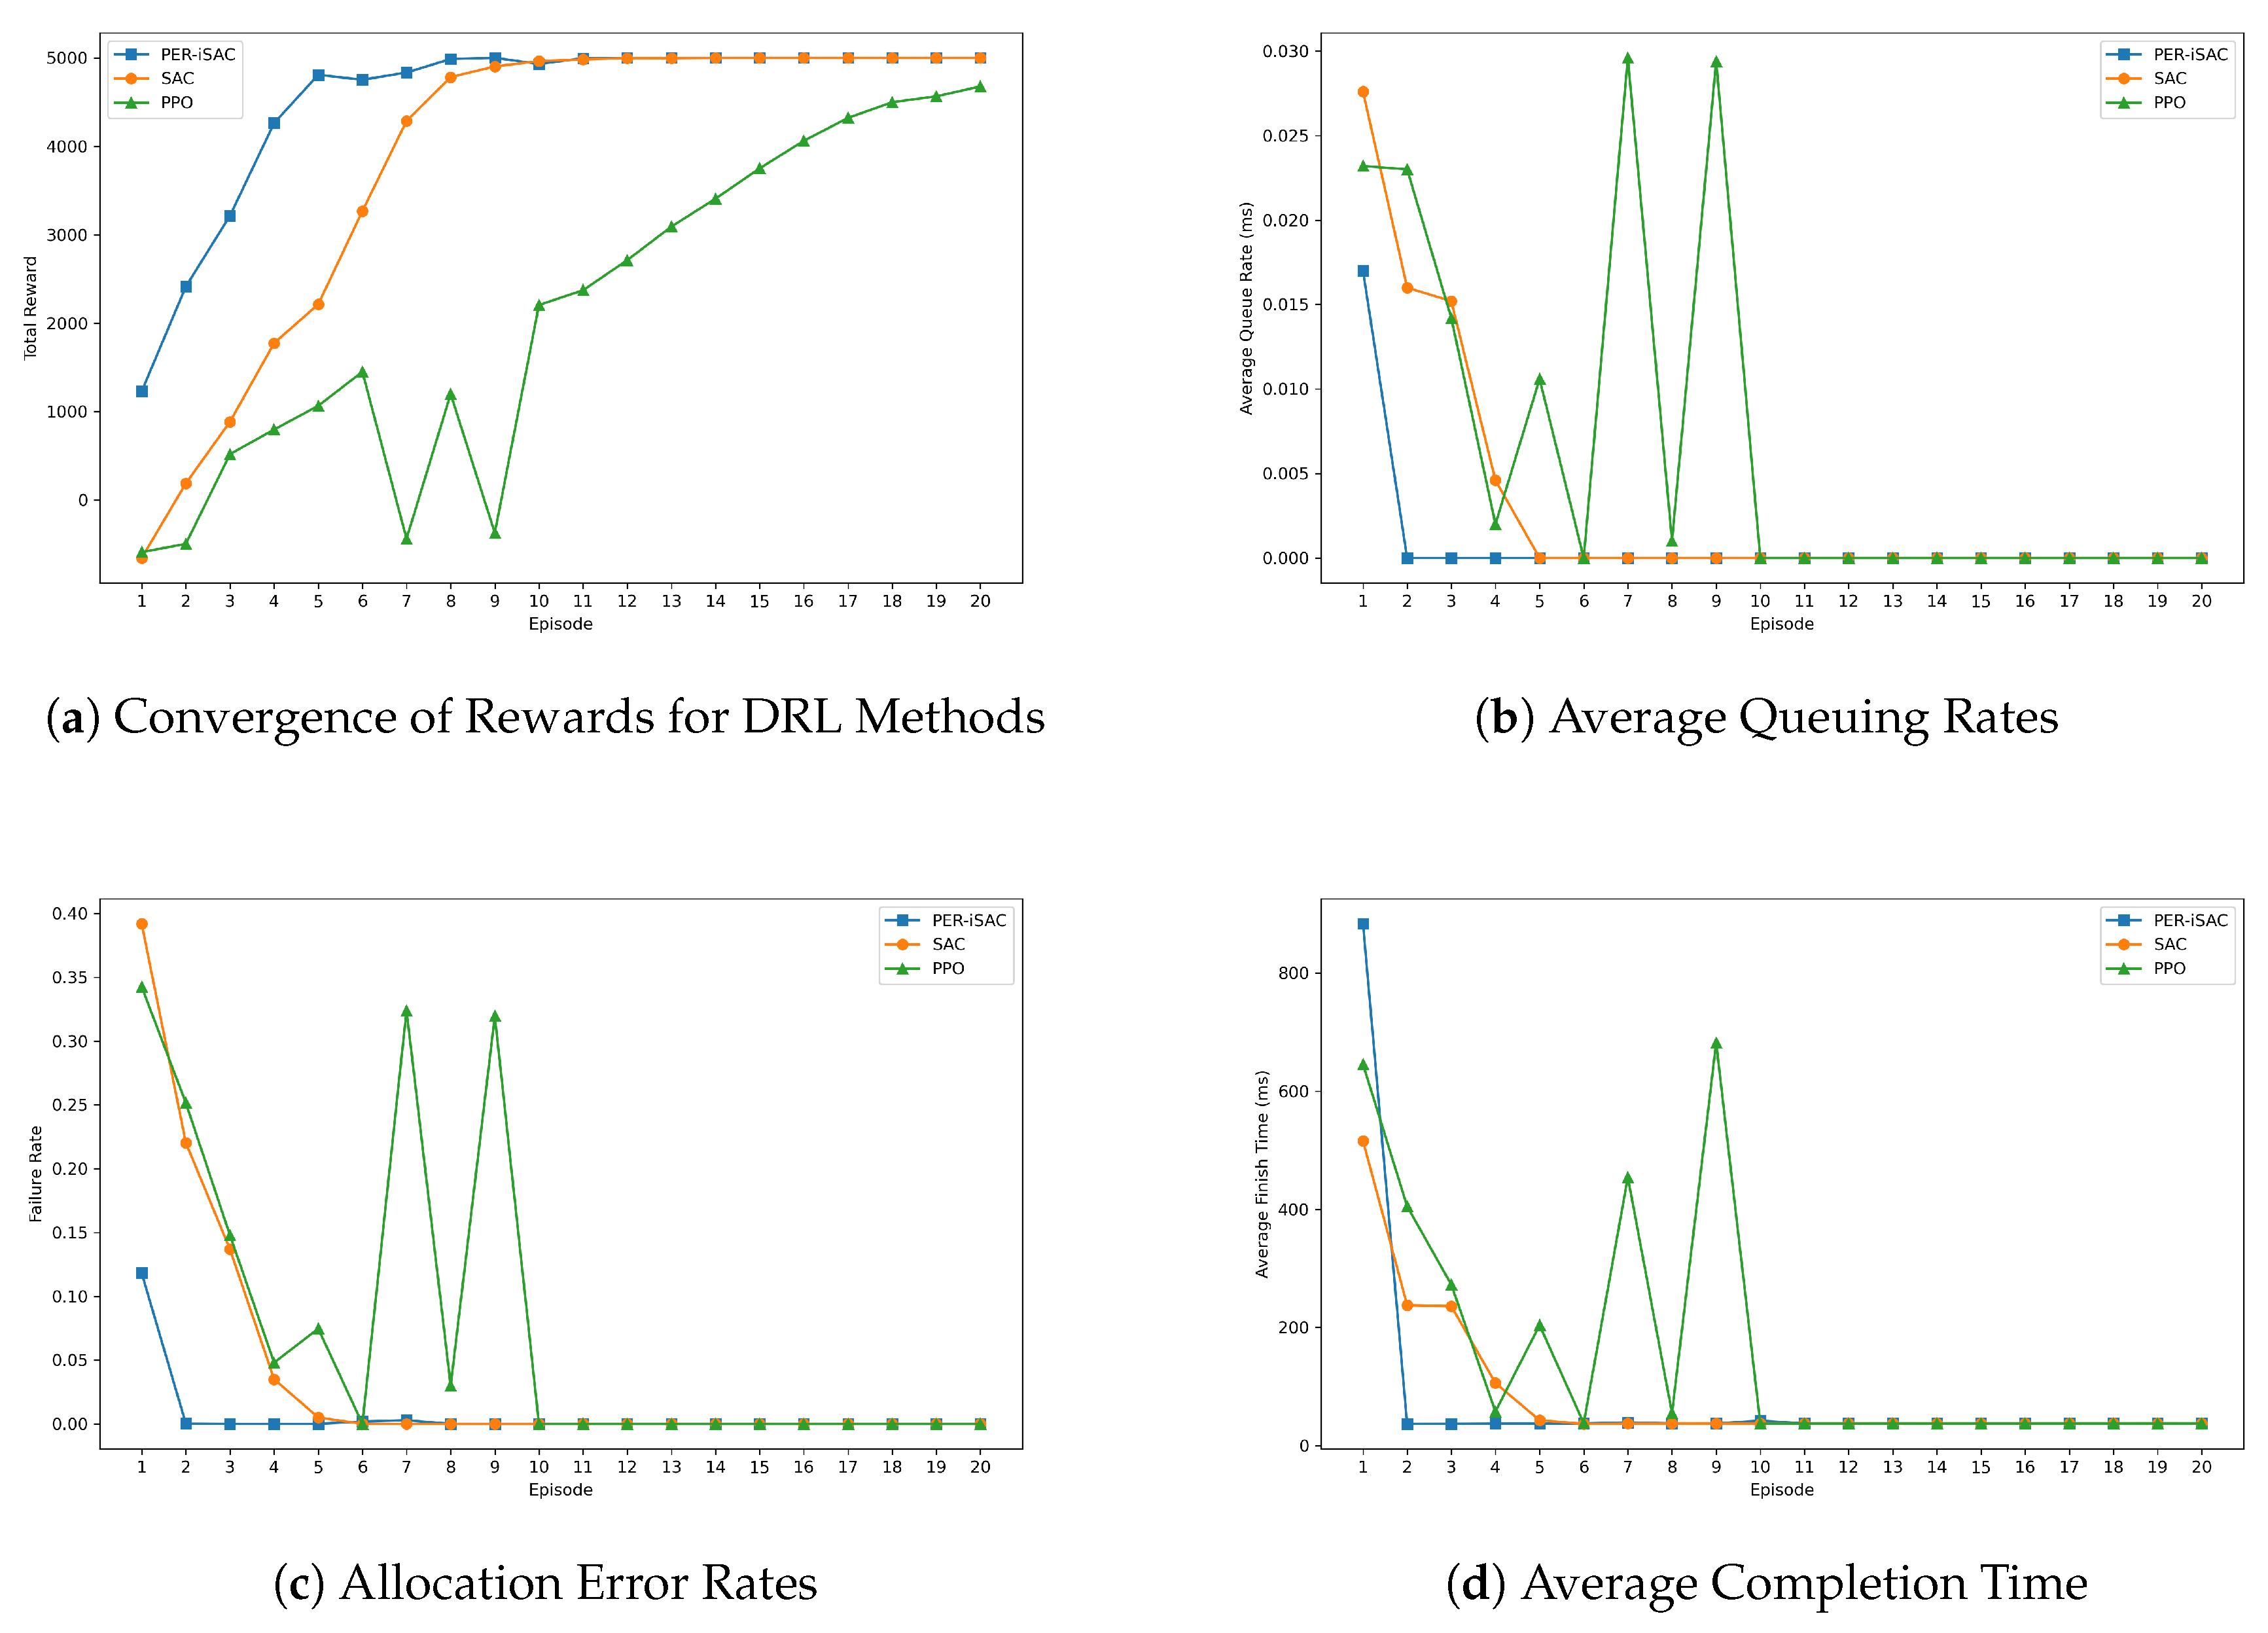
Figure 5.
Server Selection Frequency Statistics.
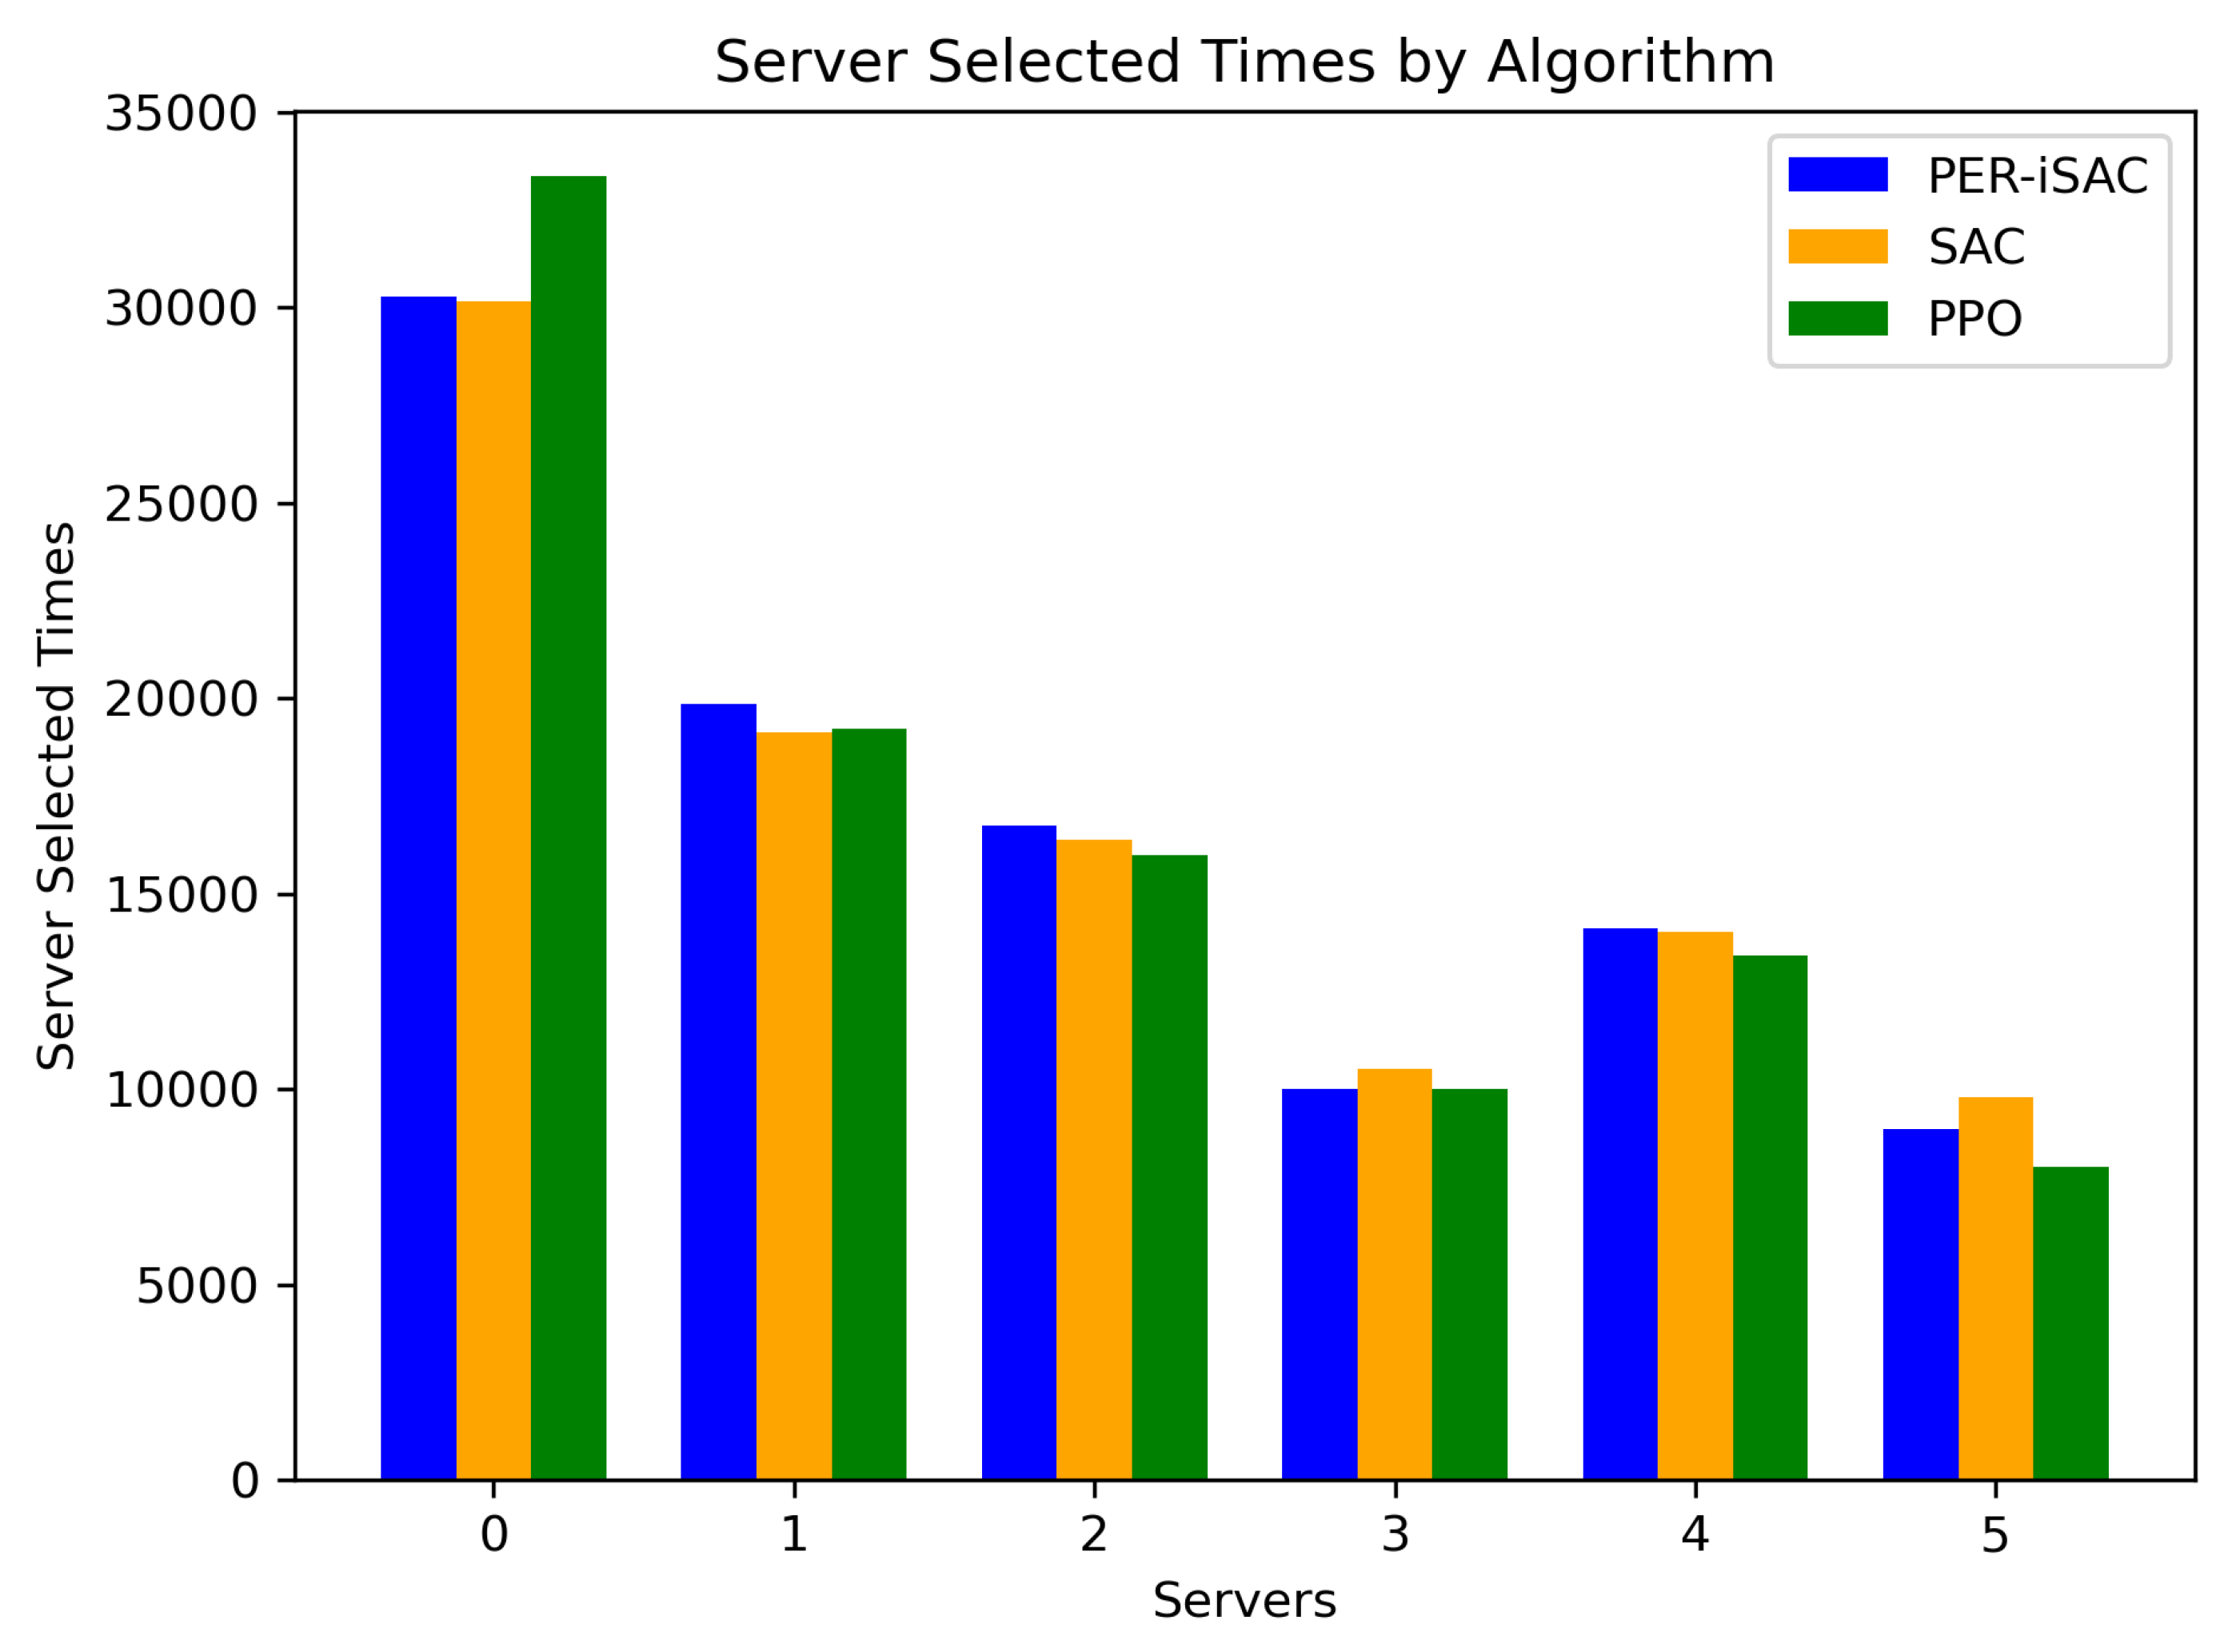
Figure 6.
Average Completion Time for Different Task Sizes.
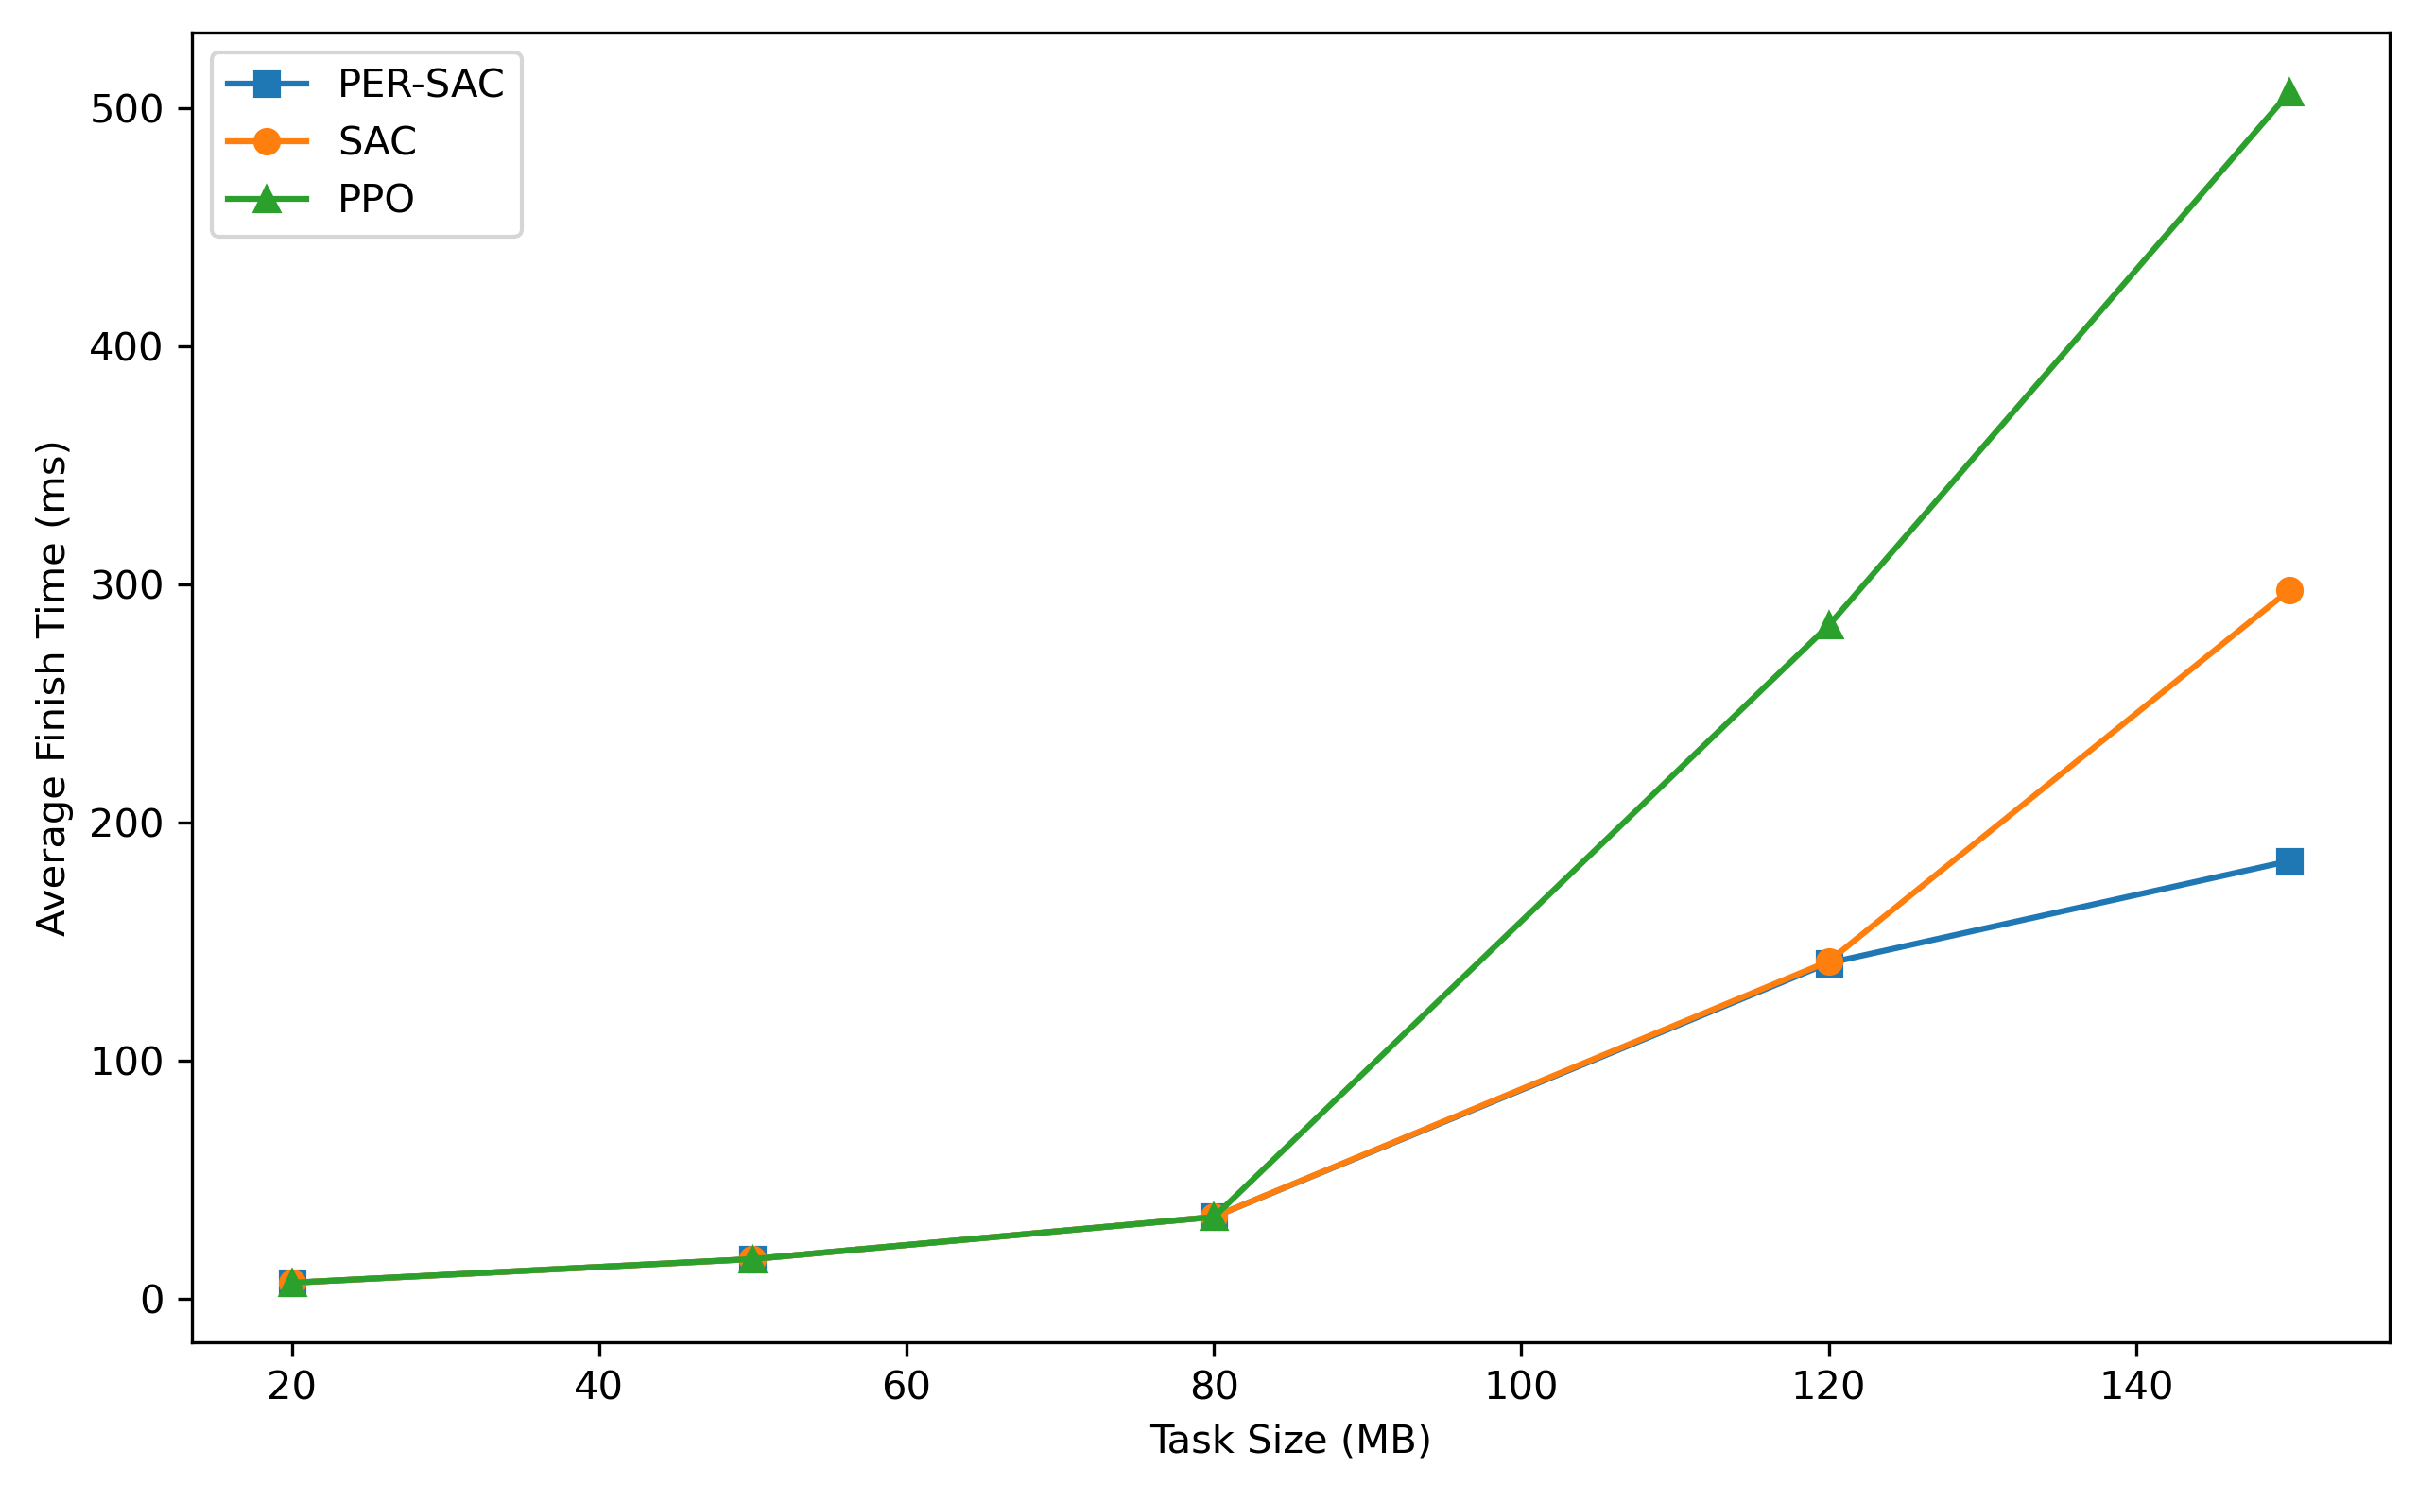

Table 1.
Main performance indicators of the edge servers.
| Servers | GPU Computing Power(TFLOPS) | GPU Storage(GB) | Idle Load Power(W) | Full Load Power(W) |
|---|---|---|---|---|
| S0 | 200~250 | 32 | 300~500 | 500~1000 |
| S1 | 140~160 | 24 | 150~350 | 350~500 |
| S2 | 130~150 | 24 | 150~300 | 300~500 |
| S3 | 100~120 | 16 | 50~150 | 200~450 |
| S4 | 110~130 | 16 | 50~150 | 200~500 |
| S5 | 100~120 | 8 | 50~100 | 150~300 |
Table 2.
Simulation Parameters.
| Parameters | Values |
|---|---|
| Computing Power Requirement | 200~4000 GFLOPs |
| Image Data Size | 4.8~160 MB |
| Model Data Size | 10~500 MB |
| Task Result Coefficient1 | 0.1~0.3 |
| Completion Time Coefficient2 | 1.2~1.5 |
| Link Speed | 5G: 100 Mbps~10 GbpsOptical Fiber Network: 200~400 Gbps |
| Communication Range | 10~500 m |
| Communication Delay | 1~2 ms |
1 The task result is 0.1 to 0.3 times the original task data size. 2 the task deadline is 1.2 to 1.5 times the task completion time.
Disclaimer/Publisher’s Note: The statements, opinions and data contained in all publications are solely those of the individual author(s) and contributor(s) and not of MDPI and/or the editor(s). MDPI and/or the editor(s) disclaim responsibility for any injury to people or property resulting from any ideas, methods, instructions or products referred to in the content. |
© 2025 by the authors. Licensee MDPI, Basel, Switzerland. This article is an open access article distributed under the terms and conditions of the Creative Commons Attribution (CC BY) license (http://creativecommons.org/licenses/by/4.0/).
Copyright: This open access article is published under a Creative Commons CC BY 4.0 license, which permit the free download, distribution, and reuse, provided that the author and preprint are cited in any reuse.


