
Submitted:
25 April 2025
Posted:
28 April 2025
You are already at the latest version
Abstract
The Southeastern European country of Romania is among the most seismically active throughout the continent and currently faces a substantial seismic risk, particularly in the Vrancea region, which accounts for approximately 90% of the earthquakes. The present study evaluates the value of the statistical probability that a Richter Magnitude 8+ earthquake will occur in the area utilising the Poisson method, and introduces a novel statistical approach for approximating intervals of recurrence. The Gutenberg–Richter law, covered by the log 10 N = a − b * M formula, describes an exponential decline in earthquake frequency with increasing magnitude, typically characterized by b ≈ 1.0 in active tectonic regions. Inverting this frequency (1 / N) highlights the relative prevalence of lower-magnitude events. For the Vrancea seismic zone, provisional inverted recurrence frequencies are estimated at 0.10 for M6.0, 0.08 for M6.5, 0.03 for M7.0, 0.01 for M7.5, 0.005 for M8.0, 0.0014 for M8.5, 0.0004 for M9.0, 0.00008 for M9.5, and 0.00001 for M10.0. These figures suggest a roughly tenfold decrease in earthquake occurrence with each unit increase in magnitude, consistent with regional b-values between 0.94 and 1.0 reported in Vrancea seismicity studies. Additionally, the N [M(x+0.5)] = 2 * N (Mx) + 14 * (n0) heuristic formula may apply for the M7 - M7.8 magnitude range in Vrancea, in which N is equal to the number of years and 6.5 < x < 7.3. Recent megathrust earthquakes, such as the 2015 M7.8 Nepal, as well as the 2023 M7.8, M7.5 and M6.7 Türkiye events - which were followed by a M5.7 earthquake ten days afterward, as well as numerous aftershocks, in the Southwestern Carpathians - have possibly displayed a potential for long-range dynamic and static stress perturbations exceeding 1,500 km, as any seismic event of scales from M7.5 above are typically capable of sending waves of tectonic stress above 1,500 kilometres afar. These may influence seismic behavior across distant fault systems, including the Carpathian–Alpine region, through indirect stress transfer mechanisms. Notably, geodetic measurements around Mount Everest suggest an uplift of approximately 4 meters by 1995, followed by a reported drop in elevation post-2015, potentially illustrating the complex tectonic adjustments following major seismic events. An analogy into geology may apply from biological systems, in which tectonic stresses can be transferred throughout lengthy distances, just as muscular contractions can significantly affect distant parts of the human body, and particularly the ones with a lower extent of stability. In the same manner, areas of significant mountain ring curvature that likely include the Vrancea region, may be particularly affected by any transmitted wave of seismic stress, regardless of the distance from the emitting source of such stress. Furthermore, the continuous movement of the African plate toward the Eurasian plate with an average speed of 2.15 cm per year could also have been gradually amplifying existing transfers of tectonic stress via the African, Asian and European plates, potentially having brought additional, indirect implications for both Asia Minor and Southeastern Europe, and the consideration of long-term tectonic changes around the Eastern Mediterranean would be particularly important. For the purpose of International Health and Safety guidelines, local, national and international authorities should not rule out the occurrence of an earthquake with a magnitude of up to M9, given the lack of historic data regarding the occurrence of an M8.5+ earthquake within the past 800 years [N (M8.5) ~ 700 years, threshold level of significant probability at 60%, maximum probability of ~63% resulted from seismic stress transfers], let alone since records first began around 800 years ago. Provisional statistical modelling estimated an overall capped probability of 75-80% that an M8+ event will occur in Vrancea, Romania, within the next several years - visibly exceeding the 60% threshold of statistical concern. Any seismic event reaching and exceeding M8 in Vrancea would likely be felt throughout widespread areas of Europe, and the medium-high average depth of earthquakes in Vrancea (i.e. generally around 65-190 km underneath the sea level) would be a major factor to such a phenomenon. Such overall findings underscore the importance of integrating regional recurrence modeling with broader geodynamic interactions in future seismic hazard assessments.
Keywords:
geostatistics
; Poisson
; Gutenberg
; Richter
; Mercalli
; probability
; p-value
; chi-squared test
; T-test
; ANOVA
; Romania
; Europe
; tectonic plate
; continental interaction
; tectonic stress
; transfer
; mountain ring
; helium
; magnitude
; depth
; duration
; epicentre
; aftershock
; interest
; Einstein
; Newton
; thermodynamics
; energy
; electromagnetics
; gravity
Introduction
Europe represents one of the smallest world’s continents that paradoxically has several geographic areas where significant seismic activity occurs frequently and oftentimes intensely, particularly in regions that are more proximal to the intercontinental plates. For example, the European area of Turkey is at the highest risk of major seismic activity, partially due to the proximity of the Istanbul area to the Eurasian plate. It is likely that the Balkan Peninsula and/or surrounding areas, such as the Carpathian ring of mountains, are situated at the second or third place with regards to the frequency and intensity of recurring seismic activity. Some geological studies suggest that the Vrancea region of Romania, which is located in the Southeastern area of the Carpathian mountains, represents the second most seismically active region of the continent. Although awareness has been raised for multiple times to the local and national authorities within the important local administrations and Ministry of Internal Affairs respectively, the current level of preparedness for the onset of a high intensity earthquake (M7+) seems to have remained deficient in nature, despite the fact that it has considerably increased within the past few years alone. Given the fact that the Vrancea region of Romania is situated in South-Eastern Europe, at approximately 280 miles (450 kilometres) distance from the natural border between Europe and Asia, in the area of Istanbul, Turkey, which is deemed as the most seismically active region of the continent - particularly at the level of earthquake intensity, rather than frequency - it would be rational to pre-emptively hypothesise and even theorise that Romania would be at a second or third highest risk of seismic disasters, given its rich history of earthquakes, combined with the geological features of the country that favour a recurring onset of major seismic activity. It is also highly important to mention the relatively proximal distance between both the Southeastern Carpathian mountains, which are located within the Alpine-Himalayan belt of mountains, and the African plate, as well as between the African and the Eurasian plates, which may only raise a real-world data-based probability that a larger-scale earthquake will eventually occur in Romania due to indirect transfers of tectonic stress that may have been occurring as a result of the existence of a relationship of tectonic interdependence between various, proximal and more distant plates, and it may be that areas of curvature are most vulnerable and likewise, most prone to seismic incidents, just as in the human organism, powerful muscular contractions and induced damages may bring consequences upon more distant areas of the organism that could also involve elements from other systems of organs, and just as there is an existing relationship of interdependence with regards to electromagnetic and even gravitational influences between various celestial bodies that are often separated by a tremendous physical distance. With regards to movements of different continental plates, it might be worth noting the example of Pakistan, India, Nepal and East Africa, in which the highest mountains in the world were developed as an effect of a tremendous clash between the Indian and the Asian plates, after the Indian plate moved from an area currently known to be within Eastern Africa, to the Eurasian plate. The ongoing tectonic pressure exerted by the Indian plate upon the Eurasian plate, which is displayed by the recorded increase of altitude of the Everest Mount from 8848 m to 8852 m above sea level in 1999, may also increase the extent of tectonic stress transfer upon the Himalayan-Alpine belt, and implicitly, the Southeastern curvature of the Carpathian Mountains, whose major tectonic fault may have acted as a barrier, preventing tectonic stress from reaching more Central areas of Europe, if not significantly attenuating its influence. Interestingly, the earthquake of Nepal that occurred in 2015 and had a Richter Magnitude of 7.8 was followed by an event in which Mount Everest lost approximately 3 metres in altitude. One may hope that seismic events as such do not induce or contribute to any long-term domino effect(s) of stress upon tectonic plates underneath the mountains of Turkey, the Balkan Peninsula and the Carpathians. With regards to any tectonic relationship between Europe and Africa, it is important to mention that the African plate is also moving toward the Eurasian plate at an average speed of 2,15 centimetres per year, reinforcing fears that unprecedented seismic events will eventually occur in South-Eastern Europe, as the Magnitude 7.8 quake in Turkey on the 4th of February 2023, as well as its powerful Magnitude 7.5 aftershock, was capable of sending tectonic stress to distances above 1,500km, with the other aftershock of M6.7 also having potentially distributed further tectonic stress throughout Türkiye. Interestingly, on the 14th of February 2023, an M5.7 earthquake occurred in Gorj, Southwestern Romania, at a depth of around 20 km below the sea level and a distance of approximately 300 kilometres West from Vrancea. Such a seismic event was followed by numerous aftershocks, which altogether may have covered the creation of a novel fault under the Carpathian Mountains. It may be that such a sudden event, in a less expected geographic area, did not randomly occur, but actually due to an existing phenomenon of seismic stress transfers. Furthermore, it may be statistically probable that there will be a M8.5+ earthquake in the country, since there has been no earthquake with such a magnitude ever recorded, that the Vrancea Region is among the most seismically active areas of Europe, that the tectonic plates underneath the Carpathian ring of mountains and the Balkan Peninsula are situated proximally to the Eurasian plate, making the seismic activities within such plates about as intense as the tectonic plates situated underneath the area of Istanbul; and that there could be a small probability of an existing statistical association between the occurrence of major earthquakes in Turkey and one or more subsequent occurrences of major earthquakes in Romania and/or the Balkans. Furthermore, the fact that the African plate is situated rather close to the Eurasian Plate underneath the Eastern Mediterranean Sea could represent another reason for the development of hypothetical scenarios of an M8.5+ earthquake in Romania, given that increasing extents of transfers of tectonic stress could have been occurring throughout centuries as a result of various large-scale seismic events in distinct geographical areas. Moreover, some hypotheses arose in the past, in which it was suggested that the occurrence of an intensive earthquake occurring in Türkiye, near the Eurasian plate, raises the statistical probability that an intensive earthquake will occur in Romania, generally between 6 and 15 months years afterward, which could be explained by an originating source of tectonic stress under the Himalayan Mountains that would be propagated through the occurrence of M7.3+ earthquakes in other areas of the Himalayan-Alpine belt that include Pakistan, Iran and Turkey. Such hypotheses should be tested using the utmost rigour of scientific scrutiny to eliminate any potential infiltration of alarmist perspectives. An M8+ megathrust earthquake in the Romania could result in several of the major river dams of the country to collapse - including the important dam in the Northwestern sectors of the capital - given that they had been assembled to withstand calamities as such generally not exceeding magnitudes of 7.5 degrees on the Richter scale. As a result, any natural disasters as such may result in a number of deaths reaching tens of thousands, if not more, with numerous major buildings potentially undergoing an entire collapse and numerous families torn apart by such a set of tragedies nationwide. The entire European Union and Schengen Area of free movement would face a tremendous, multi-lateral shock as a result of such an event, with potentially deadly implications upon neighbouring countries and potentially even several, more distant ones in the continent. Likewise, European authorities may be left with a significant pressure to stimulate local, national authorities in each member state to develop proportional seismic plans accordingly.
Methodology
The scientific remarks and the development of hypotheses regarding the existence of statistical risks with regards to the occurrence of unprecedented seismic activity in Romania have been gradually assembled via the utilisation of various mathematical and Artificial Intelligence (AI)-generated models through programming to ensure that results reach a threshold of significance in their relevance to real-world conditions. Firstly, the average duration between two consecutive earthquakes of the same magnitude nature has been calculated for each cohort of magnitude (i.e. M7+, M7.5+, M8+). Afterward, the Poisson model was applied into real-world, seismic data using AI-generated responses, prior to the AI-generated development of Python input codes to create provisional types of projective modelling with regards to more exact probabilities that earthquakes with magnitudes 7+, 7.5+ and 8+ will occur within the next 5, 10, 15, 20, 25, 50 and 100 years, respectively. The Poisson modelling is centred around the following formula - P(T) = 1−e−λT - discovered and implemented by Siméon Denis Poisson with the purpose of creating accurate statistical projections, and in the case of statistical analysis of the frequency of earthquakes with specific magnitudes, the formula has been implemented accordingly, via principles of applied statistics into geological events. In such a case, T represents the number of years into the future, whilst λ represents the frequency of the recurring event per year and is equal to 1 / Recurrence Interval. By utilising such a method, a Python code was generated by ChatGPT with the options of Search and Reasons switched on. By carefully analysing and interpreting all such data using realistic conditions, the author has ensured a balance that would prevent the audience from potentially reaching any alarmist perspectives, whilst encouraging the audience to remain on a threshold level of awareness and preparedness for the purpose of Internationally-recognised and implemented Health & Safety laws and guidelines. It may also be important to mention the statistical relationship of proportion between the magnitude of an earthquake and the number of its aftershocks, as described through the Gutenberg - Richter law, which is centred around the following mathematical formula: lg N(m) = a - b * M, where N(m) represents the number of seismic incidents displaying a Richter-scale magnitude greater or equal to the value of M, a is a constant value and b represents a scalable parametric value between 0.98 and 1.10. Furthermore, recent scientific hypotheses regarding a potential relationship between planetary and stellar configuration toward the Earth and increased statistical probabilities of earthquake occurrence in prone areas are being taken in consideration whilst emphasising upon the importance of acknowledging evidence-based scientific data as the ultimate, foundational model by which statistical and geological research should continue.
Results
The first step to determine the frequency of large-scale earthquakes in Vrancea was the determination of the λ variable for each cohort of earthquake magnitude. Given that λ = 1 / Recurrence Interval, the following λ values for M6+, M7+, M7.5+, M8+ and M8.5+ cohorts, respectively, were determined using advanced functions of ChatGPT; λM6+ = 0.1, λM7+ = 0.0303, λM7.5+ = 0.0125, λM8+ = 0.005747 and λM8.5+ = 0.0002762, respectively. Likewise, for M8+ earthquakes, the following equations were approximated: PM8+(1) = 0.57%, PM8+(5) = 2.83%. PM8+(10) = 5.59%, PM8+(20) = 10.84%, PM8+(50) = 25.00%, PM8+(100) = 43.73%. Other real-world data-based mathematical models have indicated slightly lower probability values for each number of years, which indicates the importance of avoiding any over-reliance upon AI-generated statistical models applied to seismology. It may be important to place the statistical threshold of significant probability at the value of 60% for the purpose of stimulating local, national and international authorities to ensure the systems of prevention and alleviation of induced infrastructural crises are up-to-date. Likewise, given the fact that 222 years have passed since a M8+ earthquake has likely occurred (approximated 66.67% statistical probability, given the estimated Richter magnitude range of M7.9 - M8.2), a PM8+(220) probability value was reached at least around 40 years ago, potentially indicating the existence of an excess probability value of around 10-15% above the threshold level of 60%. Given the uncertainty that the seismic event of 1802 reached a Richter Magnitude of 8 (only a 66.67% statistical probability), the actual statistical probability of an M8+ earthquake occurring is possibly even higher, and its excess value could be hinted at a percentage of around 5-7%, given that there is a 33.33% probability that the 1802 event did not reach magnitude M8 - currently bringing the overall probability that such a megathrust quake at a constant value of about 80%, with a high likelihood that the probability will be capped within the range of 75-80%. Under such a scenario, the risk of a catastrophic earthquake occurring in the country in the present years would overall be even higher. Given the lack of historical records regarding the existence of a M8.5+ earthquake within the past 400 years, a PM8.5+(700) value has been reached for an M8.5+ earthquake scenario, as a full standard probability of the occurrence of such an earthquake is reached at a PM8.5+(700) value. Realistically, the threshold of significance for PM8.5+(700) was likely reached at least one century ago, since records have not mentioned any catastrophic earthquake reaching or exceeding magnitude M8.5 since the year 1200. Henceforth, the statistical results alone indicate the existence of a considerable risk for an earthquake above M8, with hypothetical scenarios of an M8.5+ earthquake occurring due to the high geological vulnerability shown by the specific geographical location of the South-Eastern Carpathian mountains, alongside the Balkan and the Asia Minor Peninsulae. Moreover, the fact that the Vrancea region of Romania is situated relatively close to the Eastern Mediterranean sea, which is situated above the intersection between the Eurasian and the African plates, such hypothetical scenarios should not be completely ruled out for Romania and the rest of South-Eastern Europe. A hypothetical scenario of a M9+ earthquake would involve a T value equal to approximately 2,500 - 3,000 years, which would be equal to such a number of years for the PM9+ percentage to reach its full, standard value. Furthermore, whilst the M8+ maximum probability (P) value is likely capped at a percentage value of up to 80%, the maximum P value for M8.5+ events is likely capped at around 62 - 64%, whilst the maximum P value for M9.0+ events is generally capped at 40 - 45% following 2,500 - 3,000 years from the last seismic event within such a magnitude range. According to local, ancient history, no records of such earthquake magnitudes have existed for the times of the Dacian rule or beforehand. Under real-world data, not even an M8.3 earthquake has been recorded since the year 1200. A potential difference made between statistical improbability and impossibility to rule out such a scenario from ever occurring in the future is the continuous movement of the African plate toward the Balkan Peninsula at an average speed of just above 2 cm per year, or 2 metres per century, which could have been favouring a phenomenon of tectonic stress transfer, overall having brought some extent of influence upon the intensity of seismic activity in various areas proximal to the Eurasian plate. It is important to note that a Magnitude 6+ earthquake has not occurred in Romania for 22 years (22 > 10), that a Magnitude 7+ earthquake has not occurred for 39 years (39 > 33), that a Magnitude 7.5+ seismic event has not occurred for at least 84 years (84 > 80), and a Magnitude 8+ seismic event has not occurred for at least 222 years (222 > 220), overall bringing a big statistical imagery involving a significant risk that the country will experience a Magnitude 8+ seismic incident in the future.
Figure 1.
AI-generated graph covering a logarithmic decrease of earthquake frequency per year in accordance with a linear increase of the Richter magnitude value from 6 to 10.
Figure 1.
AI-generated graph covering a logarithmic decrease of earthquake frequency per year in accordance with a linear increase of the Richter magnitude value from 6 to 10.
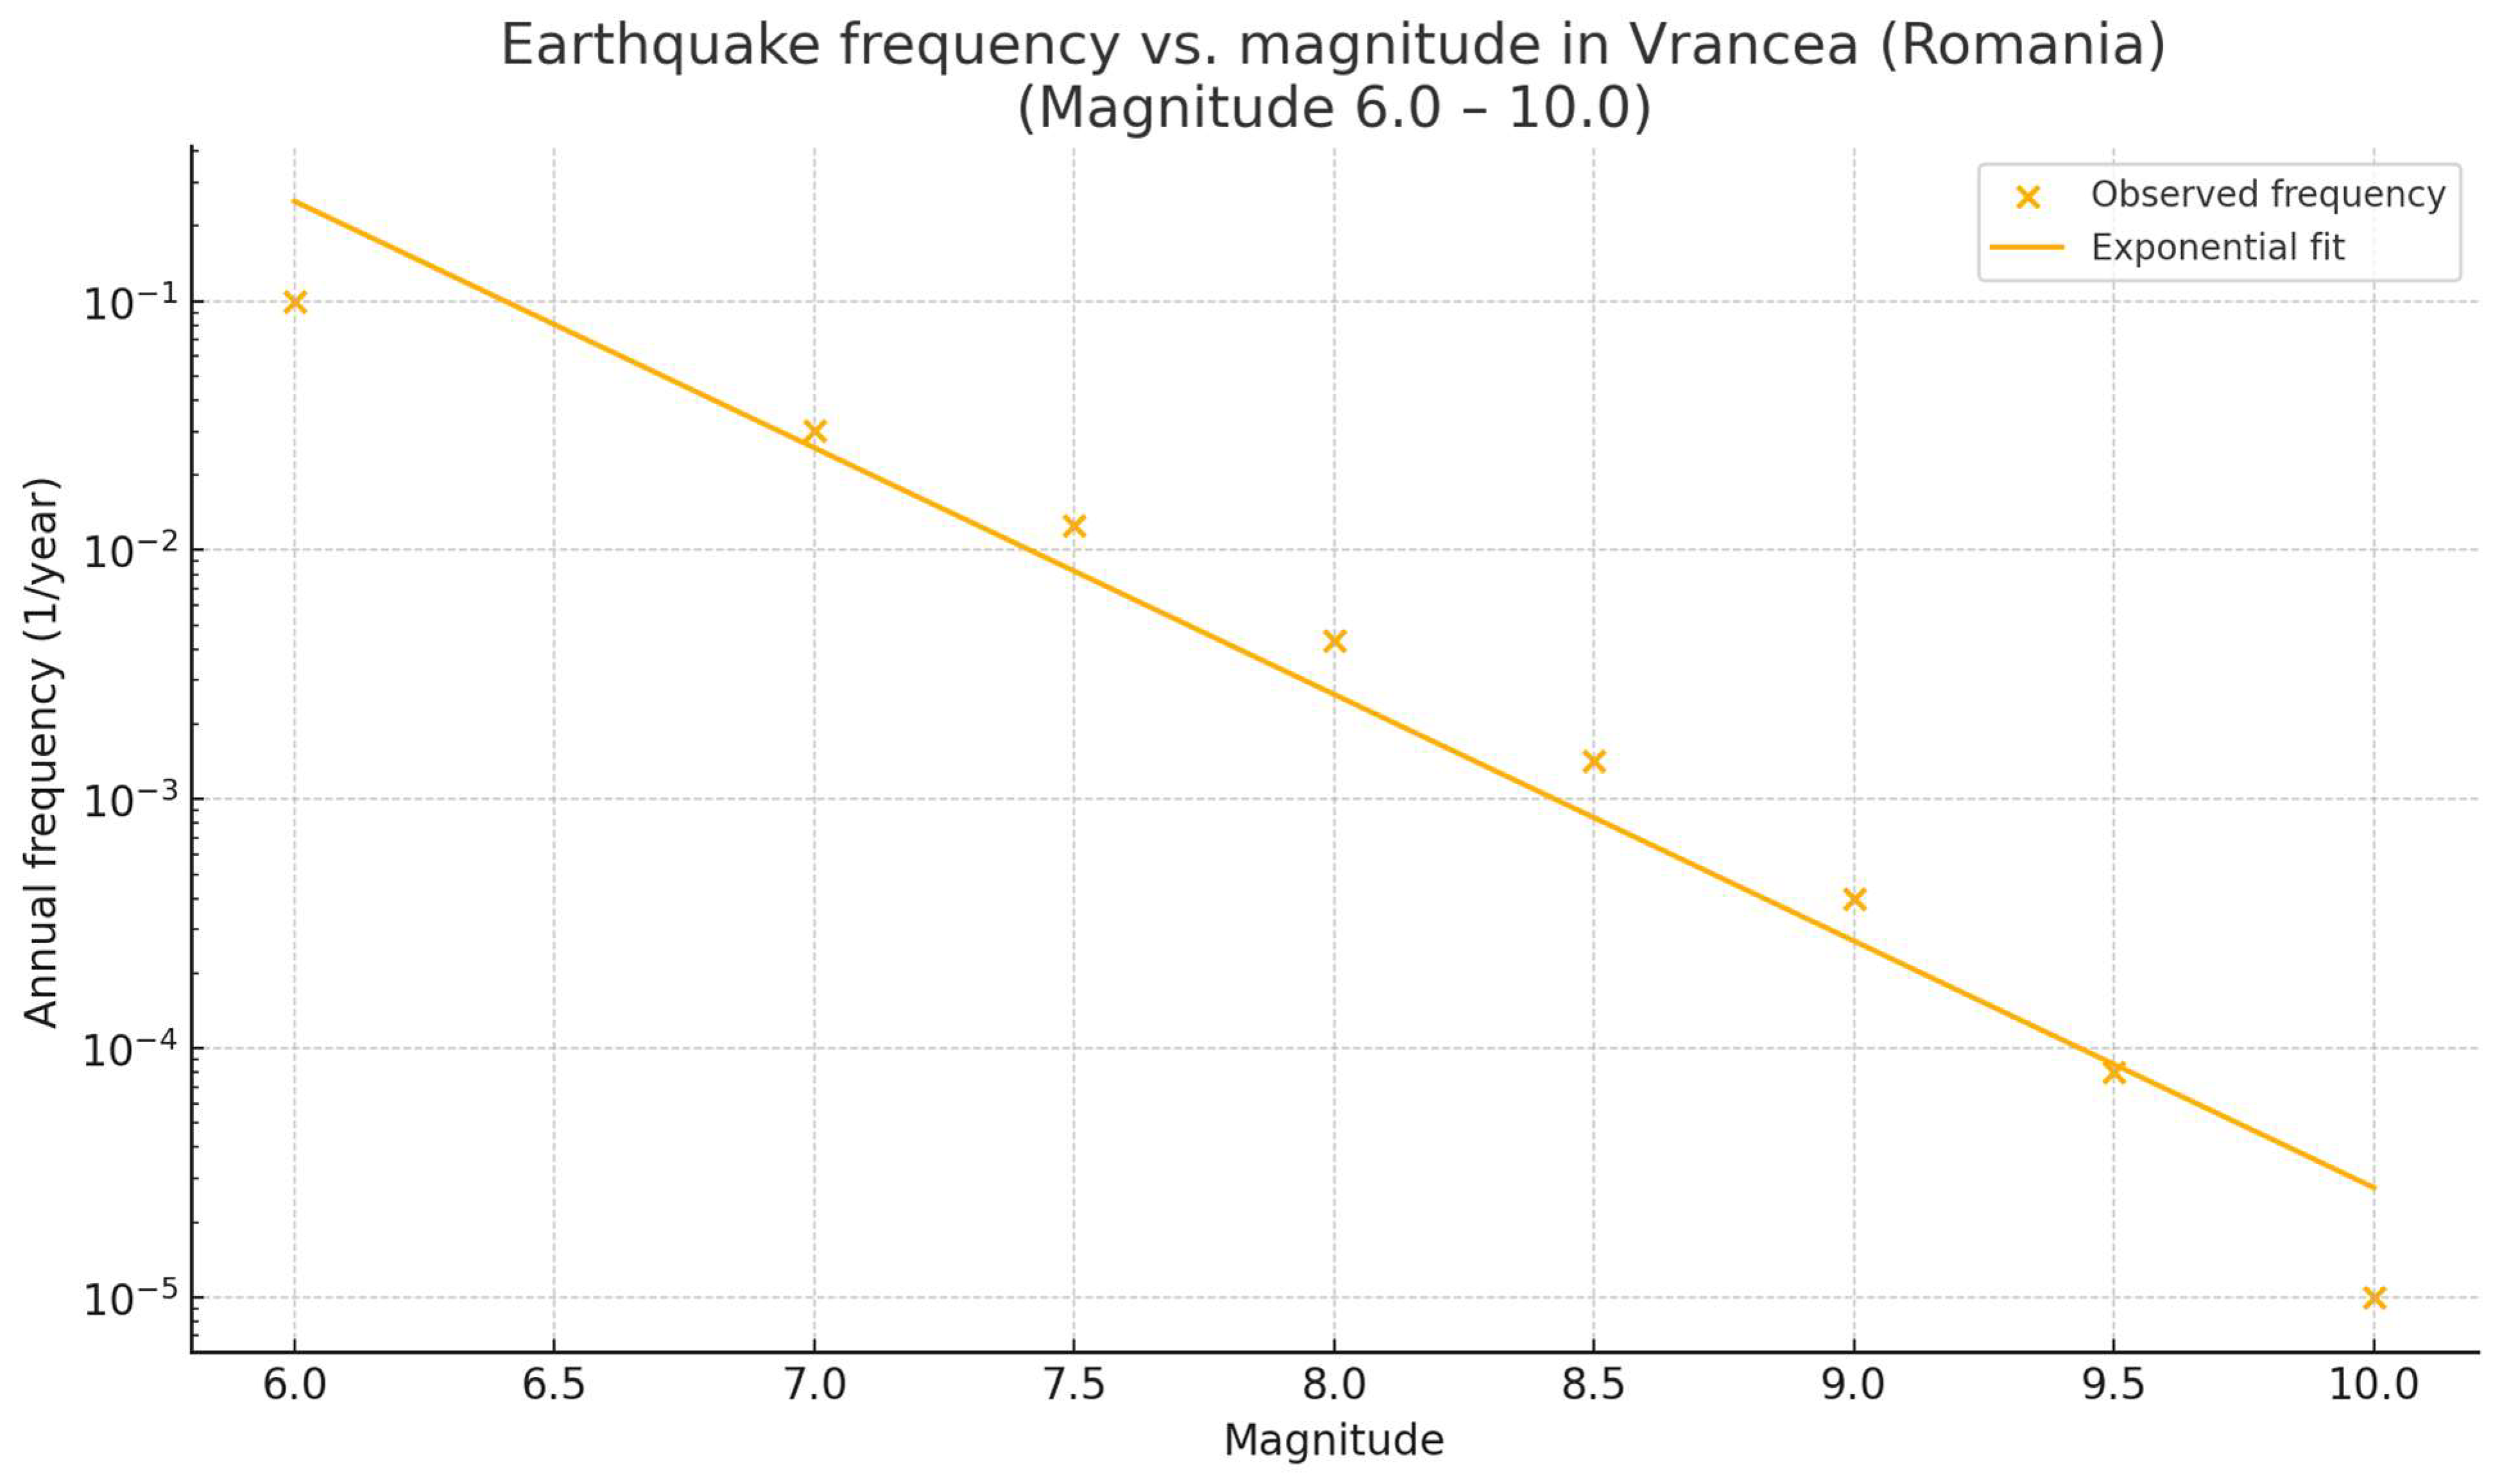
The initial estimate for M8+ quakes was once every 230 years, but a final, provisional estimate of once every 220 years was given for precautionary reasons that include lack of M8.5+ quake records within the past millennium. Such a final estimation is in considerable accordance with the AI-generated Poisson model of probability projection in which M8+ events are 25% probable to occur once every 50 years and 43.73% probable to occur once every 100 years, on average. Earlier, real-world data-based mathematical and statistical models indicated a 20% probability for an M8+ event within 50 years and around 37% for such an event to occur within a century, which still indicate that the threshold of significant M8+ seismic risk is reached after approximately 180 years following the last M8+ event - considering also the 33.33% statistical probability that it did not occur in 1802. Under general circumstances, the growth curve of the statistical probability undergoes a steep, relatively constant growth until a probability value of 65-70% is reached approximately 180 years following the last quake with such a magnitude, before the growth curve reaches a plateau phase. Nonetheless, certain factors that include two or multiple megathrust earthquakes in distant areas of the Himalayan-Alpine ring may cause the growth curve to become steeper and its plateau phase to potentially be delayed. Likewise, it may be wise for statisticians to determine the threshold of major statistical significance with regards to an existing likelihood that an M8+ earthquake will occur at a percentage of 60% for the purpose of stimulating robust preparatory responses to alleviate any crises induced by such events in the future. The overall pattern of earthquake frequency decrease as its magnitude value increases is explained in a nutshell:
M < 7
2 * N + 14 * n-a where a > 0 => decrease as M value rises
7 < M < 7.8
2 * N + 14 * (n0) => linear decrease as M value rises
M > 7.8
2 * n + 14 * (na), where a > 0 => logarithmic decrease as M value rises
The ChatGPT-generated Python input code for the M7.5, M8 and M8.5 scenarios is as follows:
“import numpy as np
def earthquake_probability(rate, time_years):
"""
Calculate the probability of at least one event occurring in a given time period
using the Poisson process.
Parameters:
rate (float): Average event rate (events per year).
time_years (float): Time period in years.
Returns:
float: Probability of at least one event occurring.
"""
return 1 - np.exp(-rate * time_years)
# Recurrence intervals for each category (in years)
recurrence_M7_5 = 80 # M7.5+ earthquakes occur once every 80 years
recurrence_M8 = 220 # M8+ earthquakes occur once every 220 years
recurrence_M8_5 = 700 # M8.5+ earthquakes occur once every 700 years
# Calculate λ for each category
lambda_M7_5 = 1 / recurrence_M7_5
lambda_M8 = 1 / recurrence_M8
lambda_M8_5 = 1 / recurrence_M8_5
print("Poisson rate parameters (λ):")
print("λ for M7.5+ earthquakes: {:.6f} events/year".format(lambda_M7_5))
print("λ for M8+ earthquakes: {:.6f} events/year".format(lambda_M8))
print("λ for M8.5+ earthquakes: {:.6f} events/year".format(lambda_M8_5))
# Define time intervals (years) for probability calculations
time_intervals = [1, 5, 10, 20, 50, 100]
# Calculate and print probabilities for each earthquake category
def print_probabilities(mag_label, lam):
print("\nProbabilities for {} earthquakes:".format(mag_label))
for t in time_intervals:
prob = earthquake_probability(lam, t)
print(" Next {:3d} years: {:6.2f}%".format(t, prob * 100))
print_probabilities("M7.5+", lambda_M7_5)
print_probabilities("M8+", lambda_M8)
print_probabilities("M8.5+", lambda_M8_5)”
The development of the front-end Python program above may constitute a sample approach in ongoing efforts to catalyse statistical and geological research using both front-end computer programming and various Artificial Intelligence models whose functions are capable of becoming specific with regards to such disciplines, as well as research methods and directions. Likewise, via the gradually broader inclusion of digitalisation and AI-mediated research and calculations, it may become increasingly easier for an increasing number of people from a broader audience to have easy accessibility to credible and peer-reviewed scientific information that can be simplified in its delivery, thereby helping people make better and more robust preparations in case of statistically significant probabilities that specific natural disasters will occur in the future.
Discussion
The development, update and gradual implementation of various Artificial Intelligence models into various, specific areas of scientific research has resulted in an effective production of a “catalysis” of the “chemical reaction” of scientific research in areas like applied mathematics into geology, applied statistics and population studies, geological research, astrophysics, biomedical science, biophysics and chemical engineering. Through the gradual change from a “manual” to an “automatic” speed of virtually-performed scientific research, scientists have become increasingly capable of assimilating highly specific and relevant information regarding major points of scientific innovation, pattern recognition in complex modern-day problems, as well as profound levels of problem resolution in scientific research, given the exponential increase in the availability of peer-reviewed data from references that are specifically relevant to the question of research. With regards to geology, Artificial Intelligence models can be easily trained to perform scientific research at higher levels of Academia, as functions that include DeepSearch in Grok 3 beta, collect peer-reviewed scientific resources that are related to the major points of the scientific inquiry. Simultaneously, it may be essential for authors to be reminded of the high importance that scientific work must remain original in nature and that all ideas of innovation and inquiry should derive from their own work. In other words, AI ought to be a “supplement” in scientific enquiry, and not a substitute, playing a role similar with an “enzyme” in chemical reactions, which does not substitute the reactants, but merely aid in their chemical interaction whilst keeping it specific to the nature and activity of the reactants. The statistical projection could be performed methodically and carefully, using the calculated statistical data from M6, M7, M7.5, M8 and M8.5 cohorts. Multiply the calculated probabilities for each cohort to obtain the general probability that a significant earthquake will occur using all presented Richter magnitude cohorts. Then, Poisson models can be developed for each 5 consecutive years. It may be important to explain that even a 5% probability may be significant, as it would resemble an added value to the already existing and growing probability over time, meaning that it is not a whole existing probability itself. In the current study, the Gutenberg - Richter law covering a logarithmic growth curve of frequency against a linear decrease in the Richter Magnitude values from 10 to 6 is generally applied, alongside a heuristic approach that is used through the development of the general formula of N [M(m + 0.5)] = (2 * n + 14) [M(m)], where N is the number of years between two consecutive earthquakes of the same kind of magnitude, and m represents the value of the earthquake magnitude upon the Richter scale and its value is between 6.5 and 7.3, it may be determined that, on average, there are 80 years between two consecutive M7.5+ earthquakes, 220 years between two consecutive M8+ earthquakes and potentially as few as 700 years between two consecutive M8.5+ earthquakes, given the proximal location of the Vrancea region to the natural border between Europe and Asia around the Istanbul area of Turkey. Such a formula can be written in the form of Poisson’s statistical model, in which P(T) = 1 − e−λT, in which T is the number of years for a scenario in which an earthquake within a specific magnitude range would occur, and λ would represent the frequency of such an event per year. Likewise, there is an excess probability of a M8+ earthquake occurring in the country of at least approximately 10% and there could be an extra probability of around 5-7%, given the uncertainty that the 1802 earthquake of Romania reached the M8 intensity on the Richter Scale - giving an overall probability ranging between 75 and 80% that a M8 earthquake will occur in the country within the following 5 years, which is significantly beyond the threshold value of 60%. The high projected value was also provisionally suggested due to the recent tectonic developments throughout the Himalayan - Alpine ring that have likely implicated a sequence of long-distance tectonic stress transfers. Unlike the probability cohort covering M8+ earthquake, in which the plateau phase of its steep growth over time is reached when the percentage value reaches a range of 65-70%, the trend involving the growth of probability that an M8.5+ event will occur over time reaches its plateau phase when the probability range of 50-53% is reached, meaning that the statistical probability that an M8.5+ event will occur in Vrancea will remain below the threshold of significance for up to a couple of centuries after the plateau phase is reached. A potentially existent problem is the fact that there are no historic records of M8.5+ quakes since records began, that no historic manuscripts describing extreme shakes characteristic of M9 events have ever been recorded throughout the regions part of today’s Romania, that the Carpathian points of seismic vulnerability due to major curvature are part of the Himalayan-Alpine mountain ring, and that two M 7.8 earthquakes (one in Nepal in 2015 and one in Türkiye in 2023) and one M7.5 aftershock (following the M7.8 quake in Türkiye) occurred in distant parts of the general mountain ring within the past 10 years, making it particularly possible for a chain reaction of tectonic stress transfer to the Carpathian plates to occur, as the tectonic plates under the Himalayan Mountains constitute the most active throughout the world. Given the country’s strategic economic ties within the European Union, such an event could result in financial losses amounting to several billions of euros and long-term disruptions in energy, transportation, and governance systems.
A “phenomenon” in which increasing proportions of the human population have coincidentally “bumped” into numerical and geometrical repetitions (i.e. “angel numbers”) and symmetrical configurations may reflect an increasing electromagnetic influence upon the Earth, which would involve shifts indirectly influencing major layers of human existence that would likewise include psychology and behaviour, as a result of increasingly common lunar, planetary and stellar alignments toward our planet - though philosophically speaking, the principle of free will remains intact in the entire process, despite the increasing extent of “temptation and challenge-related pressure”. Some scientists have even hypothesised the existence of a statistical relationship between various extents of religious beliefs and cosmic events as such. It may be that observed increasing polarisations in present times that cover the issues of climate change, extreme weather phenomena, increasing numbers of sudden natural disasters, rising geopolitical and social tensions worldwide, rising economic instability, increasing cases of mental health conditions and continuous increase in the discrepancy of resource availability throughout the world may have been influenced by changes in the proximal and more distal areas of the Universe in relation to the Earth and even the Solar System. Recently, some astrophysicists and geologists (i.e. Frank Hoogerbeets) have started hinting at a possible existence of a statistical relationship between specific lunar, planetary and stellar geometrical configurations toward the Earth and a higher probability that certain seismic activity occurs in geologically-prone areas. Such an idea is currently hypothetical in nature, though it has compelled researchers to begin processes of rigorous scientific and statistical testing procedures, as it is based upon the theory that tides are caused by increased electromagnetic and gravitational influences from the Moon and the Sun, and in theory, it sounds as a scientifically sound hypothesis, given that such cosmic configurations consist of rather numerous celestial bodies, which altogether may combine a significant electromagnetic influence upon the Earth and even its tectonic plates, which are generally situated below 75-100 kilometres from the surface level, when the Moon alone is situated at an approximate distance of 384,400 kilometres from the surface of the Earth, making the distance between the Moon and the Earth’s tectonic plates an extra of 0.0015-0.002%. The proportion of the extra distance between other planets and the Earth’s plates, compared with the distance to the Moon’s surface, would be microscopical in relation to the 0.002% value. Likewise, mathematical data tends to be generally in accordance with the hypothesis that specific alignments between the Moon, other planets and even other stars in relation to the Earth do considerably increase electromagnetic and gravitational influences toward our planet, thereby influencing the movement of tectonic plates, particularly in geographical areas statistically regarded as prone to earthquakes. Ideally, such research material should be placed under further, highly rigorous scientific screening to ensure that any areas affected by “forced statistics” are automatically filtered from the mainstream research pathways. It may be important for such speculative information to be mentioned, with the sole purpose of stimulating further research in the area.

Table 1.
How a Magnitude 8.5 earthquake in Vrancea, Romania, would be felt throughout Europe (according to recent ChatGPT AI modelling, 2015).
Table 1.
How a Magnitude 8.5 earthquake in Vrancea, Romania, would be felt throughout Europe (according to recent ChatGPT AI modelling, 2015).
| Country / Region | Estimated Maximum Mercalli-Scale Intensity for an M8.5 Seismic Event in Vrancea |
|---|---|
| Romania | Epicentral areas: X-XI; Major cities: IX-X |
| Moldova | Around VIII |
| Bulgaria | Northern regions: VIII-IX; Rest of the country: VII-VIII |
| Western Ukraine | VI-VIII |
| Serbia | VII-VIII |
| European Turkey | VI-VII |
| Hungary | V-VII |
| Czech Republic & Slovakia | V-VI |
| Austria and Eastern Switzerland | V-VI |
| Poland | V-VI |
| Italy | Northeastern regions: V-VI; Rest of the country: Generally III-IV |
| Greece | Around VI |
| France | Eastern regions: IV-V; Rest of the country: III-IV |
| Germany | Eastern regions: About V; Rest of the country: Around IV |
| United Kingdom | II-III |
| Republic of Ireland | II-III |
| Spain | II-III |
| Portugal | Around II |
| Belgium, Netherlands and Denmark | About III-IV |
| Scandinavian Countries | Around II |
| Baltic Countries | About III |
| European Russia | III-IV |
Through Web Search and Think ChatGPT functions, as well as DeepSearch Grok 3 beta, a Magnitude 8.5 earthquake was simulated in Vrancea, Romania, with the depth of the epicentre between 70 km and 200 km, to check how far the seismic event would be felt throughout Europe. Through repeated analyses, the author came to the conclusion that Western Europe would possibly feel the earthquake too, at Mercalli scales ranging from 3 to 5, given that the 1802 earthquake was felt from the Aegean Sea to Saint Petersburg, Russia; and from Voronezh, Russia, to Berlin and Rome, in Germany and Italy, respectively. It is important to note that a M8.5 earthquake is 3.162-fold more large-scale in nature than a M8 and 5.623-fold more intense, given that a whole scale increase would involve a ten-fold increase in the value of he magnitude, meaning in theory that it would be felt at a distance up to 3.162 times bigger than a M8 earthquake, suggesting overall that even countries like Norway, Ireland, Scotland and Portugal would experience it at Mercalli scales of 2 to 3, meaning that the local populations would feel the earthquake. Cities that include Paris, Frankfurt, Barcelona and Nice would feel such an event at Mercalli scales around IV, whilst cities like Rome, Milan, Berlin and Prague would feel the event at a scale of approximately V and cities like Vienna, Bratislava, Budapest and Kosice would feel it at scales generally between VI and VII, particularly in the Eastern parts of Central Europe.
Table 2.
How Mercalli scales translate to the average perception levels of an earthquake’s intensity (ChatGPT, 2025).
Table 2.
How Mercalli scales translate to the average perception levels of an earthquake’s intensity (ChatGPT, 2025).
| Mercalli Scale (MMI) | Perception | Description |
|---|---|---|
| I | Not felt | The earthquake is only felt by very few people, under highly select circumstances. |
| II | Weak | The earthquake is felt by a few people during resting time, particularly residents of higher levels of multi-story buildings. Most likely not recognised as an earthquake. |
| III | Weak | Felt visibly by persons located indoors, particularly on higher levels of multi-story buildings. Numerous people may not recognise it as an actual earthquake. |
| IV | Light | Felt indoors by numerous people, and outdoors by much fewer people. Bathroom and kitchen items, doors and windows may be moved and/or slightly affected. |
| V | Moderate | The event is felt by almost all local residents and visitors, and many people resting become awake. Wardrobes, bathroom and kitchen items, doors and windows are moved and some of the smaller items are broken and overturned in the process. |
| VI | Strong | Felt by everyone, and many people exit buildings in a panic mode. Some heavy elements of apartments that include wardrobes and even slightly broken doors are moved. Windows and other outside elements of buildings may face slight cracks and damages. |
| VII | Very Strong | Local residents and visitors find it difficult to keep their balance, with damages occurring even in well-assembled and designed buildings, with more significant effects upon older buildings. A number of houses can have their chimneys broken in the process. |
| VIII | Severe | Particularly well-assembled and designed buildings face little damage, whilst others face notable damages and some buildings may partially collapse in the process. Several chimes and some factory stacks also face collapse. |
| IX | Violent | The local population is under general panic. Well-assembled and designed buildings face notable damages and many other buildings face either complete collapse or disturbed foundations. Cracks suddenly appear in the ground. |
| X | Extreme | The majority of buildings face total collapse, including some well-constructed and assembled ones. Several, considerable fissures appear in the ground, with several vehicles and even some buses and trucks becoming “swallowed” in the process. The visibility can be decreased in remote areas, where a few closely-located multi-story buildings have collapsed. |
| XI | Extreme | Only a few buildings remain intact. Many bridges are torn apart and destroyed. Large-scale breaks in the ground appear, with many vehicles, buses and trucks falling into them. Electricity is likely cut off in broad areas, and heat and running water becomes broadly unavailable. The visibility becomes lower in local areas. |
| XII | Extreme | The earthquake has catastrophic effects upon the local and broader areas, with utter collapse observed in the general, big image of the urban environment. The ground moves in a wavy manner, leading and contributing to the production of numerous, broad fissures. Voluminous items and objects are thrown into the air at altitudes of tens and few hundred feet, and the visibility becomes low. |
The classification of the Mercalli scales above contains an in-detail explanation of how earthquakes of various intensities occur in and affect urban and rural areas that is at the same time understandable to a general audience. Such a classification is also utilised to calculate the diameter of the surface area where an earthquake is felt, according to various felt intensity levels, which are generally inversely proportional to the distance between the specific geographic area and the epicenter of the earthquake. It may be important to analyse the relationship between the depth of the epicentre and the length of the diameter of the surface where the earthquake is felt in any manner. Namely, if an earthquake occurs at a depth proximal to the sea level, the surface of the felt earthquake will tend to be smaller, whilst the felt intensity will tend to decrease logarithmically in proportion to the increasing distance from the epicentre. On the other hand, if an earthquake occurs at a deeper level, the surface of the felt earthquake will tend to be bigger, whilst the felt intensity will tend to increase exponentially in proportion to a shrinking distance to the epicenter. A major difference would be made by the actual intensity of the earthquake, as a higher magnitude earthquake would be felt significantly throughout much of the “earthquake-felt” surface if the epicentre is located closer to the sea level, whilst it would only be felt violently closer to the epicentre if the epicentre is located at a higher depth. In the case of Romania, earthquakes tend to occur between depths of 65 and 190 kilometres, which resemble a significant, yet medium depth. As a result, the area of a felt high magnitude earthquake as such would have a set of intensities resembling an exponential increase proportionally with shrinking distances toward the epicentre, with a plateau phase at the areas most proximal to the epicentre, which explains why the city of Bucharest, which is located at approximately 200 kilometres from the epicentre, felt major earthquake as intensely as geographic areas within the Vrancea region.
Let us consider the following case in which an intermediate-depth earthquake of an M8.2 occurs in Vrancea (at a depth of approximately 140 km below the sea level). Currently available region-specific Intensity Prediction Equations (IPEs) are known to regress observed Modified Mercalli Intensity (MMI) against Richter magnitude, as well as distance and attenuation factors. Seismic IPEs constitute fundamental instruments in the projection of both seismic hazard and impact assessment. In Europe, regionally-adapted IPEs cover event amplitudes (M), distances from the epicentre (R), as well as frequency-dependent attenuation to project physically felt intensity (I, which is typically on the MMI scale). For the case of earthquakes occurring in Vrancea, such equations are particularly important for robust levels of awareness, given the usual occurrence of intermediate-depth seismic events.
The IPE is typically known to display the following formula: I = a + b * M - c * log10R - d * R
In the IPE formula mentioned above, I is known as the predicted intensity on the MMI scale, whilst M is known as the moment magnitude, R the hypocentral distance in km (known as the radius from the epicentre), and a, b, c and d represent empirically-determined coefficients of regression. Next, AI-generated application of the formula occurred for the Vrancea case study. The a, b, c and d regression coefficients have been equated to values of 2.92, 1.68, 3.09 and 0.0026, respectively (Solokov and Wald, 2016). Such values mirror Vrancea’s characteristic attenuation and site amplification. Likewise, the applied IPE formula for an M8.2 event in Vrancea is the following:
I = 2.92 + 1.68 * M - 3.09 * log10R - 0.0026 * R
I = 2.92 + 1.68 * 8.2 - 3.09 * log10R - 0.0026 * R (Grok 3 beta, 2025)
It is important to state that an M8.2 megathrust earthquake would release approximately 31.6-fold more energy than an M7.2 earthquake (which occurred on the 4th of March, 1977), as the rise in one magnitude unit value is equivalent to a ten-fold amplitude rise and approximately 31.6-fold energy increase. At a depth of 140 km, generated seismic waves undergo less restricted geometric distribution in the mantle, allowing long-distance seismic wave propagation with more restricted moderation. It may also be important to observe the two past large-scale earthquakes of Vrancea from March 1977 and November 1940, respectively. Namely, the 1977 event had a magnitude of M7.2 and a depth of approximately 94 kilometres, and was perceived as far as Rome, Italy (around 1,100 kilometres from the epicentre). The 1940 event had a magnitude of 7.7 and a depth of approximately 150 kilometres, and was felt from areas of the Eastern Mediterranean sea to the Southeastern area of the Scandinavian Peninsula, including cities like St Petersburg, Helsinki, Berlin, Rome and Athens, covering a radius of around 1,350 kilometres. It may also be important to also take into consideration the existence of sedimentary basins, which are known to locally amplify shaking, even if it is weak. There are also other factors of uncertainty that include diversity in the structure of the crust, the focal mechanisms and the site response, which may either increase or decrease boundary distances with up to 100 km.
Via the utilisation of IPEs, perceptible shaking (MMI greater or equal to II-III) would have its radius likely increased to a distance value between 1,600 and 1,700 km from the epicentre. Such a distance range is in accordance with past real-world data displayed via the past two large-scale earthquakes of Vrancea, thereby displaying a firm tendency to validate such an approach. Geographic areas within the diameter of perceptible shaking (i.e. 3,200 - 3,400 km) include the vast majority of the European continent, including the majority of Western European countries, with only countries including the United Kingdom of Great Britain, the Republic of Ireland, Iceland, Portugal and vast areas of Spain being spared (though some areas may still perceive mild shakes and perhaps be confused with shakes caused by the movement of large vehicles that include buses and trucks).
To determine the distance where the level of shaking decreases to the threshold level of physical perceptibility (MMI ~ 2.5), the following formula is written:
2.5 = 2.92 + 1.68 * 8.2 - 3.09 * log10R - 0.0026 * R
2.5 = 2.92 + 13.776 - 3.09 * log10R - 0.0026 * R
2.5 = 16.696 - 3.09 * log10R - 0.0026 * R
3.09 * log10R - 0.0026 * R = 16.696 - 2.5
3.09 * log10R - 0.0026 * R = 14.196
Given that the equation is transcendental in nature, the value of R may only be estimated. Using an AI-generated approach involving Python programming and a graph plotting of an f(x) function, the value was estimated at a range of 1,600 - 1,650 km.
AI-generated Python code (returned an error):
from scipy.optimize import root_scalar
# Redefine the function, valid only for R > 0
def equation(R):
return 3.09 * np.log10(R) - 0.0026 * R - 14.196
# Use a root-finding method over a bracket
result = root_scalar(equation, bracket = [10, 10000], method='brentq')
result.root if result.converged else "No solution found"
Following the return of the error, the AI report generated a graph to estimate the R value using calculus. A general range result of 1,000 - 2,000 km was returned.
Figure 2.
AI-generated xOy graph displaying the estimation of the radius from the epicentre to the geographical areas where minimal perception of the seismic event occurs at an MMI value of ~2.5 (ChatGPT, 2025).
Figure 2.
AI-generated xOy graph displaying the estimation of the radius from the epicentre to the geographical areas where minimal perception of the seismic event occurs at an MMI value of ~2.5 (ChatGPT, 2025).
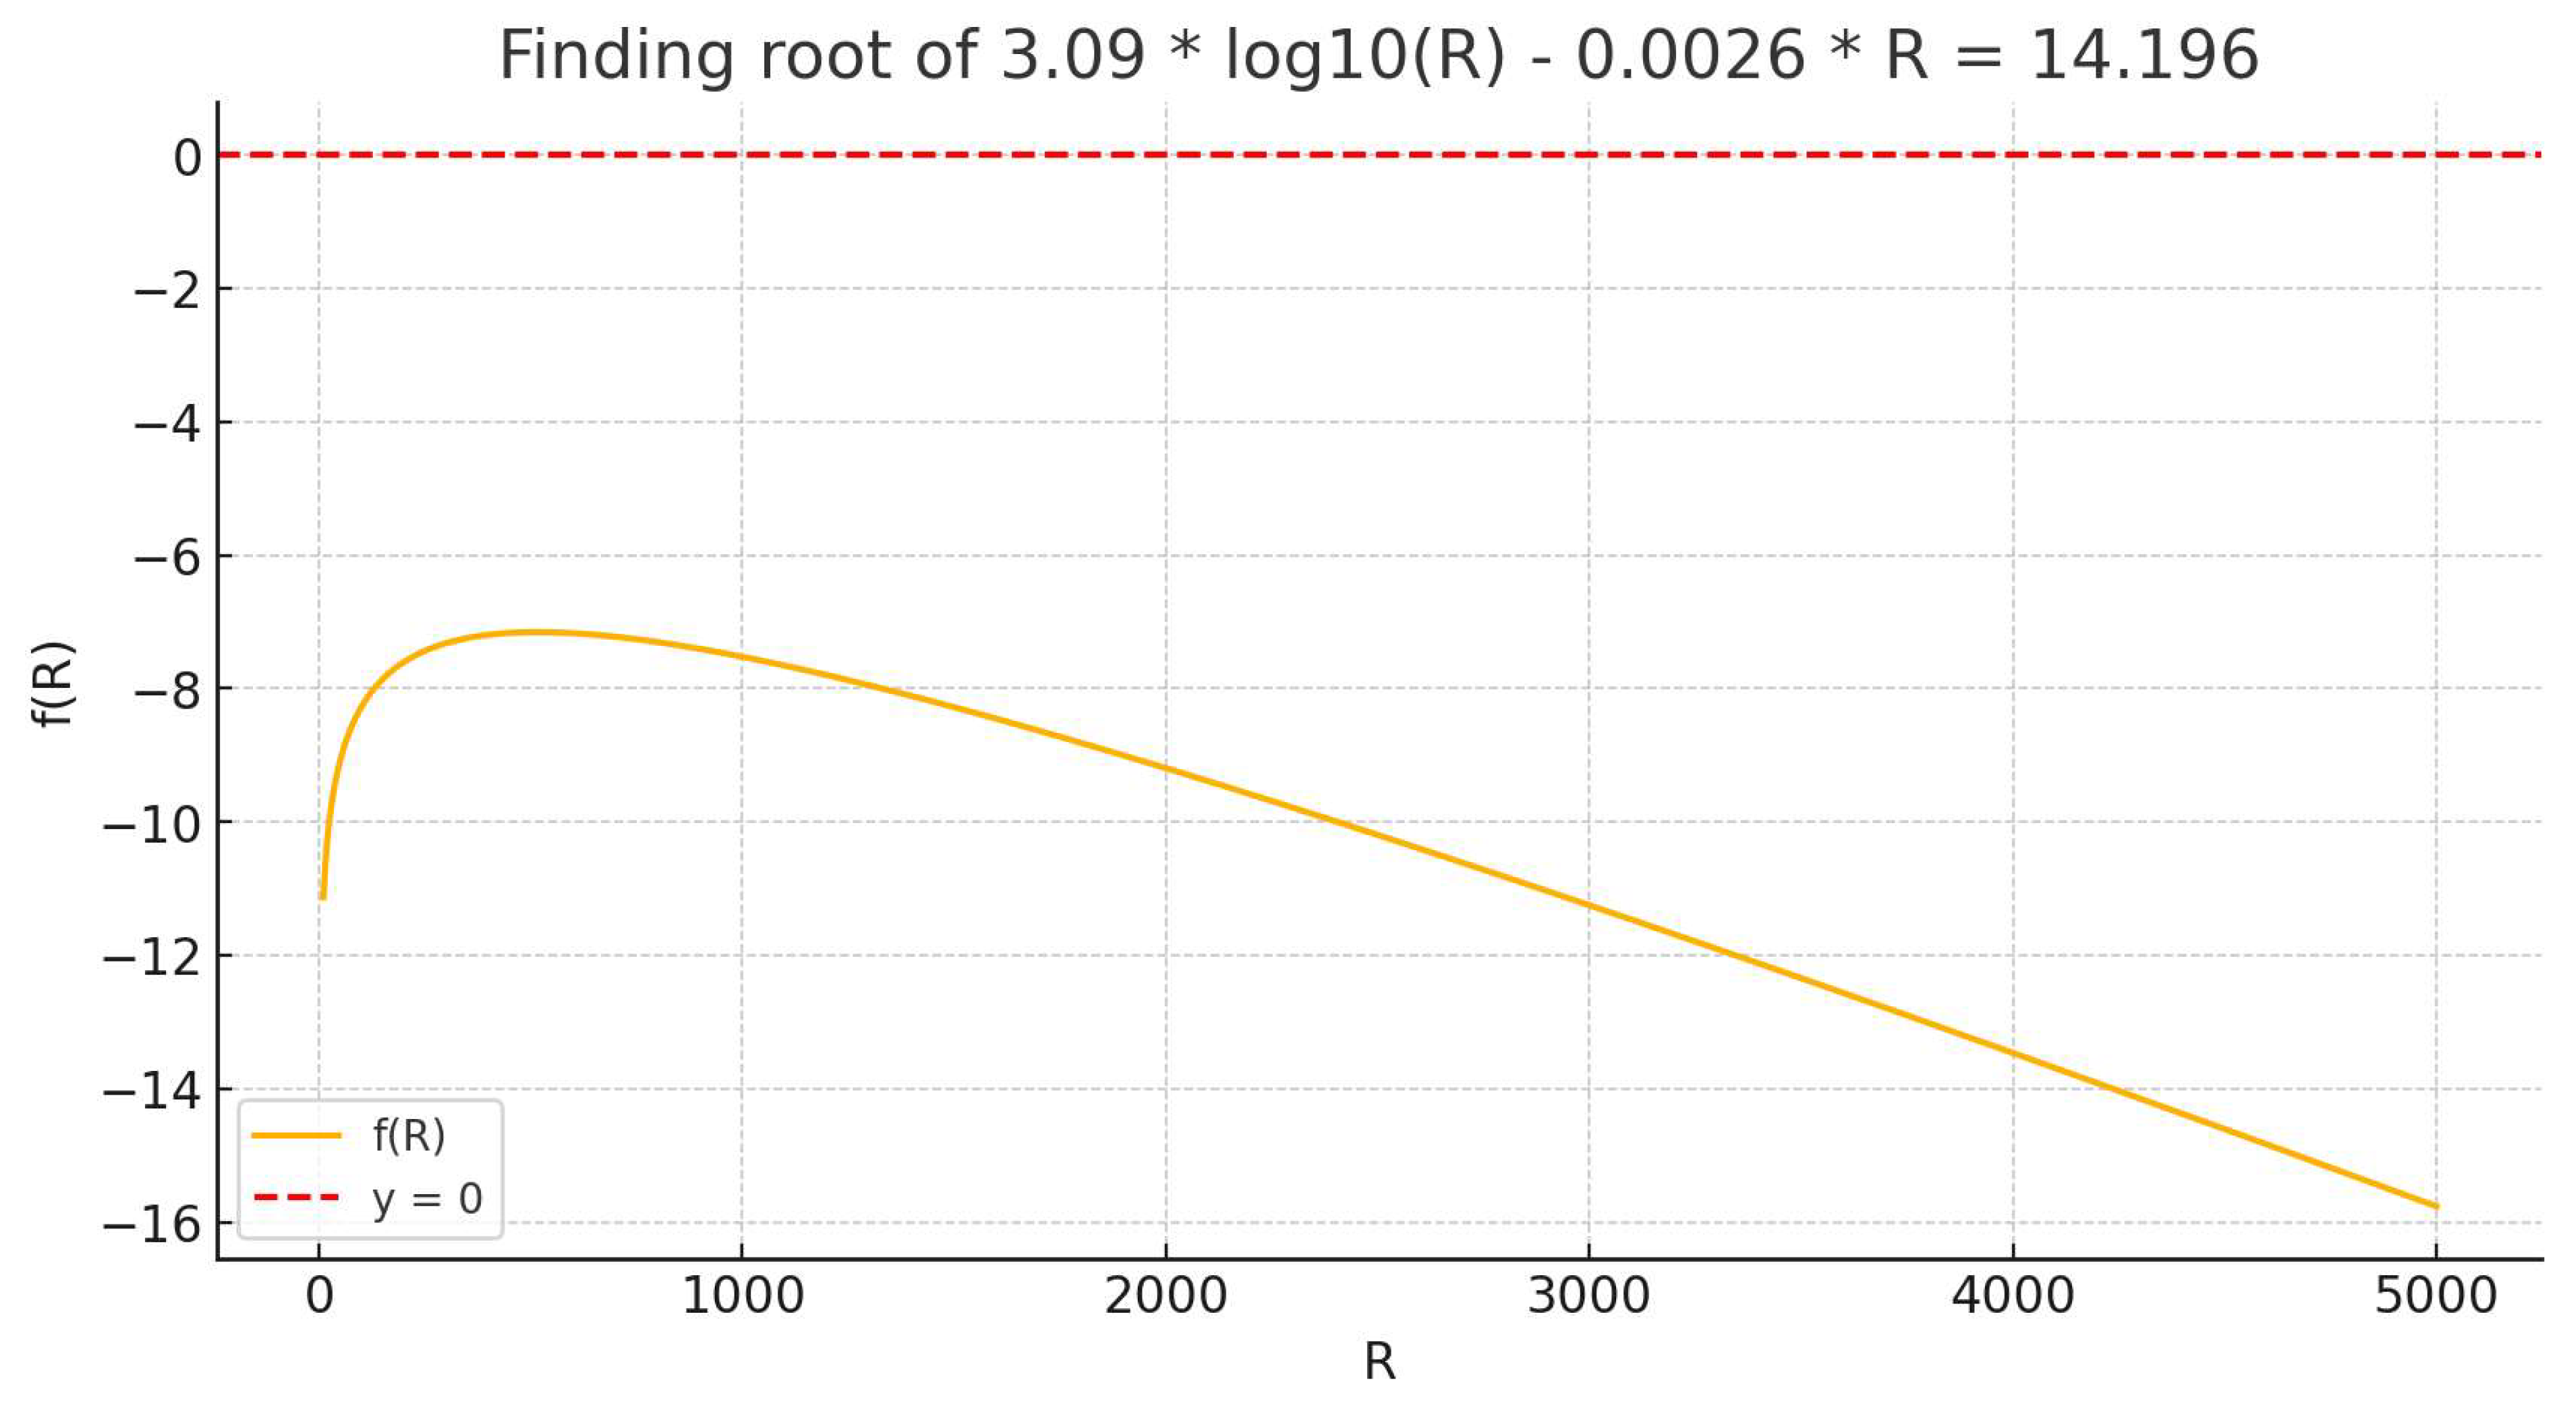
It was recommended that the user would utilise the Python root-finding functions of brentq or fsolve from scipy.optimize to retrieve a more precise value of R, meaning that the user was required to install scipy as well (i.e. “pip install scipy”), prior to copying and pasting the input code into a .py file or a Jupyter Notebook, and running it in the end. The AI-generated Python input message for such a second step is as follows:
import numpy as np
from scipy.optimize import root_scalar
# Define the equation
def equation(R):
return 3.09 * np.log10(R) - 0.0026 * R - 14.196
# Use Brent's method within a bracket where the root is expected
result = root_scalar(equation, bracket = [1000, 2000], method='brentq')
if result.converged:
print(f"The value of R is approximately: {result.root:.4f}")
else:
print("The solution did not converge.")
Overall, the application of an Vrancea-specified IPE in a hypothetical case of a M8.2 event at a depth of 140km suggests perceptible ground movement up to 1630 kilometres away from the epicentre. Such a radius reflects the real-world examples of past intermediate-depth earthquakes in Vrancea and evidentiates the pan-European reach of a megathrust earthquake in the Romanian region, meaning that they constitute crucial inputs for efforts in emergency planning, risk prevention and attenuation, as well as public communication at a continental level.
Table 3.
Risk assessment for river dams in Romania following an M8+ and an M8.5+ earthquake in Vrancea, using Grok 3 beta’s DeepSearch AI model as a reference.
Table 3.
Risk assessment for river dams in Romania following an M8+ and an M8.5+ earthquake in Vrancea, using Grok 3 beta’s DeepSearch AI model as a reference.
| Distance from the epicentre (from the surface-level perspective) | Risk of dam collapse following a Magnitude 8+ earthquake | Risk of dam collapse following a Magnitude 8.5+ earthquake |
|---|---|---|
| Close river dams (<100 km) | Siriu, Valea Uzului: 50-80% | Siriu, Valea Uzului: 70-90% |
| Medium-distance river dams (100-200 km) | Izvorul Muntelui, Bolboci, Lacul Morii: 30-60% | Izvorul Muntelui, Bolboci, Lacul Morii: 50-80% |
| Large-distance river dams (>200 km) | Vidra, Vidraru: 25-40%Gilau I: 10-25% | Vidra, Vidraru: 45-60%Gilau I: 30-45% |
The results above have been provisionally generated via an extensive analysis of the Romanian hydraulic infrastructure, which is not as developed as the infrastructures of countries that include Japan, Chile, Mexico and the United States of America. Likewise, risks of dam collapse have been provisionally graded as higher due to the historic and economic context Romania is situated into. Likewise, it may be highly important to analyse the potential implications of any earthquake over M8 over Romanian infrastructure, as any significant level of damage may bring as a consequence unprecedented loss of human and animal life. For example, there are several river dams created mainly in the Carpathian mountains, designed to withstand any earthquake with a magnitude value up to 7.5, meaning that an M8+ earthquake could cause some or most of the river dams to collapse, which would result in imminent losses of at least tens of thousands of lives nationally, given that several large towns and cities are located within the course of such rivers, beyond the assembled dams. Likewise, any earthquake reaching and exceeding Magnitude 8 would have catastrophic effects upon Romania, as its political and economic history has not allowed the country to develop as much as Central and Western countries of the continent, and much of its infrastructure is, on average, less able to withstand earthquakes with such a magnitude. For example, a collapse of the Vidraru dam would result in the subsequent flooding of the Curtea De Arges large town and Pitesti city, which alone would involve thousands of fatal casualties throughout the Muntenia region. A collapse of the Vidra dam would result in the flooding and widespread destruction of Oltenia’s one of the most important cities - Ramnicu-Valcea. In Moldova, the “Izvorul Muntelui” dam would also be vulnerable to an M8 earthquake in Vrancea, and any form of collapse would cause devastating effects in the entire area of the country. In Transylvania, the Gilau I dam would also be notably vulnerable if an M8+ earthquake occurs in Vrancea, and its collapse would devastate the second most important city of Romania - Cluj-Napoca. A final example would involve the Lacul Morii Dam, which is located in the Northwest of Bucharest and whose collapse would result in the flooding of up to 30% of the capital city, which in turn would potentially result in tens of thousands of fatal casualties, given the fact that the city currently contains a human population exceeding 2 million. According to Grok 3 beta’s DeepSearch modelling, an M8+ earthquake in Vrancea would likely cause the Vidraru, Bolboci, Lacul Morii, Siriu and Valea Uzului dams to collapse, whilst other river dams like Vidra, Izvorul Muntelui and Gilau I would less likely collapse, though risks would still be notable.
Conclusion
Southeastern Europe is currently situated in a statistically significant area of risk with regards to a potential occurrence of an unprecedented seismic event, given the gathered geological, mathematical and statistical evidence throughout the past several decades. According to scientific evidence, local and national authorities would be required to prepare extensive plans of preparation in case such events actually occur, in order for the local and national populations to be extensively prepared, and have the availability of provisional resources fulfilling their most primary human needs for survival. Levels of concern would be based on the fact that the Carpathian mountains are located within the Alpine-Himalayan ring of mountains, that the Vrancea region is located in an area of significant tectonic vulnerability as a result of the steep curvature of the Southeastern Carpathians, that the Indian plate has continued to exert a tectonic pressure upon the Eurasian plate, as the Himalayan Mountains have continued to grow in their altitude above sea level; that the Carpathian mountains are relatively proximally to both the African and the Eurasian plates, and that the African plate is in a continuous motion toward the Eurasian plate at an average speed of 2,15 cm per year, meaning that any eventual occurrence of unprecedented clashes in the tectonic fault underneath Vrancea, Romania, and implicitly, any potential risks that particularly intense earthquakes will occur in the future, cannot be fully eliminated, given that the African plate’s ongoing movement toward the Balkan Peninsula, which could have been favouring an increase in a transfer of tectonic stress via the Eurasian plate due to a “chain reaction” of tectonic stress transfers as a result of multiple M7.5+ seismic events occurring in distinct areas of the Himalayan-Alpine ring. Currently, the African plate is situated at a distance of approximately 1,750 km from Romania, and 200 kilometres from the Eurasian plate via the Eastern Mediterranean area, which could be raising fears of more easily accessible tectonic interactions between the African and the Eurasian plates around Asia Minor. Both the European Parliament and perhaps eventually the United Nations’ General Assembly as well should, in the author’s utmost humble opinion, bring the current subject to an immediate debate, as any seismic activity exceeding M8 would likely cause tremendous losses in human life and financial expenditure, particularly in Southeastern Europe, where the general living conditions are lower than in Western European countries. It may be critical to raise scientific and academic awareness about the existing, major statistical probability that an unprecedentedly large-scale seismic event may occur in Romania and cause devastating effects for the quality of life and economic wellbeing of several Southeastern European countries, dragging the entire European Union into significant challenges as a result. It may be that such large-scale seismic activity would bring repercussions in the world economy, given that Romania is rich in natural resources and is a member of the North Atlantic Treaty Organisation (NATO), the European Economic Area (EEA) and the Schengen Area. The fact that, on the 23rd of April 2025, a Richter M6.2 earthquake occurred underneath the Sea of Marmara - at a depth of 10 kilometres, having also been felt in widespread areas of the Balkan Peninsula, as well as in Romania - should probably constitute a reminder for Southeastern European countries to devise extensive earthquake plans, as experts have indicated the existence of a 50% probability that an M7+ seismic event will occur within the Anatolian fault line by 2030 as well. Furthermore, novel astrophysical hypotheses regarding the existence of considerable electromagnetic influences from various planetary and stellar alignment events should not be rapidly disregarded, but thoroughly tested using utmost rigorous procedures of scientific testing, to ensure an utter balance that eliminates both alarmist and reductionist forms of misinformation from important spaces of scientific research and innovation. It may be important to emphasise upon Albert Einstein’s three great quotes about ideal scientific perspectives and mindset, in which His Excellency stressed that problem resolution may only successfully occur if regular change of mind is practiced through humility, that various phenomena ultimately occur behind “the curtains” of coincidences and paradoxes, and that an unspoken principle of interest applies Universally to the utmost letter of rigour, meaning that each approach is faced with self-amplification in focus, whether such an approach is performed consciously or not; willingly or not.
References
- Isaic-Maniu, A.; Gogu, E.; Dragan, I.M.; Constantin, F. The Risk of Earthquakes in Romania-A Statistical Point of View. Economic Computation & Economic Cybernetics Studies & Research 2024, 58. https://ecocyb.ase.ro/nr2024_3/1_AlexandruIsaicManiu_EmiliaGogu.pdf.
- Roman, C. Seismicity in Romania—evidence for the sinking lithosphere. Nature 1970, 228, 1176–1178. [Google Scholar] [CrossRef]
- Vlad, I.; Vlad, M. Behavior of dwellings during strong earthquakes in Romania. In Proceedings of the 14th World Conference on Earthquake Engineering; 2008. https://www.iitk.ac.in/nicee/wcee/article/14_S29-002.PDF.
- Enescu, B.; Enescu, D.; Ito, K. Values of b and p: their variations and relation to physical processes for earthquakes in Japan and Romania. Rom. J. Phys. 2011, 56, 590–608. https://www.researchgate.net/profile/Bogdan-Enescu/publication/266291957_Values_of_b_and_p_Their_variations_and_relation_to_physical_processes_for_earthquakes_in_Japan_and_Romania/links/54b6b6470cf2e68eb27ef916/Values-of-b-and-p-Their-variations-and-relation-to-physical-processes-for-earthquakes-in-Japan-and-Romania.pdf.
- Armaş, I.; Toma-Danila, D.; Ionescu, R.; Gavriş, A. Vulnerability to earthquake hazard: Bucharest case study, Romania. International Journal of Disaster Risk Science 2017, 8, 182–195. [Google Scholar] [CrossRef]
- Imoto, M.; Hurukawa, N. Assessing potential seismic activity in Vrancea, Romania, using a stress-release model. Earth, Planets and Space 2006, 58, 1511–1514. [Google Scholar] [CrossRef]
- Gutenberg, B.; Richter, C.F. Earthquake magnitude, intensity, energy, and acceleration. Bulletin of the Seismological Society of America 1942, 32, 163–191. [Google Scholar] [CrossRef]
- Atkinson, G.M.; Boore, D.M. Earthquake ground-motion prediction equations for eastern North America. Bulletin of the Seismological Society of America 2006, 96, 2181–2205. [Google Scholar] [CrossRef]
- Pavel, F. Evaluation of Key PSHA Assumptions—Case-Study for Romania. Geosciences 2021, 11, 70. [Google Scholar] [CrossRef]
- Raileanu, V.; Bala, A.; Hauser, F.; Prodehl, C.; Fielitz, W. Crustal properties from S-wave and gravity data along a seismic refraction profile in Romania. Tectonophysics 2005, 410, 251–272. [Google Scholar] [CrossRef]
- Petrescu, L.; Plăcintă, A.O.; Borleanu, F.; Radulian, M.; Cioflan, C. Past earthquake simulations using ambient seismic noise in Vrancea, Romania. Seismological Research Letters 2023, 94, 2373–2383. [Google Scholar] [CrossRef]
- Scholz, N.A. Development of a global spatio-temporal seismicity model and its application to the Vrancea Seismic Zone, Romania. Doctoral Dissertation, Open Access Te Herenga Waka-Victoria University of Wellington, 2007. [Google Scholar] [CrossRef]
- Enescu, B.; Ghita, C.; Moldovan, I.A.; Radulian, M. Revisiting Vrancea (Romania) intermediate-depth seismicity: some statistical characteristics and seismic quiescence testing. Geosciences 2023, 13, 219. [Google Scholar] [CrossRef]
- Torsvik, T.H.; Rehnström, E.F.; Mosar, J. The tectonic evolution of the Alpine–Himalayan orogenic belt: A review. Earth-Science Reviews 2006, 76, 1–31. [Google Scholar]
- Searle, M.P.; Treloar, P.J. Himalayan tectonics: A review of the late Cenozoic structures and processes. Journal of the Geological Society 2006, 163, 433–448. [Google Scholar]
- Berge-Thierry, C.; Cotton, F.; Scotti, O.; Griot-Pommera, D.A.; Fukushima, Y. New empirical response spectral attenuation laws for moderate European earthquakes. Journal of Earthquake Engineering 2003, 7, 193–222. [Google Scholar] [CrossRef]
- Sokolov, V.; Bonjer, K.-P.; Wenzel, F.; Grecu, B.; Radulian, M. Ground-motion prediction equations for the intermediate depth Vrancea (Romania) earthquakes. Bulletin of Earthquake Engineering 2008, 6, 367–388. [Google Scholar] [CrossRef]
- Delavaud, E.; Scherbaum, F.; Cotton, F.; Stafford, P. Toward a ground-motion logic tree for probabilistic seismic-hazard assessment in Europe. Journal of Seismology 2012, 16, 451–473. [Google Scholar] [CrossRef]
- Akkar, S.; Sandıkkaya, M.A.; Bommer, J.J. Empirical ground-motion models for point- and extended-source crustal earthquake scenarios in Europe and the Middle East. Bulletin of Earthquake Engineering 2014, 12, 359–387. [Google Scholar] [CrossRef]
- Boore, D.M.; Stewart, J.P.; Seyhan, E.; Atkinson, G.M. NGA-West2 equations for predicting PGA, PGV, and 5 %-damped PSA for shallow crustal earthquakes. Earthquake Spectra 2014, 30, 1057–1085. [Google Scholar] [CrossRef]
- Bindi, D.; Massa, M.; Luzi, L.; Ameri, G.; Pacor, F.; Puglia, R.; Augliera, P. Pan-European ground-motion prediction equations for the average horizontal component of PGA, PGV, and 5 %-damped PSA at spectral periods up to 3.0 s using the RESORCE dataset. Bulletin of Earthquake Engineering 2014, 12, 391–430. [Google Scholar] [CrossRef]
- Campbell, K.W.; Bozorgnia, Y. NGA-West2 ground motion model for the average horizontal components of PGA, PGV, and 5 %-damped linear acceleration response spectra. Earthquake Spectra 2014, 30, 1087–1115. [Google Scholar] [CrossRef]
- Cauzzi, C.; Faccioli, E.; Vanini, M.; Bianchini, A. Updated predictive equations for broadband (0.01–10 s) horizontal response spectra and peak ground motions, based on a global dataset of digital acceleration records. Bulletin of Earthquake Engineering 2015, 13, 1587–1612. [Google Scholar] [CrossRef]
- King, G.C.P.; Stein, R.S.; Lin, J. Static stress changes and the triggering of earthquakes. Bulletin of the Seismological Society of America 1994, 84, 935–953. [Google Scholar] [CrossRef]
- Bommer, J.J.; Douglas, J.; Scherbaum, F.; Cotton, F.; Bungum, H.; Fäh, D. On the selection of ground-motion prediction equations for seismic hazard analysis. Seismological Research Letters 2010, 81, 783–793. [Google Scholar] [CrossRef]
- Stein, R.S. The role of stress transfer in earthquake occurrence. Philosophical Transactions of the Royal Society A: Mathematical, Physical and Engineering Sciences 1999, 357, 1887–1900. [Google Scholar] [CrossRef]
- Gomberg, J.; Ellsworth, W.L. Earthquake triggering by seismic waves following the Landers and Hector Mine earthquakes. Nature 1998, 411, 462–466. [Google Scholar] [CrossRef] [PubMed]
- Brodsky, E.E.; Dmowska, R. Remote triggering of earthquakes: Mechanisms and observations. Current Science 2004, 87, 1065–1072. [Google Scholar]
- Wesnousky, S.G. Remote triggering of earthquakes. In Encyclopedia of Complexity and Systems Science; Kanamori, H., Ed.; Springer, 2008; pp. 7595–7607. [Google Scholar] [CrossRef]
- Hill, D.P.; Prejean, S.G. Dynamic triggering. In Treatise on Geophysics; Kanamori, H., Ed.; Springer, 2007; Volume 4, pp. 257–291. [Google Scholar] [CrossRef]
- Dumitru, T.A.; Marin, C.; Popescu, R. Far-field tectonic effects of the India–Eurasia collision: Implications for stress propagation toward the Carpathian region. Tectonophysics 2009, 474, 1–14. [Google Scholar] [CrossRef]
- Hainzl, S.; Zöller, G. Modeling aftershock triggering by dynamic stress perturbations. Journal of Geophysical Research: Solid Earth 2006, 111. [Google Scholar]
- Hardebeck, J.L.; Hauksson, E. Crustal stress field in southern California and its implications for fault mechanics. Journal of Geophysical Research: Solid Earth 2001, 106, 21859–21882. [Google Scholar] [CrossRef]
- Parsons, T.; Dreger, D. Static-stress impact of the 1992 Landers earthquake sequence on nucleation and slip at the site of the 1999 M = 7.1 Hector Mine earthquake, southern California. Geophysical Research Letters 2000, 27, 1949–1952. [Google Scholar] [CrossRef]
- Freed, A.M.; Lin, J. The potential for dynamic triggering of earthquakes by Rayleigh waves: Evidence from northern California. Journal of Geophysical Research: Solid Earth 2001, 106, 16499–16514. [Google Scholar] [CrossRef]
- Belardinelli, M.E.; Bizzarri, A.; Cocco, M. Earthquake triggering by static and dynamic stress changes. Journal of Geophysical Research: Solid Earth 2003, 108, 2135. [Google Scholar] [CrossRef]
- Freed, A.M. Earthquake triggering by static, dynamic, and postseismic stress transfer. Annual Review of Earth and Planetary Sciences 2005, 33, 335–367. [Google Scholar] [CrossRef]
- Toda, S.; Stein, R.S.; Richards-Dinger, K.; Bozkurt, S.B. Forecasting the evolution of seismicity in southern California: Animations built on earthquake stress transfer. Journal of Geophysical Research: Solid Earth 2005, 110, B05S16. [Google Scholar] [CrossRef]
- Pollitz, F.F.; Sacks, I.S. Stress triggering of the 1999 Hector Mine earthquake by transient deformation following the 1992 Landers earthquake. Bulletin of the Seismological Society of America 2002, 92, 1487–1496. [Google Scholar] [CrossRef]
- Pollitz, F.F. Post-seismic relaxation theory on laterally heterogeneous viscoelastic model. Geophysical Journal International 2003, 155, 57–78. [Google Scholar] [CrossRef]
- Pollitz, F.F.; Bürgmann, R.; Banerjee, P. Postseismic relaxation following the great 2004 Sumatra–Andaman earthquake on a compressible self-gravitating Earth. Geophysical Journal International 2006, 167, 397–420. [Google Scholar] [CrossRef]
- Perfettini, H.; Schmittbuhl, J.; Cochard, A. Shear and normal load perturbations on a two-dimensional continuous fault: 1. Static triggering. Journal of Geophysical Research: Solid Earth 2003, 108, 2042. [Google Scholar] [CrossRef]
- Perfettini, H.; Schmittbuhl, J.; Cochard, A. Shear and normal load perturbations on a two-dimensional continuous fault: 2. Dynamic triggering. Journal of Geophysical Research: Solid Earth 2003, 108, 2409. [Google Scholar] [CrossRef]
- Wesnousky, S.G. Crustal deformation processes and the stability of the Gutenberg-Richter relationship. Bulletin of the Seismological Society of America 1999, 89, 1131–1137. [Google Scholar] [CrossRef]
- Olsson, R. An estimation of the maximum b-value in the Gutenberg-Richter relation. Journal of Geodynamics 1999, 27, 547–552. [Google Scholar] [CrossRef]
- Perez-Oregon, J.; Muñoz-Diosdado, A.; Rudolf-Navarro, A.H.; Guzmán-Sáenz, A.; Angulo-Brown, F. On the possible correlation between the Gutenberg-Richter parameters of the frequency-magnitude relationship. Journal of Seismology 2018, 22, 1025–1035. [Google Scholar] [CrossRef]
- Burk, K.; Dewey, J.F. Two plates in Africa during the Cretaceous? Nature 1974, 249, 313–316. [Google Scholar] [CrossRef]
- Chase, C.G. Plate kinematics: The Americas, East Africa, and the rest of the world. Earth and Planetary Science Letters 1978, 37, 355–368. [Google Scholar] [CrossRef]
- Rosenbaum, G.; Lister, G.S.; Duboz, C. Relative motions of Africa, Iberia and Europe during Alpine orogeny. Tectonophysics 2002, 359, 117–129. [Google Scholar] [CrossRef]
- Westaway, R. Present-day kinematics of the plate boundary zone between Africa and Europe, from the Azores to the Aegean. Earth and Planetary Science Letters 1990, 96, 393–406. [Google Scholar] [CrossRef]
- Burke, K. The african plate. South African Journal of Geology 1996, 99, 341–409. https://hdl.handle.net/10520/EJC-942801f20.
- Mcclusky, S.; Balassanian, S.; Barka, A.; Demir, C.; Ergintav, S.; Georgiev, I.; Gurkan, O.; Hamburger, M.; Hurst, K.; Kahle, H.; Kastens, K. Global Positioning System constraints on plate kinematics and dynamics in the eastern Mediterranean and Caucasus. Journal of Geophysical Research: Solid Earth 2000, 105, 5695–5719. [Google Scholar] [CrossRef]
- Argus, D.F.; Gordon, R.G.; DeMets, C.; Stein, S. Closure of the Africa-Eurasia-North America plate motion circuit and tectonics of the Gloria fault. Journal of Geophysical Research: Solid Earth 1989, 94, 5585–5602. [Google Scholar] [CrossRef]
- Erdik, M. Earthquake risk in Turkey. Science 2013, 341, 724–725. [Google Scholar] [CrossRef]
- Taymaz, T.; Tan, O.; Yolsal, S. Active tectonics of Turkey and surroundings and seismic risk in the Marmara Sea Region. In Proceedings of the 1st International Workshop on Active Monitoring in the Earth Geophysics (IWAM04), Mizunami, Japan; 2004. Extended Abstract Book. pp. 110–115. https://web.itu.edu.tr/~taymaz/docs/Taymaz_IWAM04_S3-09.pdf.
- Tosun, H.; Zorluer, İ.; Orhan, A.; Seyrek, E.; Savaş, H.; Türköz, M. Seismic hazard and total risk analyses for large dams in Euphrates basin, Turkey. Engineering Geology 2007, 89, 155–170. [Google Scholar] [CrossRef]
- Tabuchi, S.; Sanders, R. Current and Emerging Insurance Markets–Earthquake Models and Risk Transfer Technology. https://www.researchgate.net/profile/Shigeko-Tabuchi/publication/228822608_CURRENT_AND_EMERGING_INSURANCE_MARKETS-EARTHQUAKE_MODELS_AND_RISK_TRANSFER_TECHNOLOGY/links/00b7d52e8e999dd1a8000000/CURRENT-AND-EMERGING-INSURANCE-MARKETS-EARTHQUAKE-MODELS-AND-RISK-TRANSFER-TECHNOLOGY.pdf.
- Koutsoupakis, I.; Tsompanakis, Y.; Soupios, P.; Kirmizakis, P.; Kaka, S.; Providakis, C. Seismic Risk Assessment of Chania, Greece, Using an Integrated Computational Approach. Applied Sciences 2021, 11, 11249. [Google Scholar] [CrossRef]
- Moshou, A. Investigating Seismic Events along the Eurasian Plate between Greece and Turkey: 10 Years of Seismological Analysis and Implications. Earth 2024, 5, 17. [Google Scholar] [CrossRef]
- Bahrouni, N.; Masson, F.; Meghraoui, M.; Saleh, M.; Maamri, R.; Dhaha, F.; Arfaoui, M. Active tectonics and GPS data analysis of the Maghrebian thrust belt and Africa-Eurasia plate convergence in Tunisia. Tectonophysics 2020, 785, 228440. [Google Scholar] [CrossRef]
- Letamo, A.; TP, T. Seismicity pattern of African regions from 1964–2022: b-value and energy mapping approach. Geomatics, Natural Hazards and Risk 2023, 14, 2197104. [Google Scholar] [CrossRef]
- Beghoul, N.; Chatelain, J.L.; Boughacha, M.S.; Benhallou, H.; Dadou, R.; Mezioud-Saïch, A. Seismic empirical relations for the Tellian Atlas, North Africa, and their usefulness for seismic risk assessment. Pure and Applied Geophysics 2010, 167, 277–321. [Google Scholar] [CrossRef]
- Poggi, V.; Garcia-Peláez, J.; Styron, R.; Pagani, M.; Gee, R. A probabilistic seismic hazard model for North Africa. Bulletin of Earthquake Engineering 2020, 18, 2917–2951. [Google Scholar] [CrossRef]
- Dogru, A.; Gorgun, E.; Aktug, B.; Ozener, H. Seismic hazard assessment of the central North Anatolian Fault (Turkey) from GPS-derived strain rates and b-values. Geomatics, Natural Hazards and Risk 2018, 9, 356–367. [Google Scholar] [CrossRef]
- Binder, D. Human Causality and Seismic Risks in Turkey. 2023. [Google Scholar] [CrossRef]
- El Moudden, T.; Amnai, M.; Choukri, A.; Fakhri, Y.; Gherabi, N. The Influence of the Planet's Positions on Earthquakes Events: New Evidence Using Built Data. [CrossRef]
- Babayev, E.S.; Allahverdiyeva, A.A. Effects of geomagnetic activity variations on the physiological and psychological state of functionally healthy humans: some results of Azerbaijani studies. Advances in Space Research 2007, 40, 1941–1951. [Google Scholar] [CrossRef]
- Mostafa, H. Enhancing Volcanology Prediction Capabilities through Machine Learning and Data Analysis. 2023. [Google Scholar]
- Mukherjee, S. Cosmic influence on the sun-earth environment. Sensors 2008, 8, 7736–7752. [Google Scholar] [CrossRef] [PubMed]
- Gheonjian, L.A. On the Place and Role of Astronomy and Astrophysics in the Emerging New Model of Education. Communications of the Byurakan Astrophysical Observatory (ComBAO) 2022, 69, 187–192. http://93.187.165.86/Content/359471/187-192.pdf. [CrossRef]
- Sotala, K.; Gloor, L. Superintelligence as a cause or cure for risks of astronomical suffering. Informatica 2017, 41. https://www.informatica.si/index.php/informatica/article/view/1877.
- Lewin, C.G. The emergence of compound interest. British Actuarial Journal 2019, 24, e34. [Google Scholar] [CrossRef]
- Nadarajah, S.; Popović, B.; Ristić, M. Compounding: An R package for computing continuous distributions obtained by compounding a continuous and a discrete distribution. Computational Statistics 2013, 28, 977–992. [Google Scholar] [CrossRef]
- Tahir, M.H.; Cordeiro, G.M. Compounding of distributions: A survey and new generalized classes. Journal of Statistical Distributions and Applications 2016, 3, 13. [Google Scholar] [CrossRef]
- Jordan, D. Teaching the time value of money: Advantages of the continuous compounding (exponential) model. Journal of Instructional Techniques in Finance 2015, 5, 22. [Google Scholar] [CrossRef]
- Wagenaar, W.A.; Sagaria, S.D. Misperception of exponential growth. Perception & Psychophysics 1975, 18, 416–422. [Google Scholar] [CrossRef]
- Cosentino, P.; Ficara, V.; Luzio, D. Truncated exponential frequency–magnitude relationship in earthquake statistics. Bulletin of the Seismological Society of America 1977, 67, 1615–1623. [Google Scholar] [CrossRef]
- Kijko, A.; Sellevoll, M.A. Estimation of earthquake hazard parameters from incomplete data files. Part I. Utilization of extreme and complete catalogs with different threshold magnitudes. Bulletin of the Seismological Society of America 1989, 79, 645–654. [Google Scholar] [CrossRef]
- Kijko, A.; Sellevoll, M.A. Estimation of earthquake hazard parameters from incomplete and uncertain data files. Natural Hazards 1990, 3, 1–13. [Google Scholar] [CrossRef]
- Zöller, G.; Holschneider, M.; Hainzl, S. Parameter estimation for doubly truncated Gutenberg–Richter distribution by means of maximum likelihood and the method of non-linear regression. Natural Hazards and Earth System Sciences 2010, 10, 1425–1438. [Google Scholar]
- Nikolaidēs, E. Science and Eastern Orthodoxy: From the Greek Fathers to the Age of Globalization. JHU Press, 2011. [Google Scholar]
- Benouar, D. Earthquake Risk in Africa. 2005. https://www.humanitarianlibrary.org/sites/default/files/2014/02/Benouar-Booklet-Disaster-Community.pdf.
- Holschneider, M.; Zöller, G.; Hainzl, S. Estimation of the maximum possible magnitude in the framework of a doubly truncated Gutenberg–Richter model. Bulletin of the Seismological Society of America 2011, 101, 1649–1659. [Google Scholar] [CrossRef]
Disclaimer/Publisher’s Note: The statements, opinions and data contained in all publications are solely those of the individual author(s) and contributor(s) and not of MDPI and/or the editor(s). MDPI and/or the editor(s) disclaim responsibility for any injury to people or property resulting from any ideas, methods, instructions or products referred to in the content. |
© 2025 by the authors. Licensee MDPI, Basel, Switzerland. This article is an open access article distributed under the terms and conditions of the Creative Commons Attribution (CC BY) license (http://creativecommons.org/licenses/by/4.0/).
Copyright: This open access article is published under a Creative Commons CC BY 4.0 license, which permit the free download, distribution, and reuse, provided that the author and preprint are cited in any reuse.


