Submitted:
14 April 2025
Posted:
15 April 2025
You are already at the latest version
Abstract
In order to improve the accuracy and efficiency of personalized offer strategies in the retail industry, a dynamic pricing and personalized recommendation system is constructed based on multi-source data fusion and intelligent decision-making models. Analyzing the homogenization problem of traditional offer strategies, deep learning and reinforcement learning algorithms are used to optimize the construction of user profiles, the prediction of purchasing behavior and the generation of offer strategies. The results show that the intelligence-driven personalized Go-to-market strategy effectively improves the user conversion rate and customer unit price, optimizes the inventory turnover efficiency, and enhances the ability to accurately deploy marketing resources. Further research can focus on data privacy protection, cross-platform adaptability and computational cost optimization to enhance the stability and value of the strategy.
Keywords:
retail industry
; personalized Go-to-market strategy
; dynamic pricing
; user profiling
1. Introduction
The market environment of the retail industry has become increasingly complex, and consumer demand has become highly personalized, making it difficult for traditional promotional strategies to adapt to the dynamically changing consumption patterns. Offers based on fixed discounts and uniform full reductions fail to accurately match the needs of individual users, resulting in a waste of promotional resources and limited marketing conversion effect. Static rule setting cannot make full use of multi-source data, and it is difficult to accurately identify users' price sensitivity, purchasing preference and life cycle value, so the homogenization of promotional strategies is becoming more and more prominent. In this context, the technology system relying on large-scale data analysis and accurate prediction provides a new optimization path for retail personalized offer strategies. The combination of dynamic pricing and personalized recommendation technology makes it possible to adjust the discount strength, reach timing, and promotional methods in real time according to user characteristics and market fluctuations, thus improving conversion efficiency and customer unit price. This study focuses on the optimization of personalized offer strategies by building a data-driven intelligent decision-making system, exploring accurate pricing, and optimizing marketing placement paths to achieve a more efficient retail promotion model.
2. The Value of Artificial Intelligence in Retail
The application value of AI in the retail field stems from its data-driven accurate decision-making and dynamic optimization capabilities. In traditional retail scenarios, consumer behavior data is scattered in heterogeneous data from multiple sources, such as transaction records, browsing tracks, and external environments, making it difficult for manual analysis to achieve real-time insight and personalized response. By integrating machine learning and deep learning algorithms, artificial intelligence technology can efficiently process terabytes of unstructured data, build multi-dimensional customer profiles, and identify key features such as consumption preferences, price sensitivity, and lifecycle value [1]. On this basis, the system can dynamically generate differentiated offer strategies, continuously optimize discount strength, offer timing and reach channels through reinforcement learning models, and realize accurate placement of marketing resources.
3. Design of Retail Personalized Offer System Based on Artificial Intelligence
3.1. Overall System Architecture
The AI-based retail personalized offer system adopts a layered, decoupled architecture (Figure 1), supporting both batch and streaming data processing through the Lambda framework. The bottom layer uses Kafka to collect POS logs, mobile user data, and third-party SDK streams. Data cleaning, feature encoding, and anomaly detection are performed in parallel via Spark (batch) and Flink (stream), processing 1.2 TB of raw data daily and extracting 327-dimensional features, including temporal behavior sequences and spatial heat patterns.The middle layer integrates an XGBoost-based purchase propensity model and a Transformer-driven dynamic pricing algorithm to generate differentiated strategies based on customer clustering. The real-time pricing module maintains a response latency under 47ms [2]. The application layer delivers dynamic coupons to the CRM system via RESTful API and evaluates strategy effectiveness through the ABTest framework.
3.2. Data Acquisition and Preprocessing Module
The data collection and preprocessing module adopts a multi-source heterogeneous data fusion framework (Figure 2), covering 15 types of data sources online and offline, including POS transaction logs (daily average of 2.3 million entries), APP buried event streams (peak of 12,000 events per second) and third-party geo-fencing data (accuracy ±10m). The preprocessing process realizes the transformation of raw data to usable features through three stages of quality control (Table 1): firstly, outlier transaction records are eliminated based on the Grubbs test of sliding window, secondly, the missing behavioral sequences are complemented with context-awareness using the LSTM-Attention model, and finally, periodic features are extracted by the time-series decomposition formula [3]:
Among them, Trendt is extracted using Hodrick-Prescott filtering, and Seasonalityt fits the daily/weekly cycle pattern via Fourier series. The processed feature set contains 327-dimensional structured vectors, which are stored in a distributed feature repository to provide high-quality inputs for downstream modeling.
3.3. Customer Profile Building Module
The customer profile module adopts a multi-dimensional feature fusion and refinement framework (Figure 3), combining statistical selection and model-driven optimization to enhance feature utility and efficiency. The system comprises three layers: the basic attribute layer integrates eight static demographic variables; the behavioral analysis layer uses Transformer-XL to capture long-range patterns over 90-day sliding windows; the value assessment layer applies RFM metrics and customer lifecycle prediction via Weibull survival analysis [4]:
To reduce redundancy and retain high-impact features, the module applies a two-stage selection strategy: (1) univariate filtering using mutual information and information gain to retain the top 40% features; (2) multivariate filtering via minimum redundancy maximum relevance (mRMR) to ensure independence and discrimination. This process narrows the original 327-dimensional space to 142 key features. Correlation is evaluated using Pearson coefficients (continuous), Cramér’s V (categorical), and cosine similarity (embedded vectors), with features exceeding |r| > 0.85 removed to prevent multicollinearity.Feature importance and weight assignment rely on Gini coefficients from the XGBoost model. A dynamic weight layer adjusts weights based on temporal relevance and interaction frequency. For example, price sensitivity shows a dominant weight of Wps=0.32±0.07, while low-SHAP features are down-weighted. All numerical features are standardized via z-score, and categorical embeddings are reduced with PCA to improve efficiency without compromising semantic integrity.Profiles are updated in real time via Flink. When a user’s daily behavioral events exceed Q=15Q = 15Q=15, incremental features are recalculated and pushed to the policy engine through the Redis pipeline with μs-level latency, ensuring timely and accurate decision inputs.
3.4. Go-to-Market Strategy Generation Module
Go-to-market strategy generation module adopts the collaborative decision-making architecture of rule engine and AI model, and realizes the organic integration of traditional business rules and machine learning prediction through dynamic weight allocation formula. The module is designed with a dual-channel decision-making mechanism: the rule engine executes preset strategies based on the Drools framework (e.g., 32 types of business logic, such as the first order reduction for new customers, inventory clearance rules, etc.), while the XGBoost model outputs real-time probabilities of preferential tendencies based on the customer profiles, and the two generate the final strategies through a weighted voting mechanism, with the weight coefficients α dynamically adjusted by Thompson sampling [5]:
where Srule is the rule engine confidence score, with an initial value of α of 0.6. The real-time decision flow completes policy synchronization with an average latency of 120ms through the Redis Pub/Sub channel (Table 2), and automatically switches to the rule-dominant mode to ensure business constraint prioritization when the inventory pressure index, Istock, is > 0.8.
4. Algorithm Design and Implementation of Personalized Offer Strategies
4.1. Customer Segmentation Algorithm
Customer clustering is foundational to personalized Go-to-market strategies, aiming to accurately represent user purchasing behavior and support targeted marketing. The system applies unsupervised clustering, combining K-Means, Gaussian Mixture Model (GMM), and Spectral Clustering for multi-level user classification based on diverse feature sets.Core attributes—such as RFM metrics, price sensitivity, and consumption cycles—are extracted from the original 327-dimensional vectors and reduced to 12 principal components using PCA, balancing computational efficiency with information preservation. K-Means++ initializes cluster centers, while DBSCAN identifies anomalies to refine initial distributions. For nonlinear, high-dimensional data, GMM enhances clustering using the EM (Expectation Maximization) algorithm to estimate user affiliation probabilities [6]:
Where πi is the mixture weight, μi,Σi are the mean and covariance matrix of the ith Gaussian distribution, respectively. Clustering quality is evaluated via Silhouette Score, while cosine similarity assesses category stability. When the mean deviation across clusters falls below 0.02, results are stored in the distributed repository and mapped to the preference strategy engine for dynamic personalization.
4.2. Prediction Model of Purchasing Behavior
The purchase behavior prediction model adopts Transformer-XL, selected for its ability to capture long-range temporal dependencies in user interactions—crucial for modeling evolving intent in high-frequency retail data. Benchmarking against BiLSTM and GRU showed Transformer-XL outperformed with a 4.2% higher AUC and 28% faster convergence, supporting its use as the core sequential model.The model processes three feature types: (1) static attributes (e.g., gender, membership level, 8 dimensions); (2) temporal behaviors (clicks, add-to-carts, payments) using 7, 30, and 90-day sliding windows; and (3) contextual variables such as promotion status and time of day. Temporal data is embedded into 256-dimensional dense vectors for sequence modeling.The computation core employs multi-head attention and relative position encoding, formulated as [7]:
where Rij denotes the relative position bias matrix of position i and j. Hyperparameters are optimized via Bayesian Optimization with the Tree-structured Parzen Estimator (TPE). The optimal configuration: learning rate = 2e-4, heads = 8, dropout = 0.2, embedding dim = 256. To address class imbalance, Focal Loss is applied with gamma = 2.0 and alpha = 0.75.A five-fold time-based cross-validation evaluates model performance, yielding AUC = 0.867, F1-score = 0.73, and Precision@5 = 0.62. SHAP analysis confirms consistent feature importance, with top contributors including recency, payment interval deviation, and promotion frequency.The model is deployed via Flink, enabling real-time inference with <50ms latency. Drift detection (e.g., entropy shift in feature distribution) is continuously monitored to trigger weekly online retraining when significant shifts occur (Table 3).
4.3. Preferential Program Recommendation Algorithm
The offer recommendation algorithm is built on a multi-objective deep reinforcement learning (DRL) framework to optimize offer type, face value, and delivery timing. Inputs include 327-dimensional customer portraits, recent 30-minute behavioral data, and contextual signals such as inventory pressure and budget constraints. The action space is the Cartesian product of 7 offer types, 4 face values, and 3 timing slots.The reward function combines three objectives:
where ΔCR\Delta CRΔCR is conversion rate change, ΔROI is return on investment, and ΔIS reflects inventory stress reduction. To manage trade-offs (e.g., high ROI vs. broad conversion), the system applies Pareto frontier approximation, using discretized reward space and non-dominated sorting to maintain diversity. The weights α,β,γ are initialized at (0.48, 0.35, 0.17) and updated via population-based optimization based on policy performance variance. To ensure stability and convergence, the DDQN framework integrates soft target updates (τ=0.005) and gradient clipping (threshold = 1.0). An ε-greedy strategy with decay manages exploration, and reward normalization avoids gradient bias. The loss function includes TD error regularization and entropy-based smoothing to stabilize updates. A Graph Attention Network (GAT) models relationships among users, products, and offers, with edge weights updated per episode based on recent interaction strength. The inference engine, built on Flink and Redis, supports real-time recommendation of up to 10,000 SKUs within 200ms latency.Finally, the policy security layer embeds a Constraint Satisfaction Problem (CSP) model to filter infeasible actions, such as those violating brand discount rules or inventory limits [8].
4.4. Real-Time Dynamic Pricing Algorithm
The real-time dynamic pricing algorithm uses a deep deterministic policy gradient (DDPG) framework to construct a price elasticity response model, which achieves dynamic optimization of pricing strategy by fusing real-time demand forecast and inventory state. The model input contains 128-dimensional state feature vectors composed of three parts: market state (category real-time demand increase rate, competitor price index), inventory characteristics (turnover days, demurrage risk score) and user profiles (individual price elasticity coefficient, historical discount sensitivity). The action space is defined as the price adjustment range interval [-12%,+8%], and the strategy evaluation and execution are decoupled by a two-delay network (TD3) structure, whose objective function is based on the improved Bellman equation [9]:
where the instant reward rt is calculated by weighting the amount of gross profit change ΔG after price adjustment with the amount of conversion rate improvement ΔC:
The feature engineering layer integrates the sliding window statistic (standard deviation of the near 1-hour transaction price) with the periodic pattern extracted by the GRU time-series encoder. To prevent price oscillations, the output layer of the strategy network uses the Tanh activation function to constrain the adjustment amplitude, and the quadratic programming model to ensure that the price adjustment does not break the category price band boundary condition Pmin≤pt≤1.2P\avg.
5. System Experimentation and Effectiveness Evaluation
5.1. Data Set Construction
The dataset construction of this study is based on the integration of online and offline multi-channel retail data, covering four major types of data sources: POS transaction logs, APP user behavior data, geo-fence trajectory information and promotional activity response records. The dataset covers the period from January 2023 to January 2024, and contains 32 million transaction records, 1.4 billion click events, and 78 million user path trajectory points, of which member user data accounts for 67.2%, forming a high-quality personalized marketing training sample. A three-stage quality control process (Table 4) is used in the data cleaning session, where abnormal transaction values are eliminated based on Grubbs test and missing behavioral sequences are filled in using the LSTM-Attention model to ensure the integrity of the time series features. To enhance the temporal dynamic characteristics of the dataset, snapshots of user behaviors at 7-day, 30-day, and 90-day granularity are constructed based on the sliding window strategy, and periodic consumption patterns are extracted by Fourier transform (Figure 4) [10]. Eventually, the processed dataset contains 327-dimensional high-dimensional feature vectors, which are stored in a distributed feature warehouse to provide high-quality input for subsequent personalized Go-to-market strategy generation.
5.2. Assessment of Indicators
To evaluate the optimization effect of the AI-driven personalized Go-to-market strategy, a multi-dimensional indicator system is used, covering user conversion rate, customer unit price growth, offer placement accuracy, inventory turnover, and model efficiency. User conversion rate reflects the impact of personalized offers on purchasing behavior, calculated as the ratio of purchases to offer exposures (Table 5). Customer unit price growth assesses the effect of discount strategies through year-over-year comparison. Accuracy combines prediction deviation with actual purchase matching. Inventory turnover is measured by turnover days and the proportion of slow-moving items post-promotion, indicating discount strategies' impact on inventory flow. To ensure real-time performance, model efficiency is evaluated by inference delay and offer generation response time, with the former kept within 50ms. These metrics collectively reflect the system’s optimization effectiveness and provide quantitative support for experimental evaluation.
5.3. Analysis of Experimental Results
The experiment compares and analyzes the effect of personalized Go-to-market strategy in different user groups, and focuses on measuring core indicators such as user conversion rate, customer unit price growth, and inventory turnover efficiency. The results show that after adopting the AI-optimized personalized Go-to-market strategy, the user conversion rate increased from 7.8% to 13.2%, and the customer unit price increased by 18.5% on average, with the most significant growth in the high-value user group (Figure 6). In addition, the precision of offer placement has been significantly improved, and the utilization rate of personalized recommended offers has increased by 23.6% compared to the baseline strategy. In terms of inventory turnover, the dynamic discount strategy effectively reduces the proportion of slow-moving items, with a reduction of 2.4 days in turnover days, and the optimization effect is particularly prominent in high-traffic product categories. The experimental results show that the AI-driven personalized discount strategy not only improves the utilization efficiency of marketing resources, but also demonstrates significant advantages in user experience optimization and inventory management, providing strong data support for the intelligent marketing of retail enterprises.
6. Conclusions
The optimization of personalized offer strategies has shown significant value in the retail industry. The data-driven refined operation model enables the effective implementation of technologies such as dynamic pricing and precise recommendation, which plays an important role in enhancing user conversion rate, optimizing inventory management and improving the utilization efficiency of marketing resources. The fusion of heterogeneous data from multiple sources, the application of deep learning models, and the introduction of reinforcement learning strategies provide solid support for the construction of an accurate and efficient offer decision-making system. However, the optimization of personalized strategies still faces the challenges of data privacy protection, real-time improvement and cross-platform adaptability, and the balance between algorithm generalization capability and computational cost still needs to be further explored. In the future, in-depth research can be conducted on federated learning, cross-modal data fusion and more adaptive intelligent decision-making frameworks to improve strategy stability and scalability to better adapt to the complex and changing market environment.
References
- Kishen R, Upadhyay S, Jaimon F, et al. Prospects for artificial intelligence implementation to design personalized customer engagement strategies[J]. Pt. 2 J. Legal Ethical & Regul. Isses, 2021, 24: 1.
- Cao L. Artificial intelligence in retail: applications and value creation logics[J]. International Journal of Retail & Distribution Management, 2021, 49(7): 958-976. [CrossRef]
- Kumaravelu A. THE IMPACT OF MACHINE LEARNING ON PROMOTIONAL STRATEGIES: A STUDY OF AI-POWERED COUPON PERSONALIZATION[J]. INTERNATIONAL JOURNAL OF ENGINEERING AND TECHNOLOGY RESEARCH (IJETR), 2024, 9(2): 168-176.
- Anica-Popa I, Anica-Popa L, Rădulescu C, et al. The integration of artificial intelligence in retail: benefits, challenges and a dedicated conceptual framework[J]. Amfiteatru Economic, 2021, 23(56): 120-136. [CrossRef]
- Gong, C., Zhong, Y., Zhao, S., & Liu, Y. (2025, January). Application of Machine Learning in Predicting Extreme Volatility in Financial Markets: Based on Unstructured Data. In The 1st International scientific and practical conference “Technologies for improving old methods, theories and hypotheses”(January 07–10, 2025) Sofia, Bulgaria. International Science Group. 2025. 405 p. (p. 47).
- Gong, C., Lin, Y., Cao, J., & Wang, J. (2024, October). Research on Enterprise Risk Decision Support System Optimization based on Ensemble Machine Learning. In Proceeding of the 2024 5th International Conference on Computer Science and Management Technology (pp. 1003-1007).
- Yang, J., Tian, K., Zhao, H., Feng, Z., Bourouis, S., Dhahbi, S., ... & Por, L. Y. (2025). Wastewater treatment monitoring: Fault detection in sensors using transductive learning and improved reinforcement learning. Expert Systems with Applications, 264, 125805. [CrossRef]
- Zhao H, Chen Y, Dang B, Jian X. Research on Steel Production Scheduling Optimization Based on Deep Learning.
- Jian X, Zhao H, Yang H, Lin Y. Self-Optimization of FDM 3D Printing Process Parameters Based on Machine Learning. InThe 24th International scientific and practical conference “Technologies of scientists and implementation of modern methods”(June 18–21, 2024) Copenhagen, Denmark. International Science Group. 2024. 431 p. 2024 Jun 18 (p. 369).
- Jian X, Zhao H, Yang H, Lin Y. Self-Optimization of FDM 3D Printing Process Parameters Based on Machine Learning. InThe 24th International scientific and practical conference “Technologies of scientists and implementation of modern methods”(June 18–21, 2024) Copenhagen, Denmark. International Science Group. 2024. 431 p. 2024 Jun 18 (p. 369).
Figure 1.
System Architecture Diagram.
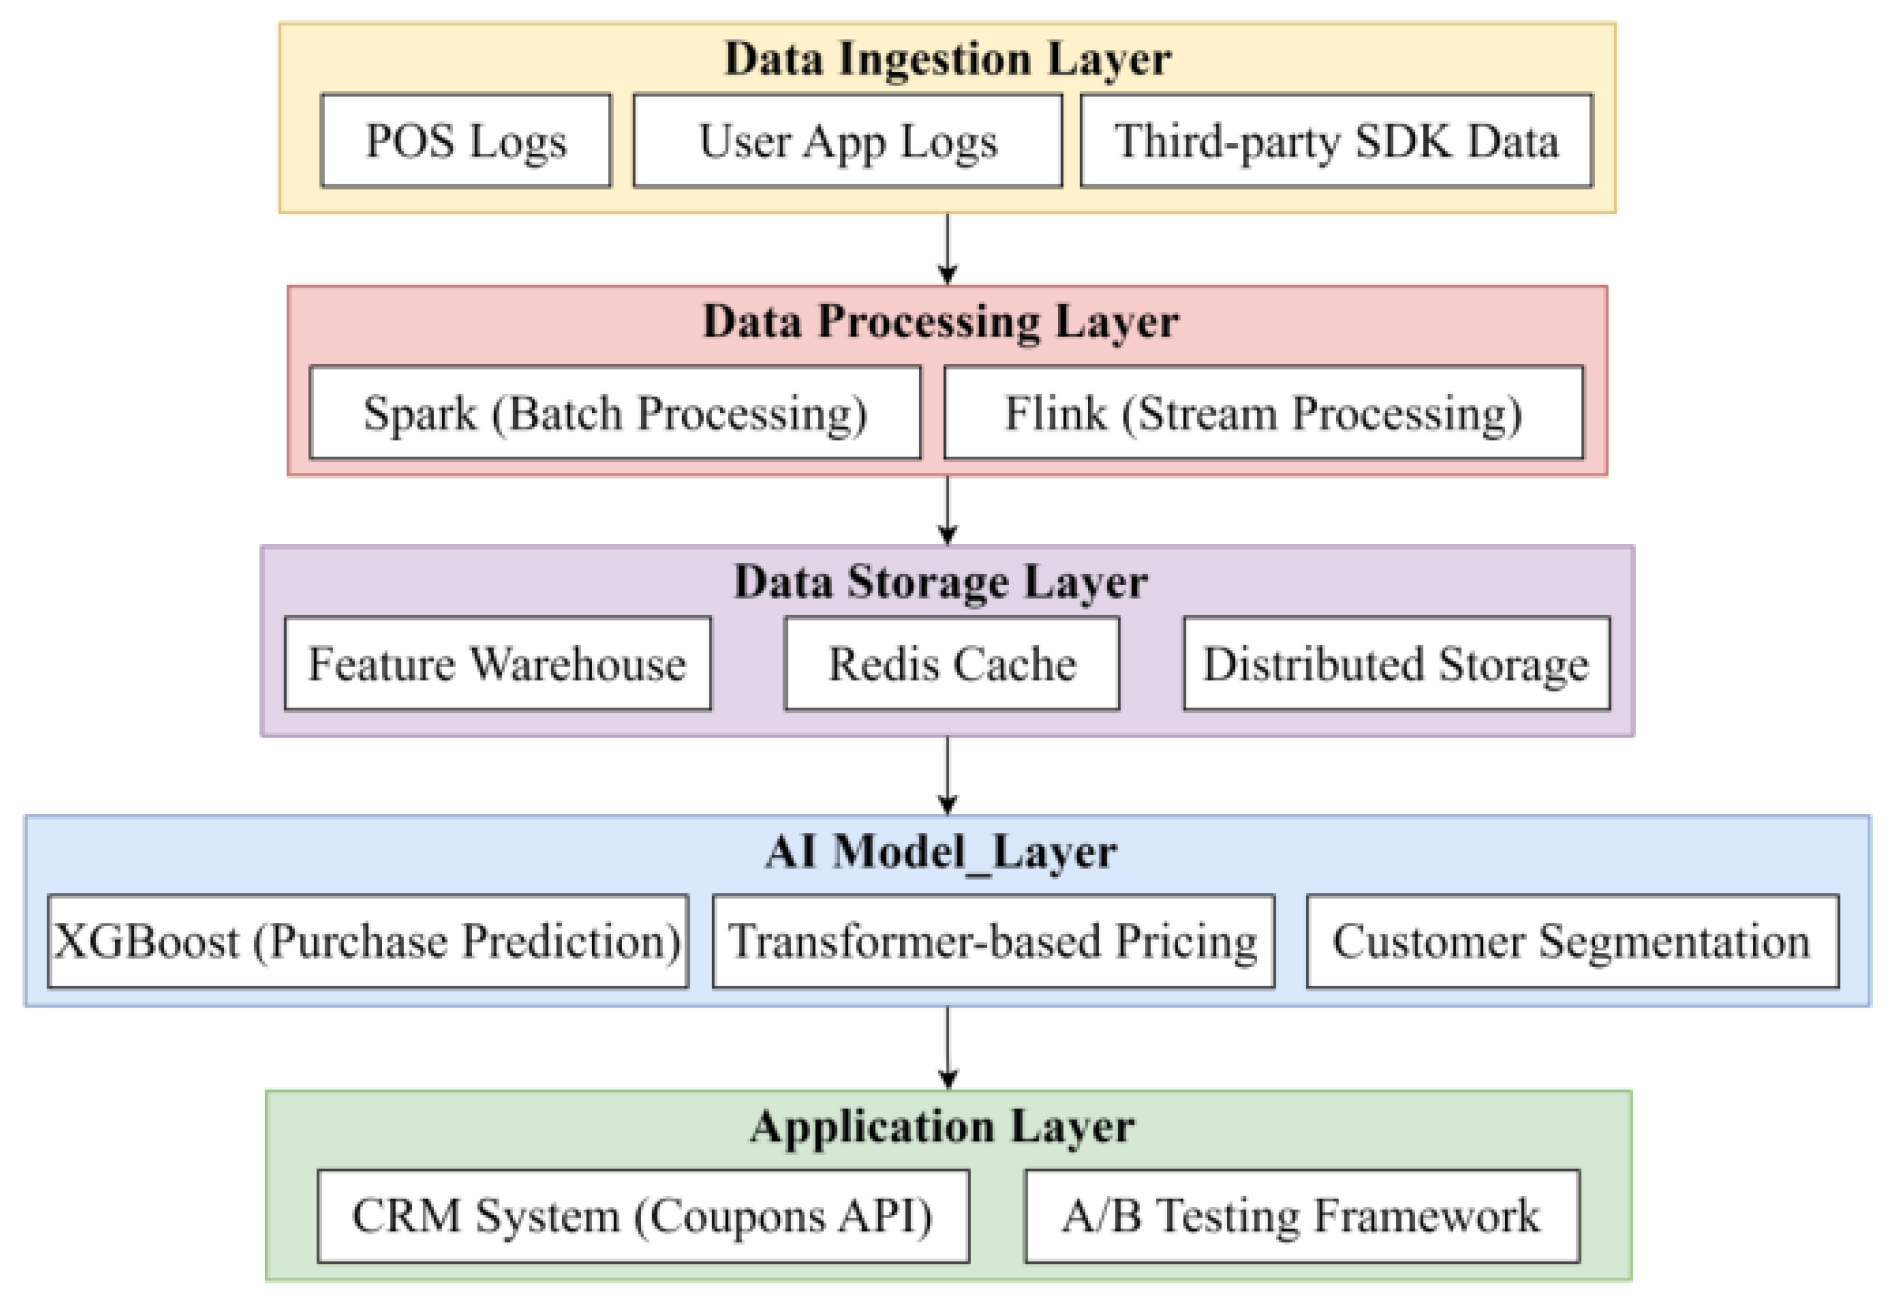
Figure 2.
Flowchart of multimodal retail data acquisition and processing.
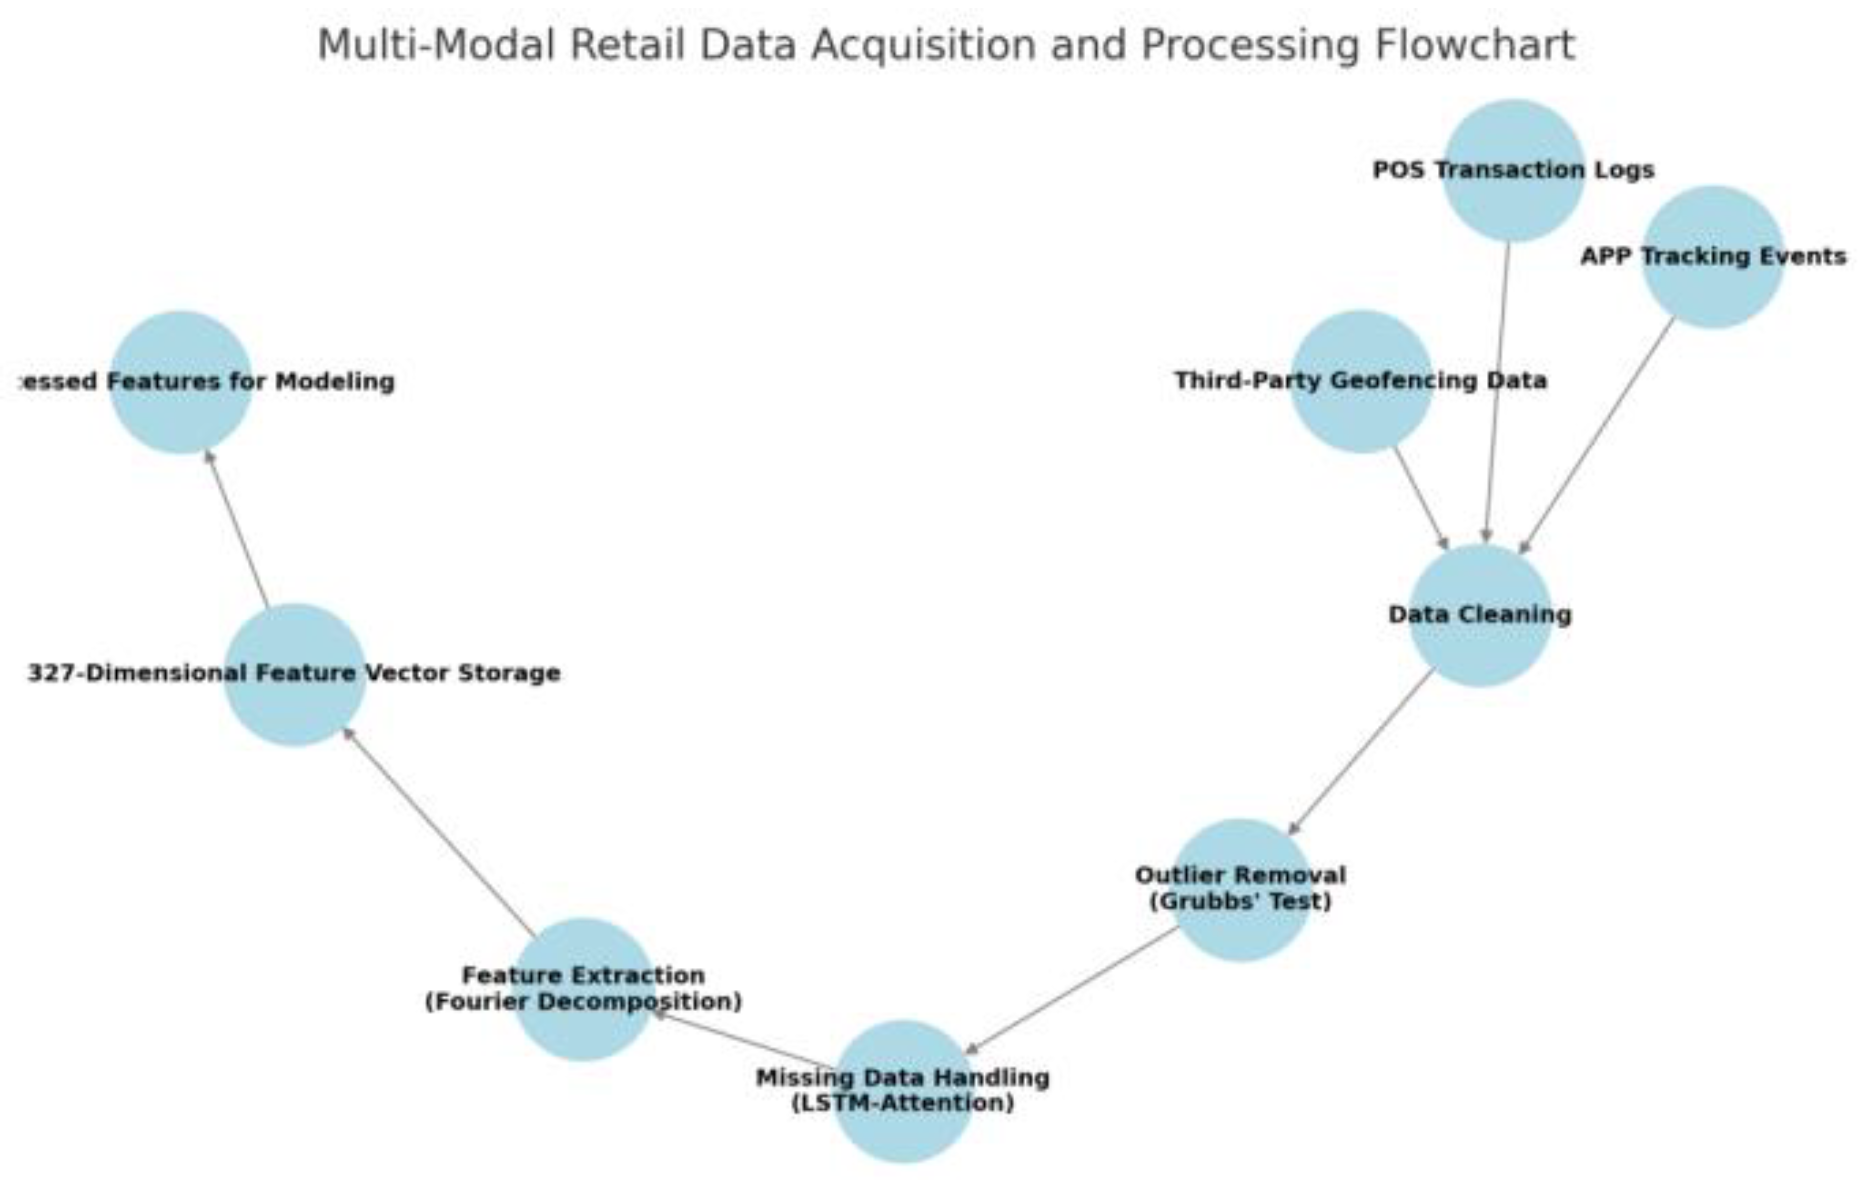
Figure 3.
Hierarchical feature system diagram of customer portrait.
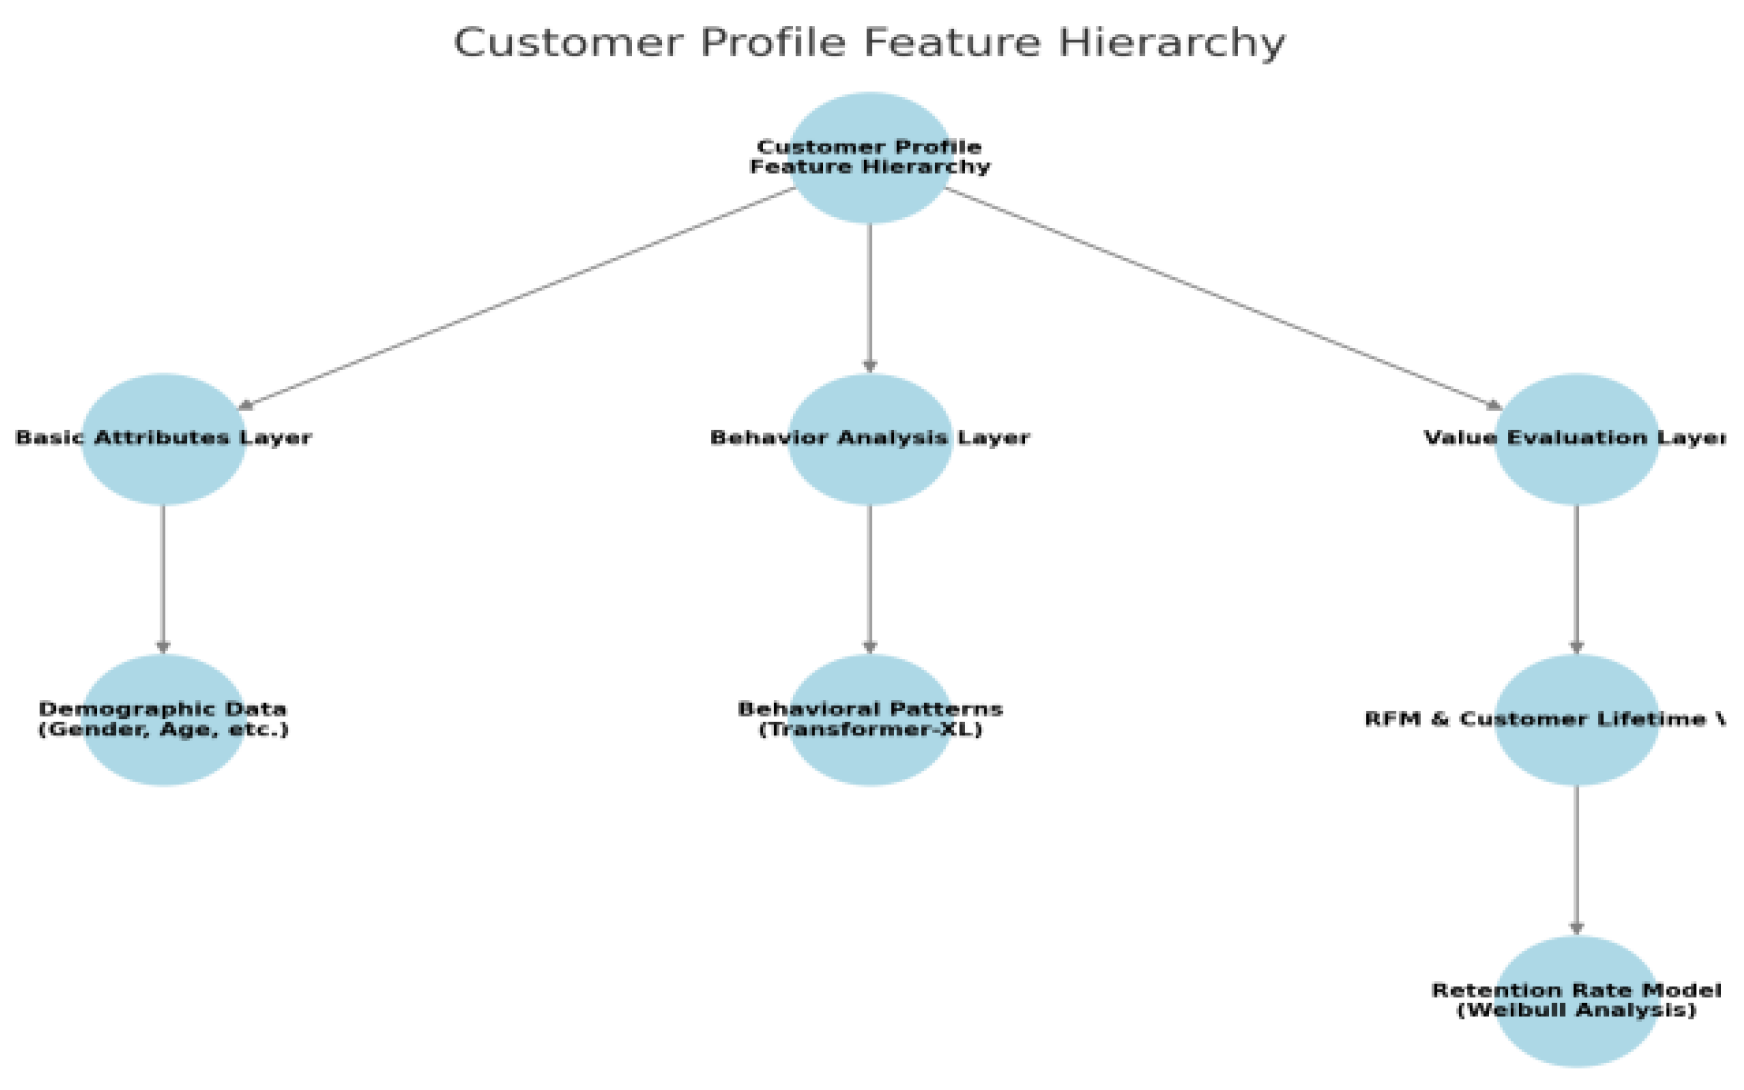
Figure 4.
Cyclical pattern of user consumption behavior.
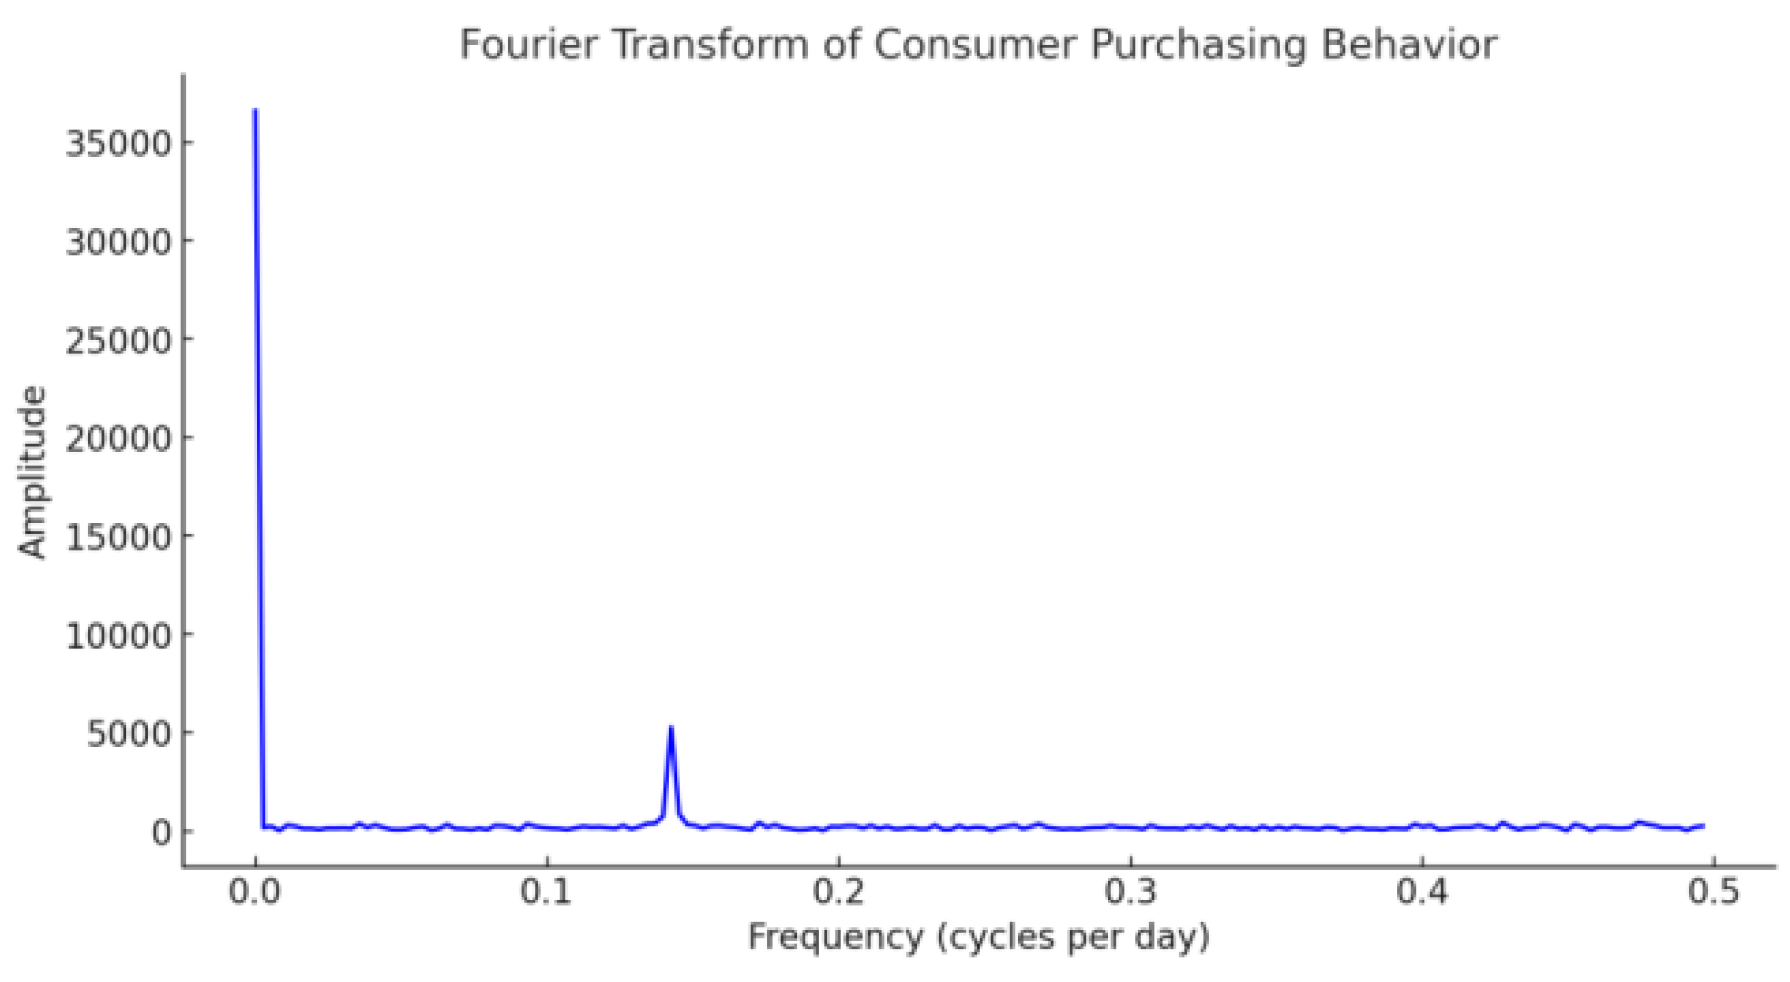
Figure 6.
Increase in customer unit price by personalized Go-to-market strategy under different user groups.
Figure 6.
Increase in customer unit price by personalized Go-to-market strategy under different user groups.
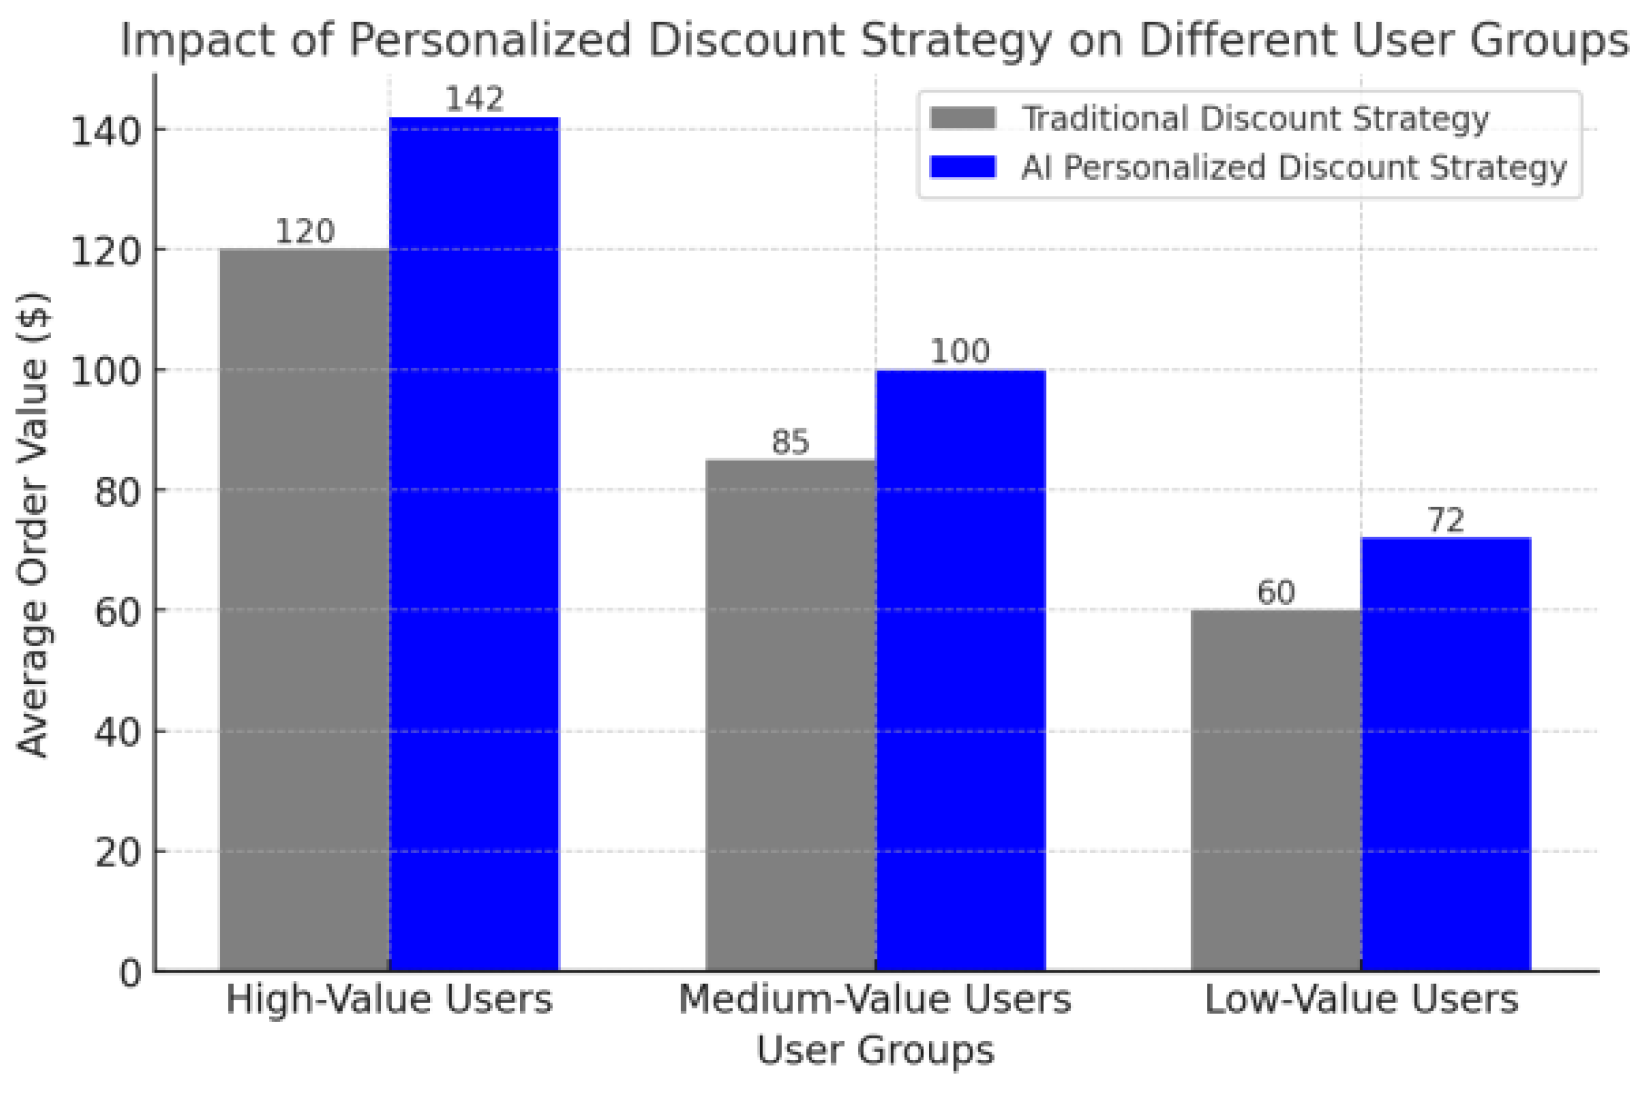

Table 1.
Data cleaning rules and exception handling mechanism.
| data type | Exception type | Detection Algorithms | processing strategy | Number of fields affected |
| Transaction amount | outlier | Grubbs test | Median replacement | 12/million bars |
| position track | drift point | DBSCAN clustering | trajectory interpolation | 7.3% records |
| click event | chronological disorder | Wasserstein Distance | Window Rearrangement | 18.6% Sessions |
Table 2.
Mapping of Policy Types to Generation Mechanisms.
| Type of strategy | Rule Engine Trigger Conditions | AI model input features | Decision weights α | response time |
| full-price coupon | Customer unit price > 120% of history | price elasticity coefficient | 0.55±0.08 | 78ms |
| discount coupon | Early warning of category slowdowns | Browse Depth Timing | 0.32±0.05 | 85ms |
| complimentary item | Membership Level Achievement | Cross-Category Relevance | 0.68±0.06 | 63ms |
Table 3.
Combination of features of purchase behavior prediction model.
| Feature type | Examples of features | Processing technology | dimension (math.) |
| static property | Membership Level, City Level | One-Hot coding | 32 |
| chronological behavior | Frequency of additions in the last 30 days, standard deviation of payment intervals | LSTM temporal coding | 256 |
| contextual characterization | Current time period, promotion ID | Embedding mapping | 128 |
Table 4.
Data cleaning rules and exception handling strategies.
| data type | Exception type | Detection Algorithms | processing strategy | Proportion of impact data |
| Transaction amount | outlier | Grubbs test | Median replacement | 12/million bars |
| position track | drift point | DBSCAN clustering | trajectory interpolation | 7.3% Records |
| click event | chronological disorder | Wasserstein Distance | Window Rearrangement | 18.6% Conversation |
Table 5.
Indicators for calculating user conversion rate.
| norm | formula | frame of reference |
| User conversion rate (%) | (Number of users purchasing/number of users receiving discounts)×100 | 5% - 15% |
| Preferential utilization rate (%) | (Number of users using the offer/number of users receiving the offer) x 100 | 10% - 30% |
| Repurchase rate (%) | (Number of users who purchased again within 30 days/number of users who purchased for the first time) x 100 | 20% - 50% |
Disclaimer/Publisher’s Note: The statements, opinions and data contained in all publications are solely those of the individual author(s) and contributor(s) and not of MDPI and/or the editor(s). MDPI and/or the editor(s) disclaim responsibility for any injury to people or property resulting from any ideas, methods, instructions or products referred to in the content. |
© 2025 by the authors. Licensee MDPI, Basel, Switzerland. This article is an open access article distributed under the terms and conditions of the Creative Commons Attribution (CC BY) license (http://creativecommons.org/licenses/by/4.0/).
Copyright: This open access article is published under a Creative Commons CC BY 4.0 license, which permit the free download, distribution, and reuse, provided that the author and preprint are cited in any reuse.


