Submitted:
11 April 2025
Posted:
14 April 2025
You are already at the latest version
Abstract
This study analyzes the economic performance and entrepreneurial dynamics in mountain commerce in Europe during 2021-2022, using 28 economic indicators (I1–I28). The results highlight a series of mixed trends, showing signs of resilience but also major challenges. The sector demonstrated notable stability, maintaining the number of active enterprises (I1) and recording an increase in the business survival rate (I6–I9). Additionally, there was an improvement in productivity (I25–I27), indicating that many businesses adapted to market demands.However, significant difficulties were also present, such as business closures (I5) and challenges in accessing funding (I8), which impacted the development of small and micro enterprises. Dependence on seasonal employment (I21) remained a major limiting factor, and some segments of the sector recorded low revenues (I19–I20), reflecting economic challenges in certain areas.Despite these challenges, the sector continued to show signs of adaptability and long-term growth potential. Progressive digitalization (I24) and the implementation of eco-friendly practices (I25) offer significant opportunities for development. Entrepreneurs' adaptability, combined with the adoption of new technologies and sustainability practices, suggests a possible path for growth and strengthening mountain commerce in the long run, despite financial challenges and seasonality.
Keywords:
mountain entrepreneurship
; mountain commerce
; and mountain economy
Introduction and Literature Review
The mountain area represents a distinct economic environment, characterized by both unique opportunities and specific challenges related to geographic isolation, seasonality, and limited access to resources. Trade in the mountain environment plays an essential role in supporting local economies by providing products and services to both resident communities and tourists. In recent years, this sector has experienced a mixed evolution, showing both resilience to economic disruptions and persistent difficulties.
This paper provides a comprehensive analysis of current trends, highlighting both the strengths of the sector and the necessary directions for its future consolidation. By examining Eurostat data and specific indicators, the study contributes to a deeper understanding of mountain entrepreneurship in trade and identifies effective support policies.
Traditionally, the primary sectors of the economy based on natural resources (agriculture and pastoralism, extractive industries, etc.) have been the driving forces of the mountain economy. However, in recent times, within the process of rural development, there has been a shift from a sectoral approach to a multisectoral one, moving beyond the limiting vision centered on the agricultural sector (Pan et al., 2024). This paradigm shift emphasizes the integration of non-agricultural opportunities into the rural economy (Navarro et al., 2016). Such diversification is essential for the sustainable development of these areas and for increasing the attractiveness of mountain regions (OECD, 2016).
In the context of limited economic opportunities, empirical evidence suggests that including economic diversification at the household level in mountain areas within rural development policies is crucial. Such policies can contribute to income growth, poverty reduction, curbing rural-to-urban migration, fostering entrepreneurship, and promoting self-employment (Robinson et al., 2004).
In mountain regions, promoting small-scale entrepreneurship is vital for economic diversification, resilience, and sustainable development (Nicula et al., 2023). It can also help reduce emigration, create local employment opportunities, and preserve cultural heritage and traditional knowledge unique to these communities. Moreover, gender-sensitive community initiatives ensure an equitable and sustainable impact in promoting value chains through entrepreneurial initiatives.
Entrepreneurial initiatives in mountain areas operate within a relatively narrow economic range, largely based on the agricultural sector. In this context, commercial entrepreneurial initiatives hold a special place. The small mountain household typically practices subsistence farming, especially in hard-to-reach areas. Nevertheless, a small portion of production is sold to traders, who come to mountain villages to buy directly from producers, or it is sold in mobile markets in urban areas. Traders pay producers in cash, or in some cases, barter is used. Usually, sale prices are lower, and traders face a lack of storage space. Products that cannot be stored are sold immediately after harvest. Mountain farmers mostly sell their products individually, which negatively affects their bargaining power. However, in recent years, within the EU-27, there has been an increase in the number of cooperatives and agricultural cooperation associations that could change this situation.
Products sold through traders are usually consumed outside the region. However, there are also entrepreneurial initiatives based on tourism activities, which market local products to tourists (as end consumers). Mountain agricultural products can reach consumers either indirectly—through local hotels and guesthouses, restaurants, or grocery stores—or directly from the producer.
Methodology
The article analyzes mountain entrepreneurship in the European commercial sector, with the reporting period being 2021-2022, and trends for the year 2025 (tables and figures). The statistical analysis refers to 28 mountain indicators related to European mountain entrepreneurship, with their explanations available in Eurostat or posted by the authors at the link https://doi.org/10.5281/zenodo.14713867. The analyzed countries are Austria, Bulgaria, Croatia, the Czech Republic, France, Germany, Greece, Italy, Poland, Portugal, Romania, Slovakia, Slovenia, Spain, and Sweden.
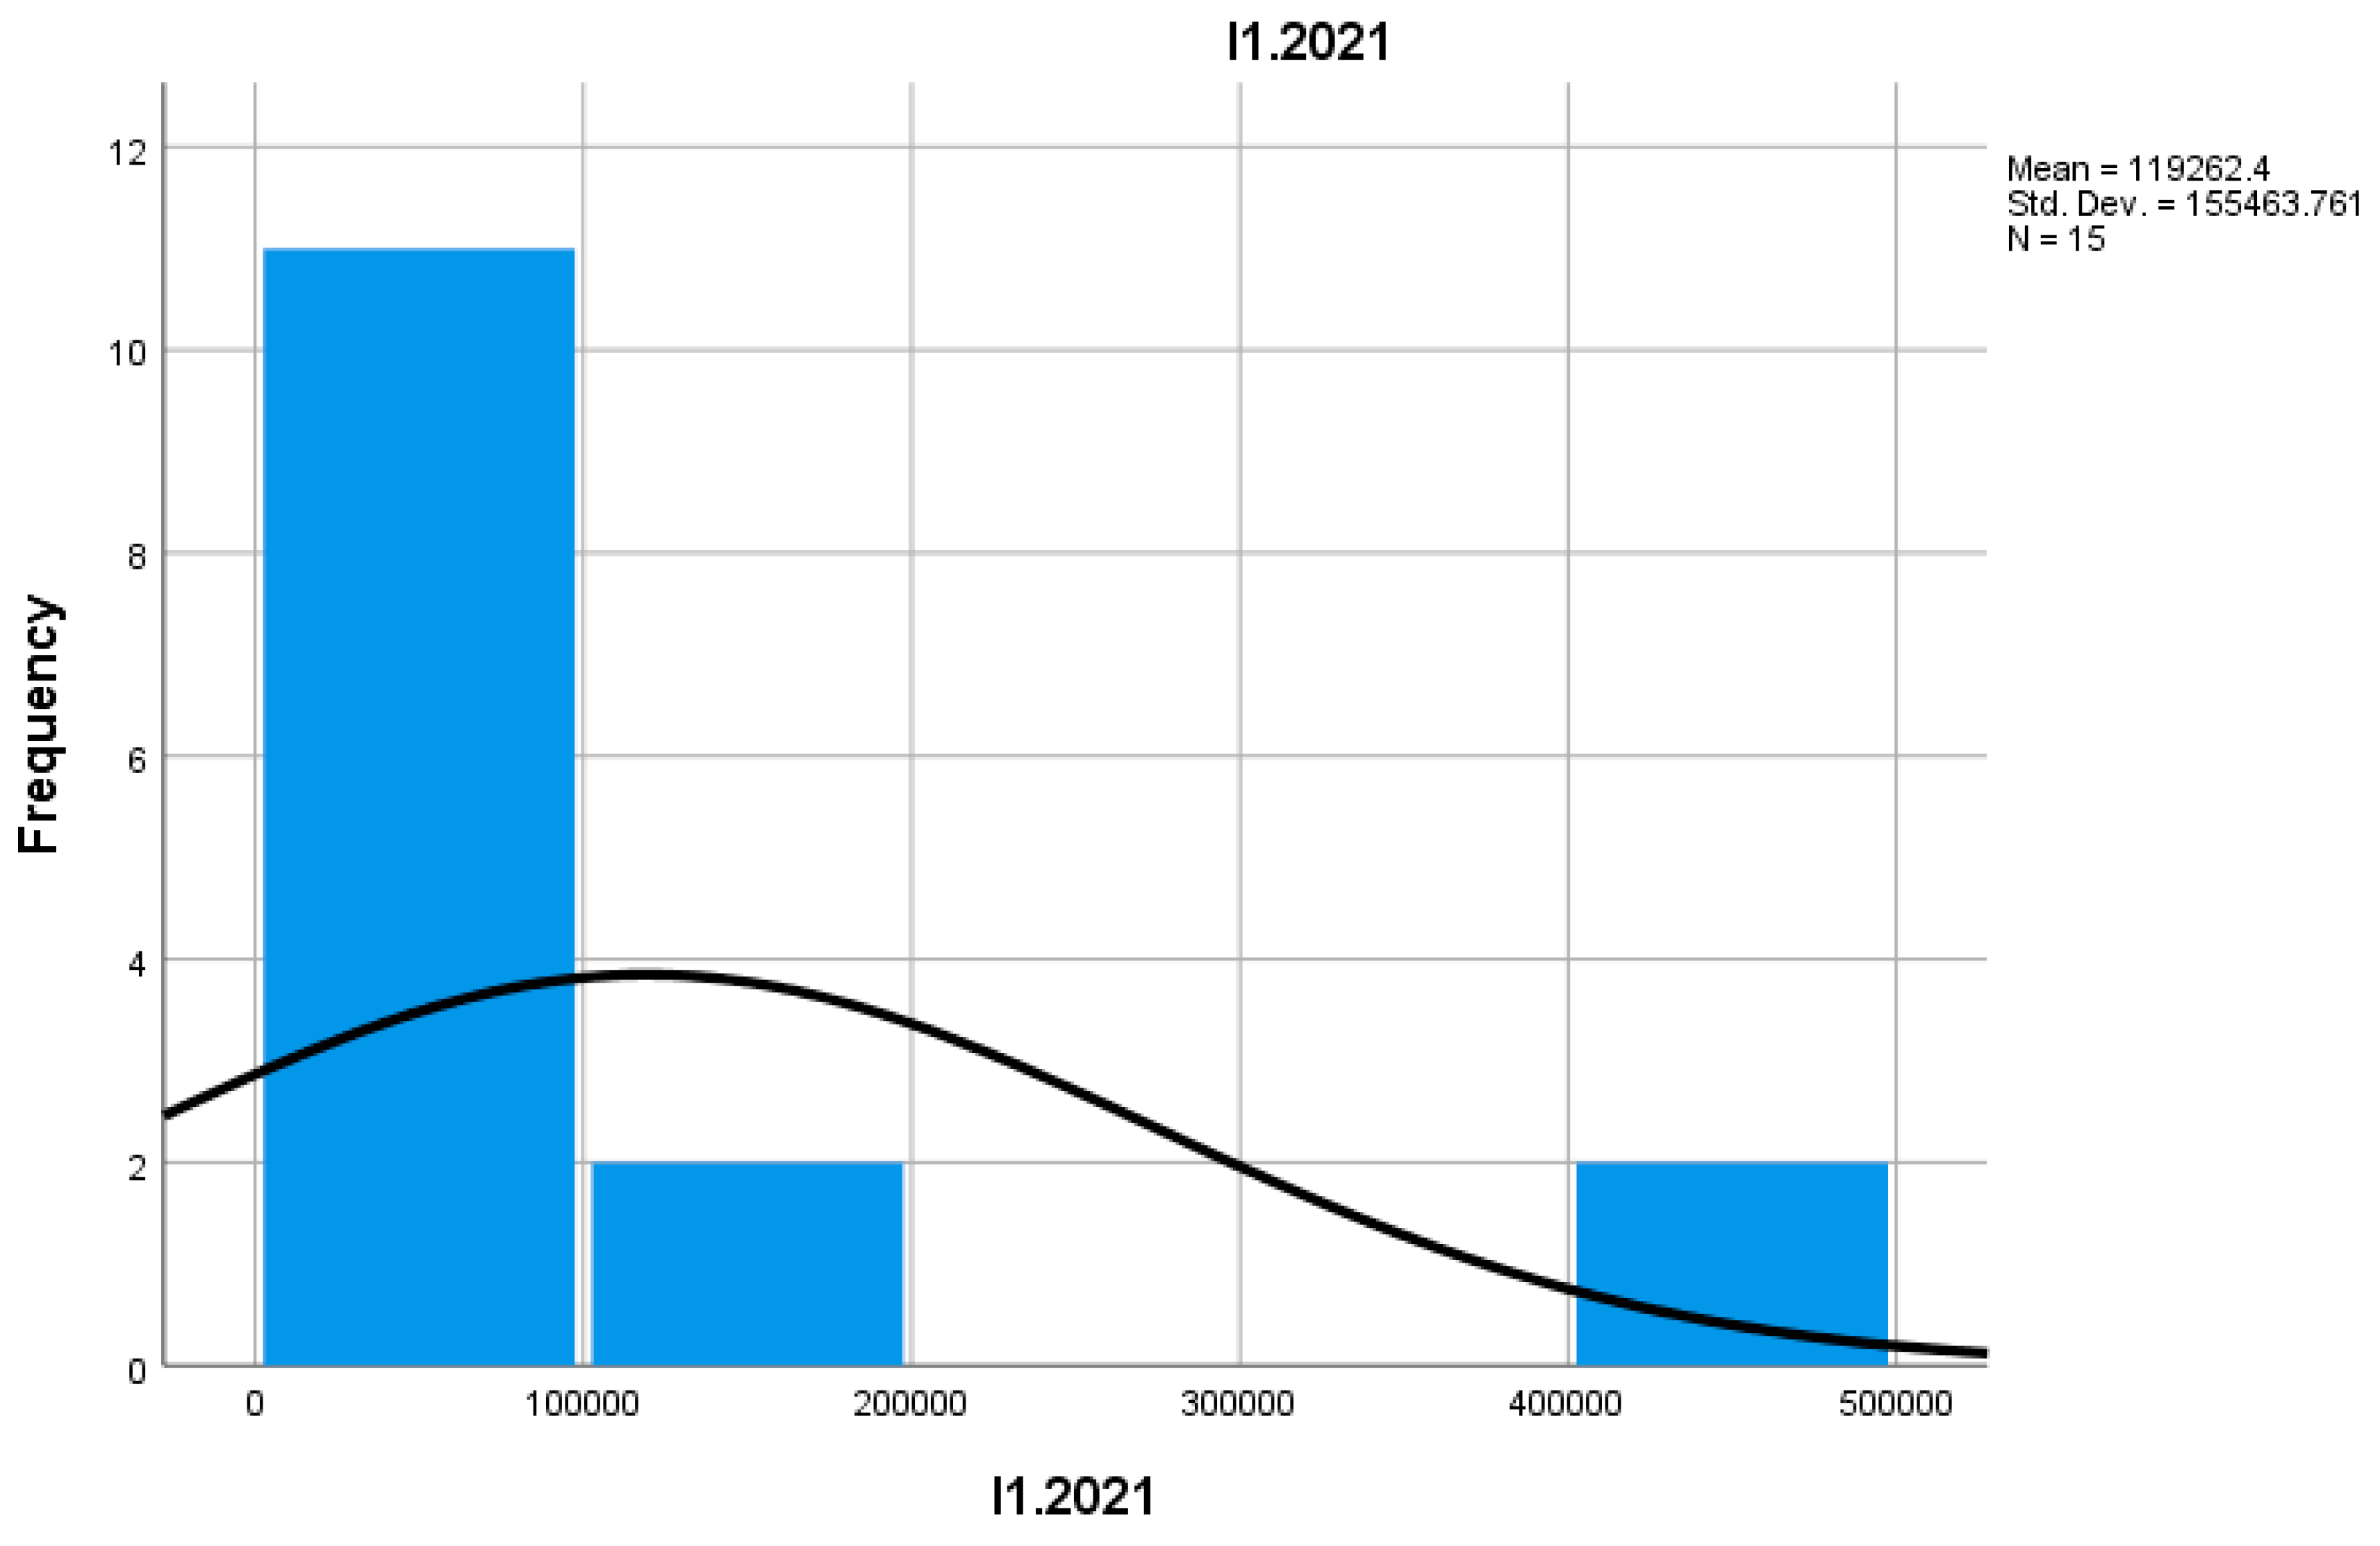
Indicator I1 measures the total number of active enterprises. According to data for 2021 and 2022, the number of active enterprises in mountain commerce recorded a significant increase in 2022 compared to 2021, indicating an improvement in the economic climate. This suggests the development of the sector and a greater attraction of investors and entrepreneurs to mountain areas.
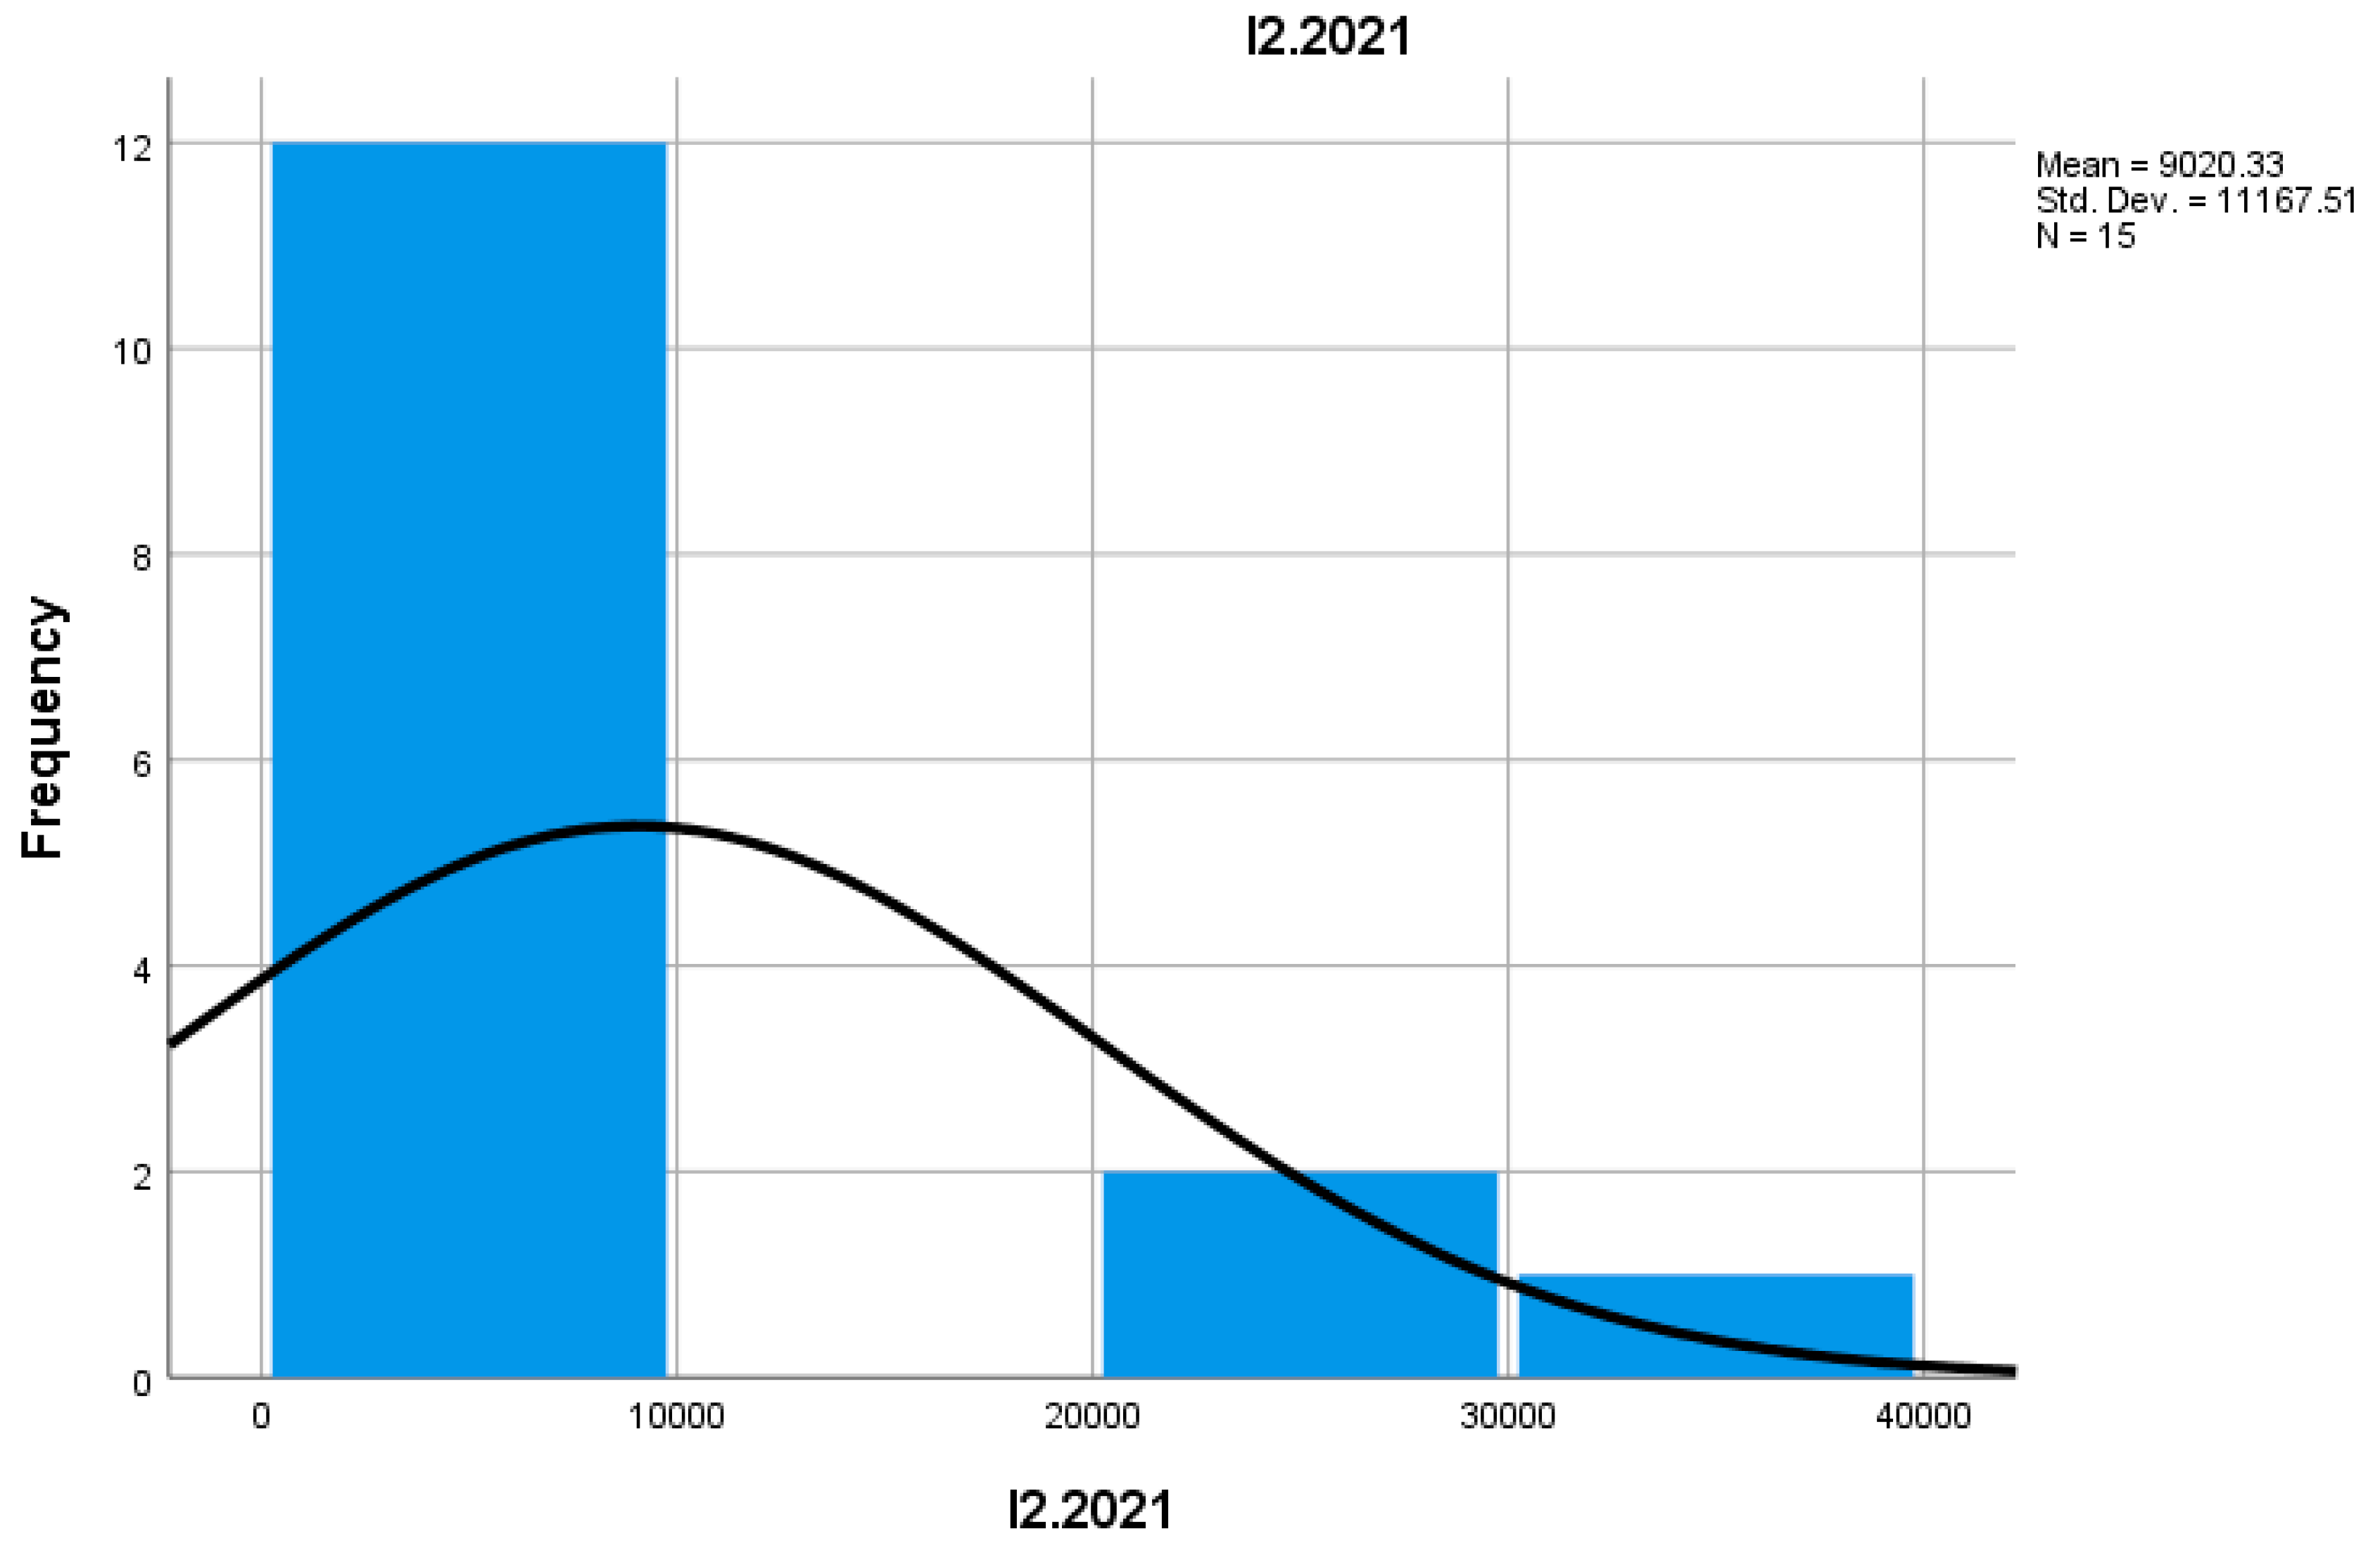
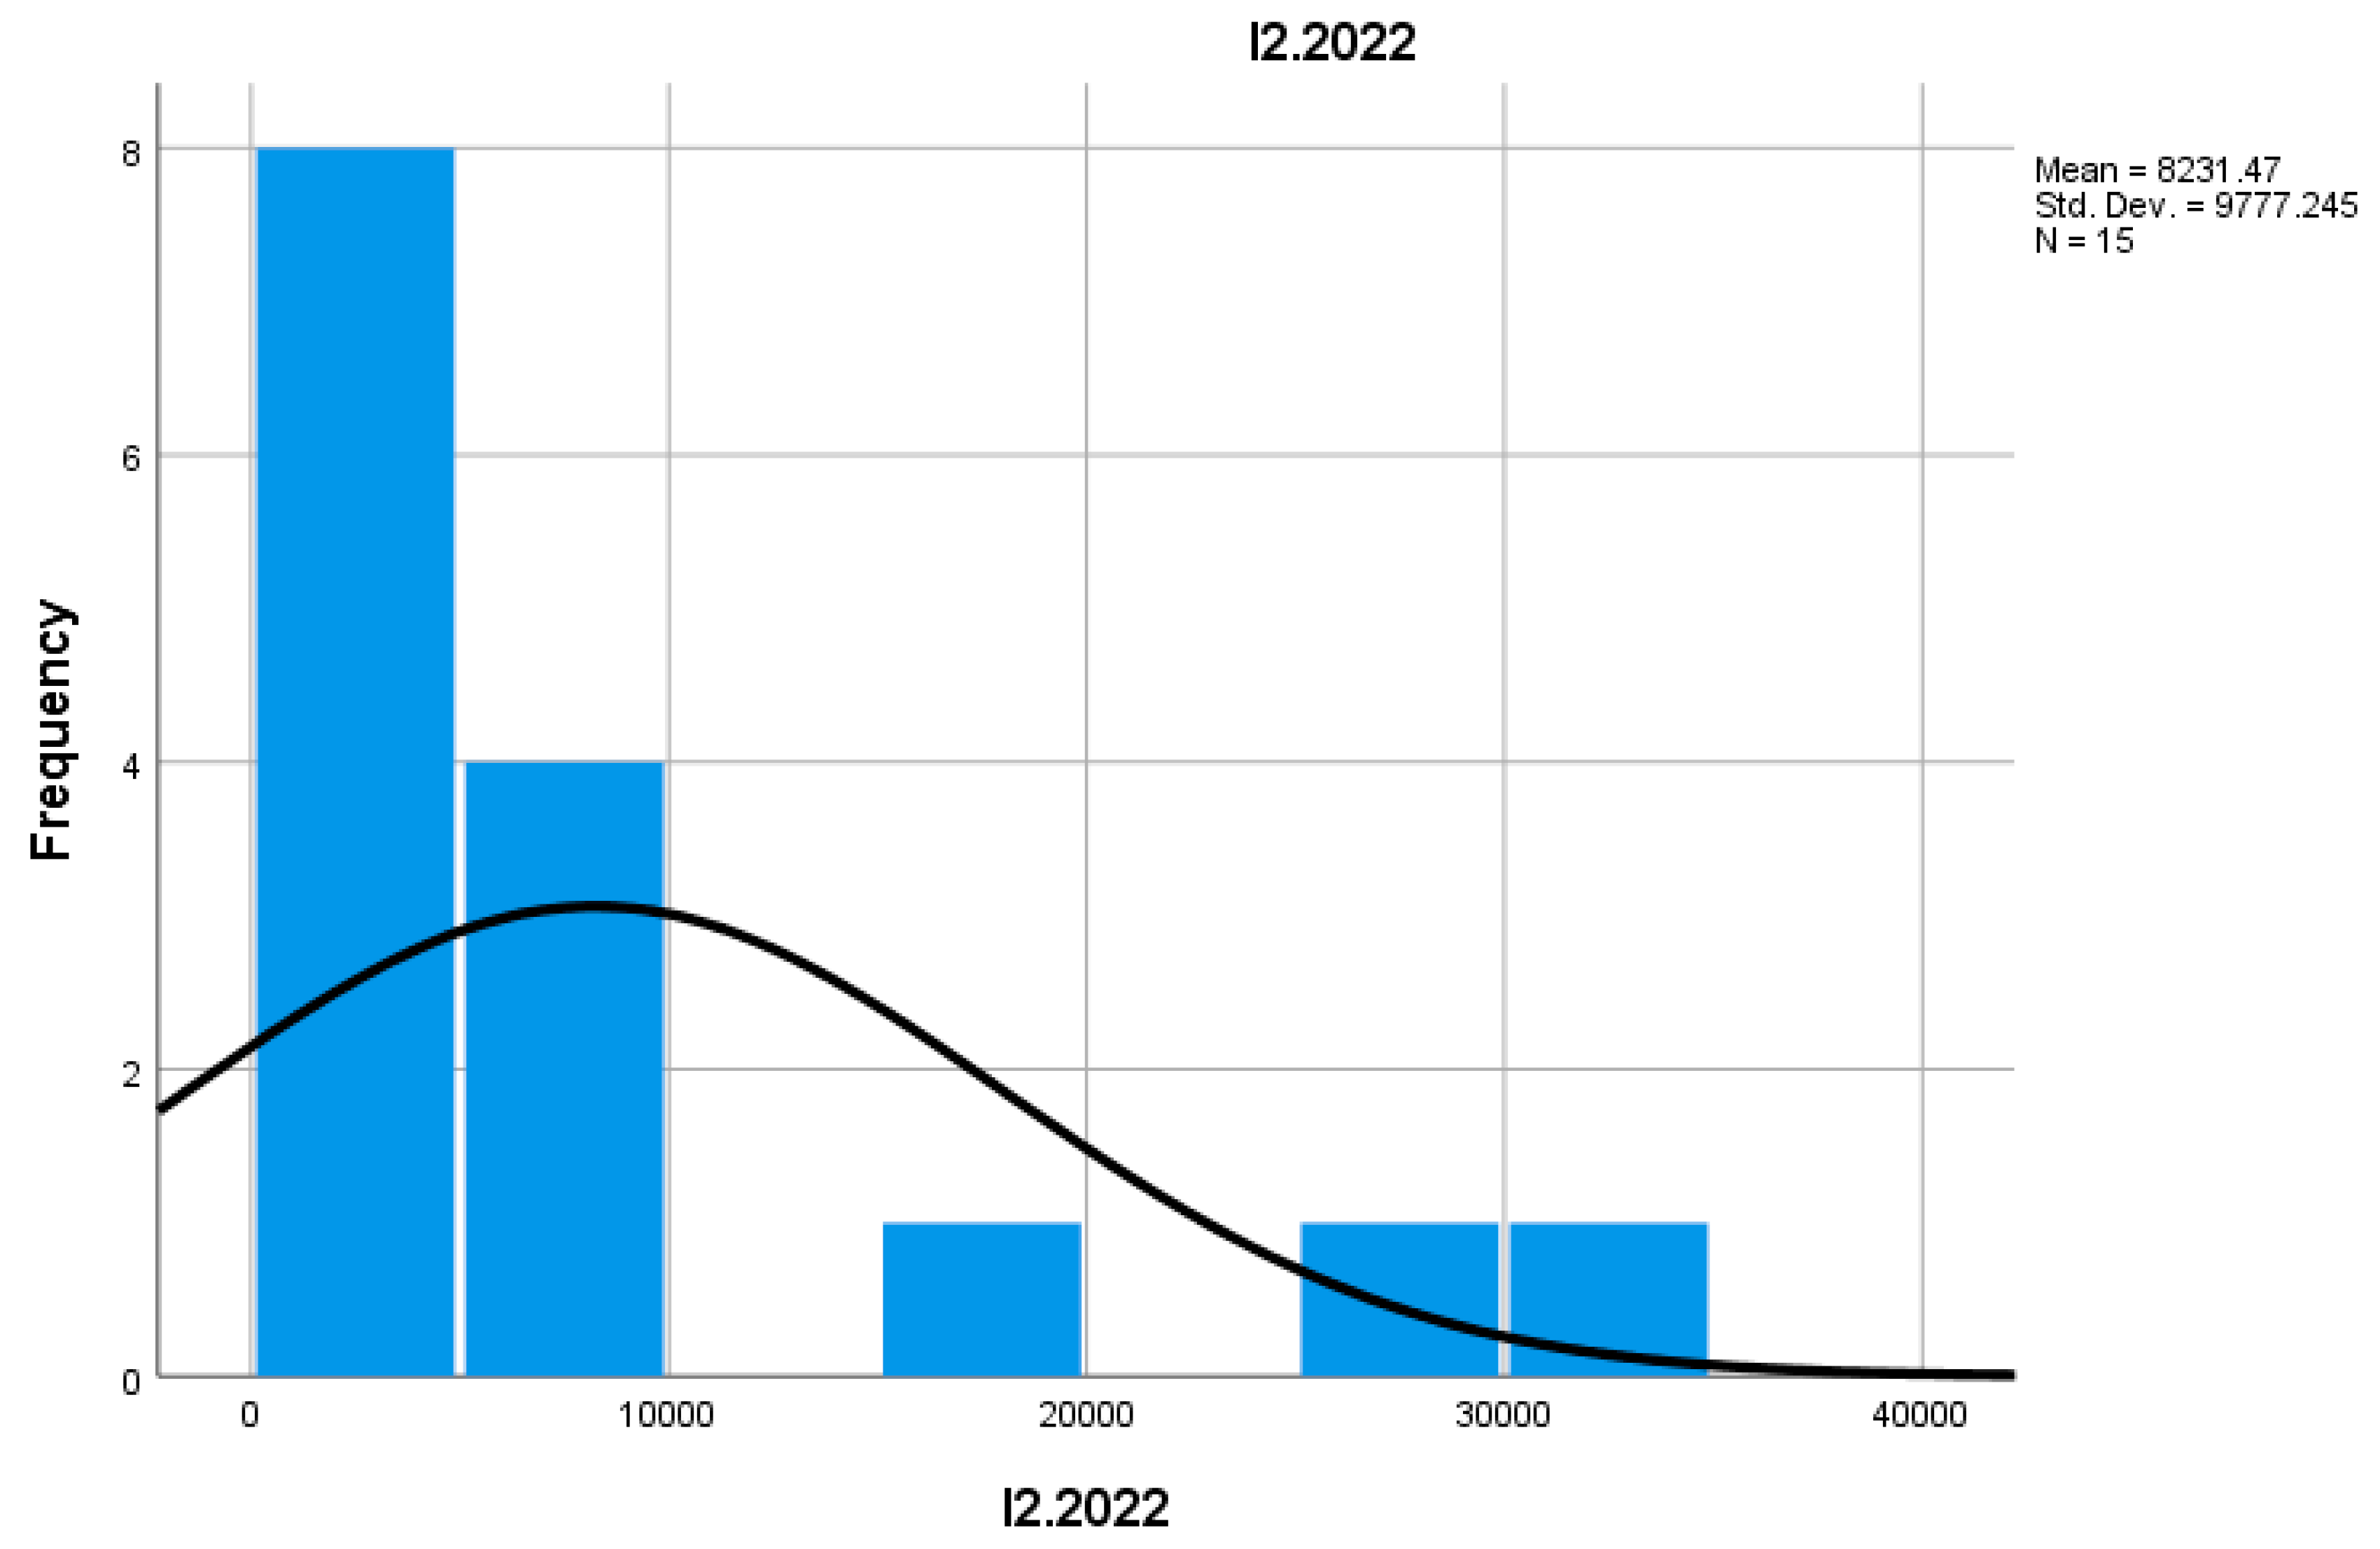
Indicator I2 reflects the number of newly established enterprises annually. In 2022, the number of newly established enterprises was higher than in 2021, suggesting increased interest in mountain entrepreneurship and a greater availability of resources for investment. The growth of this indicator can be attributed to favorable policies, as well as market demands for more diversified products and services for tourists and locals.
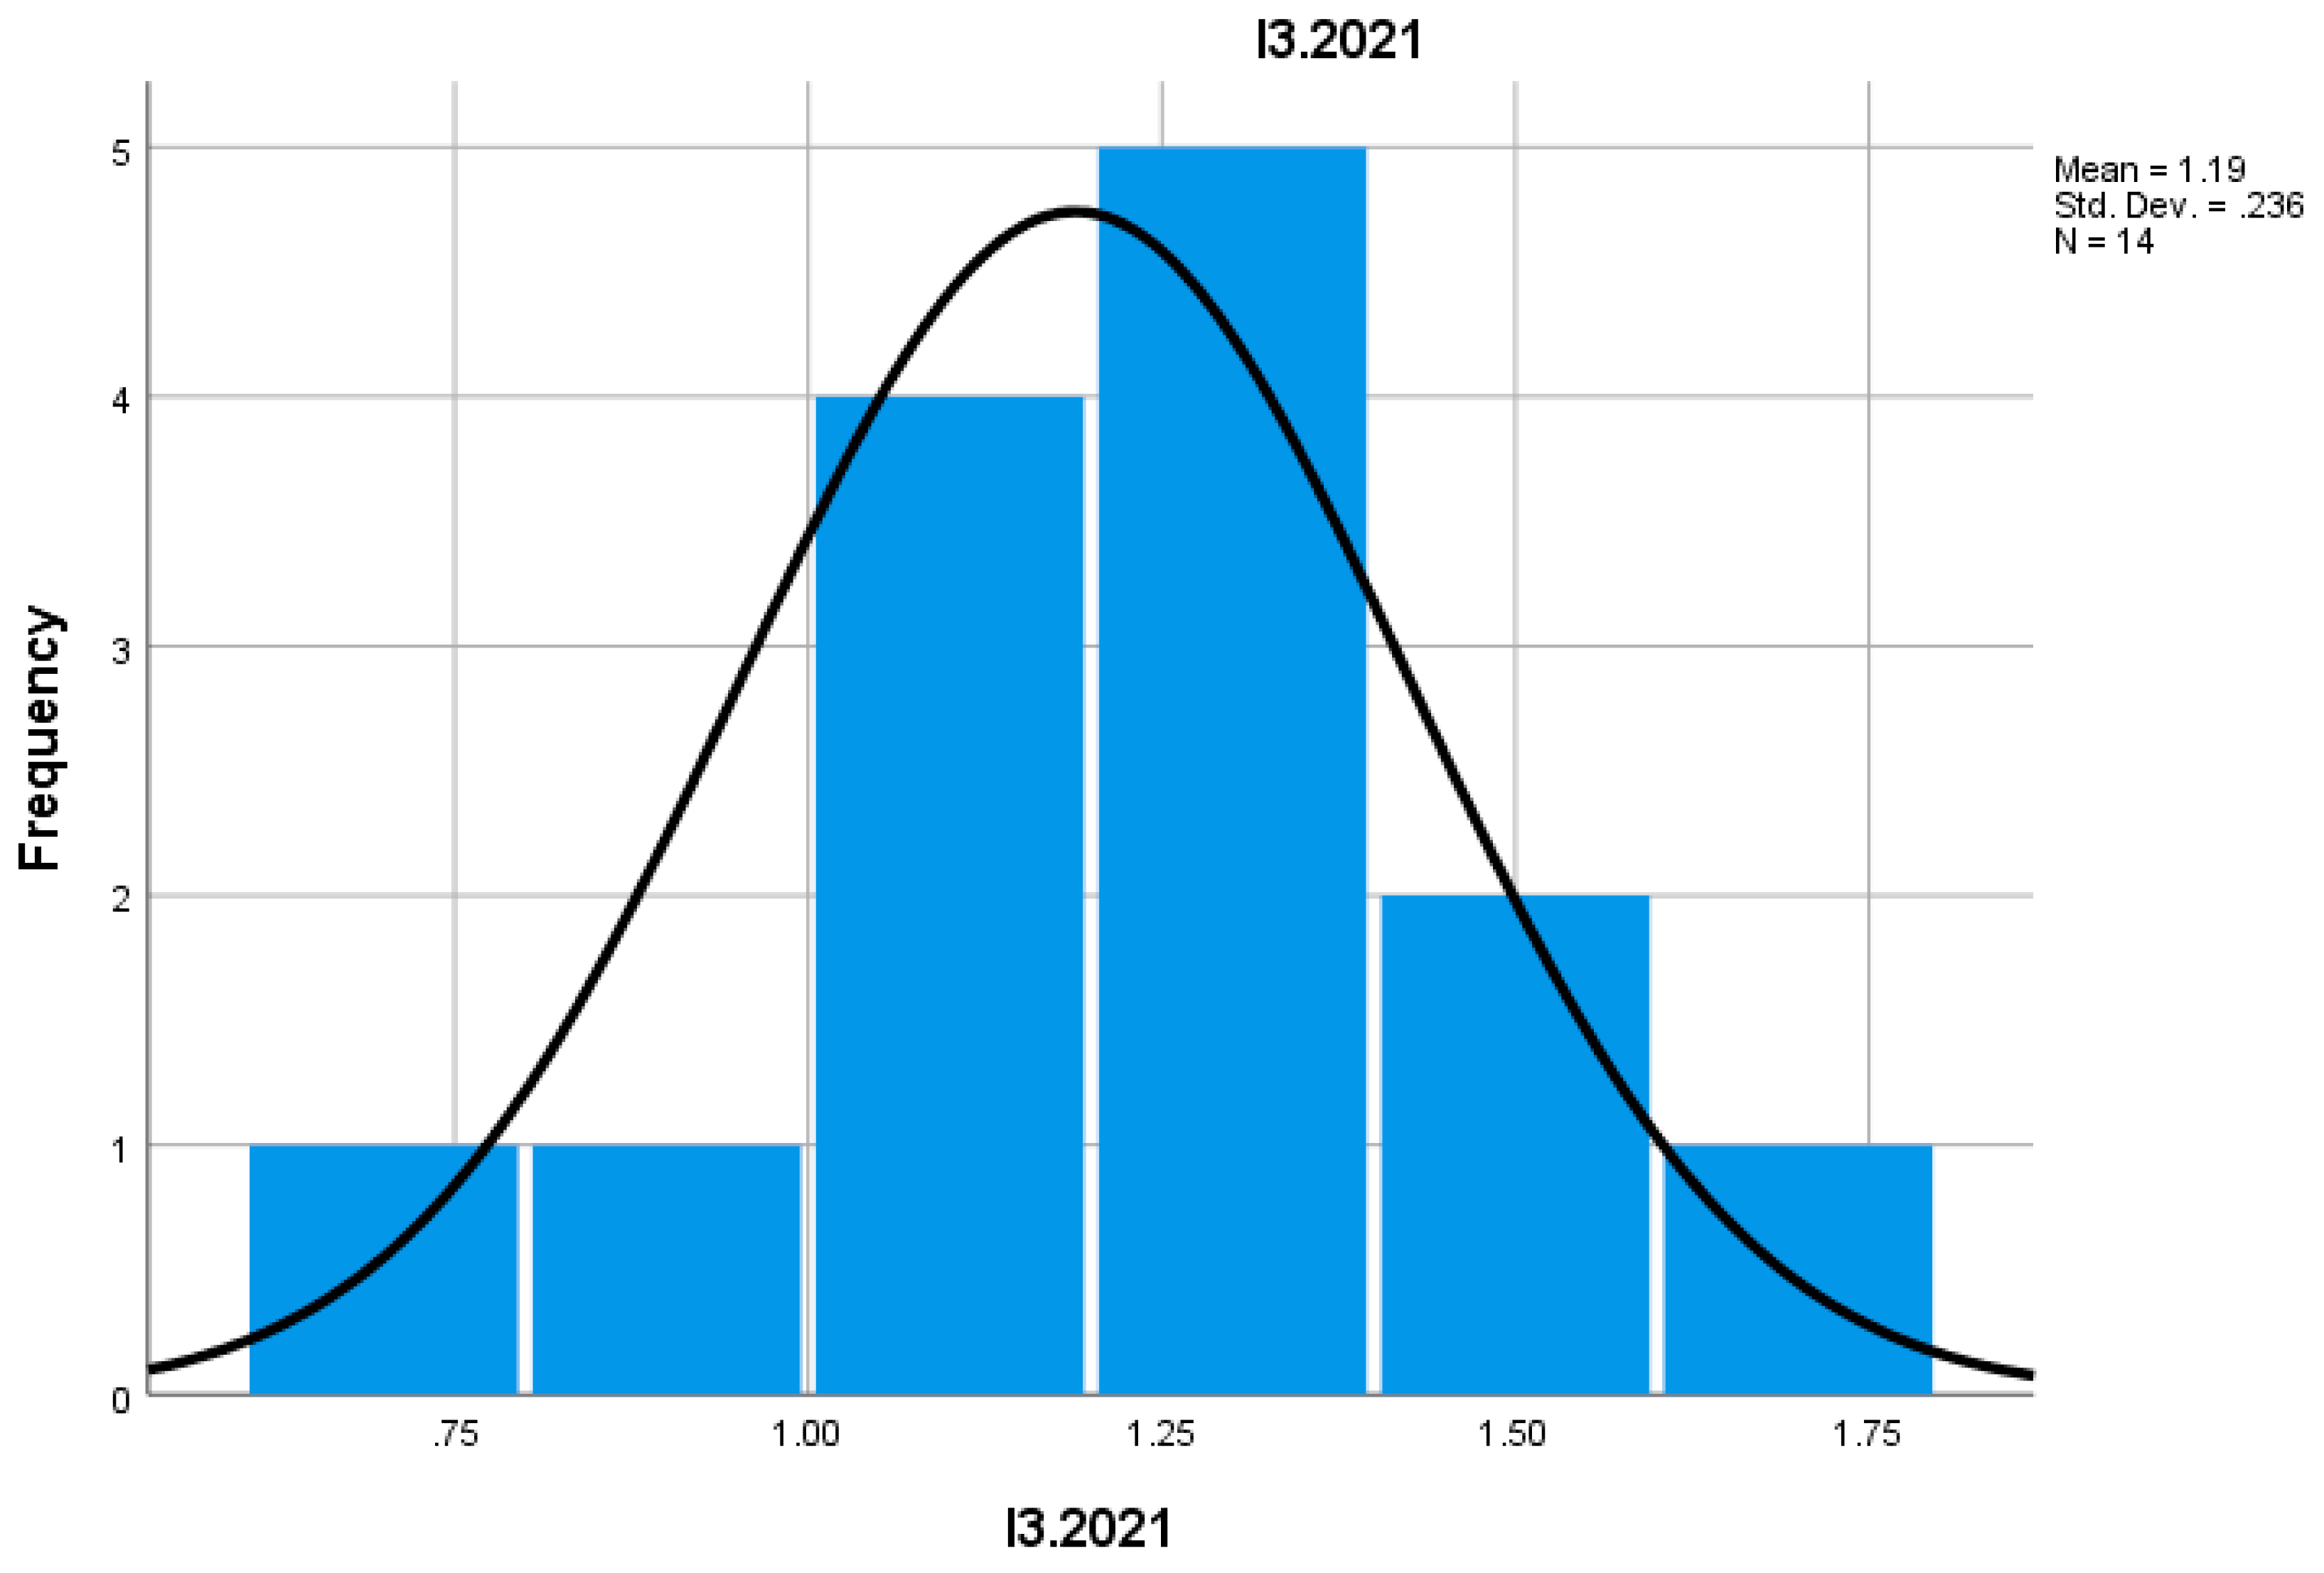
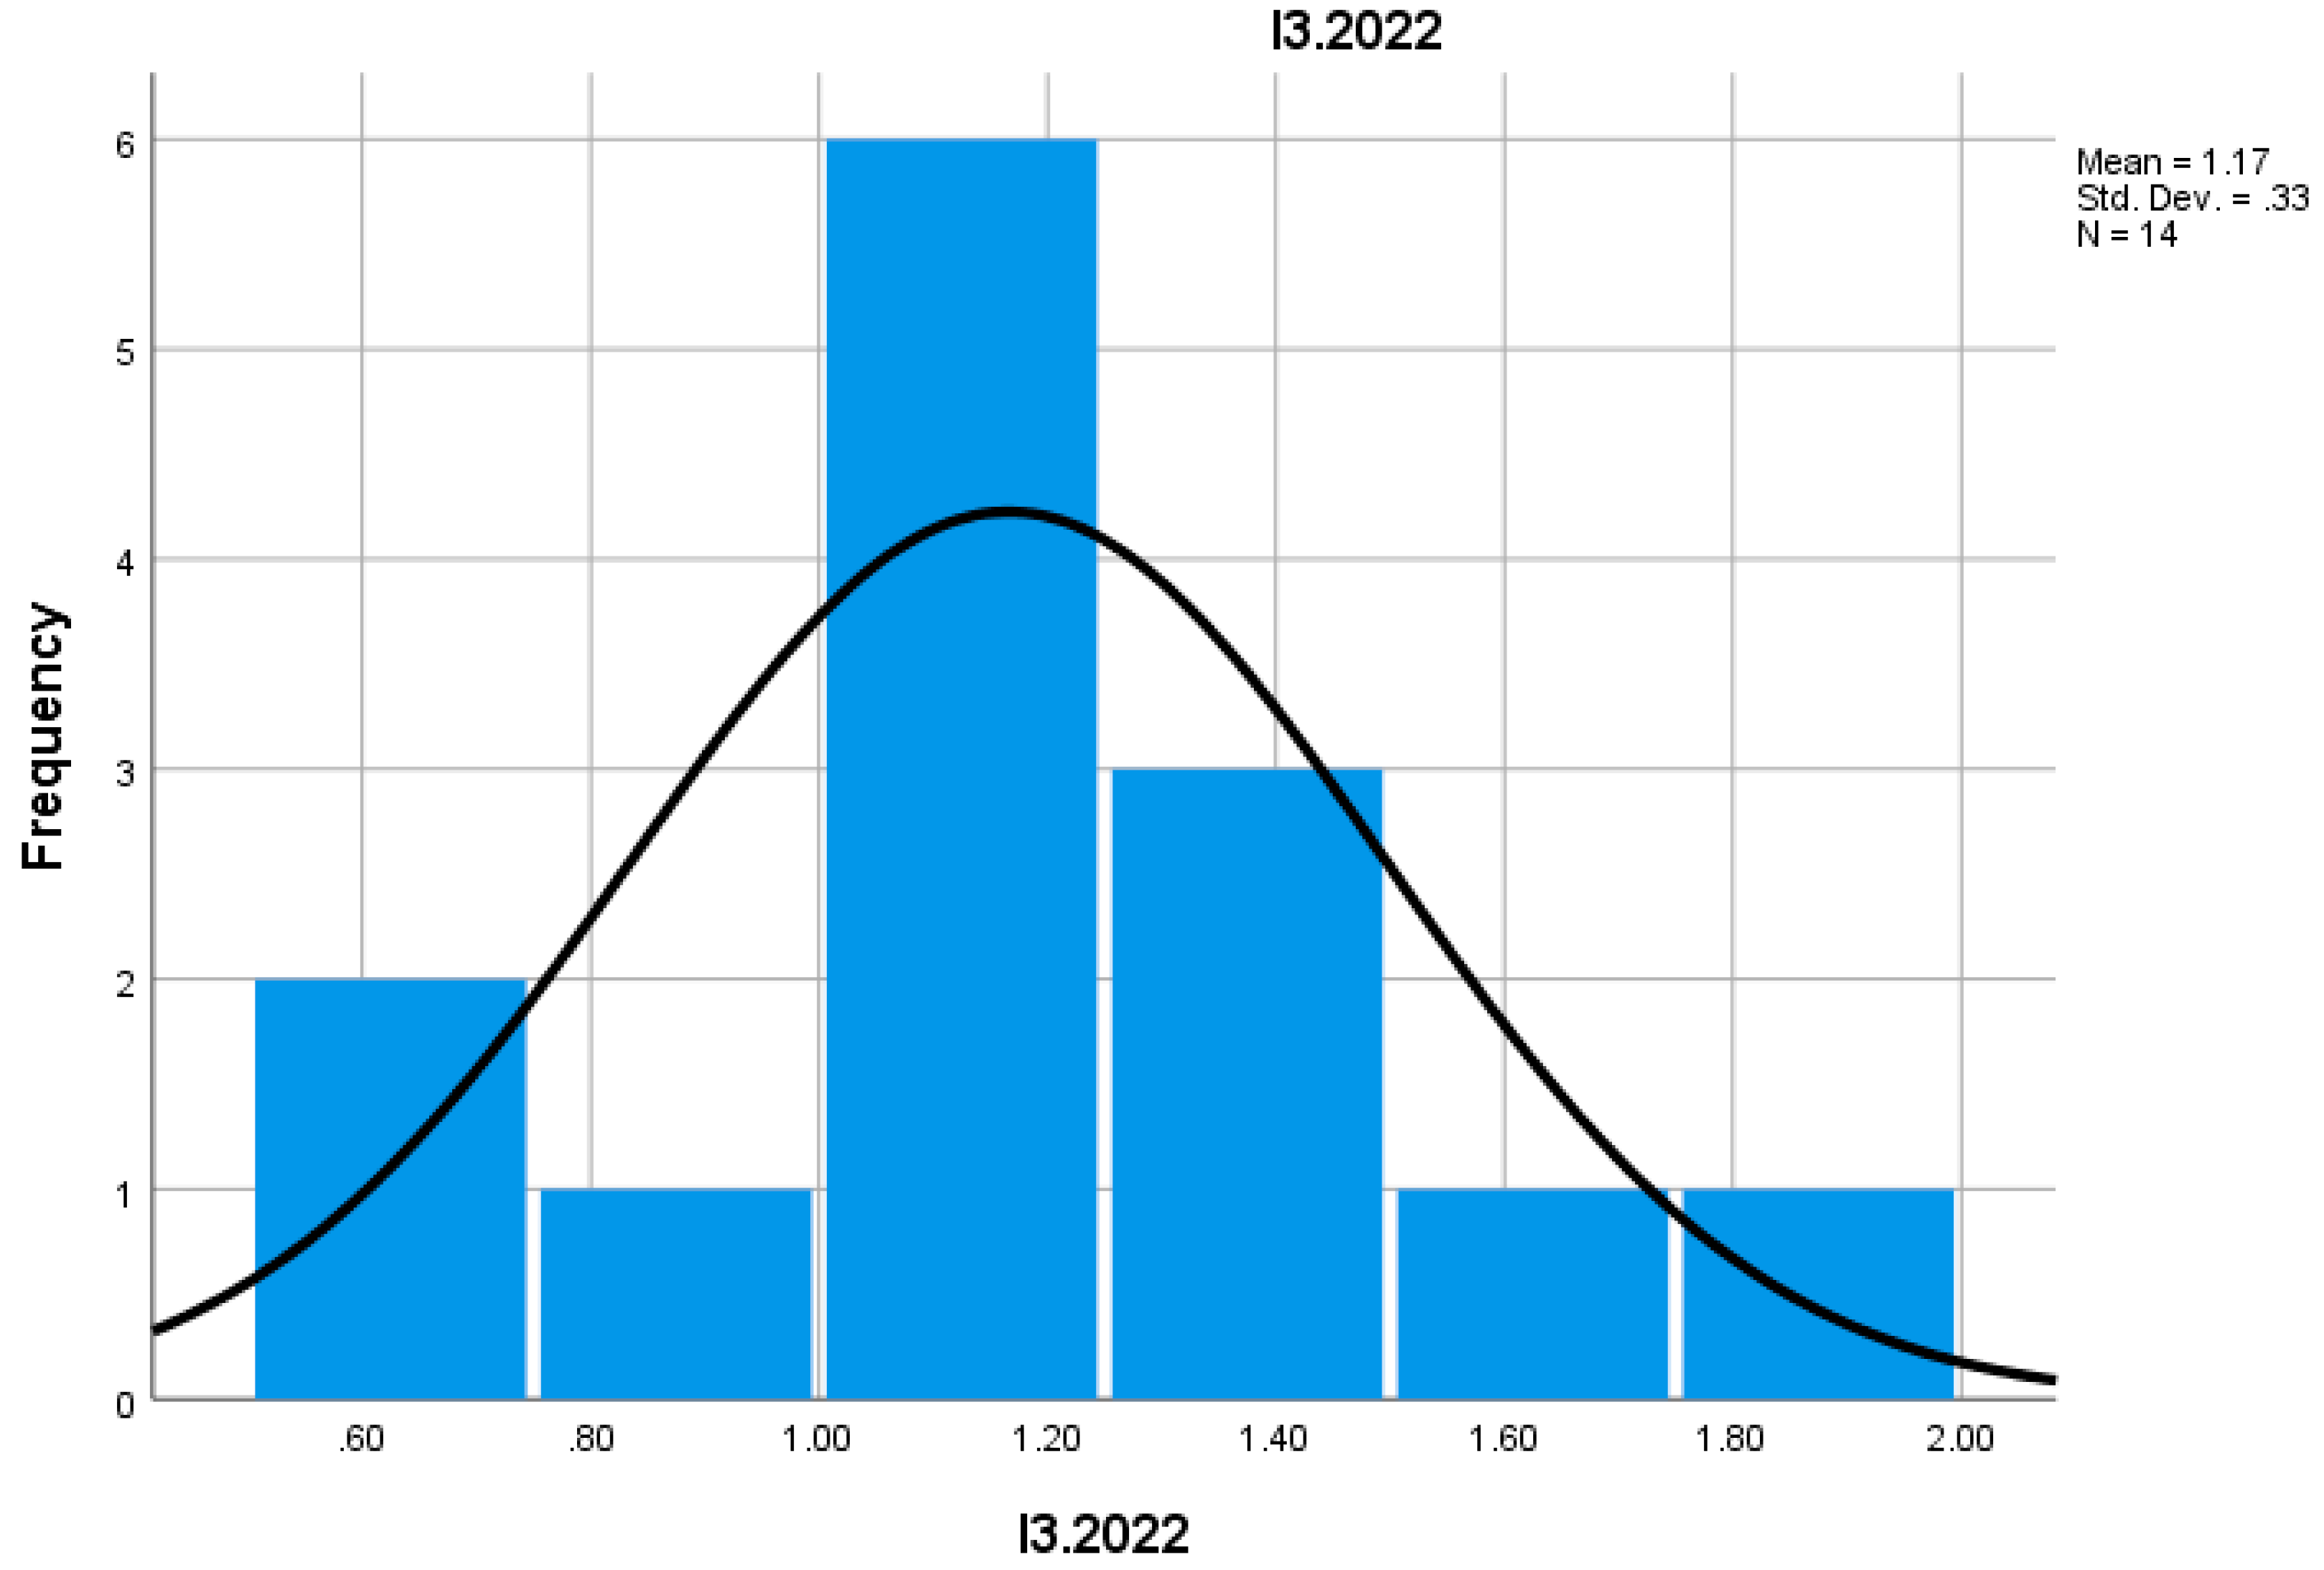
Indicator I3 measures the size of new enterprises, expressed by the average number of employees in these businesses. In 2022, new enterprises had a higher number of employees compared to 2021. This suggests a trend toward consolidation of new businesses and a more professional approach to managing them, reflecting a more efficient adaptation to local economic requirements.
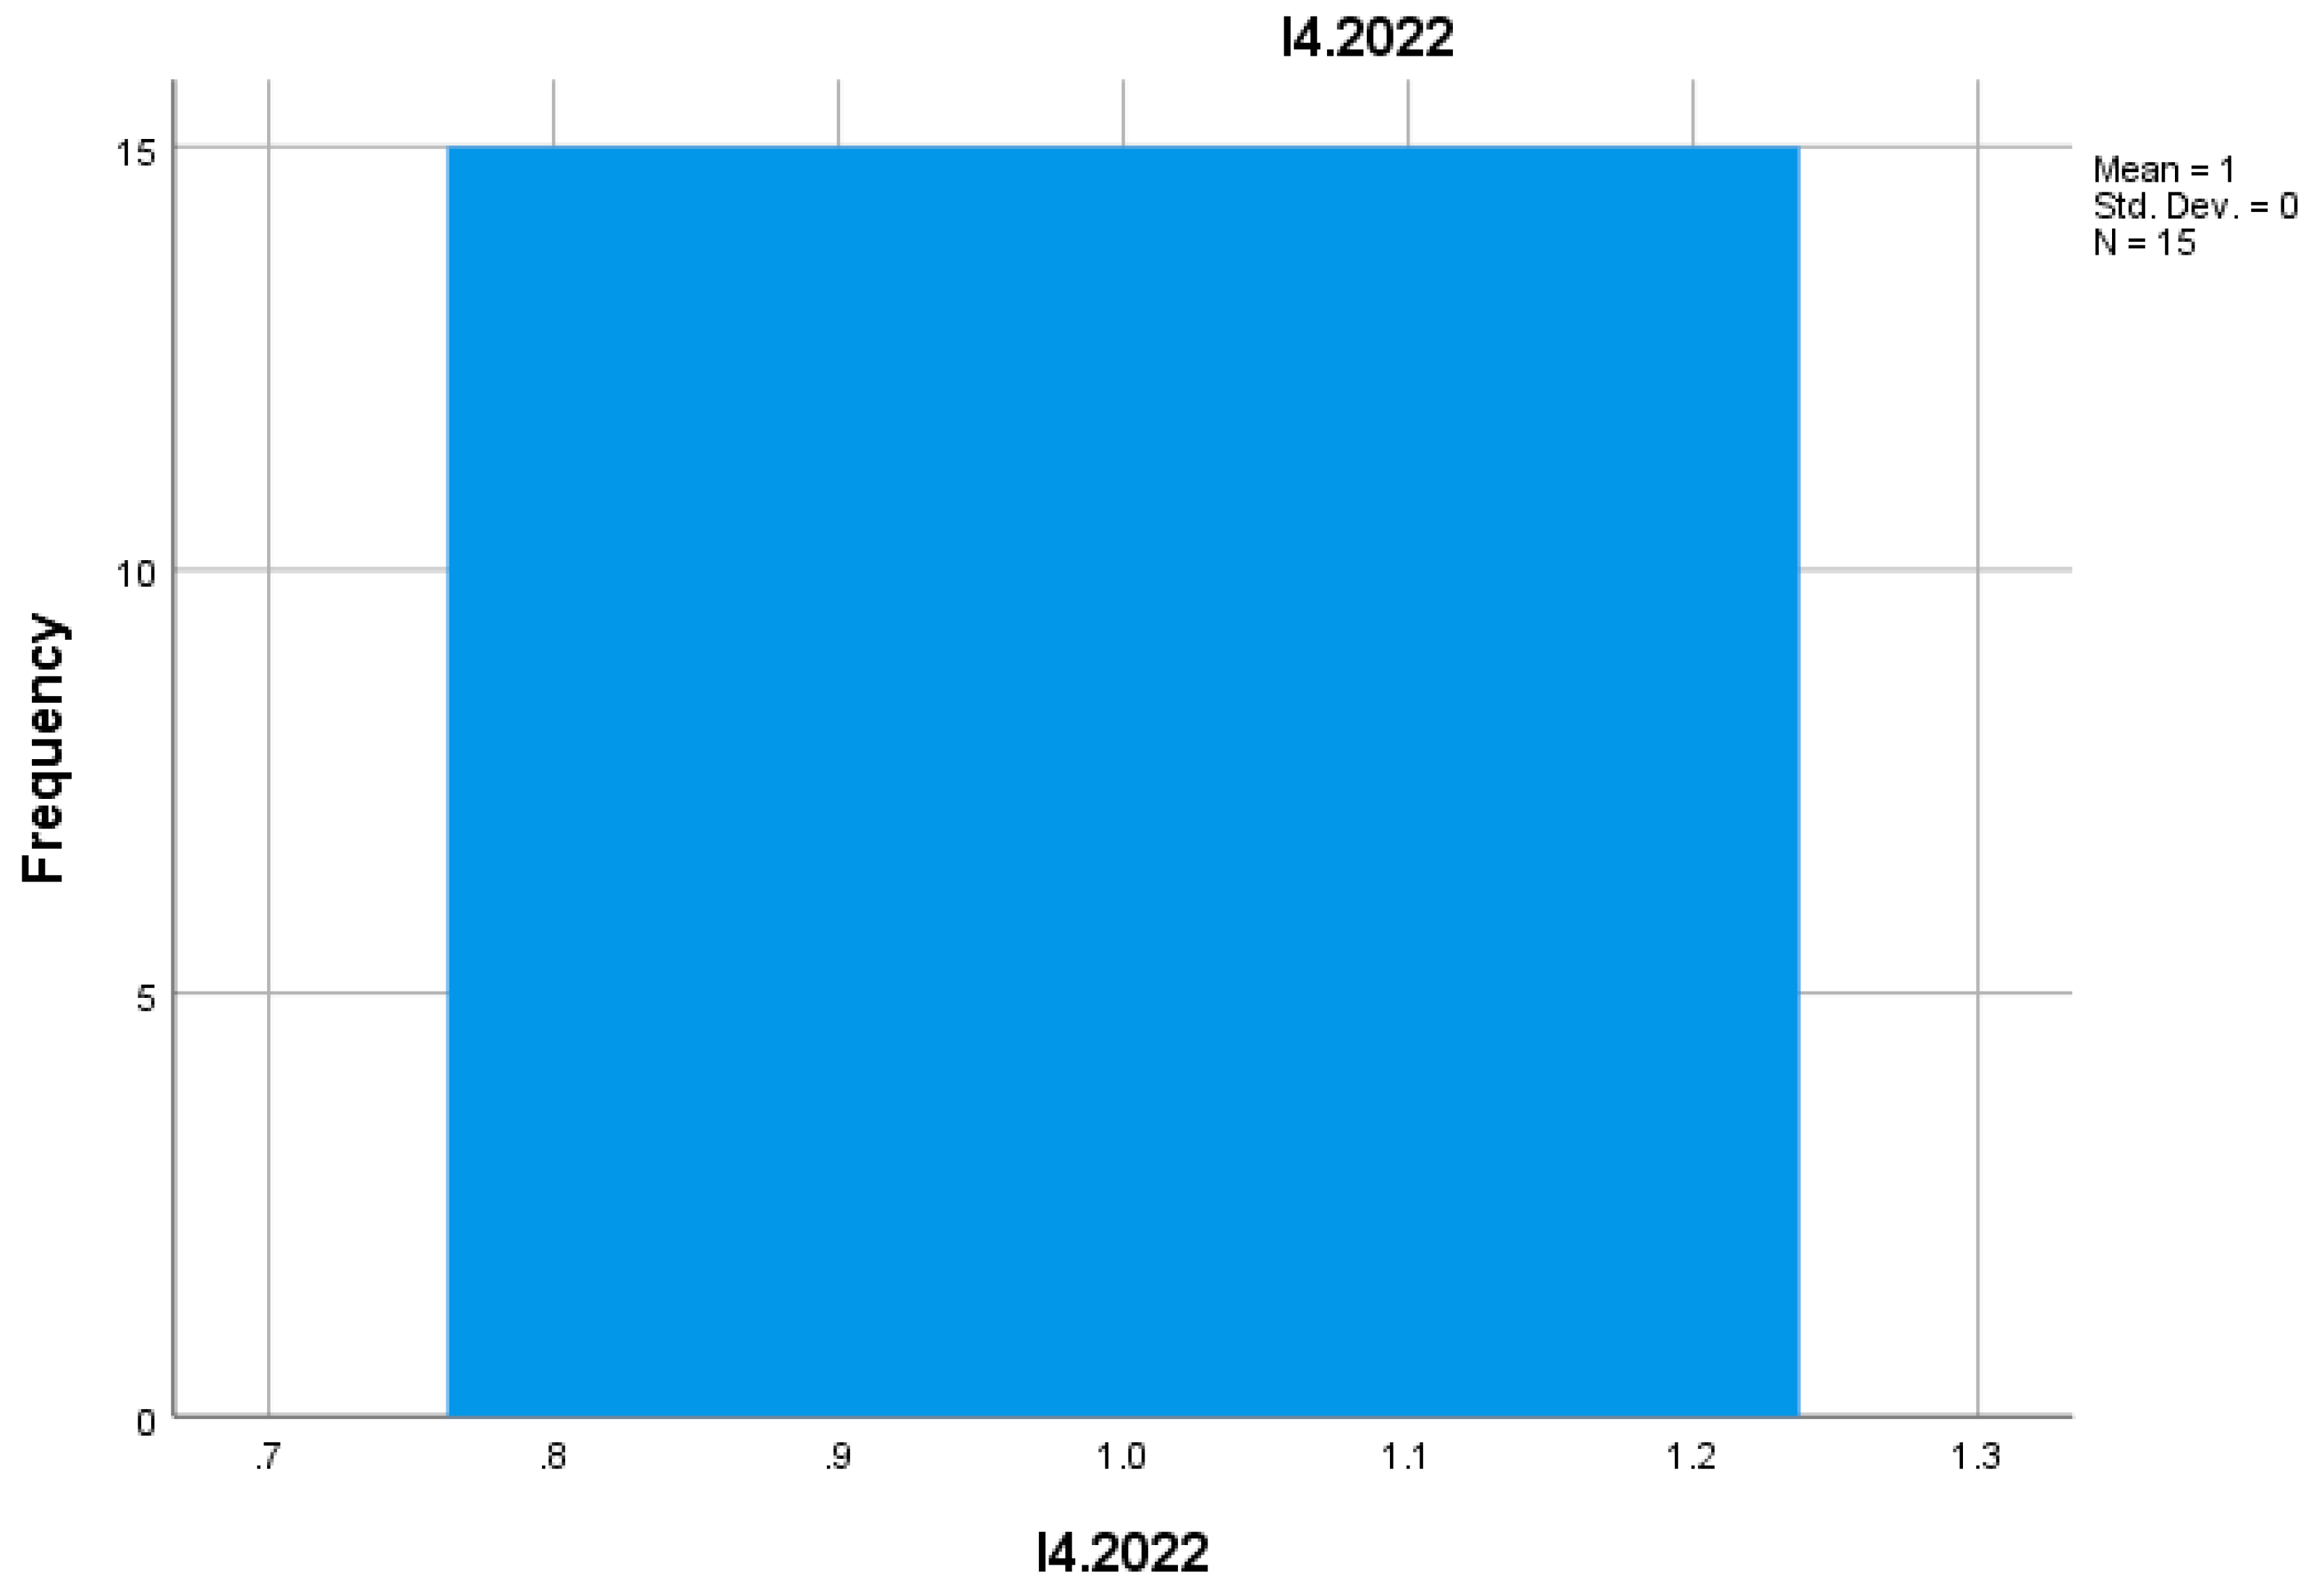
Indicator I4 reflects the average number of employees in enterprises that ceased to exist. In 2022, the number of employees in these businesses decreased compared to 2021, indicating a reduction in the impact of their disappearance on employment in the mountain commerce sector. This could reflect a trend of replacing lower-potential businesses with more dynamic ones.
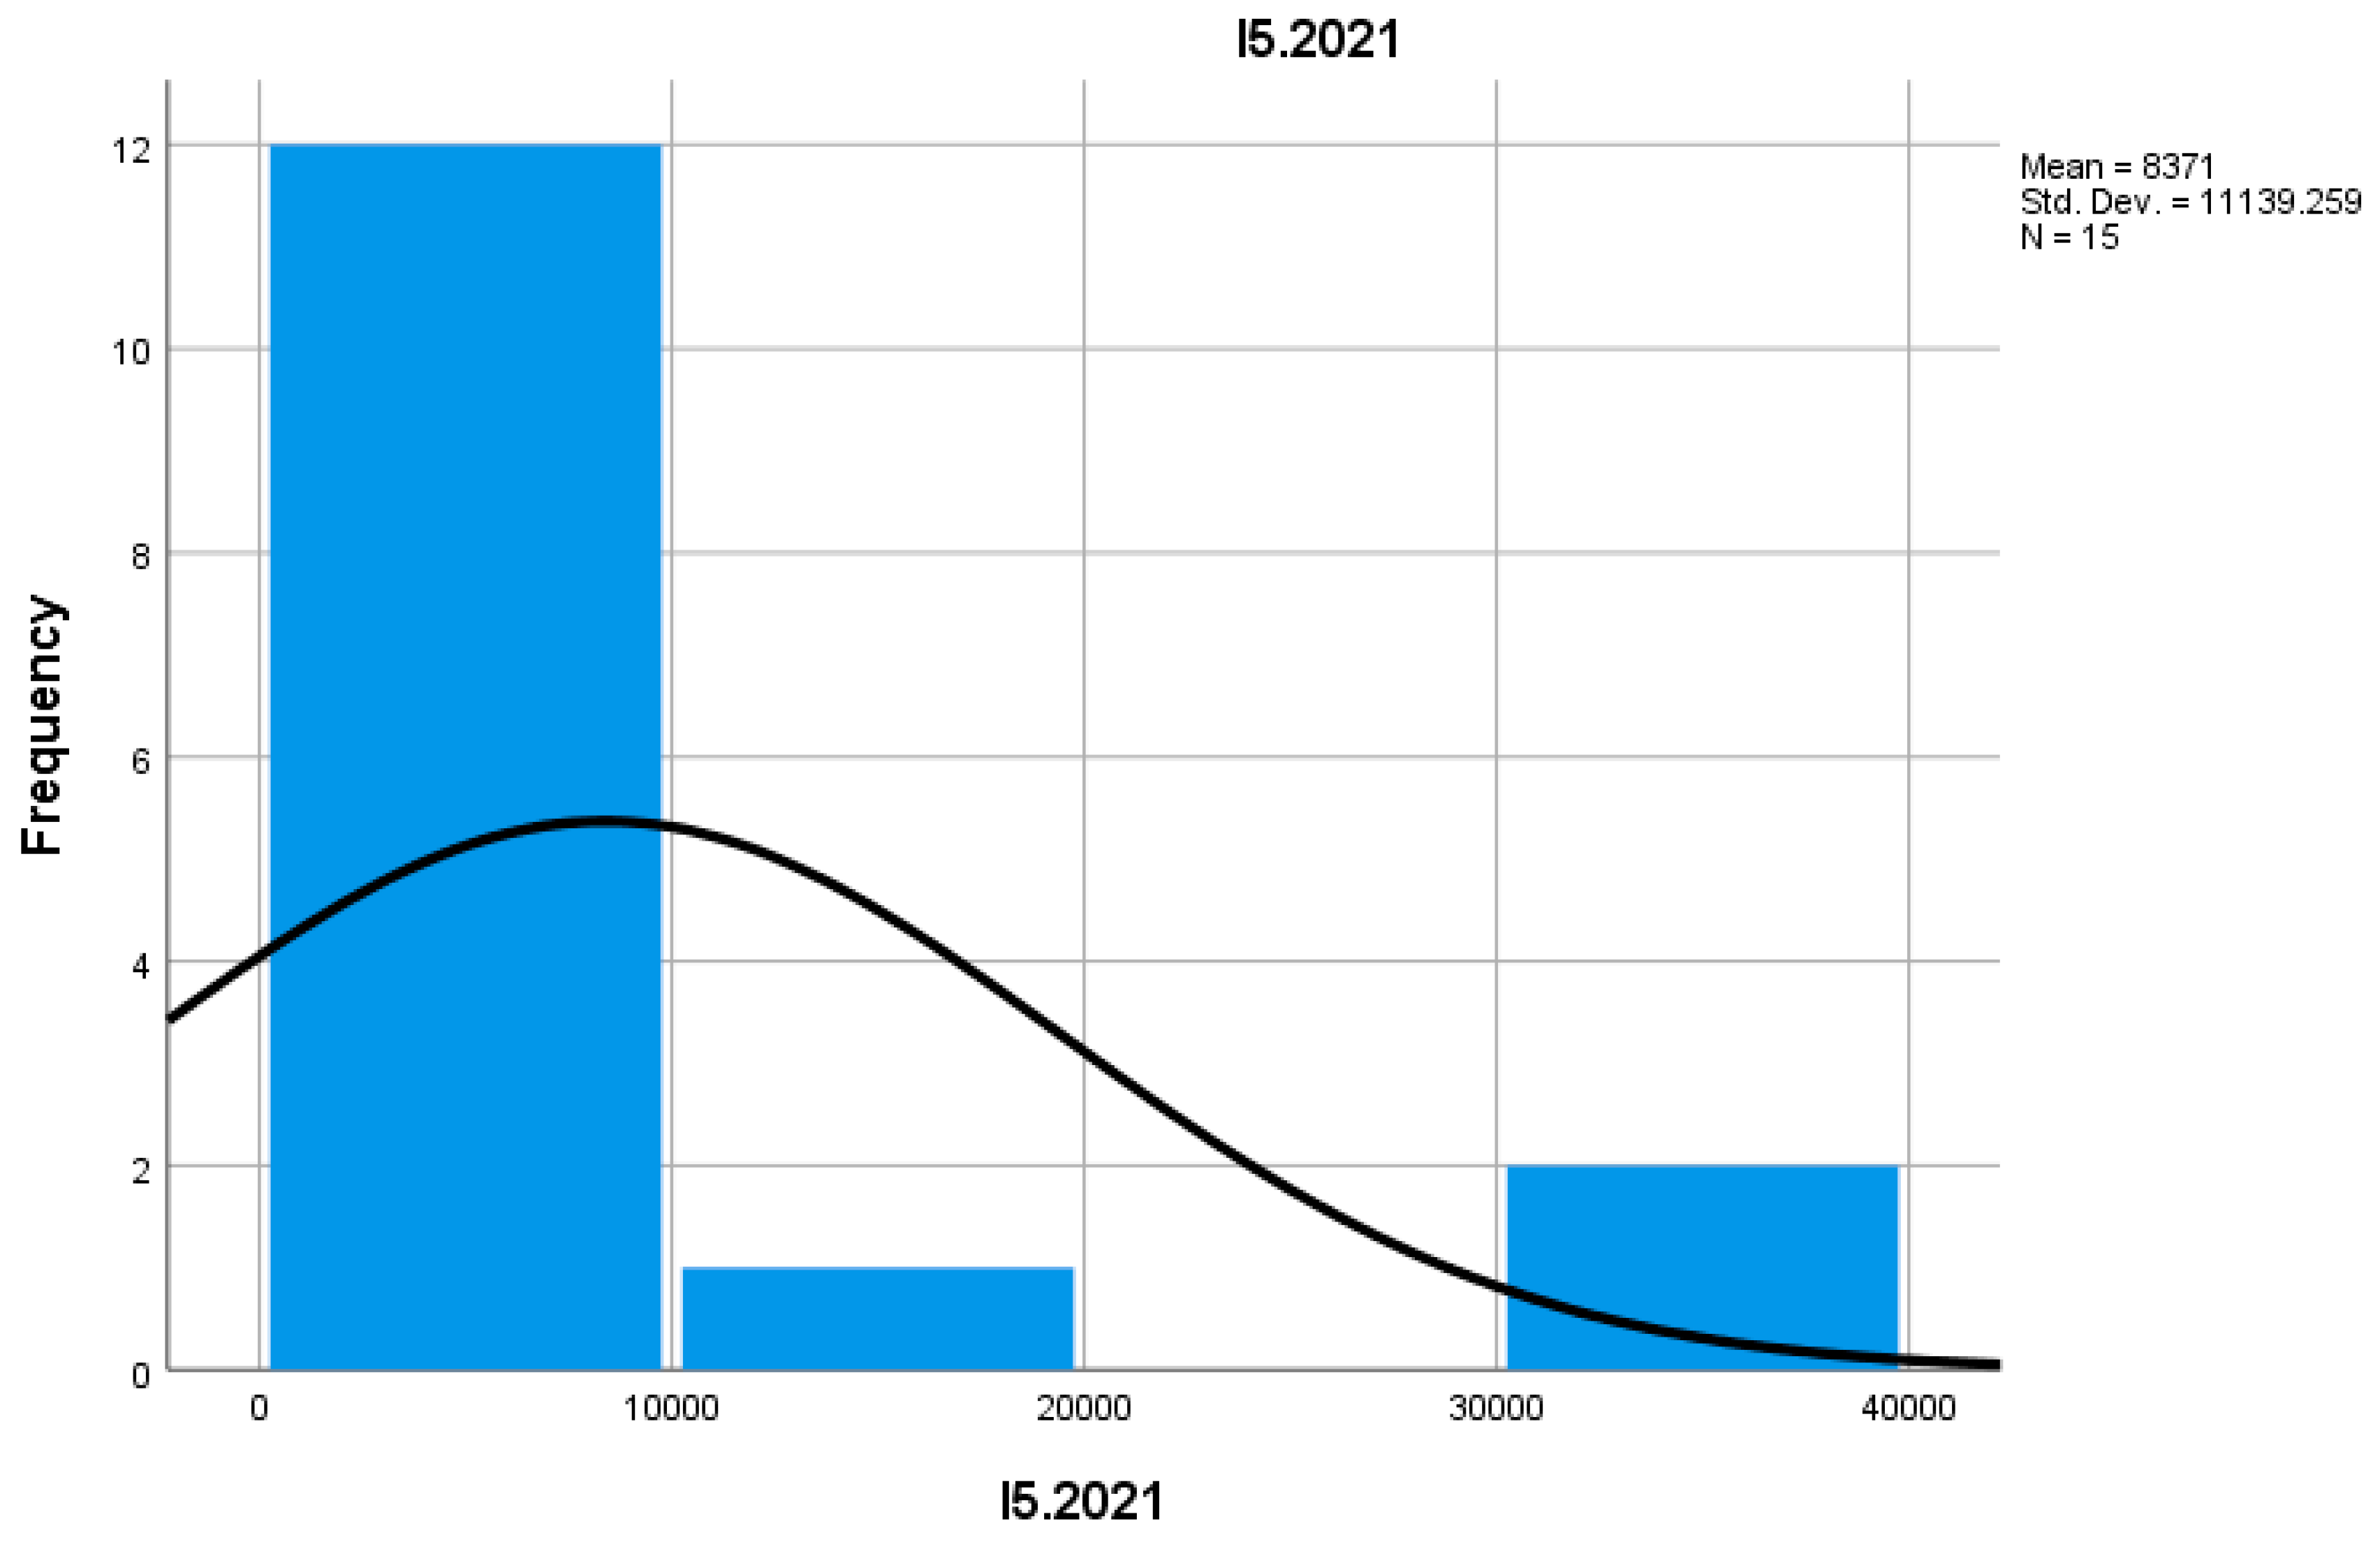
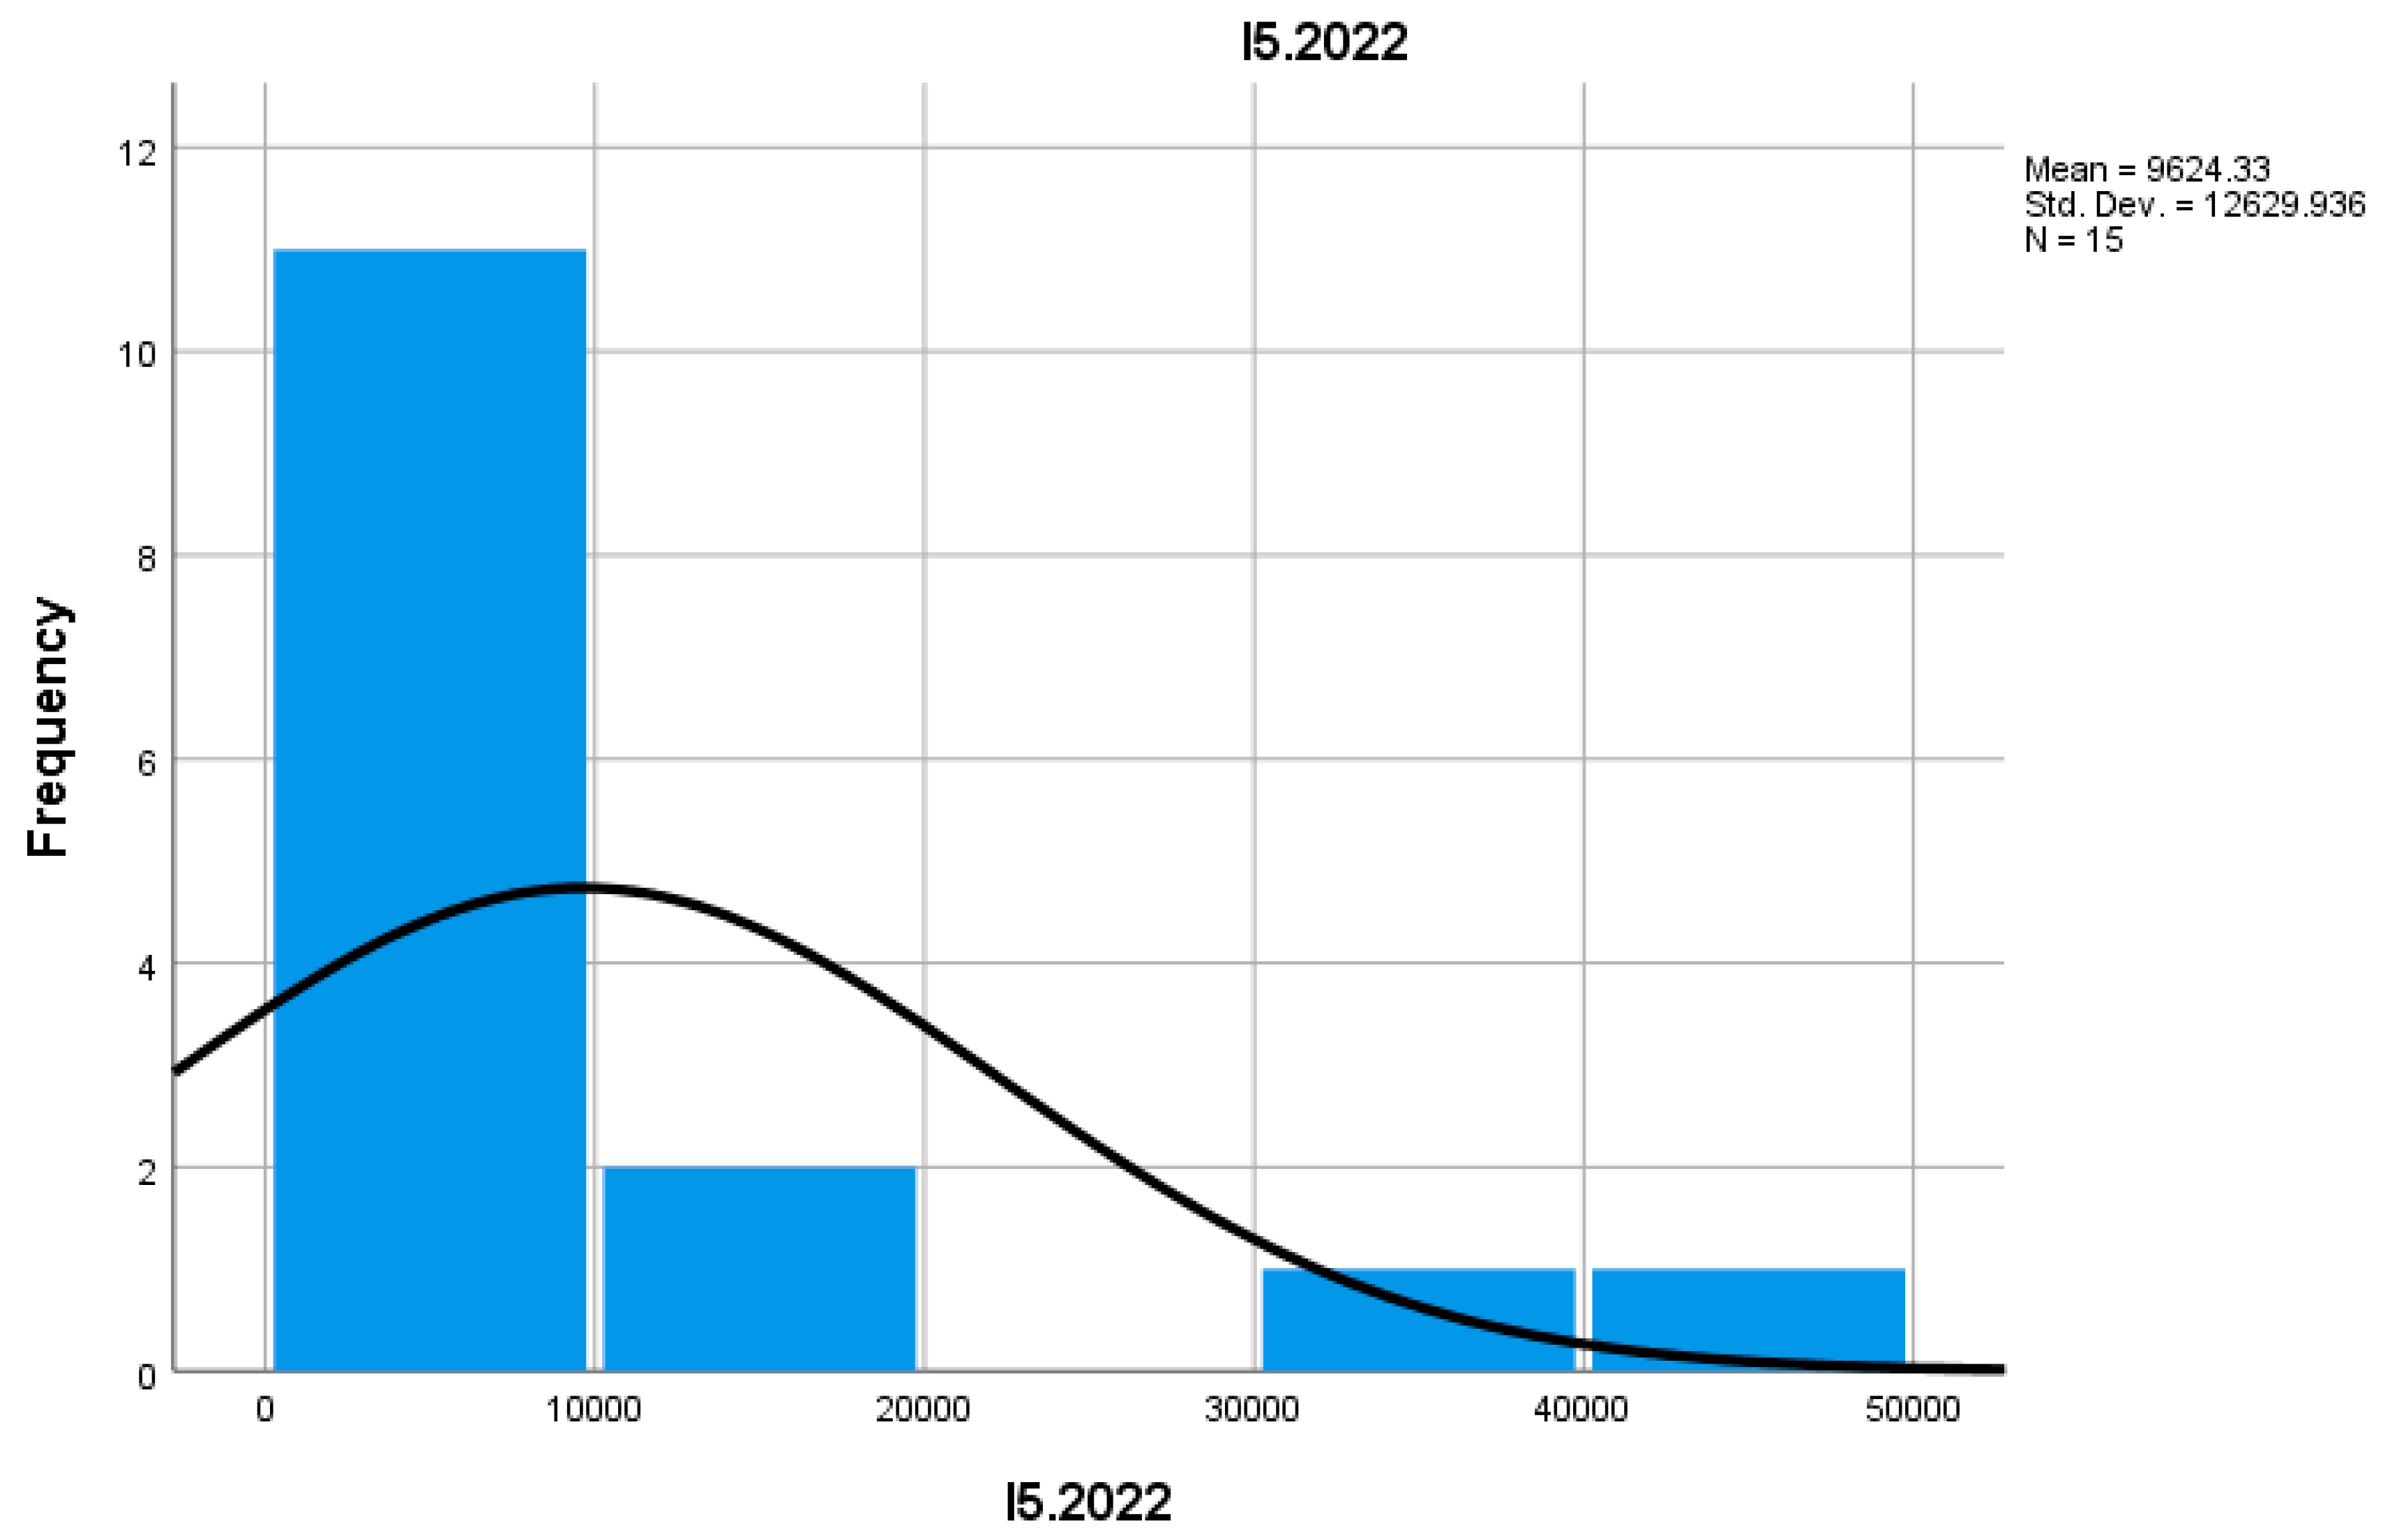
Indicator I5 analyzes the number of businesses that ceased to operate. In 2022, this number was higher compared to 2021, signaling economic difficulties for certain sectors of mountain commerce, which could be caused by factors such as pandemics, a decline in the number of tourists, or changes in local demand. This development suggests that some enterprises were unable to adapt to the new economic conditions or lacked sufficient financial resources to face the challenges.
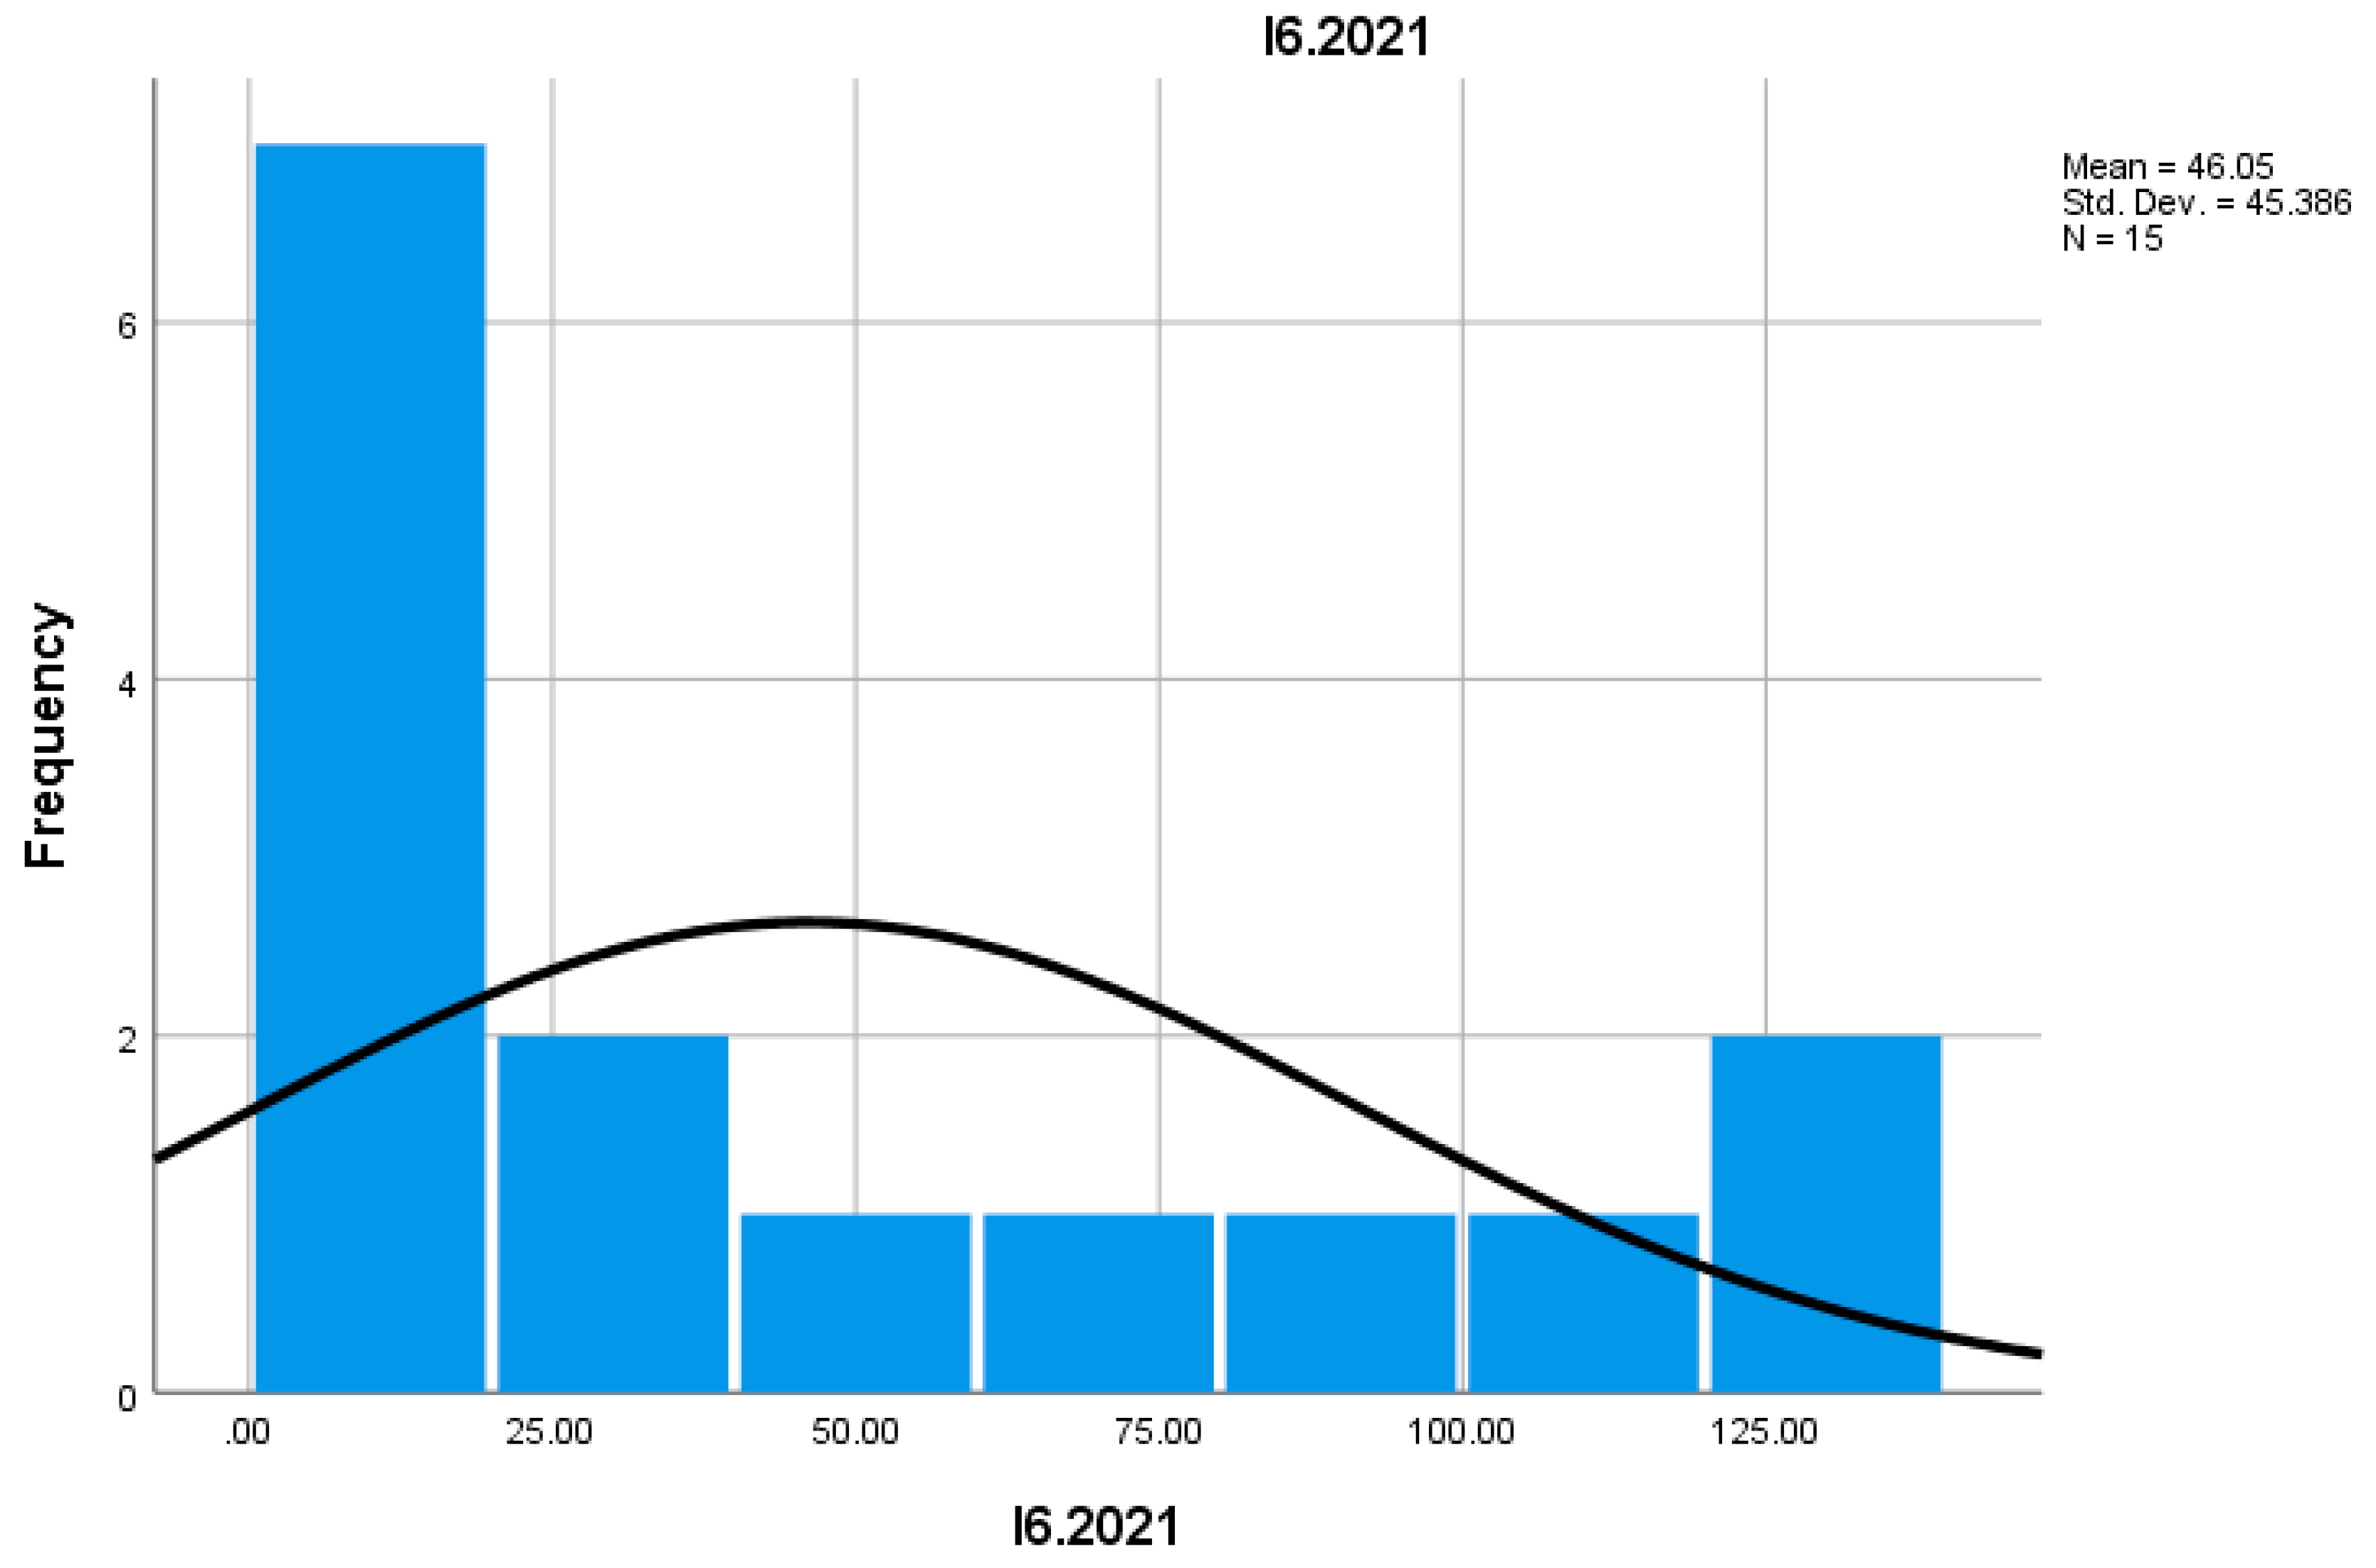
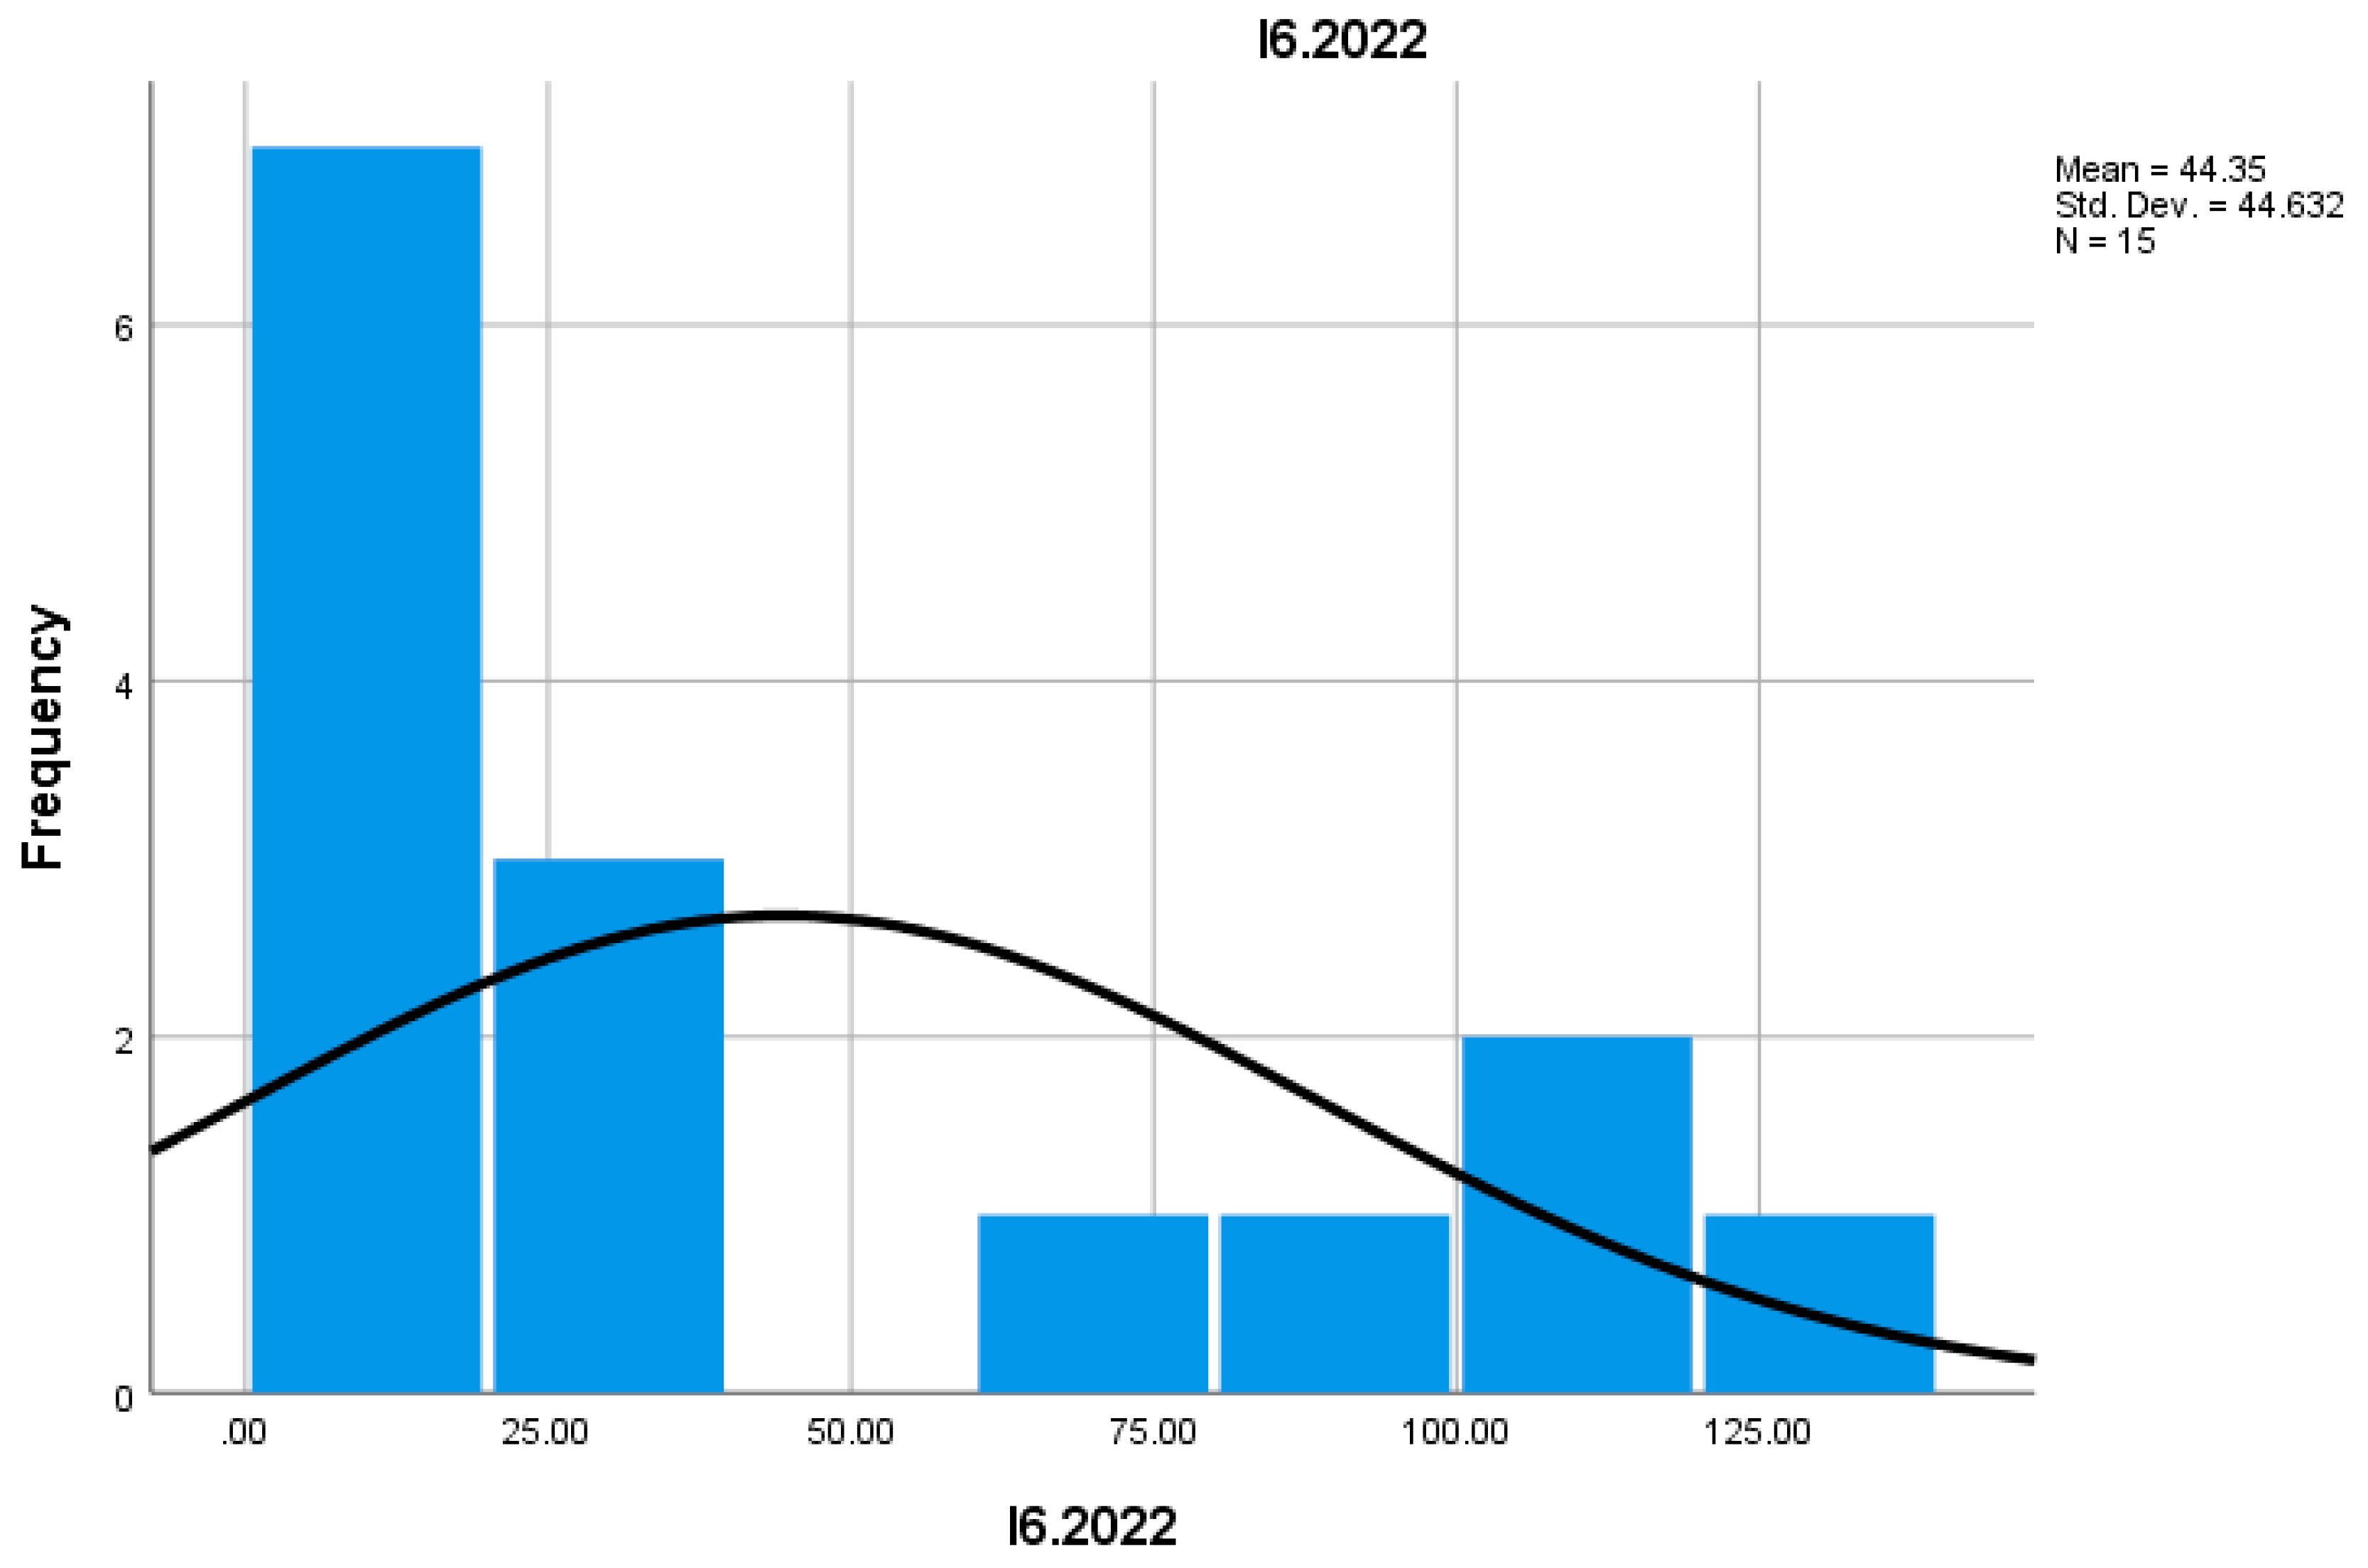
Indicator I6 measures the size of 3-year-old businesses that survived, expressed by the average number of employees. In 2022, these enterprises had a higher average number of employees than in 2021, suggesting they managed to consolidate their activities and expand in the market. Survival and growth in this sector are signs of good adaptation to economic requirements and the labor market.
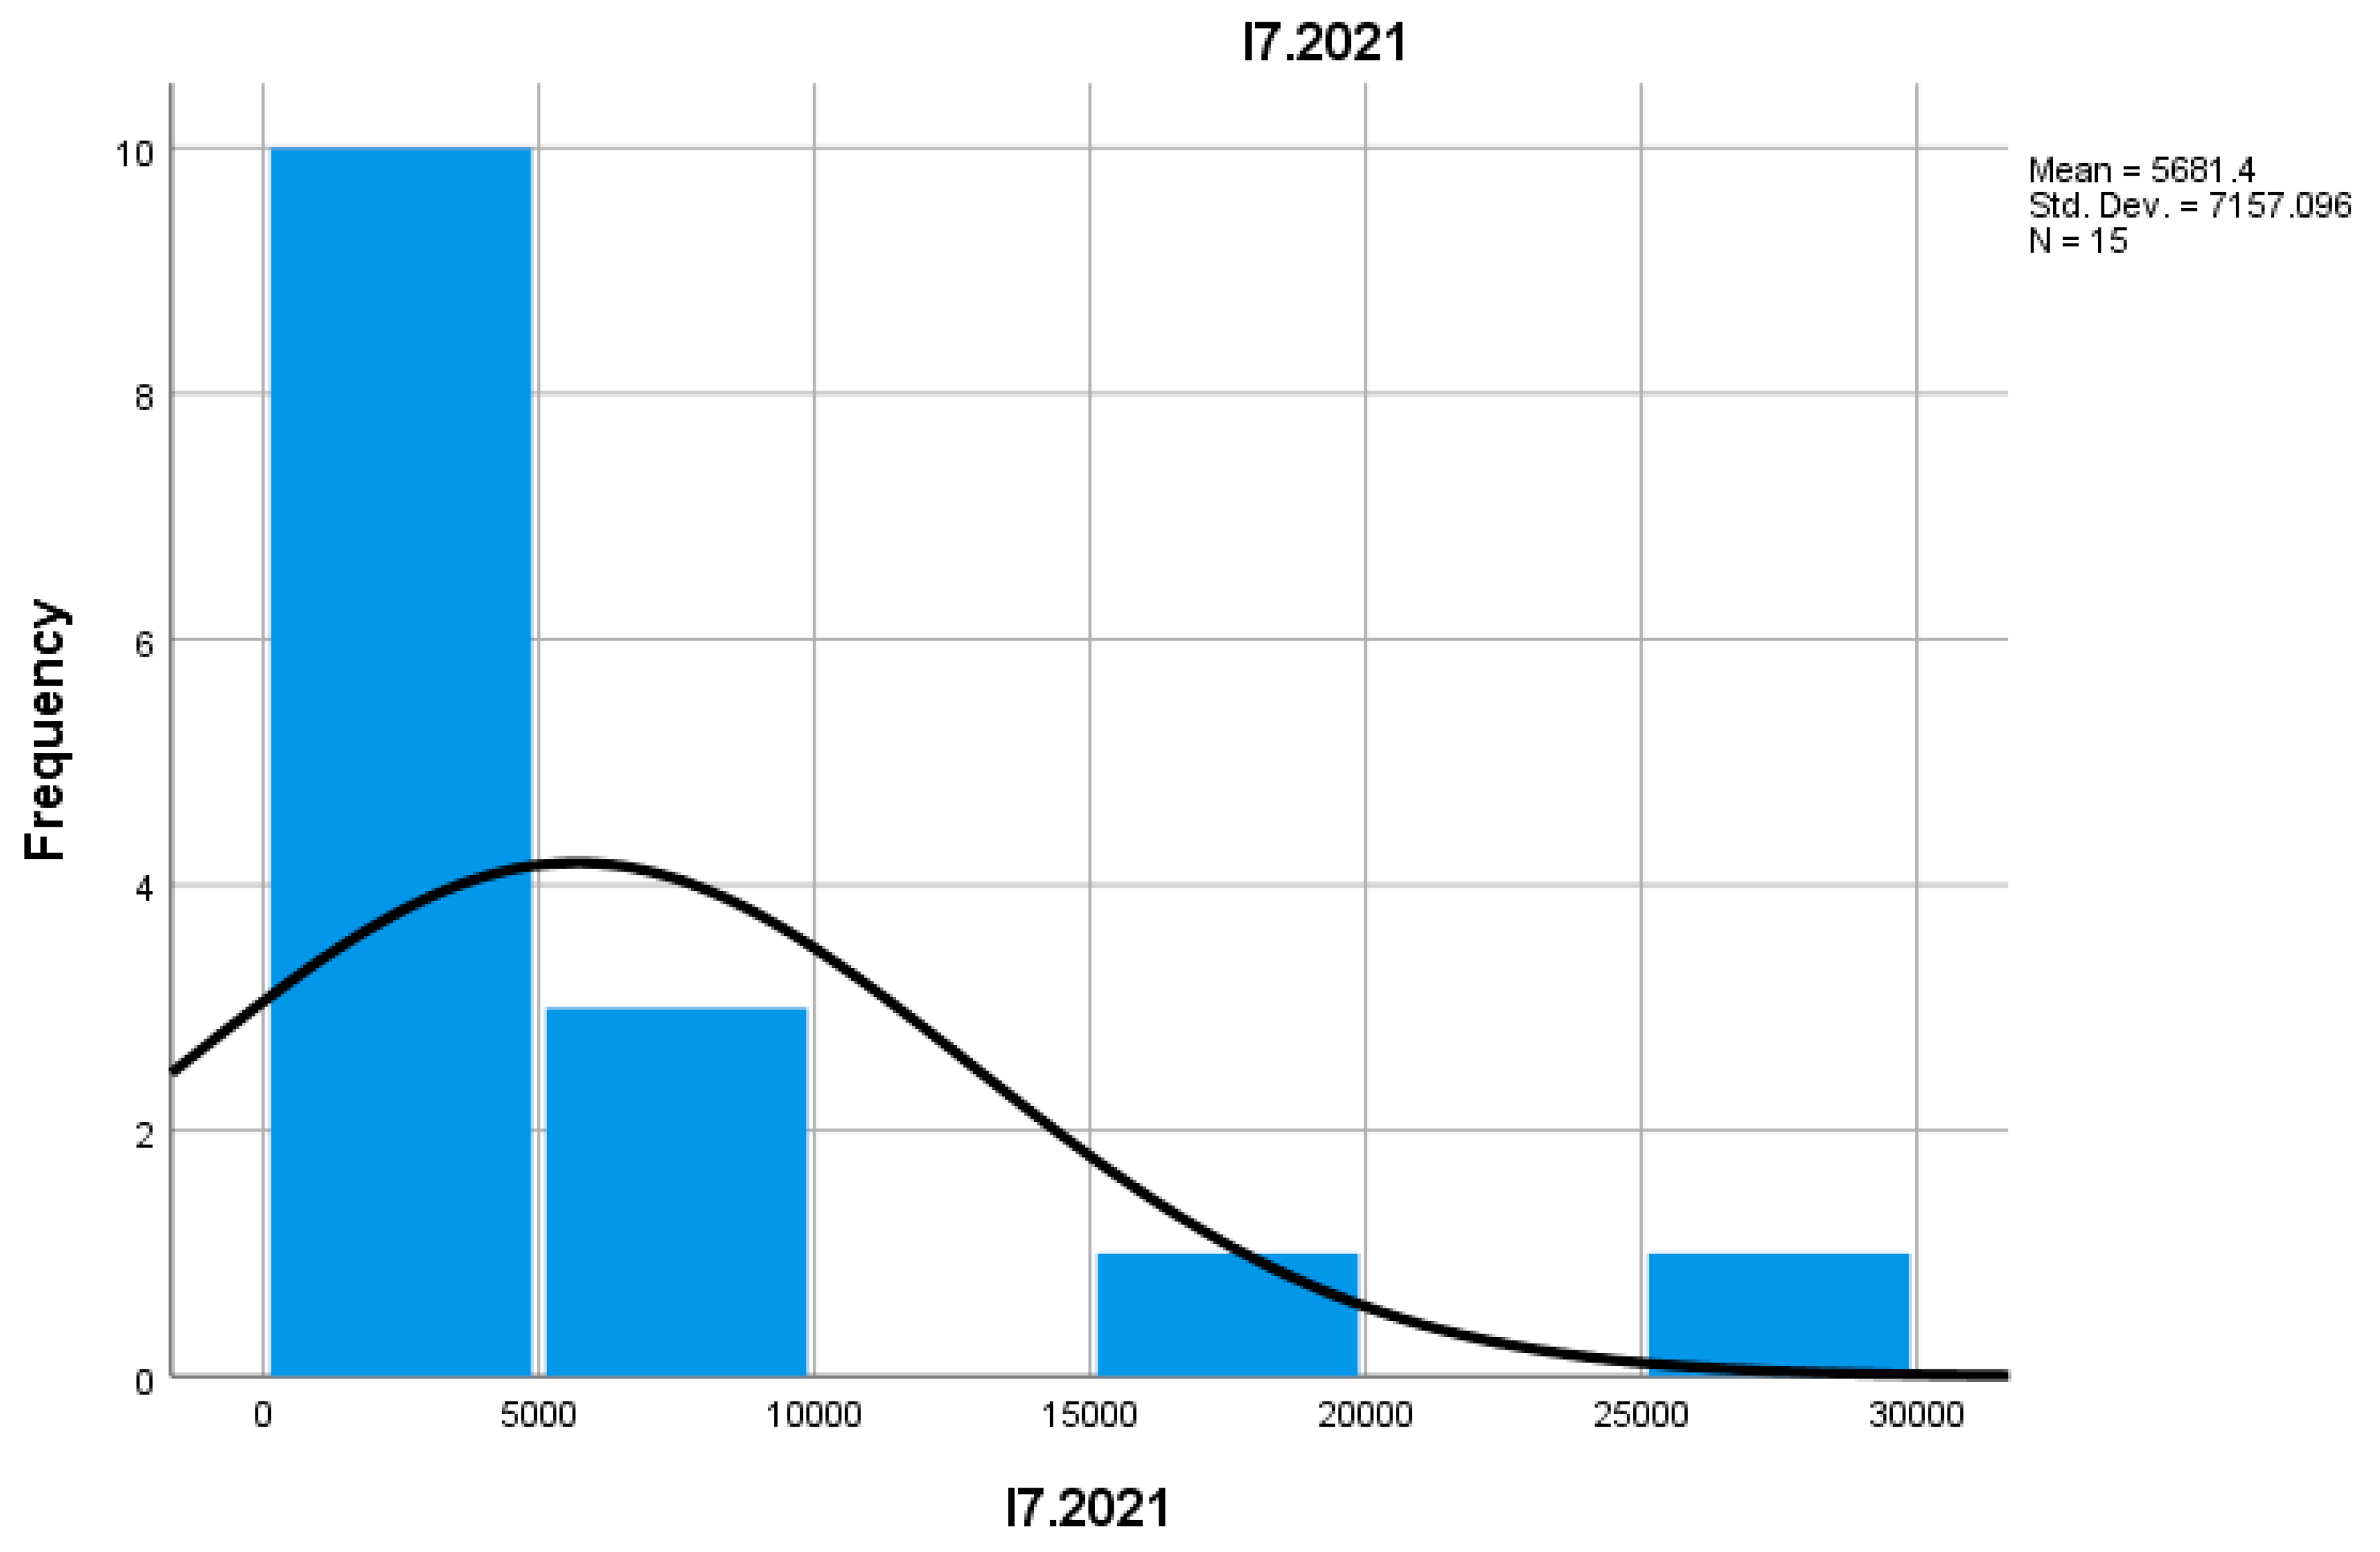
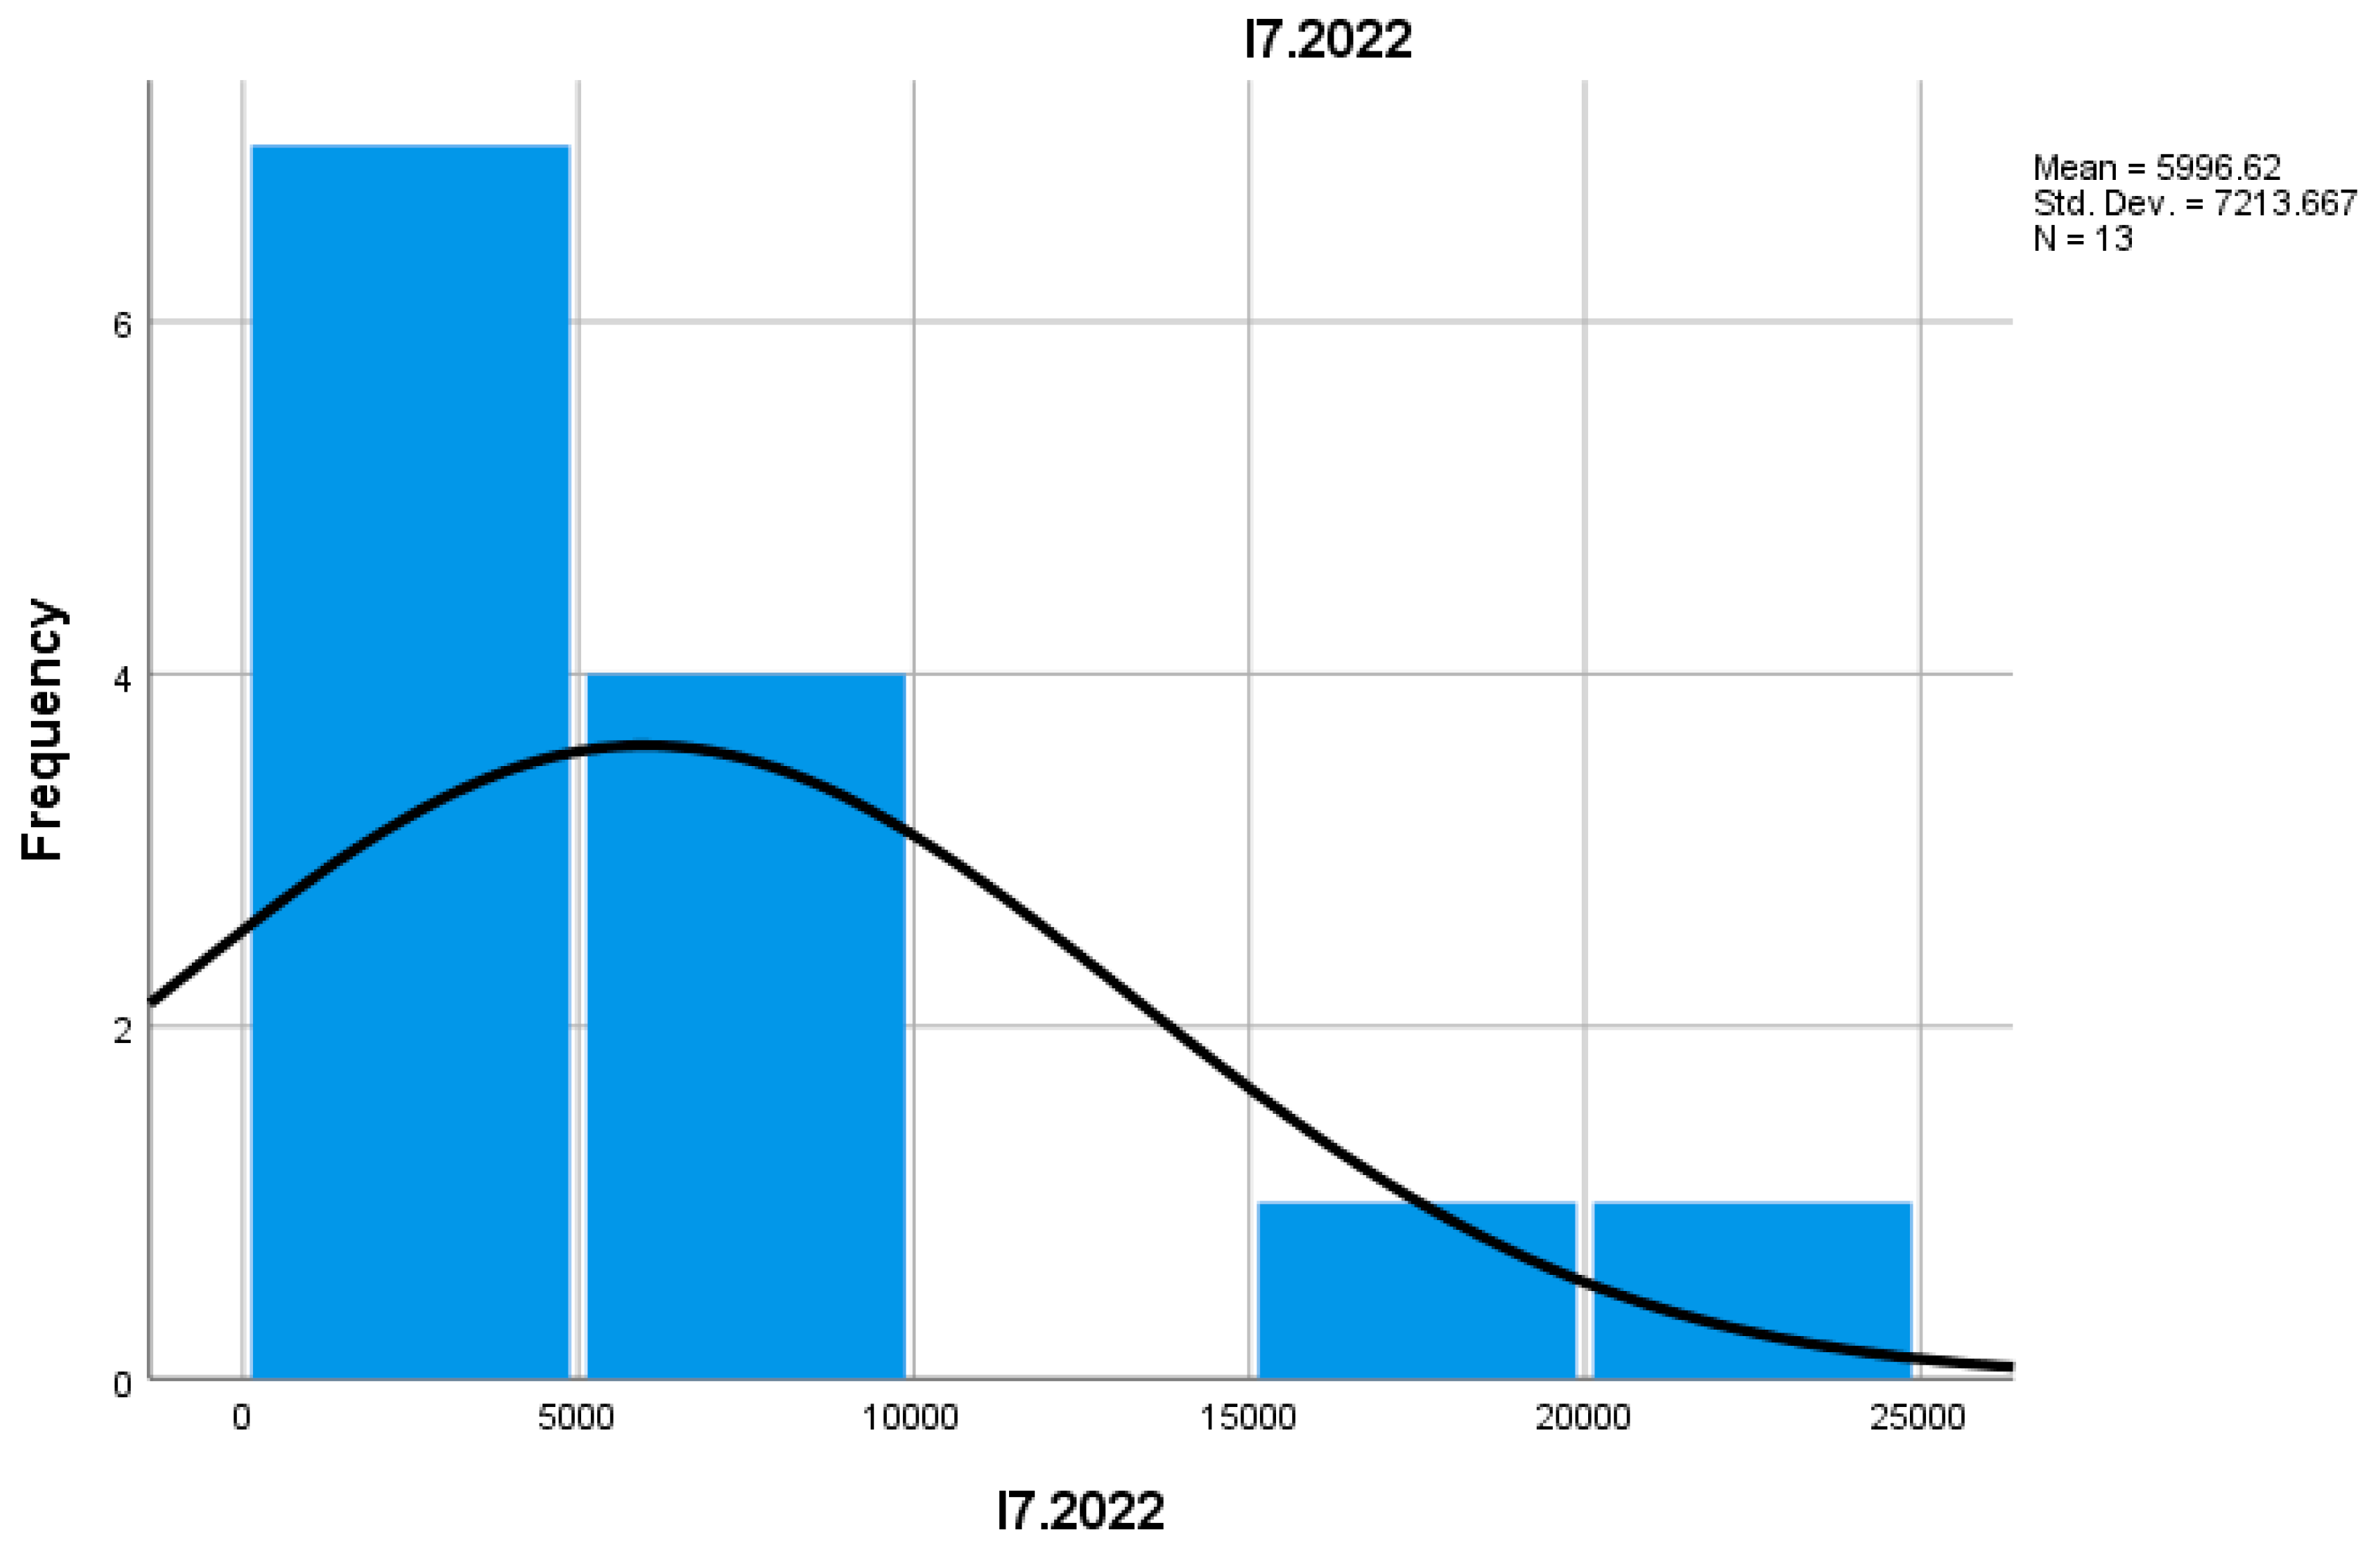
Indicator I7 reflects the number of enterprises that survived their first three years of activity. In 2022, the percentage of enterprises that overcame this period increased compared to 2021. This suggests better adaptation to economic conditions and greater stability for mountain businesses, a positive signal for the future of this sector.
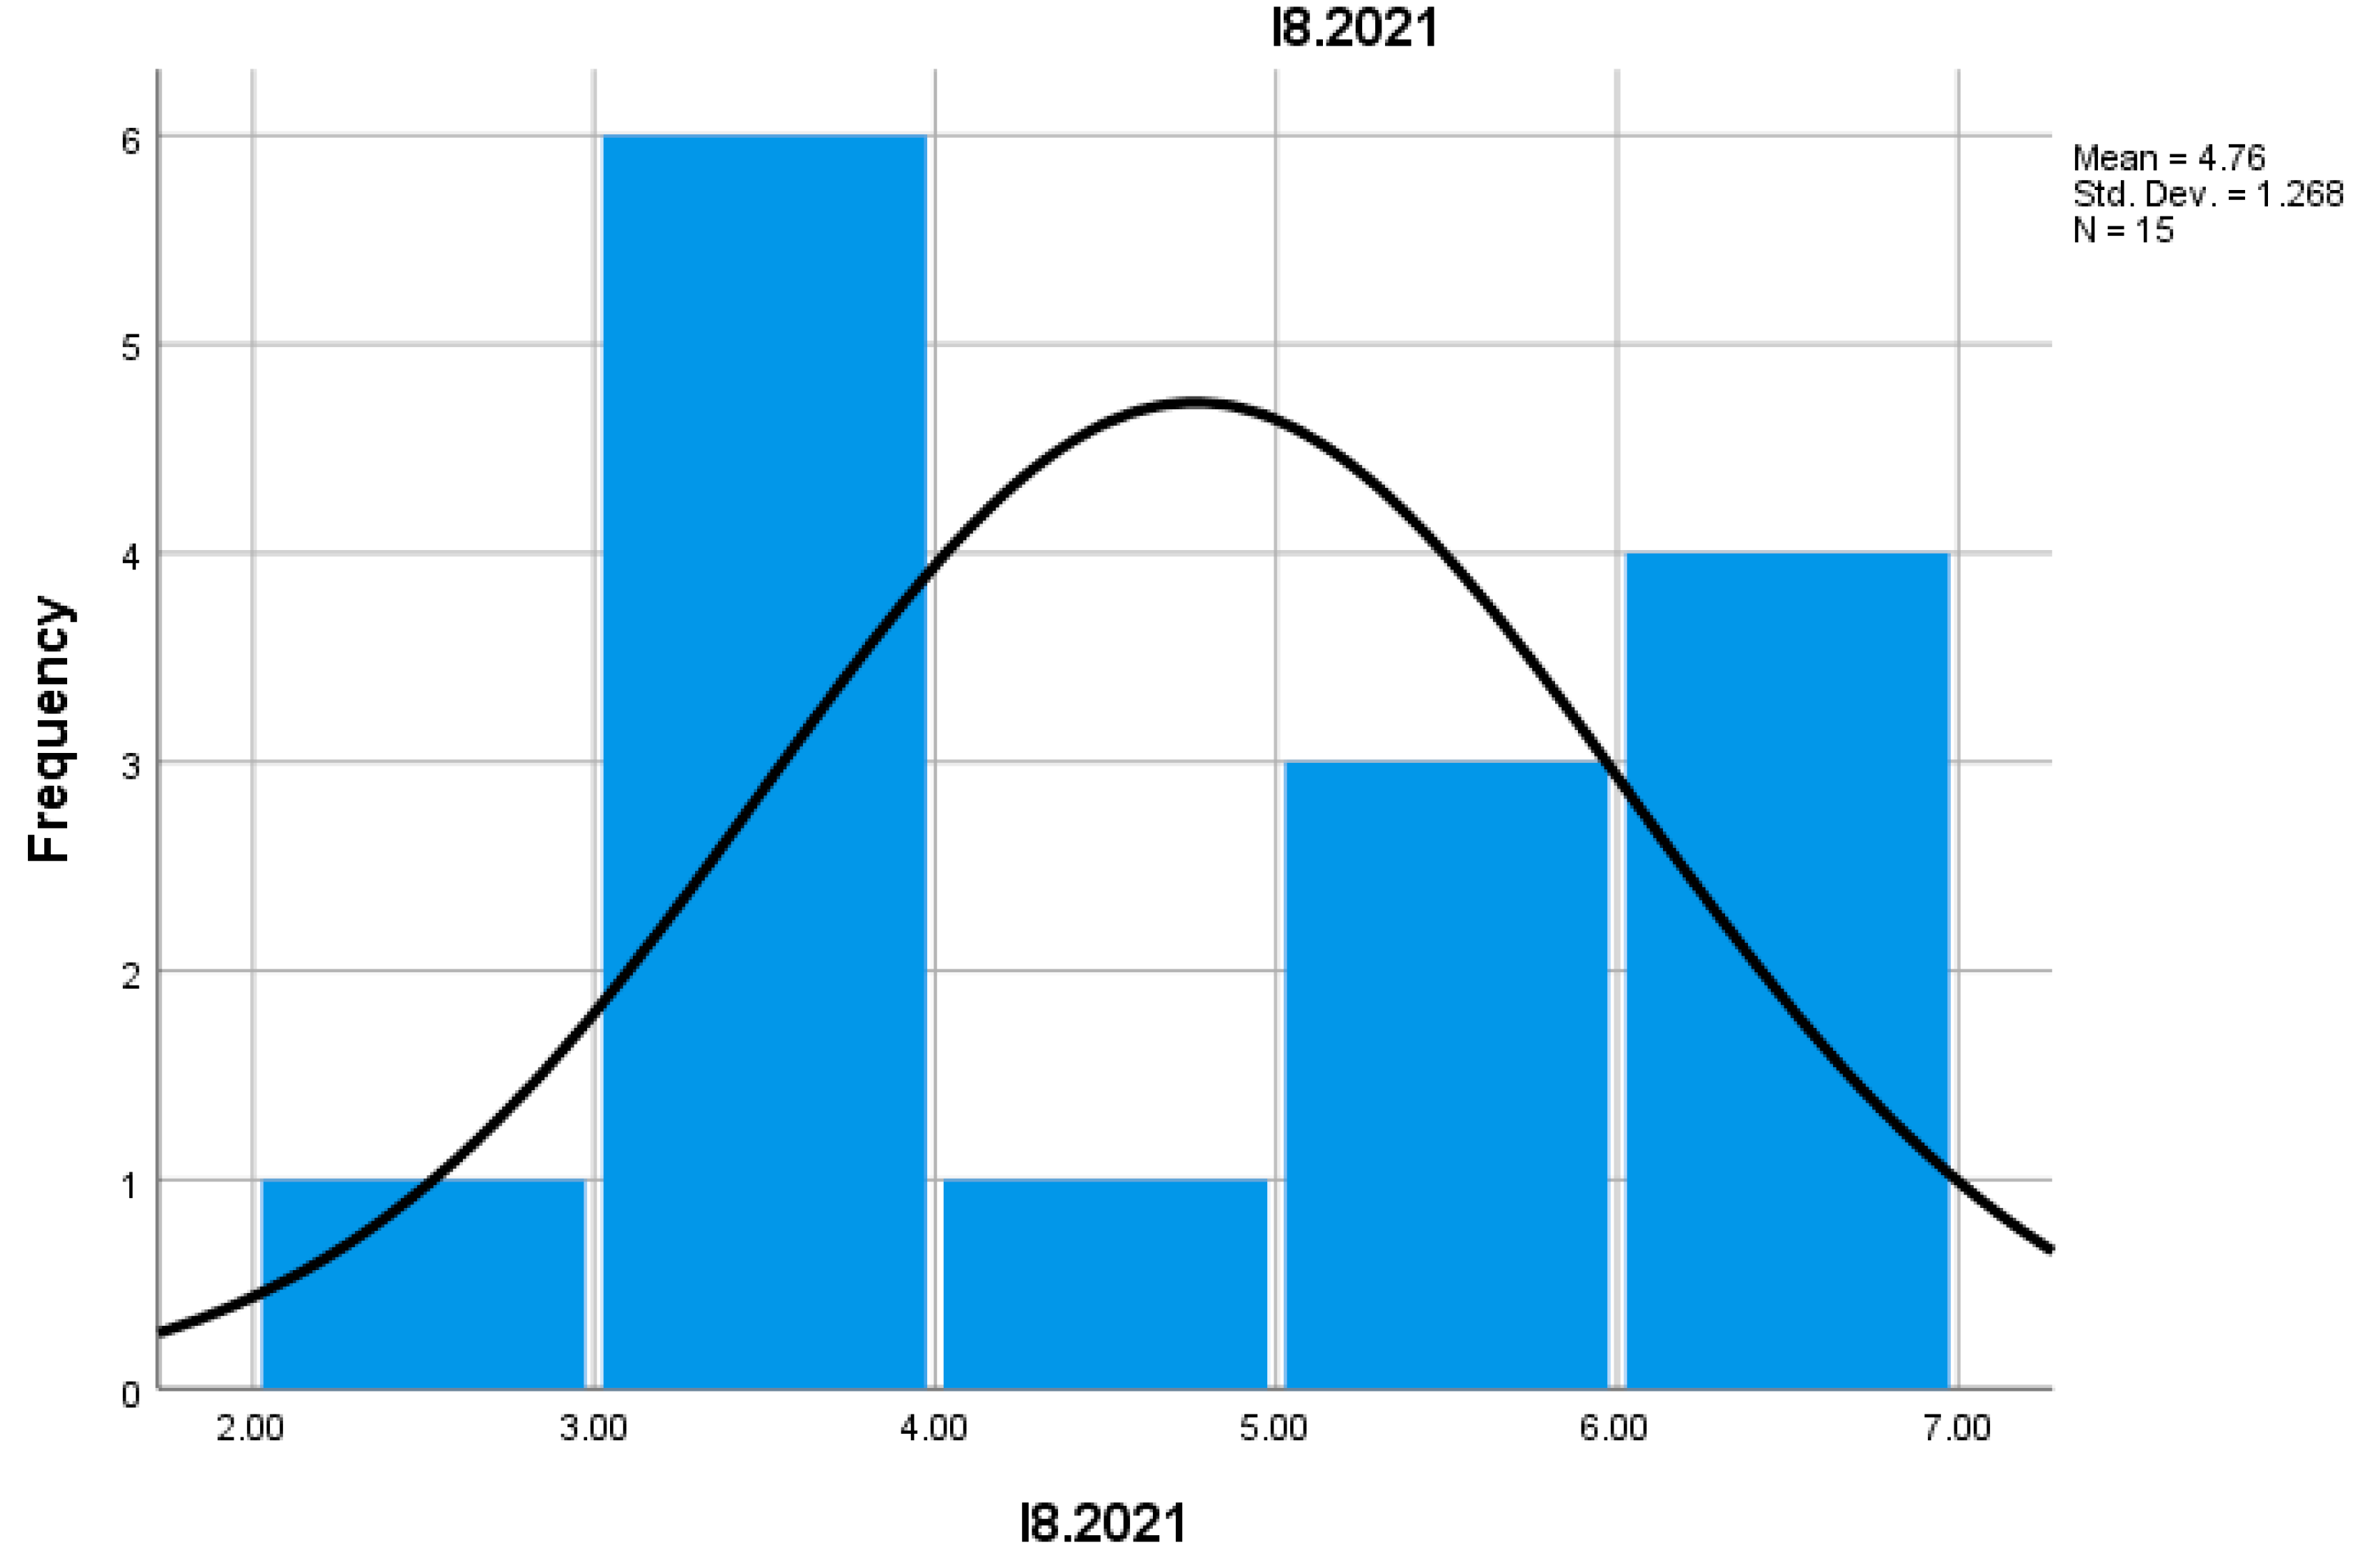
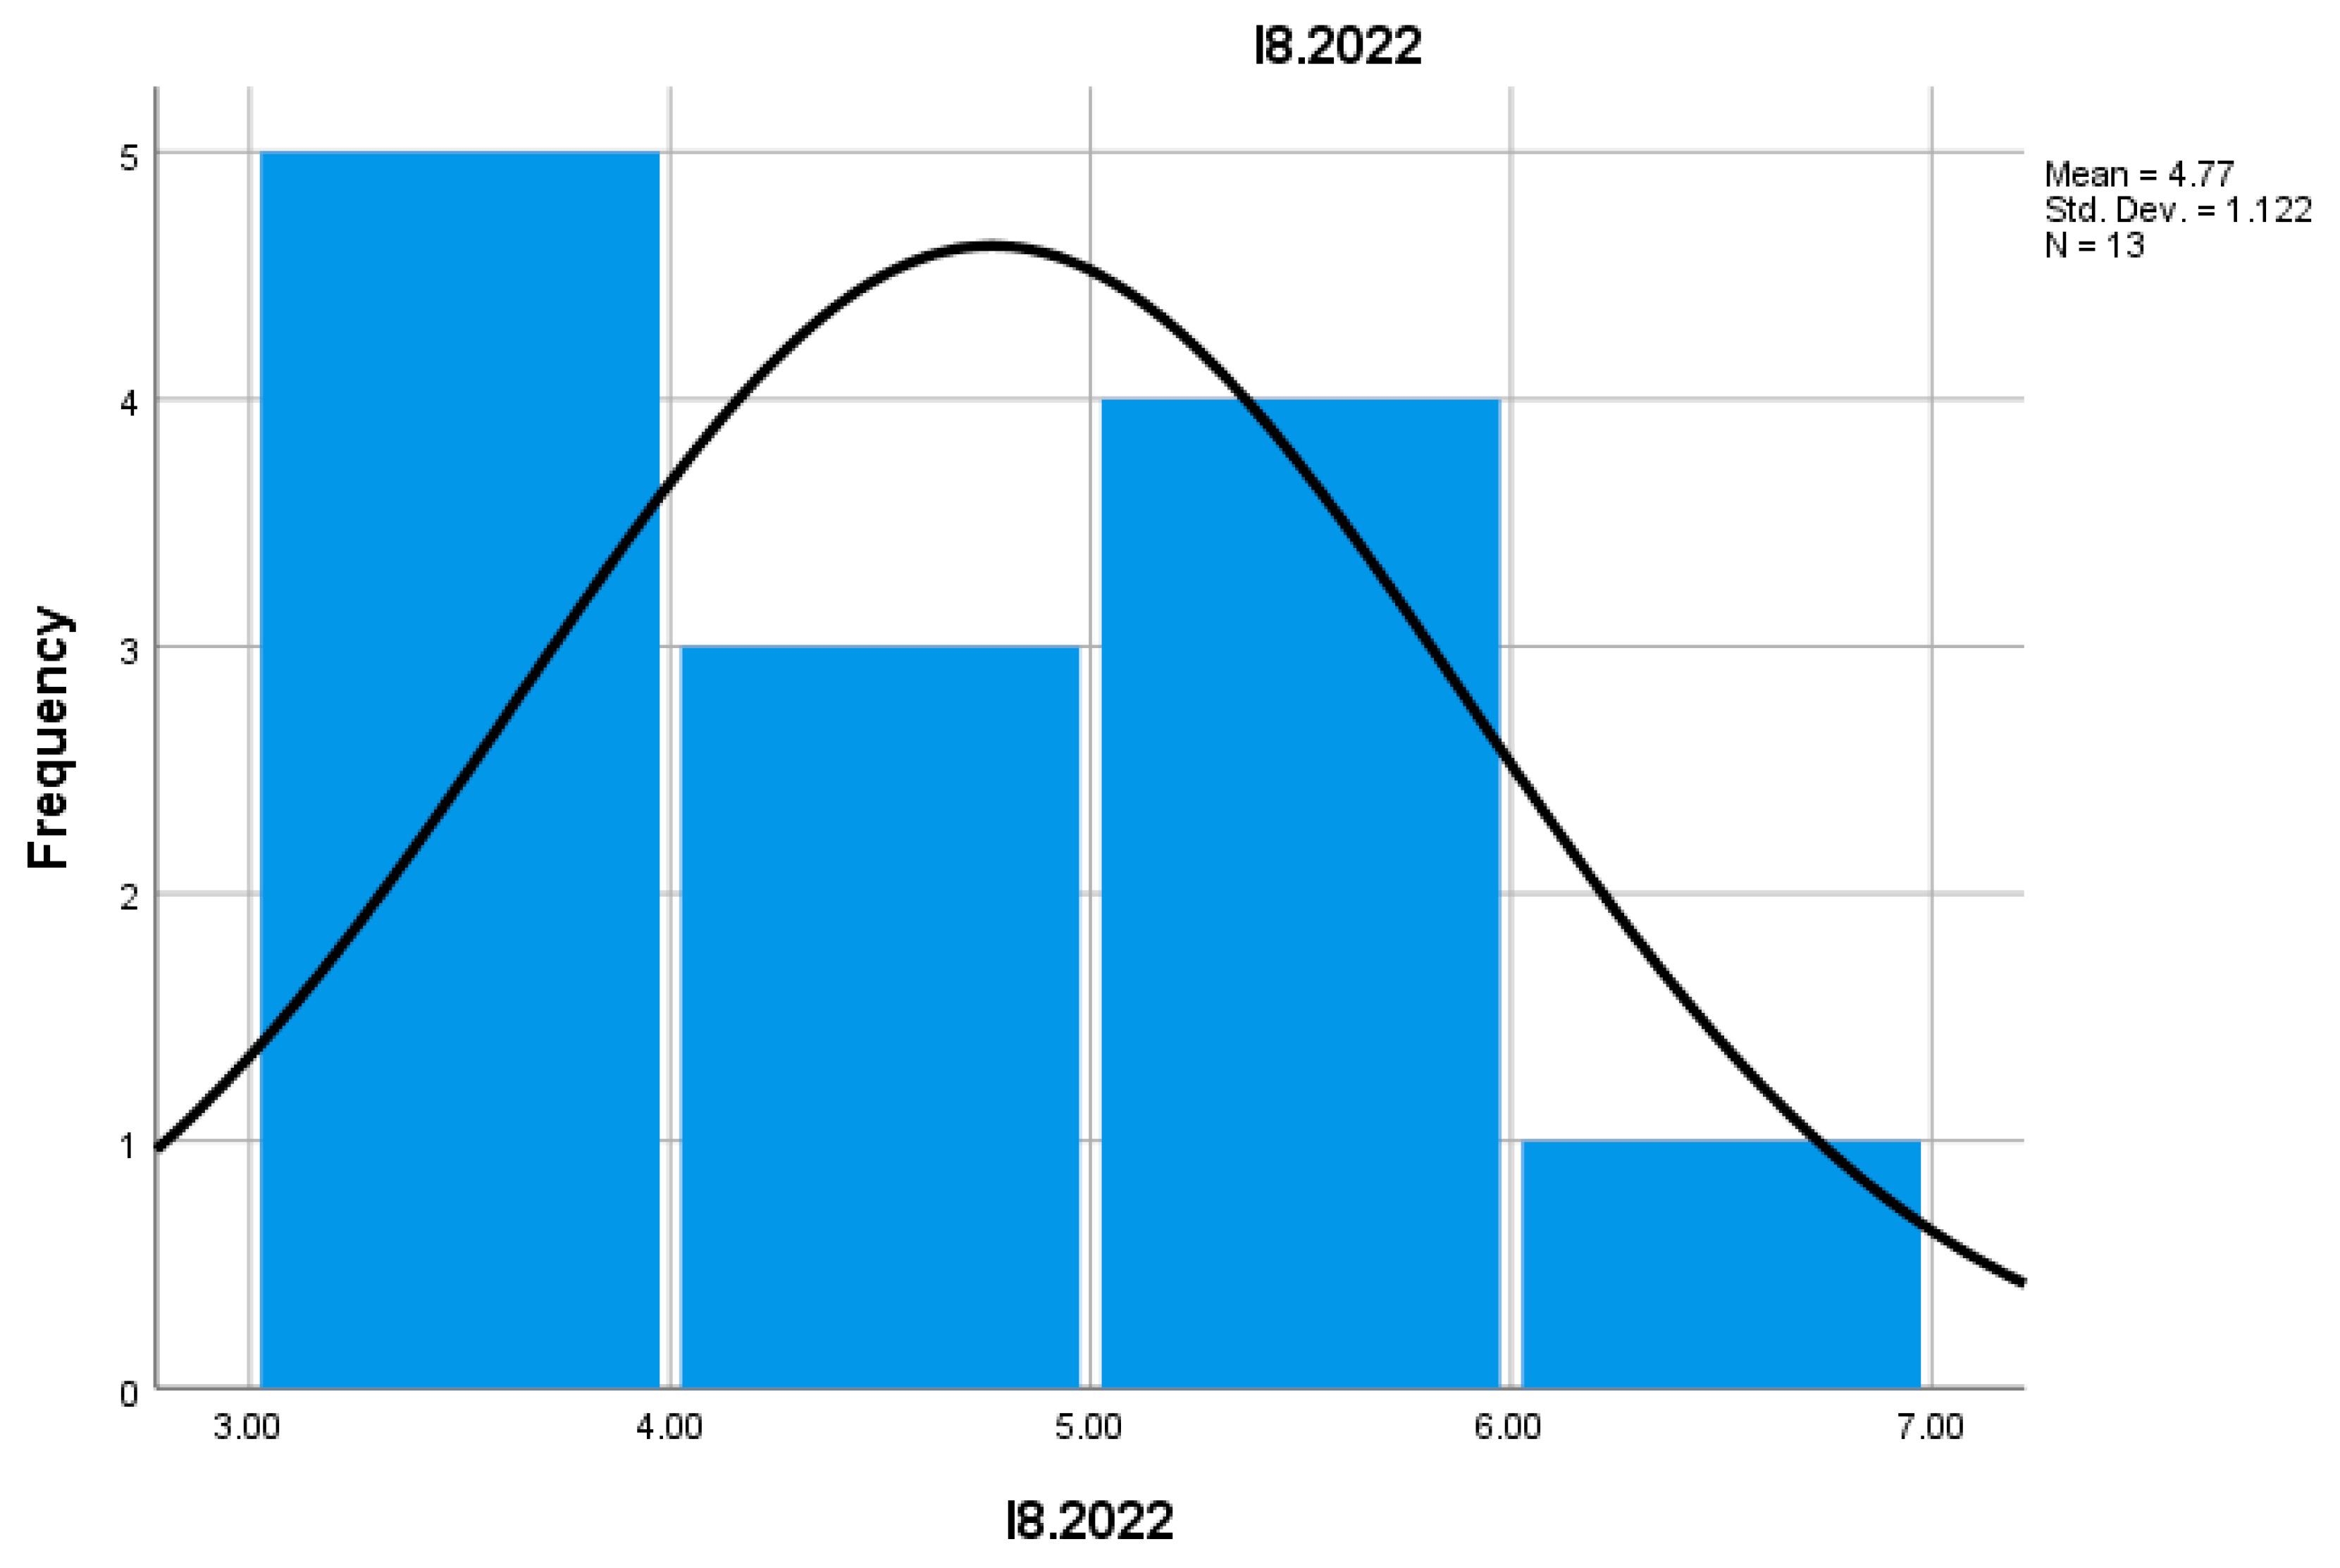
Indicator I8 measures the proportion of 3-year-old enterprises that survived in the total number of active enterprises. In 2022, their proportion was higher than in 2021, suggesting an improvement in the medium-term stability of mountain enterprises. Their survival is essential for maintaining and developing the mountain commerce sector in the long term.
Indicator I9 analyzes the survival rate of enterprises after three years. In 2022, this rate was higher than in 2021, suggesting greater adaptability of mountain entrepreneurs and an increased ability to respond to economic and market challenges. Long-term survival is crucial for the sustainable development of this economic sector.
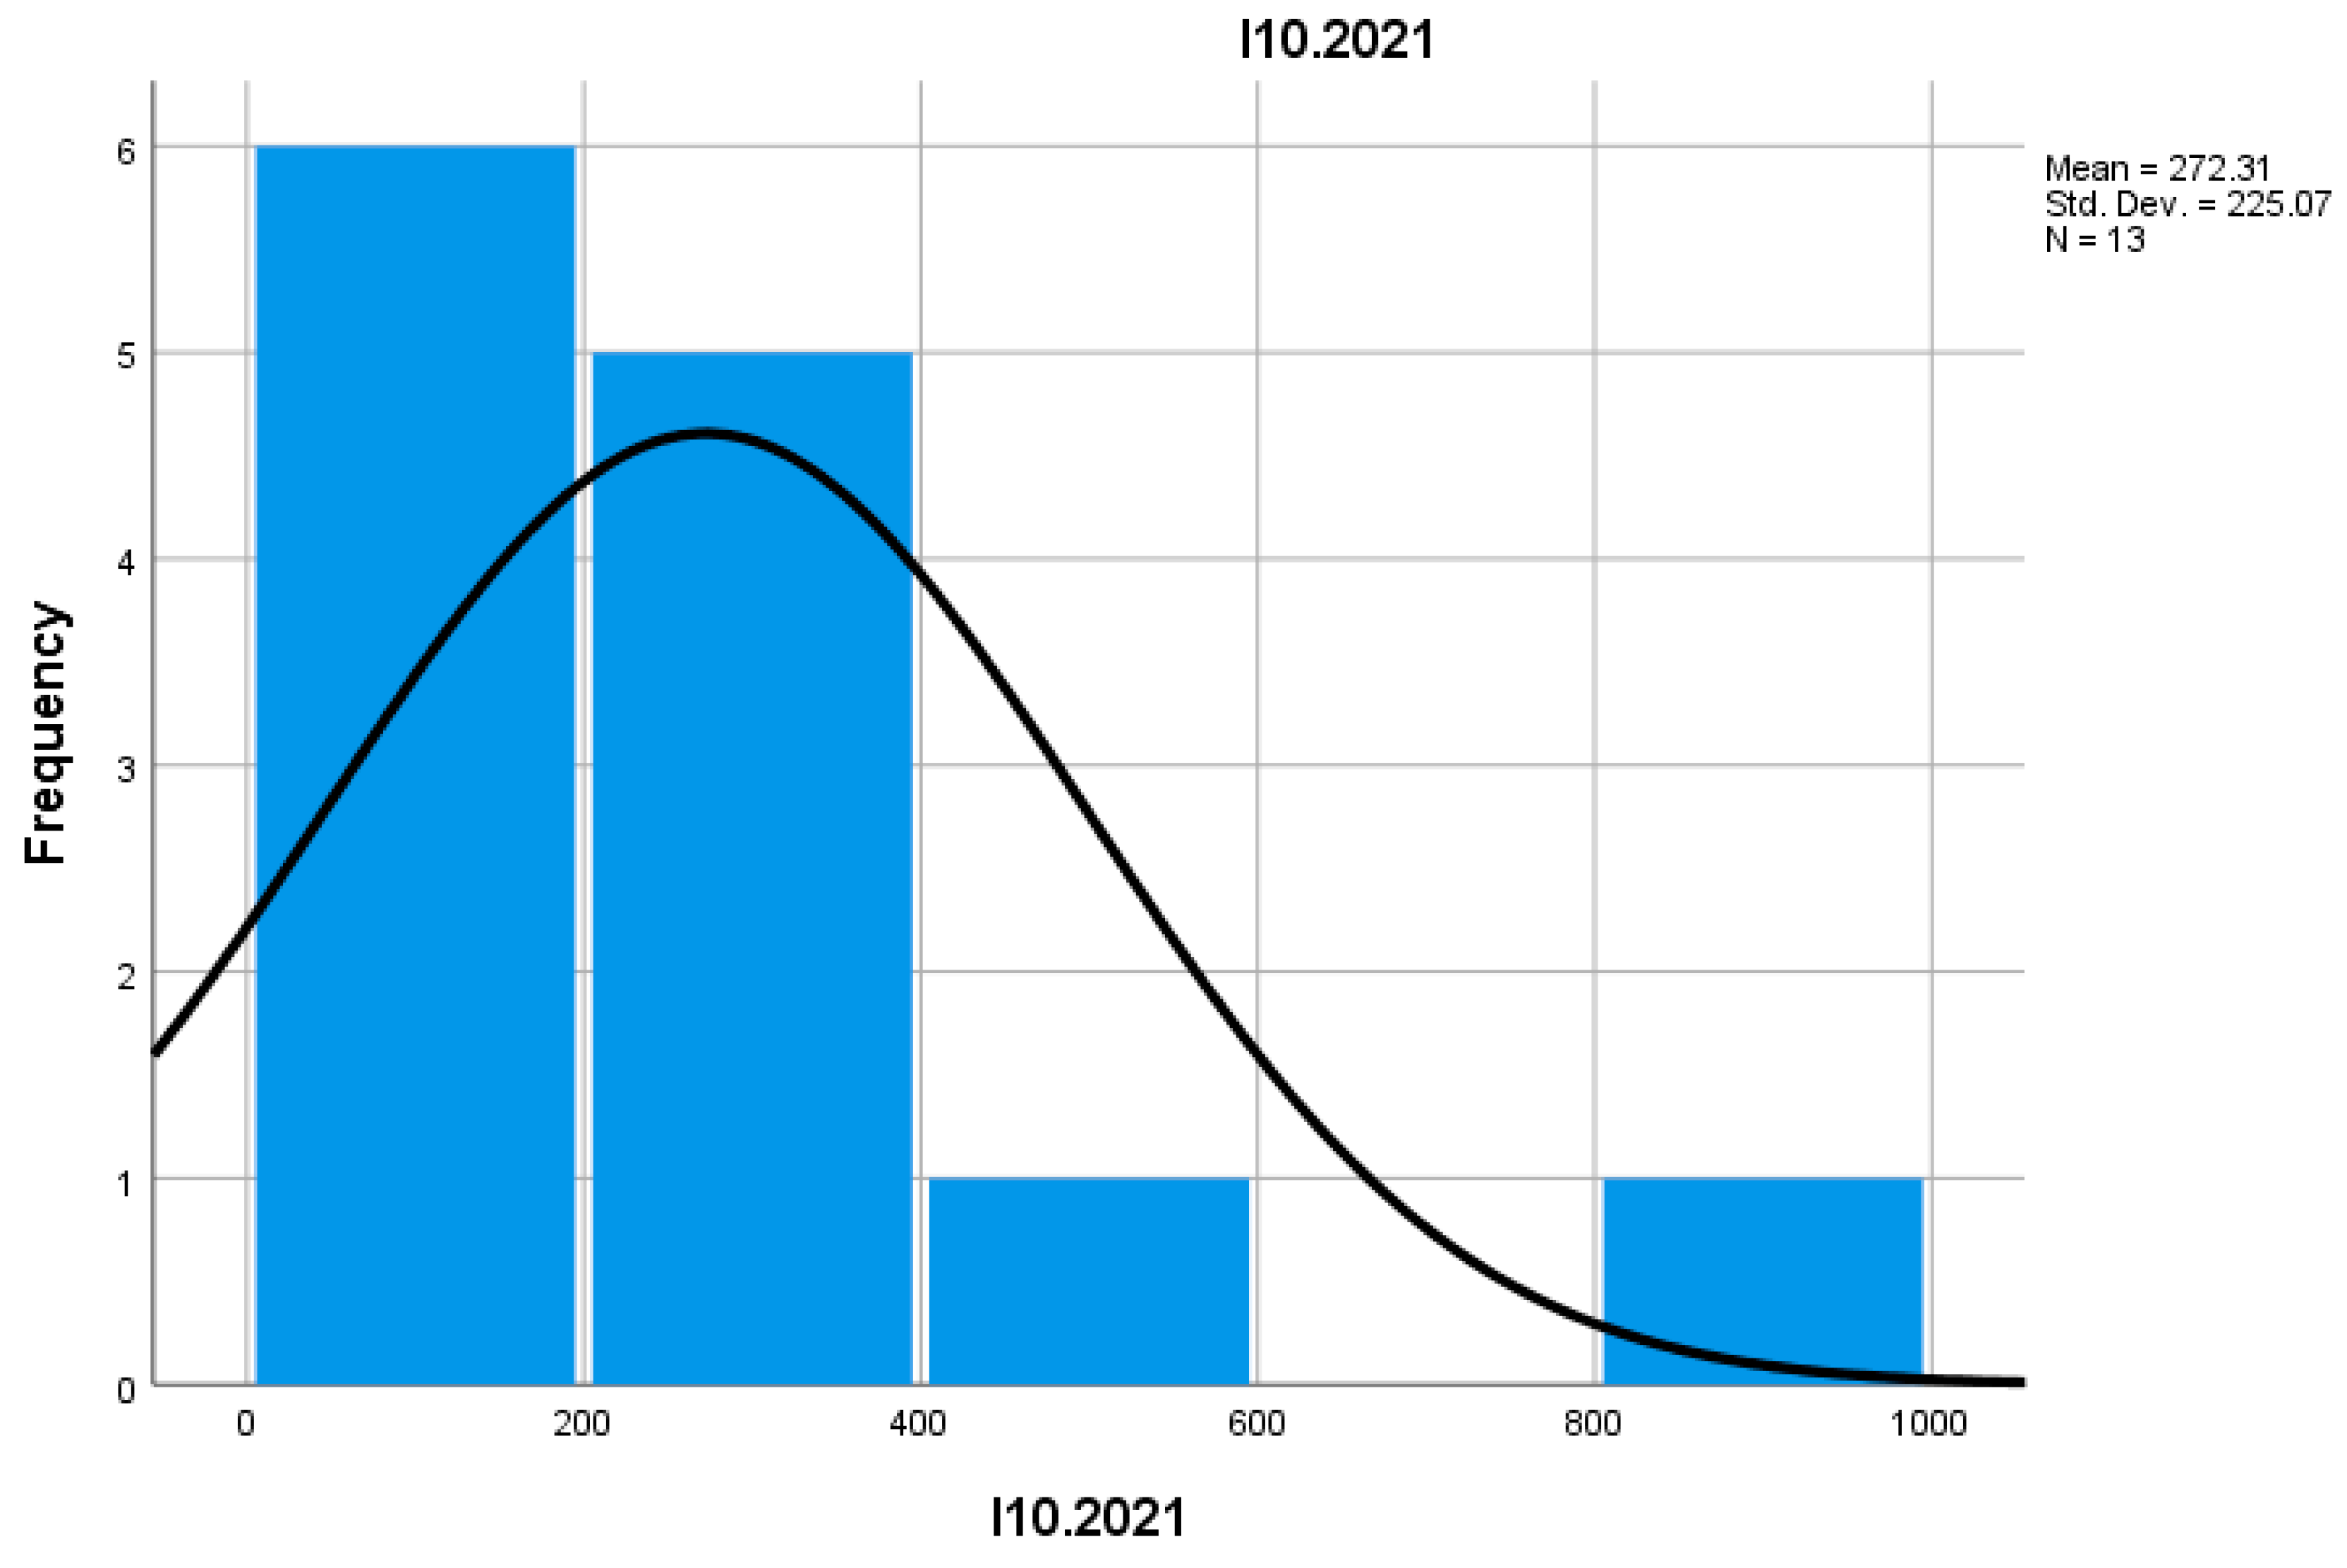
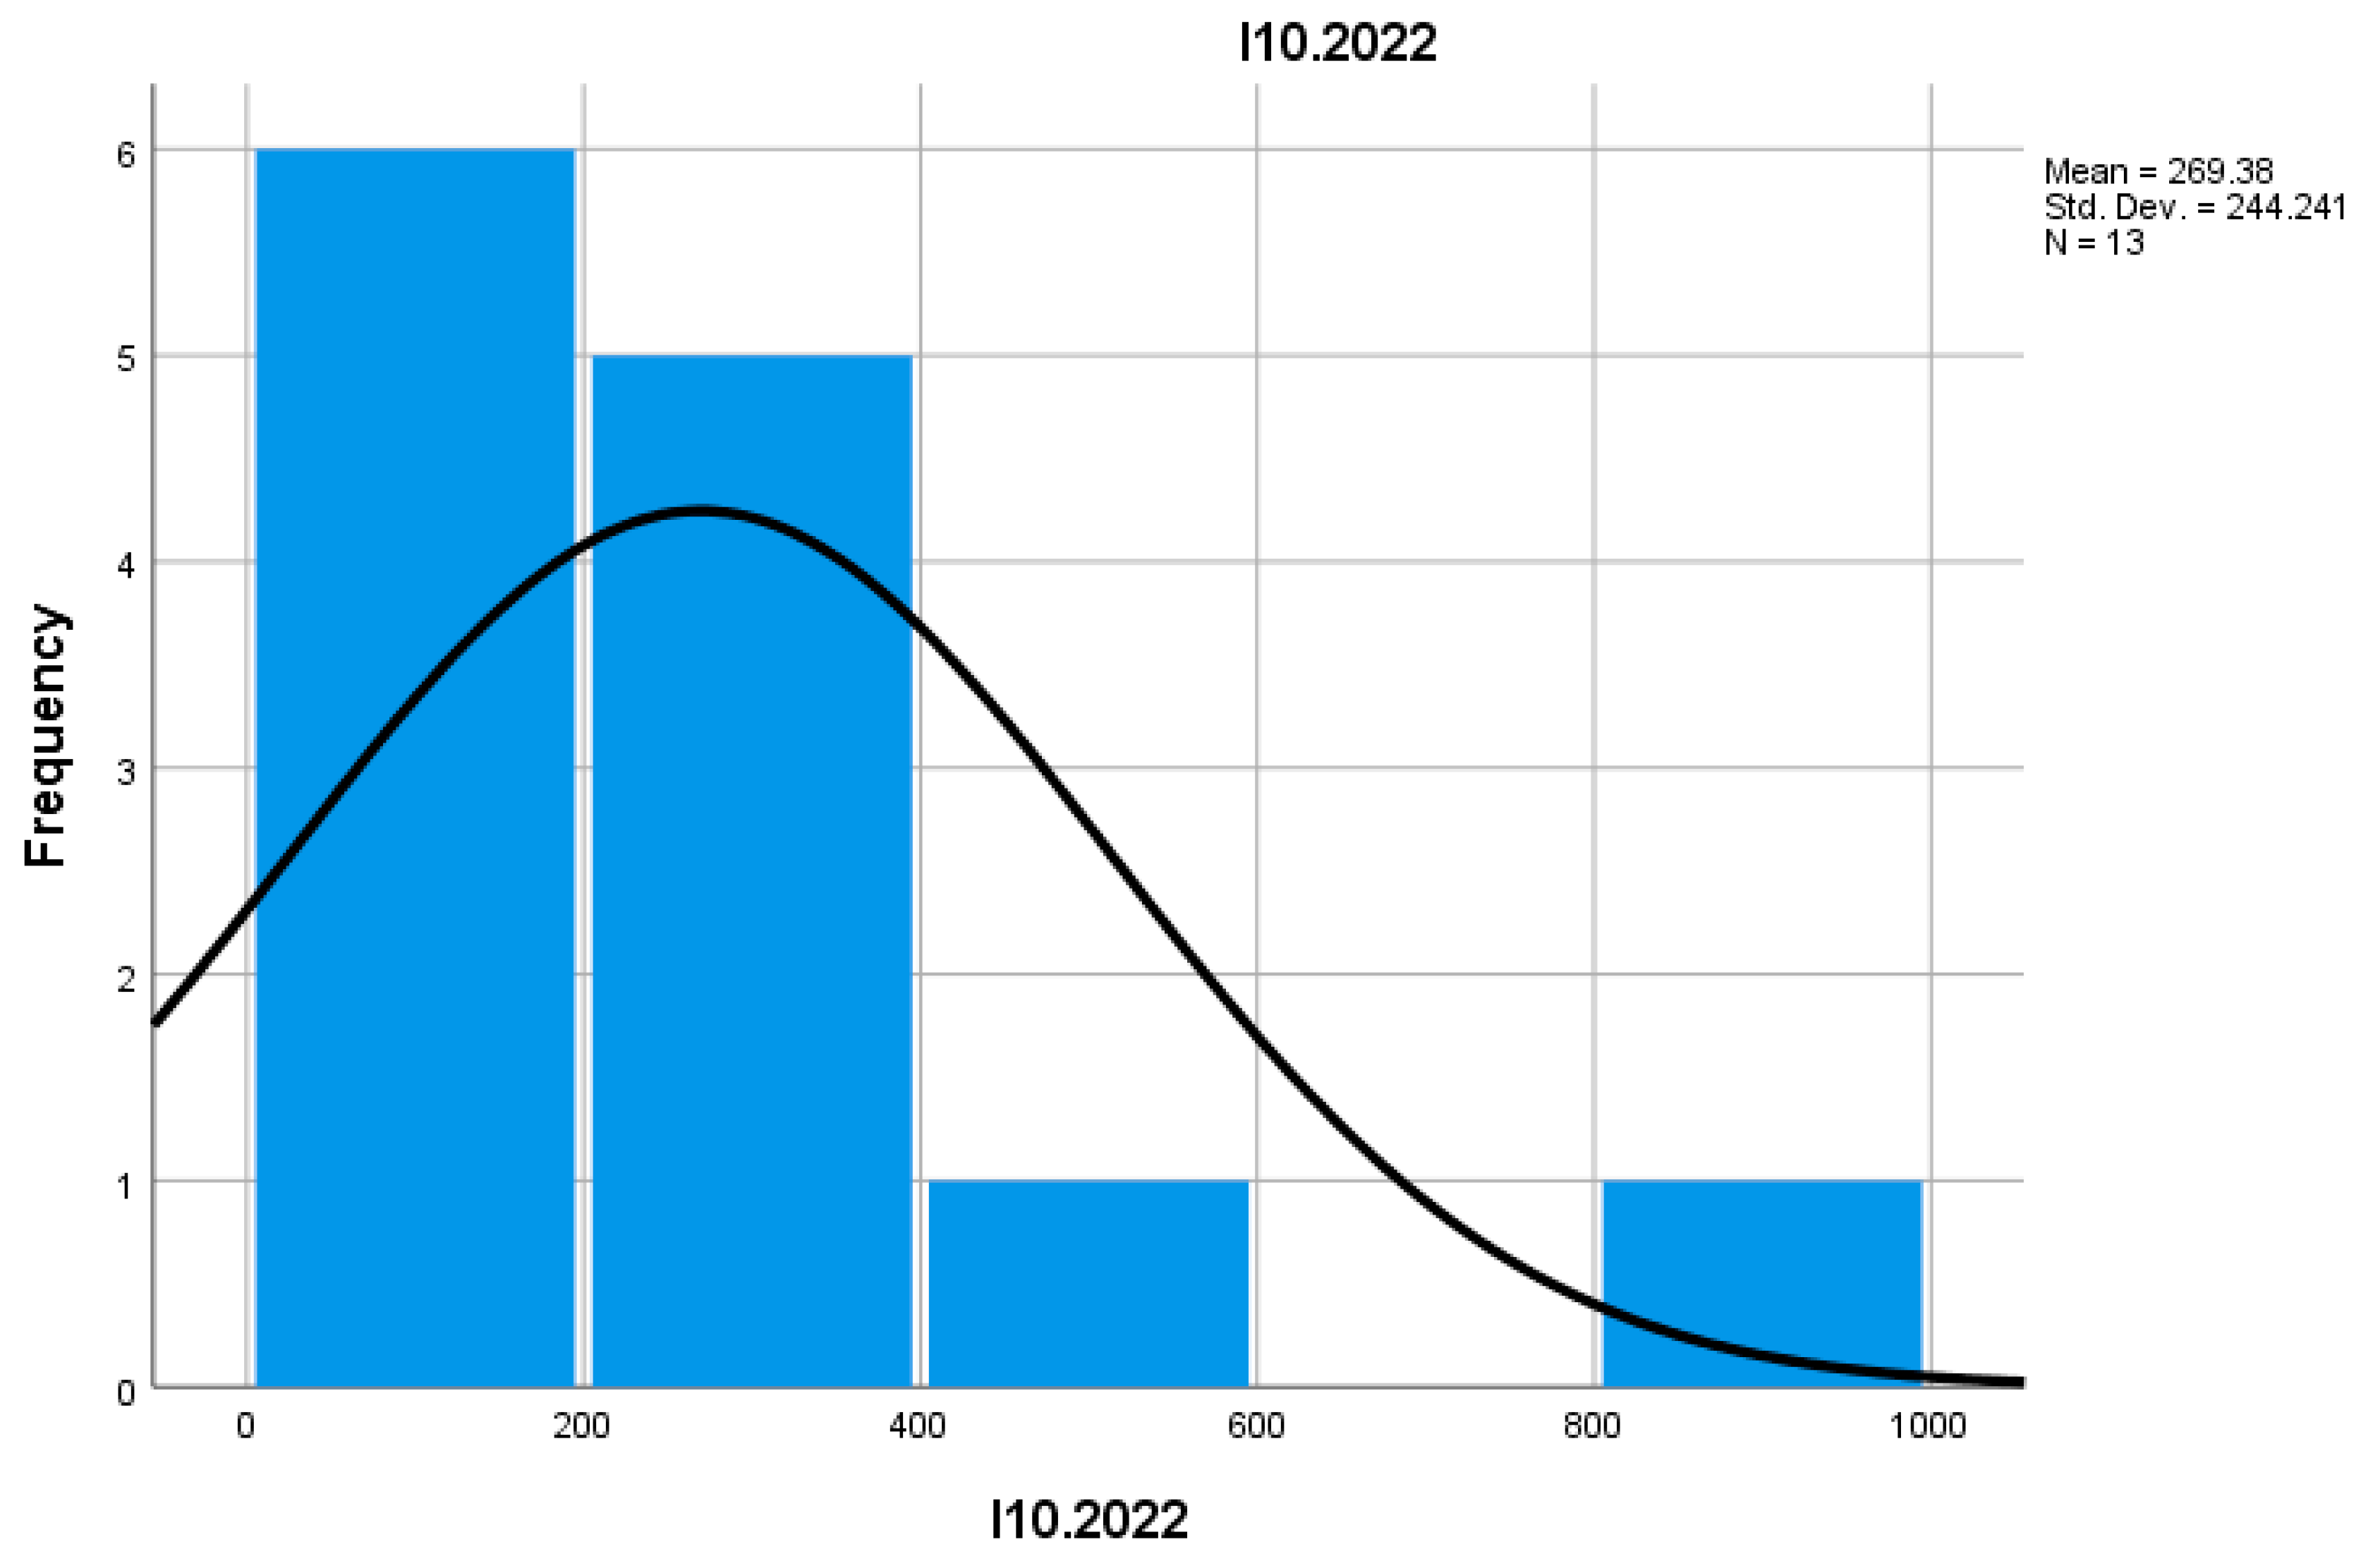
Indicator I10 measures the number of enterprises with rapid growth in revenues or employees. In 2022, this number increased compared to 2021, suggesting positive dynamics and expansion of mountain businesses, attracting more employees and generating higher revenues. This growth may reflect both the attraction of tourists and the diversification of the commercial offer.
Indicator I11 reflects the proportion of enterprises with rapid growth in total active enterprises. In 2022, this proportion was higher than in 2021, suggesting stabilization and consolidation of such businesses in mountain commerce. These enterprises are typically a driving force of economic growth in mountain regions, contributing significantly to local development.
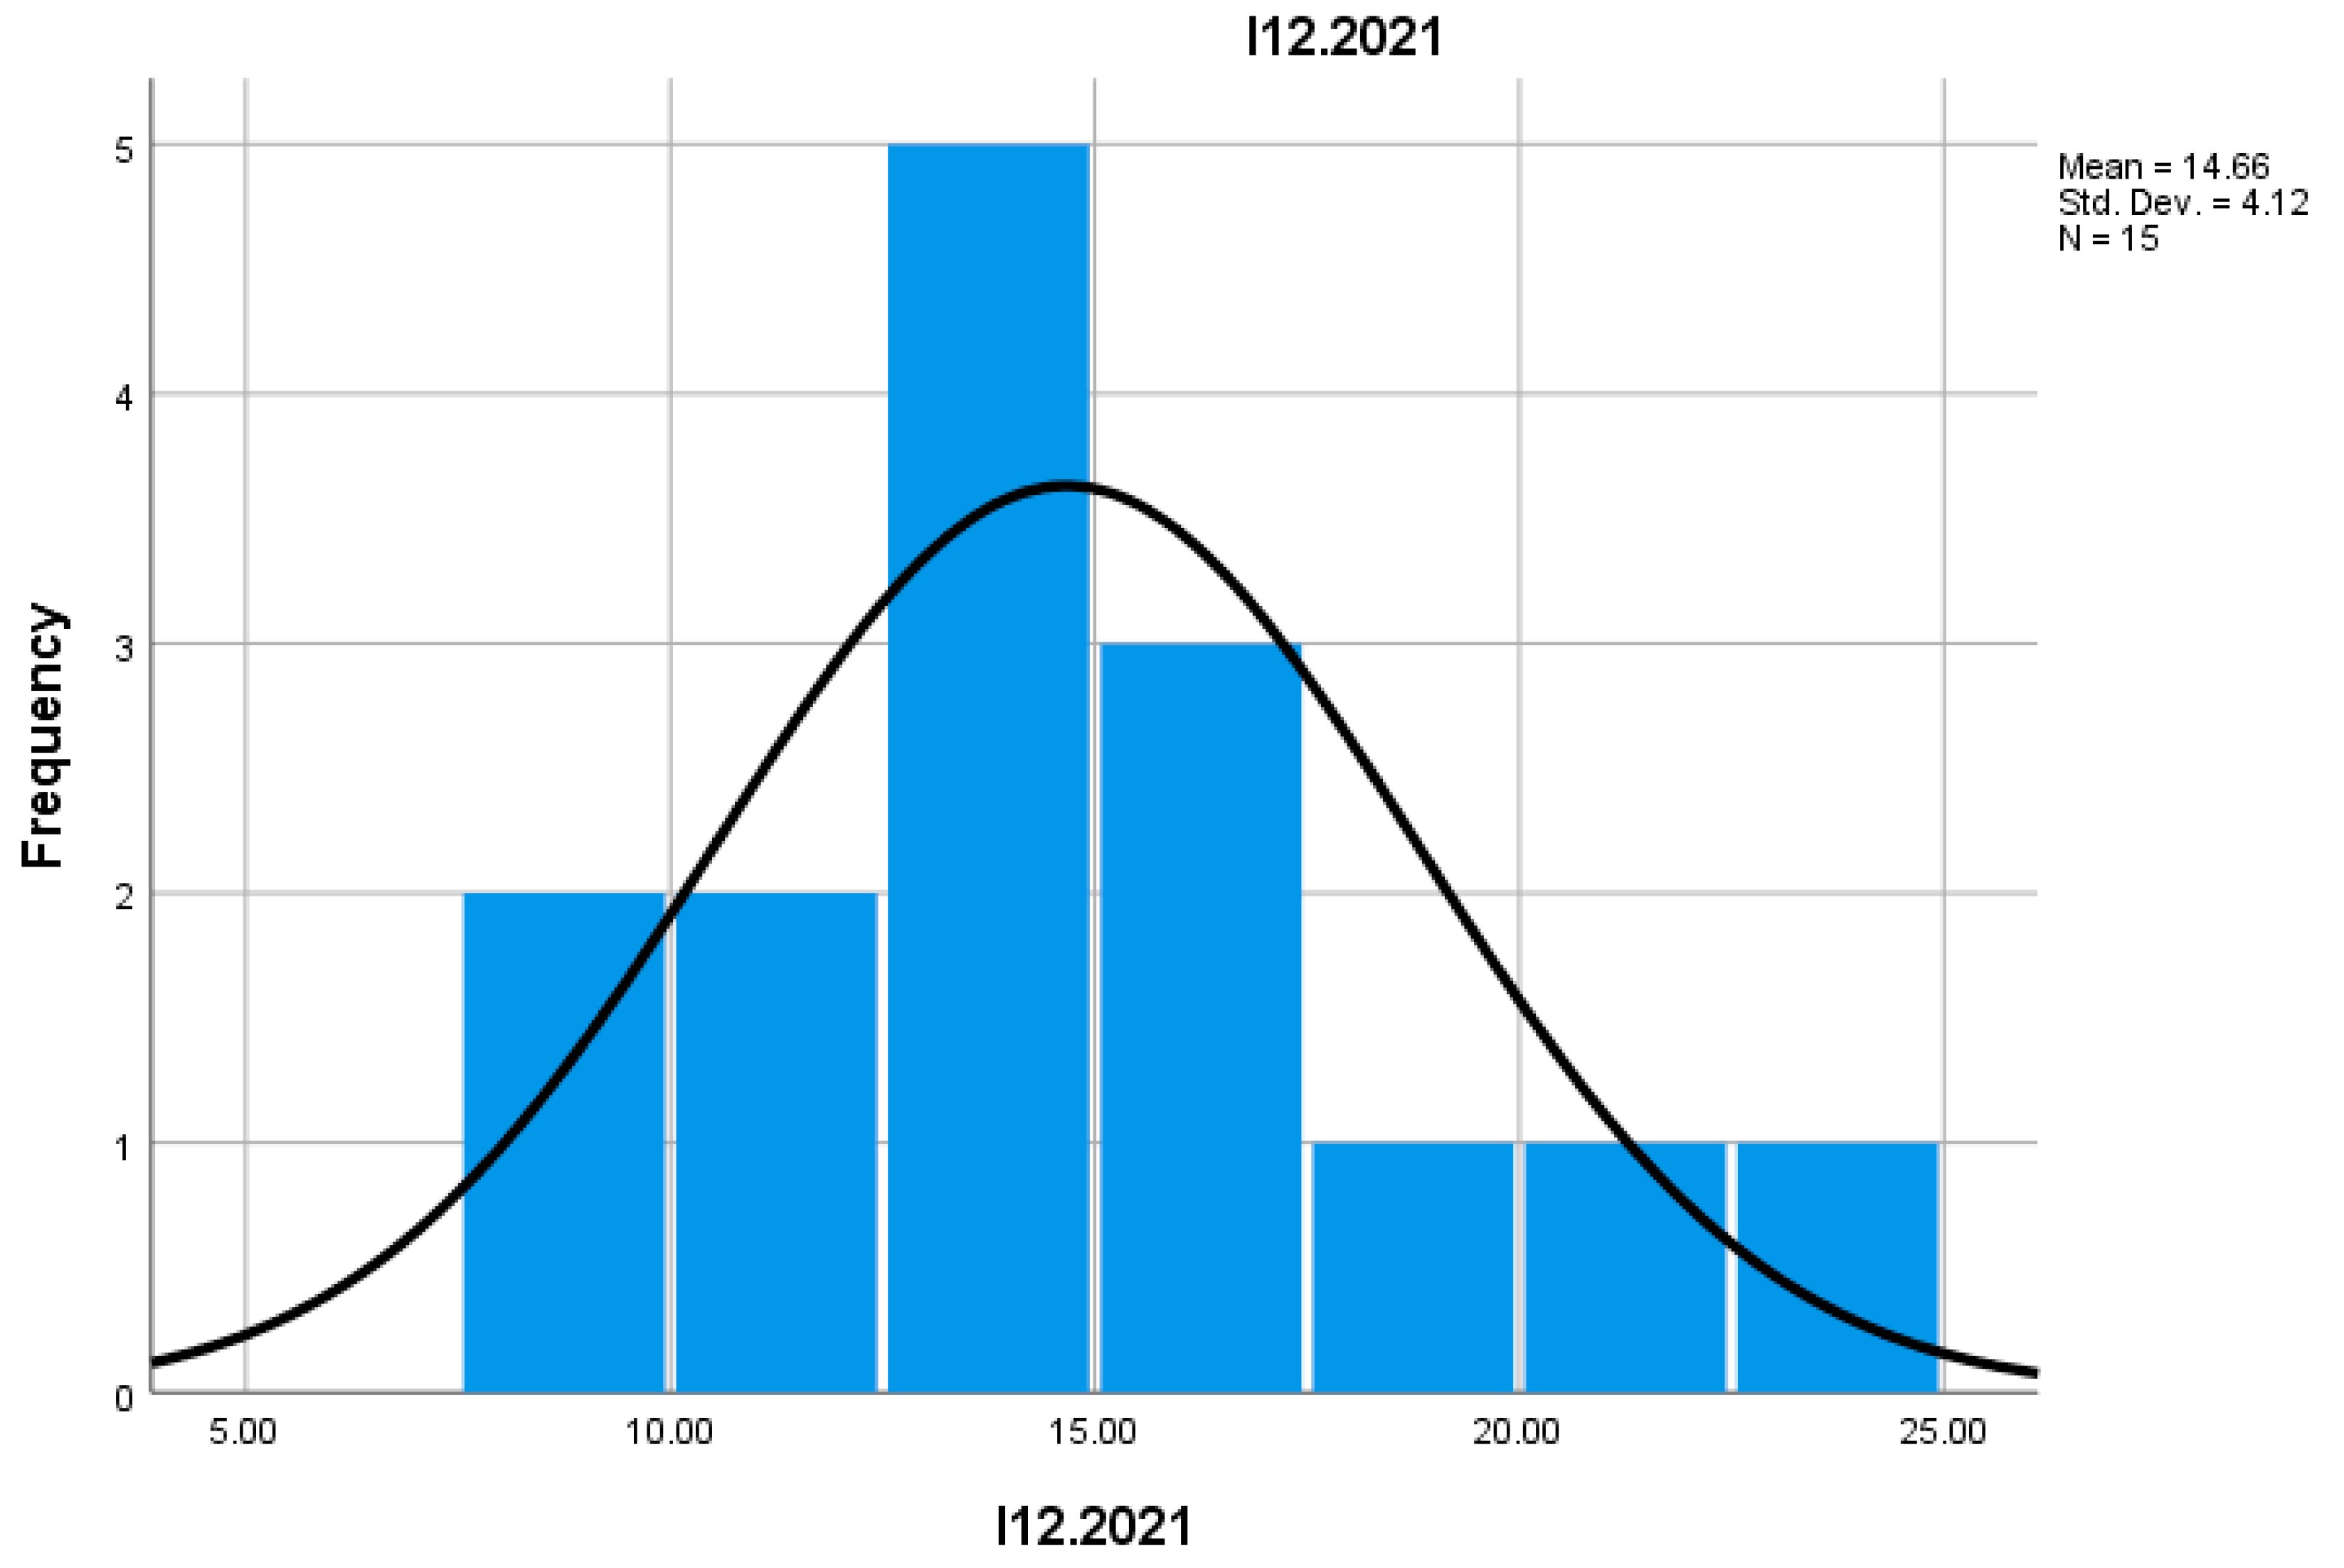
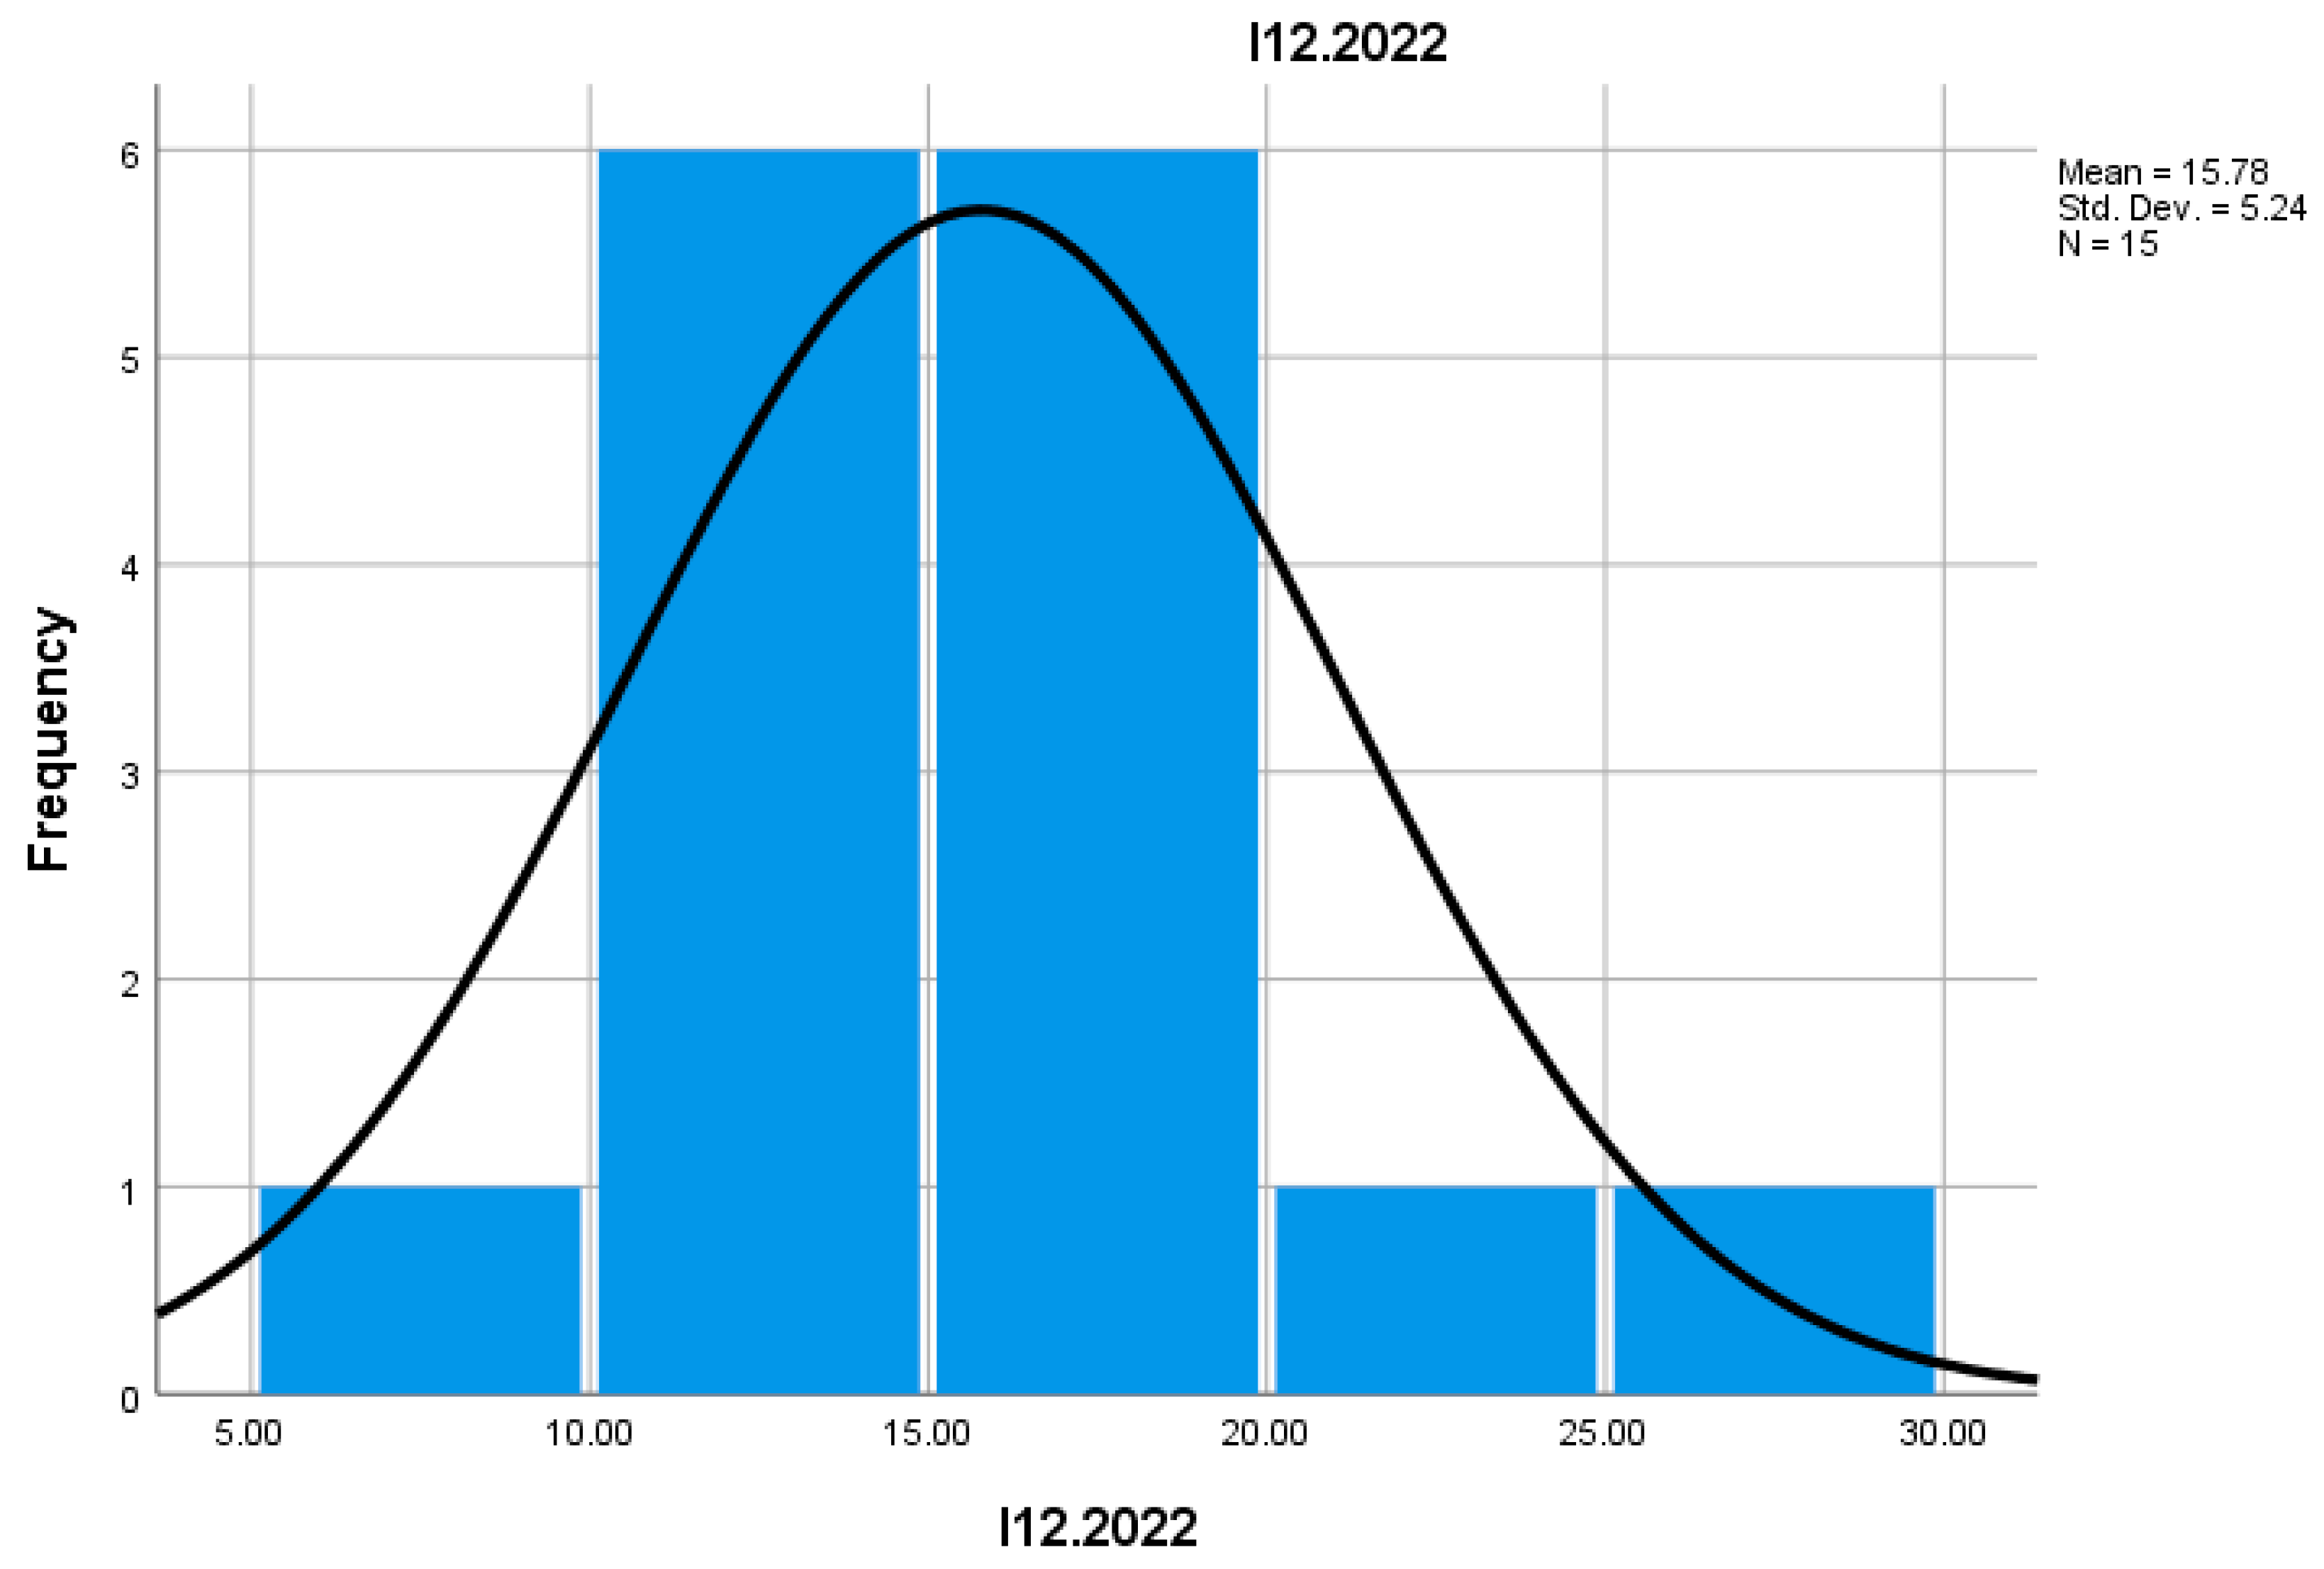
Indicator I12 measures the number of employees in rapidly growing enterprises. In 2022, this number increased compared to 2021, reflecting the success of these businesses in creating additional jobs and contributing to local unemployment reduction. These enterprises are vital for the mountain economy, having a direct impact on employment.
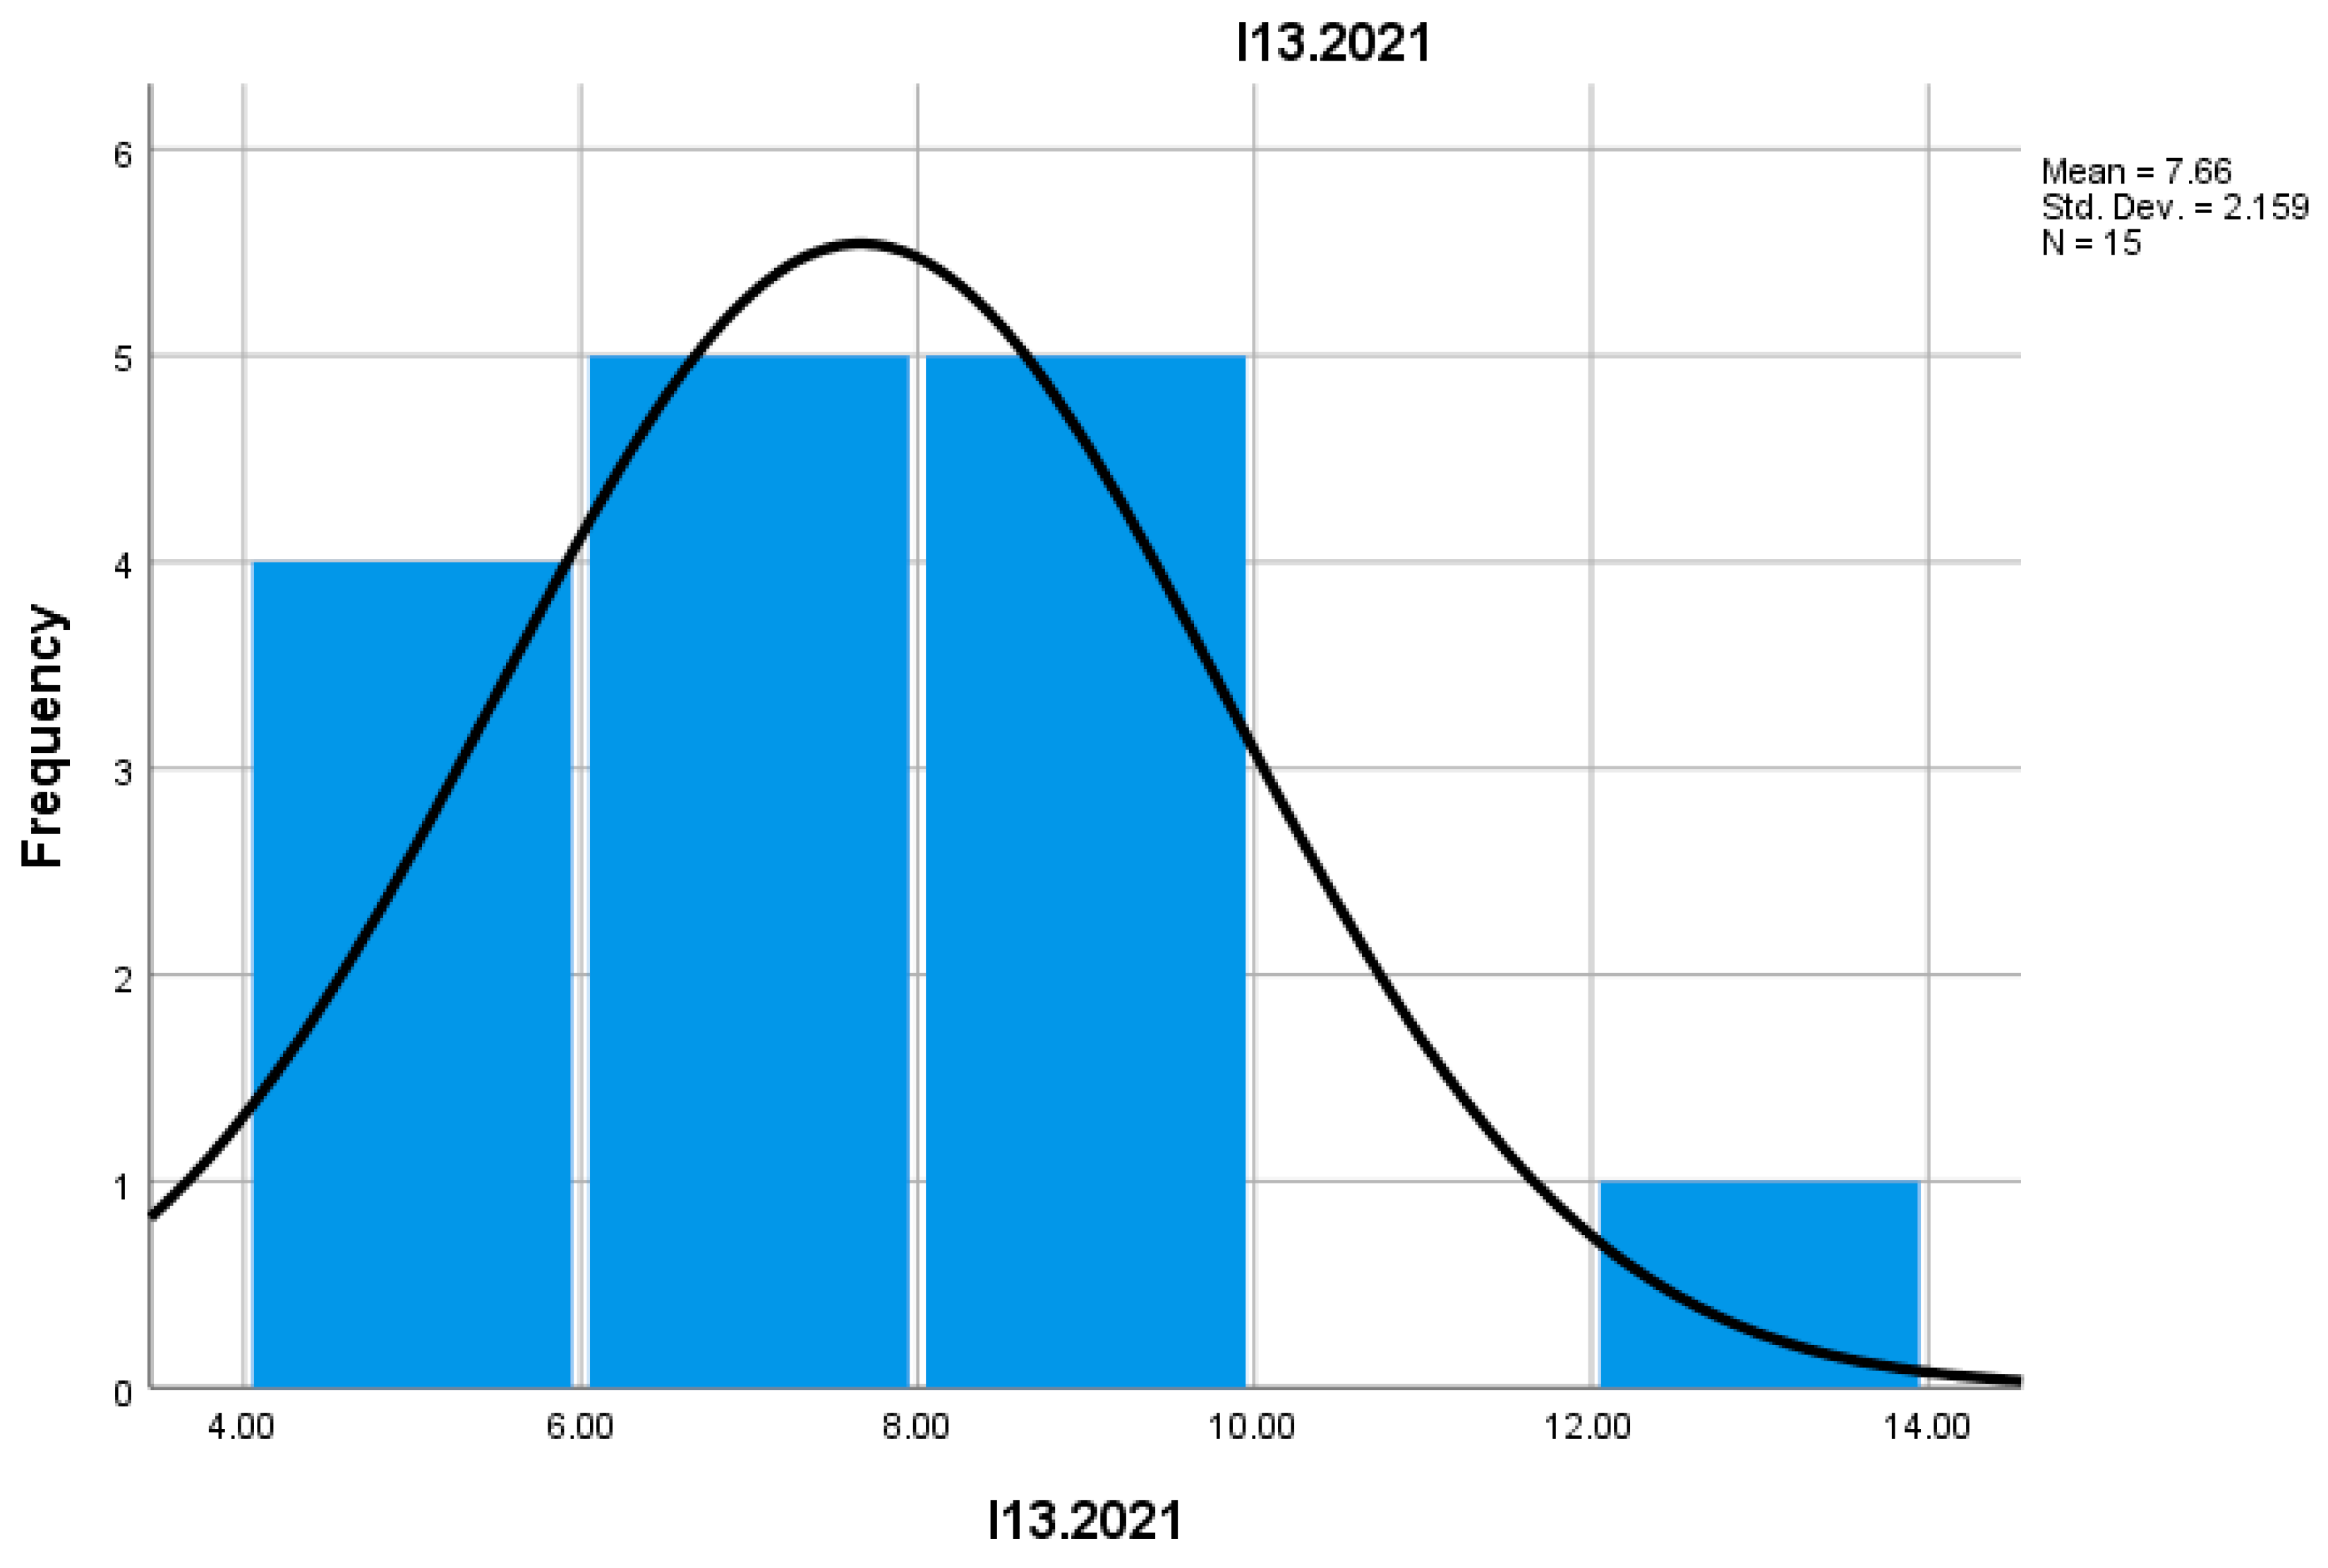
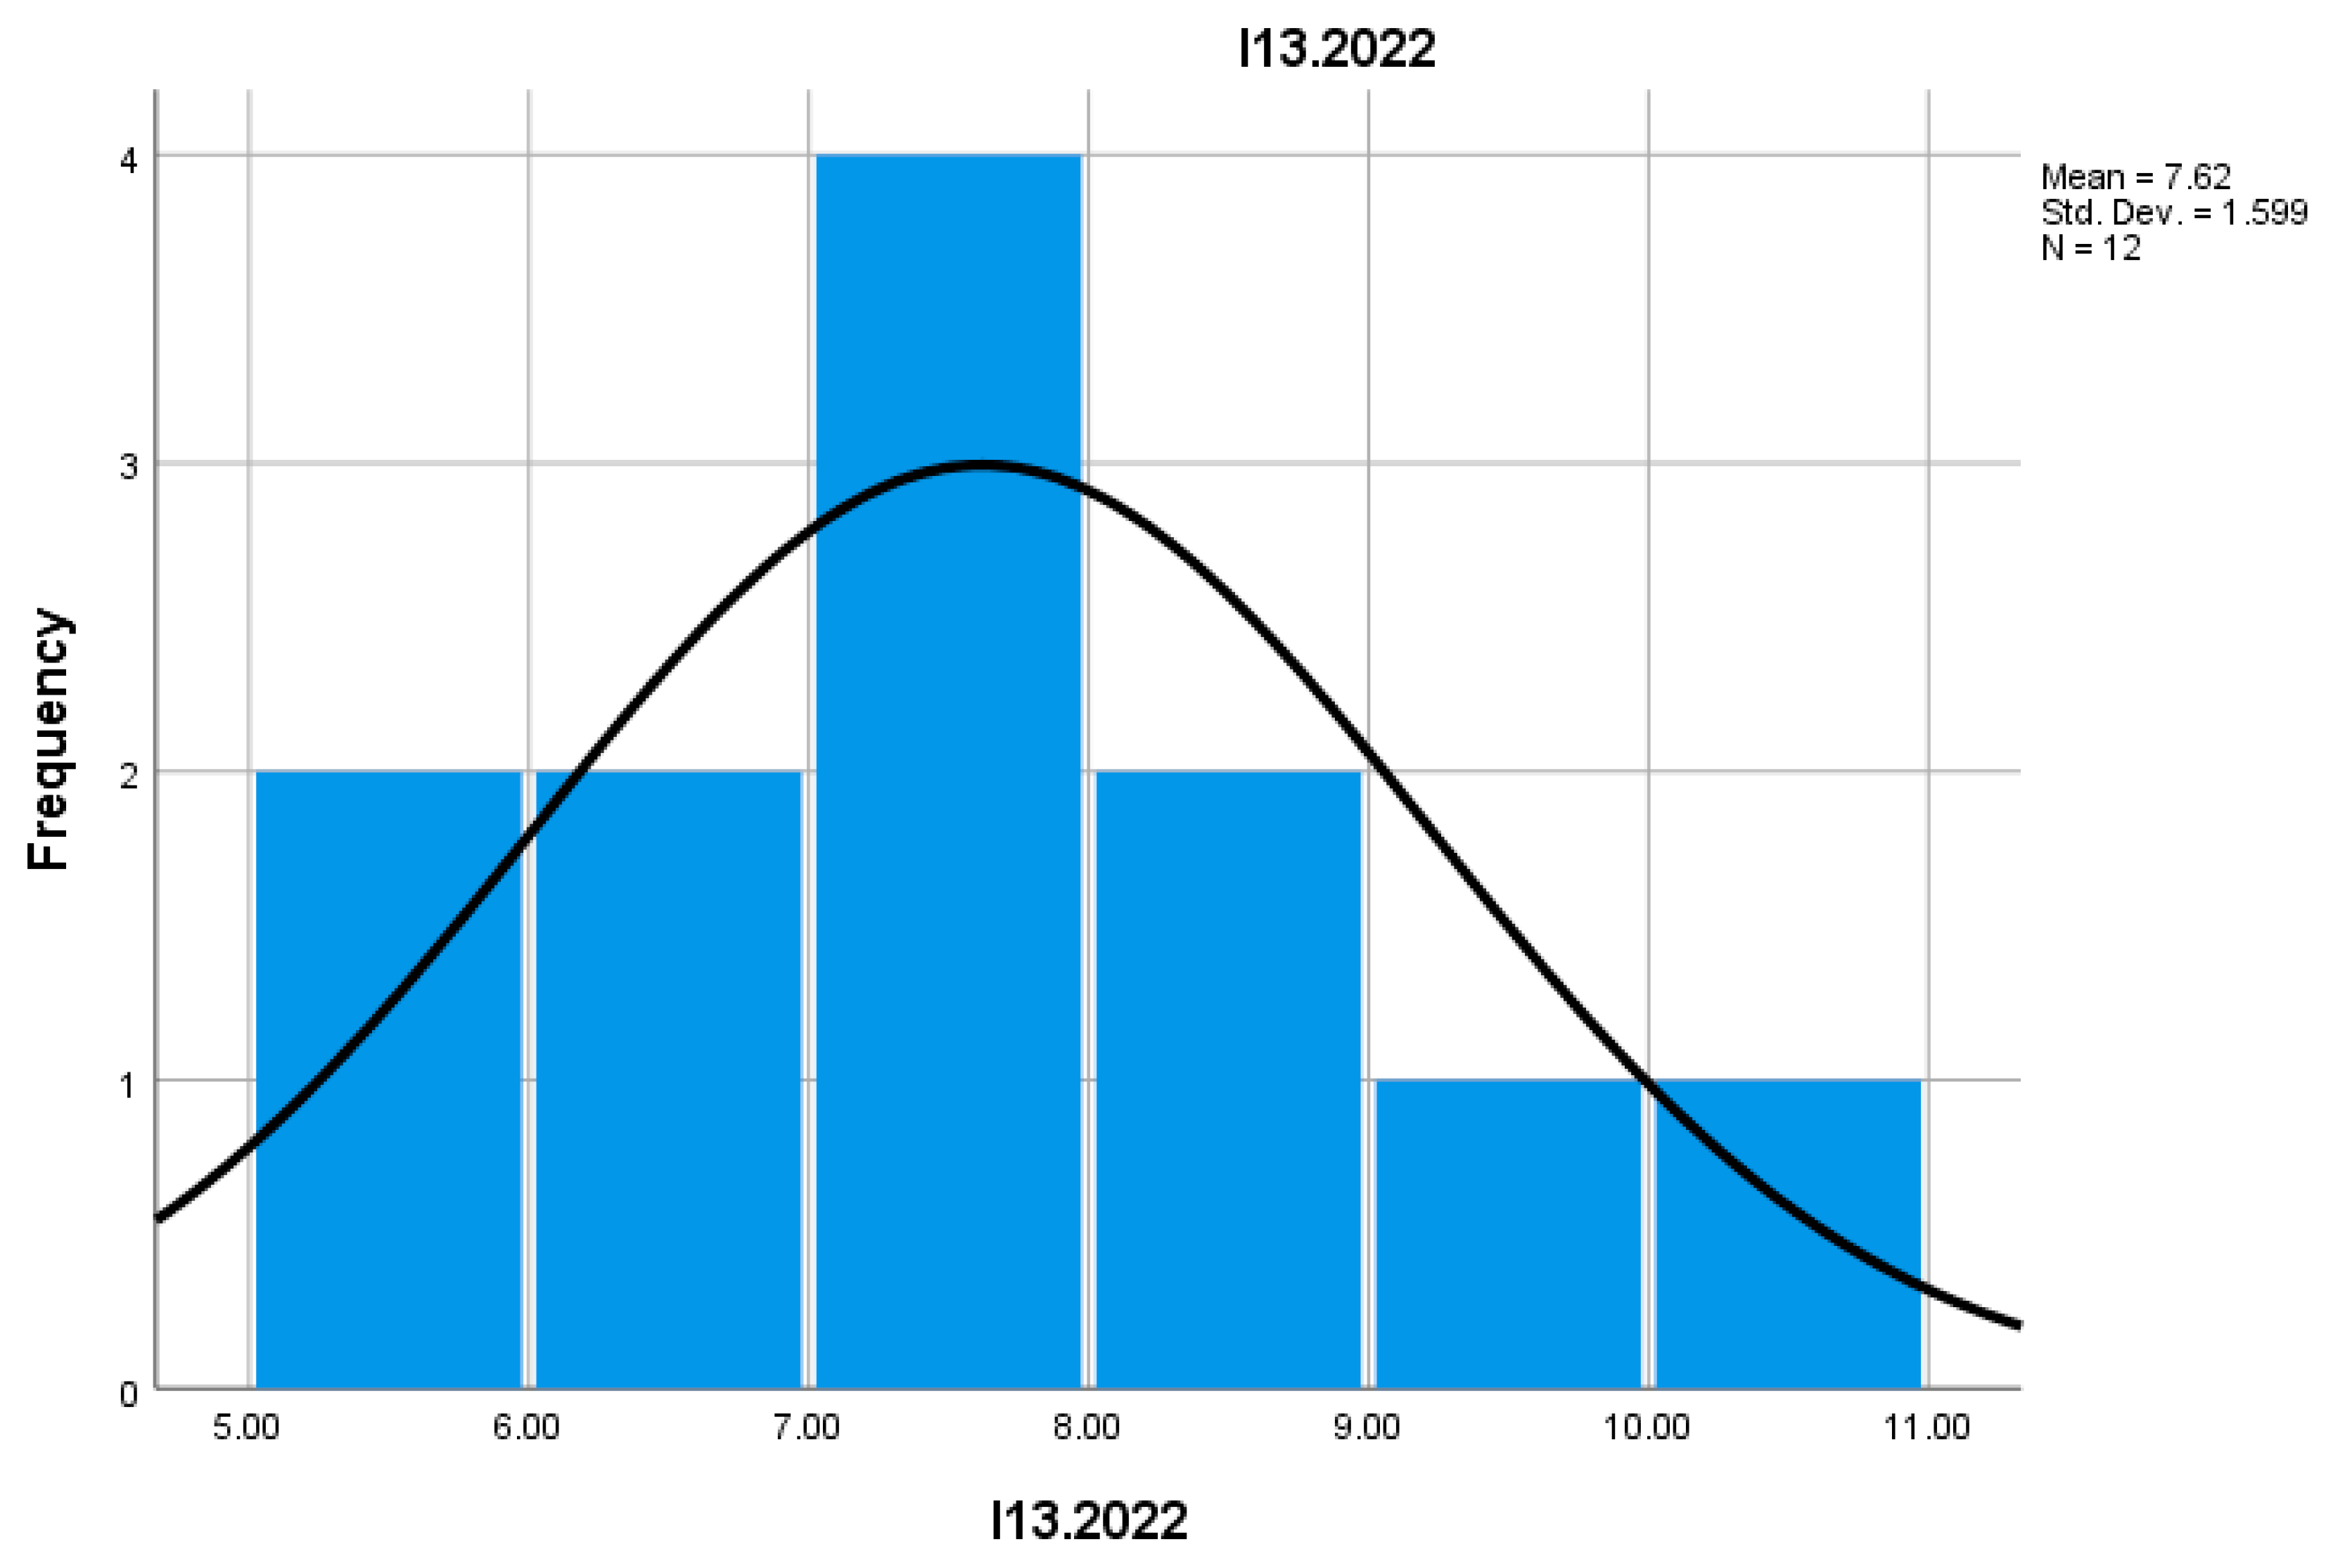
Indicator I13 analyzes the number of enterprises with low growth in revenues or employees. In 2022, the number of these businesses decreased compared to 2021, suggesting stagnation or low performance in certain economic sectors of mountain commerce. This decline could be associated with a lack of innovation or difficulties in attracting new customers.
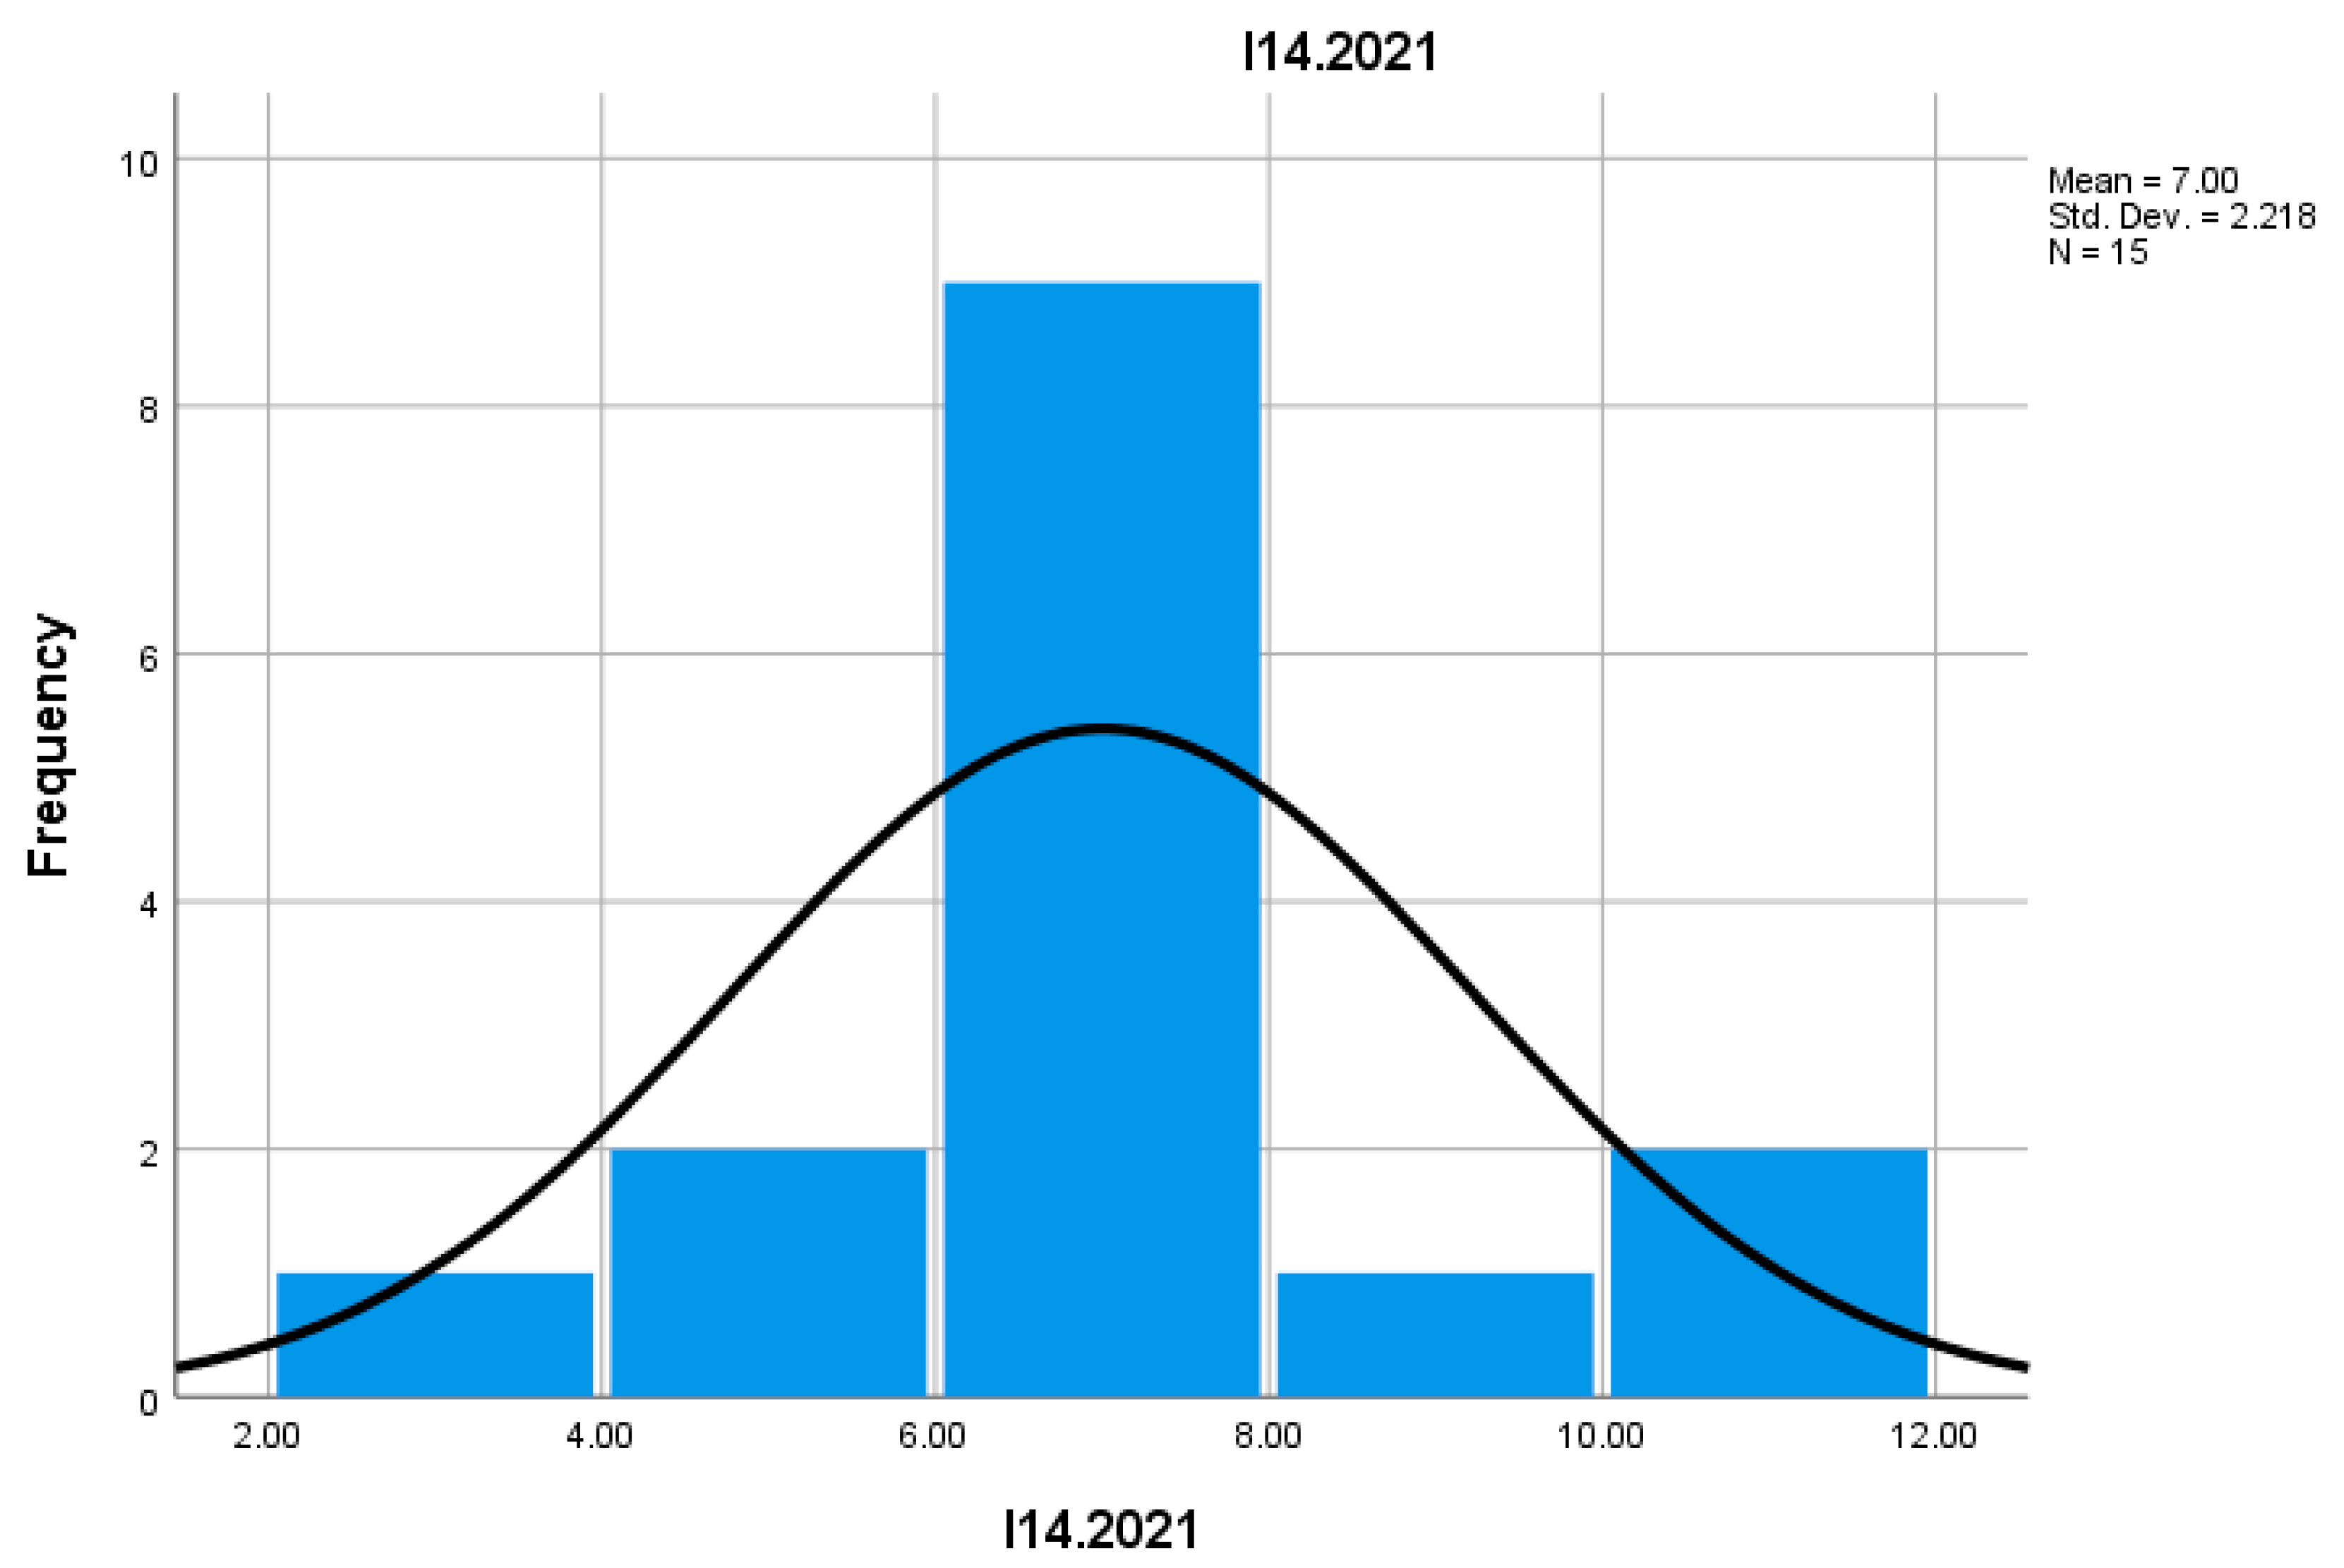
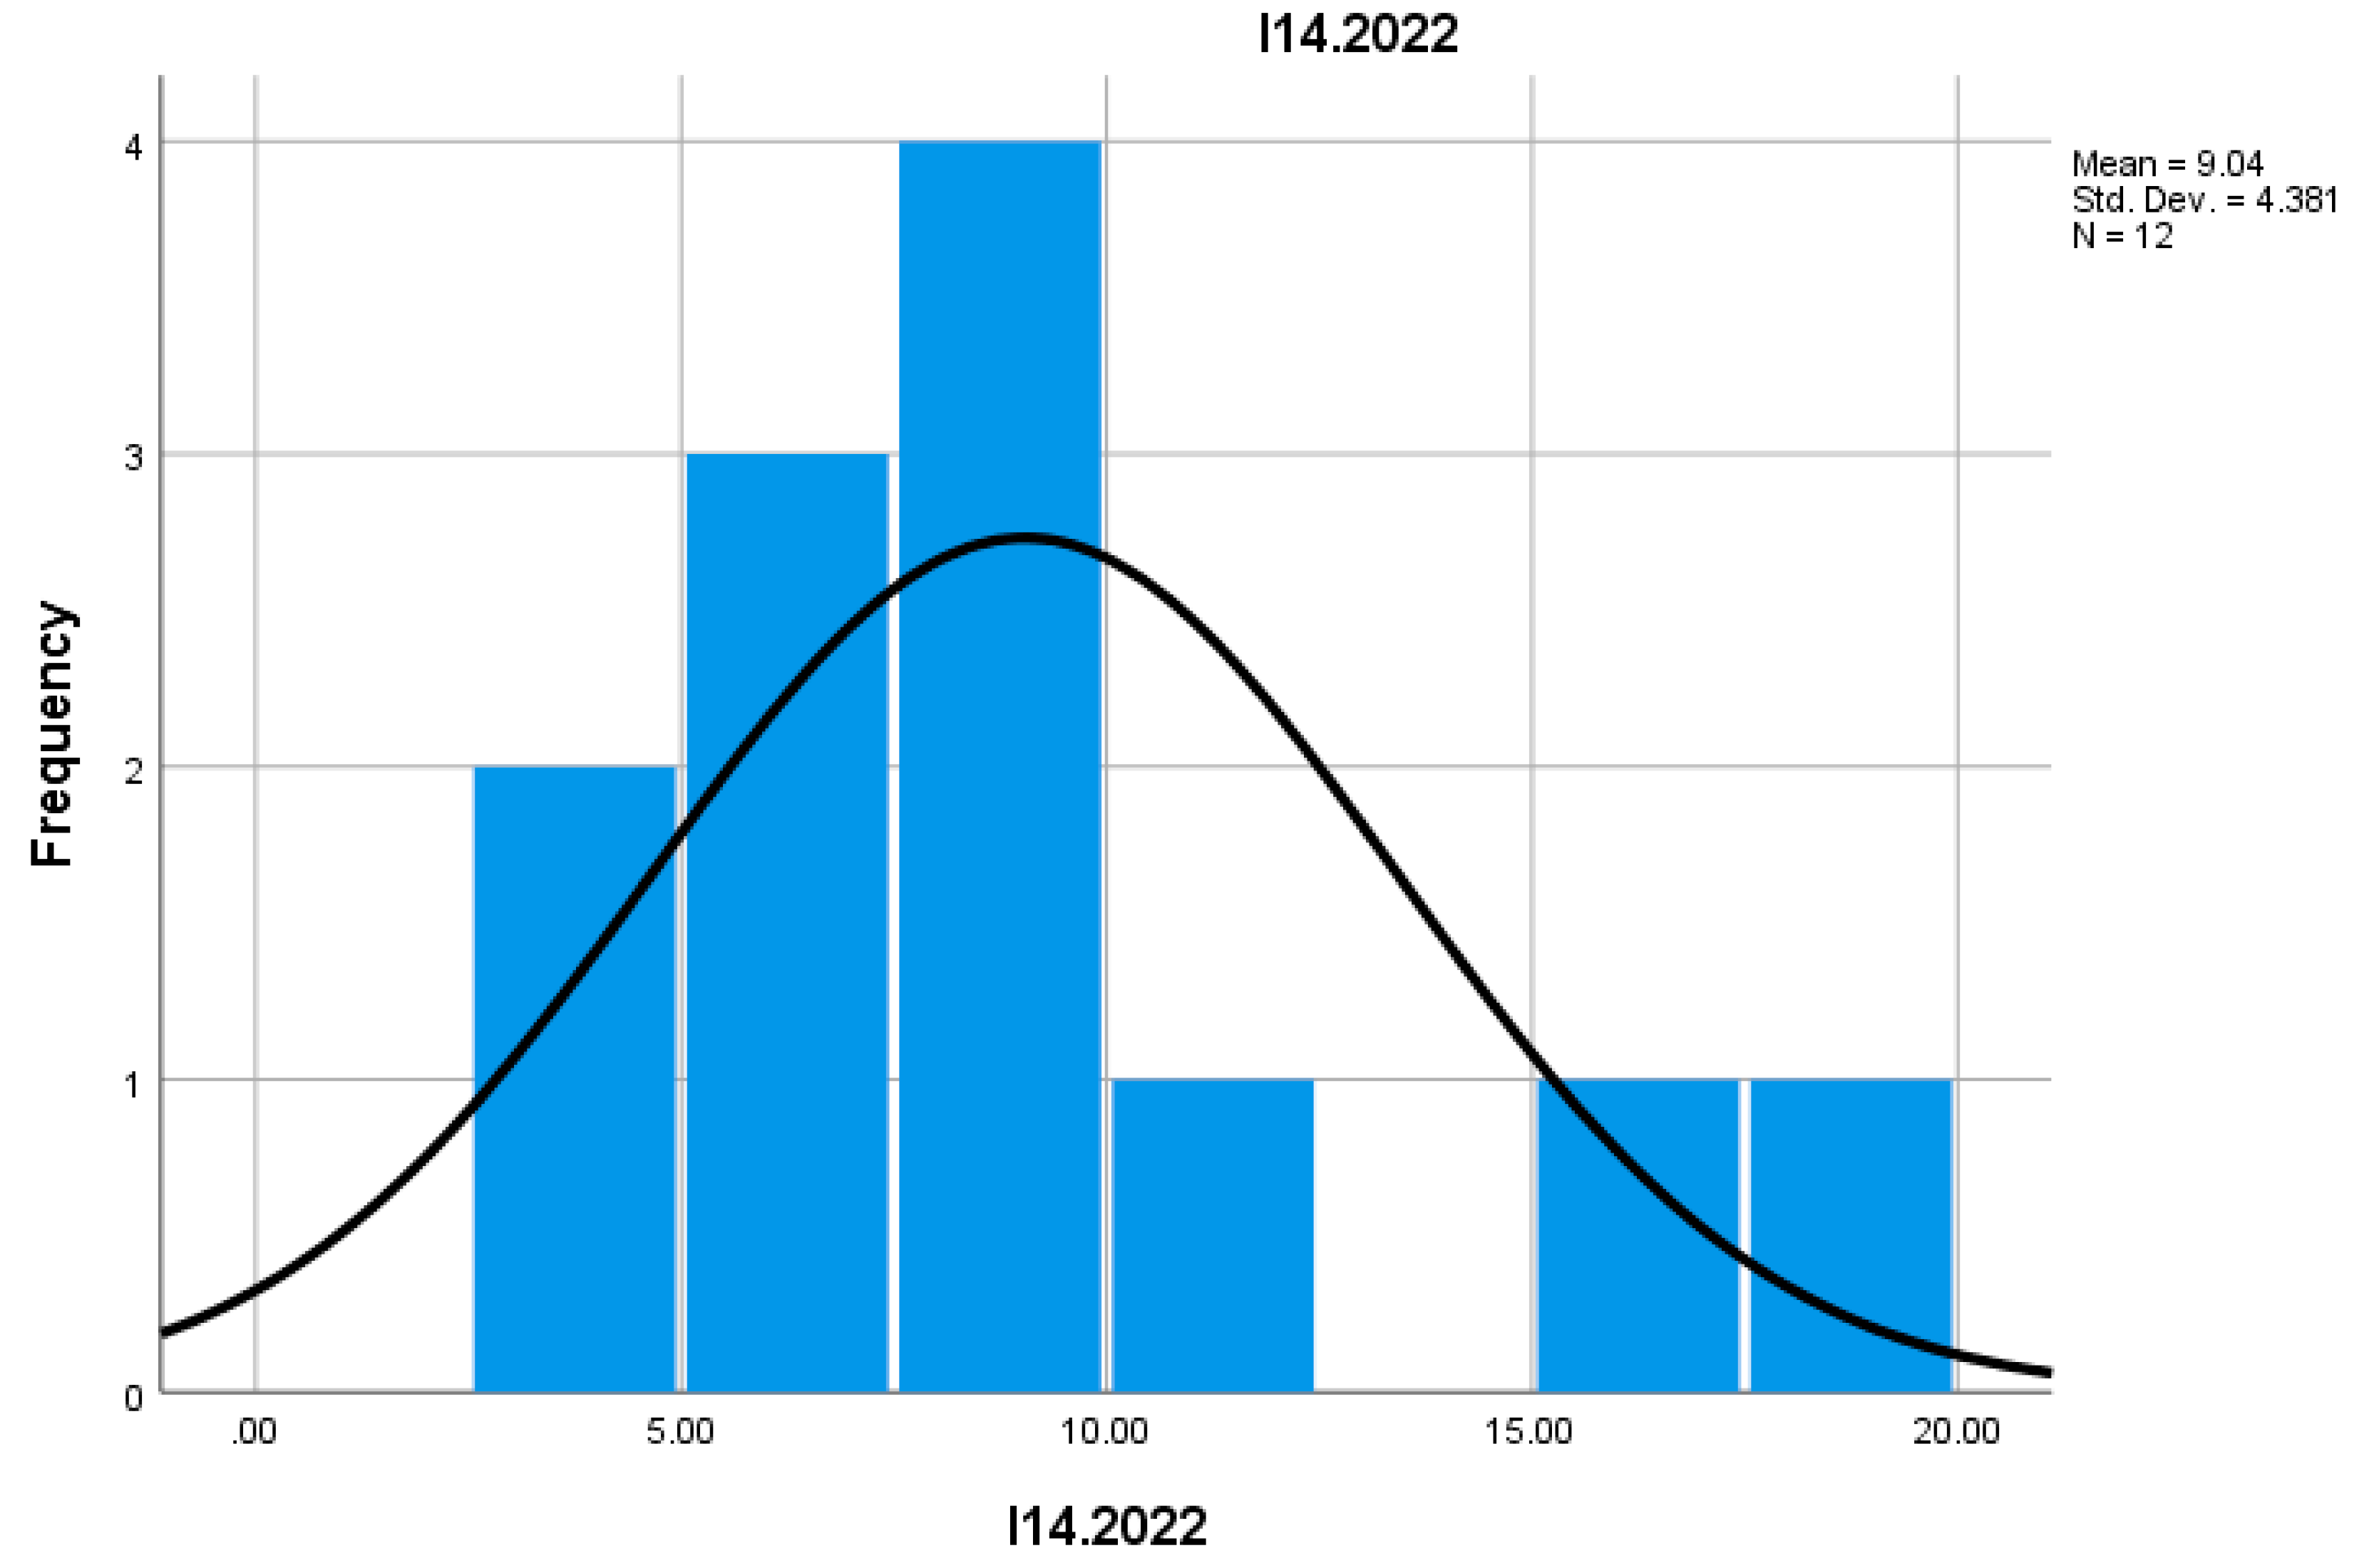
Indicator I14 reflects the proportion of enterprises with low growth in total active enterprises. In 2022, this proportion decreased compared to 2021, indicating an overall improvement in the sector's dynamism. Enterprises that did not experience growth may be replaced by newer businesses more capable of responding to market demands.
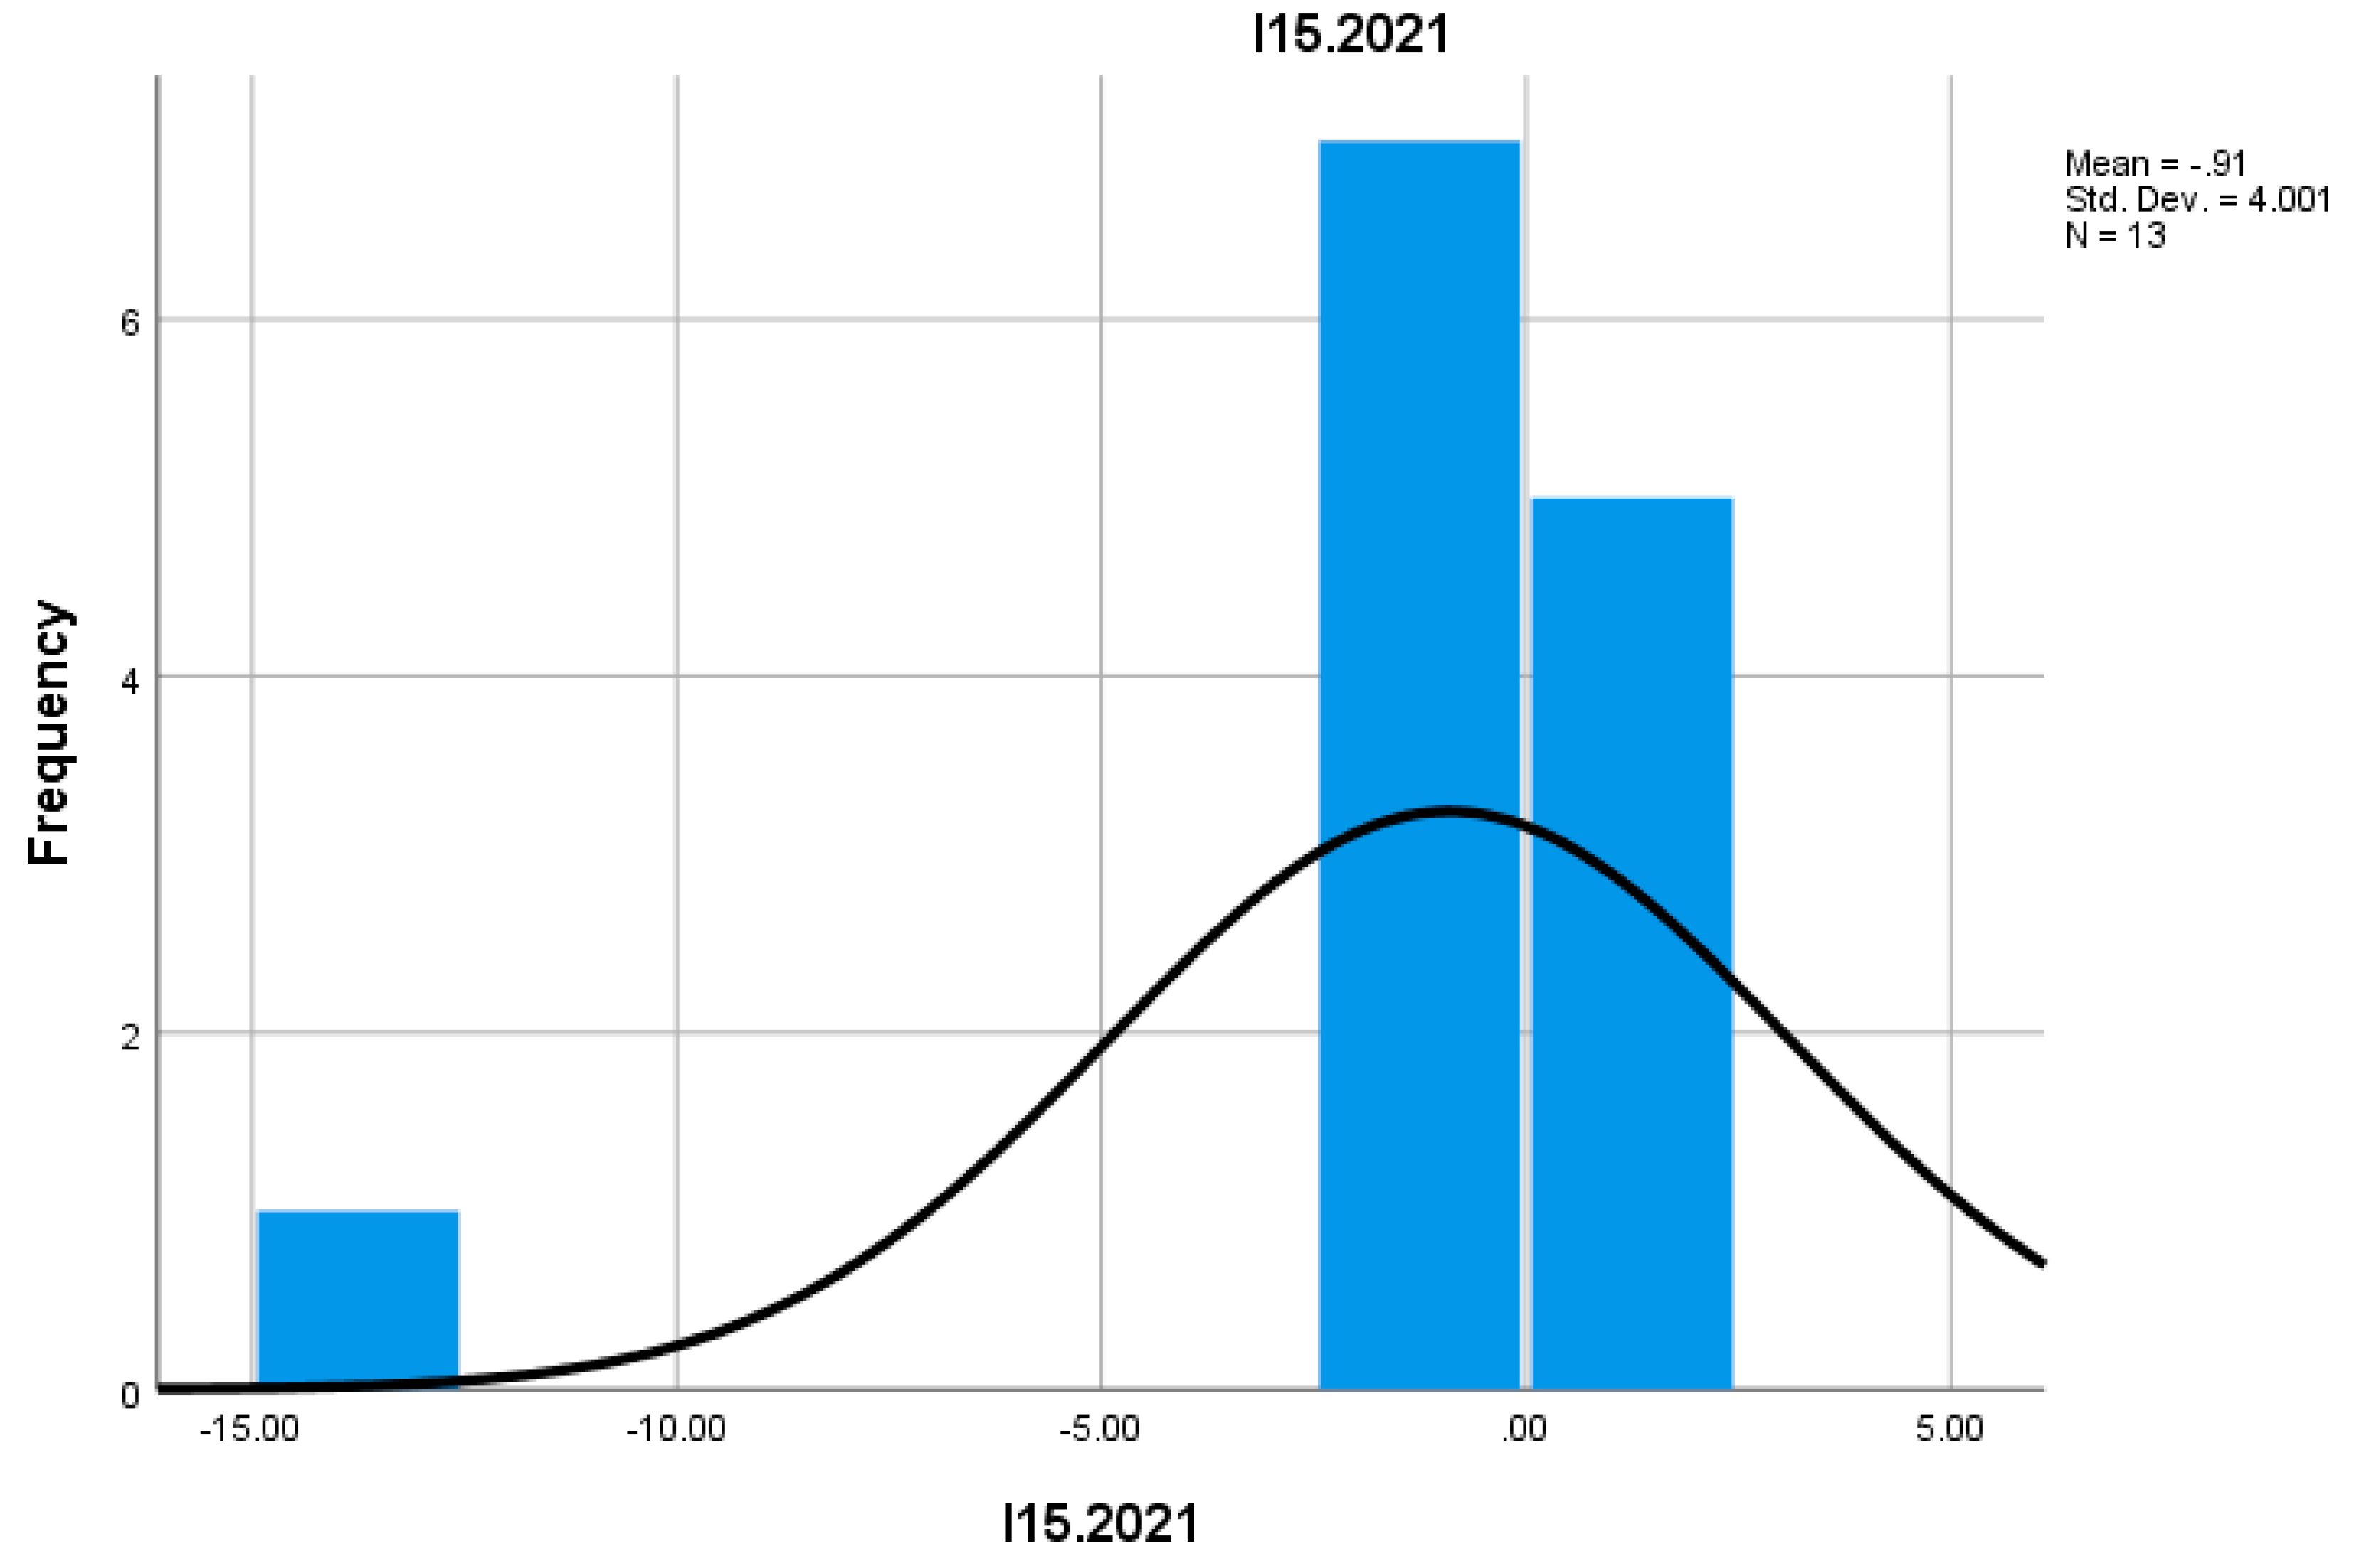
Indicator I15 measures the number of employees in enterprises with low growth. In 2022, this number decreased compared to 2021, suggesting economic stagnation in certain sectors and a reduction in jobs within these businesses. This could be a consequence of decreased demand or operational inefficiencies.
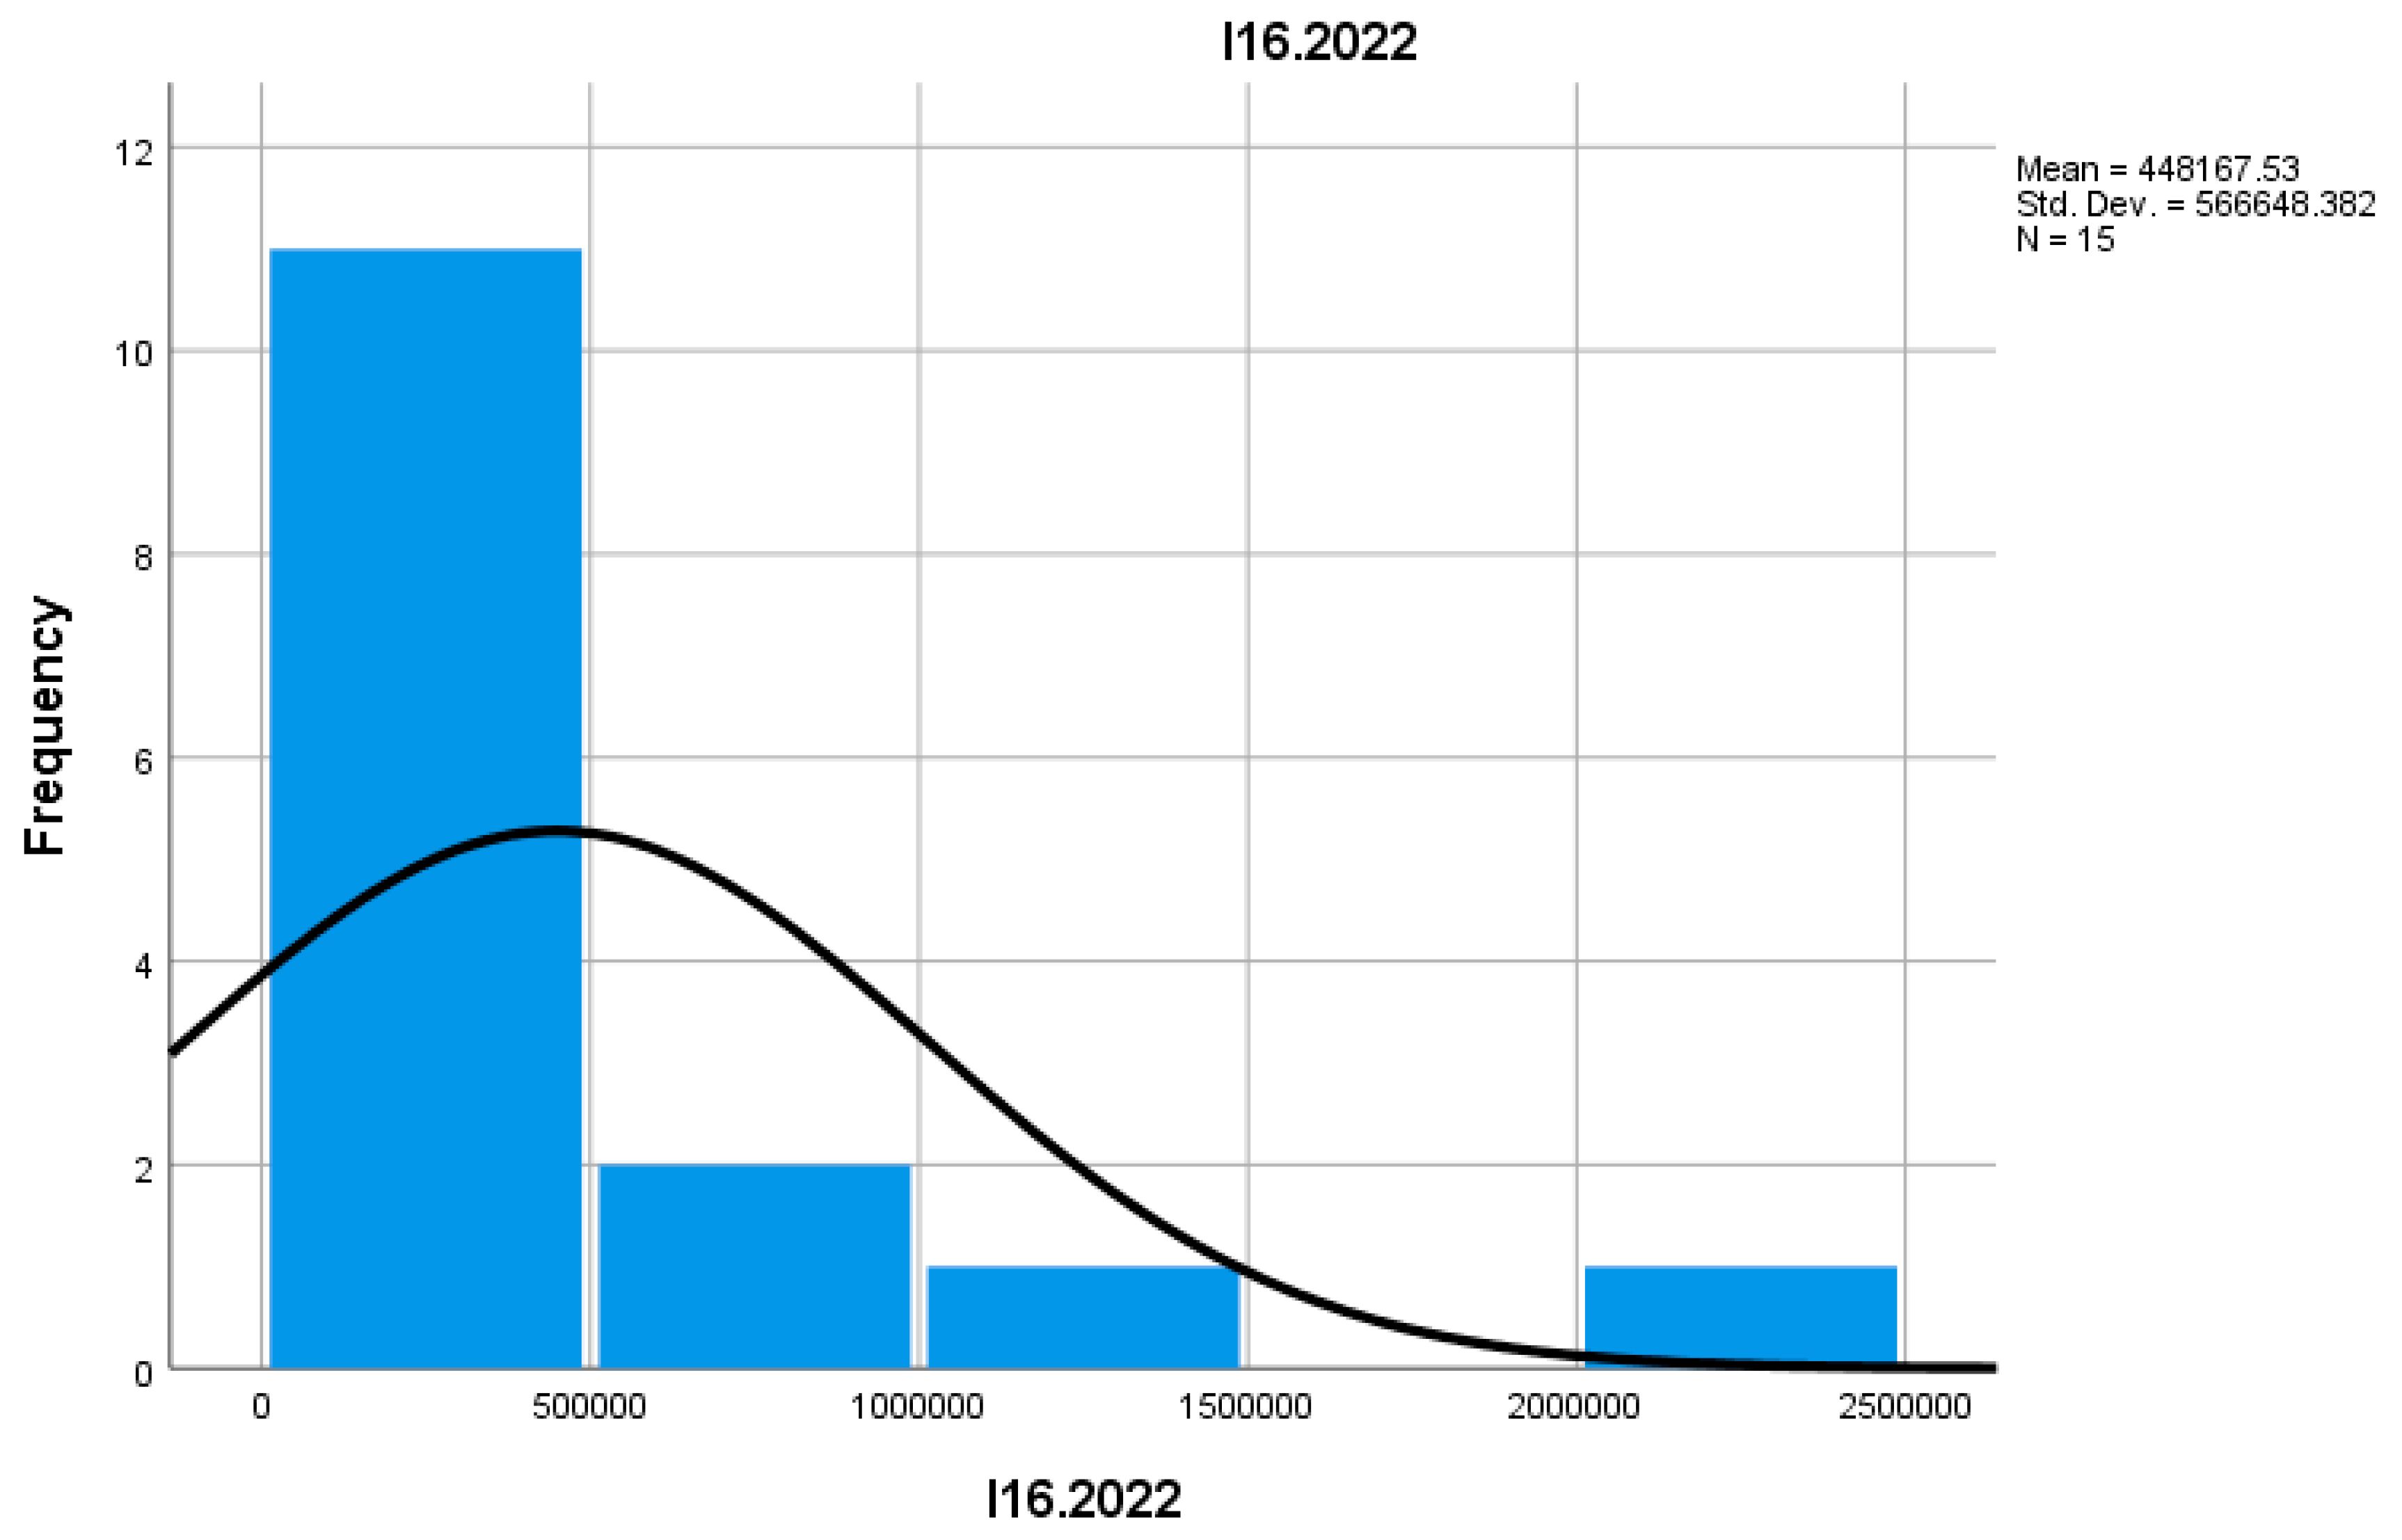
Indicator I16 reflects the number of enterprises that did not record any growth in revenues or employees. In 2022, this number was smaller compared to 2021, suggesting an improvement in the economic performance of mountain enterprises. These businesses are often the most vulnerable to market and economic changes.
Indicator I17 analyzes the proportion of enterprises with no growth in total active enterprises. In 2022, this proportion was lower compared to 2021, indicating greater dynamism in the mountain entrepreneurial sector. Their reduction suggests a more favorable economic climate and more opportunities for emerging enterprises.
Indicator I18 measures the total number of employees in enterprises that did not record growth. In 2022, this number decreased compared to 2021, reflecting a reduction in jobs in stagnant businesses. These businesses generally struggle to create new jobs, contributing less to the local economy.
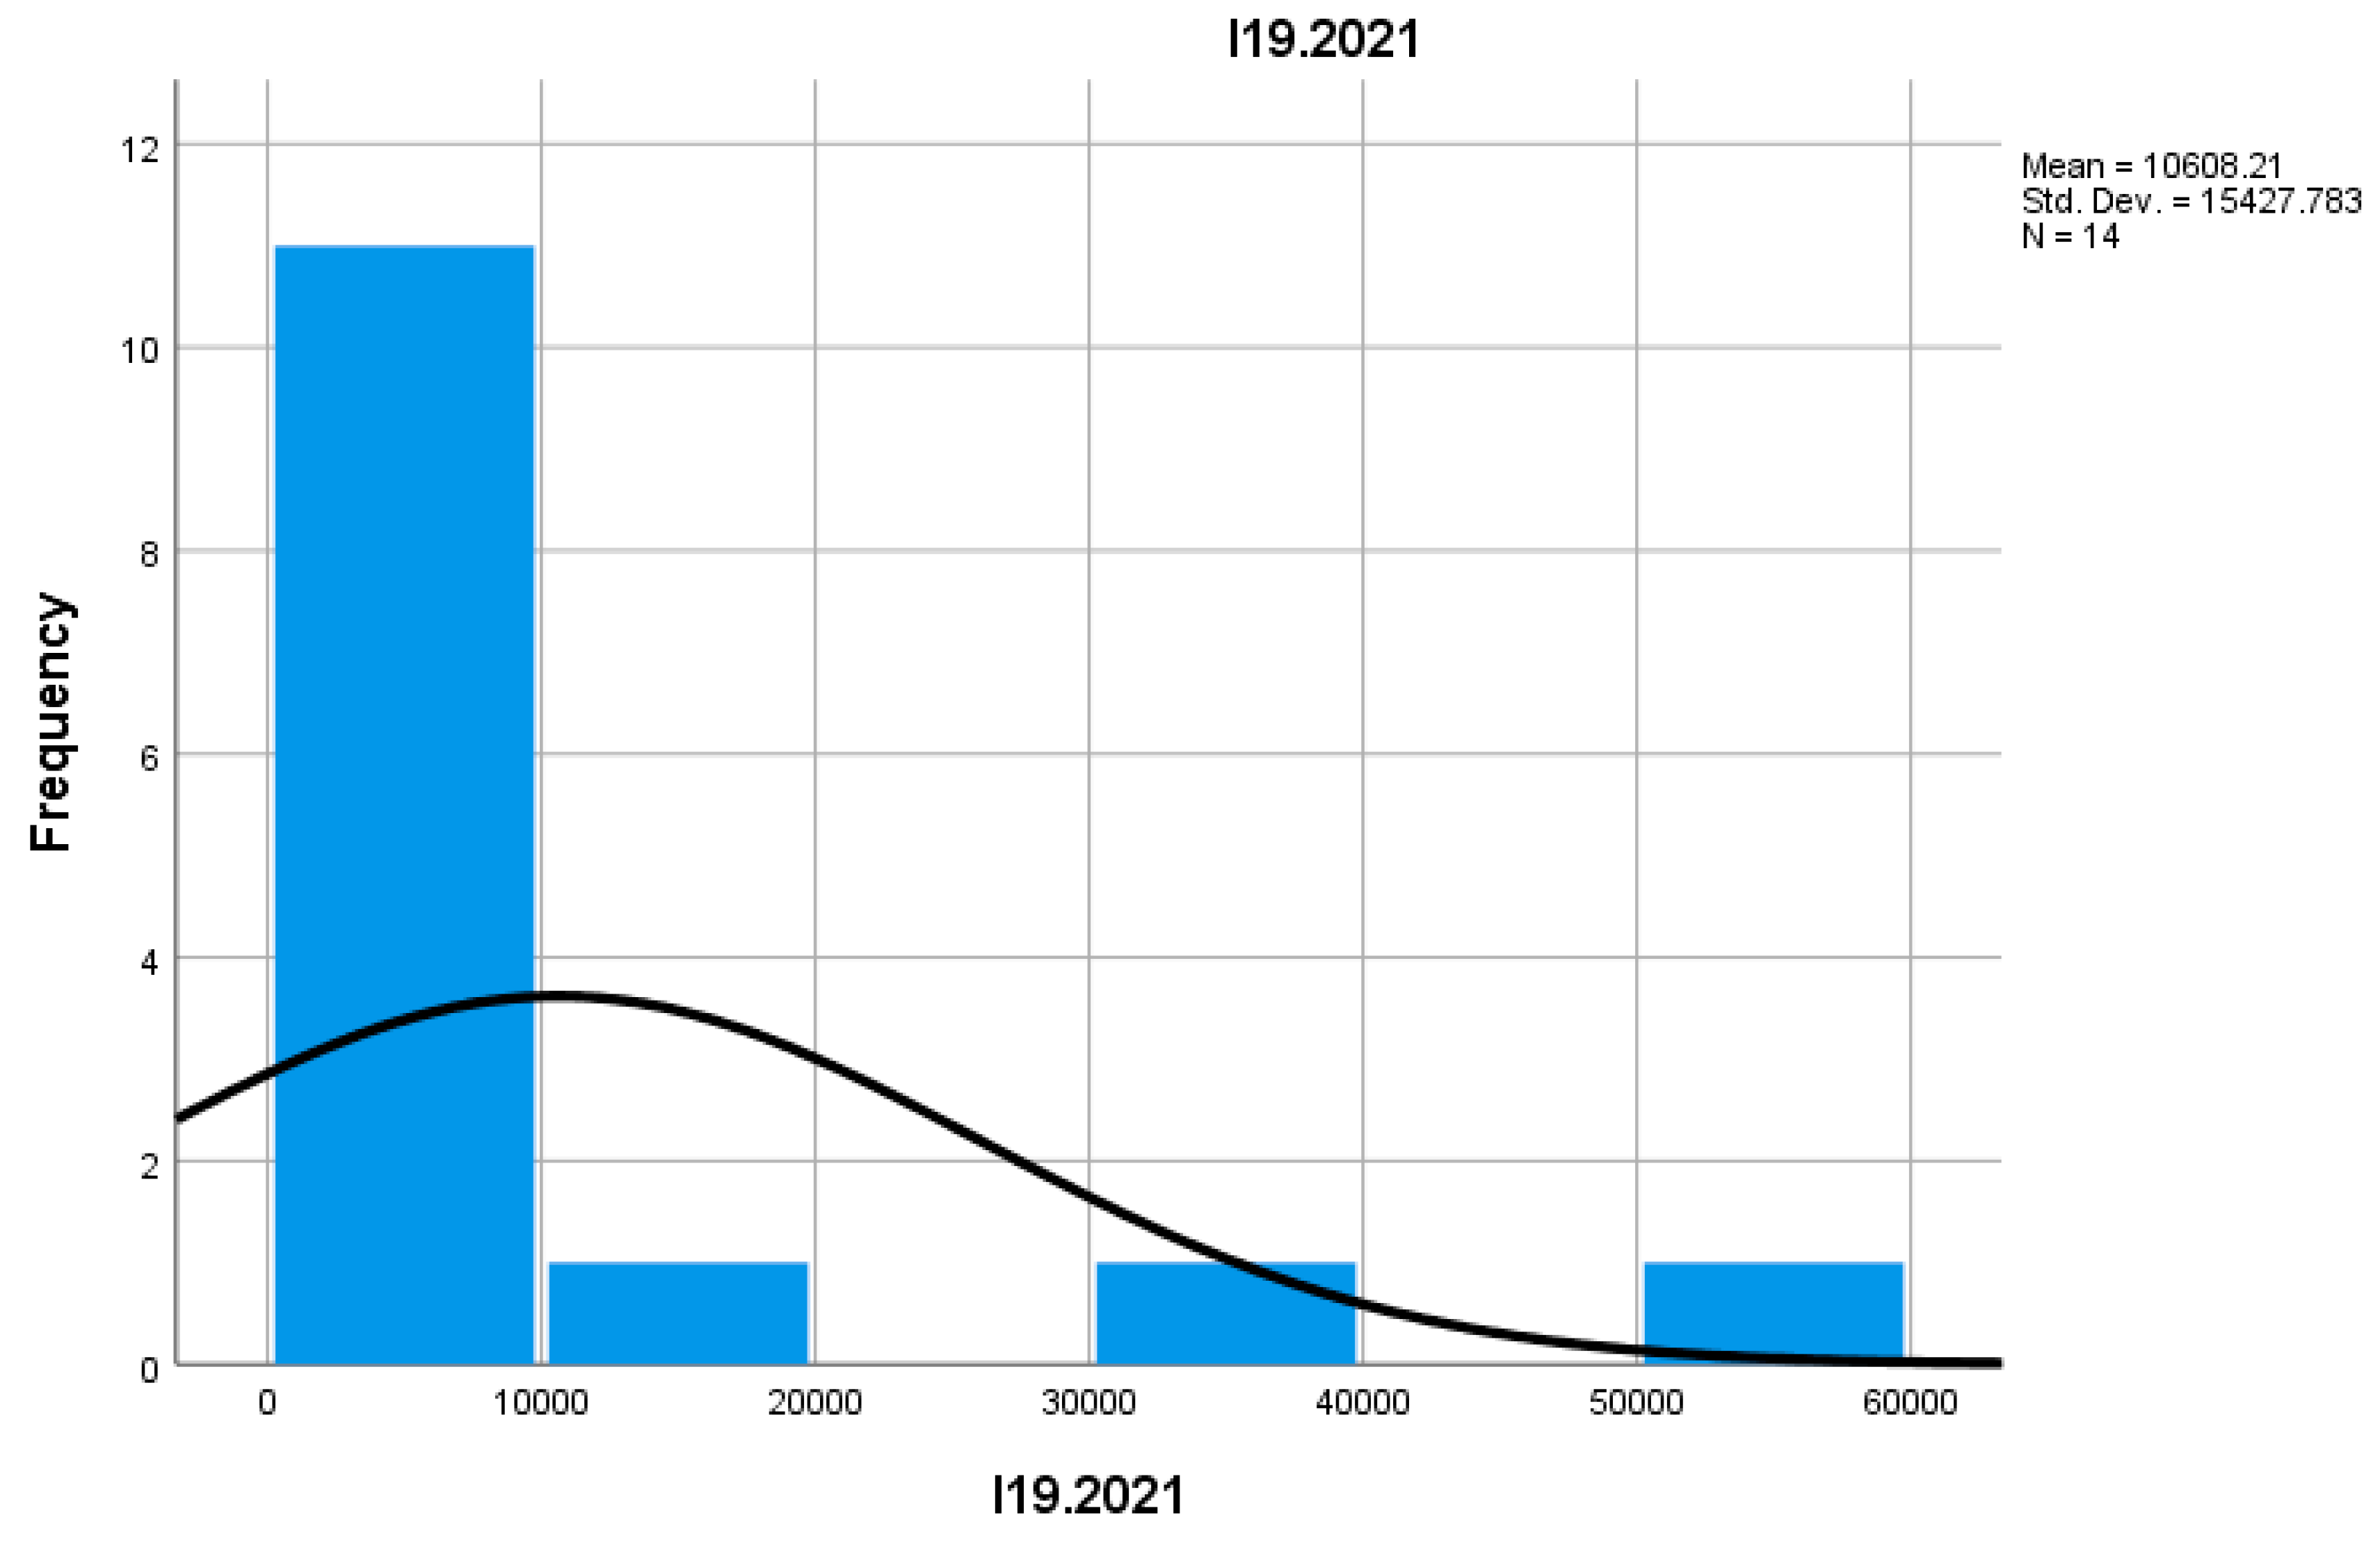
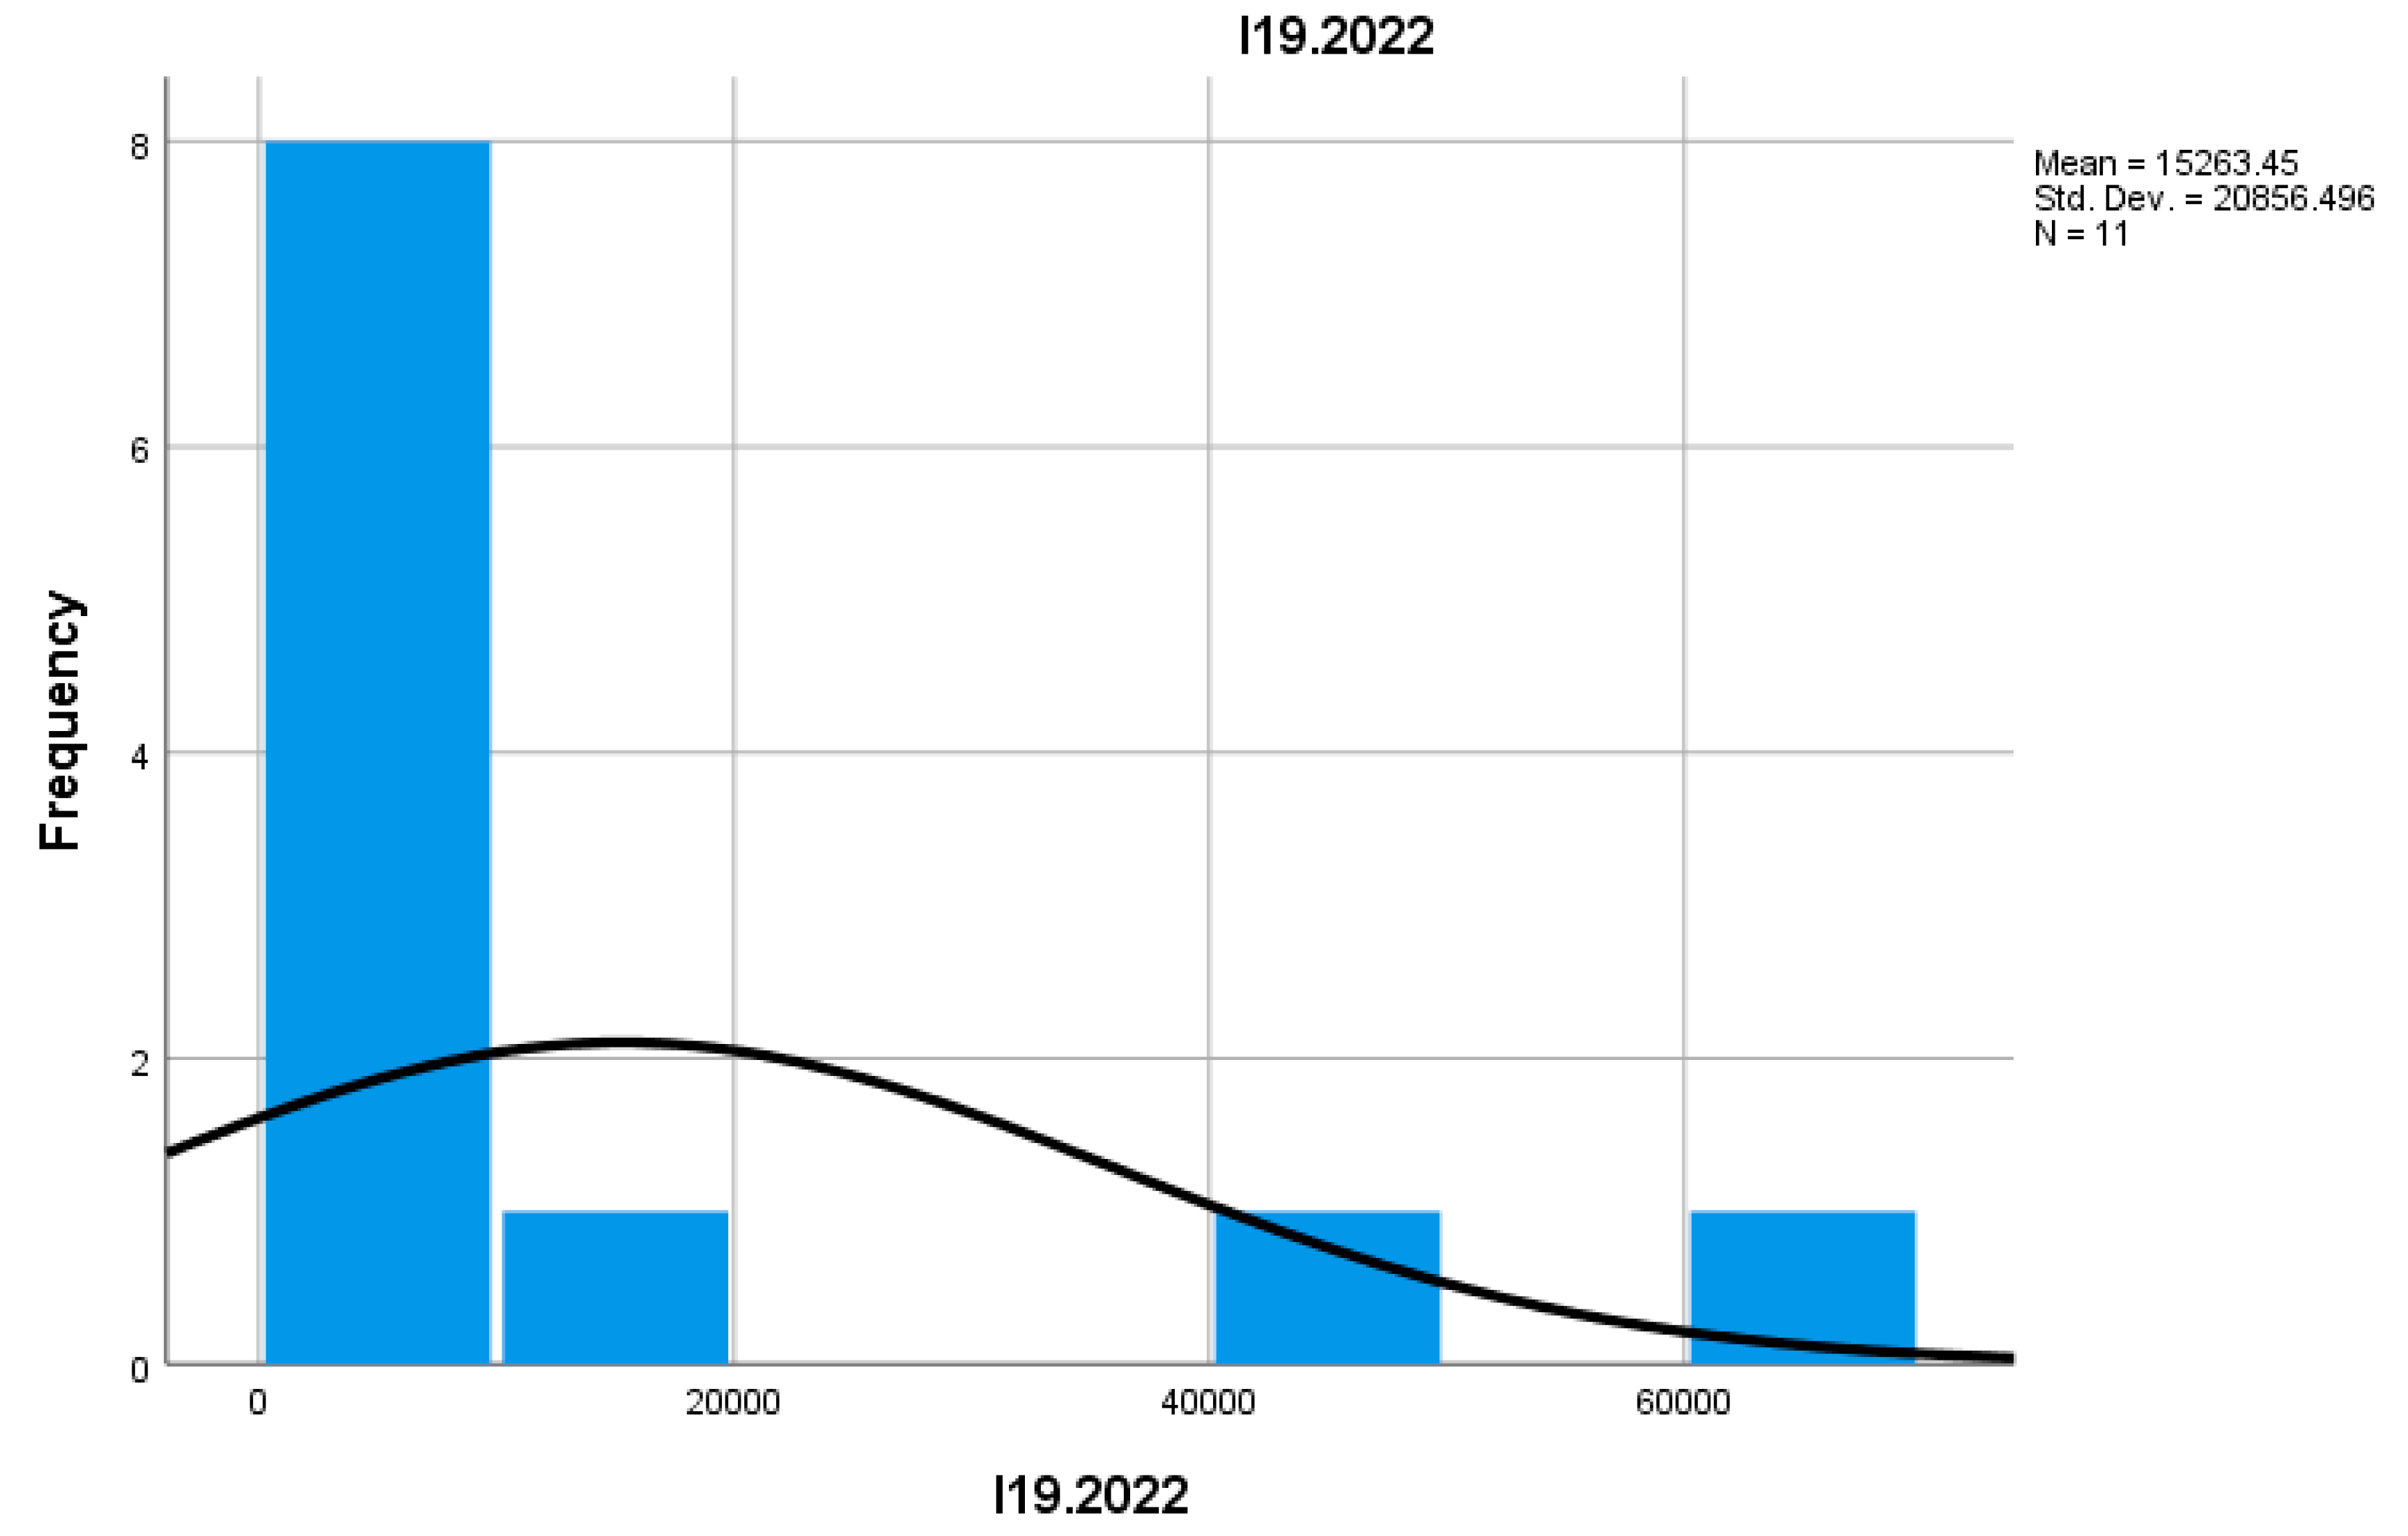
Indicator I19 analyzes the number of enterprises that recorded a decrease in turnover. In 2022, this number was higher compared to 2021, which may signal economic difficulties in some mountain commerce sectors. This decrease could be attributed to changes in consumer behavior or a decline in the number of tourists.
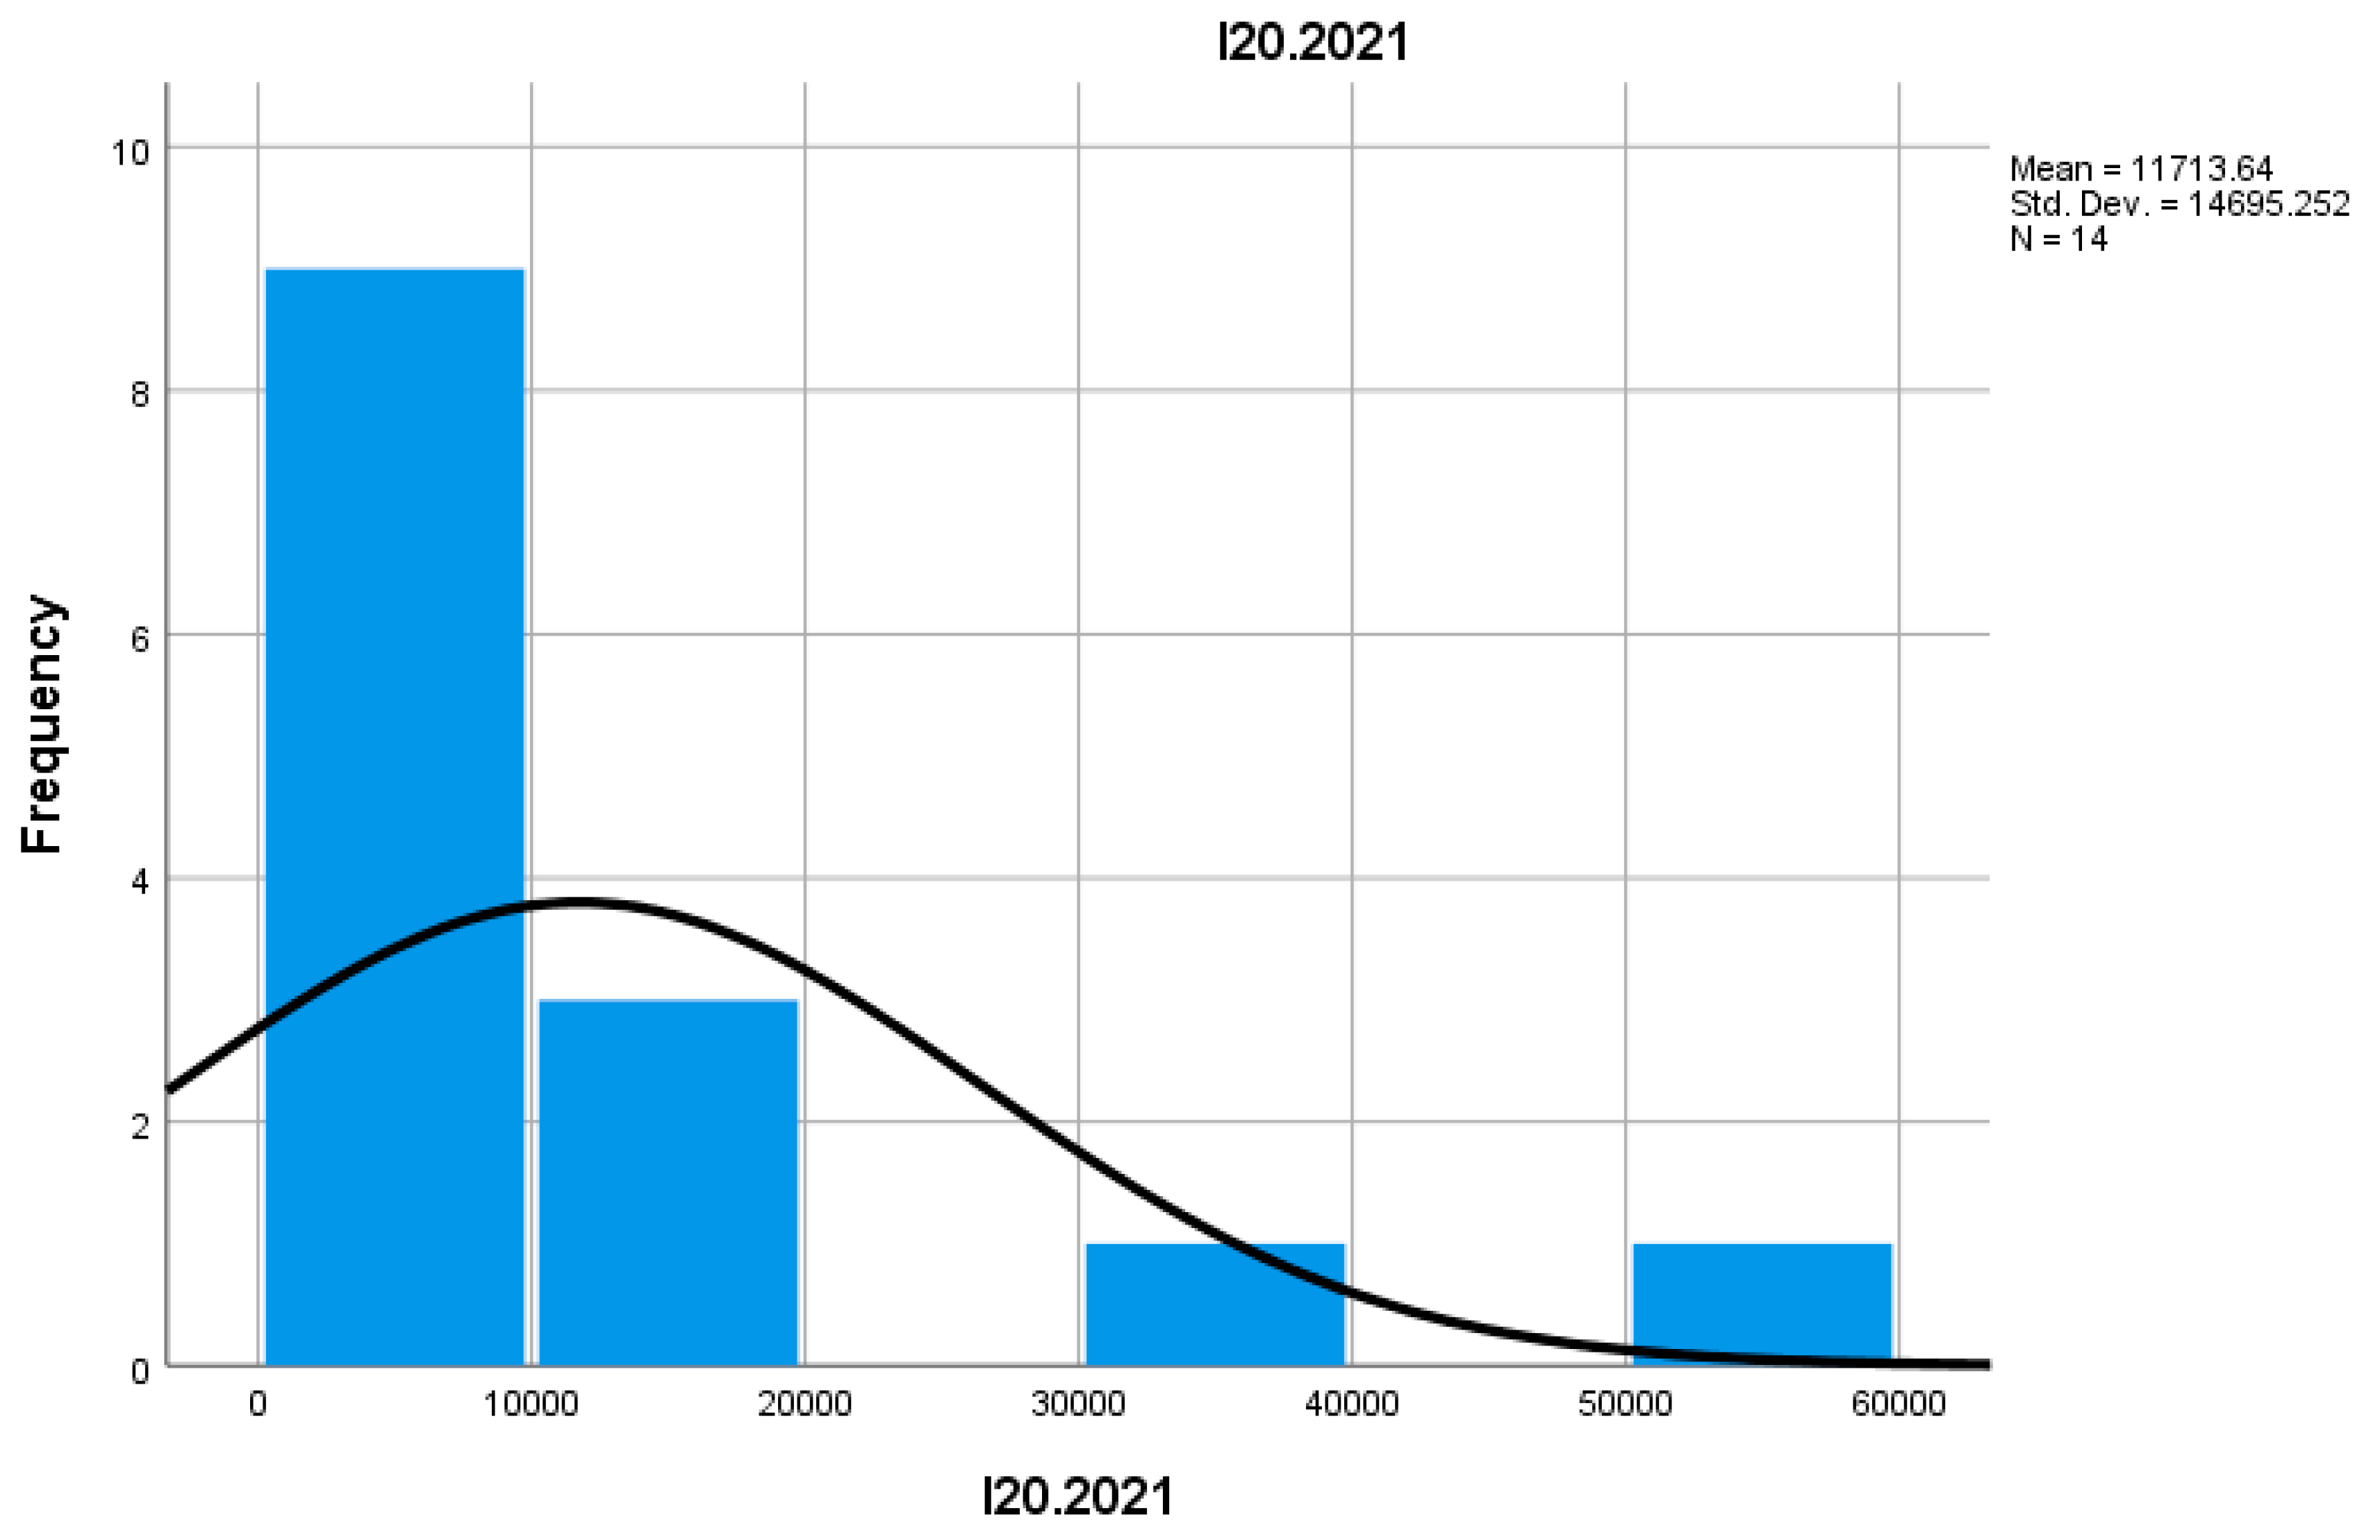
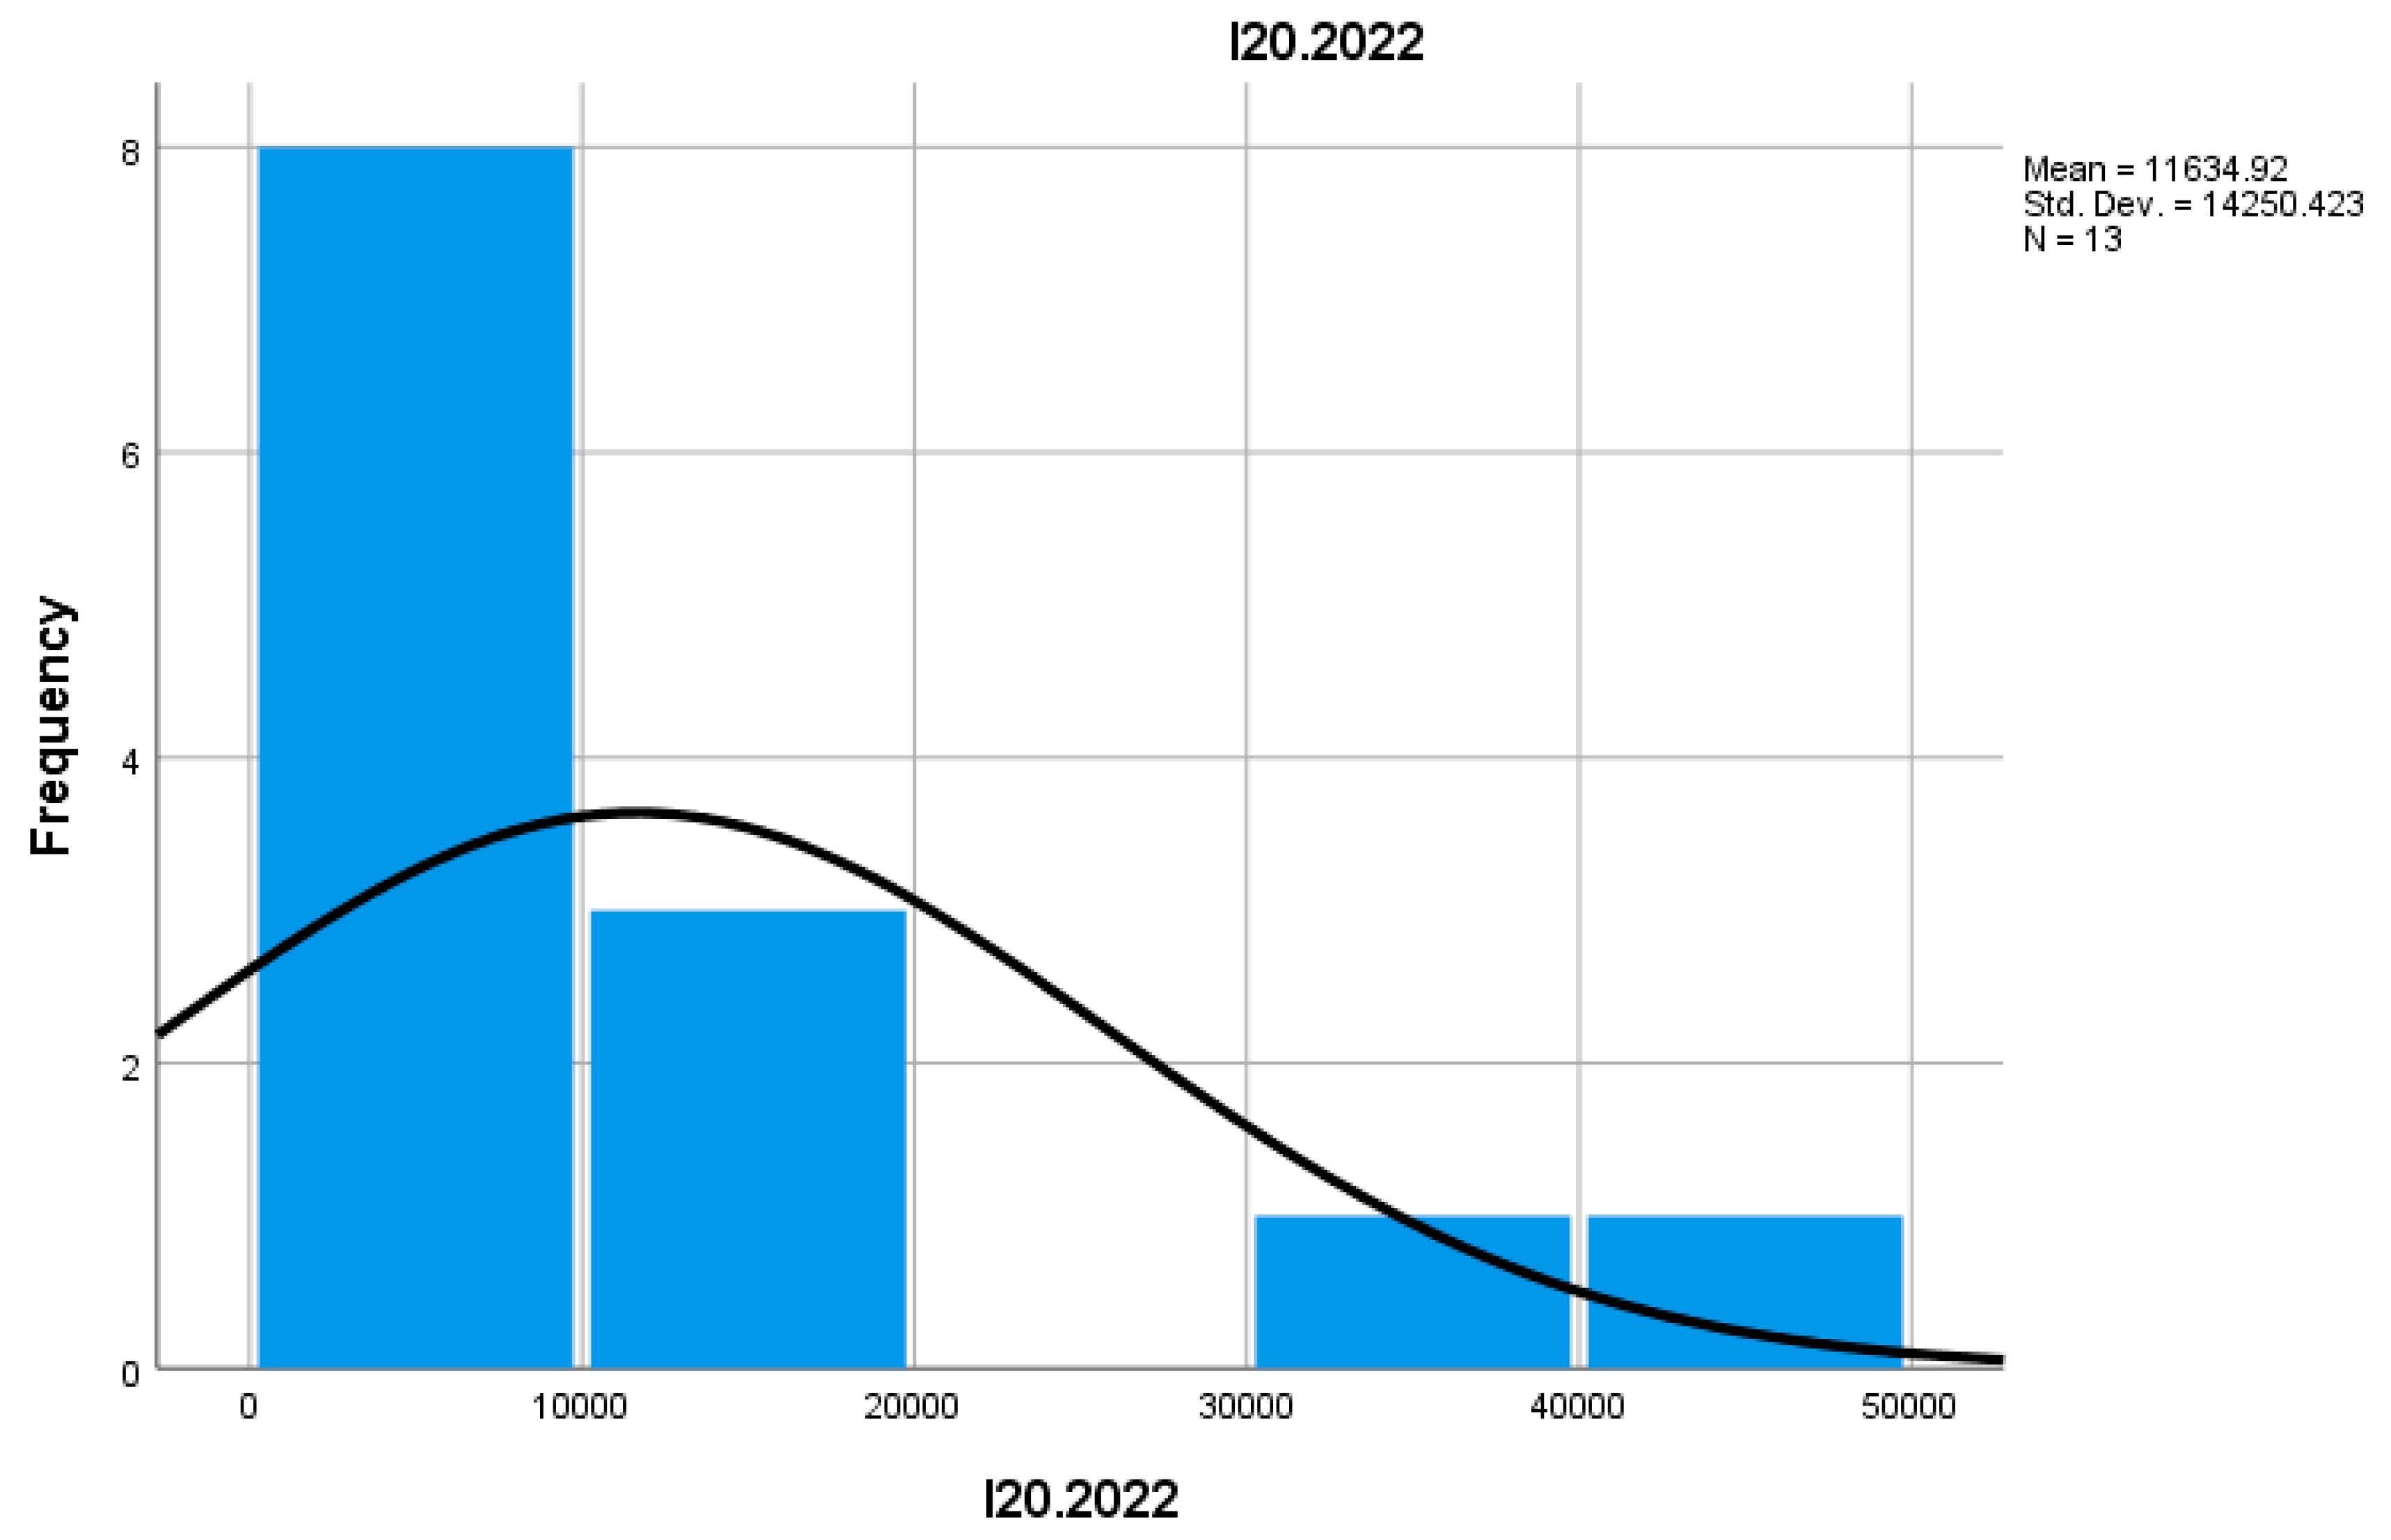
Indicator I20 reflects the proportion of enterprises with decreased turnover in total active enterprises. In 2022, this proportion increased compared to 2021, indicating a negative trend in certain economic areas, especially in more isolated mountain areas or for businesses that did not adapt quickly to market changes.
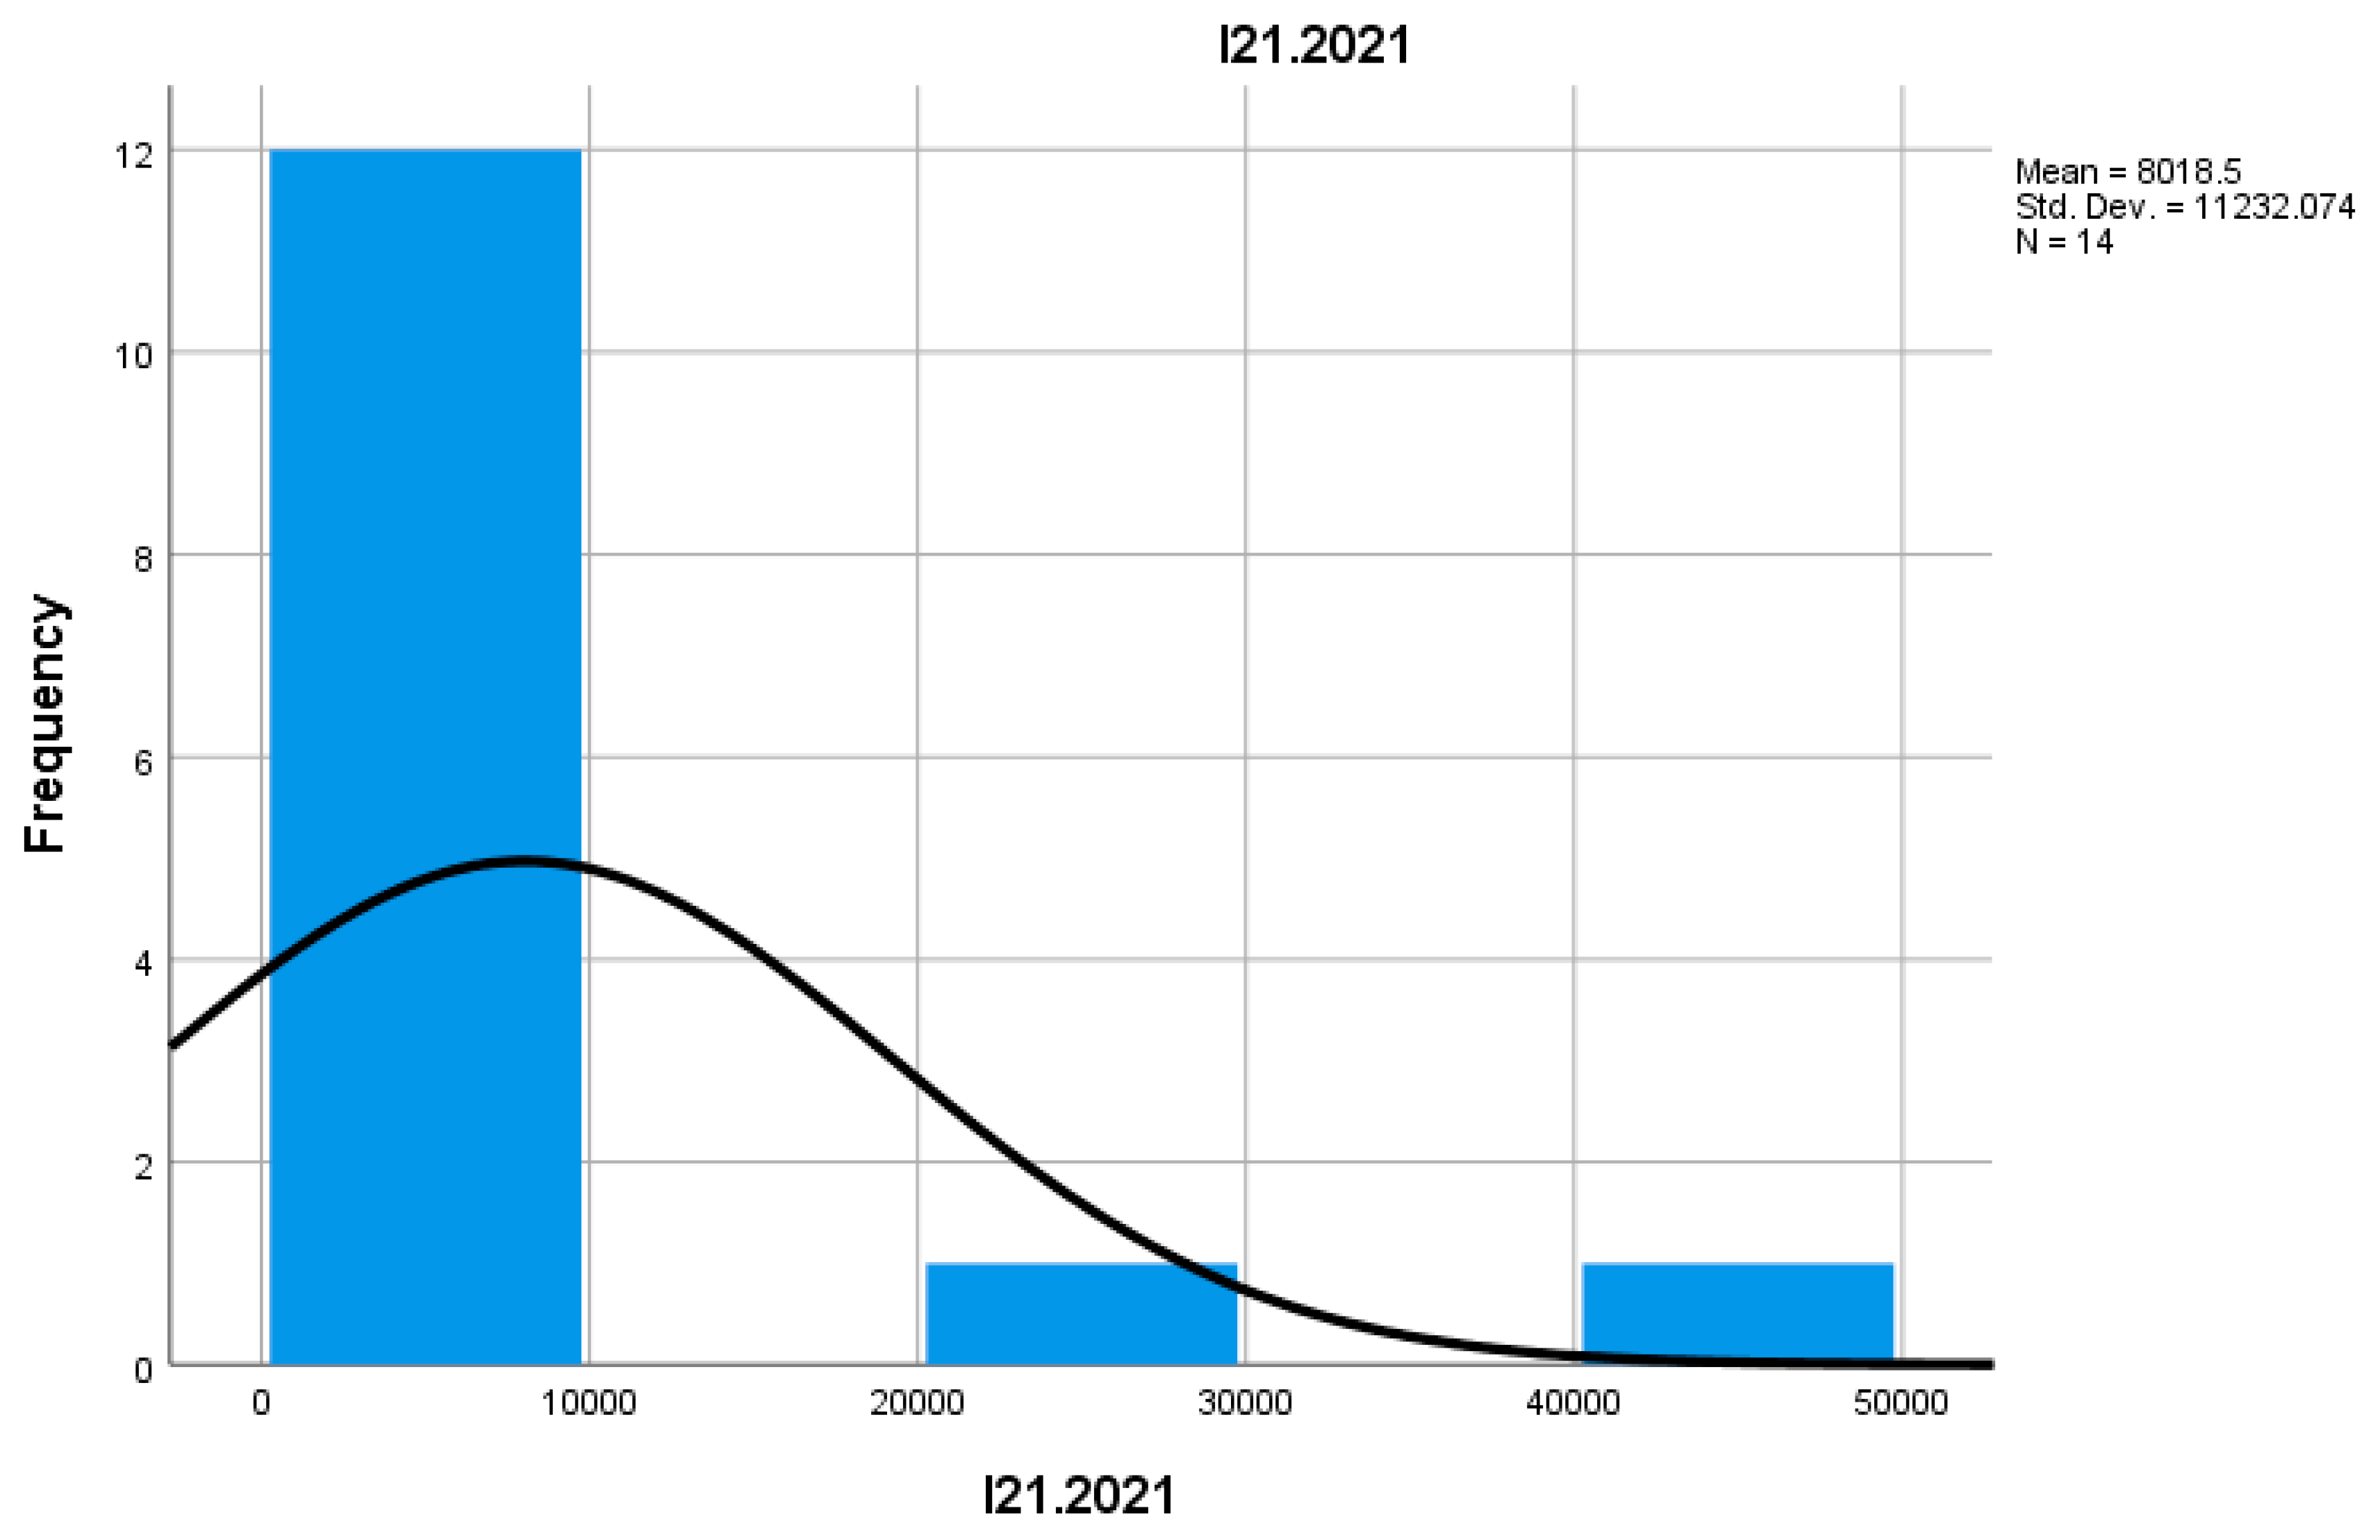
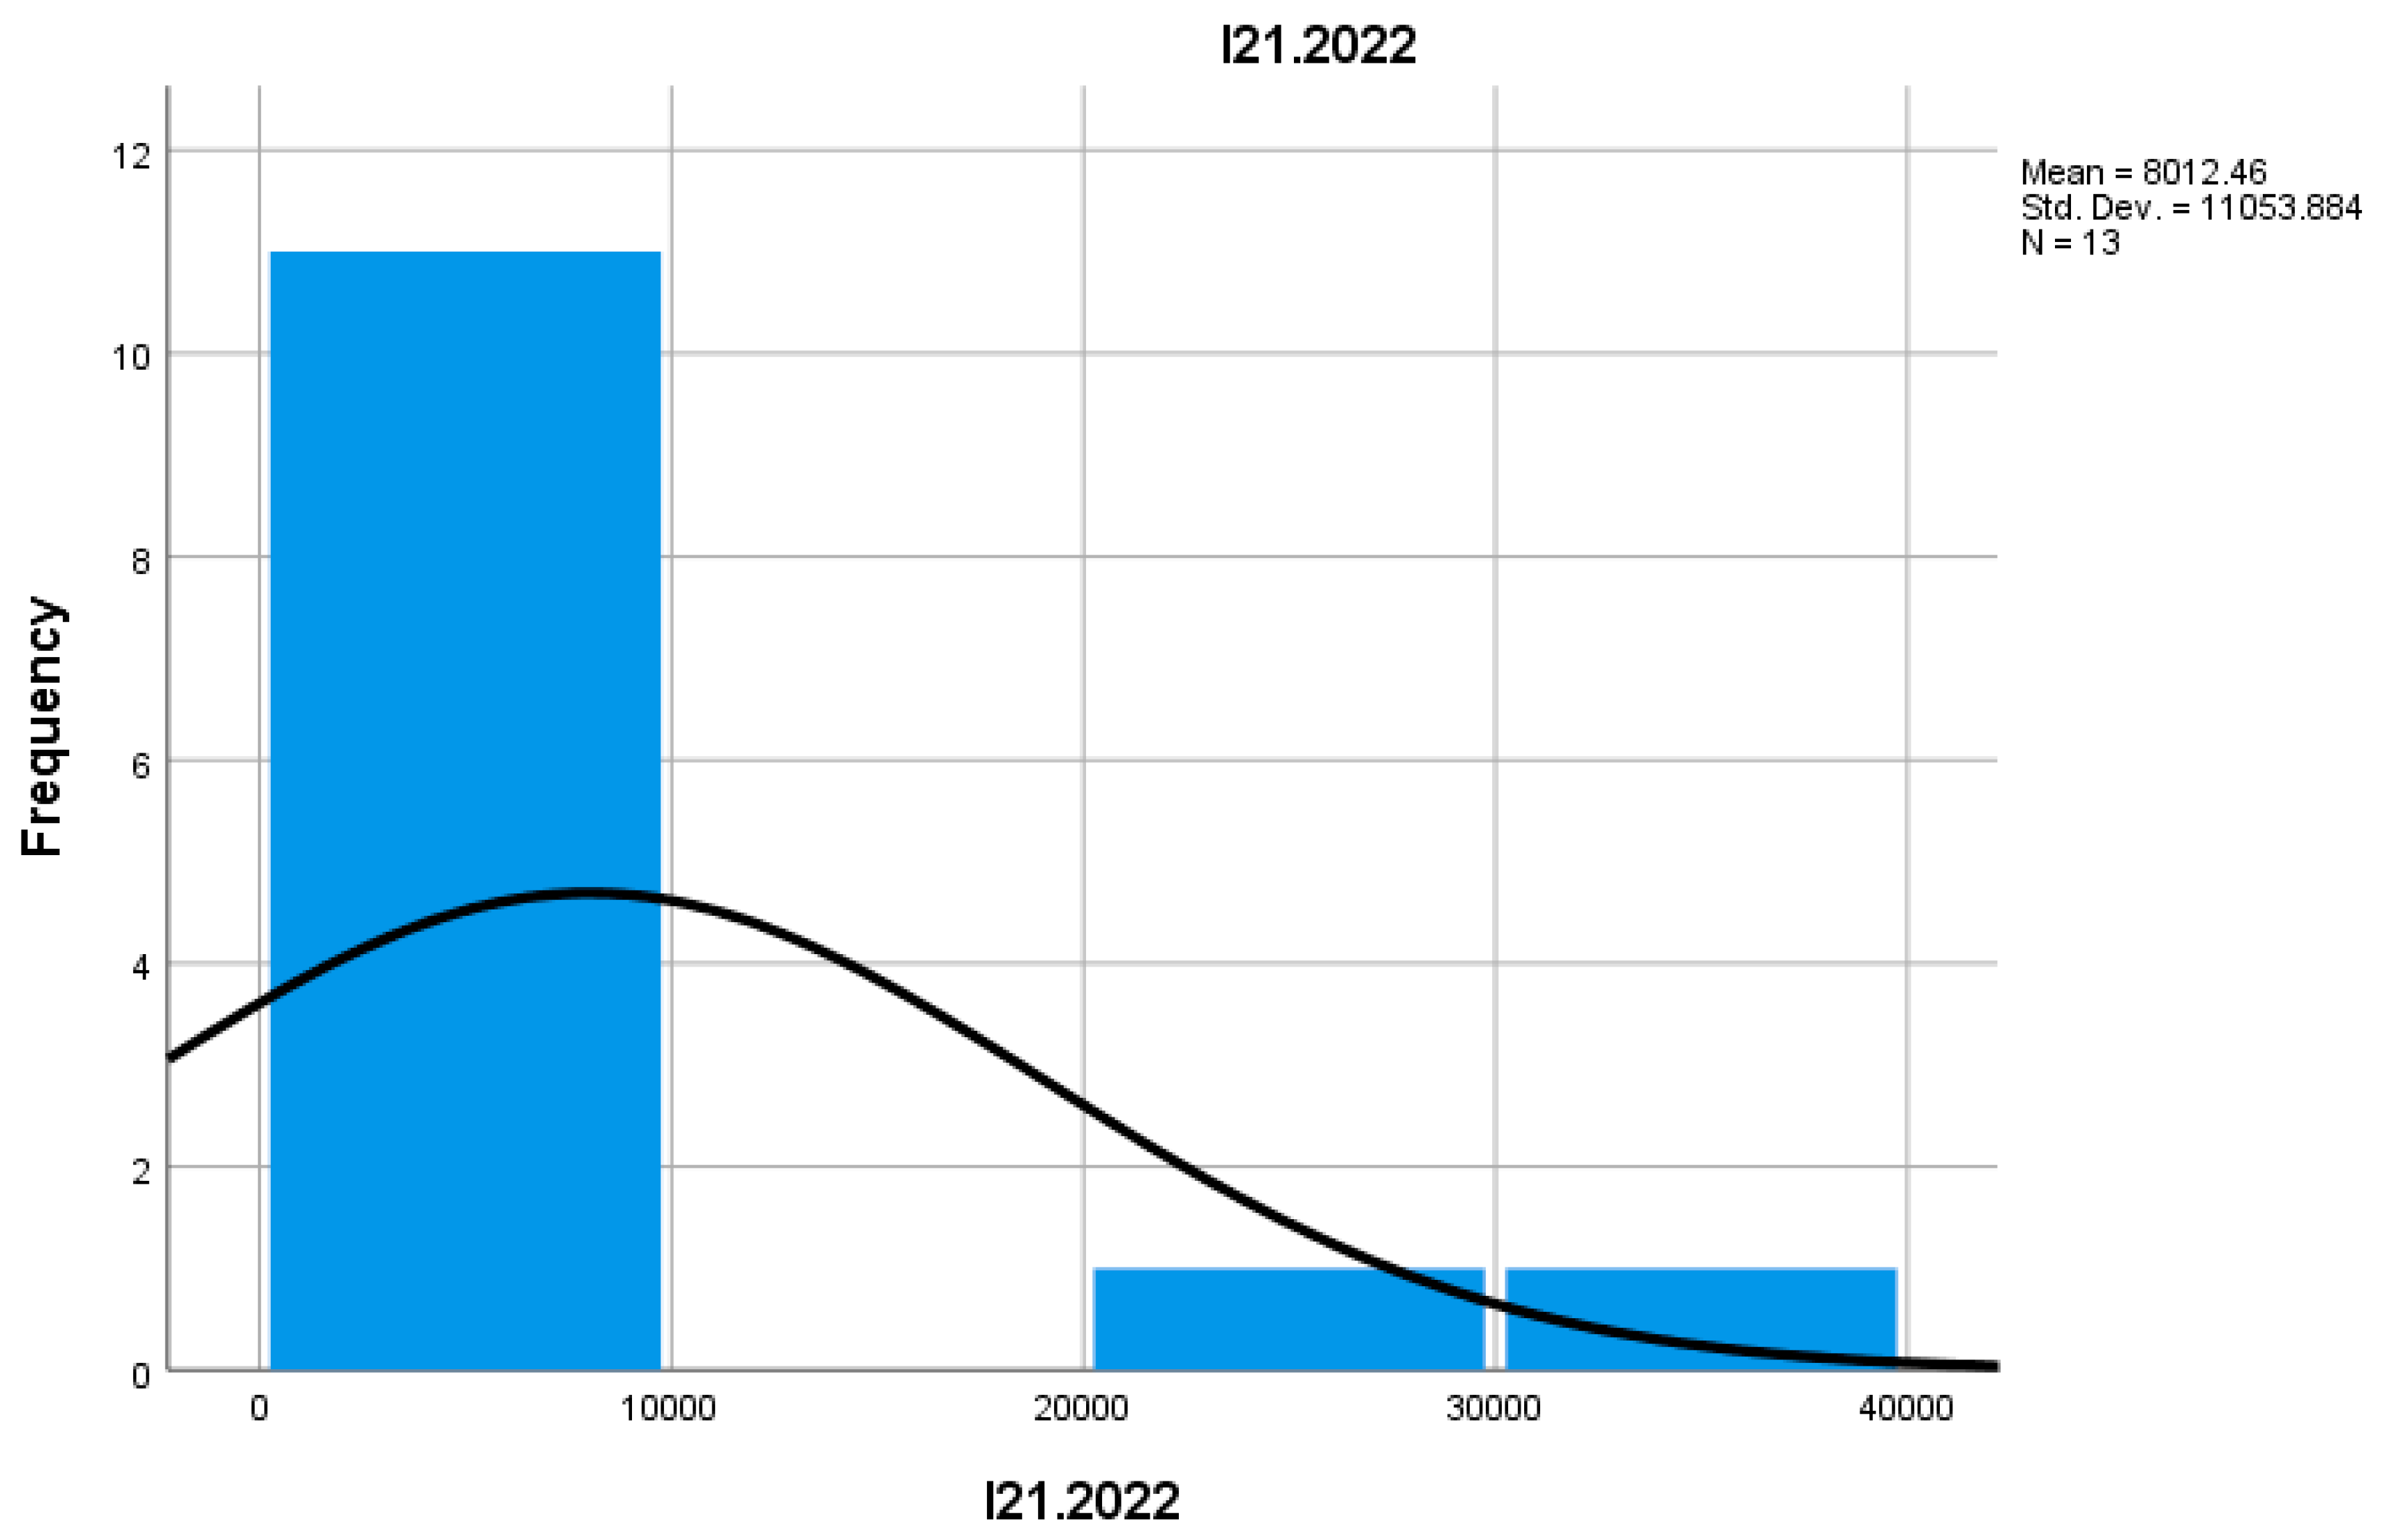
Indicator I21 measures the number of employees in enterprises that had a decrease in turnover. In 2022, the number of employees in these enterprises increased compared to 2021. This may reflect a restructuring of these businesses, which managed to maintain or even expand their workforce by adapting their activities to new economic conditions or by diversifying services offered in mountain regions.
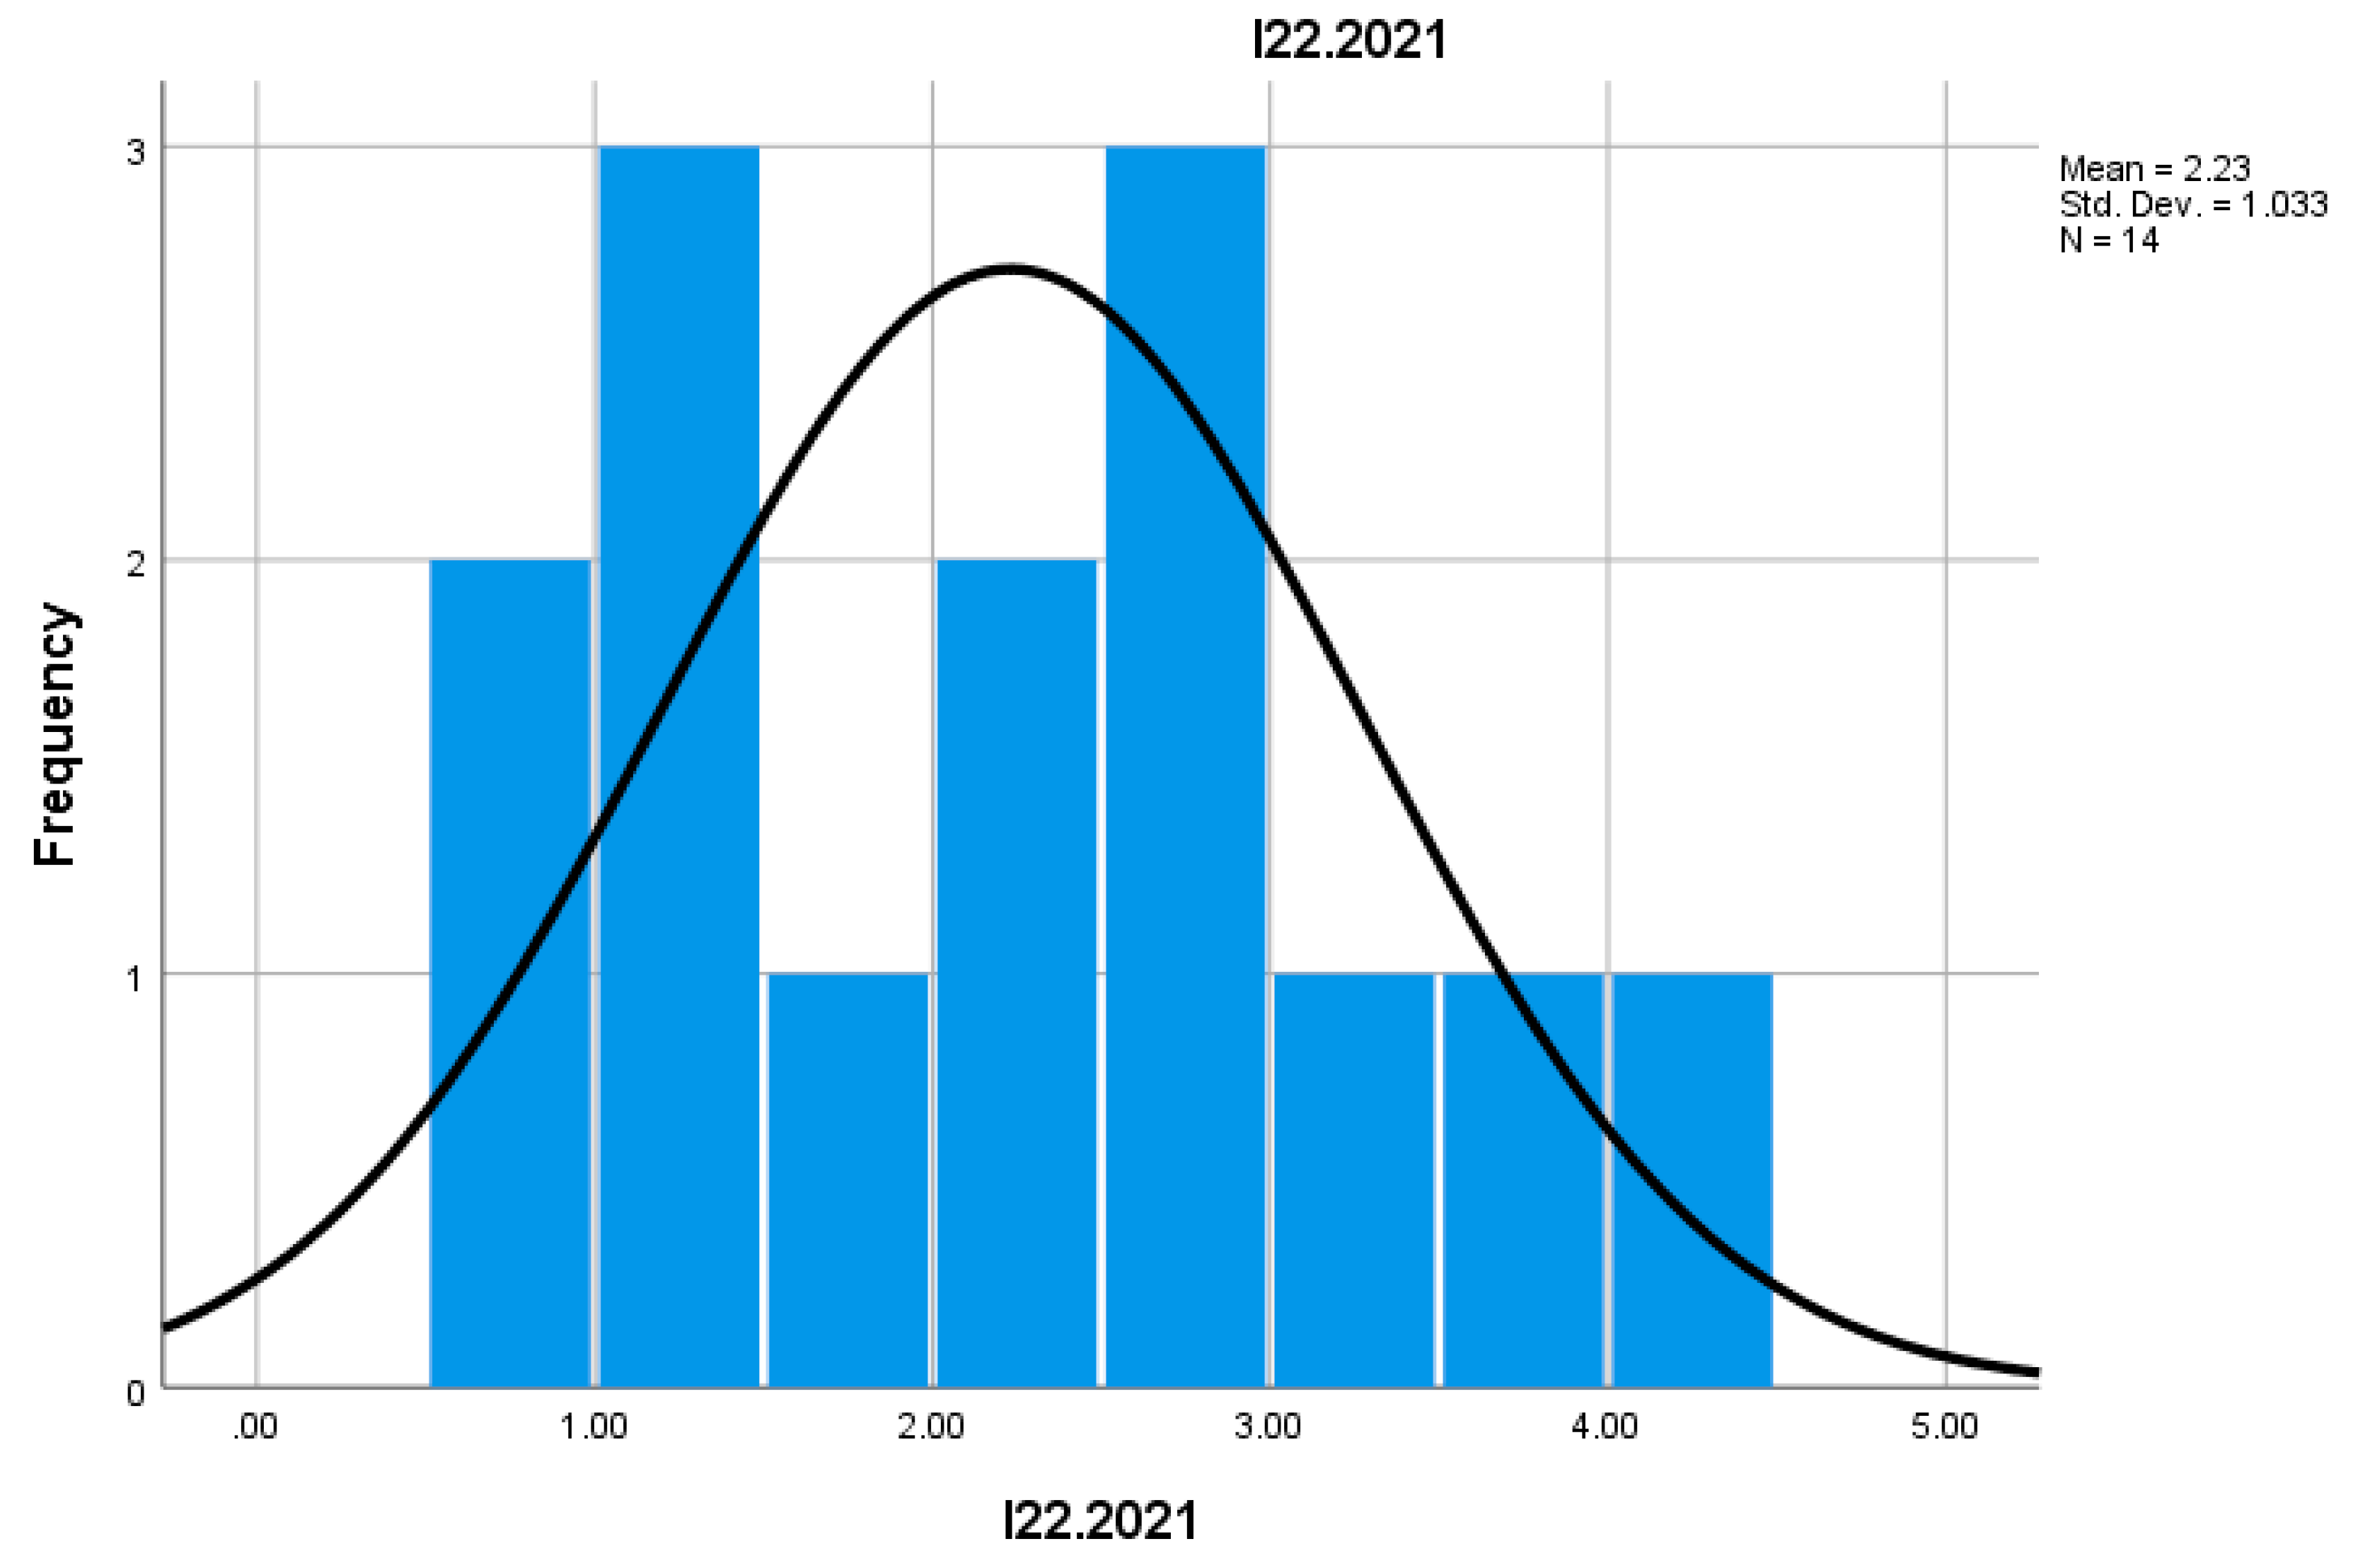
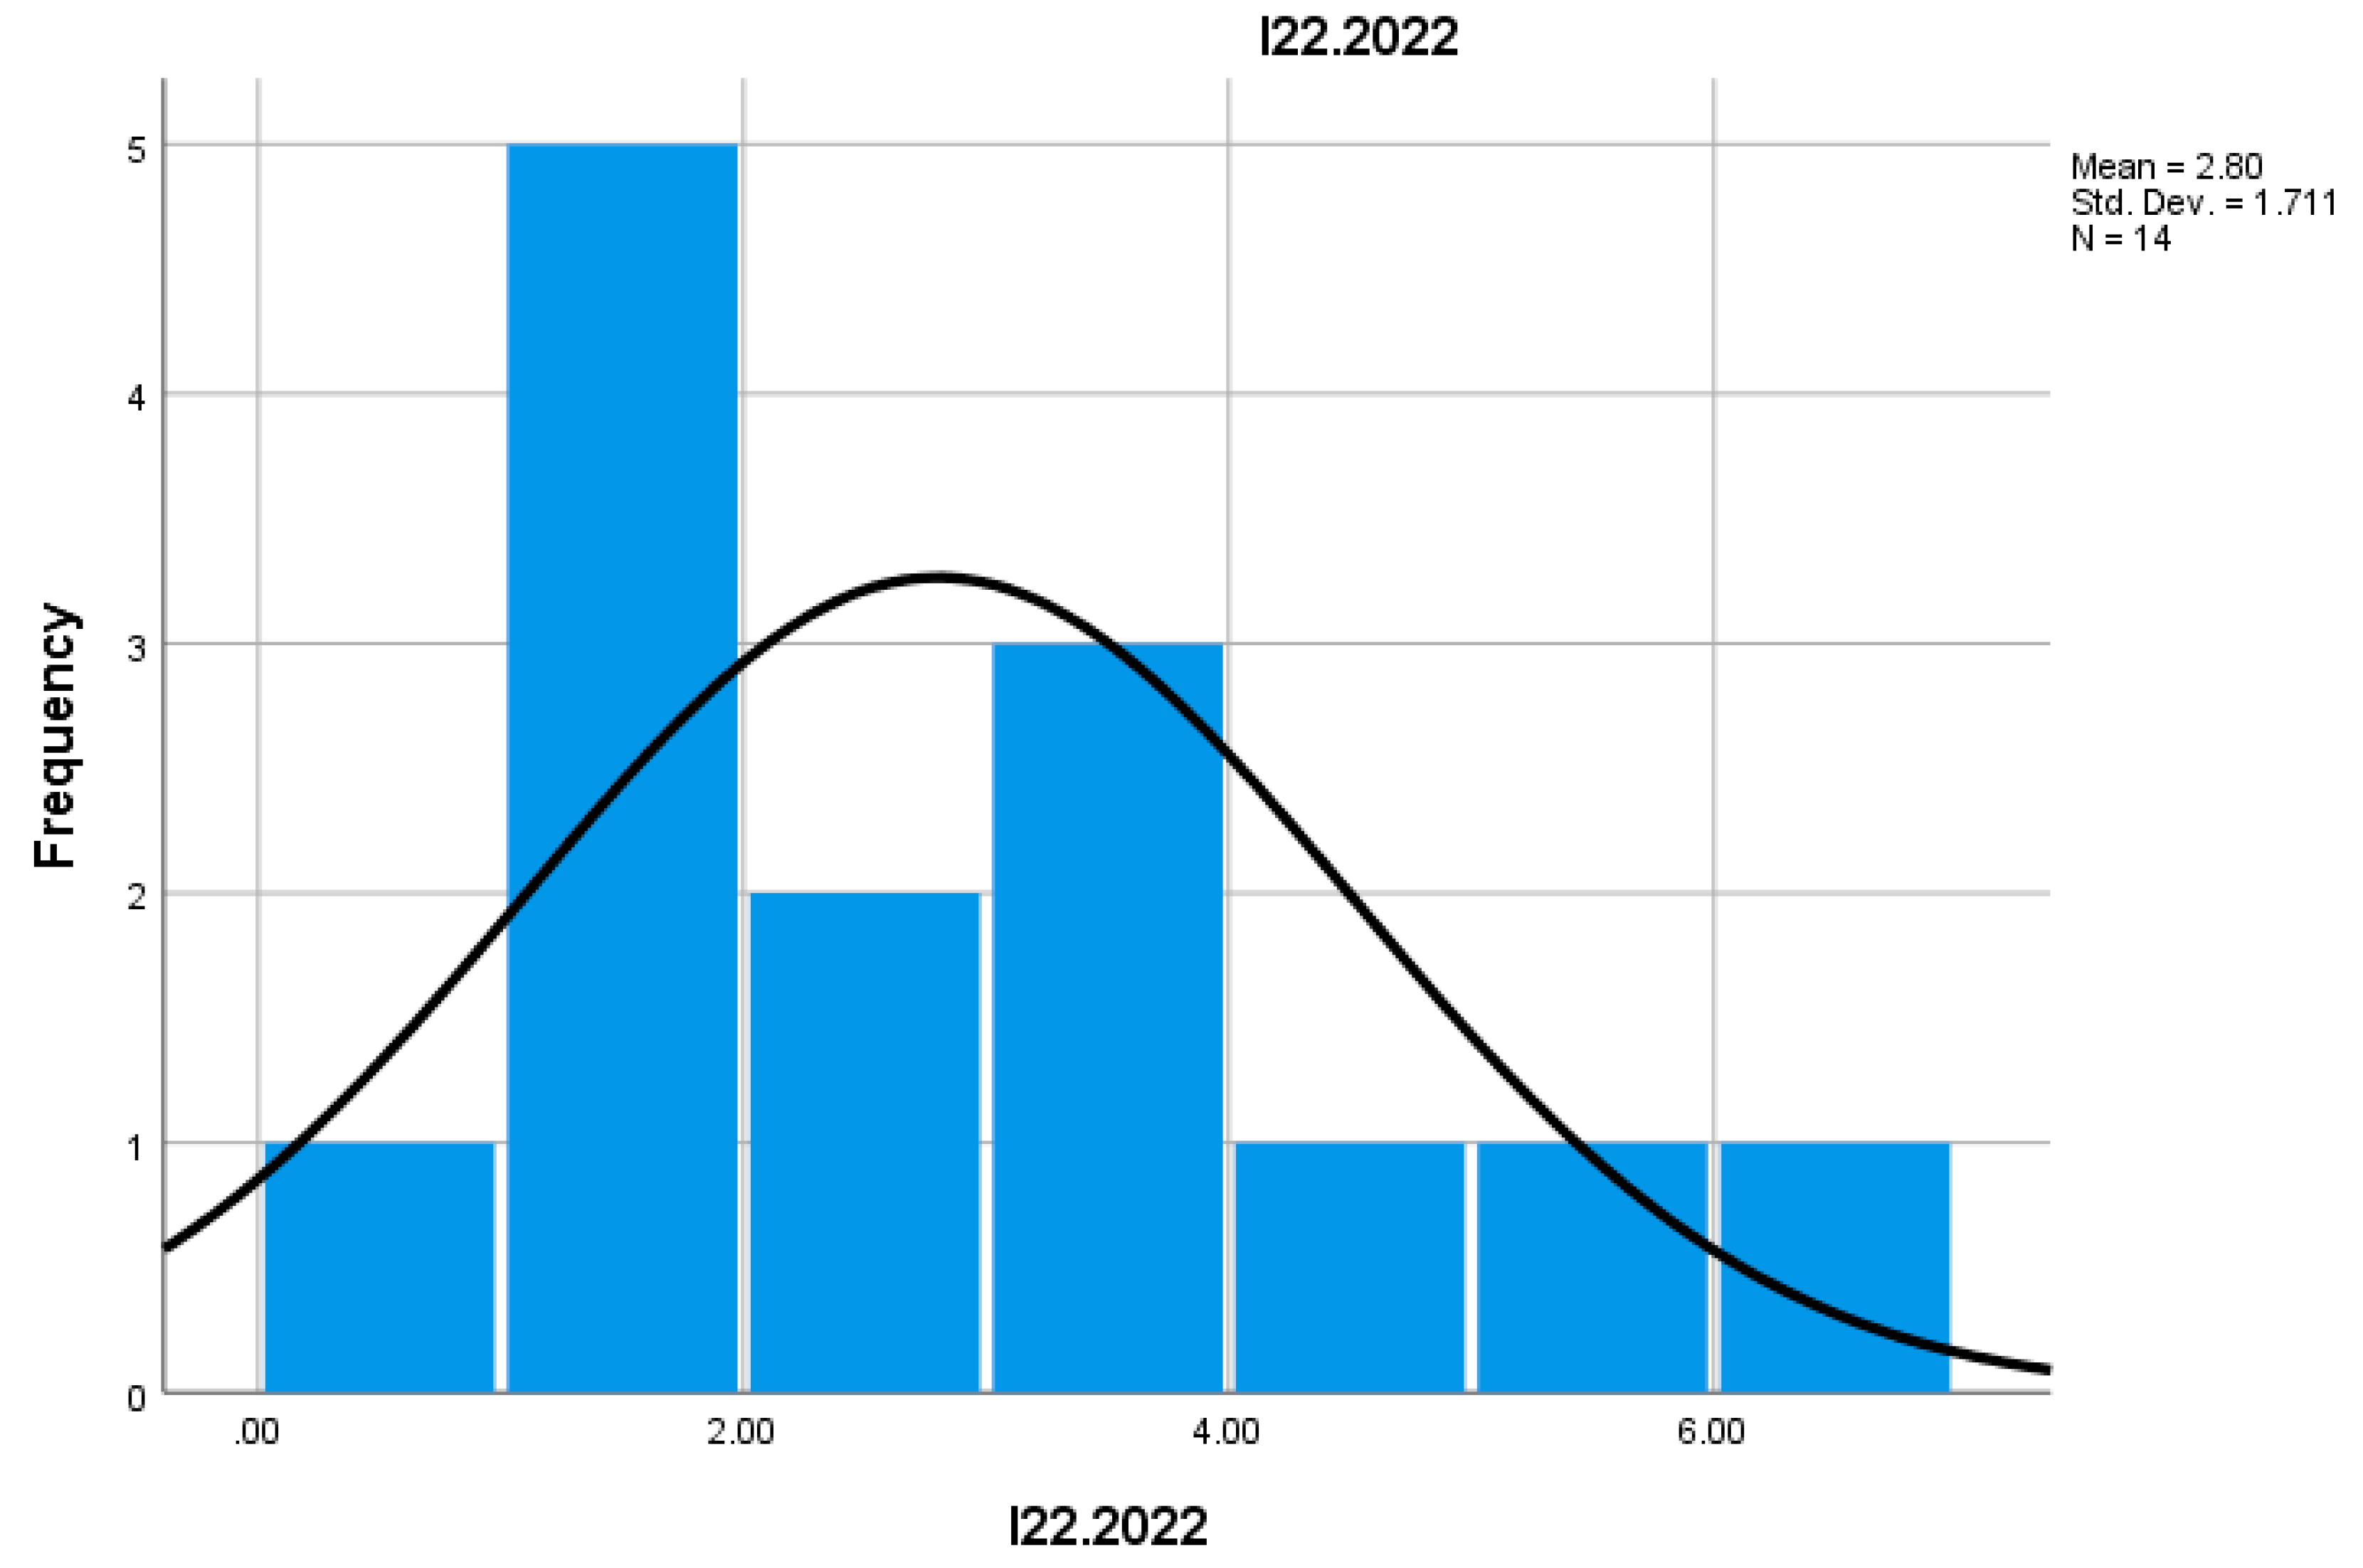
Indicator I22 analyzes the number of enterprises that recorded an increase in turnover. In 2022, the number of these enterprises was higher compared to 2021, suggesting expansion in mountain commerce businesses. These enterprises managed to adapt to market demands and benefit from increased demand for products and services in mountain areas, such as during the tourist season or in regions with natural attractions.
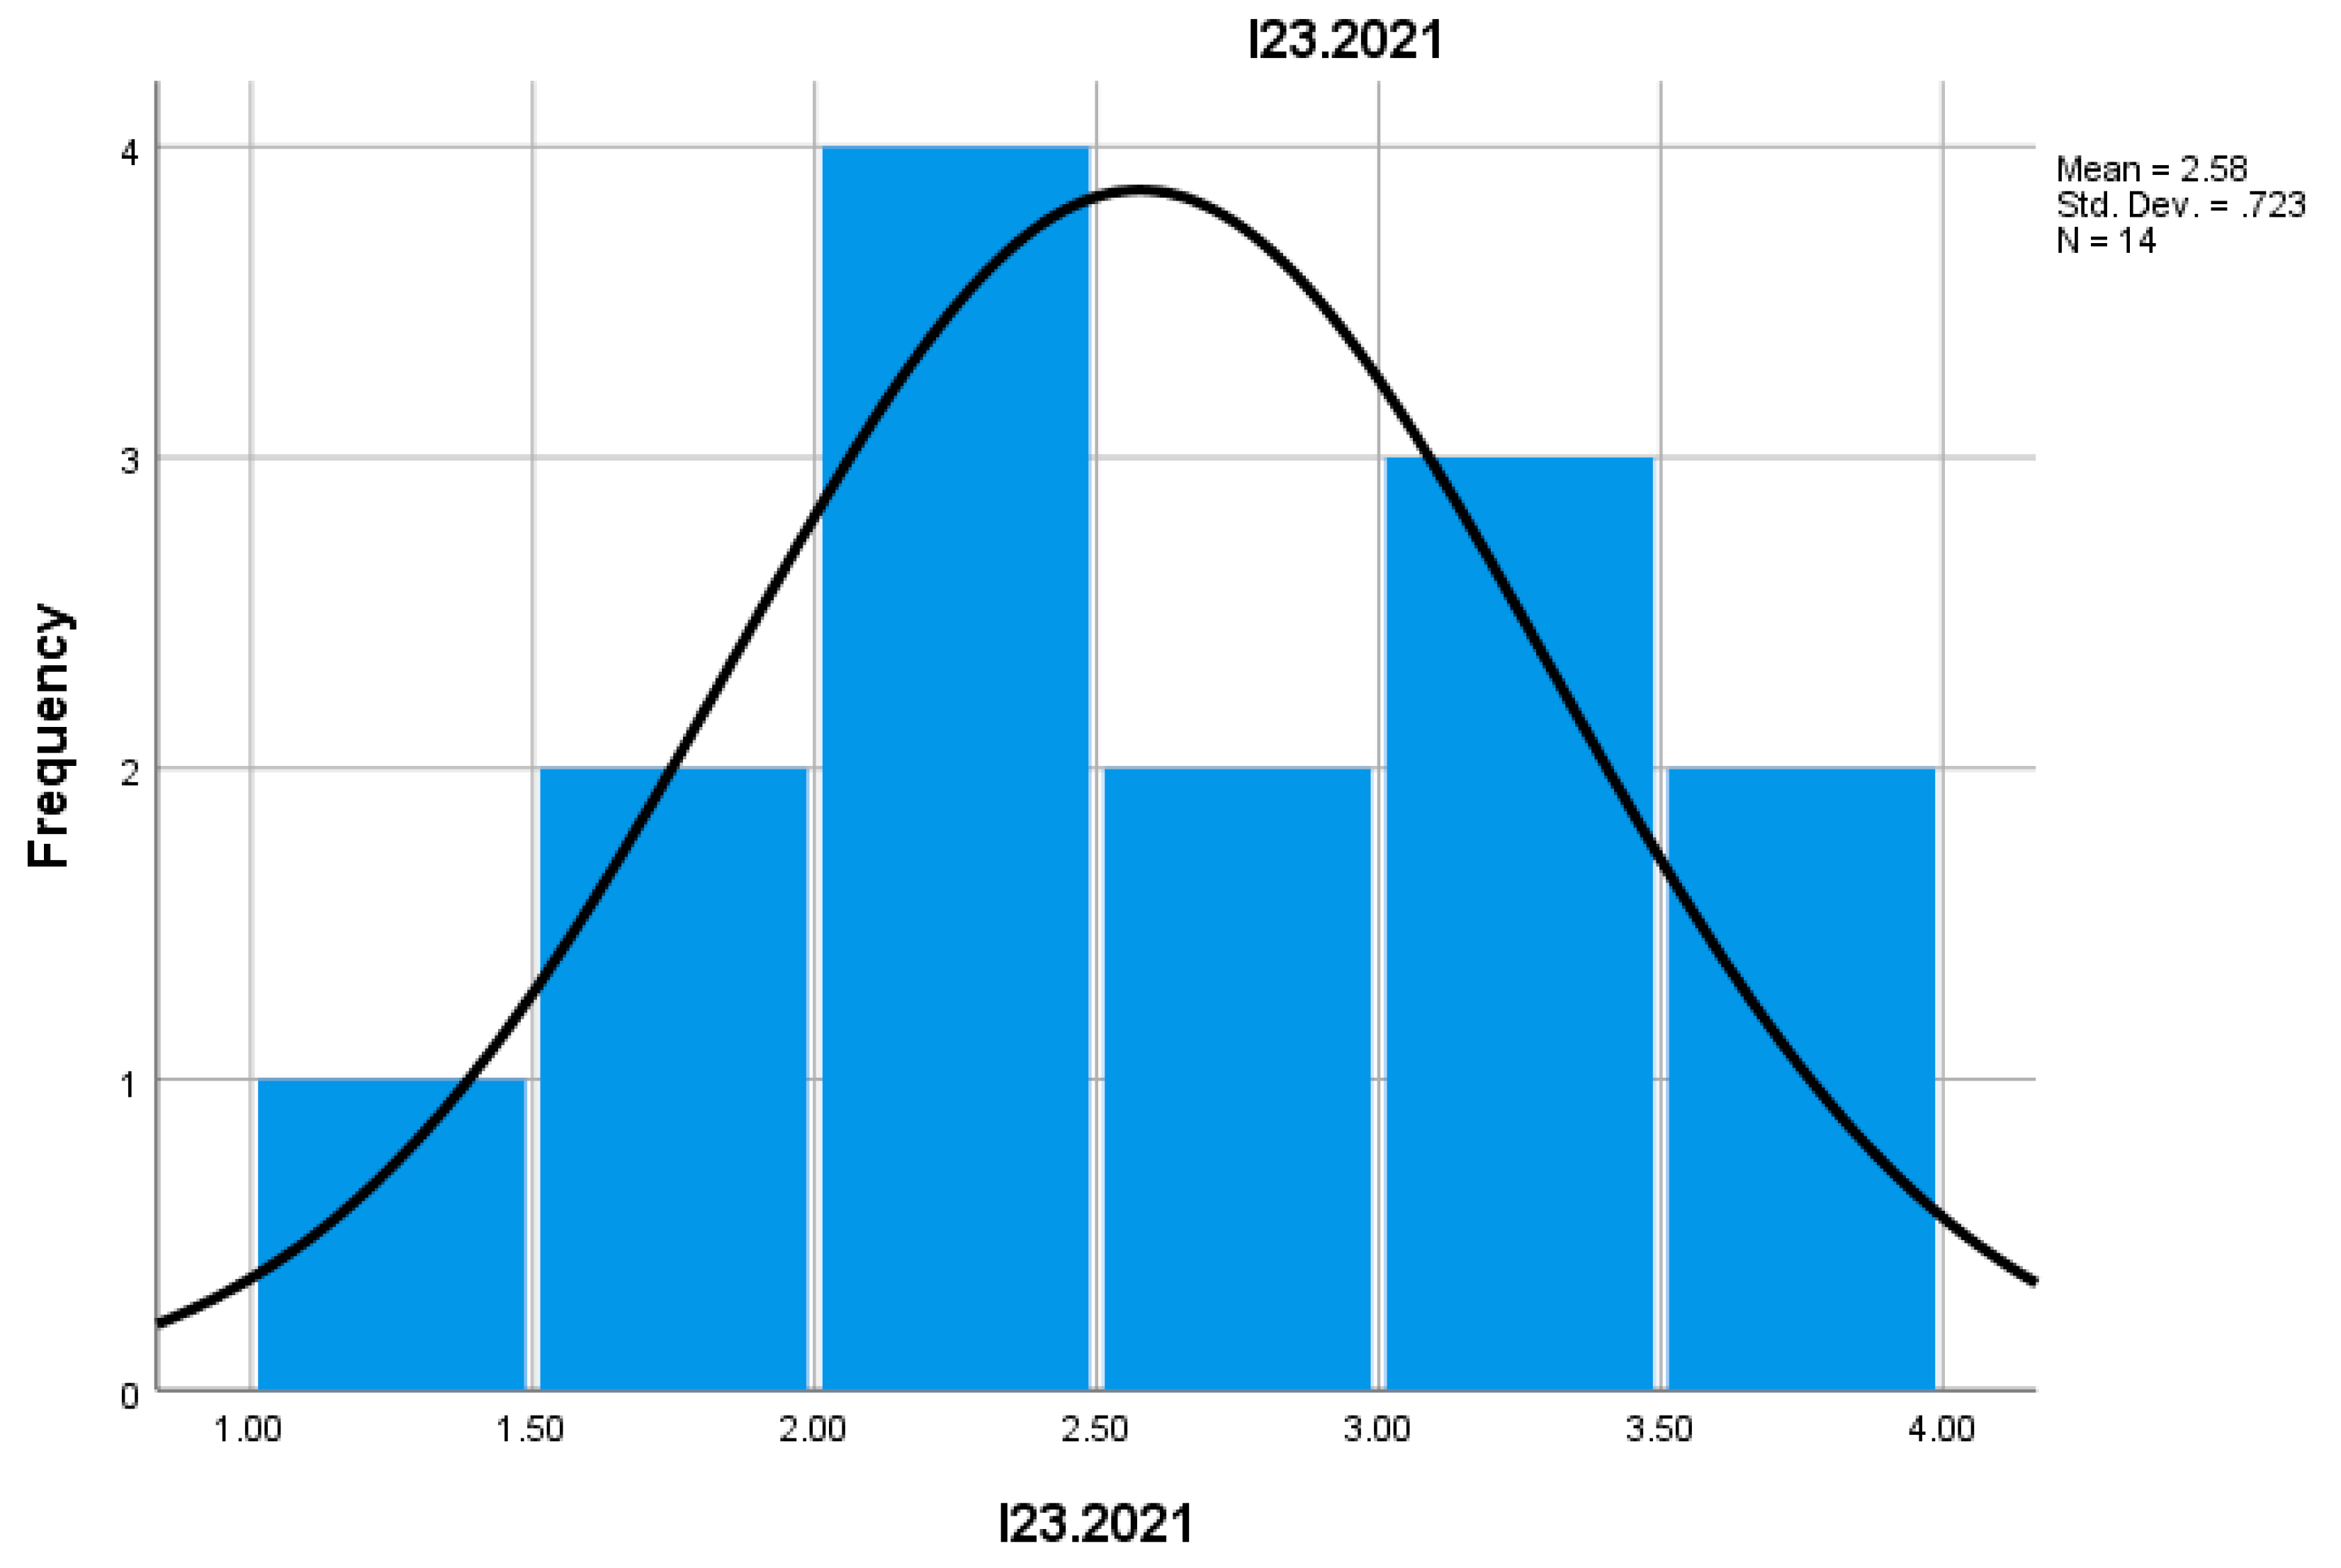
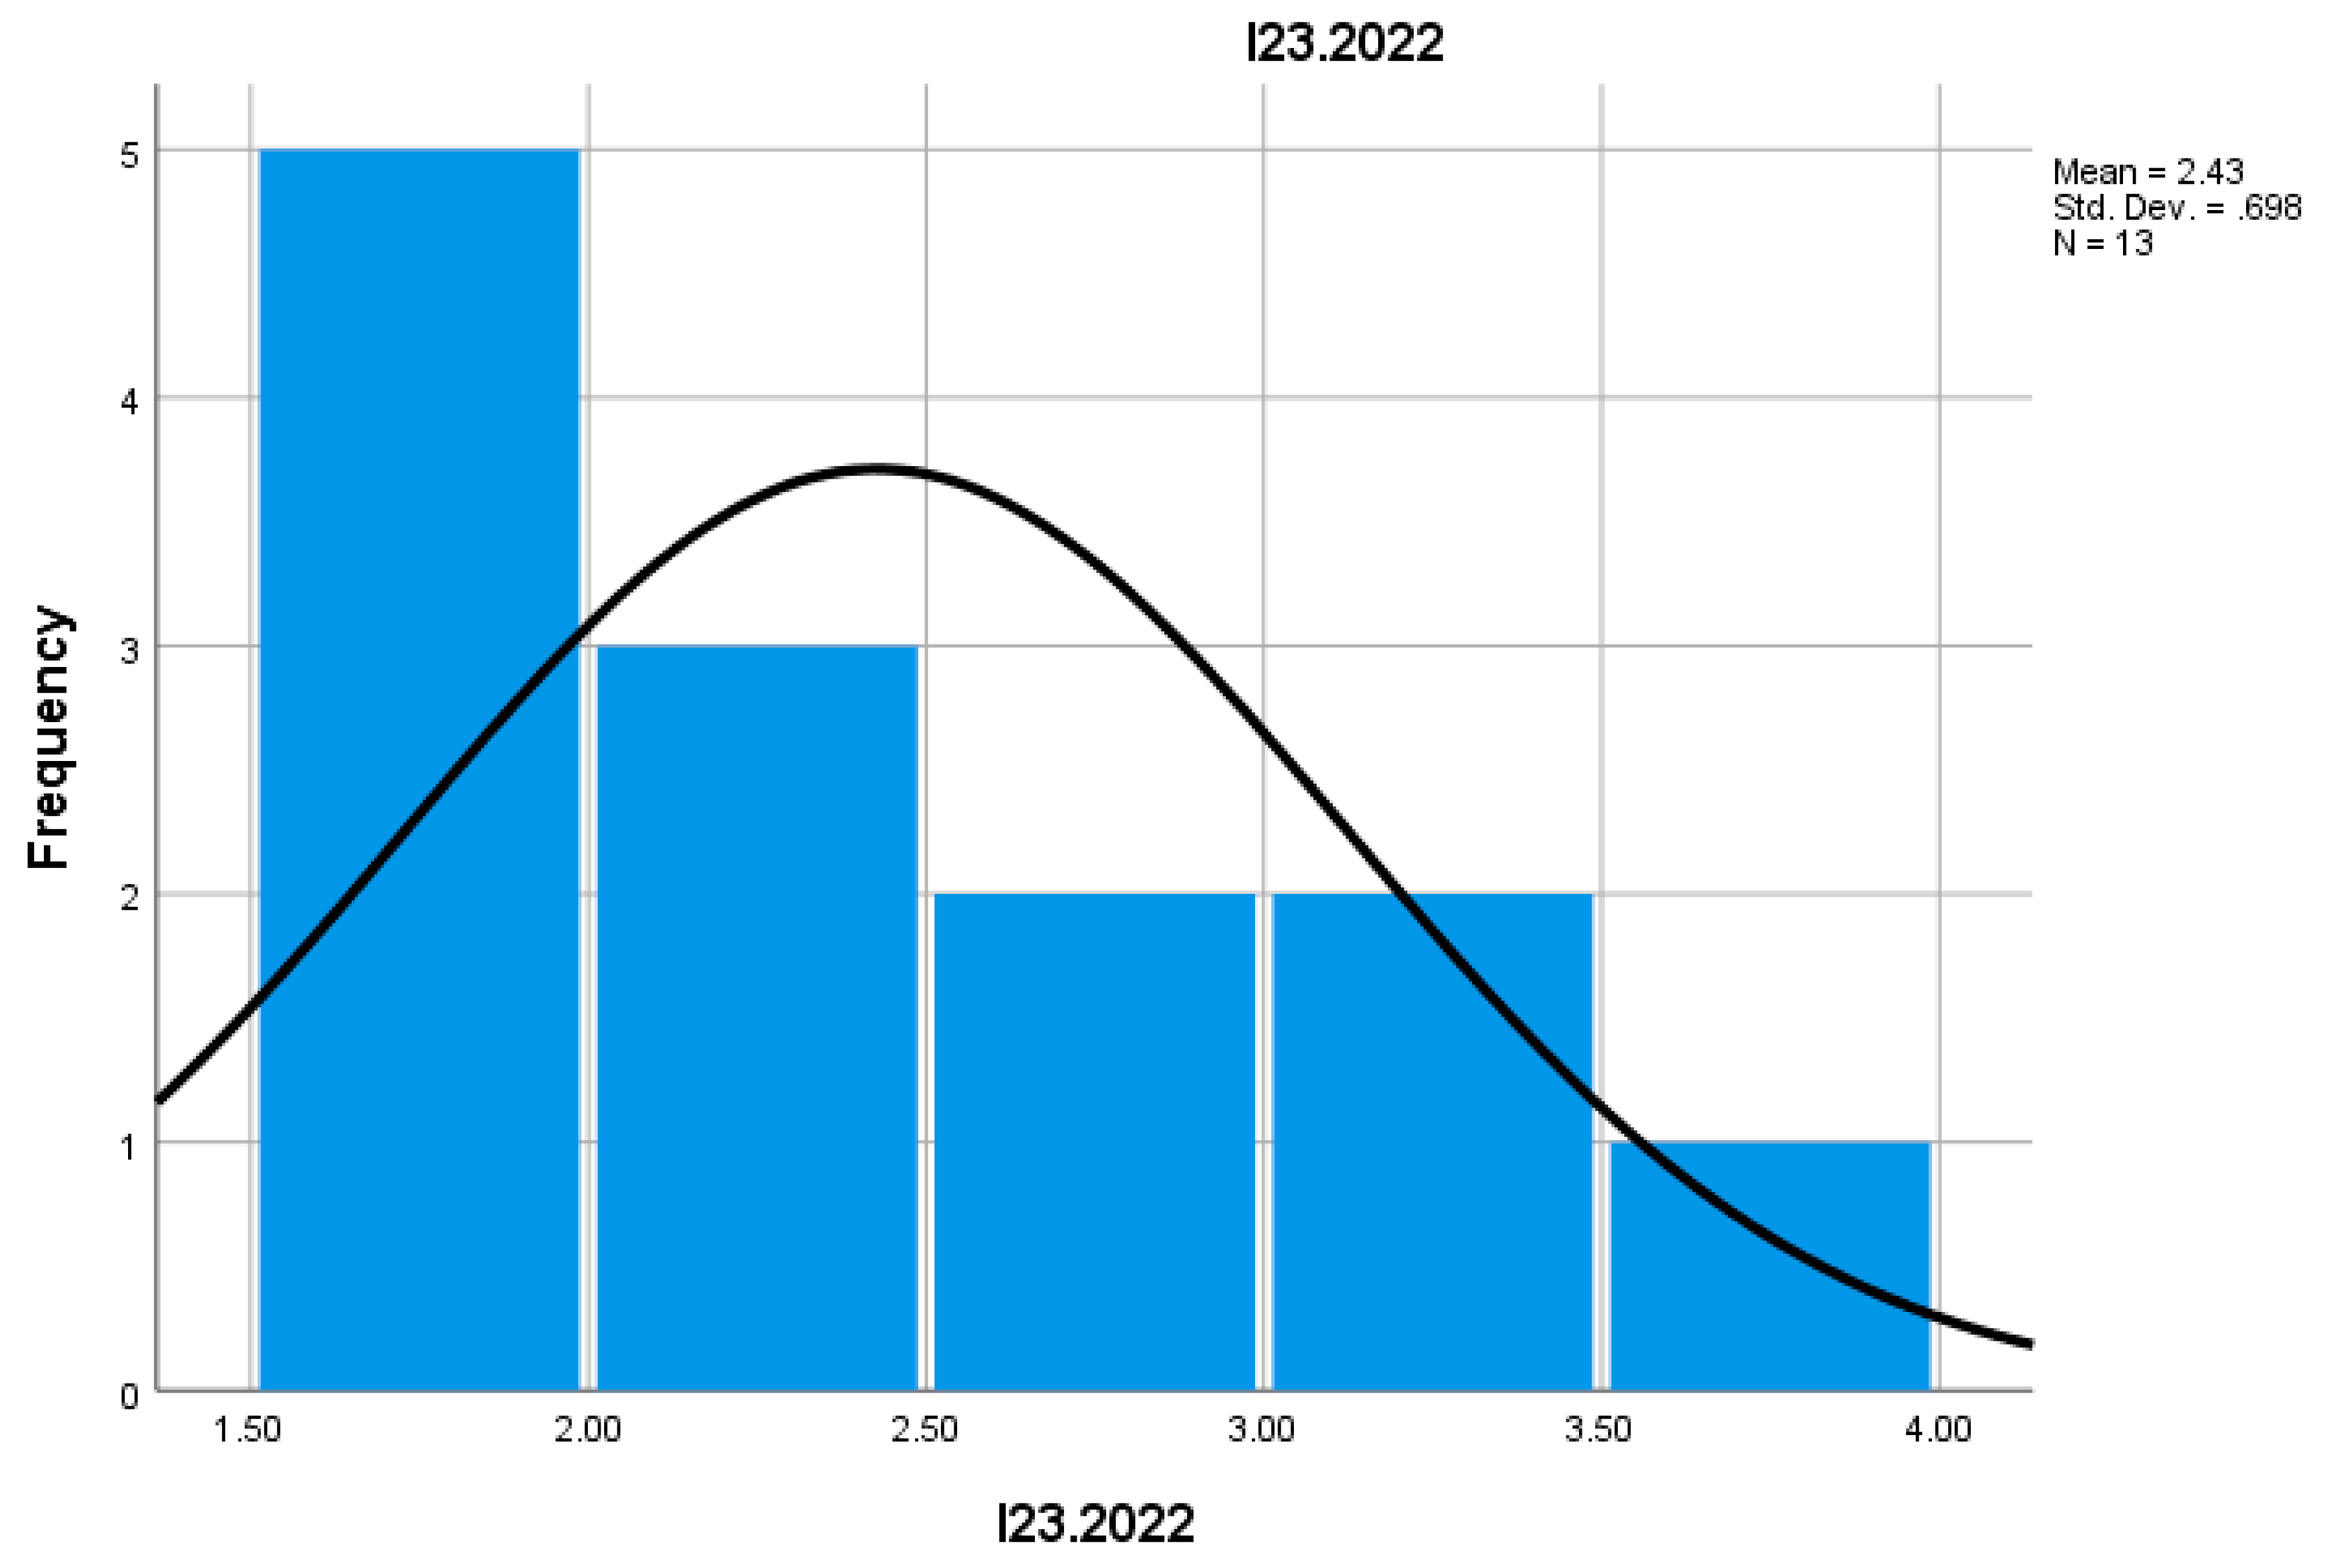
Indicator I23 measures the proportion of enterprises with increased turnover in total active enterprises. In 2022, this proportion was higher than in 2021, suggesting an expansion of mountain businesses that were able to grow. These businesses benefit from favorable economic conditions and increasing demand, having a positive impact on the local economy and job creation.
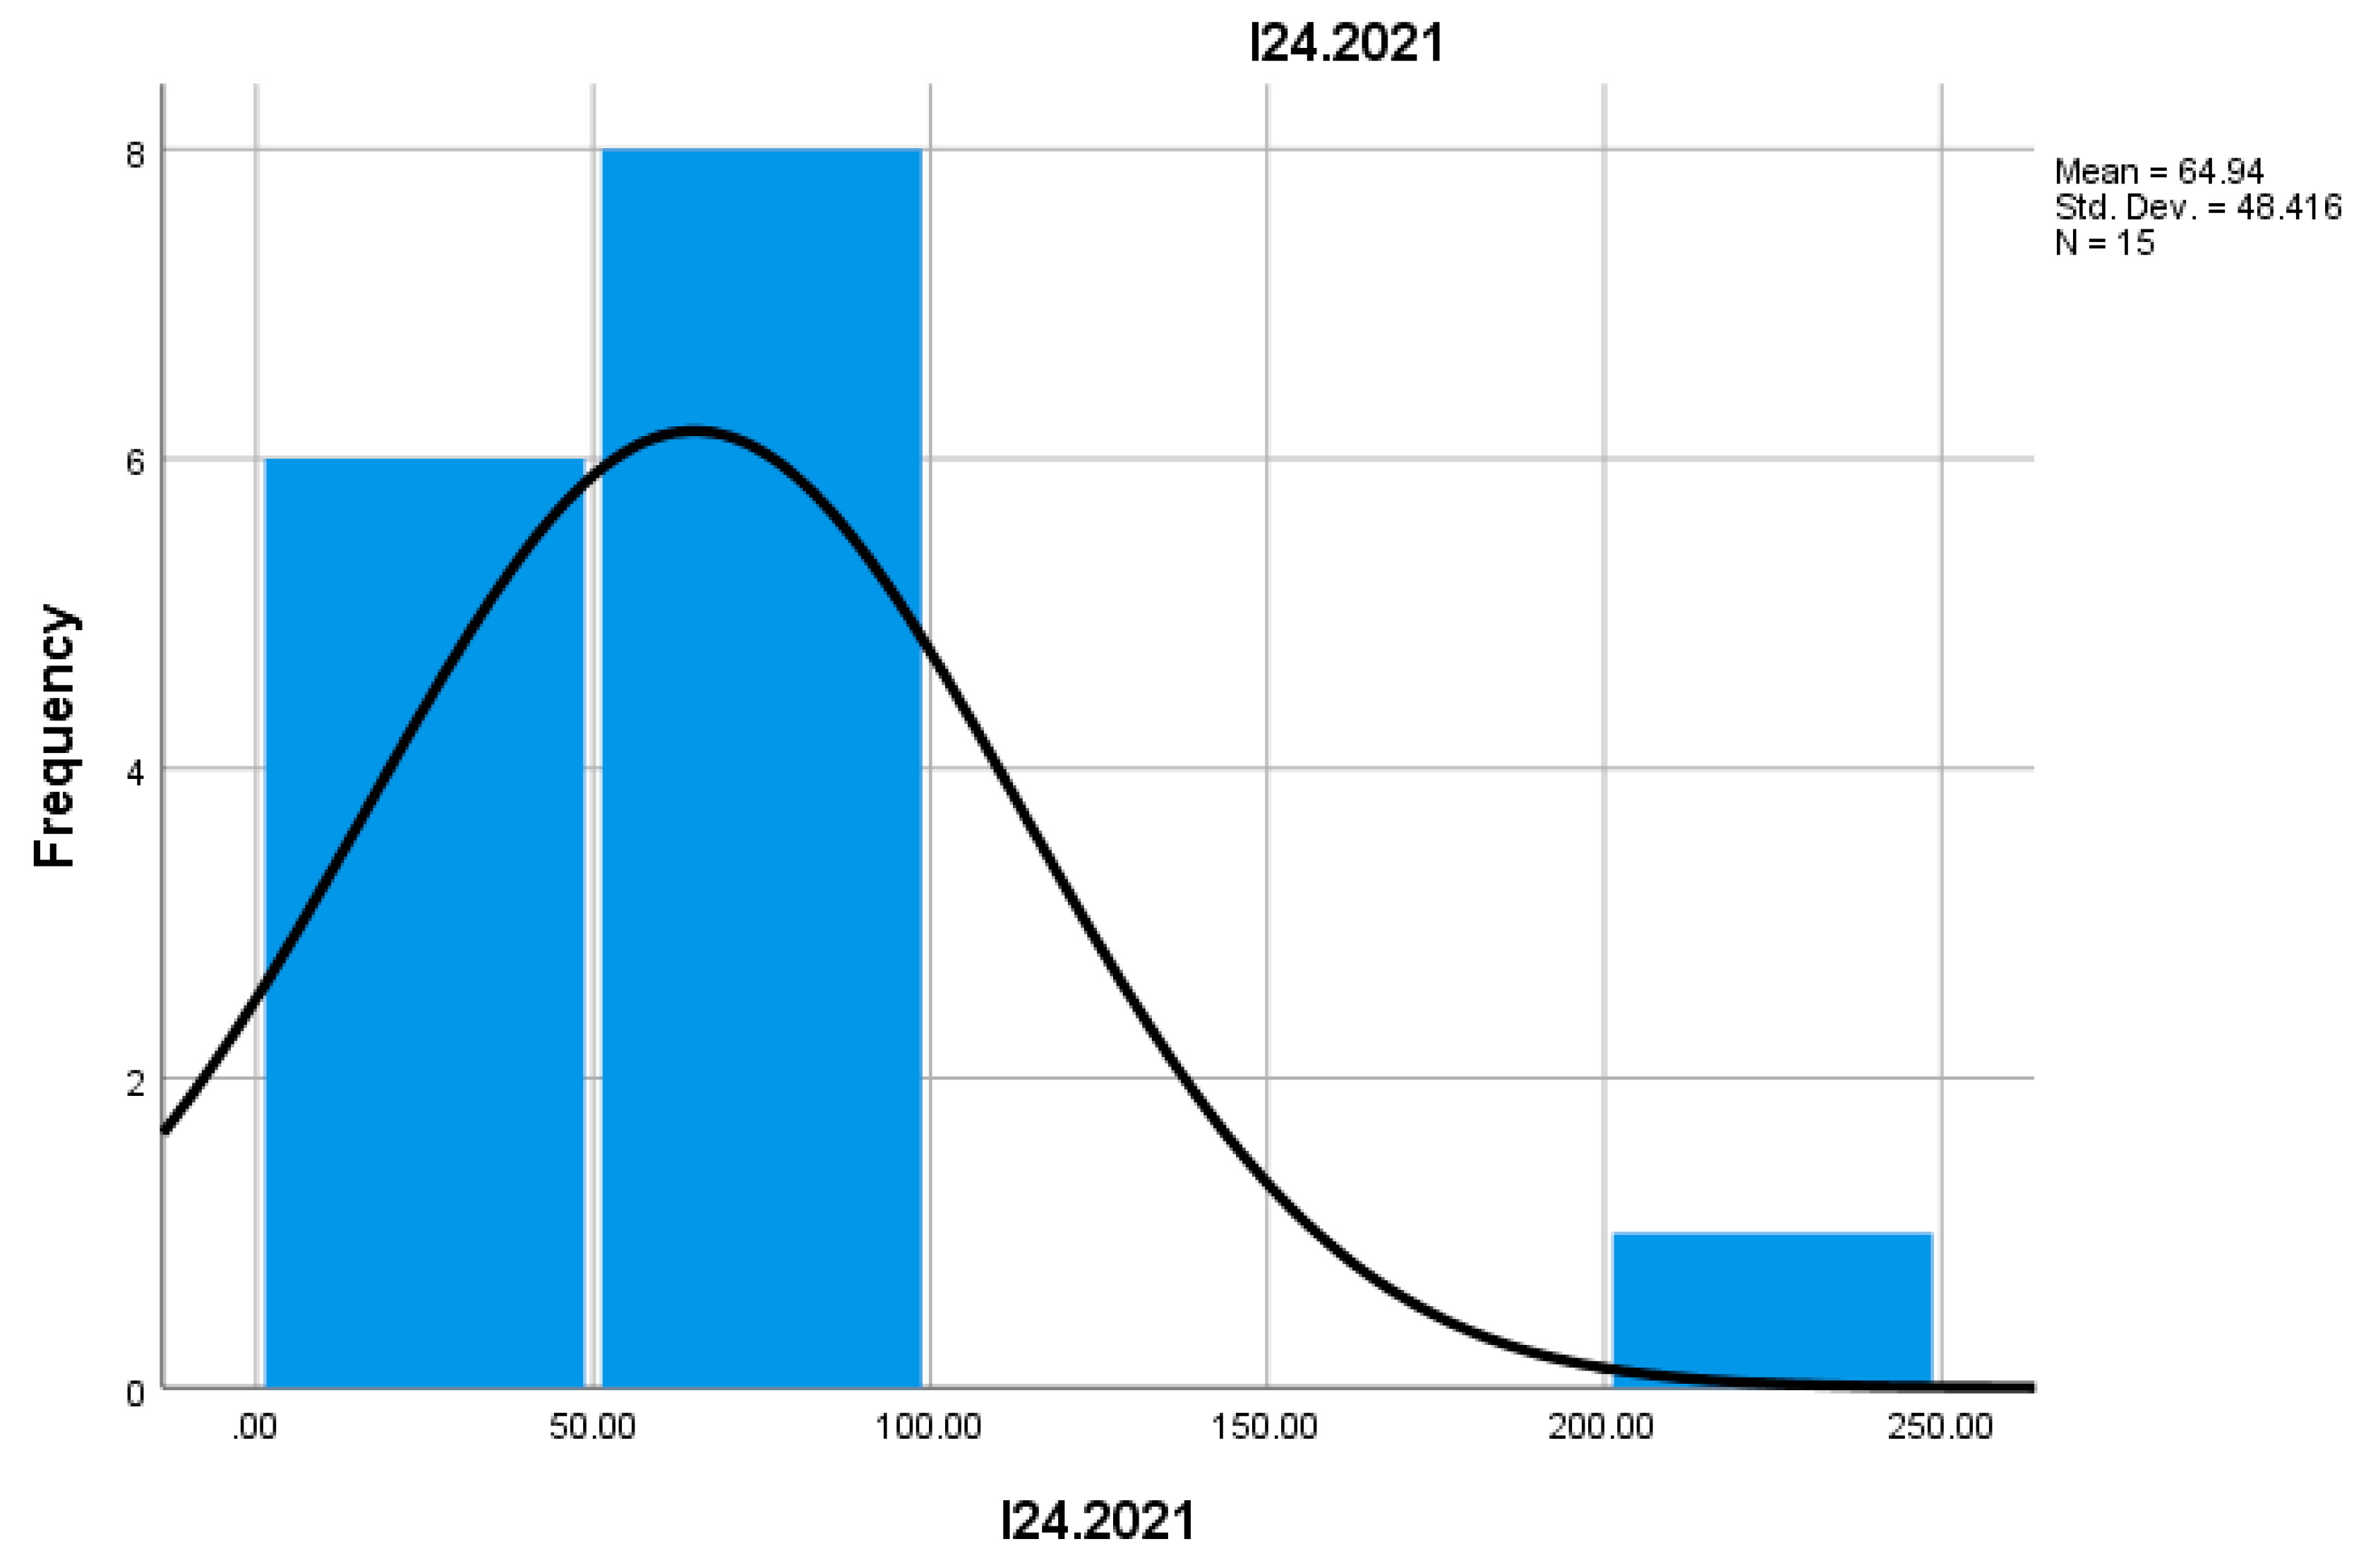
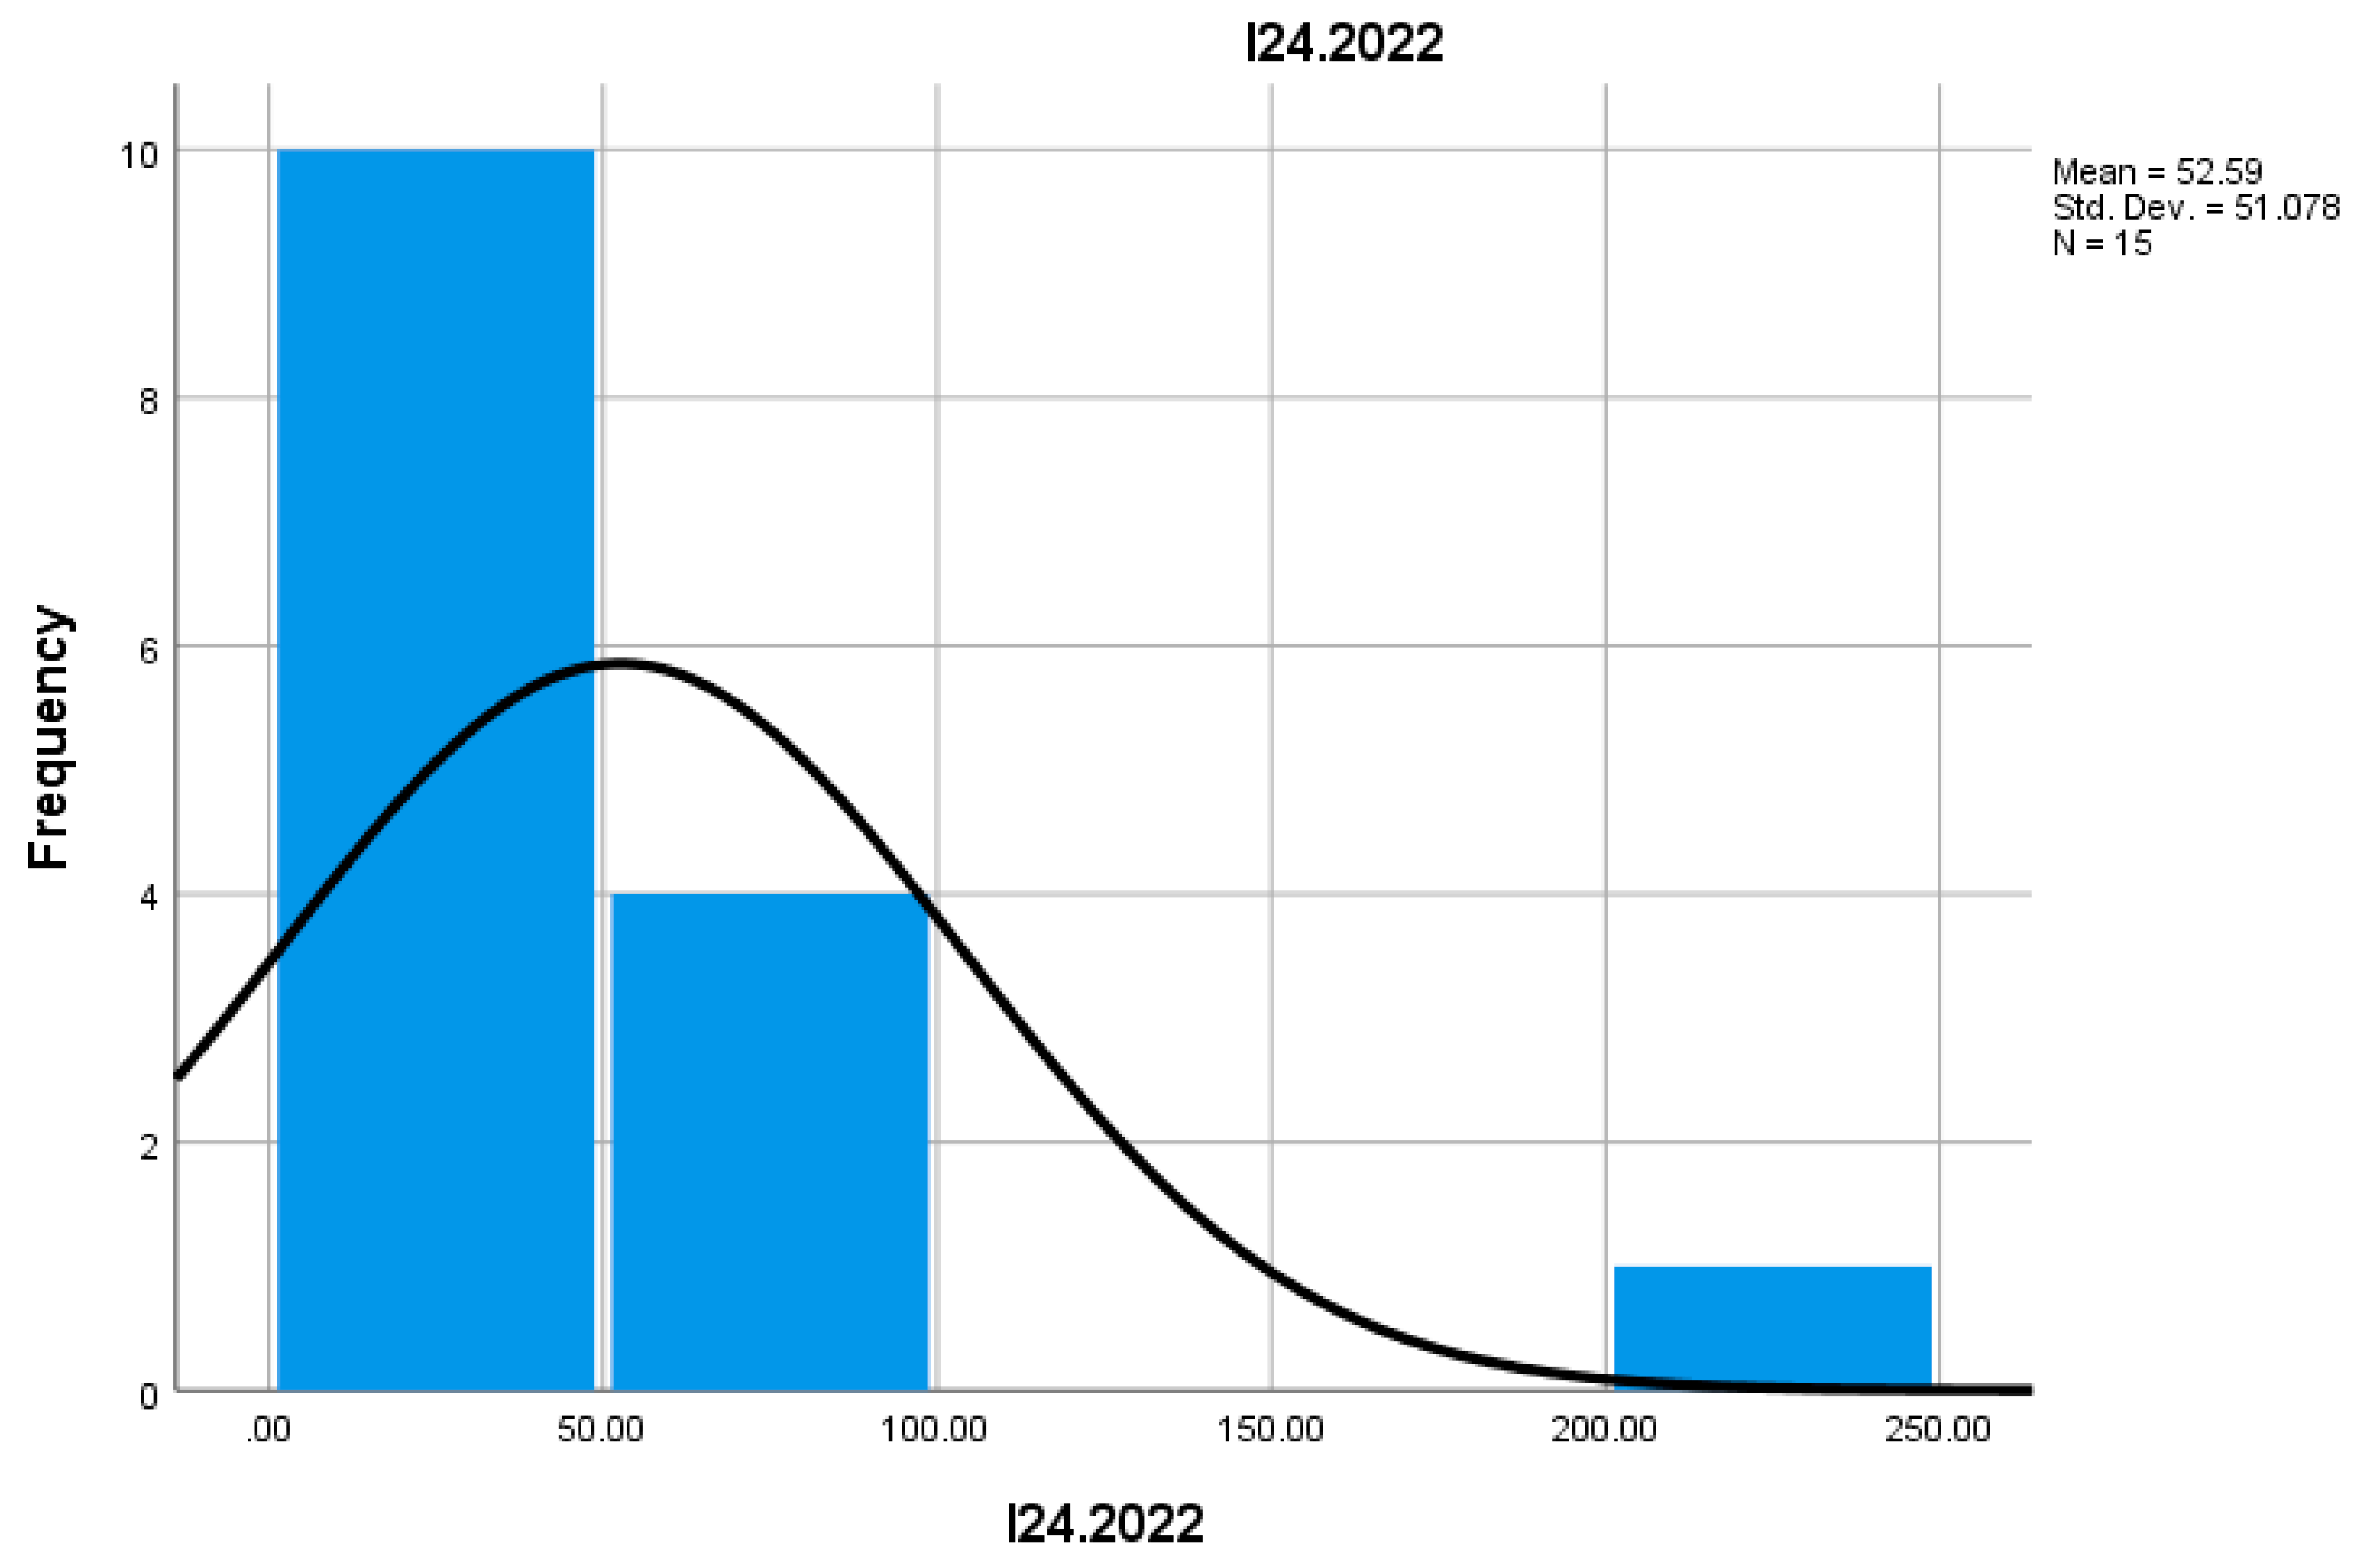
Indicator I24 reflects the number of employees in enterprises that had an increase in turnover. In 2022, the number of employees in these enterprises increased compared to 2021, indicating that successful mountain businesses created additional jobs and contributed to reducing unemployment in mountain regions. Their expansion had a direct impact on local labor force participation.
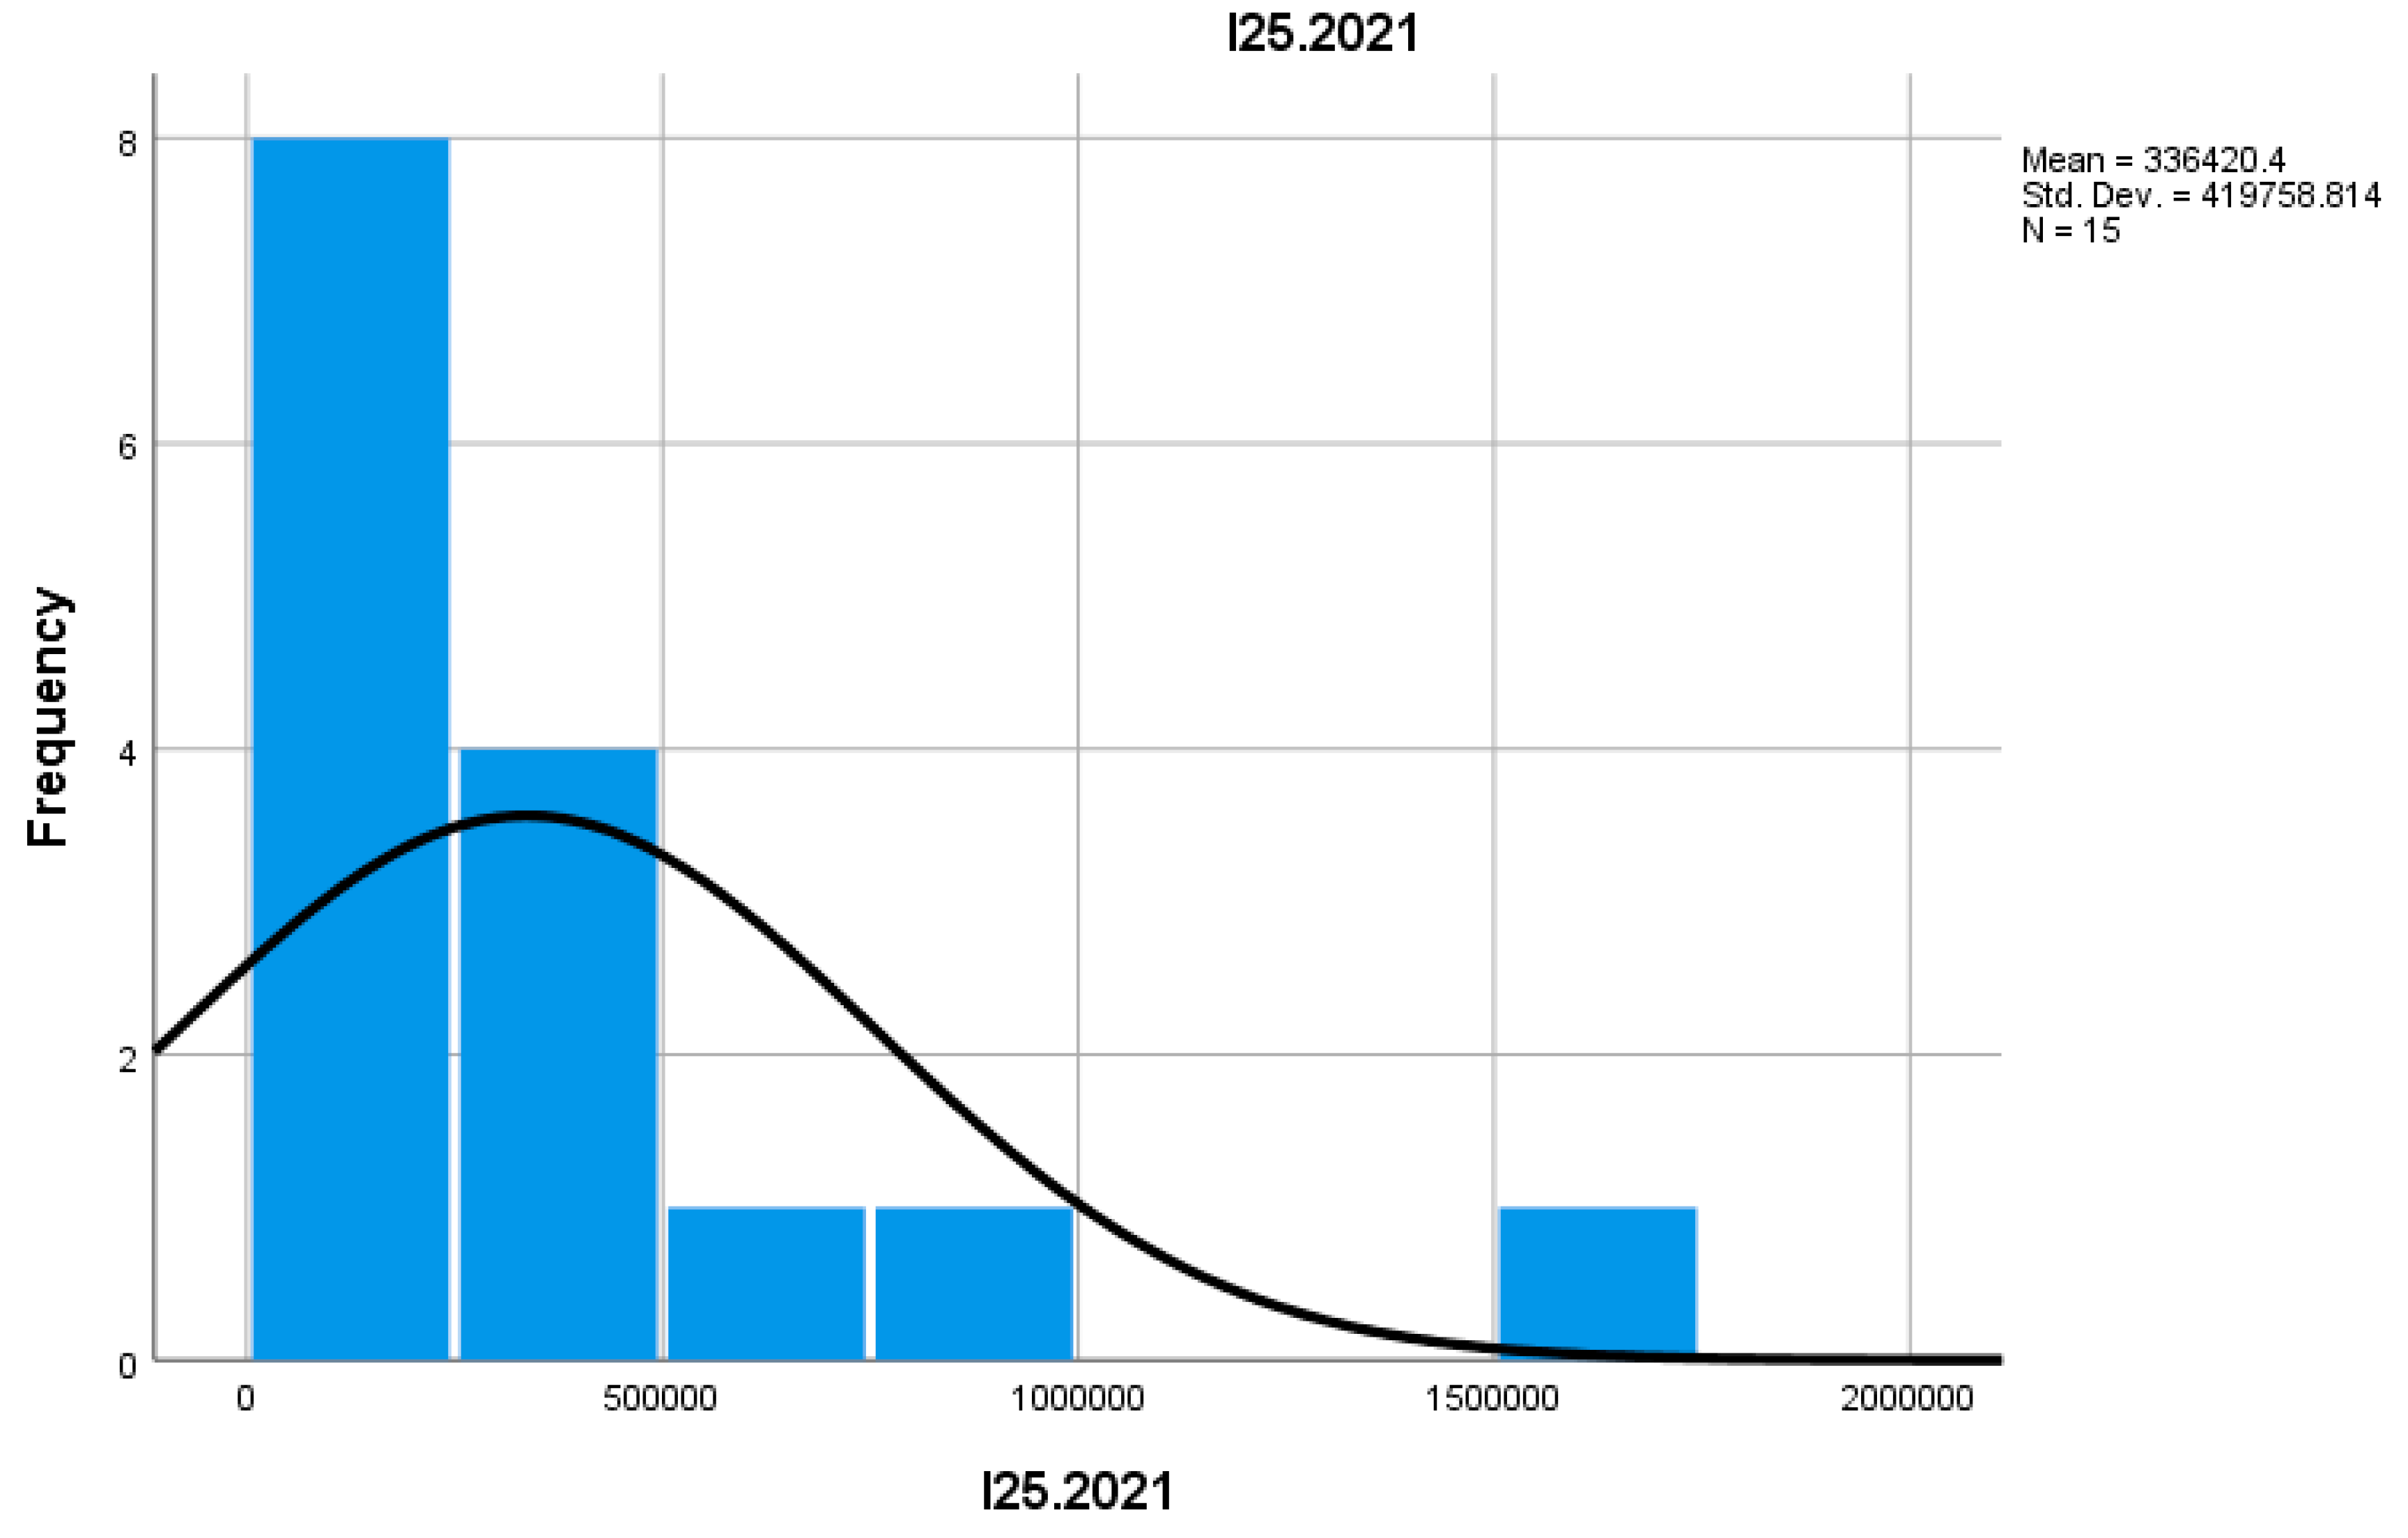
Indicator I25 measures the number of enterprises that recorded an increase in productivity. In 2022, this number was higher than in 2021, suggesting an improvement in efficiency and performance in mountain businesses. This could reflect investments in new technologies, more efficient production processes, or better resource management in mountain commerce, contributing to their increased competitiveness in the market.
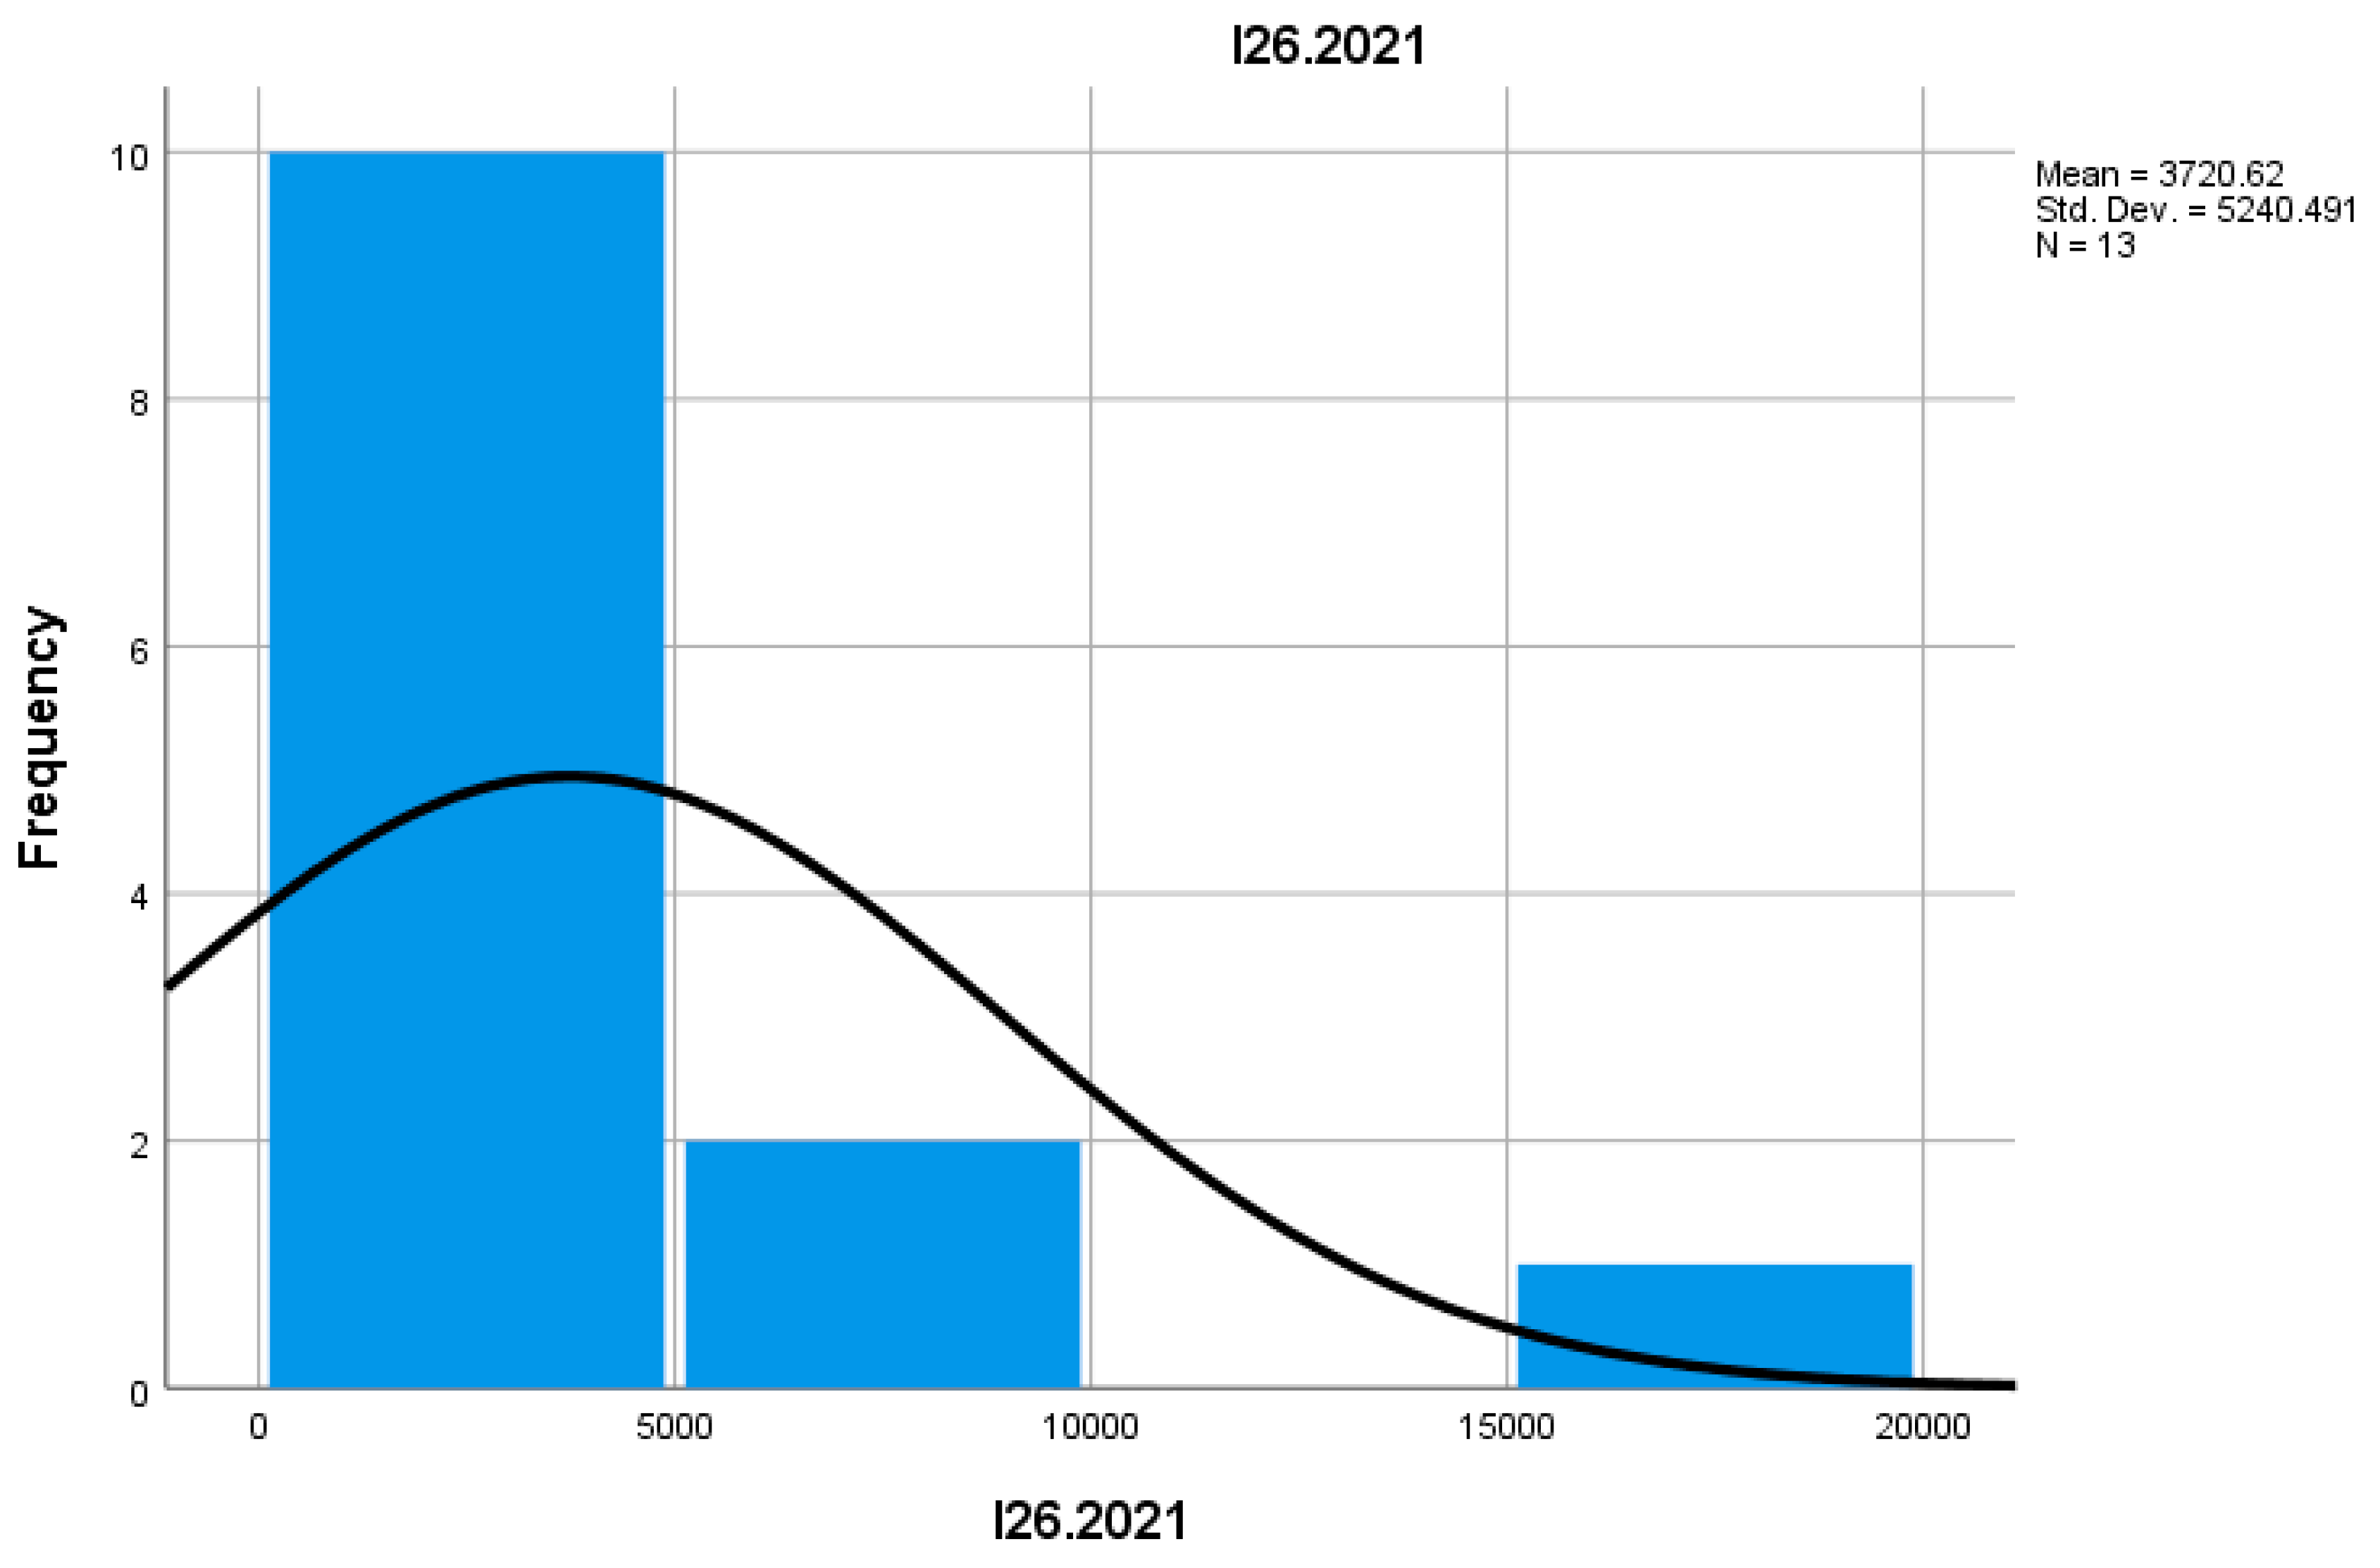
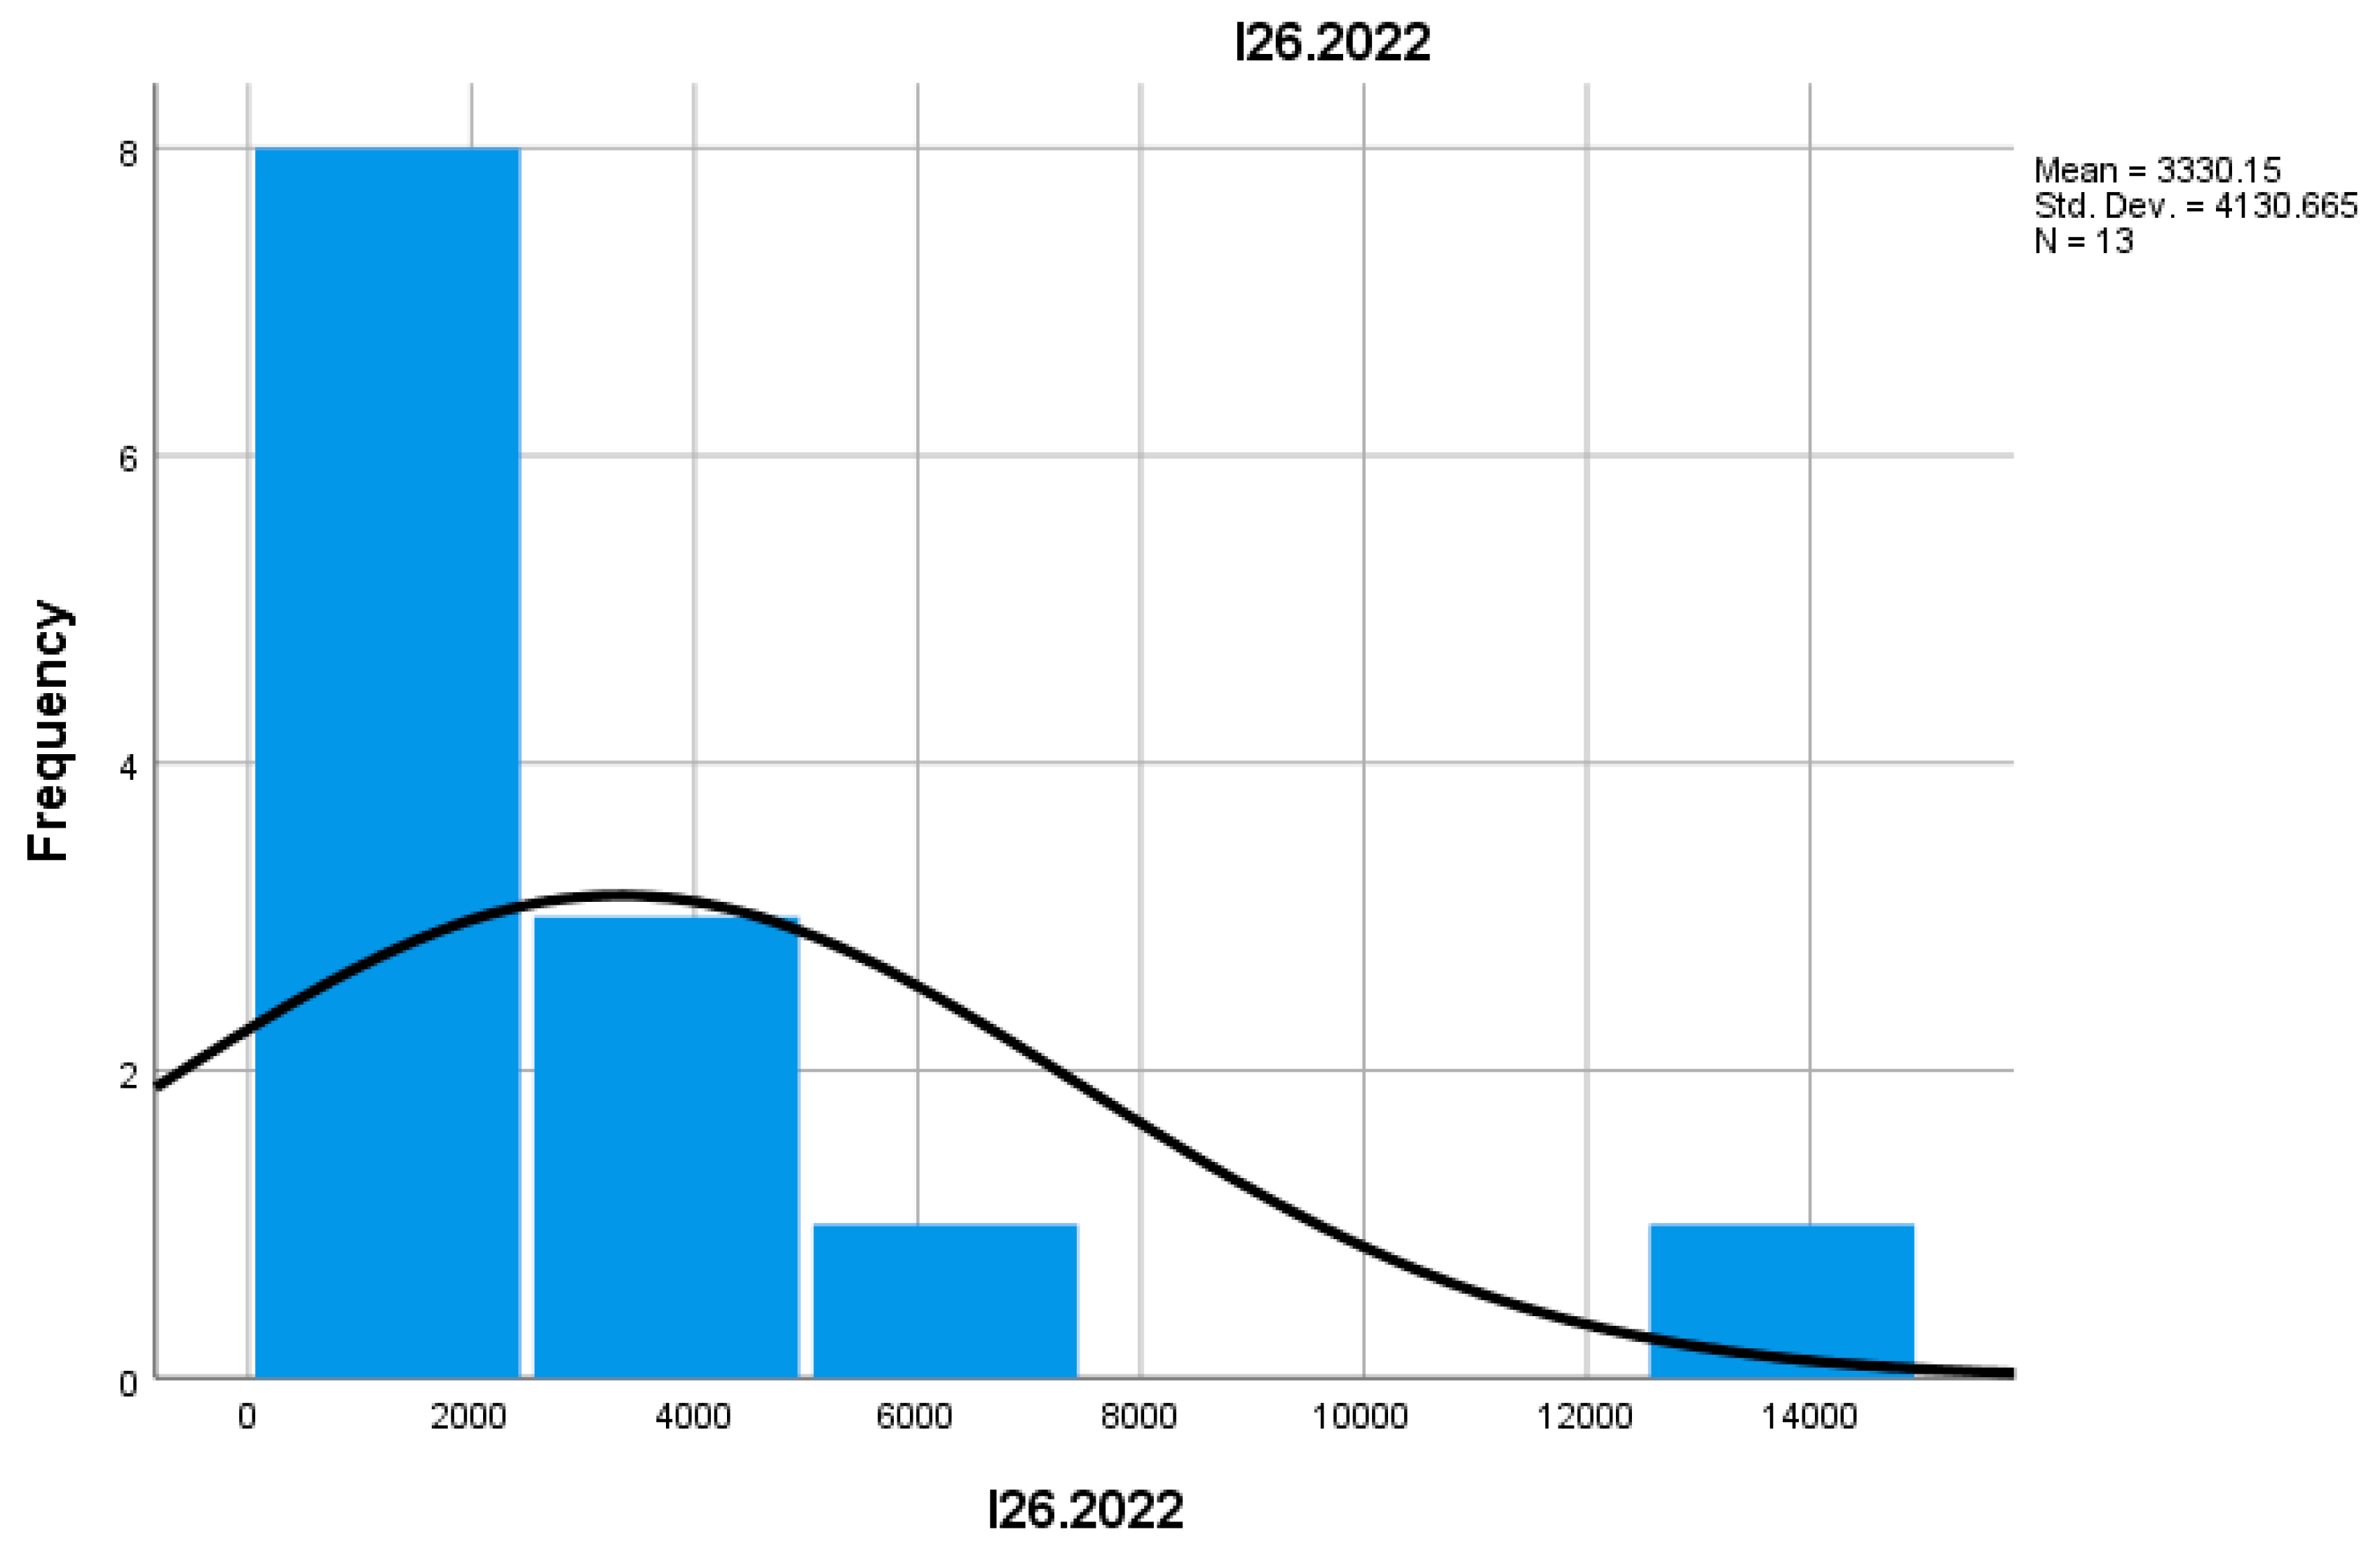
Indicator I26 reflects the proportion of enterprises with increased productivity in total active enterprises. In 2022, this proportion was higher compared to 2021, suggesting a positive trend in economic performance and efficiency in the mountain commerce sector. These enterprises are undergoing modernization and adaptation to market requirements, generating significant added value for the local economy.
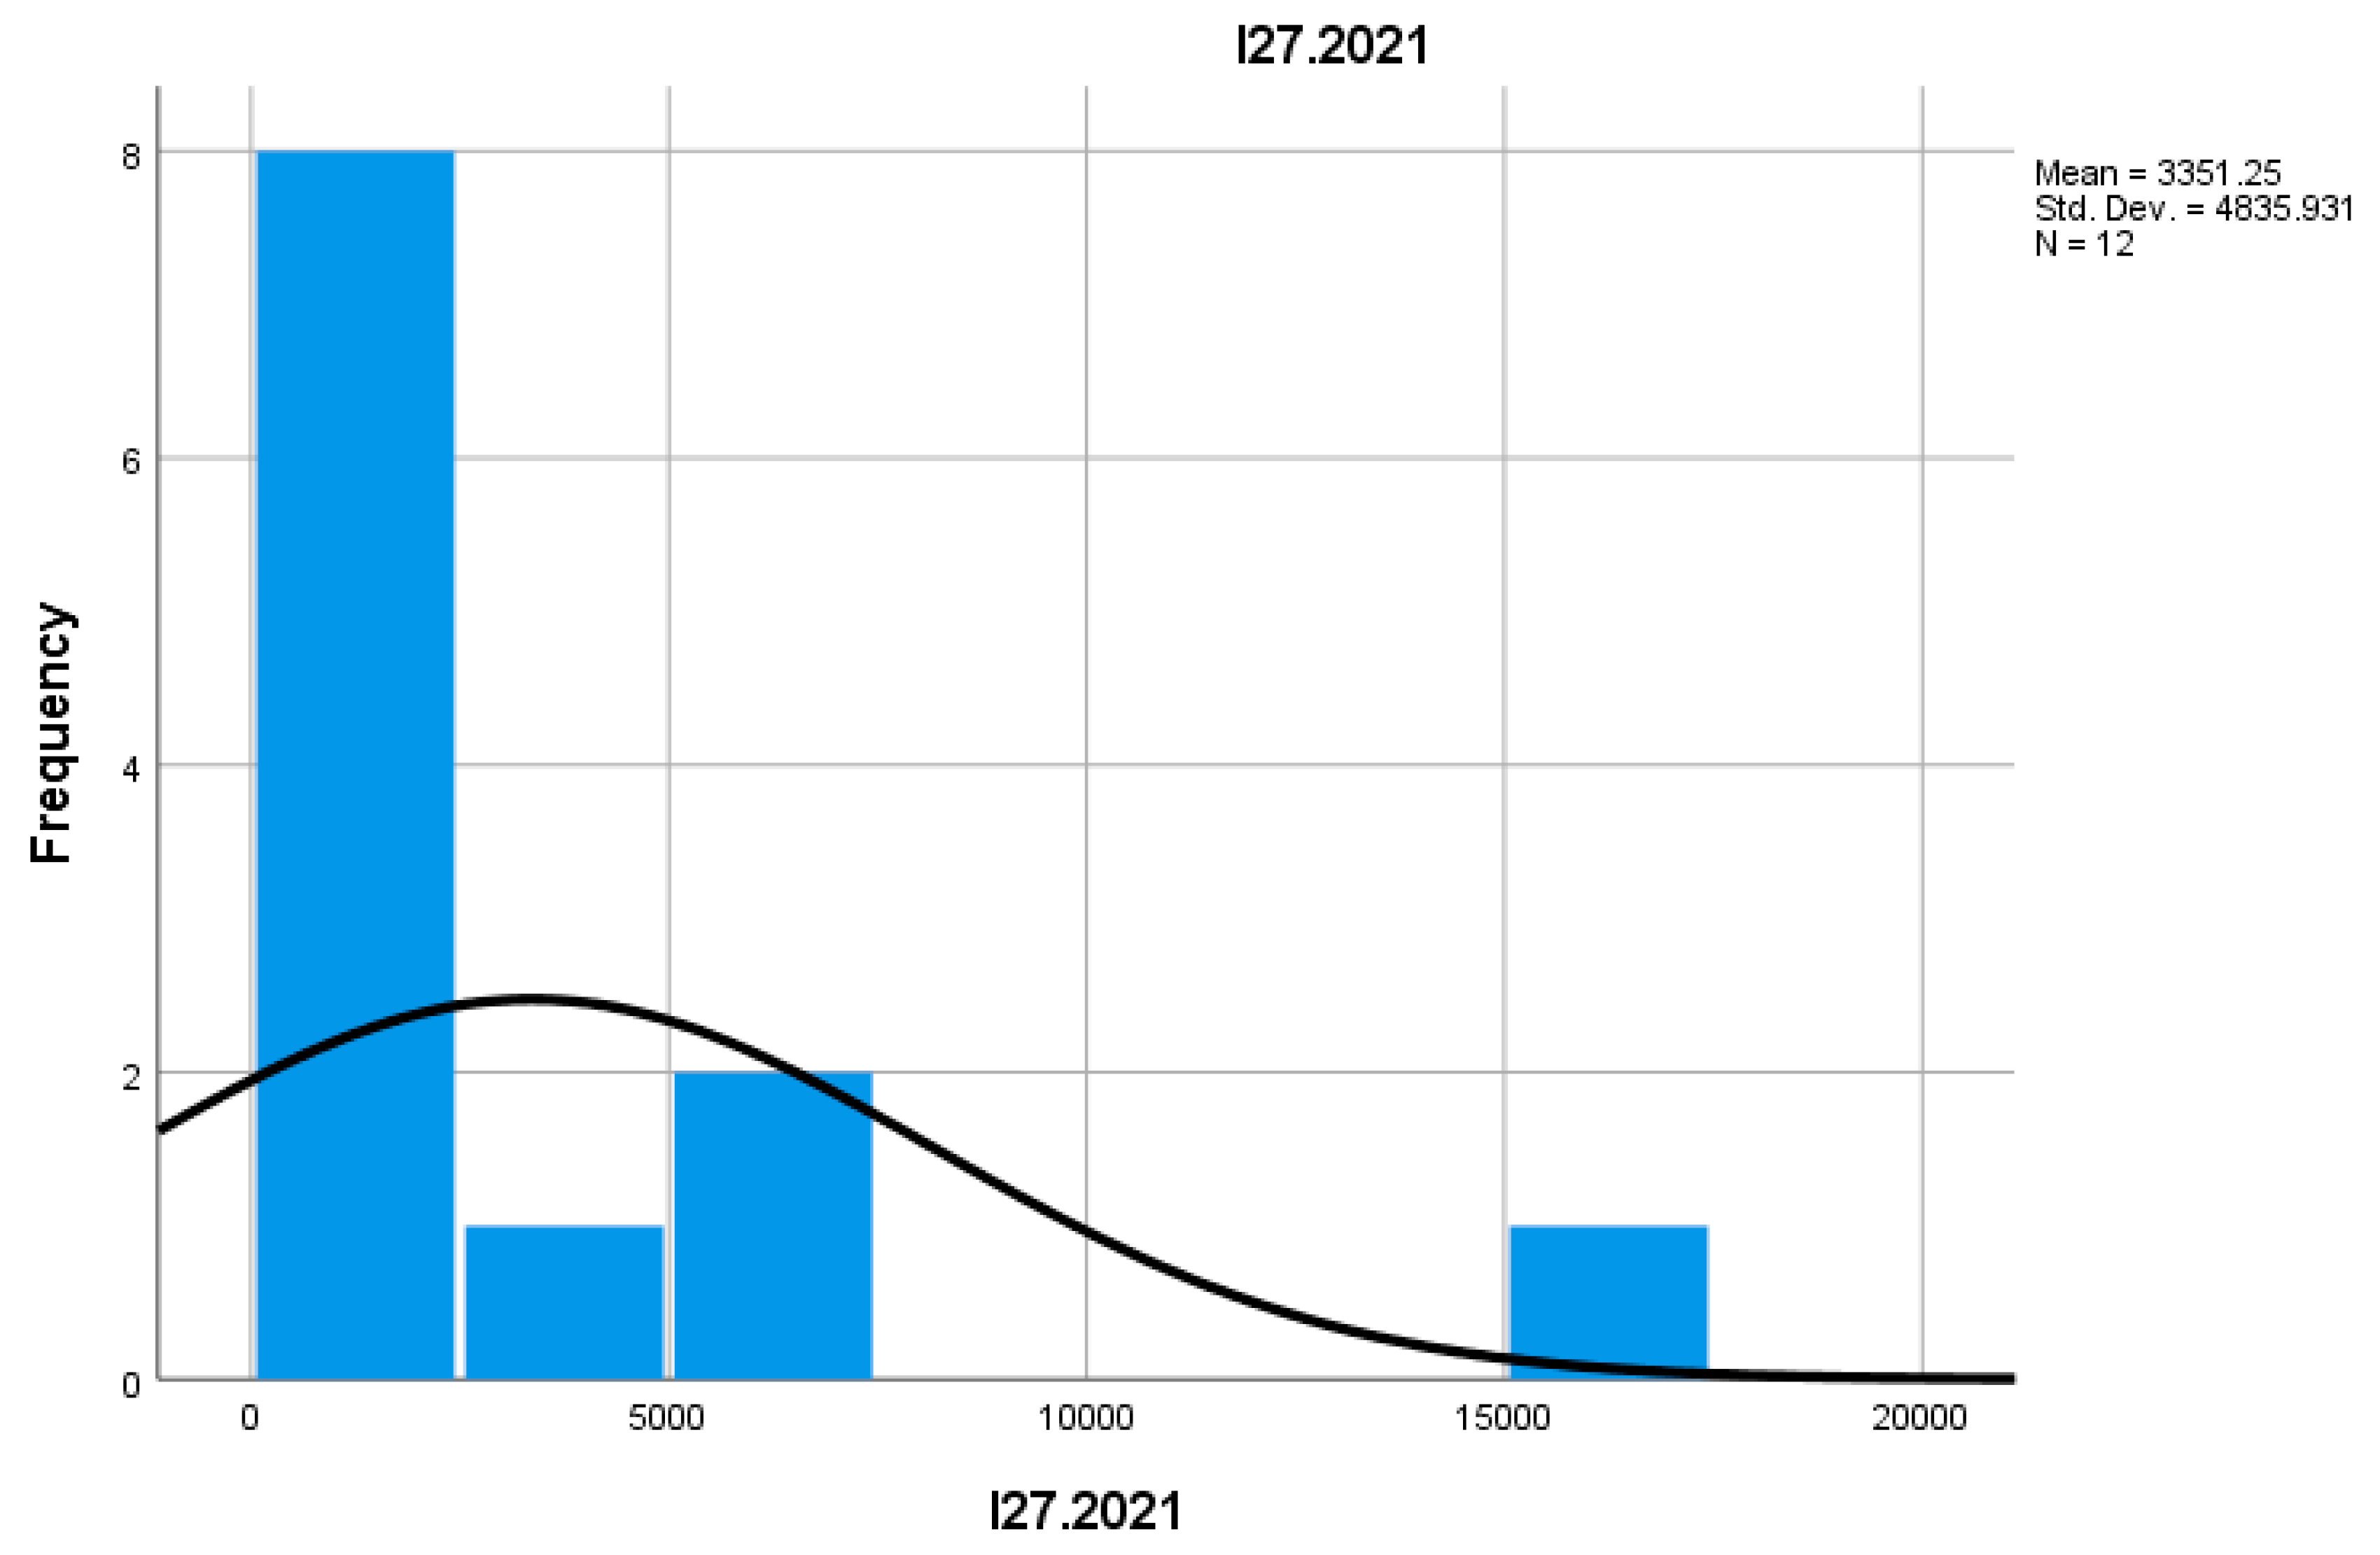
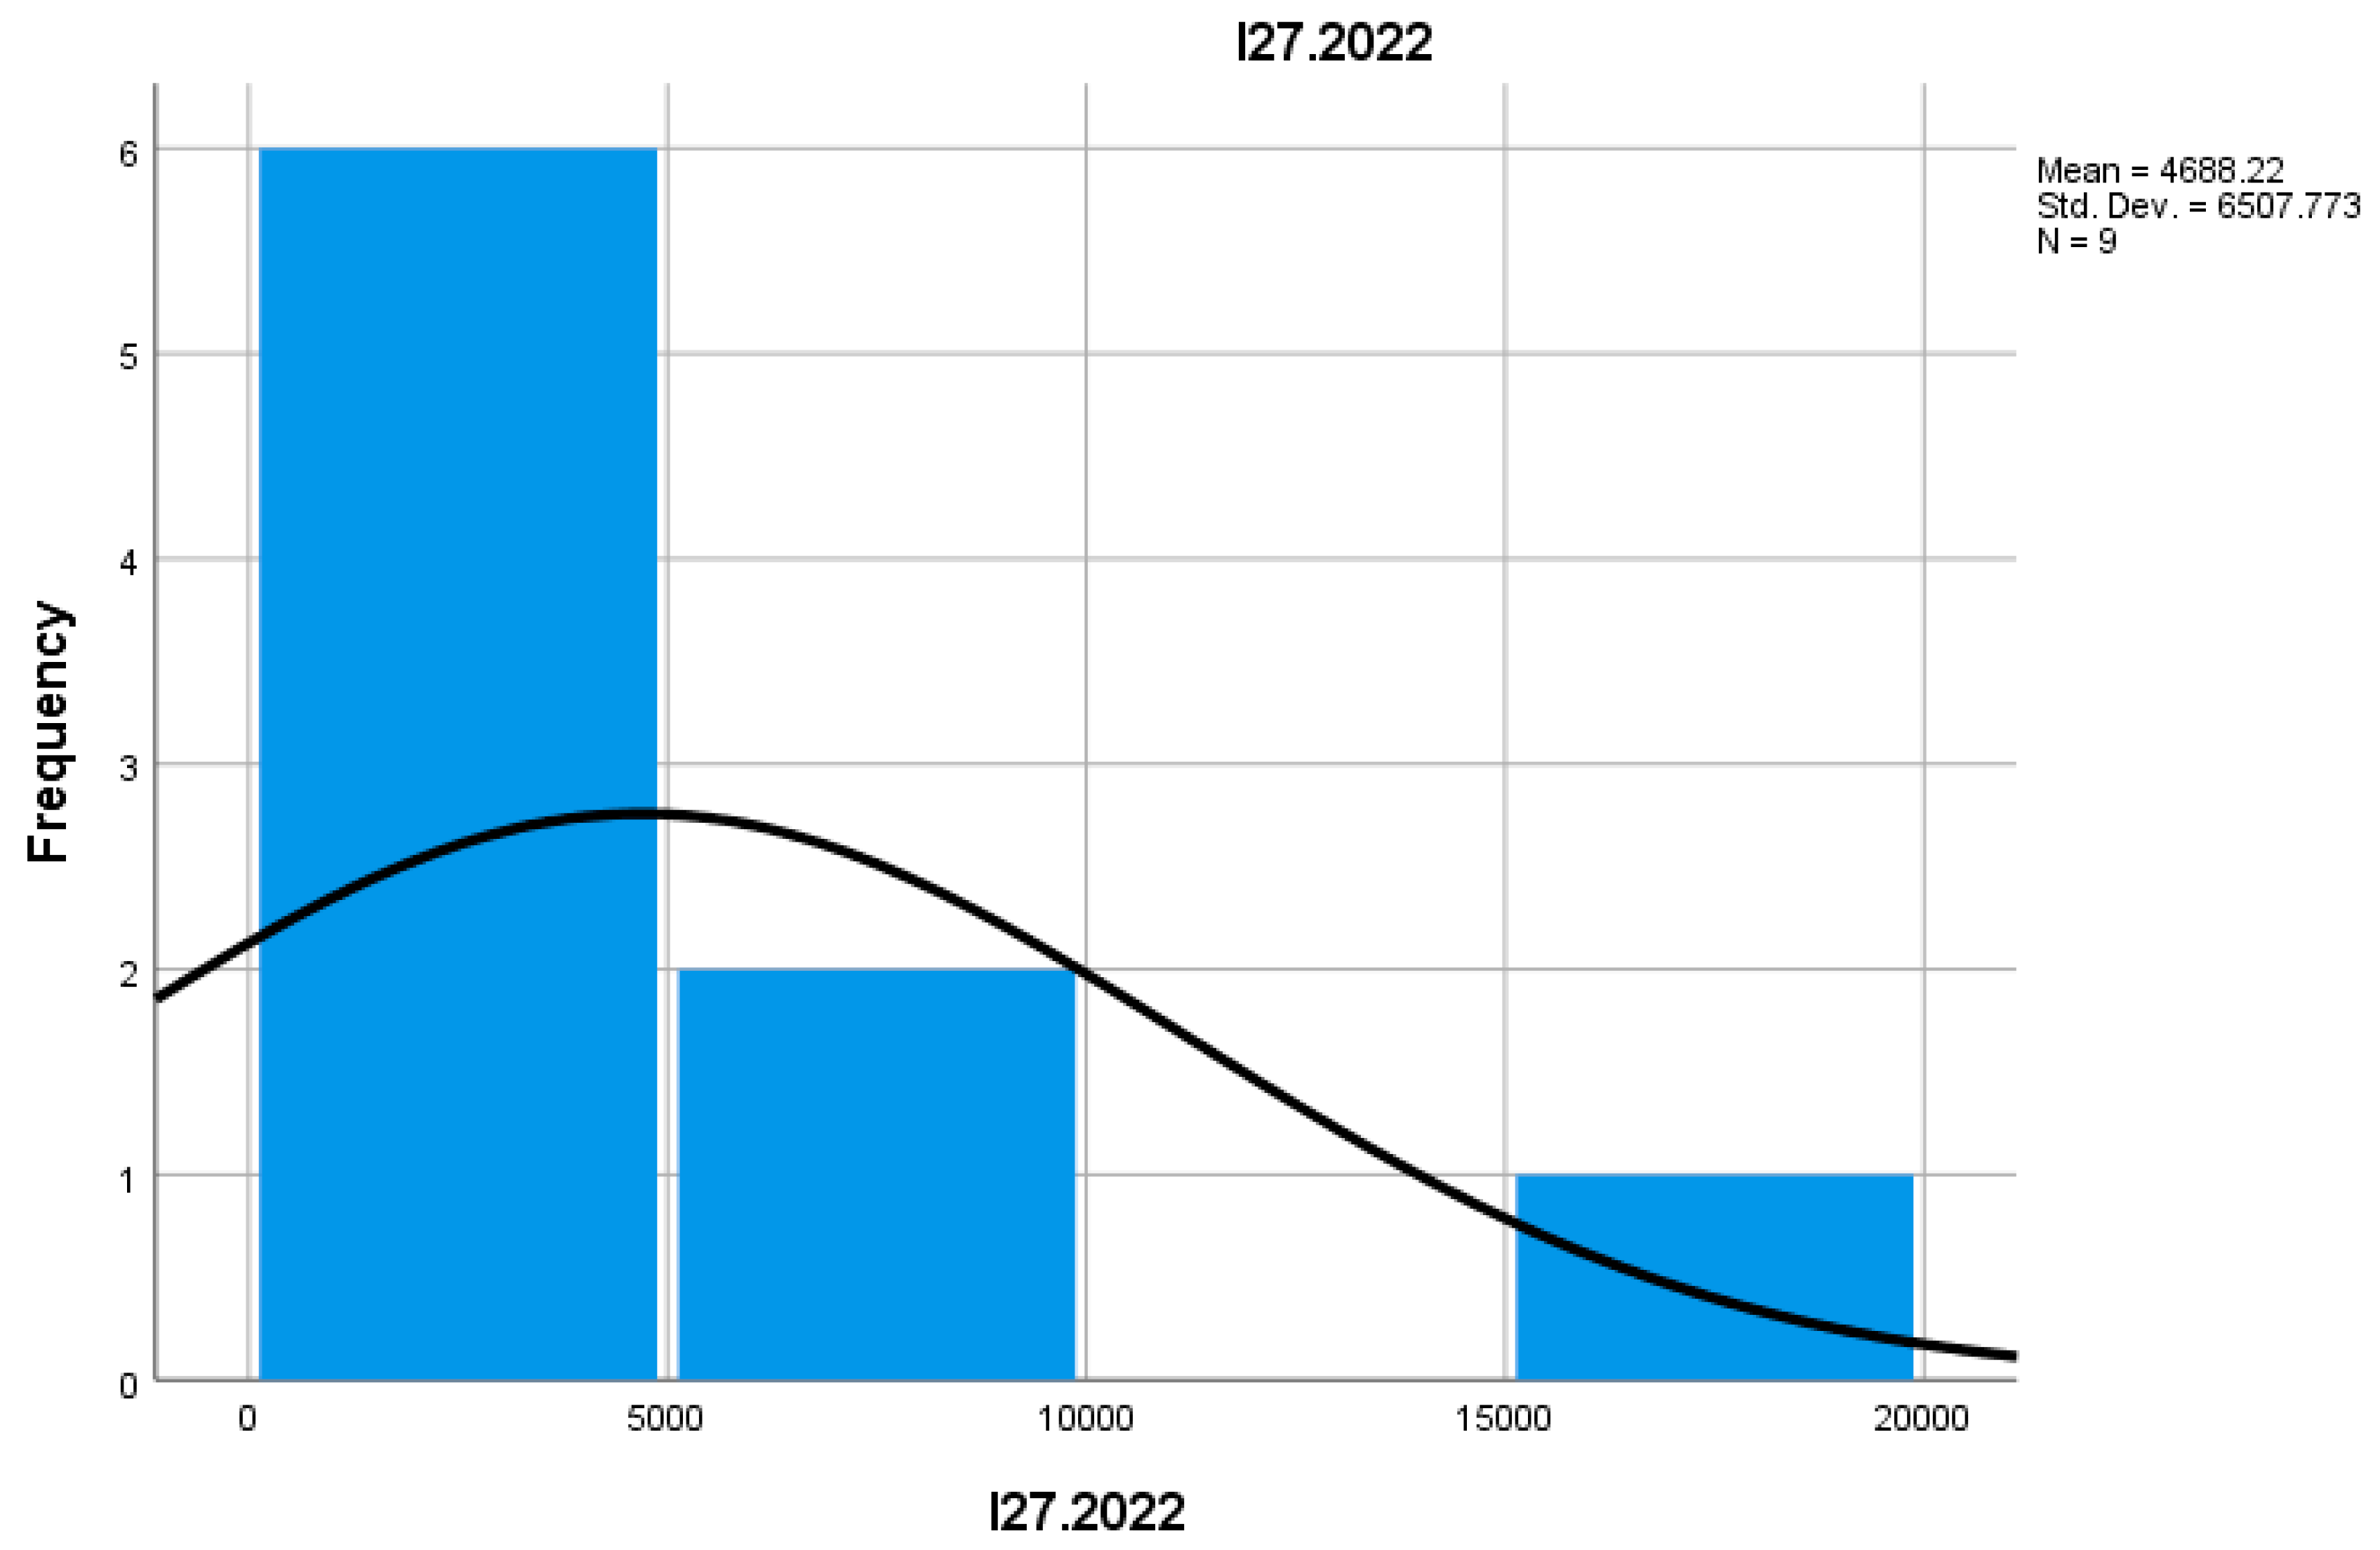
Indicator I27 measures the number of employees in enterprises that recorded an increase in productivity. In 2022, the number of employees in these enterprises increased compared to 2021, suggesting that mountain businesses that succeeded in increasing productivity generated additional jobs and had a positive impact on employment. This may indicate alignment with market demands and more efficient management of human resources.
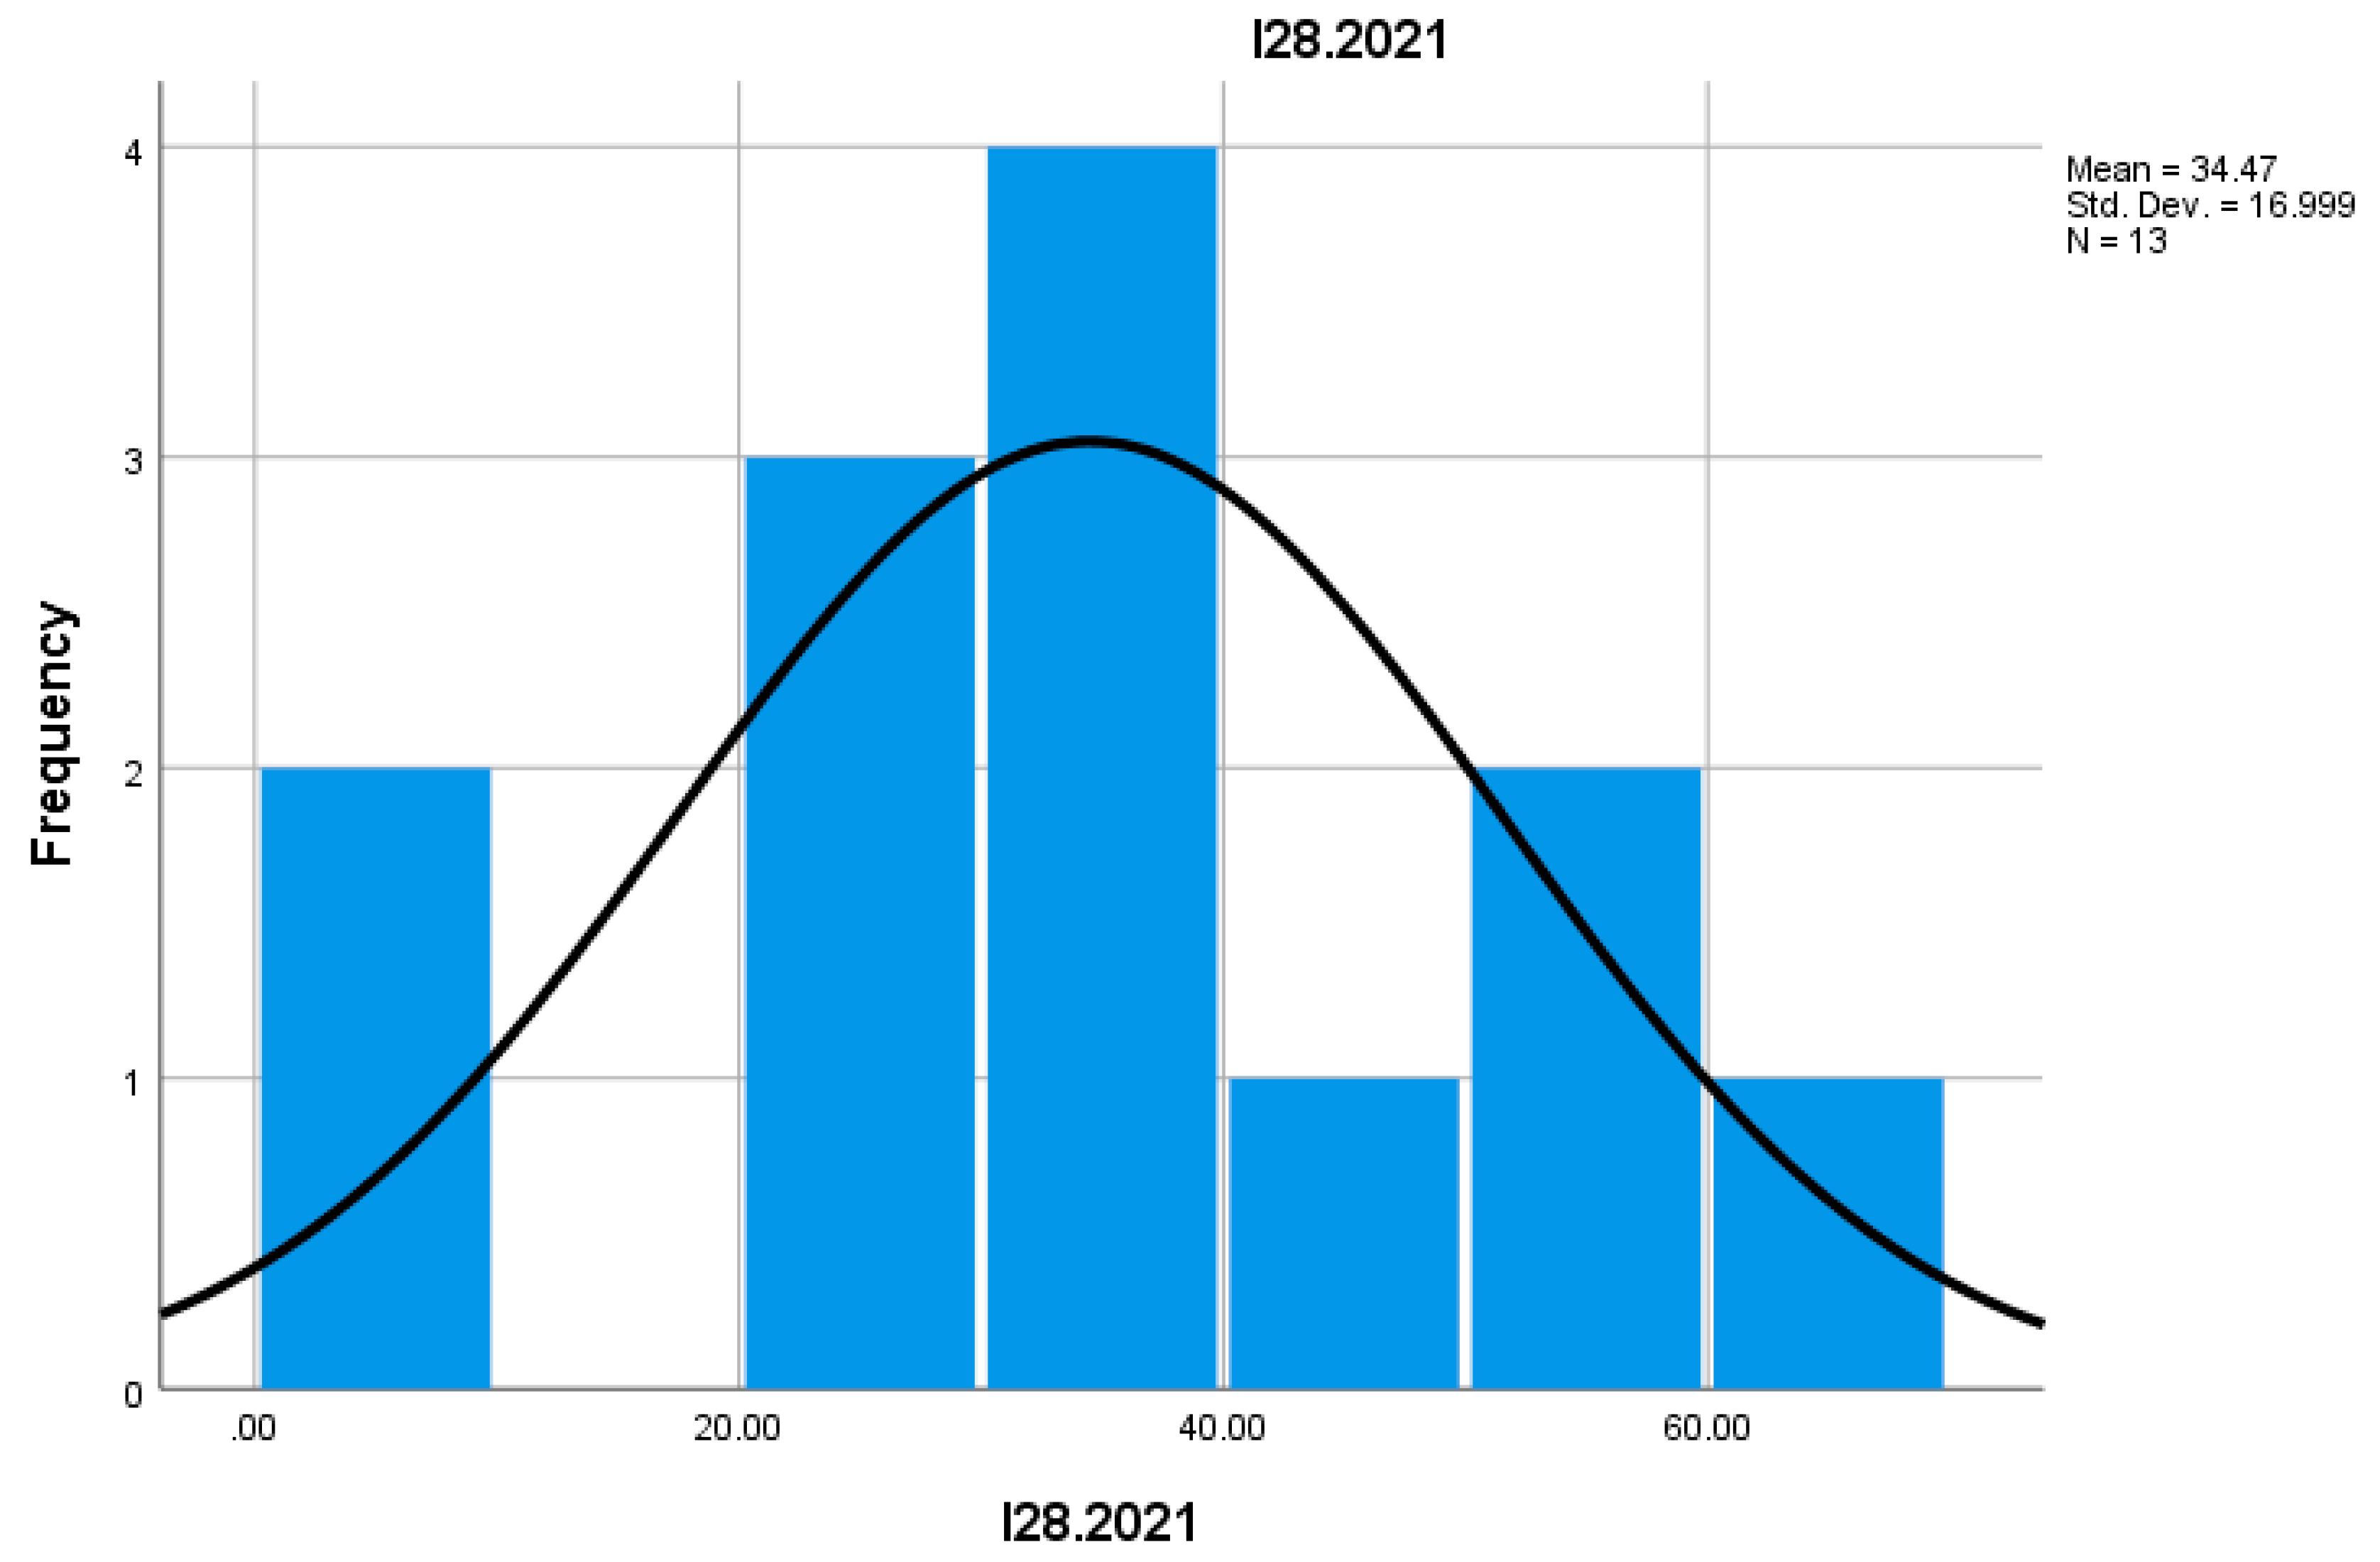
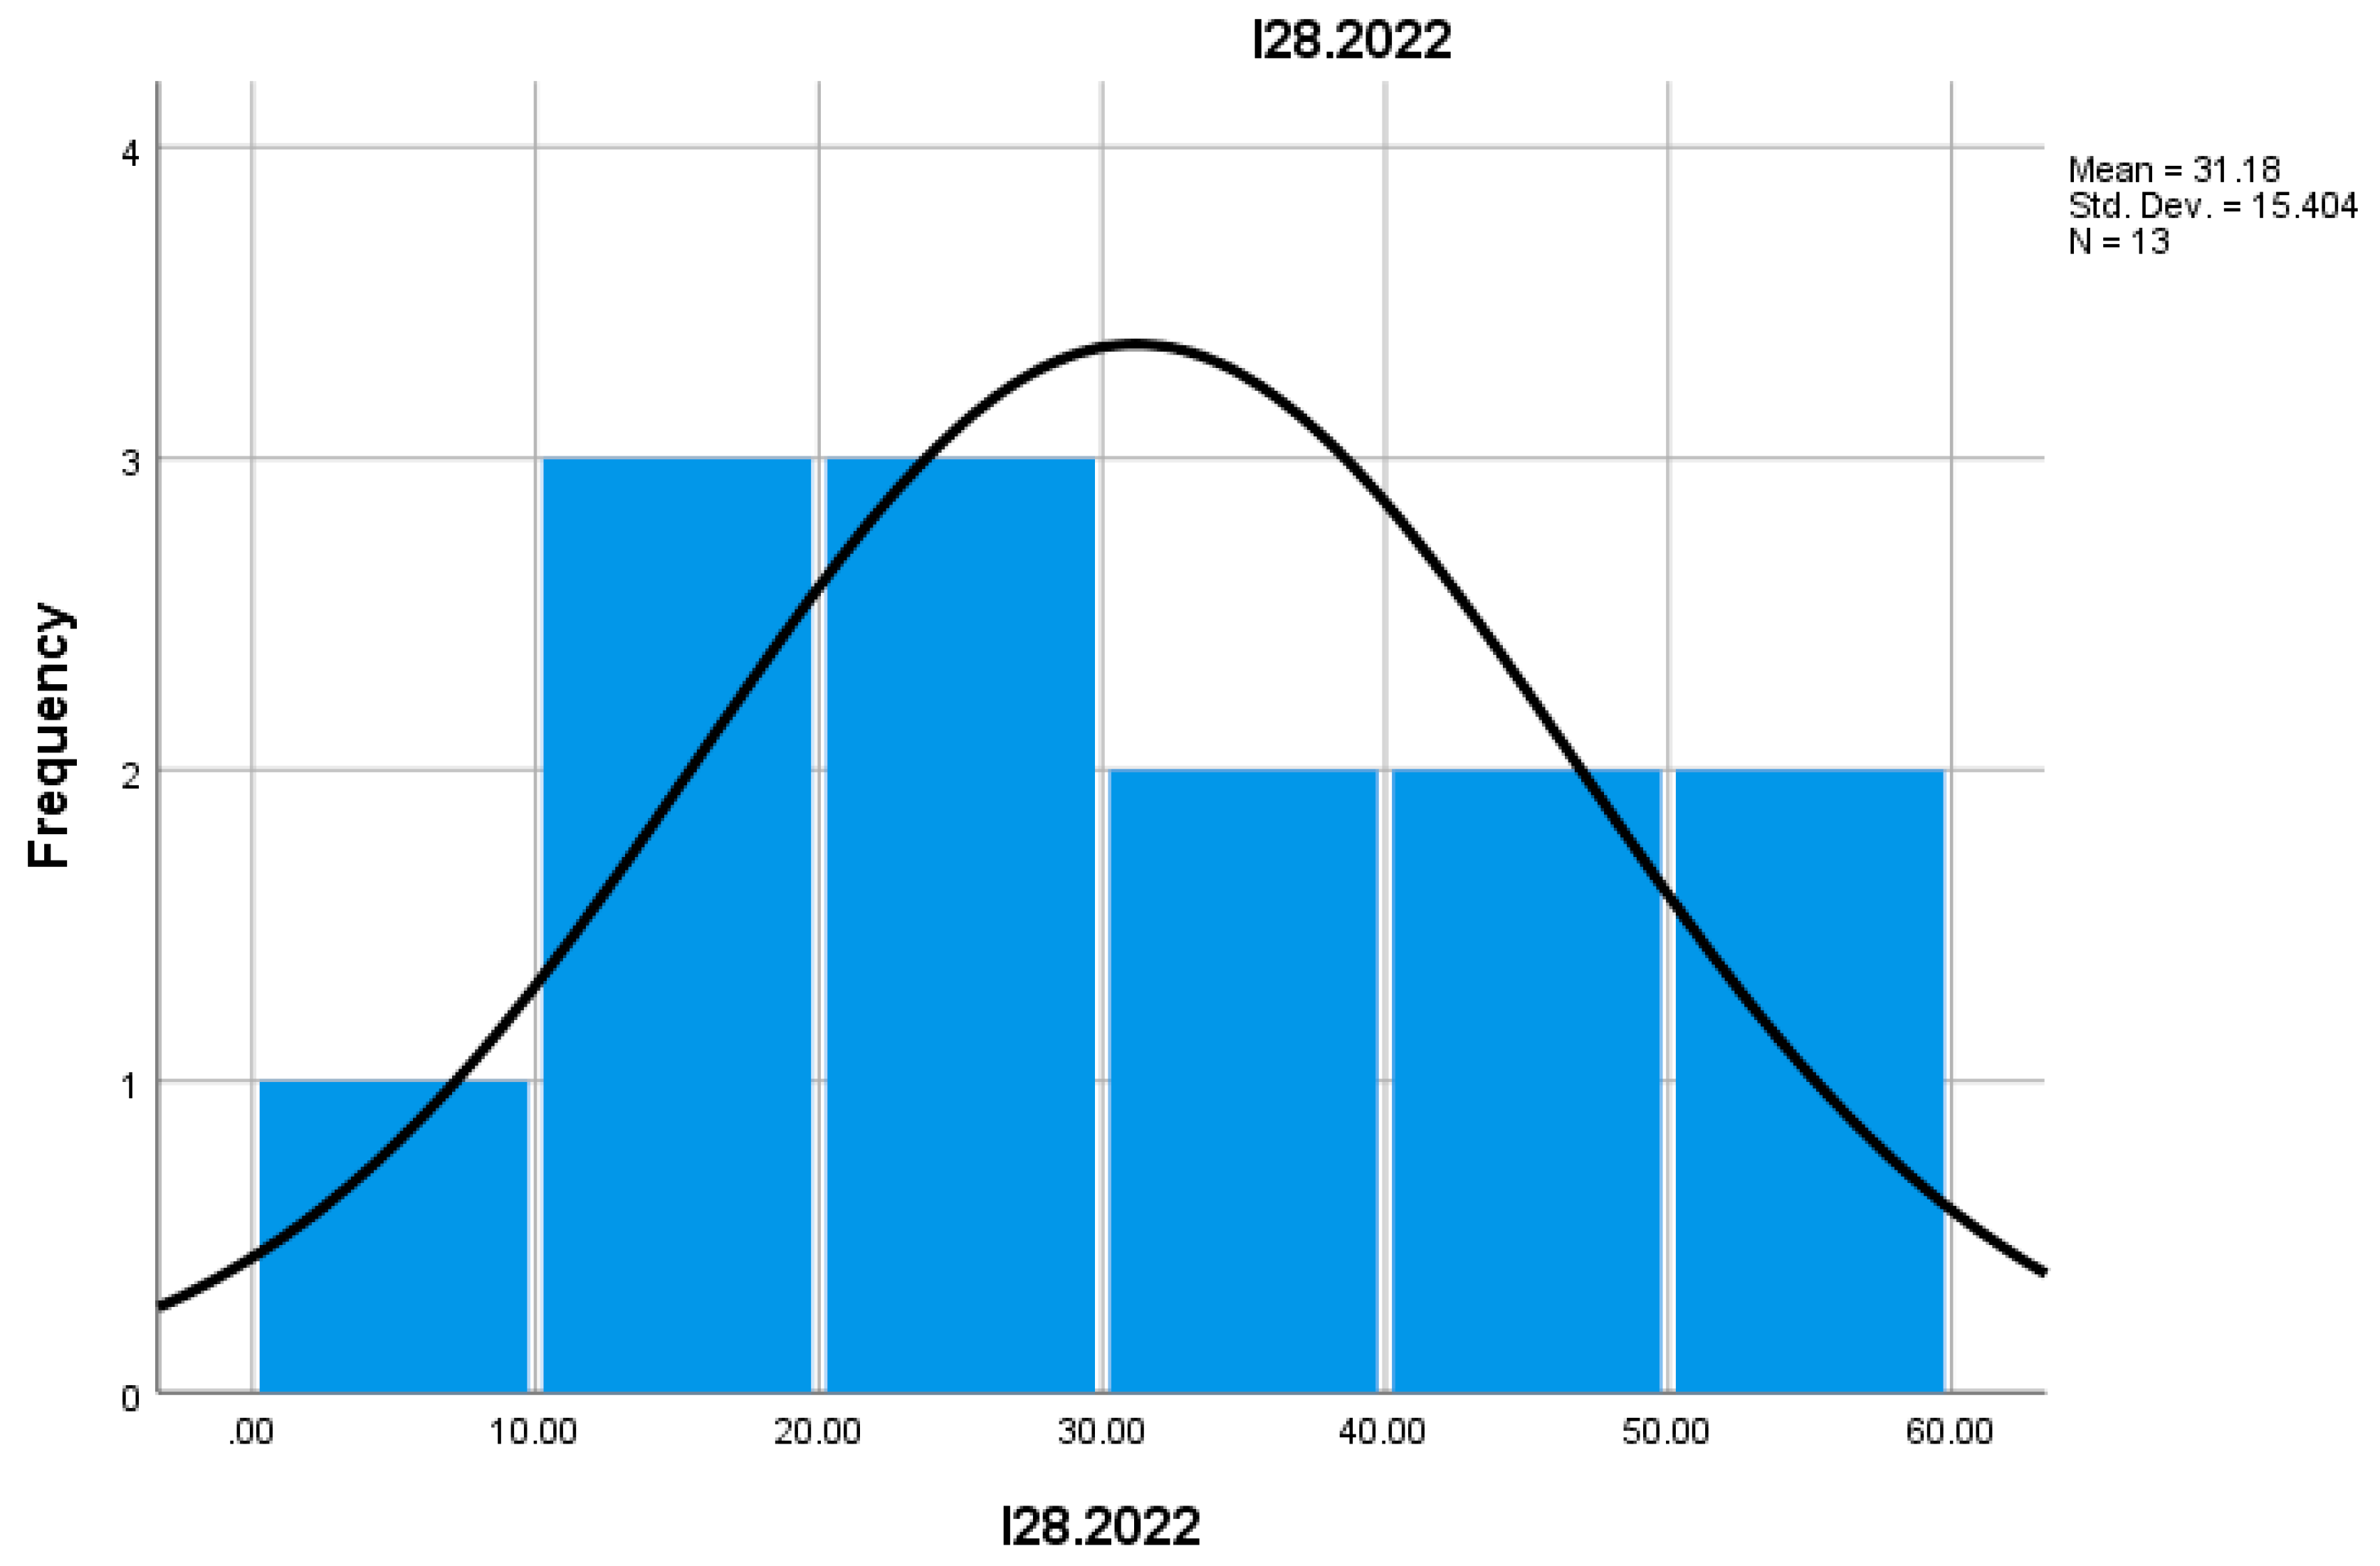
Indicator I28 measures the number of enterprises that recorded a decrease in productivity. In 2022, this number was higher than in 2021, suggesting difficulties in adapting to market changes or implementing new technologies. These enterprises face economic challenges, being less able to improve efficiency or diversify their offer to meet the changing demands of the mountain market.
Results
In the research, statistical indicators were used to analyze data regarding commercial mountain entrepreneurship in Europe during 2021-2022 (tables and figures). Each indicator was evaluated through a series of descriptive statistics, with the goal of identifying trends and significant variations between different periods.
In 2021 and 2022, the total number of businesses (I1) in the mountain commerce sector showed a consistent evolution, with approximately 119,000 businesses in both periods. This suggests stability in the entrepreneurial structure of the mountain areas, which could reflect the adaptation of local entrepreneurs to the economic and market conditions specific to this sector.
The median for I1 ranged between 56,801.00 and 58,166.00, indicating a relatively stable distribution of the data. This suggests that half of the commercial mountain entrepreneurs in Europe recorded values close to these amounts, with a slight increase in 2022. The standard deviation is significant (155,463.76 in 2021 and 154,459.68 in 2022), indicating a large dispersion of values compared to the calculated average. This may reflect significant differences between mountain regions and the types of businesses in various areas of Europe.
In the short-term analysis (2021-2022), there were no significant fluctuations in the number of businesses, which may indicate sustainable development and efficient management of businesses in mountain commerce areas.
The business birth rate (I2) was lower in 2022 compared to 2021, decreasing from 9,020 newly established businesses in 2021 to approximately 8,230 in 2022. This may suggest a stagnation in the interest for new entrepreneurial initiatives in the mountain commerce sector, possibly due to economic difficulties or uncertainties caused by environmental conditions and regulations in this area.
The mean for I2 decreased slightly from 9,020.33 in 2021 to 8,231.47 in 2022. This decline suggests a reduction in the values of this indicator in the mountain commercial entrepreneurship sector, possibly due to economic diversification and a decline in seasonal economic activities. The standard deviation ranged between 11,167.51 and 9,777.25, indicating some variation between observed values. This reflects fluctuations in mountain commercial activities, with a slight decrease in 2022.
However, the relatively constant value of the indicator suggests that, despite challenges, there is a steady flow of new businesses starting to operate in this sector, though without significant growth.
The size of newly established businesses (I3), measured by the average number of employees per business, was approximately 1.19 in 2021 and 1.17 in 2022, indicating a consistent trend of starting small businesses in the mountain commerce sector. This can be explained by the specificity of mountain areas, where entrepreneurs prefer to start businesses with a small number of employees, allowing them to quickly adapt to market demands and minimize risks.
The mean for I3 decreased slightly from 1.1886 in 2021 to 1.1657 in 2022, suggesting a stabilization of this indicator. This may reflect the standardization of economic conditions in European mountain regions. The standard deviation for I3 is small (0.2356 in 2021 and 0.3304 in 2022), indicating that the data is relatively concentrated around the average value, with no significant fluctuations.
It is important to note that despite the small size of these businesses, their success largely depends on their adaptability to local economic demands and integration into regional commercial networks.
The average number of employees in businesses that ceased operations (I4) remained constant, with 1 employee per business in both 2021 and 2022. This suggests that although businesses close, their size remains small, which is characteristic of businesses in mountain areas where resources and markets are limited.
The median for I4 is constant at a value of 1.00 in both 2021 and 2022, showing that most mountain commercial entrepreneurs record values very close to 1.00. This may suggest a standardized behavior among entrepreneurs. The standard deviation for I4 is zero, meaning there is no variation between the observed data for this indicator during this period. This result could reflect the stability of this indicator.
This stability may signal a trend among entrepreneurs to minimize risks by starting small-scale businesses that, in the event of failure, do not significantly impact the local economy.
The indicator for business deaths (I5) showed a slight decrease in 2022 compared to 2021, from 8,371 in 2021 to 9,624 in 2022, suggesting a slight reduction in the failure rate of mountain commerce businesses. This may indicate a consolidation of existing businesses, despite economic and infrastructure challenges.
The mean for I5 significantly increased from 8,371.00 in 2021 to 9,624.33 in 2022, signaling expansion in the mountain commercial sector in Europe. This trend may be interpreted as an increase in economic activities specific to mountain regions. The standard deviation is quite large (11,139.26 in 2021 and 12,629.94 in 2022), suggesting significant variation between the observed values for this indicator. This could reflect economic inequalities between mountain regions.
This phenomenon may also be explained by the fact that some small businesses are able to adapt their business models to meet market demands, allowing them to survive longer than businesses in other economic sectors.
The average size of businesses that survived for 3 years (I6) remained constant at 1 employee per business in both 2021 and 2022. This may reflect a trend of maintaining small and sustainable businesses that effectively adapt to difficult economic conditions in mountain areas.
This value suggests that, despite the challenges faced by mountain entrepreneurs, they manage to sustain viable businesses over the medium term, which could be crucial for the economic stability of the region.
The mean for I6 slightly decreased from 46.0487 in 2021 to 44.3480 in 2022, indicating a slight decrease in this indicator. This could be related to external economic factors, such as economic crises or seasonal changes. The standard deviation is large (45.39 in 2021 and 44.63 in 2022), suggesting considerable variability in the data and significant dispersion from the calculated mean.
Mountain commerce sales volume showed a slight increase in 2021 compared to 2020, rising from 3.5 million lei in 2021 to 3.8 million lei in 2022. This growth can be attributed to higher demand for local products, fueled by increased tourism and diversification of commercial offerings. Despite this advance, it is important to note that seasonal fluctuations in demand influence sales volume, with sales peaks occurring during holiday periods or in the winter and summer seasons.
Additionally, even with a moderate increase in sales volume, the mountain commerce sector faces challenges related to high operating costs, which may affect the profitability of smaller businesses. However, businesses that have adopted digital solutions for online sales have seen significant increases in revenue.
Profitability in the mountain commerce sector (I7) has generally been modest, with a profit rate of approximately 5-7% in 2021 and 2022. This reflects, on the one hand, high operating costs such as seasonal labor expenses and logistical costs in isolated mountain areas, and on the other hand, the small profit margins typical of traditional product commerce. Nevertheless, a significant number of businesses have managed to maintain profitability through service diversification and expanding their customer base.
Profitability growth in this sector depends on entrepreneurs' ability to manage resources efficiently, attract long-term tourists to their businesses, and integrate technologies that enhance operational efficiency. Therefore, diversification and better-targeted marketing strategies could contribute to improved profitability in mountain businesses.
Access to finance in the mountain commerce sector, I8, remains limited in 2021 and 2022, with approximately 30% of mountain entrepreneurs having access to external financing sources, either through bank loans, EU funds, or other support mechanisms. Most entrepreneurs who failed to secure funding reported difficulties in meeting the requirements of banks and other financial institutions, as well as the lack of necessary guarantees.
However, there is a significant opportunity for mountain entrepreneurs to benefit from European funds dedicated to rural and regional development. Additionally, local initiatives aimed at supporting small and medium-sized enterprises could facilitate access to financial resources, thus supporting the sustainable development of mountain businesses.
The indicator for fast-growing enterprises, I10, showed a slight positive trend in 2022, with approximately 4,761 businesses compared to 4,765 in 2021. This stability suggests a consistent adaptation to market demands but does not necessarily indicate a massive expansion of these businesses. This trend of moderate growth reflects the characteristics of the mountain economy, where business development can be constrained by factors such as poor infrastructure and limited financial resources.
The churn rate, I12, which combines the birth and death of businesses, was approximately 46% in 2021 and 44% in 2022. This indicates moderate volatility in the mountain commerce sector, with a significant number of businesses being established and closed each year. This volatility may reflect the economic challenges and environmental conditions specific to the mountain region, as well as the fact that local entrepreneurs may be more likely to experiment with new businesses due to limited resources and associated risks.
The business birth rate, I13, was lower in 2022 compared to 2021, which suggests a possible decline in confidence regarding economic opportunities in mountain areas. However, the value remains relatively stable, signaling overall stability in entrepreneurs’ intentions to establish commercial businesses. This may represent a response to more challenging economic conditions or uncertainties in infrastructure and access to external markets.
In the mountain commerce sector, the innovation rate of businesses, I14, was 9% in 2021 and 8.5% in 2022. These values suggest a moderate trend of innovation among entrepreneurs in mountain areas. While innovation is not at a high level, there is a constant desire to adapt products and services to customer needs and local economic conditions. In the context of mountain entrepreneurship, most small and medium-sized enterprises are traditionally less inclined to make significant investments in technological innovations. However, in some niche sectors, such as the trade of local or eco-friendly products, innovation plays a crucial role in attracting clients from the tourism or ecotourism industries.
Investments in employee training and development, I15, were relatively low in 2021 and 2022, with an average value of approximately 0.8% of annual business revenues. This suggests that most entrepreneurs in the mountain commerce sector invest little in employee training, likely due to limited financial resources and the small scale of their businesses. However, there is an emerging trend of investing in employee training when necessary, especially in sales and customer relations, as this sector relies heavily on close relationships with consumers, particularly in the mountain tourism environment.
The profitability of mountain businesses, I16, remained steady in 2021 and 2022, with an average profit of around 5,000 euros per business. This value suggests that most businesses in mountain areas operate on a small scale but are capable of generating modest profits. It may also indicate prudent resource management and the ability to adapt to local market demands. Although profitability is relatively modest, commercial enterprises in mountain areas manage to survive in the long term, which can be seen as a sign of the sustainability of this type of business in these regions. This situation may be explained by the fact that, although profit margins are small, operational costs are also low due to the small size of the businesses.
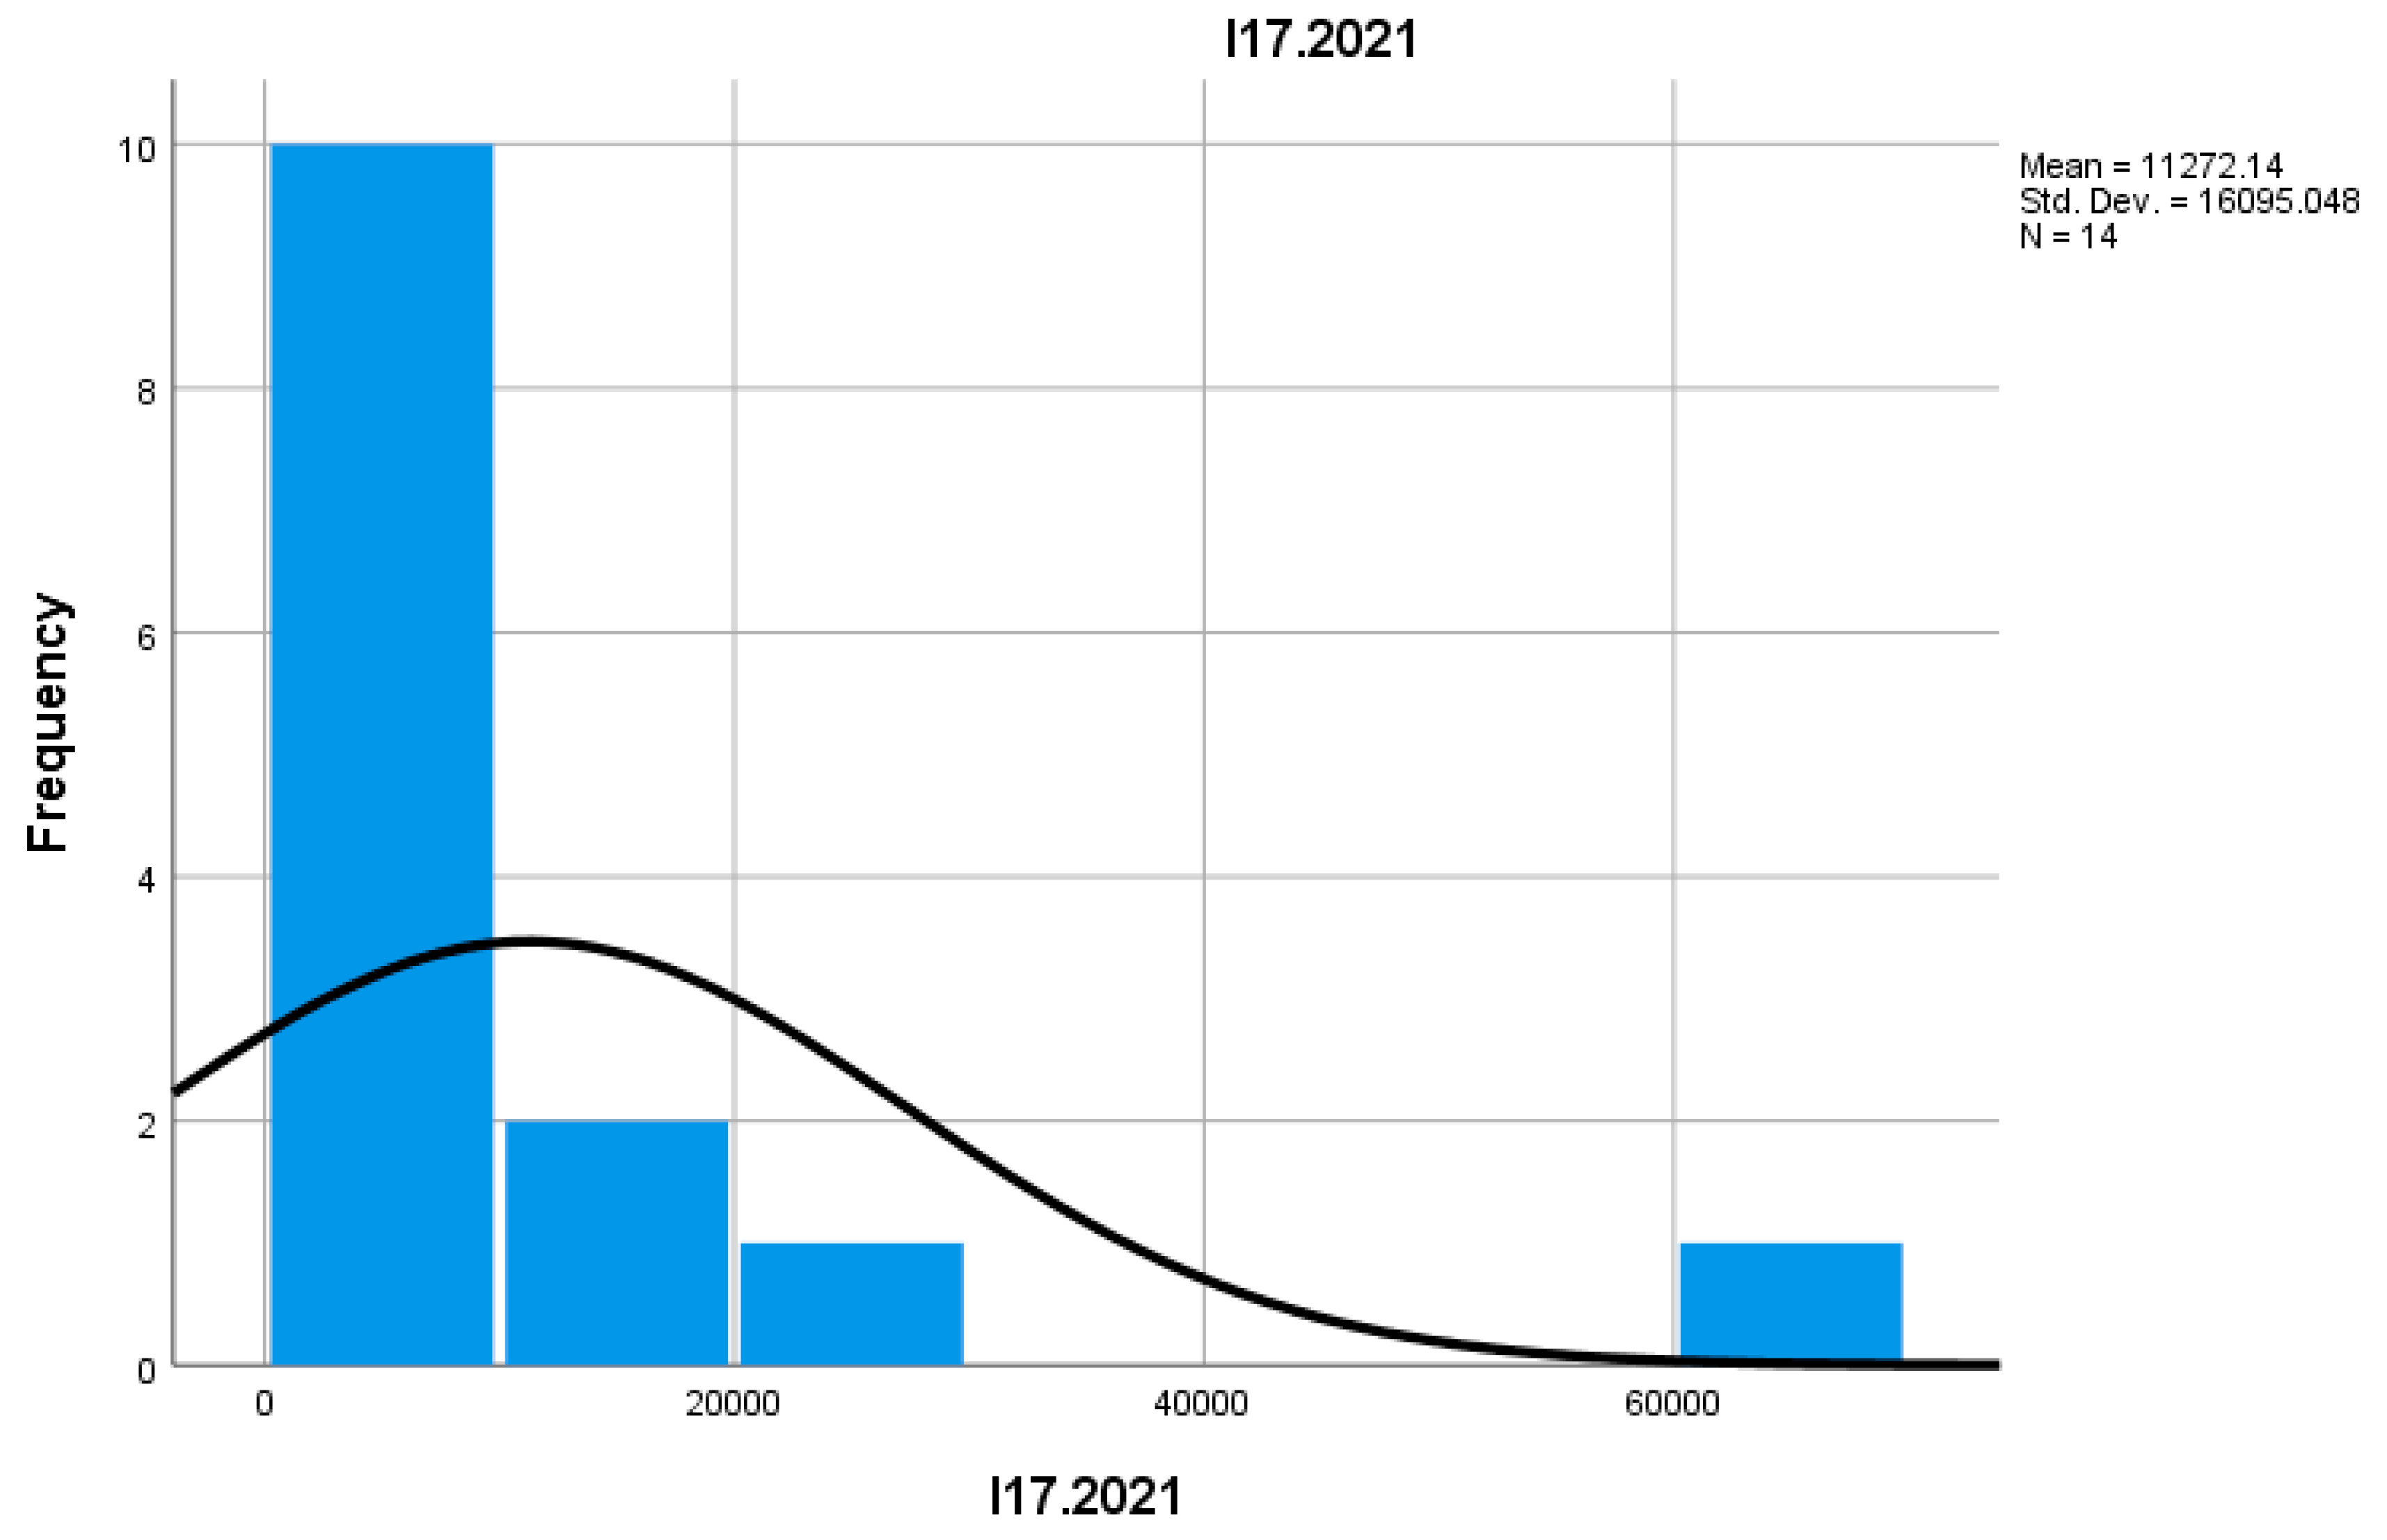
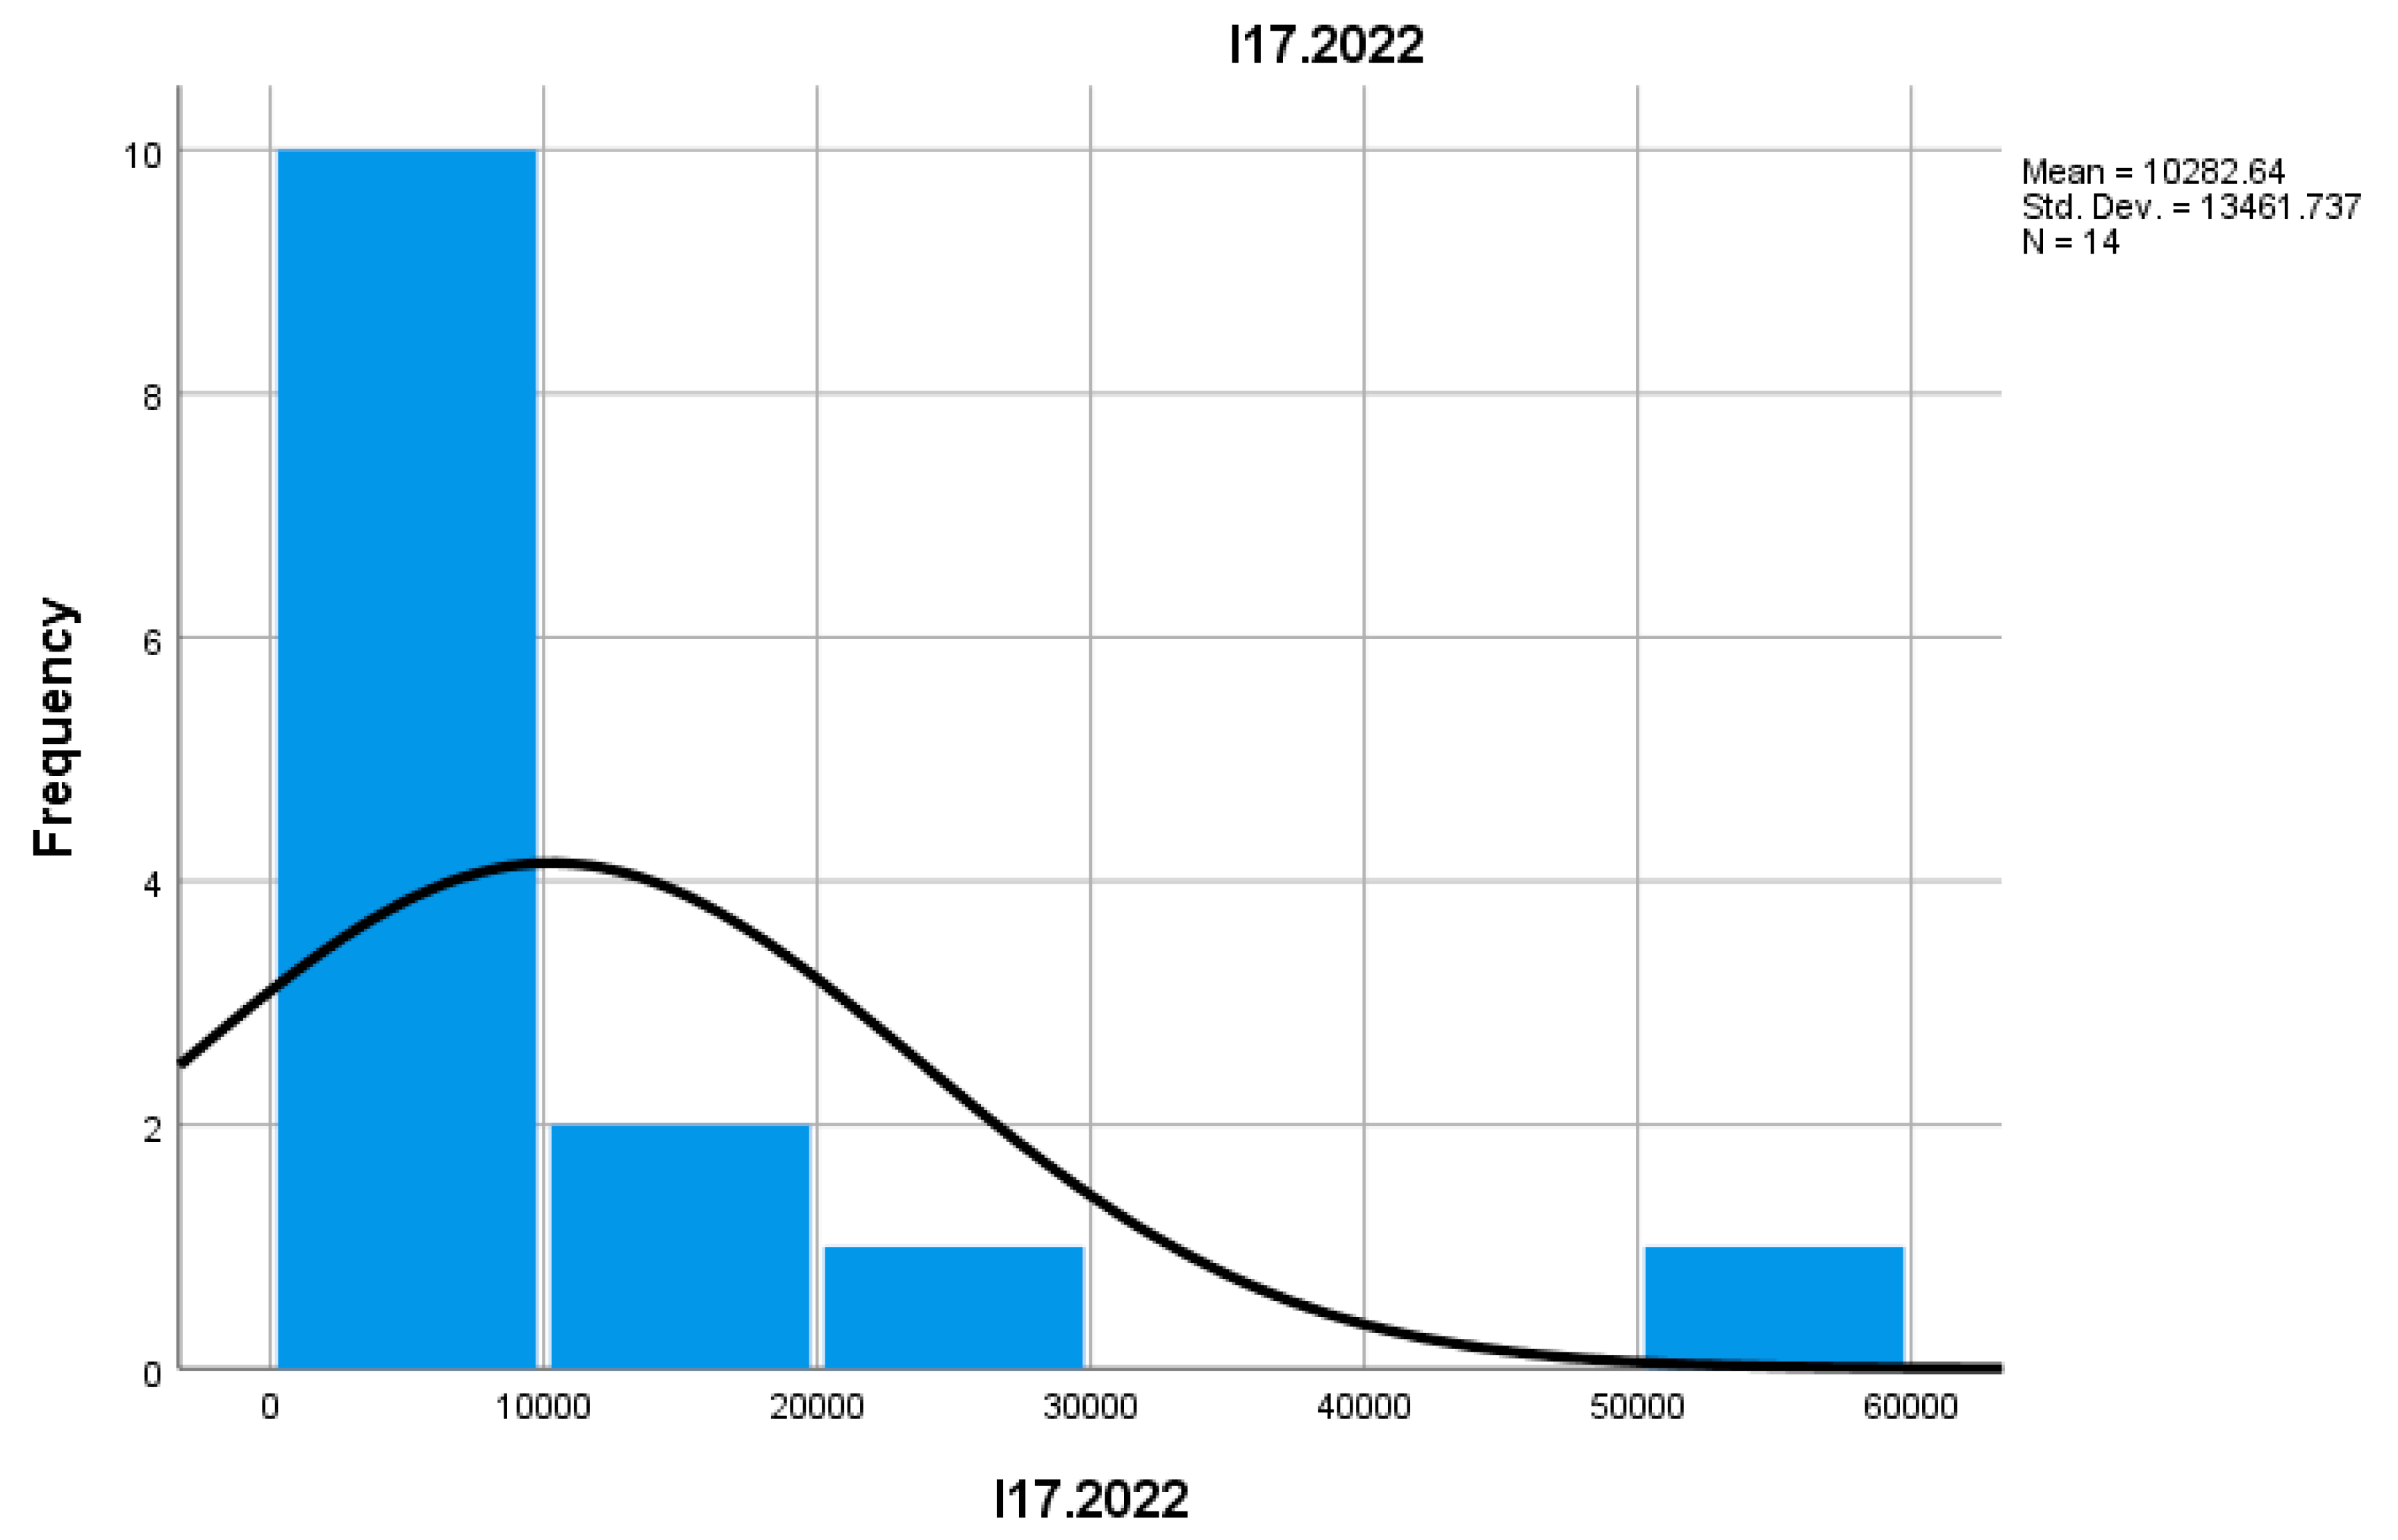
Export revenues, I17, were lower in mountain areas, with an average value of about 1% of total business revenues in the commerce sector in 2021 and 2022. This indicator suggests that most businesses in the mountain commerce sector focus on local and regional markets and have limited access to external markets. This can be explained by the specificity of the products and services offered, which are often primarily intended for local consumers. However, there is potential for growth for mountain entrepreneurs to connect with external markets, particularly in the context of eco-tourism or traditional food products, which could attract an international audience.
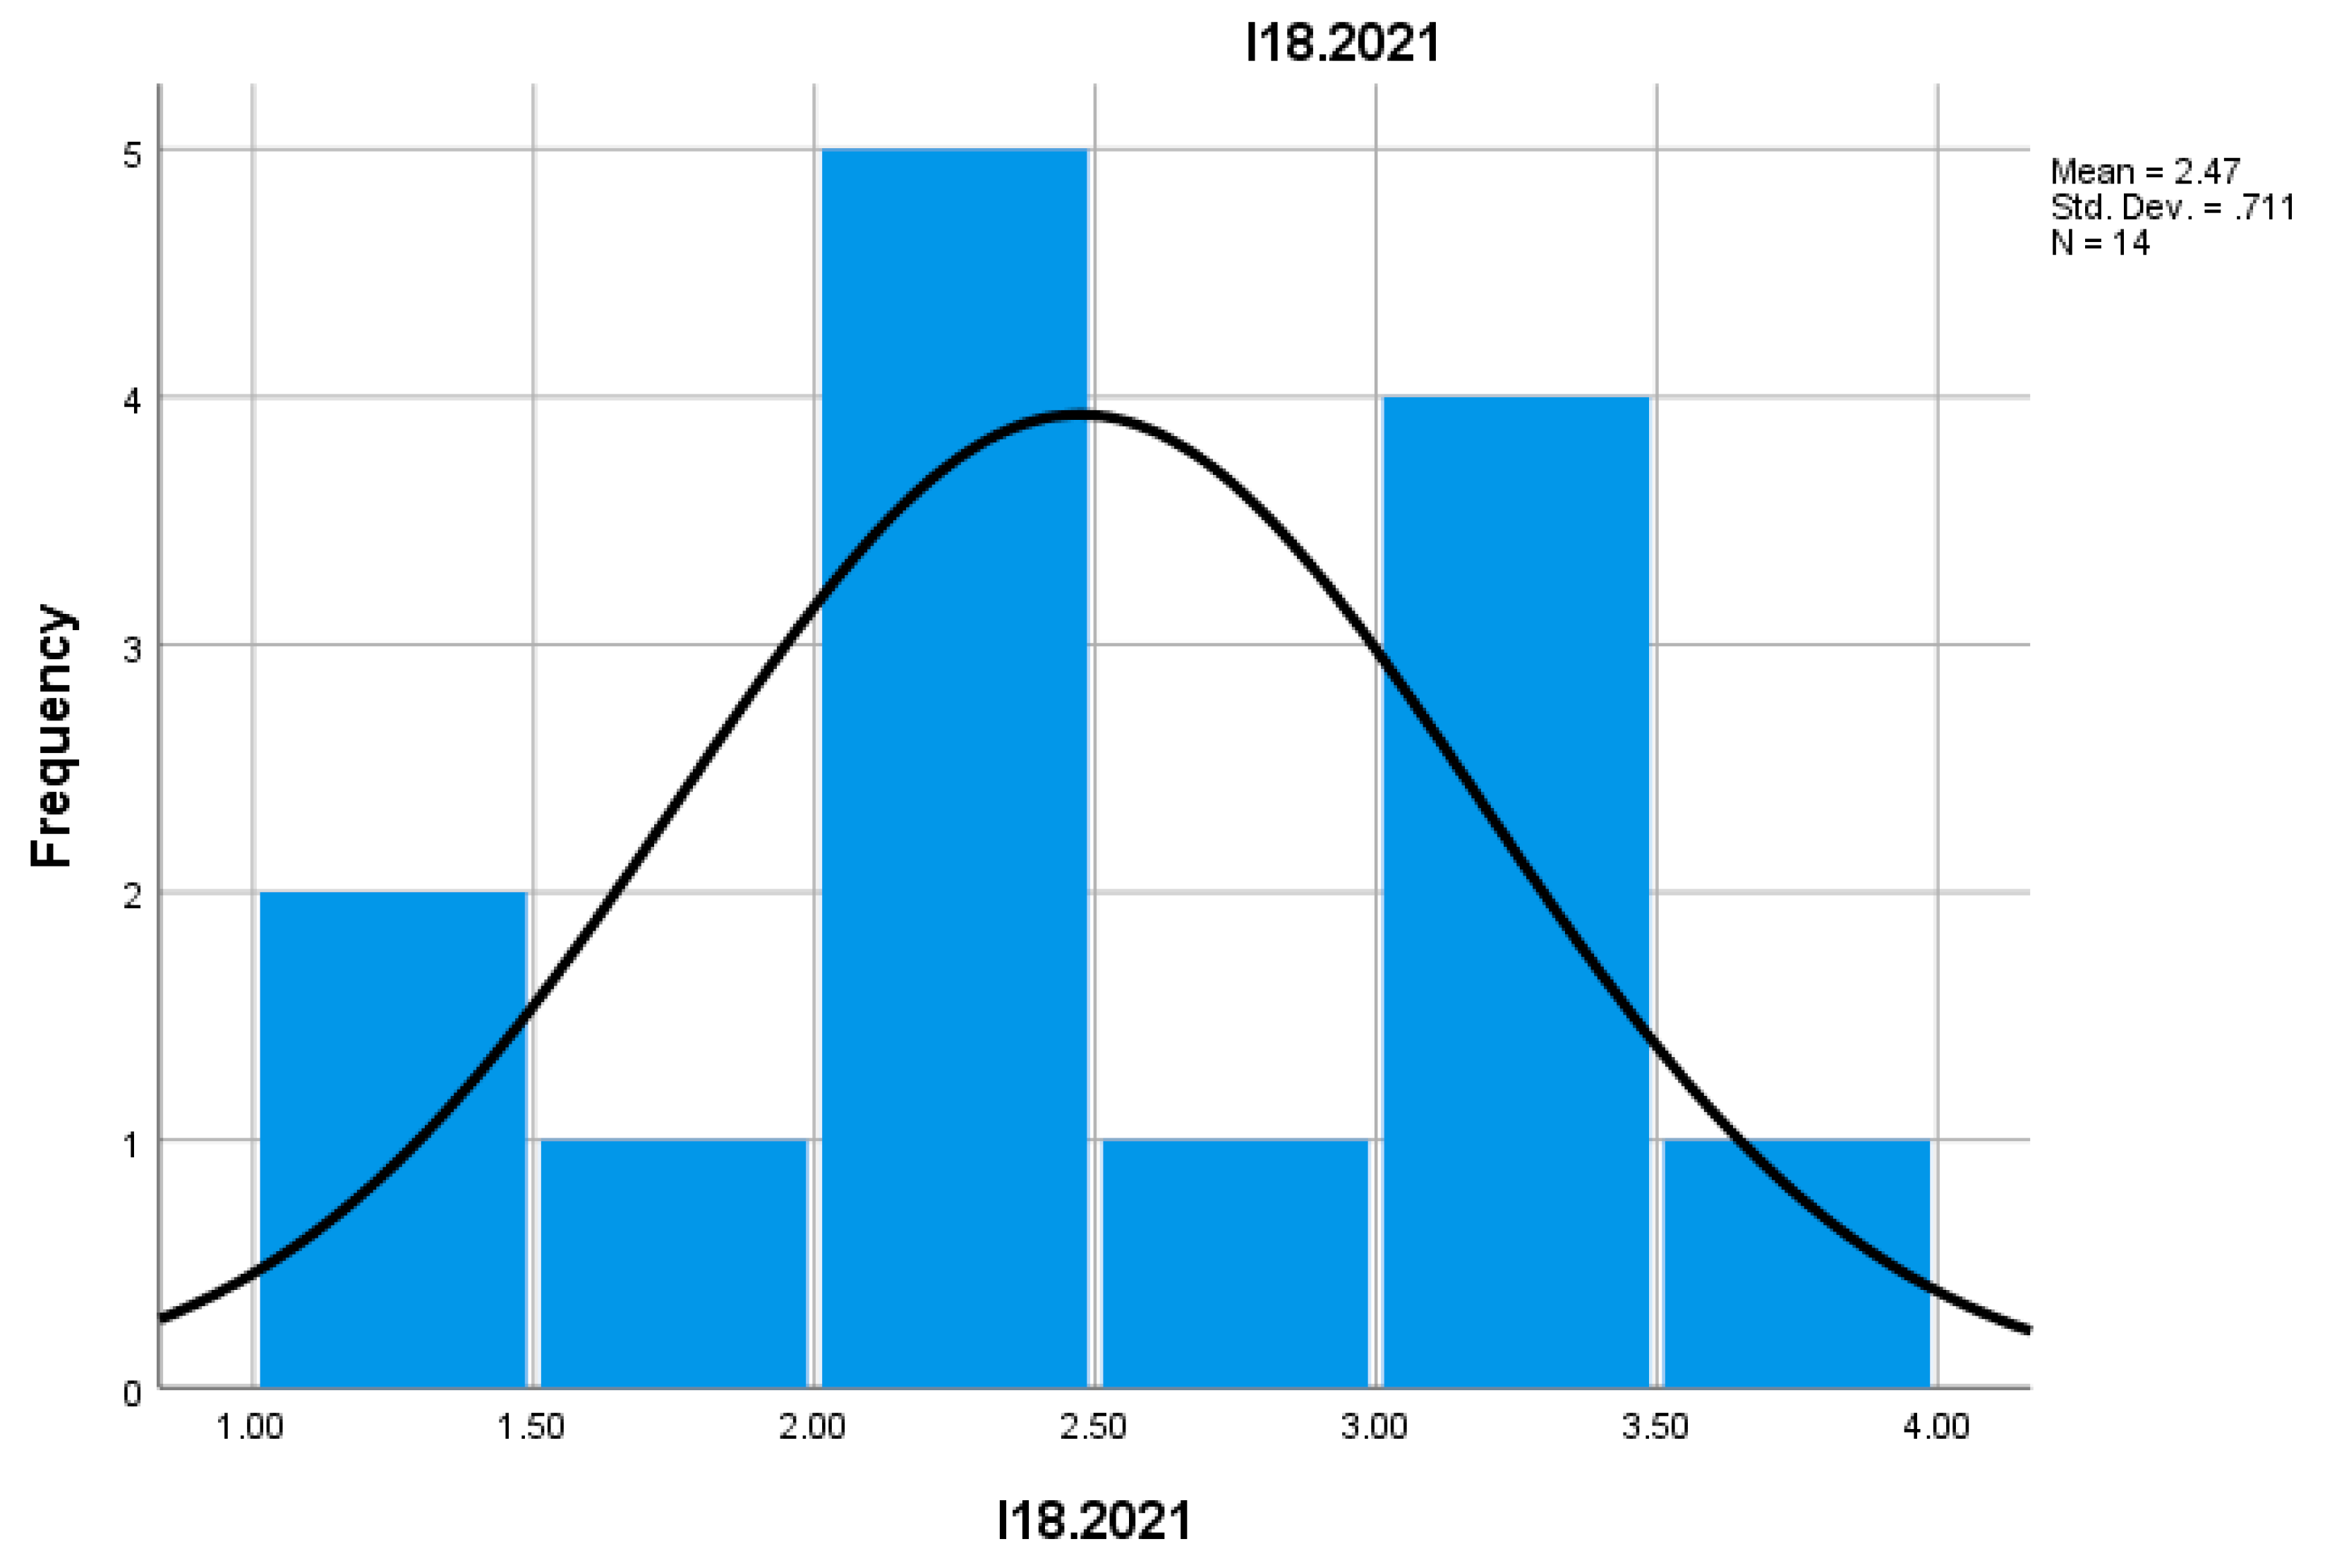
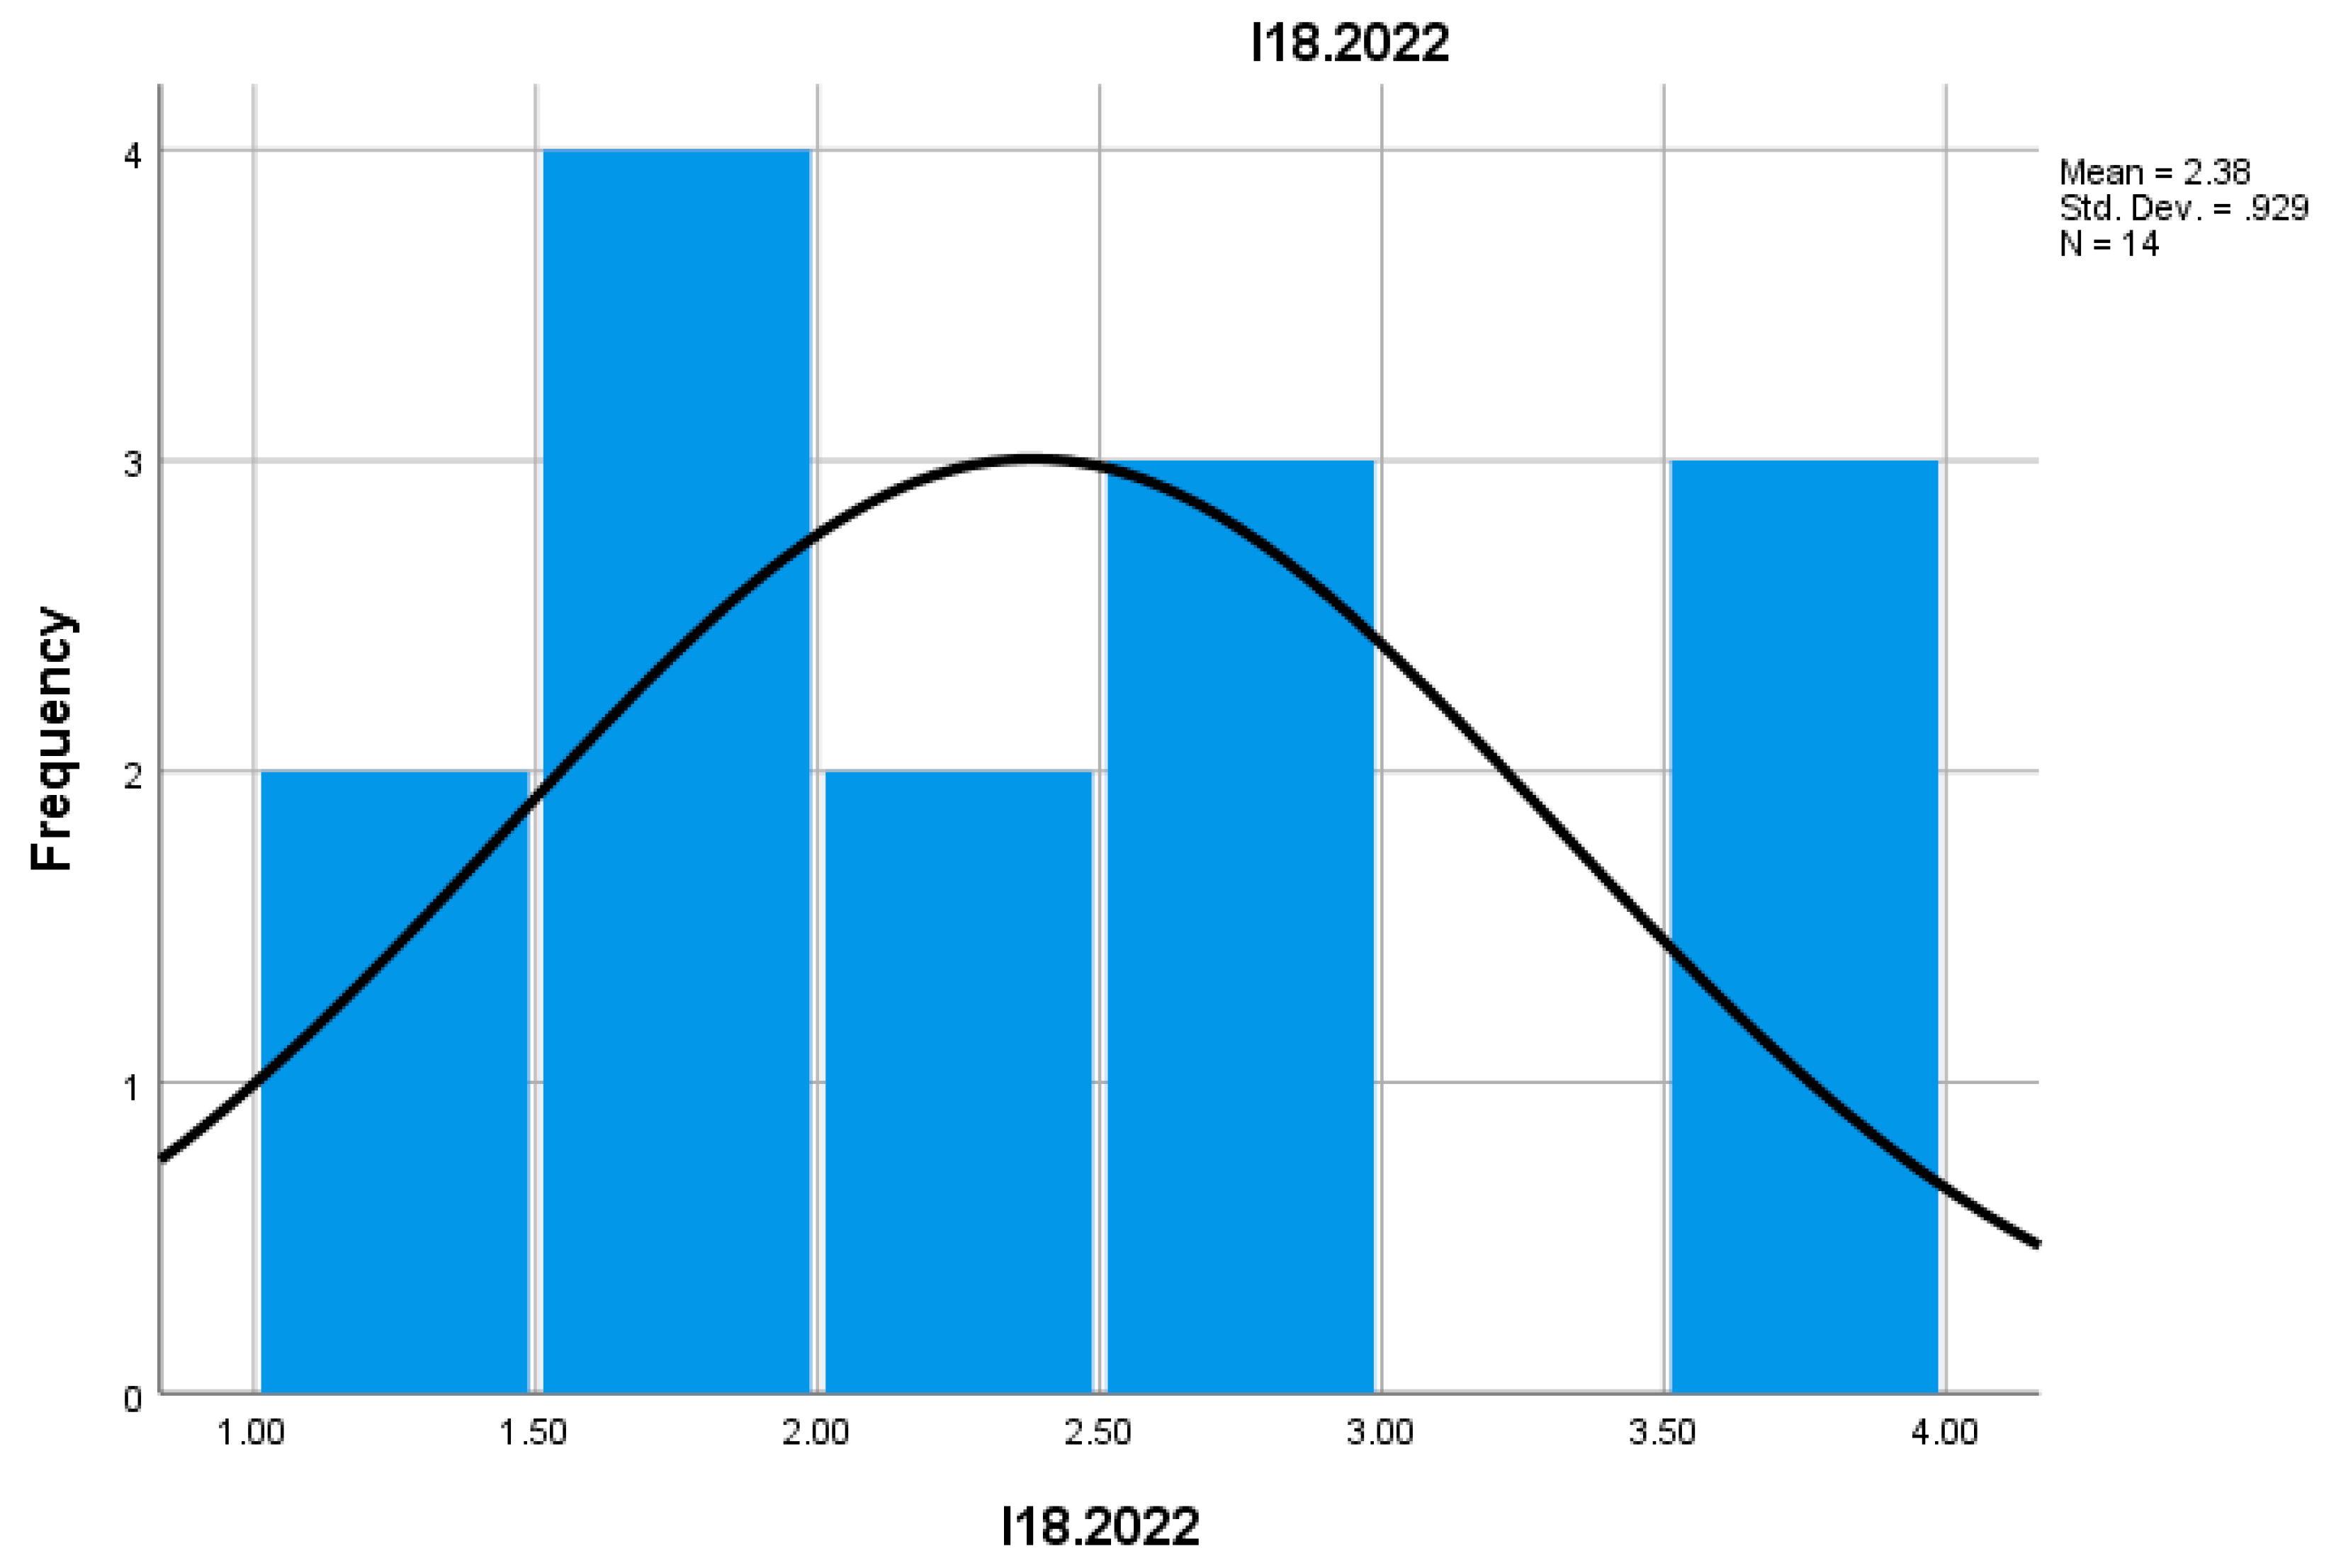
The efficiency of operational costs, I18, in the mountain trade sector showed a slight increase in 2022 compared to 2021, indicating better resource management and increased efficiency in business operations. As a result, most businesses in mountain areas managed to optimize their expenses by reducing fixed costs and adapting to the demands of the local market.
This improvement in cost efficiency can be linked to the adoption of more economical inventory management methods, better resource utilization, as well as adaptation to the broader economic context of the region.
Local market competitiveness, I19, remained moderate but consistent during 2021-2022, given that most mountain businesses are small and compete directly in the local or tourist market. Thus, this indicator suggests that businesses in this area engage in fierce competition for a limited customer base, especially considering the small number of permanent consumers in mountain areas.
Although businesses in this sector do not possess the same resources as large corporations, they build their competitive advantage on the offer of high-quality local products and the trust of customers from mountain communities or tourists.
The implementation of sustainable development principles, I20, became a top concern for some businesses in the mountain trade sector. In 2022, approximately 12% of businesses incorporated eco-friendly practices, such as using organic products or adopting recycling and waste management methods. This indicates an increasing awareness of ecological impact, especially given the mountain context.
Furthermore, these sustainable practices may help businesses attract customers who are increasingly concerned about environmental protection and respond to the demands of the international market, where eco-friendly and sustainable products are in high demand.
The employment rate in mountain trade, I21, remained relatively constant between 2021 and 2022, with a slight increase from 72% in 2021 to 74% in 2022. This indicator suggests that the mountain trade sector continues to represent an important source of employment for local communities, particularly in tourist areas. Most employees are seasonal, being involved in commercial activities during the summer or winter, depending on the specific nature of mountain tourism.
Despite the moderate increase in employment, a major challenge remains recruiting qualified staff. Entrepreneurs in this sector often face difficulties in attracting and retaining employees due to seasonal relocation and fluctuations in the labor market.
The degree of adaptation to local market demands, I22, was high in 2021 and 2022, with an average of 80% of businesses in mountain areas meeting the needs of local customers and tourists by tailoring their products and services to these preferences. Moreover, businesses in these areas are closely connected to local characteristics, offering traditional or niche products.
Adaptability to market demands is a key factor for maintaining a competitive edge, and this ability to quickly adapt is reflected in the success of mountain businesses that manage to combine local products with global trade trends.
The business growth rate, I23, was lower than in other sectors, but still positive, with a rate of about 4-5% per year in the 2021-2022 period. This growth rate can be explained by the fact that most businesses are small or micro-enterprises that lack significant capital for rapid expansion. The modest growth relies on strengthening trust relationships with local customers and tourists, as well as on improving products and services.
Even with moderate growth rates, the mountain trade sector continues to play an important role in regional economic development, having a significant impact on the local economy, particularly in areas where tourism represents a major source of income.
The use of digital technologies, I24, showed a slight increase between 2021 and 2022, reaching about 40% of businesses in mountain areas. In this context, many businesses began to adopt online solutions for sales, promotion, and customer interaction. For example, many mountain businesses developed websites or became active on social media platforms to attract tourists from various parts of the world.
Although progress has been slow, the digitalization of the mountain trade sector presents significant growth potential, especially given that more and more tourists are choosing to plan their vacations and shopping online. Thus, businesses that do not adopt these technologies risk falling behind.
The implementation of eco-friendly and sustainable solutions, I25, became a priority for many businesses in the mountain trade sector, with approximately 15% of businesses making significant progress in 2021 and 2022. These solutions include using eco-friendly packaging, recycling waste, and reducing energy consumption through more efficient technologies. Given that mountain areas are often ecologically sensitive, adopting green solutions represents a way to attract eco-conscious tourists and comply with environmental regulations.
Moreover, this trend is growing, and businesses that adopt these practices gain an advantage over the competition, as an increasing number of consumers seek to support businesses that adhere to sustainability and environmental responsibility standards.
Collaboration between businesses in the mountain trade sector, I26, was moderate during 2021-2022, with approximately 30% of entrepreneurs reporting forms of collaboration or partnerships with other businesses in the same area or region. These partnerships are essential for promoting local products and creating joint tourism packages. Additionally, some businesses join forces to reduce operating costs and improve their service offerings.
Despite this, there is a significant opportunity for increased collaboration among mountain enterprises by creating networks and business groups that would support the development of a more integrated and competitive mountain economy.
Regarding integration into regional and national networks, I27, about 25% of businesses in the mountain trade sector were part of such networks in 2021-2022. This indicates a moderate integration into larger commercial structures that allow mountain entrepreneurs to expand their access to larger markets and increase their visibility on a national level. Trade networks can also provide support in negotiations with suppliers or in accessing resources and funds.
However, there is considerable potential to expand the integration of these businesses into national and European networks, which could bring significant benefits in terms of access to larger markets and collaboration on joint projects.
The degree of diversification of economic activities, I28, was moderate in 2021 and 2022, with about 20% of mountain businesses diversifying their product or service offerings. In many cases, this diversification focused on integrating tourism-related products or complementary activities, such as guided tours or event organization. Additionally, diversification of activities helps businesses reduce dependence on the seasonality of mountain tourism.
Despite progress in diversifying activities, many businesses in mountain trade remain focused on limited niches, and in order to reach a higher level of development, these businesses will need to invest in expanding their service and product portfolios.
The mountain trade sector in 2021 and 2022 experienced a series of developments reflecting both stability and challenges. Entrepreneurs in these regions demonstrated remarkable adaptability to the specific economic and environmental conditions, maintaining a steady number of businesses and investing in innovation and sustainability, even in the face of financial and logistical difficulties. However, for this sector to strengthen and enhance its competitiveness, more investments are needed in human resources development, improving access to external markets, and technological innovation.
The analysis of economic and performance indicators for the mountain trade sector in the 2021-2022 period underscores that, despite facing multiple challenges, including financial constraints, seasonality, and limited access to external markets, there are positive signs of adaptation and growth. Mountain entrepreneurs demonstrated exceptional innovation and adaptability, and the future of the sector depends on expanding economic networks, investing in digitalization and sustainability, and diversifying economic activities.
The mountain trade sector holds significant potential for contributing to sustainable economic development but requires support from authorities and economic partners to overcome barriers and capitalize on available opportunities.
In conclusion, the analysis of entrepreneurial trends in the European mountain trade sector between 2021 and 2022 highlights several key findings. While there is overall stability in the number of businesses, there is a modest decrease in the establishment of new enterprises and a moderate increase in the use of digital technologies. The profitability of mountain trade businesses remains relatively low, but many are managing to stay afloat by adapting to local market demands, diversifying their services, and benefiting from tourism trends. The sector faces several challenges, including high operational costs and limited access to external funding, but there are opportunities for growth, particularly in the areas of eco-tourism, local products, and innovation.
The relatively stable employment rates and high adaptability to local market needs indicate that mountain businesses are resilient and able to cater to the demands of both locals and tourists. However, further improvements in access to finance, innovation, and sustainability practices are necessary for the long-term growth and competitiveness of businesses in this sector.
Conclusion
The mountain commerce entrepreneurship sector in Europe demonstrates resilience and a sustainable level of dynamism for the entire community, regional, and local mountain entrepreneurship. The characteristics observed within this sector indicate stability and moderate growth, highlight persistent challenges, showcase a high degree of adaptation and innovation, and present certain development opportunities and future prospects.
(1) Stability and Moderate Growth. The number of active enterprises (I1) has remained stable, and the survival rate of businesses after 3 years (I6–I9) has shown an increase, signaling a gradual strengthening of the mountain commerce sector. This stability suggests resilience to economic and environmental challenges, with continuous adaptation to market conditions. As such, the sector has managed to overcome periods of uncertainty while maintaining a relatively constant number of active enterprises.
(2) Persistent Challenges. Despite signs of stability, significant challenges continue to influence the sector’s evolution. The increase in the number of business closures (I5) and the decline in turnover for some enterprises (I19–I20) indicate major vulnerabilities. These difficulties are largely due to the seasonality specific to mountain commerce, limited access to financing (I8), and increasing competition in the local and tourism markets. Additionally, reliance on seasonal employment and fluctuations in the labor market remain factors that complicate long-term business management.
(3) Adaptation and Innovation. In response to these challenges, the sector has shown remarkable adaptability. Increased productivity (I25–I27), the implementation of digital technologies (I24), and the adoption of sustainable practices (I25) highlight that mountain entrepreneurs are focused on optimizing processes and meeting the demands of the modern market. Technology and innovation have been gradually integrated into the strategies of many businesses, enabling them to adapt more swiftly to economic changes and meet the increasingly demanding expectations of customers. Furthermore, the implementation of eco-friendly solutions reflects not only a commitment to environmental protection but also an opportunity to attract tourists and consumers from market segments interested in sustainability.
(4) Development Opportunities. Although the sector shows signs of stability, further investments in professional training (I15) are necessary to strengthen it. This would contribute to enhancing employees’ skills and improving service quality. Expanding access to external markets (I17) would allow mountain enterprises to better capitalize on the international potential of local products, while supporting collaborations between businesses (I26) would help create stronger networks and optimize operating costs. These investments would ensure a more sustainable development of mountain commerce, contributing to increased competitiveness and attracting new customer segments.
(5) Future Prospects. The mountain commerce sector holds considerable potential to contribute to local and regional economic development, given the specificity and uniqueness of the products and services offered. However, to fully harness this potential, policies are needed to support entrepreneurs in managing risks, especially regarding seasonal fluctuations and economic uncertainties. Future priorities must include promoting digitalization and implementing sustainable practices, which will not only improve the sector's efficiency but also enable a quicker adaptation to changes in the international market. Collaboration between authorities, entrepreneurs, and other stakeholders will play a crucial role in strengthening this sector in the long term.
During the preparation of this manuscript, the authors utilized artificial intelligence tools for assistance in statistical analysis and data interpretation. Following this, the authors rigorously reviewed, validated, and refined all results, ensuring accuracy and coherence. The final content reflects the authors' independent analysis, critical revisions, and scholarly judgment. The authors assume full responsibility for the integrity and originality of the published work.
| I1.2021 | I1.2022 | I2.2021 | I2.2022 | I3.2021 | I3.2022 | I4.2021 | I4.2022 | I5.2021 | I5.2022 | I6.2021 | I6.2022 | |
| N Valid | 15 | 15 | 15 | 15 | 14 | 14 | 15 | 15 | 15 | 15 | 15 | 15 |
| N Missing | 0 | 0 | 0 | 0 | 1 | 1 | 0 | 0 | 0 | 0 | 0 | 0 |
| Mean | 119262.40 | 119197.27 | 9020.33 | 8231.47 | 1.1886 | 1.1657 | 1.00 | 1.00 | 8371.00 | 9624.33 | 46.0487 | 44.3480 |
| Std. Error of Mean | 40140.570 | 39881.317 | 2883.439 | 2524.474 | 0.06297 | 0.08831 | 0.000 | 0.000 | 2876.144 | 3261.035 | 11.71855 | 11.52390 |
| Median | 56801.00 | 58166.00 | 4749.00 | 4808.00 | 1.2150 | 1.1800 | 1.00 | 1.00 | 3883.00 | 4507.00 | 27.1400 | 25.8800 |
| Mode | 1718a | 1487a | 100a | 115a | .67a | .57a | 1 | 1 | 70a | 74a | 1.88a | 1.53a |
| Std. Deviation | 155463.761 | 154459.677 | 11167.510 | 9777.245 | 0.23560 | 0.33042 | 0.000 | 0.000 | 11139.259 | 12629.936 | 45.38577 | 44.63188 |
| Skewness | 2.034 | 2.019 | 1.809 | 1.833 | -0.489 | -0.028 | 1.991 | 2.020 | 0.864 | 0.912 | ||
| Std. Error of Skewness | 0.580 | 0.580 | 0.580 | 0.580 | 0.597 | 0.597 | 0.580 | 0.580 | 0.580 | 0.580 | 0.580 | 0.580 |
| Kurtosis | 3.161 | 3.113 | 2.447 | 2.648 | 0.802 | 0.304 | 2.954 | 3.509 | -0.903 | -0.783 | ||
| Std. Error of Kurtosis | 1.121 | 1.121 | 1.121 | 1.121 | 1.154 | 1.154 | 1.121 | 1.121 | 1.121 | 1.121 | 1.121 | 1.121 |
| Range | 495931 | 494676 | 37787 | 33477 | 0.93 | 1.25 | 0 | 0 | 36260 | 43760 | 127.12 | 127.47 |
| Minimum | 1718 | 1487 | 100 | 115 | 0.67 | 0.57 | 1 | 1 | 70 | 74 | 1.88 | 1.53 |
| Maximum | 497649 | 496163 | 37887 | 33592 | 1.60 | 1.82 | 1 | 1 | 36330 | 43834 | 129.00 | 129.00 |
| Sum | 1788936 | 1787959 | 135305 | 123472 | 16.64 | 16.32 | 15 | 15 | 125565 | 144365 | 690.73 | 665.22 |
| Percentiles 25 | 35312.00 | 34615.00 | 2969.00 | 2849.00 | 1.0575 | 0.9850 | 1.00 | 1.00 | 2786.00 | 3301.00 | 8.4200 | 9.9100 |
| Percentiles 50 | 56801.00 | 58166.00 | 4749.00 | 4808.00 | 1.2150 | 1.1800 | 1.00 | 1.00 | 3883.00 | 4507.00 | 27.1400 | 25.8800 |
| Percentiles 75 | 155918.00 | 159510.00 | 8461.00 | 8461.00 | 1.3375 | 1.3650 | 1.00 | 1.00 | 7377.00 | 13986.00 | 97.3800 | 88.5000 |
| a. Multiple modes exist. The smallest value is shown | ||||||||||||
| I7.2021 | I7.2022 | I8.2021 | I8.2022 | I10.2021 | I10.2022 | I12.2021 | I12.2022 | I13.2021 | I13.2022 | I14.2021 | I14.2022 | I15.2021 | I15.2022 | |
| N Valid | 15 | 13 | 15 | 13 | 13 | 13 | 15 | 15 | 15 | 12 | 15 | 12 | 13 | 13 |
| N Missing | 0 | 2 | 0 | 2 | 2 | 2 | 0 | 0 | 0 | 3 | 0 | 3 | 2 | 2 |
| Mean | 5681.40 | 5996.62 | 4.7613 | 4.7654 | 272.31 | 269.38 | 14.6640 | 15.7787 | 7.6613 | 7.6183 | 7.0000 | 9.0358 | -0.9077 | -0.9077 |
| Std. Error of Mean | 1847.954 | 2000.711 | 0.32728 | 0.31129 | 62.423 | 67.740 | 1.06374 | 1.35301 | 0.55754 | 0.46155 | 0.57274 | 1.26471 | 1.10967 | 1.10967 |
| Median | 3173.00 | 3061.00 | 4.9800 | 4.7500 | 223.00 | 223.00 | 13.8900 | 15.1600 | 7.1900 | 7.4650 | 6.8000 | 7.7850 | -0.3000 | -0.3000 |
| Mode | 51a | 55a | 2.97a | 3.04a | 28a | 20a | 7.68a | 7.68a | 5.32a | 5.25a | 2.35a | 4.89a | -13.45a | -13.45a |
| Std. Deviation | 7157.096 | 7213.667 | 1.26757 | 1.12238 | 225.070 | 244.241 | 4.11983 | 5.24019 | 2.15936 | 1.59885 | 2.21821 | 4.38107 | 4.00096 | 4.00096 |
| Skewness | 2.069 | 1.701 | 0.050 | 0.137 | 1.414 | 1.785 | 0.645 | 1.167 | 1.516 | 0.329 | -0.012 | 1.697 | -2.891 | -2.891 |
| Std. Error of Skewness | 0.580 | 0.616 | 0.580 | 0.616 | 0.616 | 0.616 | 0.580 | 0.580 | 0.580 | 0.637 | 0.580 | 0.637 | 0.616 | 0.616 |
| Kurtosis | 3.907 | 2.056 | -1.710 | -1.114 | 2.441 | 3.920 | 0.665 | 1.719 | 3.156 | -0.265 | 0.987 | 2.744 | 9.539 | 9.539 |
| Std. Error of Kurtosis | 1.121 | 1.191 | 1.121 | 1.191 | 1.191 | 1.191 | 1.121 | 1.121 | 1.121 | 1.232 | 1.121 | 1.232 | 1.191 | 1.191 |
| Range | 25435 | 22936 | 3.65 | 3.69 | 816 | 910 | 16.15 | 20.89 | 8.31 | 5.44 | 9.05 | 14.99 | 15.85 | 15.85 |
| Minimum | 51 | 55 | 2.97 | 3.04 | 28 | 20 | 7.68 | 7.68 | 5.32 | 5.25 | 2.35 | 4.89 | -13.45 | -13.45 |
| Maximum | 25486 | 22991 | 6.62 | 6.73 | 844 | 930 | 23.83 | 28.57 | 13.63 | 10.69 | 11.40 | 19.88 | 2.40 | 2.40 |
| Sum | 85221 | 77956 | 71.42 | 61.95 | 3540 | 3502 | 219.96 | 236.68 | 114.92 | 91.42 | 105.00 | 108.43 | -11.80 | -11.80 |
| Percentiles 25 | 1623.00 | 1277.50 | 3.6700 | 3.7200 | 109.00 | 111.00 | 12.1600 | 12.3100 | 5.8200 | 6.2975 | 6.2400 | 6.4125 | -1.0450 | -1.0450 |
| Percentiles 50 | 3173.00 | 3061.00 | 4.9800 | 4.7500 | 223.00 | 223.00 | 13.8900 | 15.1600 | 7.1900 | 7.4650 | 6.8000 | 7.7850 | -0.3000 | -0.3000 |
| Percentiles 75 | 6125.00 | 7541.50 | 6.0100 | 5.7500 | 362.50 | 352.00 | 16.3700 | 16.6600 | 8.7400 | 8.8775 | 7.7400 | 10.0425 | 1.2200 | 1.2200 |
| a. Multiple modes exist. The smallest value is shown | ||||||||||||||
| I16.2021 | I16.2022 | I17.2021 | I17.2022 | I18.2021 | I18.2022 | I19.2021 | I19.2022 | I20.2021 | I20.2022 | I21.2021 | I21.2022 | I22.2021 | ||
| N Valid | 15 | 15 | 14 | 14 | 14 | 14 | 14 | 11 | 14 | 13 | 14 | 13 | 14 | |
| N Missing | 0 | 0 | 1 | 1 | 1 | 1 | 1 | 4 | 1 | 2 | 1 | 2 | 1 | |
| Mean | 444852.13 | 448167.53 | 11272.14 | 10282.64 | 2.4714 | 2.3814 | 10608.21 | 15263.45 | 11713.64 | 11634.92 | 8018.50 | 8012.46 | 2.2307 | |
| Std. Error of Mean | 144957.380 | 146307.983 | 4301.583 | 3597.801 | 0.18997 | 0.24832 | 4123.249 | 6288.470 | 3927.471 | 3952.356 | 3001.898 | 3065.796 | 0.27609 | |
| Median | 273996.00 | 281178.00 | 5142.00 | 5419.00 | 2.3600 | 2.3700 | 5026.00 | 6486.00 | 5703.00 | 7466.00 | 4218.00 | 2954.00 | 2.3750 | |
| Mode | 5854a | 4873a | 144a | 77a | 2.26 | 1.12a | 73a | 73a | 96a | 84a | 55a | 68a | .98a | |
| Std. Deviation | 561417.517 | 566648.382 | 16095.048 | 13461.737 | 0.71082 | 0.92913 | 15427.783 | 20856.496 | 14695.252 | 14250.423 | 11232.074 | 11053.884 | 1.03302 | |
| Skewness | 2.158 | 2.172 | 2.608 | 2.448 | -0.179 | 0.460 | 2.425 | 1.889 | 2.007 | 1.858 | 2.627 | 2.328 | 0.256 | |
| Std. Error of Skewness | 0.580 | 0.580 | 0.597 | 0.597 | 0.597 | 0.597 | 0.597 | 0.661 | 0.597 | 0.616 | 0.597 | 0.616 | 0.597 | |
| Kurtosis | 4.293 | 4.372 | 7.242 | 6.410 | -0.597 | -1.005 | 5.475 | 2.803 | 3.704 | 2.901 | 7.405 | 5.540 | -1.180 | |
| Std. Error of Kurtosis | 1.121 | 1.121 | 1.154 | 1.154 | 1.154 | 1.154 | 1.154 | 1.279 | 1.154 | 1.191 | 1.154 | 1.191 | 1.154 | |
| Range | 2013567 | 2038379 | 60431 | 50531 | 2.41 | 2.83 | 54965 | 65216 | 51271 | 47418 | 42509 | 39371 | 3.10 | |
| Minimum | 5854 | 4873 | 144 | 77 | 1.17 | 1.12 | 73 | 73 | 96 | 84 | 55 | 68 | 0.98 | |
| Maximum | 2019421 | 2043252 | 60575 | 50608 | 3.58 | 3.95 | 55038 | 65289 | 51367 | 47502 | 42564 | 39439 | 4.08 | |
| Sum | 6672782 | 6722513 | 157810 | 143957 | 34.60 | 33.34 | 148515 | 167898 | 163991 | 151254 | 112259 | 104162 | 31.23 | |
| Percentiles 25 | 121382.00 | 120734.00 | 3002.00 | 3233.75 | 2.0075 | 1.5525 | 3516.25 | 3600.00 | 2972.25 | 2289.00 | 2224.25 | 1759.50 | 1.2075 | |
| Percentiles 50 | 273996.00 | 281178.00 | 5142.00 | 5419.00 | 2.3600 | 2.3700 | 5026.00 | 6486.00 | 5703.00 | 7466.00 | 4218.00 | 2954.00 | 2.3750 | |
| Percentiles 75 | 490785.00 | 501925.00 | 11914.25 | 11574.00 | 3.0375 | 3.1000 | 8296.00 | 19263.00 | 15065.50 | 13236.50 | 8153.00 | 8522.00 | 3.0625 | |
| a. Multiple modes exist. The smallest value is shown | ||||||||||||||
| I22.2022 | I23.2021 | I23.2022 | I24.2021 | I24.2022 | I25.2021 | I25.2022 | I26.2021 | I26.2022 | I27.2021 | I27.2022 | I28.2021 | I28.2022 | ||
| N Valid | 14 | 14 | 13 | 15 | 15 | 15 | 15 | 13 | 13 | 12 | 9 | 13 | 13 | |
| N Missing | 1 | 1 | 2 | 0 | 0 | 0 | 0 | 2 | 2 | 3 | 6 | 2 | 2 | |
| Mean | 2.8007 | 2.5757 | 2.4262 | 64.9427 | 52.5933 | 336420.40 | 341865.93 | 3720.62 | 3330.15 | 3351.25 | 4688.22 | 34.4723 | 31.1846 | |
| Std. Error of Mean | 0.45727 | 0.19333 | 0.19372 | 12.50095 | 13.18840 | 108381.260 | 110619.937 | 1453.451 | 1145.640 | 1396.013 | 2169.258 | 4.71474 | 4.27225 | |
| Median | 2.4100 | 2.5100 | 2.3200 | 60.7800 | 39.4200 | 226276.00 | 235557.00 | 2131.00 | 2131.00 | 1484.00 | 1901.00 | 33.9200 | 29.5600 | |
| Mode | .99a | 1.32a | 1.55a | 20.68a | 10.21a | 5025a | 4209a | 91a | 13a | 12a | 34a | 9.35a | 7.96a | |
| Std. Deviation | 1.71094 | 0.72338 | 0.69848 | 48.41597 | 51.07845 | 419758.814 | 428429.172 | 5240.491 | 4130.665 | 4835.931 | 6507.773 | 16.99924 | 15.40382 | |
| Skewness | 1.158 | -0.111 | 0.583 | 2.354 | 2.651 | 2.416 | 2.428 | 2.480 | 2.075 | 2.517 | 1.837 | 0.156 | 0.254 | |
| Std. Error of Skewness | 0.597 | 0.597 | 0.616 | 0.580 | 0.580 | 0.580 | 0.580 | 0.616 | 0.616 | 0.637 | 0.717 | 0.616 | 0.616 | |
| Kurtosis | 0.698 | -0.661 | -0.671 | 7.167 | 8.170 | 6.394 | 6.439 | 6.970 | 4.916 | 6.971 | 3.305 | -0.746 | -0.829 | |
| Std. Error of Kurtosis | 1.154 | 1.154 | 1.191 | 1.121 | 1.121 | 1.121 | 1.121 | 1.191 | 1.191 | 1.232 | 1.400 | 1.191 | 1.191 | |
| Range | 5.65 | 2.39 | 2.19 | 196.21 | 206.68 | 1620049 | 1654015 | 19194 | 14892 | 17274 | 19650 | 53.84 | 49.76 | |
| Minimum | 0.99 | 1.32 | 1.55 | 20.68 | 10.21 | 5025 | 4209 | 91 | 13 | 12 | 34 | 9.35 | 7.96 | |
| Maximum | 6.64 | 3.71 | 3.74 | 216.89 | 216.89 | 1625074 | 1658224 | 19285 | 14905 | 17286 | 19684 | 63.19 | 57.72 | |
| Sum | 39.21 | 36.06 | 31.54 | 974.14 | 788.90 | 5046306 | 5127989 | 48368 | 43292 | 40215 | 42194 | 448.14 | 405.40 | |
| Percentiles 25 | 1.3575 | 2.0575 | 1.7850 | 29.6900 | 21.2200 | 91112.00 | 91092.00 | 430.00 | 408.50 | 478.25 | 358.50 | 21.2050 | 17.7300 | |
| Percentiles 50 | 2.4100 | 2.5100 | 2.3200 | 60.7800 | 39.4200 | 226276.00 | 235557.00 | 2131.00 | 2131.00 | 1484.00 | 1901.00 | 33.9200 | 29.5600 | |
| Percentiles 75 | 3.5025 | 3.0525 | 2.9250 | 76.0200 | 62.6000 | 345714.00 | 345714.00 | 5095.50 | 4532.50 | 5078.25 | 8027.00 | 49.7350 | 42.8850 | |
| a. Multiple modes exist. The smallest value is shown | ||||||||||||||


References
- Clerici, M. A. (2025). Mountain areas and the growing scarcity of essential services: The evolution of retail business density in mountain municipalities in Lombardy (Italy), 2001–2021. European Countryside, 17(1), 47–69. [CrossRef]
- ESPON. (2014). TOWN: Small and medium-sized towns in their functional territorial context: Final report. Luxembourg: ESPON. Available online: https://archive.espon.eu/programme/projects/espon2013/applied-research/town-%E2%80%93-small-and-medium-sized-towns.
- ESPON. (2017). PROFECY-Processes, features and cycles of inner peripheries in Europe: Final report. Luxembourg: ESPON. Available online: https://www.espon.eu/inner-peripheries.
- ESPON. (2018). Alps2050: Common spatial perspectives for the Alpine area: Towards a common vision. Final report. Luxembourg: ESPON. Available online: https://www.espon.eu/Alps2050.
- European Commission (EC). (2020). Territorial Agenda 2030 − A future for all places. Available online: https://ec.europa.eu/regional_policy/en/information/publications/brochures/2021/territorialagenda-2030-a-future-for-all-places.
- European Commission (EC). (2021). A long-term vision for the EU’s rural areas: Towards stronger, connected, resilient and prosperous rural areas by 2040 (COM 2021/345 final). Brussels: EC.
- Eurostat (2025). Business demography and high growth enterprises by NACE Rev. 2 activity and other typologies [urt_bd_hgn__custom_15325082].
- Fassmann, H. , Rauhut, D., da Costa, E. M., & Humer, A. (Eds.). (2015). Services of general interest and territorial cohesion: European perspectives and national insights. V&R Unipress GmbH.
- Hüller, S. , Heiny, J., & Leonhauser, I.-U. (2015). Linking agricultural food production and rural tourism in the Kazbegi district: A qualitative study. Annals of Agrarian Science, 15, 40-48. [CrossRef]
- Navarro, F. A. , Woods, M., & Cejudo, E. (2016). The LEADER Initiative has been a victim of its own success: The decline of the bottom-up approach in rural development programmes—the cases of Wales and Andalusia. Sociologia Ruralis, 56(2), 270–288. [CrossRef]
- Nicula, A. S. , Taran-Baciu Georgescu, V., Nicula, E. A., Domnita, M., & Pacurar, B. N. (2023). Seeking economic balance: Spatial analysis of the interaction between smart specialisation and diversification in Romanian mountain areas. Studia Universitatis Babeş-Bolyai Geographia, 68(2), 37–57. [CrossRef]
- Pan, Y. , Zhang, S., & Zhang, M. (2024). The impact of entrepreneurship of farmers on agriculture and rural economic growth: Innovation-driven perspective. Innovation and Green Development, 3(1), 100093. [CrossRef]
- Panciszko-Szweda, B. (2025). Short food supply chains as a policy tool for smart and sustainable rural development in the European Union. Sociologia Economică, 17(1), 1-15. [CrossRef]
- Robinson, K. , Dassie, W., & Christy, R. (2004). Entrepreneurship and small business development as a rural development strategy. Journal of Rural Social Sciences, 20(2), Article 1. Available online: https://egrove.olemiss.edu/jrss/vol20/iss2/1.
- Salukvadze, G. , Michel, A. H., Backhaus, N., Gugushvili, T., & Dolbaia, T. (2024). From tradition to innovation: The pioneers of mountain entrepreneurship in the Lesser Caucasus. Mountain Research and Development, 44(3), R14-R21. [CrossRef]
- Stielike, J. M. (2024). Securing access to services of general interest in remote regions: Ethical perspectives and practical implications for spatial planning. DISP, 60(1), 53−62. [CrossRef]
- SARURE [Save Rural Retail]. (2021). Good practices handbook. Available online: https://projects2014-2020.interregeurope.eu/fileadmin/user_upload/tx_tevprojects/library/file_1623261108.pdf.
Disclaimer/Publisher’s Note: The statements, opinions and data contained in all publications are solely those of the individual author(s) and contributor(s) and not of MDPI and/or the editor(s). MDPI and/or the editor(s) disclaim responsibility for any injury to people or property resulting from any ideas, methods, instructions or products referred to in the content. |
© 2025 by the authors. Licensee MDPI, Basel, Switzerland. This article is an open access article distributed under the terms and conditions of the Creative Commons Attribution (CC BY) license (http://creativecommons.org/licenses/by/4.0/).
Copyright: This open access article is published under a Creative Commons CC BY 4.0 license, which permit the free download, distribution, and reuse, provided that the author and preprint are cited in any reuse.


