Submitted:
14 April 2025
Posted:
15 April 2025
You are already at the latest version
Abstract
Gold price and production output are the primary drivers of value in the mining industry. They stimulate mining companies to invest in exploration or acquire exploration projects from junior exploration companies. This study aimed to evaluate the effect of gold price and gold production on exploration budgets in South Africa between 1997 and 2021. The results were compared with the results from Ghana, Mexico and Russia. The Spearman and Kendall rank correlation coefficients were used to measure the relationship between the dependent variables and the independent variables. The study found that South African grassroots, late-stage and feasibility exploration budgets were not correlated to the gold price and annual production. The minesite exploration budget had a positive correlation with the gold price and an inverse correlation with annual production.
Keywords:
exploration budget
; gold price
; production
; rank correlation coefficient
1. Introduction
The decision to invest in a mining jurisdiction involves a pipeline of complex institutional decision-making frameworks with different competing and counteracting factors [1]. Jurisdictions that intend to attract these investments must understand that investment decisions are subjective and objective. They are subjective in that the decision depends on the investor's interest and preferences, based on their attitude to the situation. They are objective in that the decision depends on the investor's understanding of its ability to successfully confront the various external barriers and restrictions inherent in the international market economy [2].
Mining investors must navigate three prominent risks: mineral reserve, market and capital modification risks [3]. Mineral reserve risk is associated with verifying and validating economic grade and tonnage estimates for mineral resources and reserves. Changes in demand, commodity price fluctuations, market share and variations in output quality are examples of market risks. The capital structures used to finance a project, such as debt versus equity capital, are associated with capital payment modification risk.
The relationship between geological potential and the probability of unexpected changes in investment climate over the investment period is also a key factor that investors must consider when determining which jurisdiction is attractive for exploration investment [4]. A credible and publicly accessible geological database increases the geological potential of a jurisdiction [5]. The traditional country risk profiles contribute to the probability of unexpected changes in the investment climate over the investment period, especially in developing countries. The risk profiles are characterised by fragile political systems and institutional structures, expropriation, weak governance, poor administration, a weak regulatory regime, confiscation, corruption, instability of government and institutional deficiencies [6].
The key value drivers in the gold mining sector are gold price and production revenues. They stimulate mining companies and investors to invest in exploration or acquire exploration projects that have the potential from junior exploration companies. Exploration expenditure in gold mining projects is driven by the global economic growth and the gold price [7]. Growth in the world economy increases the overall demand for gold, which increases the need for more production and, in turn, drives the need for companies to find more ground to replace what has been mined [7]. The rising gold price generates surplus revenues, which encourages mining companies to increase their exploration spending to replace reserve depletions and to advance their better-performing exploration projects up the value chain.
Figure 1 shows the South African share of global exploration expenditure between 1997 and 2021. The country experienced a massive drop in exploration expenditure after the global financial crisis of 2008 and has not recovered since. The lack of a credible and publicly accessible geological database, a non-functioning mining cadastre, weak governance, poor administration and corruption have further plunged the mining industry into decline. In 2021, the South African Department of Mineral Resources and Energy (DMRE) reported to the Parliament committee on Minerals and Resources that there were 4 647 applications backlogged for prospecting rights, mining permits and mining rights [8].
The aim of this study is to evaluate the effect of gold price and gold output on exploration budgets in South Africa between 1997 and 2021. The South African results were compared to those of Ghana, Mexico and Russia. These three countries were chosen because they are the top three gold-producing developing countries. China, Australia and Canada are also leading gold producers, but they were excluded from the study because their economies are different from that of South Africa. Russia was included in the study because it provides a perspective on exploration budget trends for countries with state-owned companies that control the exploration and production of gold.
2. Data and Methods
The study correlated gold price with annual gold exploration budgets and production outputs from 1997 to 2021. The gold price data was sourced from the World Gold Council's annual end-of-the-period gold price in rands per troy ounce (R/Oz) [9]. The exploration budget data (in millions of rands) was sourced from S&P Global Market Intelligence [10]. The gold production data was sourced from the United States Geological Survey (USGS) [11] world mine production by country or locality, in kilograms (kg). The USGS gold production data was last updated in 2019, which limited the gold production correlation to the period between 1997 and 2019. Privately owned mining companies largely control the gold production and exploration budgets of South Africa, Ghana and Mexico. Russia’s state-owned mining company, Polyus Gold, produces 70% of the country’s gold. The inclusion of Russia in the comparative research aimed to offer insight on budget patterns in nations where state-owned firms control production and exploration budgets.
The annual gold exploration budgets were divided into three categories: grassroots, late-stage and feasibility, and minesite budgets. Figure 2 shows the three exploration budget stages along the mine value chain. The grassroots exploration stage is the early stage of the exploration that involves assessing the nature of mineral deposits, determining the deposit size, grade and distribution, and evaluating whether the deposit can be extracted economically. The output from this stage is exploration results and mineral resources. The late-stage and feasibility stage involves the assessment of the technical and economic viability of grassroots and minesite exploration projects. It involves the conversion of exploration results into mineral resources and mineral resources into mineral reserves. Finally, the minesite exploration stage is defined as exploration activities at the operating mine. It involves identifying additional reserves to replace depleted ore reserves and extend the mine life. Output from this stage is usually mineral resources and reserves.
The Spearman and Kendall rank correlation coefficients were used to measure the relationship between the dependent and independent variables. Rank correlation coefficient methods were chosen because they both measure the non-parametric association between variables where the distribution of the variables is not defined, the relationship between the variables is non-linear, or the variables are independent of each other. The independent variables were gold price and annual gold output. The dependent variables were grassroots, late-stage and feasibility, and minesite exploration budgets. The analysis was carried out using Microsoft Excel. The Spearman rank correlation coefficient, also called rho, was calculated using the equation:
Where: d is the difference in the ranking of the dependent and independent variables; n refers to the number of paired data.
The Kendall rank correlation coefficient, also called tau, measures the degree of concordance between two variables. It was calculated using the equation:
Where:
is the number of concordant pairs
and is the number of discordant pairs.
The directions of the correlations
were measured between -1 and +1, where the negative values implied a negative correlation,
positive values indicated a positive correlation, and zero implied no correlation.
The strengths of the correlations were classified using James Evans’ correlation
strength classification guidelines (Table 1).
The student t-test was used to evaluate the null hypothesis for the spearman rank correlation coefficient. It was calculated using the equation:
Where: the null hypothesis ():
, no correlation. The alternative hypothesis
():
, the dependent variable has a relationship
with the independent variable. The two-tailed p-value forwas calculated using the Microsoft
excel syntax function:
The z-test was used to evaluate the null hypothesis for the Kendall rank correlation coefficient. It was calculated using the equation:
Where: the null hypothesis (): , no correlation. The alternative hypothesis (): , the dependent variable has a relationship with the independent variable. The two-tailed p-value for was calculated using the Microsoft excel syntax function:
The t-test for ∝=0.05 must be greater than 2.069 for n=23 and 2.060 for n=25. The z-value must be greater than 1.960 for ∝=0.05. For the correlations to be significant, the p-values must be less than 0.05.
The first step in the Spearman rank correlation coefficient analysis procedure was to rank the independent and dependent variables in ascending order using the Microsoft syntax function: . The second step was to calculate d by subtracting the ranked dependent variables from the ranked independent variable for each pair of data. The third step was to square the d to find . The value of was used in equation (1) to calculate the correlation coefficient. Hypothesis testing was done using equation (3) and the significance test using equation (4).
The first and second steps in the Kendall rank correlation coefficient analysis procedure were the same as in the Spearman rank correlation coefficient procedure. The third step was to count the number of concordant and discordant pairs using the Microsoft Excel syntax function: .The number of concordant and discordant pairs were used in equation (2) to calculate tau. Hypothesis testing was done using equation (5) and the significance test using equation (6).
3. Results
3.1. Descriptive Statistics
The study correlated the effect of gold price and annual production on exploration budgets. The budgets were divided into grassroots, late-stage and feasibility, and minesite. Descriptive statistical analysis was performed on the gold price, South African production and exploration budgets (Table 2). The mean, median, kurtosis and skewness were used to evaluate the distribution of the data. The mean and the median were used to determine whether the distribution was normal. For the distribution to be normal, the mean and the median must be equal. All the variables did not have a normal distribution. Kurtosis and skewness were used to measure the distribution shape and the distribution's deviation from symmetry. The analysis indicated that the dataset comprised different distributions. The Spearman and Kendall rank correlation coefficients were chosen as the method of analysis instead of the Pearson product-moment correlation coefficient because the rank correlation coefficients allow for correlation between series with different distributions.
3.2. Gold Price Correlation Results
The objective of the gold price correlational analysis was to determine the effect of fluctuation in the gold price on exploration budgets. The analysis was based on twenty-five paired data. The results of the gold price correlation analysis are provided in Table 3.
The null hypothesis was evaluated using t-test and z-test methods for the Spearman and Kendall rank correlation coefficients, respectively. The confidence level for the analysis was set at 95 percent (∝=0.05). The null hypothesis () for gold price correlation analysis was:
: Gold price does not affect exploration budgets.
To accept the null hypothesis, the t-test value must be less than the critical value for N = 25 for ∝ =0.05, which is 2.060. The z-test value must be less than 1.960 for ∝ =0.05. The alternative hypothesis () was:
: Gold price affect exploration budgets.
To accept the alternative hypothesis, the t-test and z-test must be greater than 2.060 and 1.960, respectively. The p values for the Spearman and Kendall rank correlation coefficients must be less than 0.05 for the correlation to be significant.
3.3. Gold Price Correlation Discussions
The gold price correlation coefficients were positive for all dependent variables. Gold price have a positive effect with exploration budgets. However, the South African grassroots tau failed to reject the null hypothesis and failed the significance test. Ghana's rho and tau both failed to reject the null hypothesis and failed the significance test. The coefficients for Mexico and Russia passed the significance test and rejected the null hypothesis. The results indicated that Ghana and South Africa’s grassroots exploration budgets were not associated with the gold price. The Mexican and Russian grassroots exploration budgets have a positive relationship with fluctuations in the gold price.
The South African late-stage and feasibility coefficients failed to reject the null hypothesis and the significance test. These results indicate that South Africa’s late-stage and feasibility exploration budgets were not associated with gold price fluctuations. Ghana, Mexico, and Russia’s late-stage and feasibility exploration budgets correlated with fluctuations in the gold price. Figure 3 shows that the trends in the grassroots, late-stage and feasibility budgets were gentler than the steep rising gold price trend from 1997 to 2021. The budgets were fluctuating unsteadily compared to the consistent growth in the gold price. This explained the unsuccessful correlation between South Africa’s early phase exploration budgets and gold price.
The South African minesite exploration budget was the only exploration budget that showed a correlation with the gold price. The strength of rho was moderate, while tau was weak. In contrast, the correlation strength for Ghana and Russia’s rho was very strong, while the correlation strength for Mexico was strong. Figure 4 shows that the South African minesite exploration budget experienced a steep rise from 2006 to 2009, followed by a significant decline from 2009 to 2015. The minesite exploration budget had a trend similar to that of the gold price. This explained the successful correlation.
3.4. Annual Gold Production Correlation Results
The objective of the annual gold production correlational analysis was to determine if the South African gold mining industry was replacing mined-out reserves by investing in minesite exploration strategies. Table 4 outlines the results of the annual gold production correlation analysis. The number of paired data for the gold production correlation coefficient was twenty-three. The study period was from 1997 to 2019. The null hypothesis () for annual gold production correlation coefficients was:
: Gold production does not affect gold exploration budgets.
To accept the null hypothesis, the t-test value must be less than the critical value for N = 23 for ∝ =0.05, which is 2.069. The z-test value must be less than 1.960 for ∝ =0.05. The alternative hypothesis () was:
: gold production affects gold exploration budgets.
To accept the alternative hypothesis, the t-test and z-test must be greater than 2.069 and 1.960, respectively. The p values for the Spearman and Kendall rank correlation coefficient must be less than 0.05 for the correlation to be significant.
3.5. Annual Gold Production Correlations Discussions
The objective of the annual production correlational analysis was to evaluate if the South African gold mining industry was using a percentage of its output to replace depleted reserves by investing in exploration. All correlation coefficients were positive, except for South Africa, which had a negative coefficient for both the Spearman and Kendall rank correlation coefficients (Table 4). Both the South African and Ghanaian grassroots coefficients failed to reject the null hypothesis and failed the significance test. The Mexican and Russian grassroots exploration budgets were positively correlated to annual gold production. The results indicated that, in terms of grassroots exploration budgets: Ghanaian and South African budgets were not associated with gold production; Russian budgets were weakly associated with gold production; and Mexican budgets were strongly associated with gold production.
The South African late-stage and feasibility coefficients failed to reject the null hypothesis and the significance test. South African late-stage and feasibility budgets were not associated with gold production. Ghana, Russia, and Mexico’s late-stage and feasibility budgets positively correlated with gold production. Figure 5 shows that South Africa's late-stage and feasibility budget had a positive trend against the declining annual production. This explained the unsuccessful correlation.
The minesite correlation coefficients for all four countries passed the significance test and rejected the null hypothesis. The coefficients for Ghana, Mexico and Russia were strong to very strong positive correlations while the South African coefficients were weak to moderate negative correlation. Figure 6 shows that the South African minesite exploration budget declined from 2012 to 2015, but the overall trend showed a steady rise. The gold production trend declined significantly from 1997 to 2019.
3.6. Summary of Findings
The inflow of investment into the grassroots exploration stage depends on the geological potential and changes in the investment climate [13,14]. The grassroots exploration stage is more responsive to changes in the investment climate because grassroots exploration takes a longer period to deliver a profitable mine. Changes in the investment climate during the exploration project phase can have a negative impact on the project’s economics, leading to a loss of investment. In more stable countries, such as Russia and Mexico, companies do not have to worry about changes in the investment climate. Grassroots exploration spending is an opportunity to increase the mineral resources and reserves base and increase the size of their export market. Poor countries such as South Africa and Ghana still battle the effects of colonisation and unstable political, financial and economic policies. South Africa’s backlog of prospecting rights, mining permits, and mining rights applications serves as an example.
Late-stage and feasibility exploration budgets indicate the rate at which exploration results are converted to mineral resources and reserves. For a country such as South Africa, where the gold price and output have little to no impact on grassroots and minesite budgets, it would be expected that the late-stage and feasibility coefficients would be weak. Ghana, on the other hand, showed a moderate to stronger late-stage and feasibility correlation because of the stronger correlations at the minesite stage.
The primary goal of minesite exploration is to generate additional proven reserves and to ensure that mining companies minimise costs by ensuring that deposits with the lowest production costs are exploited at the earliest time [15]. South African correlation coefficients suggested that demand-side factors influencing gold price and production had an asymmetrical relationship with the exploration in South Africa. The grassroots, and late-stage and feasibility budgets were not associated with gold price and annual production. Gold price had a weak positive effect on the minesite exploration budget. The decline in annual production did not hinder minesite exploration budgets.
4. Conclusions
This research aimed to evaluate the effect of gold price and production on the exploration budgets of the South African gold mining industry. The independent variables were gold price and annual gold production. The dependent variables were grassroots, late-stage and feasibility, and minesite exploration budgets. The correlation results were compared with other major developing gold-producing countries such as Ghana, Mexico and Russia. The research found that South African grassroots, late-stage, and feasibility exploration budgets were unrelated to the gold price and annual gold production. Minesite exploration budgets correlated positively with the gold price and correlated negatively with the decline in production. Ghana’s grassroots exploration budgets were also not correlated to the gold price and annual production. However, the Ghanaian minesite correlations were moderate to strong, which indicates that most mining companies are using minesite exploration to replace their resource/reserve profile.
South Africa urgently requires exploration investment to acquire new deposits, develop its mining industry and reform its socioeconomic conditions. The investment climate is a major deterrent to grassroots, late-stage and feasibility exploration investments. The value created from the gold price is not enough to pull an inflow of exploration investment, while the decline in production has worsened the situation.
The South African DMRE has published a strategy document titled "The Exploration Strategy for the Mining Industry of South Africa 2022". The objective of the strategy is to foster a mineral exploration and development initiative led by the South African Council of Geoscience that will increase the country's share of global exploration expenditure to 5% by 2025 [16]. The strategy will boost the country’s geological potential. However, South Africa must address issues that affect its exploration investment climate.
Funding
This research received no external funding.
Conflicts of Interest
The author declares no conflict of interest.
References
- Olofsson, T. Do commodity Prices Incentivize Exploration Permit Application? An Explorative Study of an Anecdotal Relation. Min. Econ. 2022, 35, 133–141. [Google Scholar] [CrossRef]
- Alexandrov, G.; Lablonev, A. Factors of Investment Attractiveness of Mining Industries: Methodology Identification and Assessment. E3S Web of Conf. 2020, 174, 1–6. [Google Scholar] [CrossRef]
- Simonsen, H.; Perry, J. Risk Identification, Assessment and Management in the Mining and Metallurgical Industries. J. South. Afri. Inst. Min. Metall. 1999, 9, 321–328. [Google Scholar]
- Jara, J.J.; Lagos, G. , Tilton, J.E. Using Exploration Expenditures to Assess the Climate for Mineral Investment. Resourc. Policy. 2008, 33, 179–187. [Google Scholar] [CrossRef]
- Vivoda, V. Determinants of Foreign Direct Investment in the Mining Industry. In Mining in the Asia-Pacific: Risks, Challenges and Opportunities, O’Callaghan T., Graetz, G., Eds.; Springer: Cham, Switzerland, 2017; pp. 19–33. [Google Scholar]
- Kasatuka, C.; Minnitt, R.C.A. Investment and Non-Commercial Risks in Developing Countries. J. South. Afri. Inst. Min. Metall. 2006, 106, 849–856. [Google Scholar]
- Schodde, R. Long Term Trends in Gold Exploration. In Proceedings of the 2015 NewGenGold Conference, Perth, Australia, 17-18th November 2015. [Google Scholar]
- Parliament of the Republic of South Africa. Available online: https://www.parliament.gov.za/press-releases/media-statement-mineral-resources-and-energy-committee-welcomes-departments-commitment-address-licence-application-backlog (accessed on 1 September 2022).
- World Gold Council. Available online: https://www.lbma.org.uk/prices-and-data/lbma-daily-trade-reporting-data (accessed on 1 September 2025).
- S&P Global Market Intelligence. Available online: https://www.marketplace.spglobal.com/en/datasets/s-p-capital-iq-estimates-(1) (accessed on 1 September 2022).
- United States Geological Survey. Available online: https://www.usgs.gov/centers/national-minerals-information-center/gold-statistics-and-information (accessed on 1 September 2025).
- Adams, R.G.; Gilbert, C.L.; Stobart, C.G. Modern Management in the Global Mining Industry; Emerald Publishing: Bingley, United Kingdom, 2019; pp. 215–230. [Google Scholar]
- Khindanova, I. Exploration Funding and the Mineral Investment Climate. J. BUS. FINAN. ACCOUNT. 2015, 19, 1–12. [Google Scholar]
- Castillo, E. The Impacts of Profit-Based Royalties on Early-Stage Mineral Exploration. Resourc. Policy. 2021, 73, 1–16. [Google Scholar] [CrossRef]
- Attanasi, E.D. Design of Exploration and Minerals-Data-Collection Programs in Developing Areas. Socio-Econ. Plann. Sci. 1981, 15, 347–352. [Google Scholar] [CrossRef]
- Department of Mineral Resources and Energy. Available online: https://www.dmre.gov.za/Portals/0/Energy_Website/files/media/Pub/Exploration-Strategy-for-Mining-Industry.pdf (accessed on 1 September 2022).
Figure 1.
South African Share of the Global Exploration Expenditure.
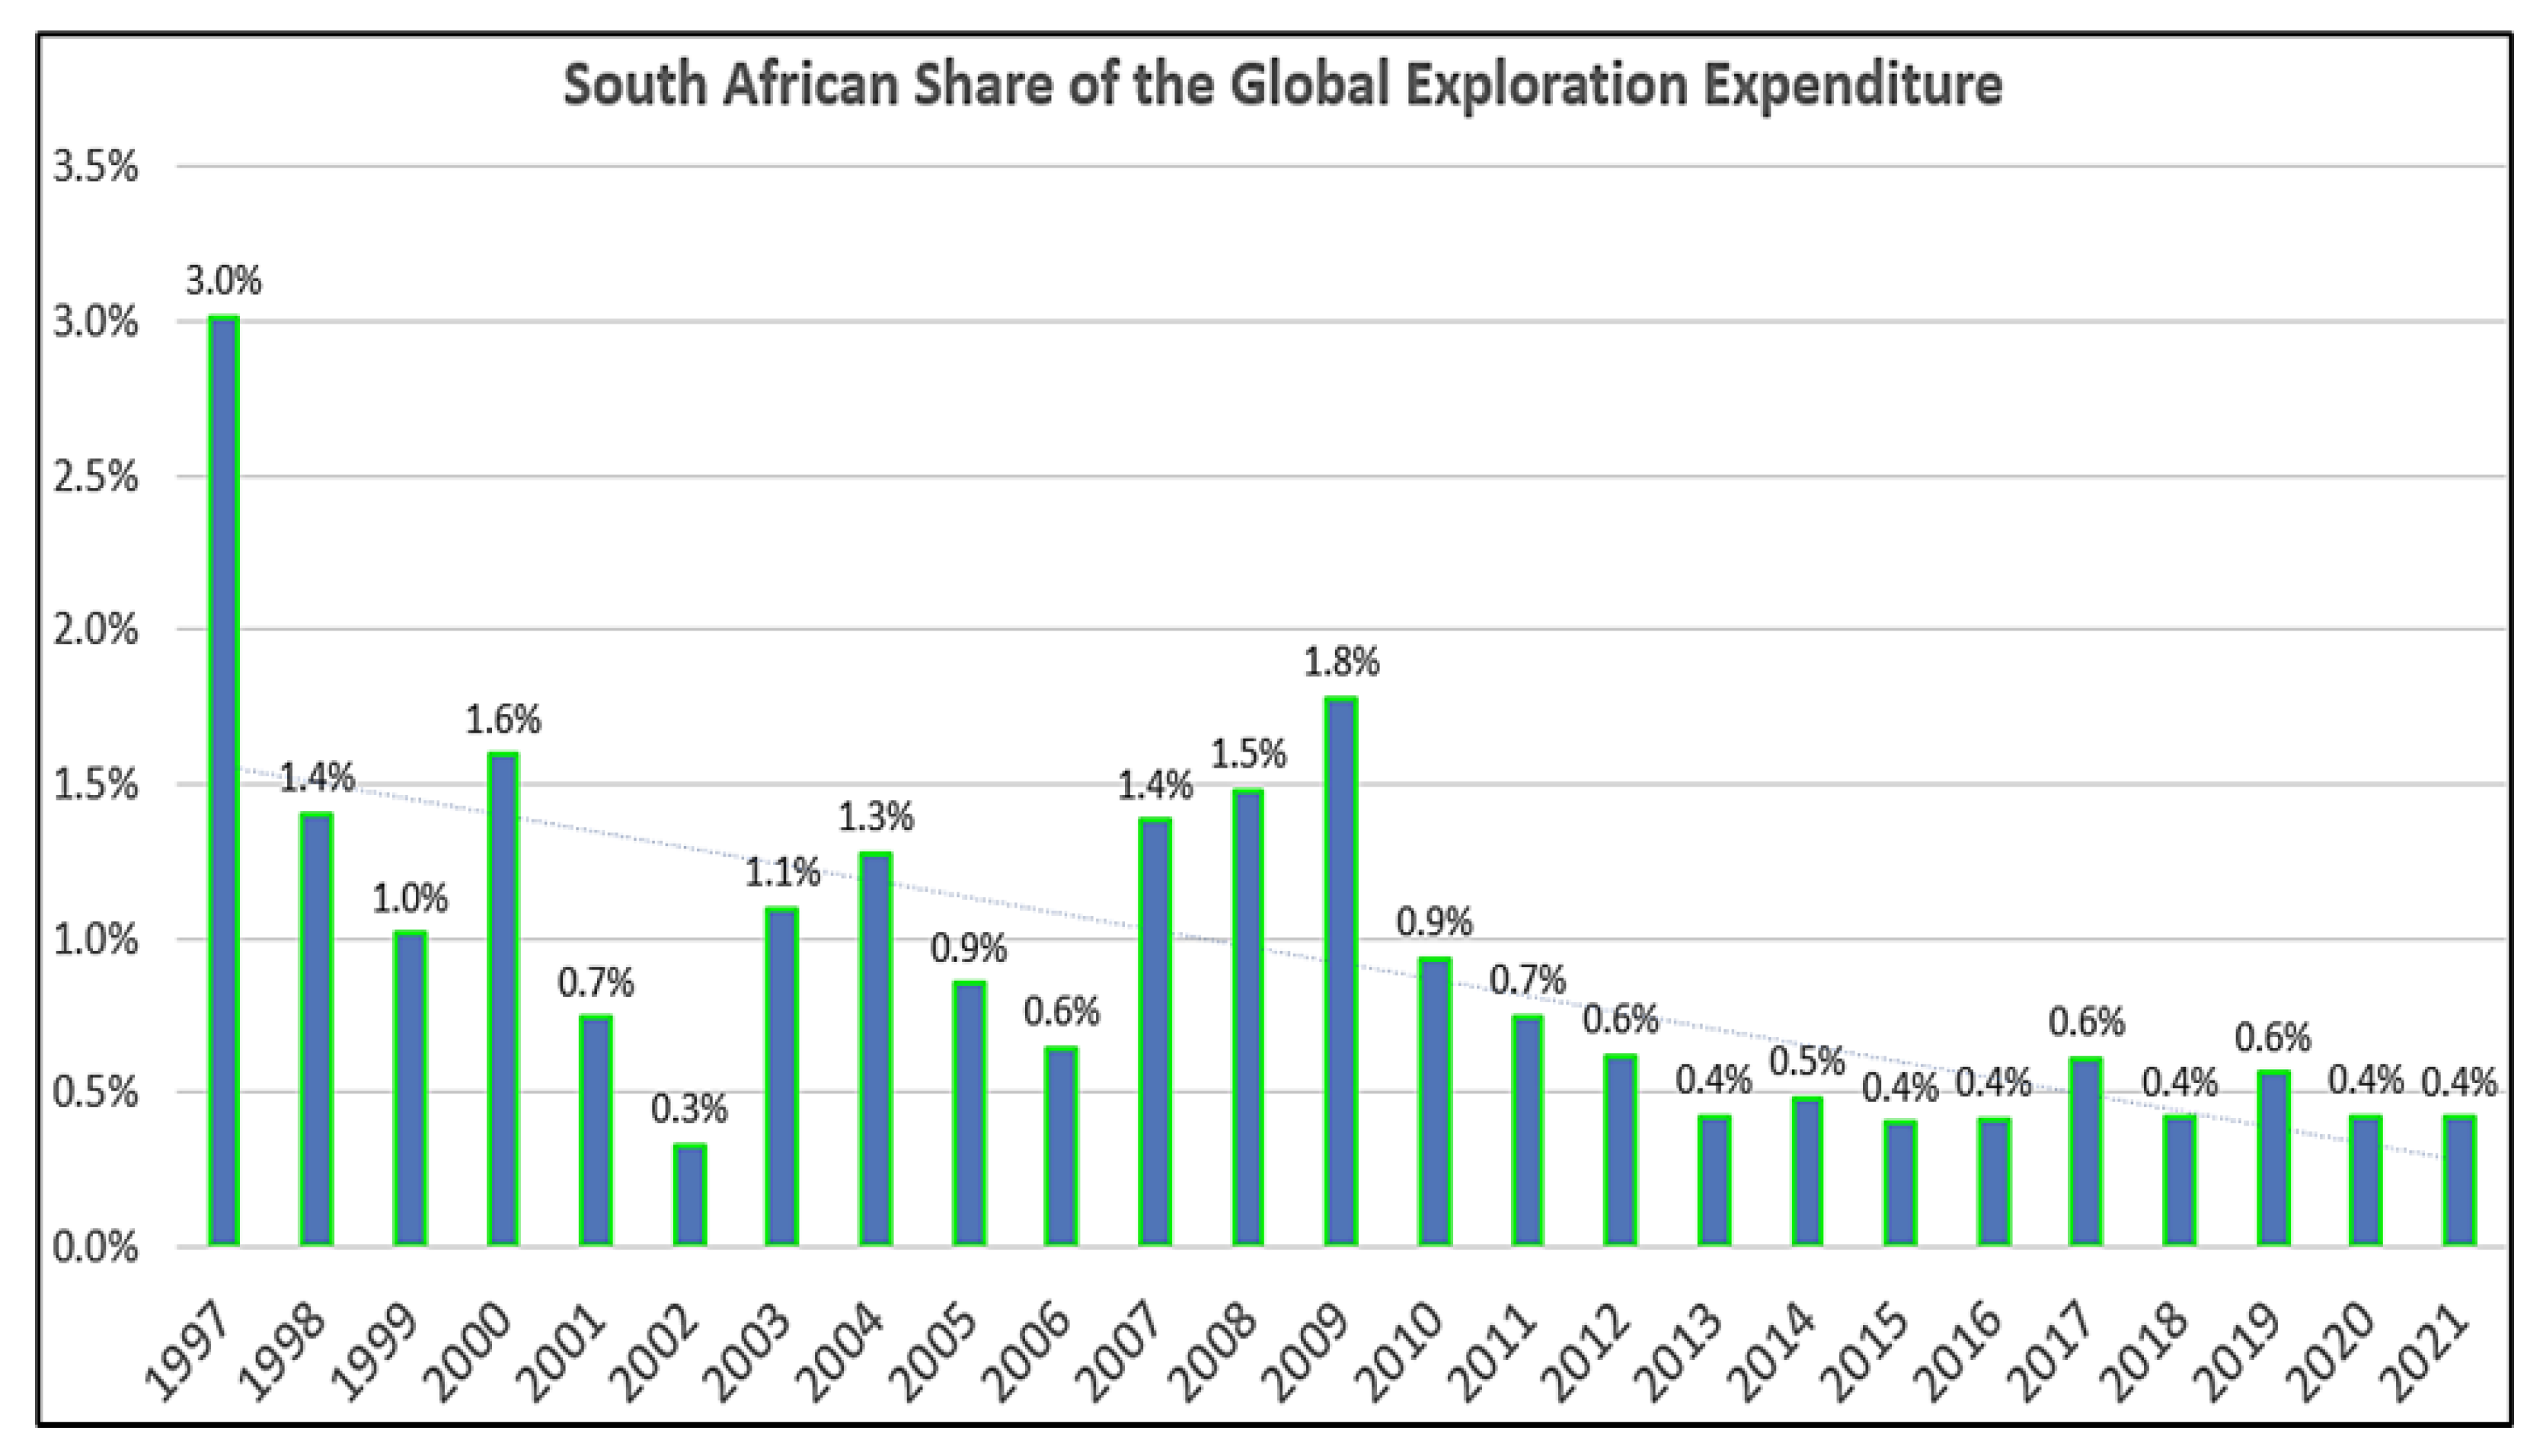
Figure 2.
Exploration budgets stage along the mine value chain (Modified after [12]).
Figure 2.
Exploration budgets stage along the mine value chain (Modified after [12]).
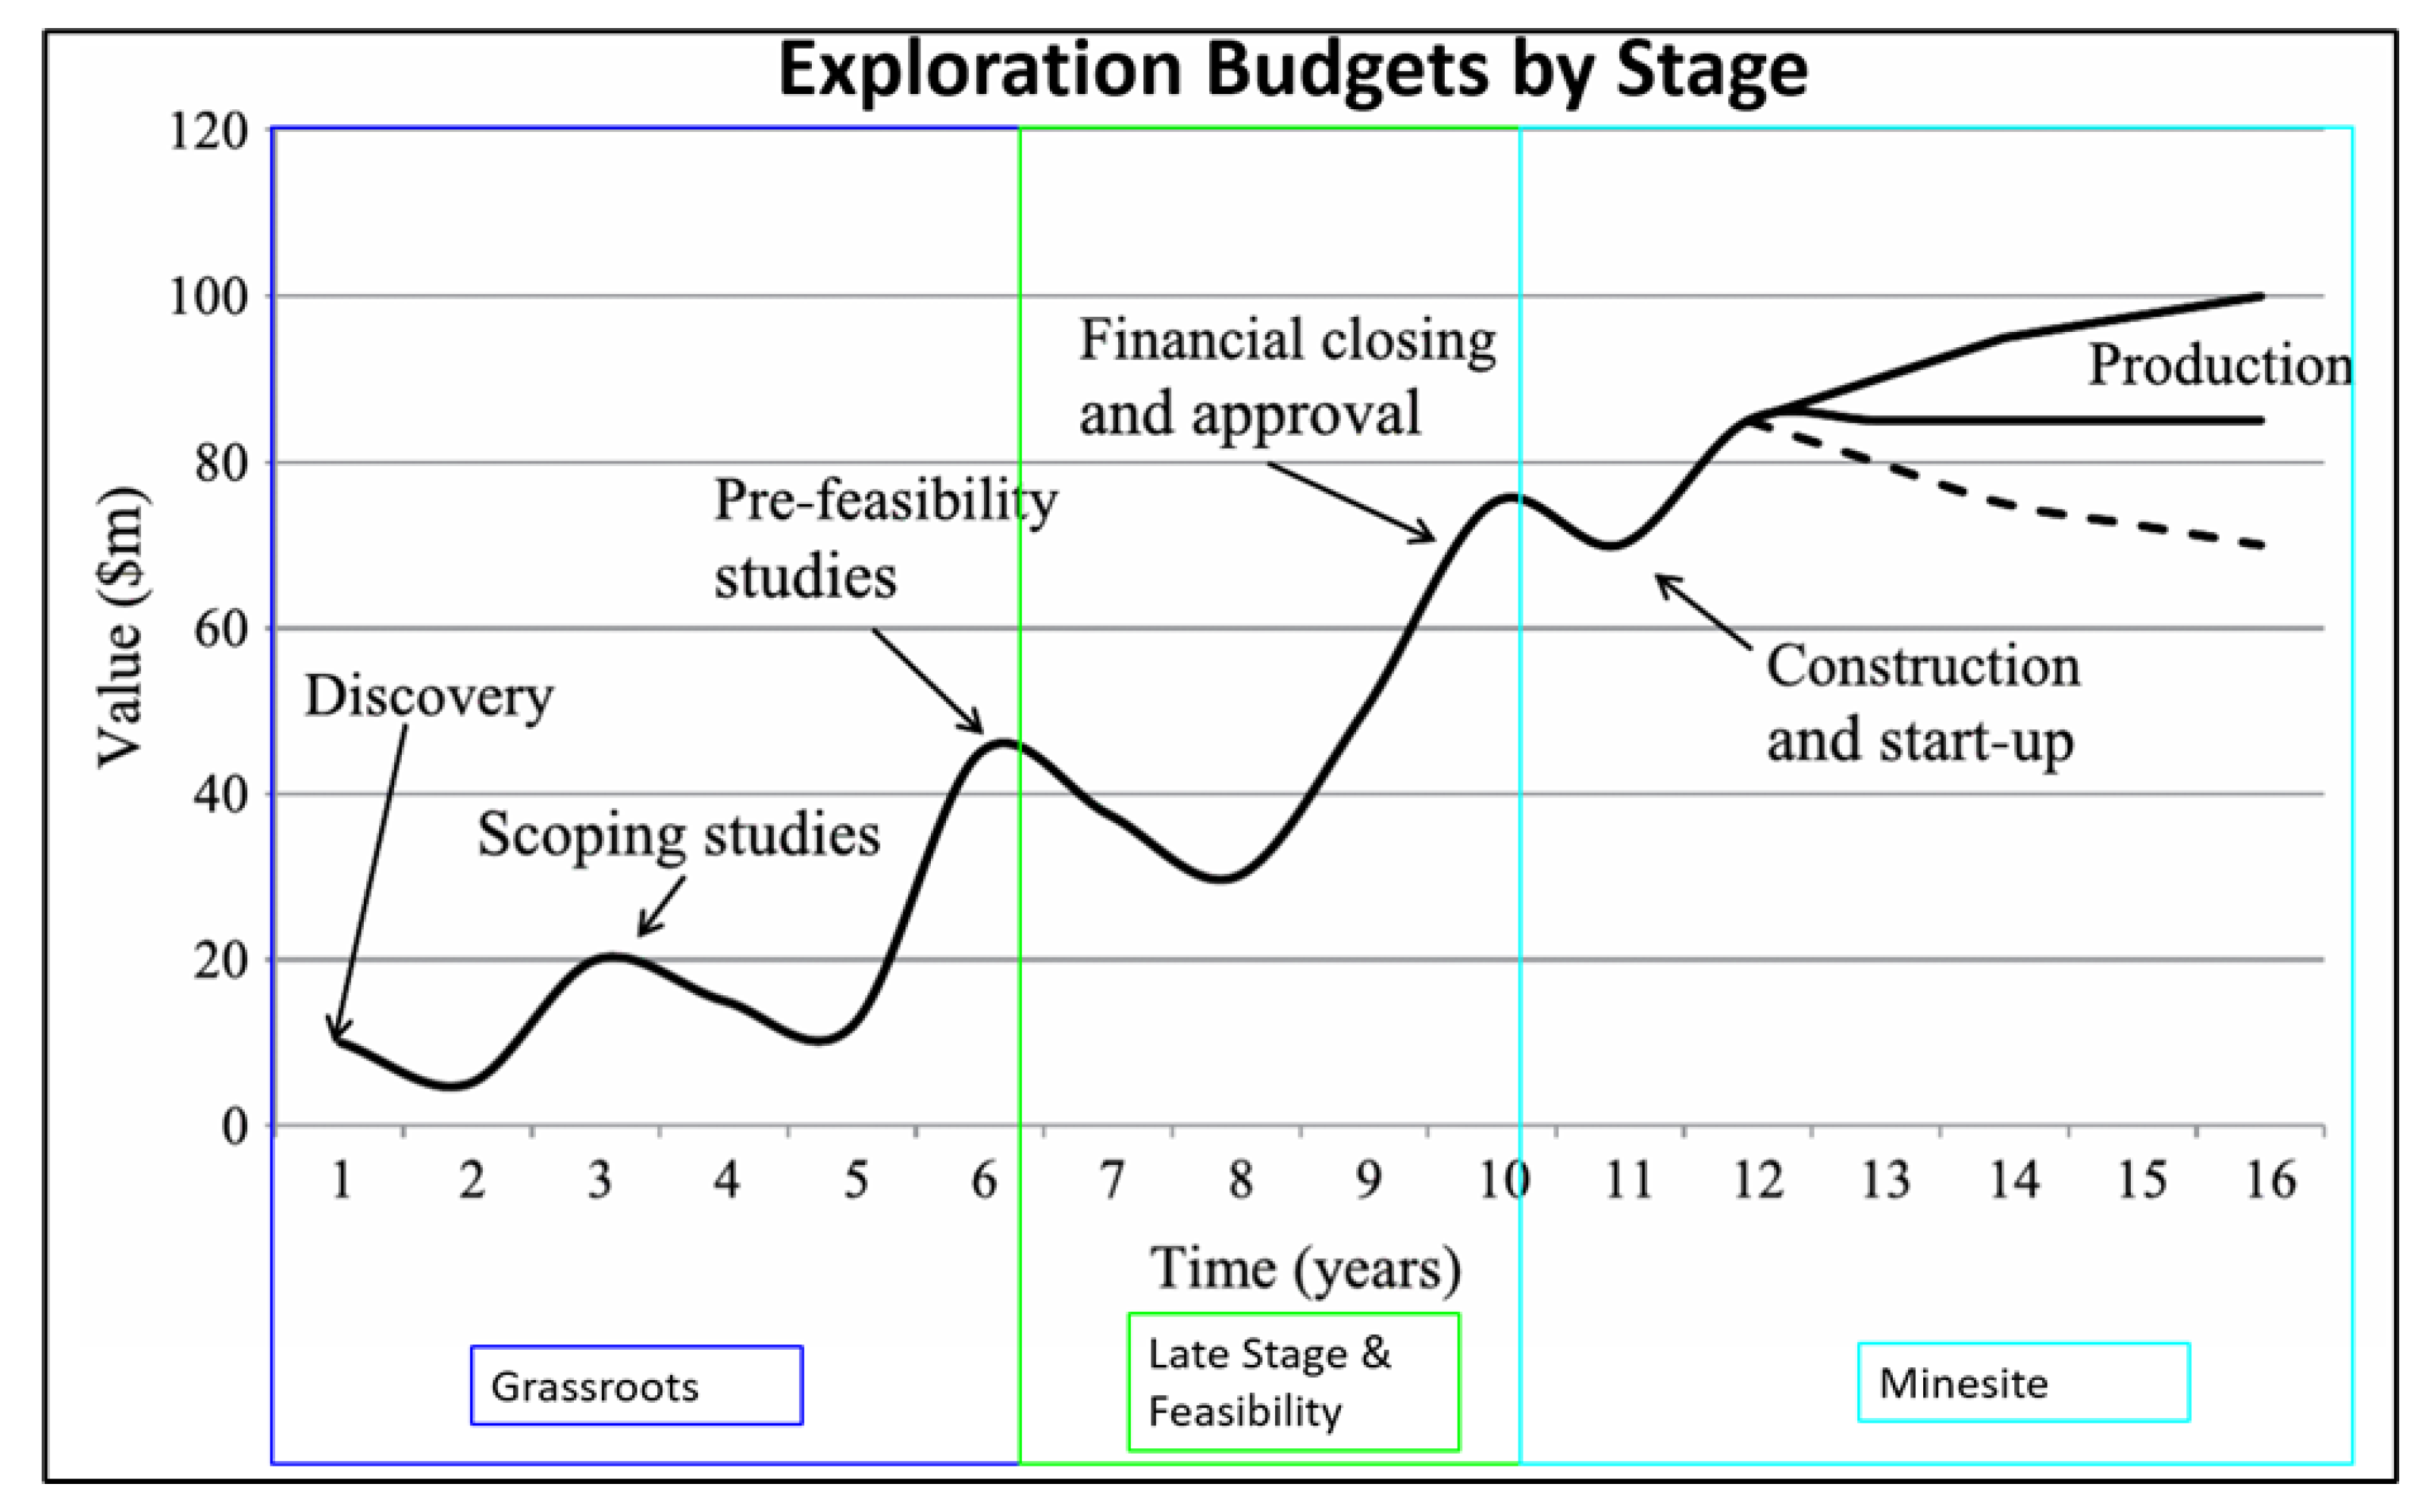
Figure 3.
South African grassroots, late-stage and feasibility exploration budgets and gold price.
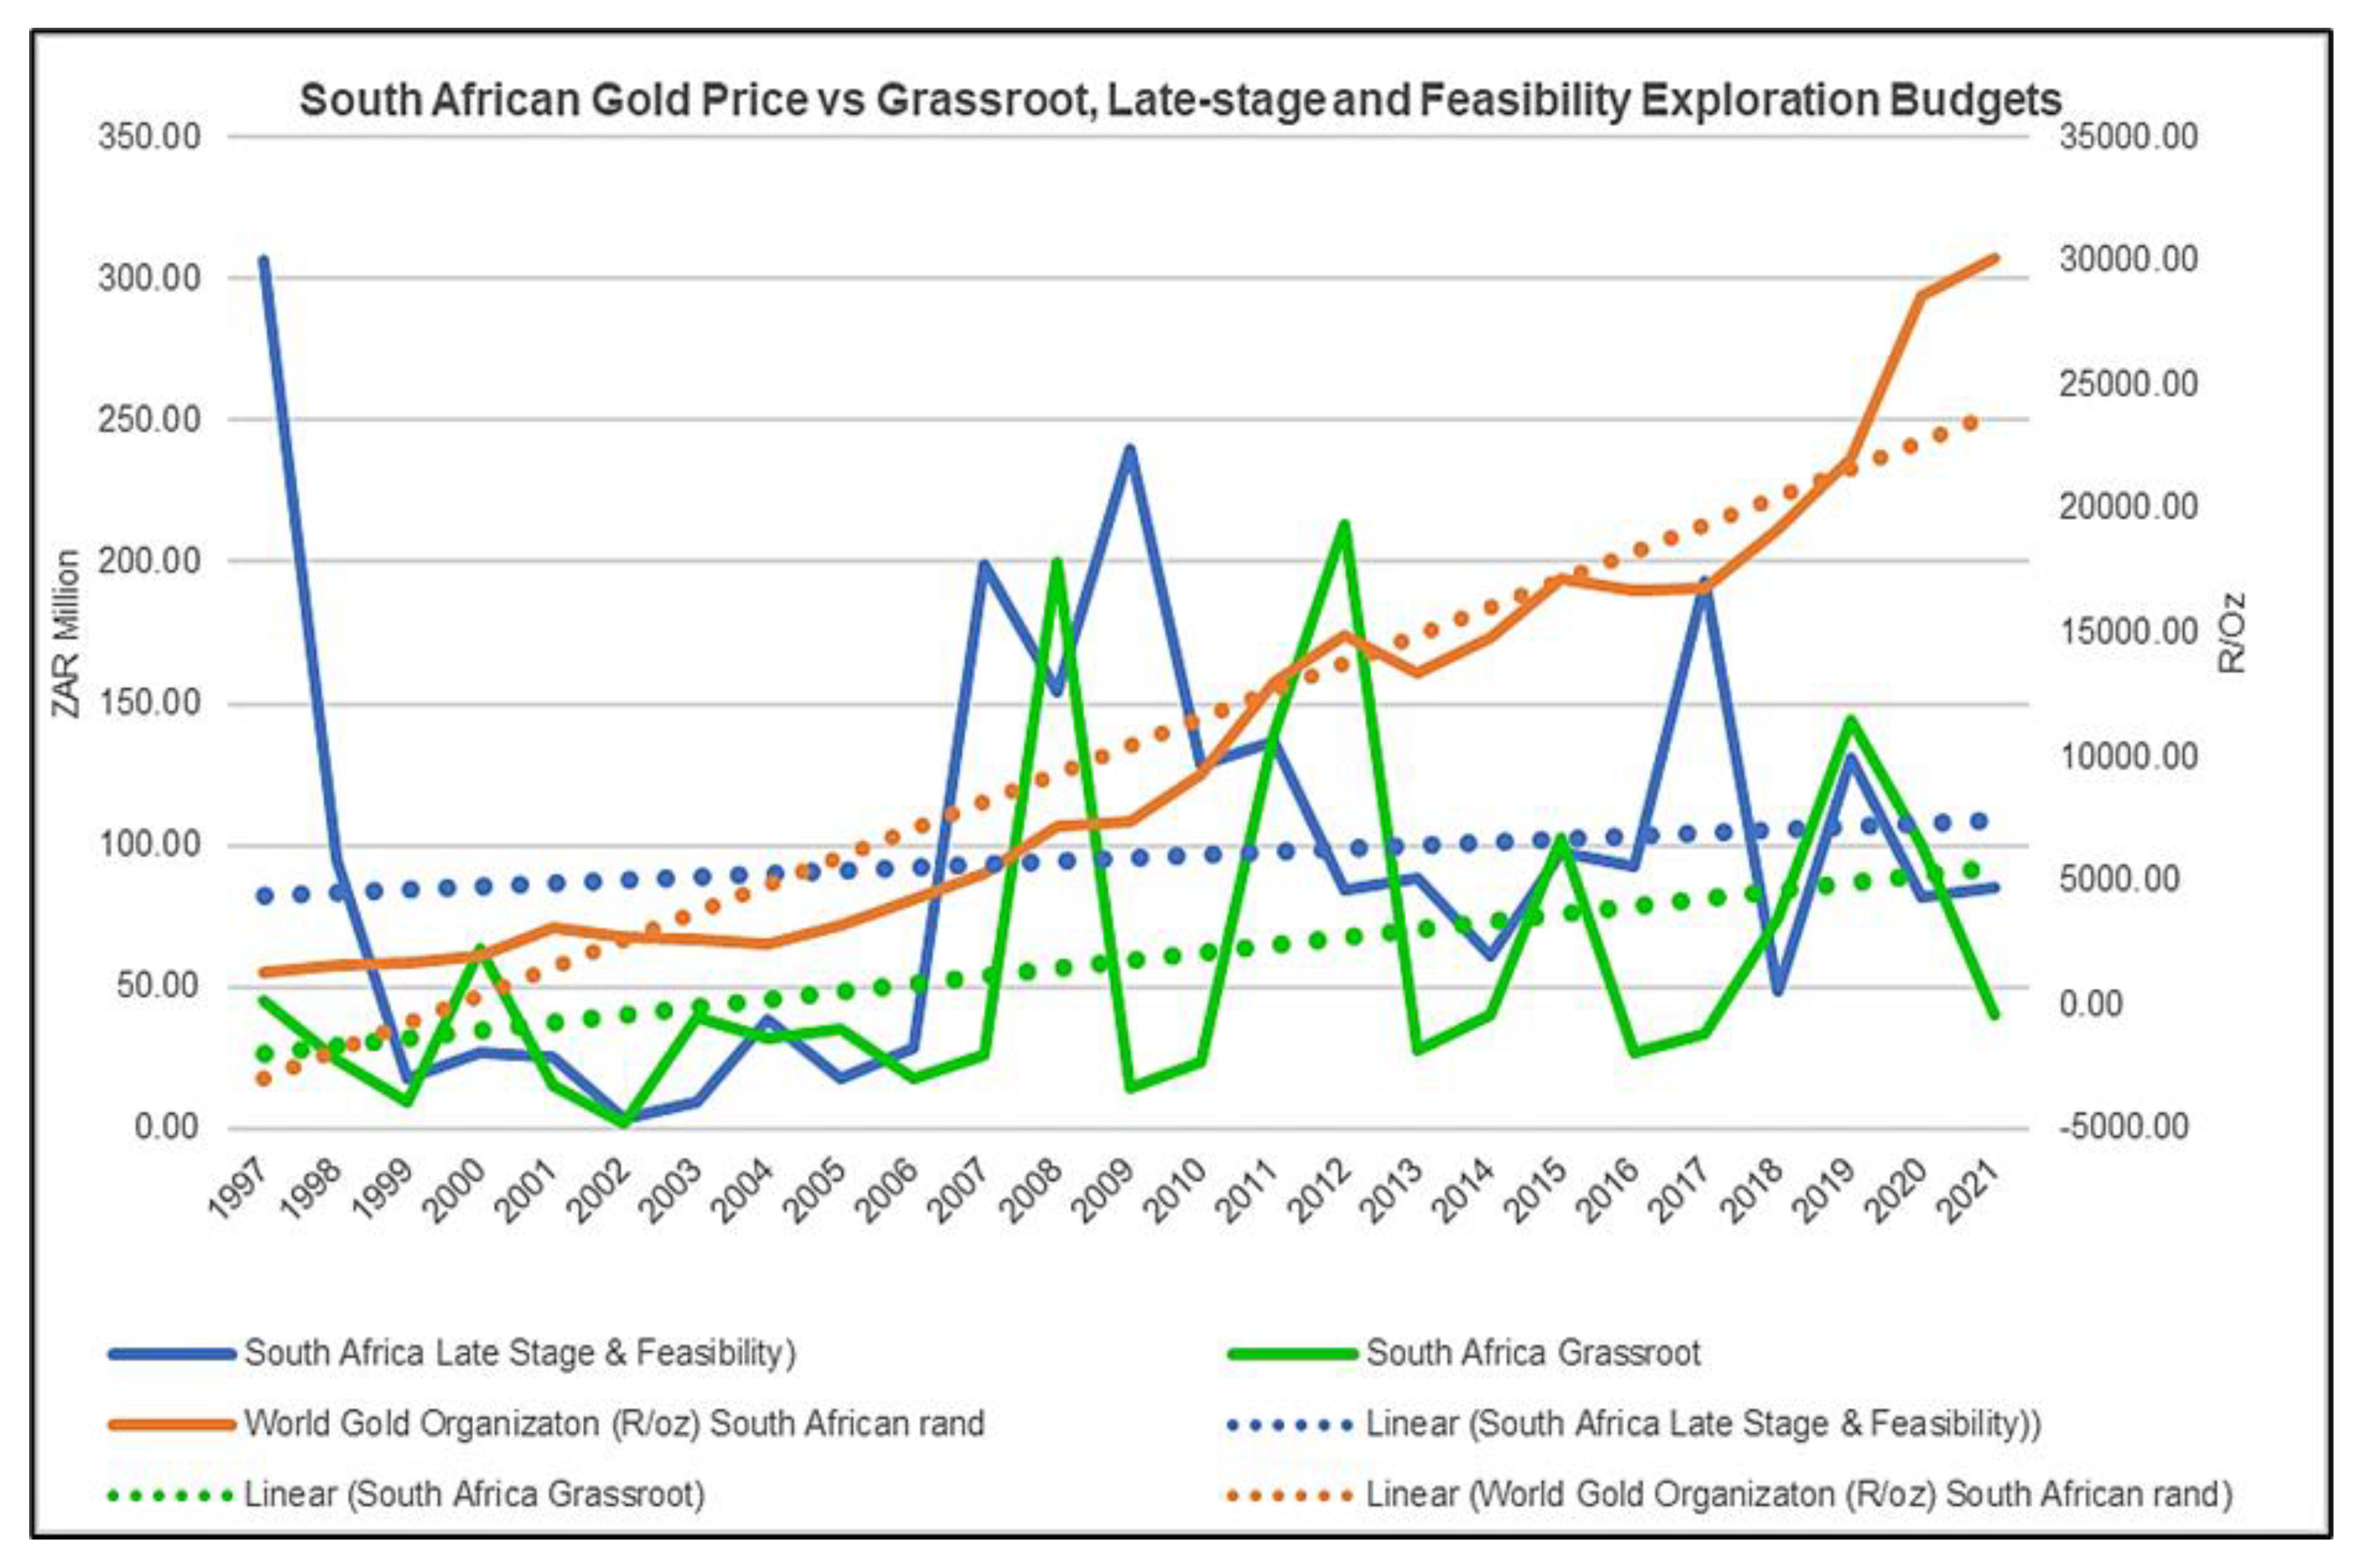
Figure 4.
South African minesite exploration budget and gold price.
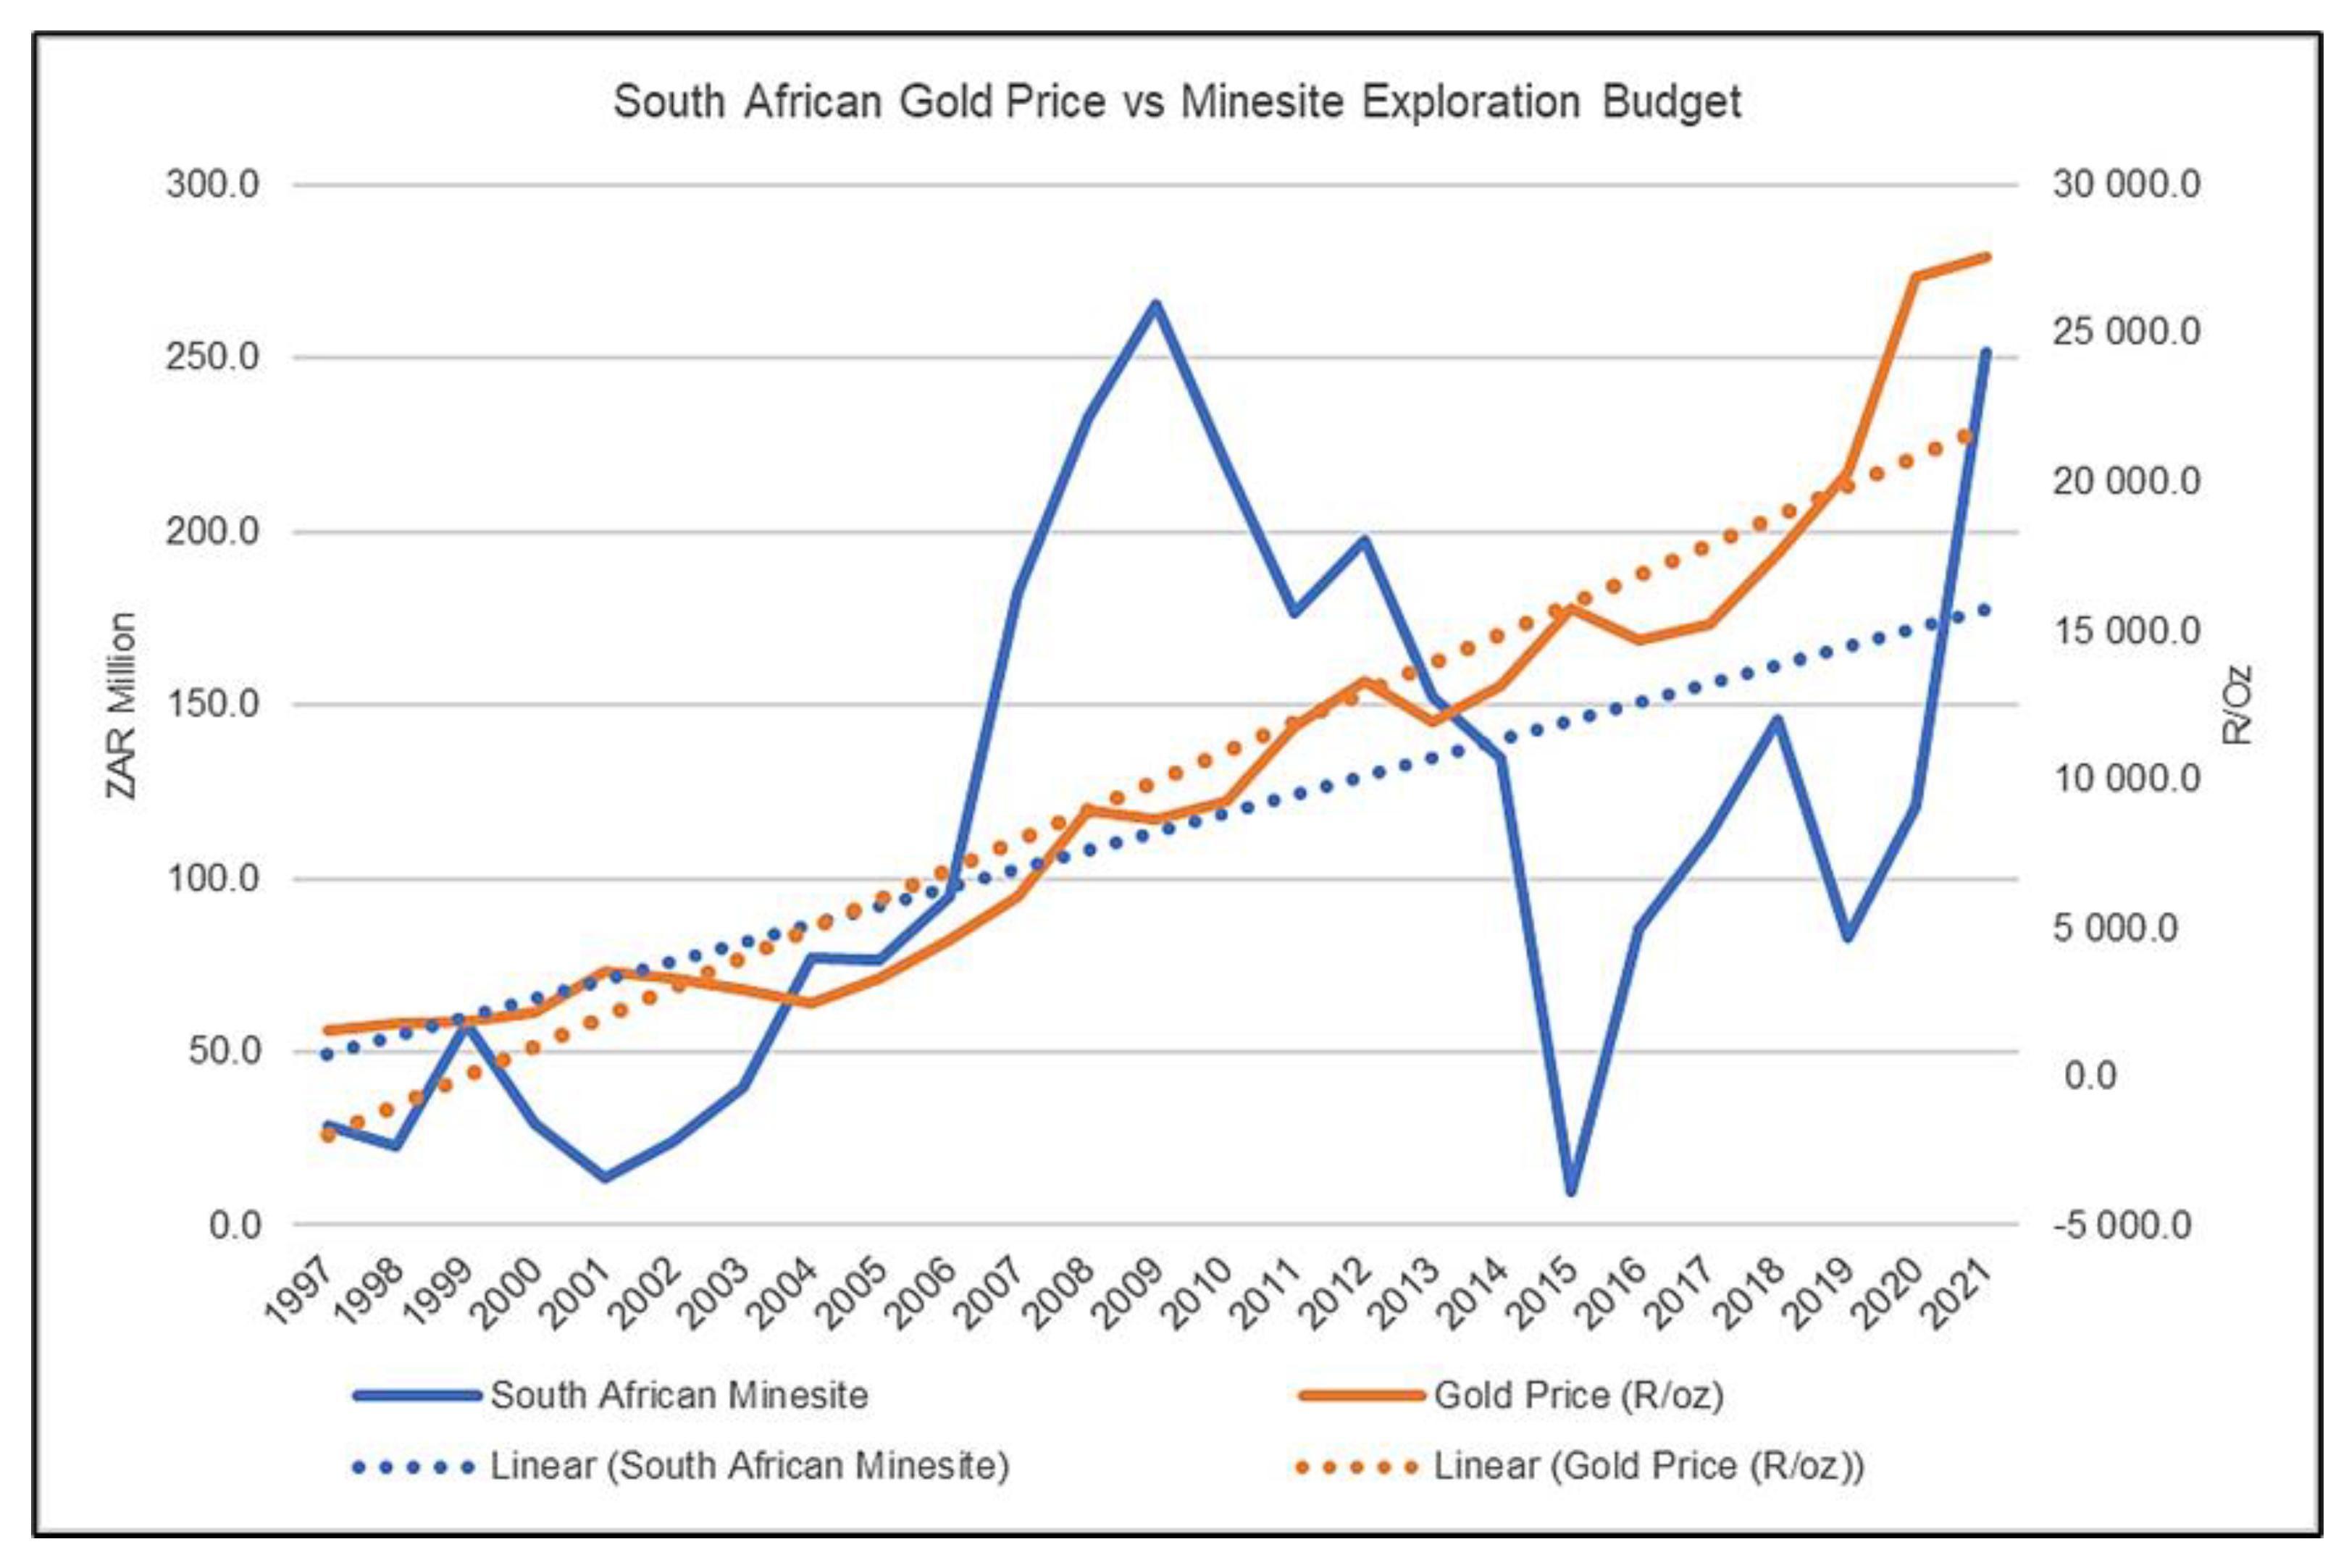
Figure 5.
South African grassroots, late-stage and feasibility exploration budgets and production.
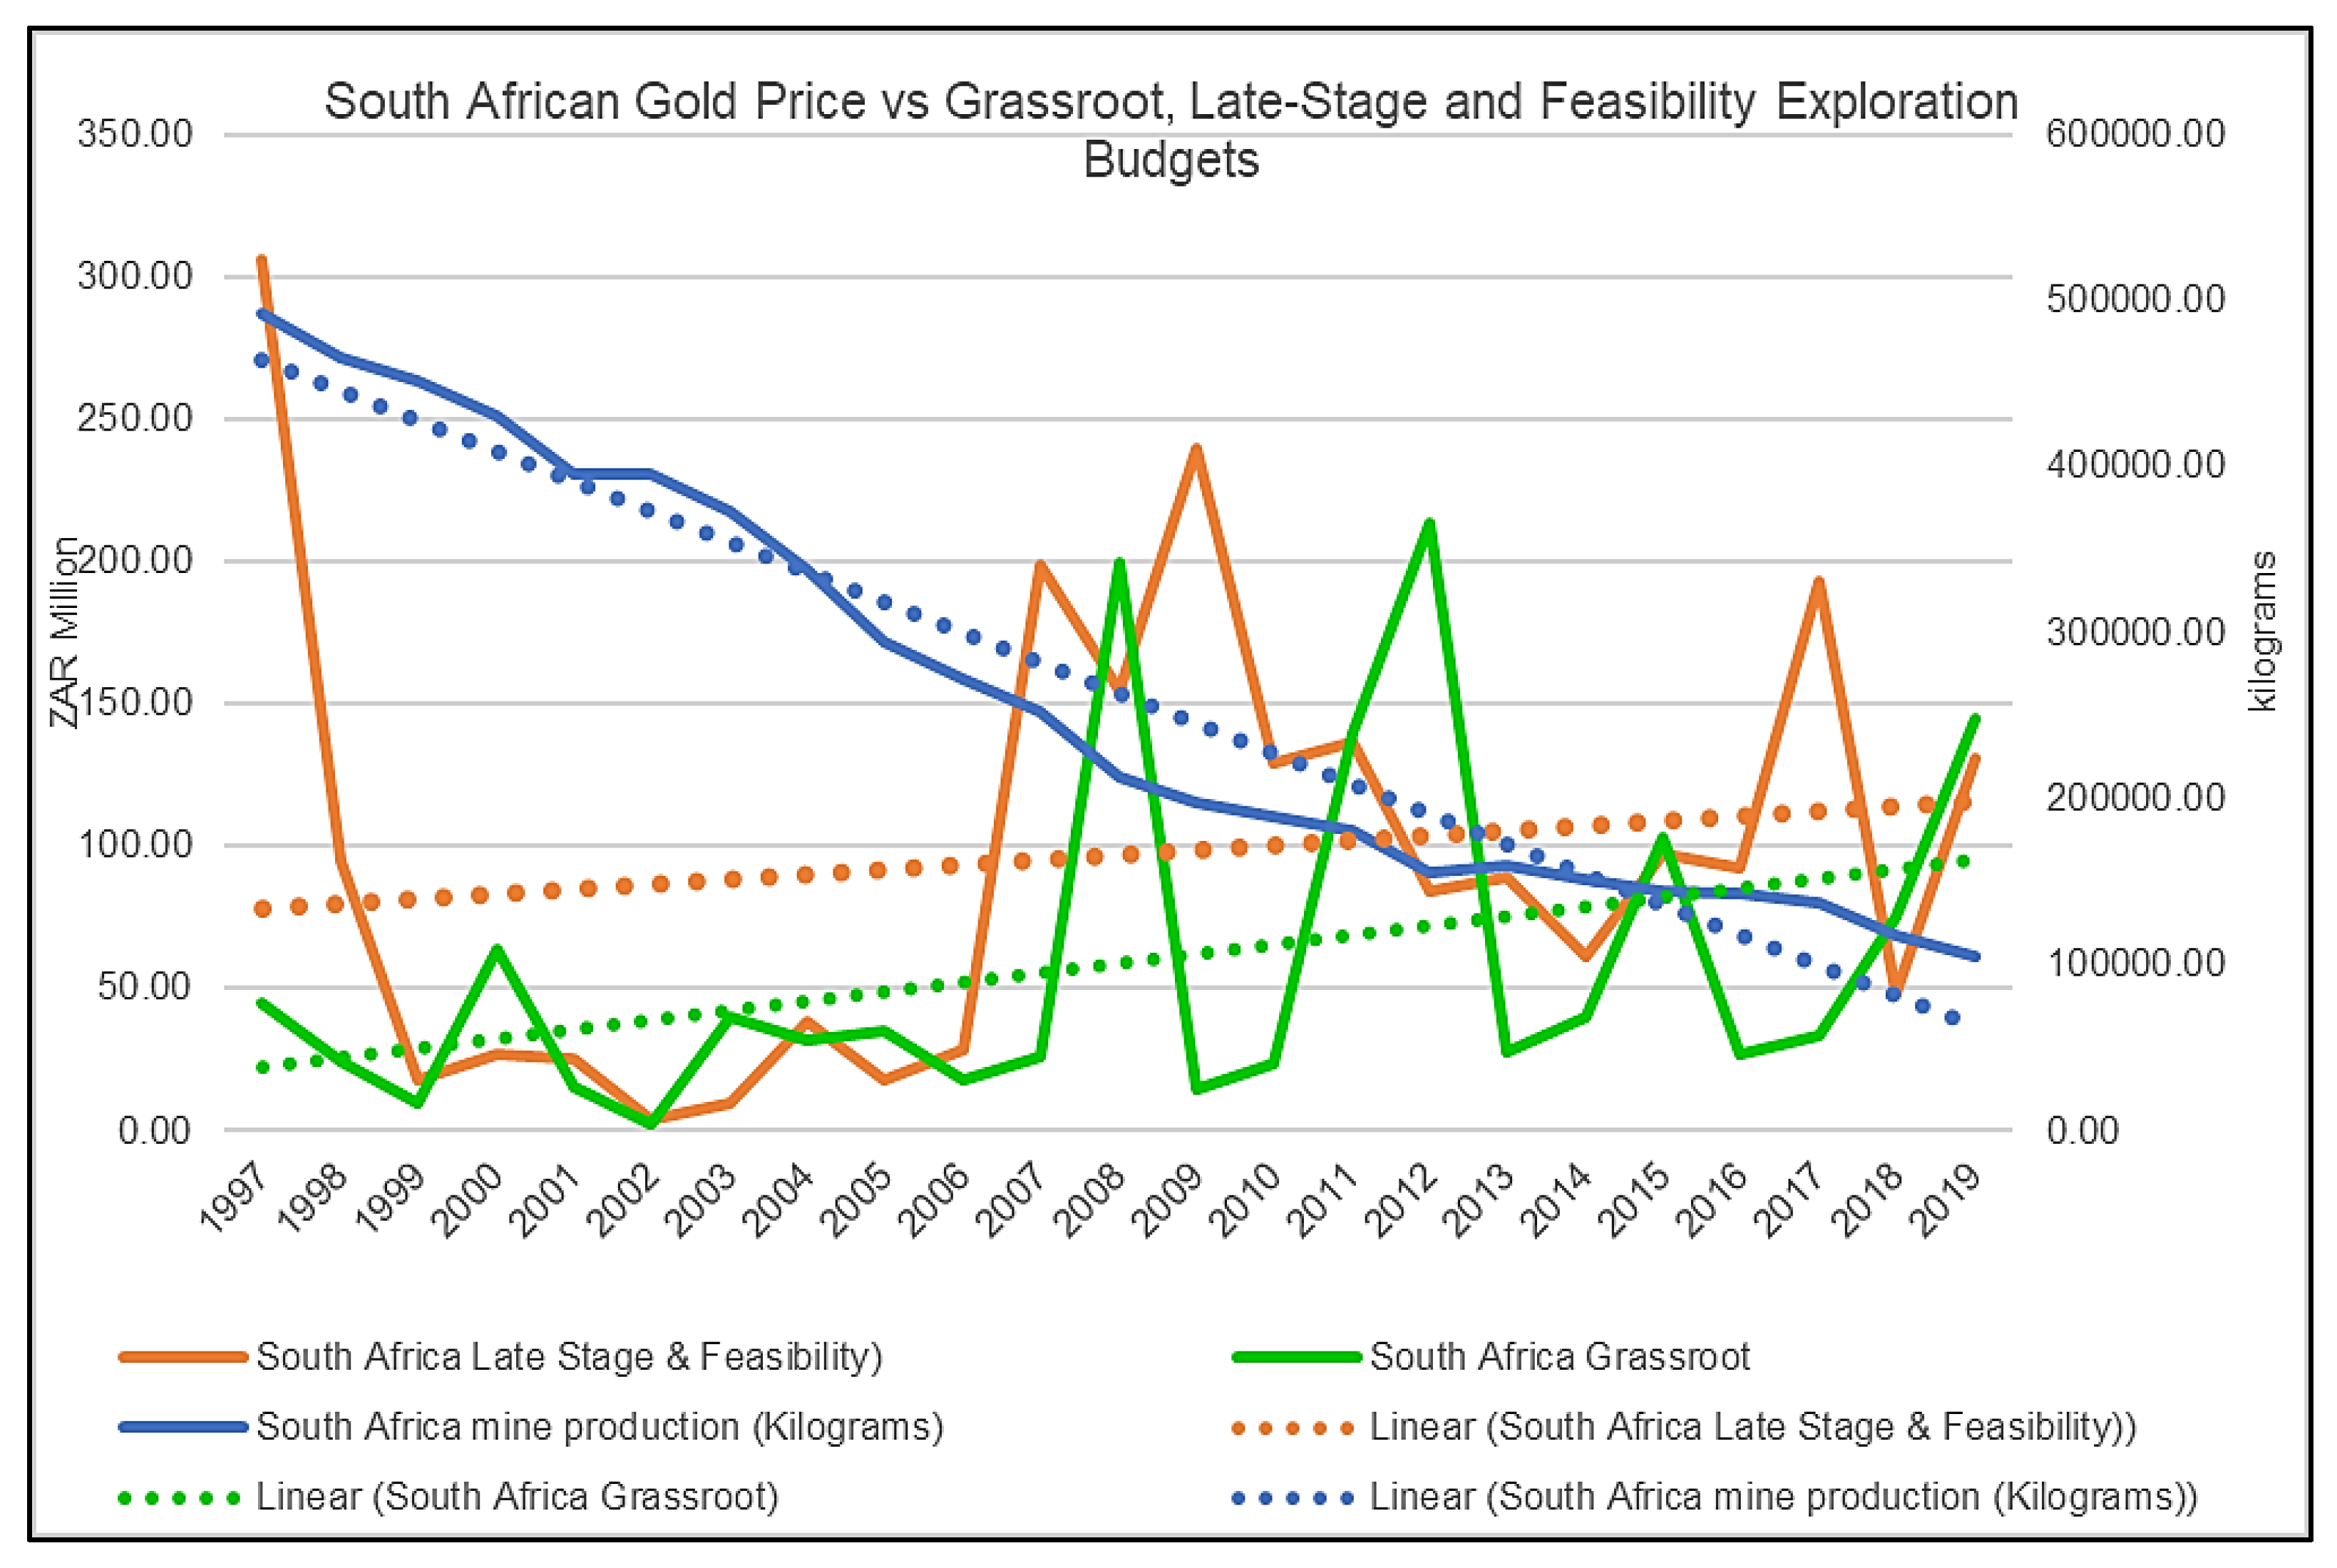
Figure 6.
A graph showing South African gold production and minesite exploration budgets.
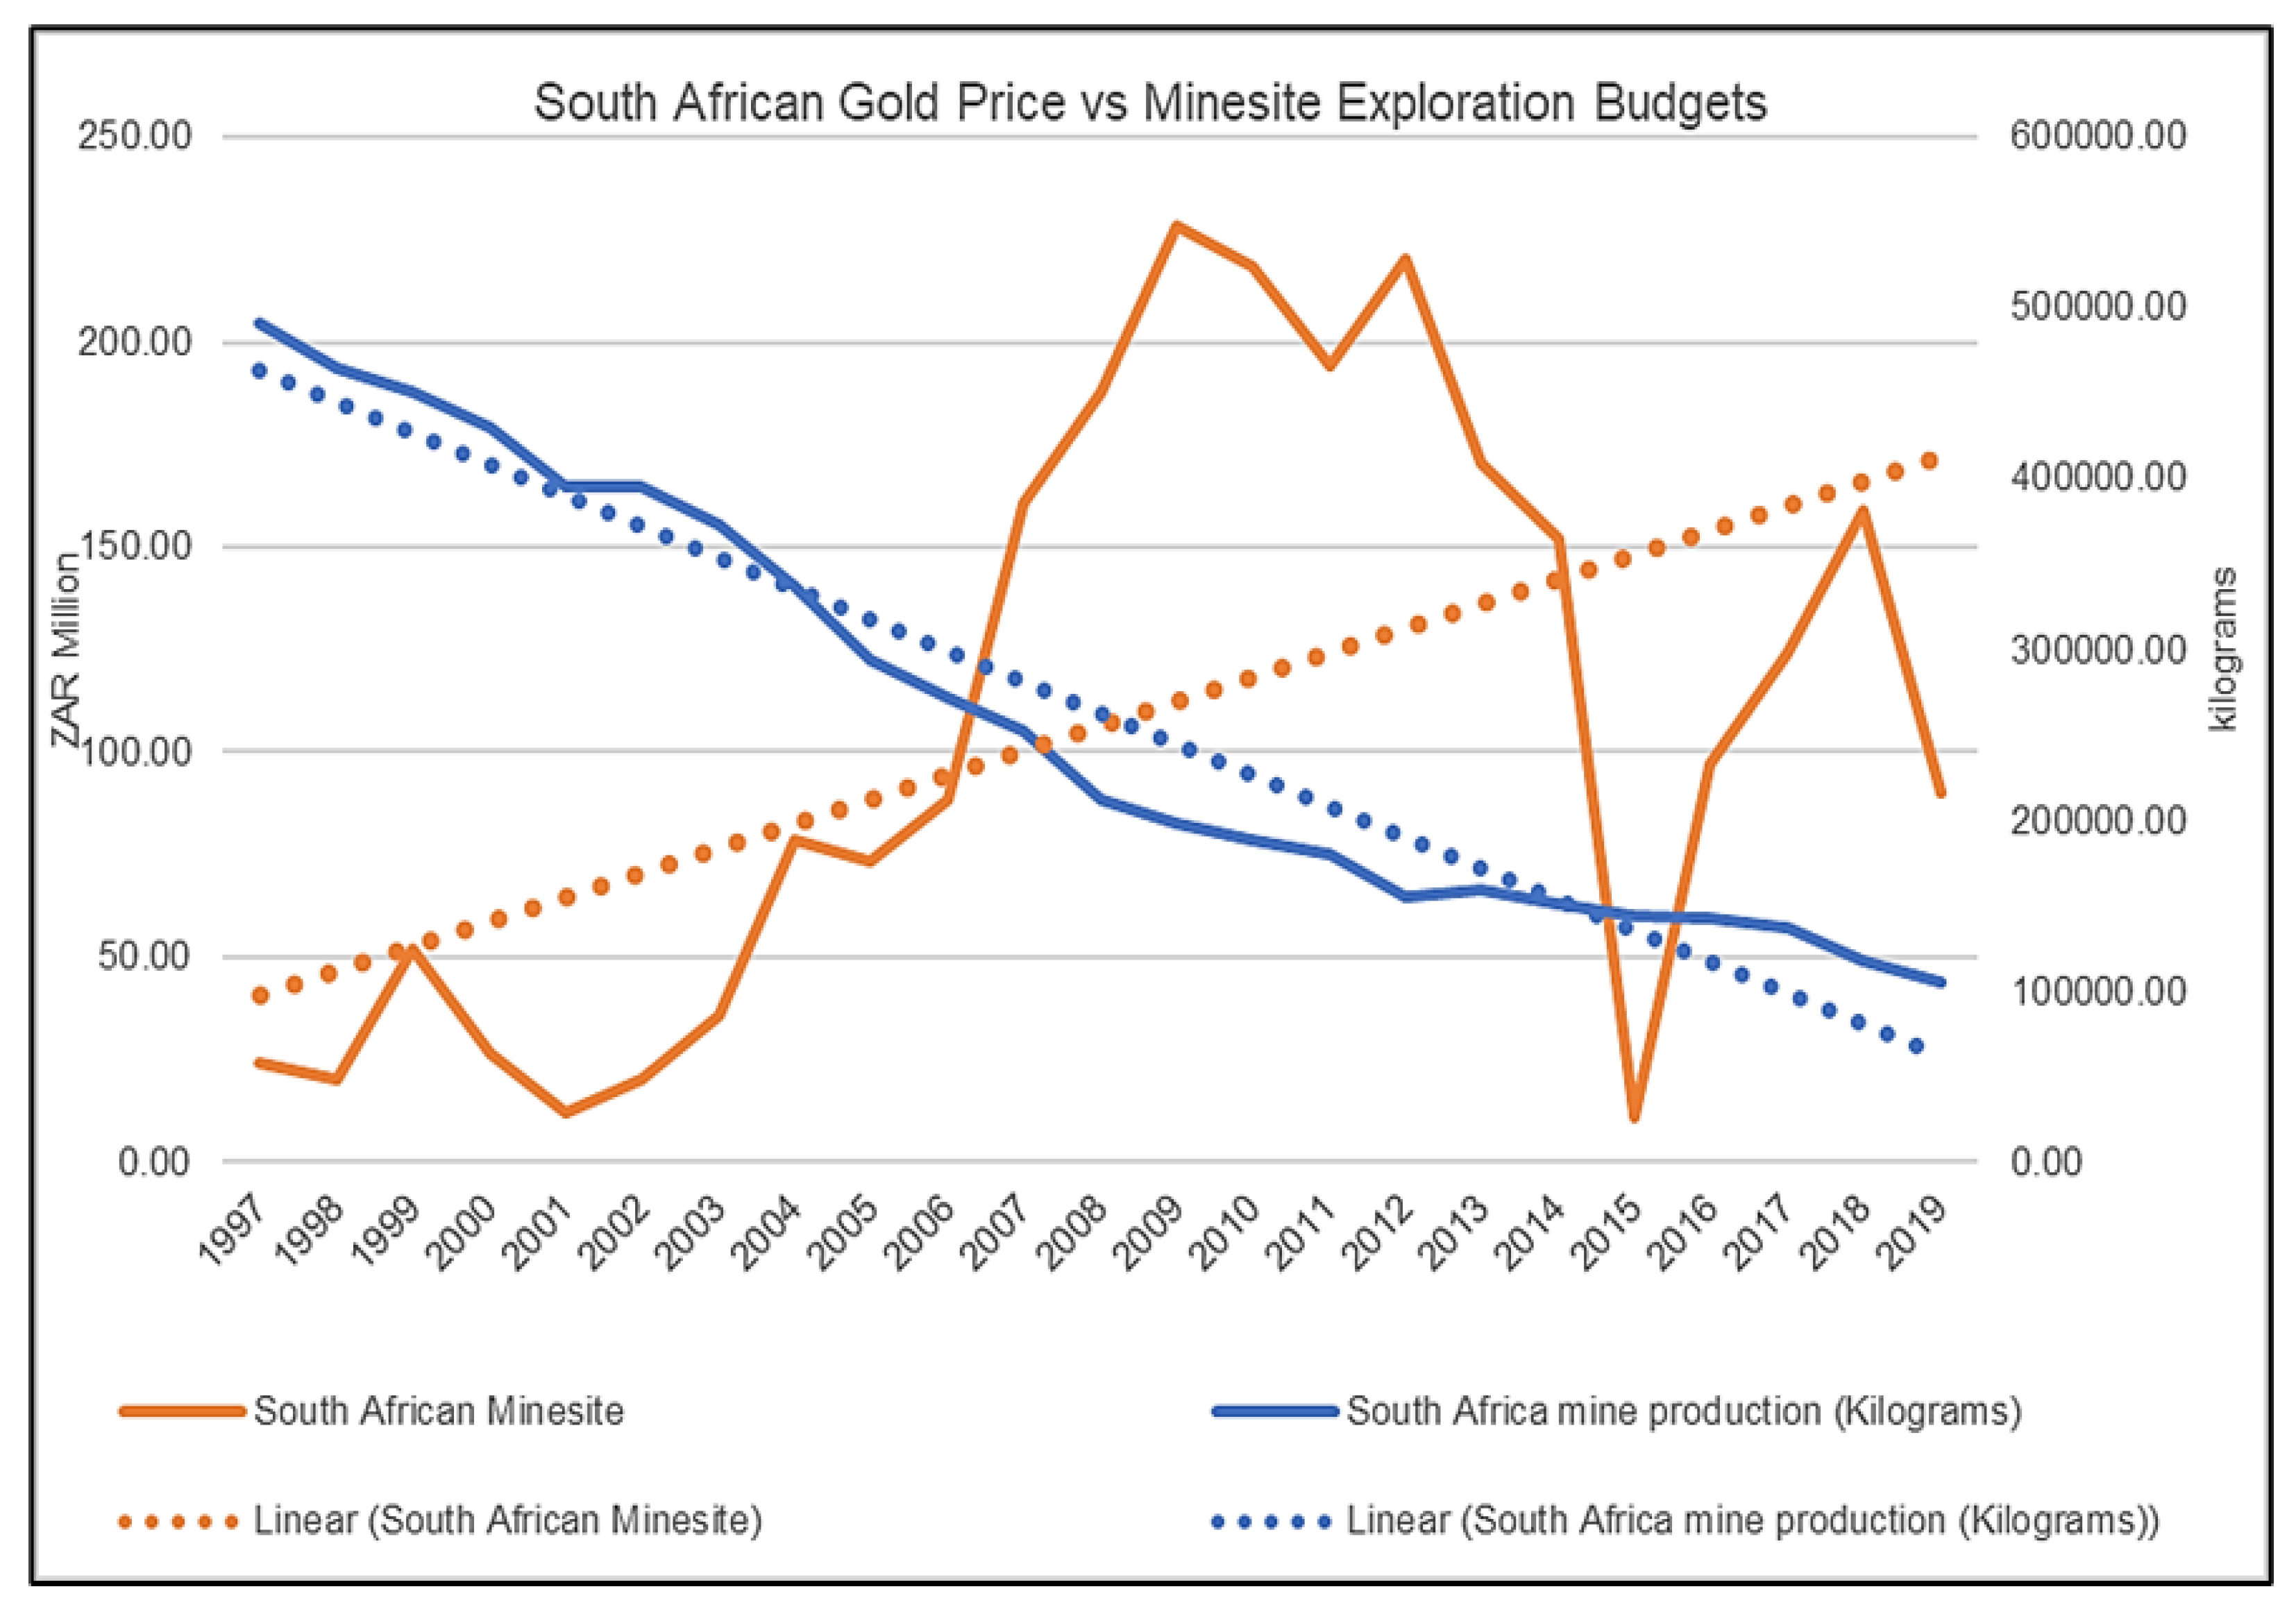

Table 1.
Correlation strength classification.
| Correlation coefficient | Strength classification |
| 0.00 to 0.19 | Very weak |
| 0.19 to 0.39 | Weak |
| 0.40 to 0.59 | Moderate |
| 0.60 to 0.79 | Strong |
| 0.80 to 1.00 | Very strong |
Table 2.
Descriptive statistical analysis for South African exploration budget data.
| South Africa | Late stage & feasibility | Minesite | South African grassroot | Gold Price | Production |
| Mean | 97.21 | 113.54 | 59.54 | 10 178.01 | 263 082.74 |
| Median | 81.34 | 91.44 | 35.67 | 8 040.84 | 212 571.00 |
| Standard Deviation | 82.48 | 78.73 | 58.43 | 8 154.95 | 127 021.51 |
| Kurtosis | 1.72 | 1.09 | 2.19 | 0.09 | 1.28 |
| Skewness | 1.33 | 0.33 | 1.68 | 0.83 | 0.49 |
| Count | 25 | 25 | 25 | 25 | 25 |
Table 3.
Gold price correlation analysis results.
| Exploration Stage | Country | Spearman correlation analysis | Kendall correlation analysis | ||||
| Rho | t-test | p-value | Tau | z-test | p-value | ||
| Grassroots | South Africa | 0.41 | 2.17 | 0.04 | 0.27 | 1.87 | 0.06 |
| Ghana | 0.14 | 0.66 | 0.51 | 0.11 | 0.75 | 0.45 | |
| Mexico | 0.73 | 5.17 | 0.00 | 0.49 | 3.46 | 0.00 | |
| Russia | 0.61 | 3.72 | 0.00 | 0.41 | 2.85 | 0.00 | |
| Late stage and feasibility | South Africa | 0.25 | 1.22 | 0.24 | 0.14 | 0.98 | 0.33 |
| Ghana | 0.73 | 5.05 | 0.00 | 0.49 | 3.46 | 0.00 | |
| Mexico | 0.8 | 6.41 | 0.00 | 0.59 | 4.11 | 0.00 | |
| Russia | 0.82 | 6.75 | 0.00 | 0.62 | 4.34 | 0.00 | |
| Minesite | South Africa | 0.51 | 2.81 | 0.01 | 0.32 | 2.24 | 0.02 |
| Ghana | 0.94 | 13.5 | 0.00 | 0.81 | 5.65 | 0.00 | |
| Mexico | 0.88 | 8.89 | 0.00 | 0.69 | 4.86 | 0.00 | |
| Russia | 0.94 | 12.94 | 0.00 | 0.83 | 5.79 | 0.00 | |
Table 4.
Annual gold production correlation analysis results.
| Exploration Stage | Country | Spearman correlation analysis | Kendall correlation analysis | ||||
| Rho | t-test | p-value | Tau | z-test | p-value | ||
| Grassroots | South Africa | -0.38 | 1.86 | 0.08 | -0.25 | -1.66 | 0.10 |
| Ghana | 0.24 | 1.11 | 0.28 | 0.16 | 1.08 | 0.28 | |
| Mexico | 0.85 | 7.51 | 0.00 | 0.67 | 4.46 | 0.00 | |
| Russia | 0.47 | 2.46 | 0.02 | 0.3 | 2.03 | 0.04 | |
| Late stage and feasibility | South Africa | -0.31 | 1.48 | 0.15 | -0.19 | -1.29 | 0.2 |
| Ghana | 0.64 | 3.81 | 0.00 | 0.42 | 2.77 | 0.01 | |
| Mexico | 0.84 | 7.12 | 0.00 | 0.65 | 4.36 | 0.00 | |
| Russia | 0.70 | 4.49 | 0.00 | 0.51 | 3.41 | 0.00 | |
| Minesite | South Africa | -0.50 | 2.61 | 0.02 | -0.33 | -2.19 | 0.03 |
| Ghana | 0.79 | 5.93 | 0.00 | 0.60 | 3.99 | 0.00 | |
| Mexico | 0.87 | 8.15 | 0.00 | 0.69 | 4.62 | 0.00 | |
| Russia | 0.88 | 8.51 | 0.00 | 0.71 | 4.73 | 0.00 | |
Disclaimer/Publisher’s Note: The statements, opinions and data contained in all publications are solely those of the individual author(s) and contributor(s) and not of MDPI and/or the editor(s). MDPI and/or the editor(s) disclaim responsibility for any injury to people or property resulting from any ideas, methods, instructions or products referred to in the content. |
© 2025 by the authors. Licensee MDPI, Basel, Switzerland. This article is an open access article distributed under the terms and conditions of the Creative Commons Attribution (CC BY) license (http://creativecommons.org/licenses/by/4.0/).
Copyright: This open access article is published under a Creative Commons CC BY 4.0 license, which permit the free download, distribution, and reuse, provided that the author and preprint are cited in any reuse.


