Submitted:
13 April 2025
Posted:
14 April 2025
You are already at the latest version
Abstract
With increasing rates of obesity and being underweight, proper classification of types of weights has emerged as a very serious matter of public health. Here, data science techniques are applied to investigate and analyze a real dataset on demographic and physical attributes such as age, gender, height, weight, and body mass index (BMI). The objective is to construct a robust classification model to accurately identify an individual's weight class—underweight, normal weight, overweight, or obese—from the k-Nearest Neighbors (k-NN) algorithm. The sample set of 110 examples with six features creates challenges with the asymmetrical distribution of the weight classes, predominantly the preponderance of underweight patients. The research aims to not only gain accurate classification but also to establish the most meaningful factors contributing to weight classification. By assessing the performance of the k-NN model, the research measures its ability to answer classification issues based on health and aims to optimize it. The results yield knowledge of the viability of data science in healthcare decision-making, i.e., formulation of targeted health interventions.
Keywords:
body mass index
; k-Nearest Neighbors
; algorithm
; weight
; classification
1. Introduction
Obesity and underweight are global health problems, disabling millions of individuals and threatening to develop various chronic diseases such as diabetes, cardiovascular disease, and disorders related to malnutrition. Accurate weighting of individuals into an appropriate category is essential to create effective public health policy and tailored healthcare interventions. Data science and machine learning provide strong tools to model health-related data, detect patterns, and enhance decision-making [1,2].
The task of work in this project is to work on building a classification model based on the k-Nearest Neighbors (k-NN) algorithm in order to make predictions for weight categories using demographic and physical traits. The data utilized in this project is composed of 110 samples with six features like age, gender, height, weight, and BMI that were collected from sources ranging from surveys to clinical records to self-reported [3,4,5,6]. The labels used for classification are four classes: underweight, normal weight, overweight, and obese. One of the big challenges with this analysis is the highly skewed distribution weight category, with a much higher proportion of underweight cases, which can influence the performance of models [7,8,9,10,11,12].
The k-NN model is chosen due to its simplicity to use, efficiency, and interpretable nature as a classification strategy. It predicts the class for new instances based on the majority class of their neighbors, which is a significant algorithm for health-oriented applications where there exists immense need for pattern recognition [13,14,15,16,17,18]. In addition to achieving accurate categorization, this study purports to establish which characteristics are most prevalent in weight categorization, such as BMI or weight, and can be applied in understanding patterns of health and risk factors [19,20].
Moreover, this research compares the effectiveness and performance of the k-NN algorithm in weight classification problems. Through comparison, the research provides information on how it could be enhanced as well as other ways that can enhance classification. Generally, the findings contribute to the growing body of health data science, demonstrating how machine learning can be utilized to advance decision-making in healthcare and the development of targeted health interventions [21,22].
2. Dataset Description
This study uses a dataset containing information regarding the classification of obesity among individuals. The dataset was combined from various sources like medical records, questionnaires, and self-reported data, to provide a mixed set of inputs [23,24,25]. It contains 110 samples and six features: demographic features like age and gender, and body measurements like height, weight, and BMI. Each individual in the dataset is assigned a unique identifier (ID), which preserves data integrity while allowing for proper analysis. The primary goal of this dataset is to allow people to be classified into four weight groups: underweight, normal weight, overweight, and obese.
The dataset holds both numerical and categorical features, both of which are very important for classification. The quantitative features are classified as continuous variables such as BMI, weight, and height and discrete variables such as ID and age. The features can be analyzed statistically and plotted using histograms, boxplots, and scatter plots [26]. But the categorical features are gender (nominal) and the label for obesity classification (ordinal). Since categorical variables never hold any inherent numerical relationships, encoding techniques are typically employed to condition them for machine learning algorithms.
One of the advantages of this dataset is that it is of high quality. It is already pre-cleaned, without missing values or duplicates [27]. The data is also well-structured, and the structure is consistent, making it ready for analysis without additional preprocessing. While there are outliers, as identified using boxplot visualizations, they do not significantly affect the performance of the model. The label groups follow a right-skewed normal distribution with increasingly decreasing skewness from ’Normal Weight’ to ’Obese.’ This suggests a natural bias in the data that follows expected real-world distributions of weight categories [28,29,30].
The dataset has been updated over the last two years, and as such, it will be suitable for use in today’s applications. The dataset was acquired from secondary data sources, including reliable online platforms and recognized authors or compilers. The dataset also provides a level of balanced distribution between both genders across the four weight categories, allowing for unbiased analysis and model development.
Ethical Considerations
This dataset was collected from secondary sources such as medical records, questionnaires, and self-reported data. The data has been pre-processed to make it accurate and convenient. Since it has been collected from public sources and just for research and educational purposes only, its usage comes under fair usage policies and does not violate any ethical codes or privacy rules. No personally identifiable information (PII) exists, ensuring the anonymity of the subjects. Furthermore, as the dataset is an educational tool, it provides an opportunity to explore obesity classification without infringing ethical standards on patient confidentiality and data security.
3. High-Level Statistics
The high-level statistical analysis provides a sense of distribution and most significant trends within the dataset. A bar chart (Figure 1) illustrates the distribution of each weight category in the ’Label’ variable per age group. The data has a right-skewed distribution, nearing normality. The ’Underweight’ category, comprised largely of participants below 30, falls off significantly with age. The ’Normal Weight’ category is symmetrically distributed, peaking between 20-40 years, while the ’Overweight’ category becomes apparent in the late 30s, peaking between 40-60, indicating a trend of increasing weight with age. The ’Obese’ category is almost exclusively found in individuals over 40, indicating increasing obesity with age. These trends signify that weight category varies according to age due to lifestyle and diet, necessitating specialized intervention—obesity prevention in middle-aged and elderly individuals and undernutrition treatment in the young.
A box plot (Figure 2) provides information about the distribution of BMI by labels and also identifies outliers. Underweight individuals have BMI values mostly below 17.5 with more spread and extreme values towards the lower end. ’Normal Weight’ contains a very small range of BMI (21-24), showing consistent distribution. The ’Overweight’ class is defined by the range of BMI 26-28 with little variability, whereas the ’Obese’ class varies over 30 with high variability. Notably, BMI values less than 6.7 were identified as extreme outliers, warranting further discussion on the deletion of outliers in later sections.
Another bar chart (Figure 3) presents class imbalance, with ’Underweight’ being the dominant class and ’Obese’ being the least represented. This type of imbalance can be damaging to model performance by favoring the dominant class. To remedy this, methods like oversampling, undersampling, or weighted metrics can be employed to balance classification.
Statistical summaries of the dataset, comprising 108 rows and 7 columns, provide important descriptive statistics. The dataset includes numerical features such as Age, Height, and Weight (as ’int64’) and BMI (as ’float64’), and categorical features such as Gender and Label (as ’object’). There were no missing values, and summary statistics, which were generated by applying the df.describe() function, offer valuable information about data distribution. The data is right-skewed, as indicated in Figure 1 and Figure 2. The mode indicates ’Underweight’ as the most prevalent weight status, and ’Male’ is the dominant gender. The average BMI is approximately 20.55 and ranges from 3.9 to 37.2. The age ranges between 11 and 112 years, and the median age is 42.5.
Data preprocessing steps address some significant concerns. There is class imbalance, with 47 instances of ’Underweight,’ 29 of ’Normal Weight,’ 20 of ’Overweight,’ and only 12 instances of ’Obese.’ Corrections could be applied, but leaving it as the natural distribution ensures model validity. Feature scaling and encoding techniques were implemented to improve balance. One-hot encoding for ’Gender’ and label encoding for ’Label’ were used for categorical features, with numerical values ’Normal Weight’ (0), ’Obese’ (1), ’Overweight’ (2), and ’Underweight’ (3) being assigned, respectively. Outliers, i.e., BMI values under 6.7, were identified using medical literature, and hence six rows were eliminated, with the dataset reducing to 102 records. StandardScaler was used to normalize BMI, Gender, and Height to enable them to contribute equally to the model’s performance.
For model deployment, feature selection preceded correlation analysis, identifying BMI, Gender, and Height as salient predictive variables. The data were split into 80% training and 20% test for unbiased evaluation. Model validation employed stratified k-fold cross-validation (k = 5) to preserve class distribution, averaging at 66.57% accuracy and 10.03% standard deviation. There was anticipated variability owing to dataset size and class imbalance. The k-Nearest Neighbors (k-NN) classifier was chosen, using Euclidean distance as the metric, since it could be applied to numerical data. The model, after training on the data, predicted weight categories for the test set, and model performance was tested by comparing predictions with true labels.
Lastly, this strategy details the higher-level statistical processing, preprocessing, feature selection, training, and evaluation through k-NN classification. The methodology achieves data integrity, model robustness enhancement, and addresses major challenges such as class imbalance and feature scaling.
4. Proposed Methodology
The approach proposed is having a step-by-step approach towards data preprocessing, model development, and validation to determine the accuracy of k-Nearest Neighbors (k-NN) classification model.
Data Preprocessing and Problems
The class is very imbalanced with ‘Underweight’ being the most frequent and ‘Obese’ being the least. The class imbalance could make the model favor underweight cases but not give correct predictions for overweight and obese cases. Nevertheless, the class distribution would not be reflective of the true data and is least likely to influence the performance of the model considerably because the dataset is too small. The data is skewed to the right as can be seen in the bar chart (Figure 1) and the numerical features are of varying scale, with height having a much greater range than BMI. Feature scaling through StandardScaler reverses this problem, so that all features contribute equally to model training.
The categorical variables, ’Gender’ and ’Label,’ must be encoded. Gender, a nominal variable, is treated with one-hot encoding via pd.get_dummies(), introducing a binary column for ‘Gender_Male.’ ‘Label’ variable, which contains an ordinal order, is encoded via LabelEncoder, giving numerical values: Normal Weight (0), Obese (1), Overweight (2), and Underweight (3).
Data Preprocessing Steps
Since there are no missing values, imputation is not necessary. If it is necessary, missing numerical values can be imputed using mean or median imputation, and mode can be employed to impute categorical variables. The ’ID’ column is removed since it does not contribute to model prediction and increases the dimensionality, hence improving model performance.
Outliers from the BMI column are detected and deleted for data quality in the dataset. A minimum BMI threshold of 6.7, based on medical literature, is set to delete extreme values. Six rows of BMI values below this threshold are deleted, reducing the dataset from 108 to 102 records. The lowest BMI after data cleaning is 8.3, reflecting the effective elimination of nonsensical values. Outlier deletion enhances data integrity and prevents biased outcomes in analysis. Feature scaling is accomplished by StandardScaler for normalizing features such as BMI, Gender, and Height. This standardizes the mean to 0 and variance to 1 so that features with larger scales do not overwhelm the model. StandardScaler is applied on both tests and training datasets for consistency.
Model Implementation
Feature selection is done based on correlation analysis, and BMI, Gender_Male, and Height are chosen as the most important predictors. The data is split into 80% training and 20% testing for the evaluation of model performance. Standard scaling procedure ensures fair feature contribution. Model validation is done through Stratified k-Fold Cross-Validation (k = 5), with each fold maintained at the same class distribution as the original. This efficiently validates the model, particularly with imbalanced data. When k = 3, the mean accuracy of the k-NN model is 66.57% with a standard deviation of 10.03%. This kind of variation can be expected given the small size and class imbalance of the dataset. We chose the k-NN classifier to train the model, using Euclidean distance as the similarity measure. This is an appropriate option given the numerical dataset, in which Euclidean distance can meaningfully measure feature similarity. StandardScaler facilitates fair distance calculations by preventing scale-dominated bias. While alternative distance measures are possible, Euclidean distance allows for computational efficiency and interpretability. Predictions are made on models using the trained k-NN classifier, and performance is evaluated by comparing predicted labels with actual test labels.
Model Evaluation
Model performance is evaluated with a number of metrics:
Accuracy determines the number of instances correctly predicted as a percentage.
Macro-averaged precision, recall, and F1-score determine performance for all weight categories, taking into account false positives and false negatives. Confusion Matrix graphs model predictions, highlighting misclassifications and points of improvement.
This methodology ensures a rigid process for dataset preprocessing, feature engineering, model training, and evaluation, maximizing the performance and reliability of the k-NN classification model.
Figure 4.
Code for Model Evaluation.
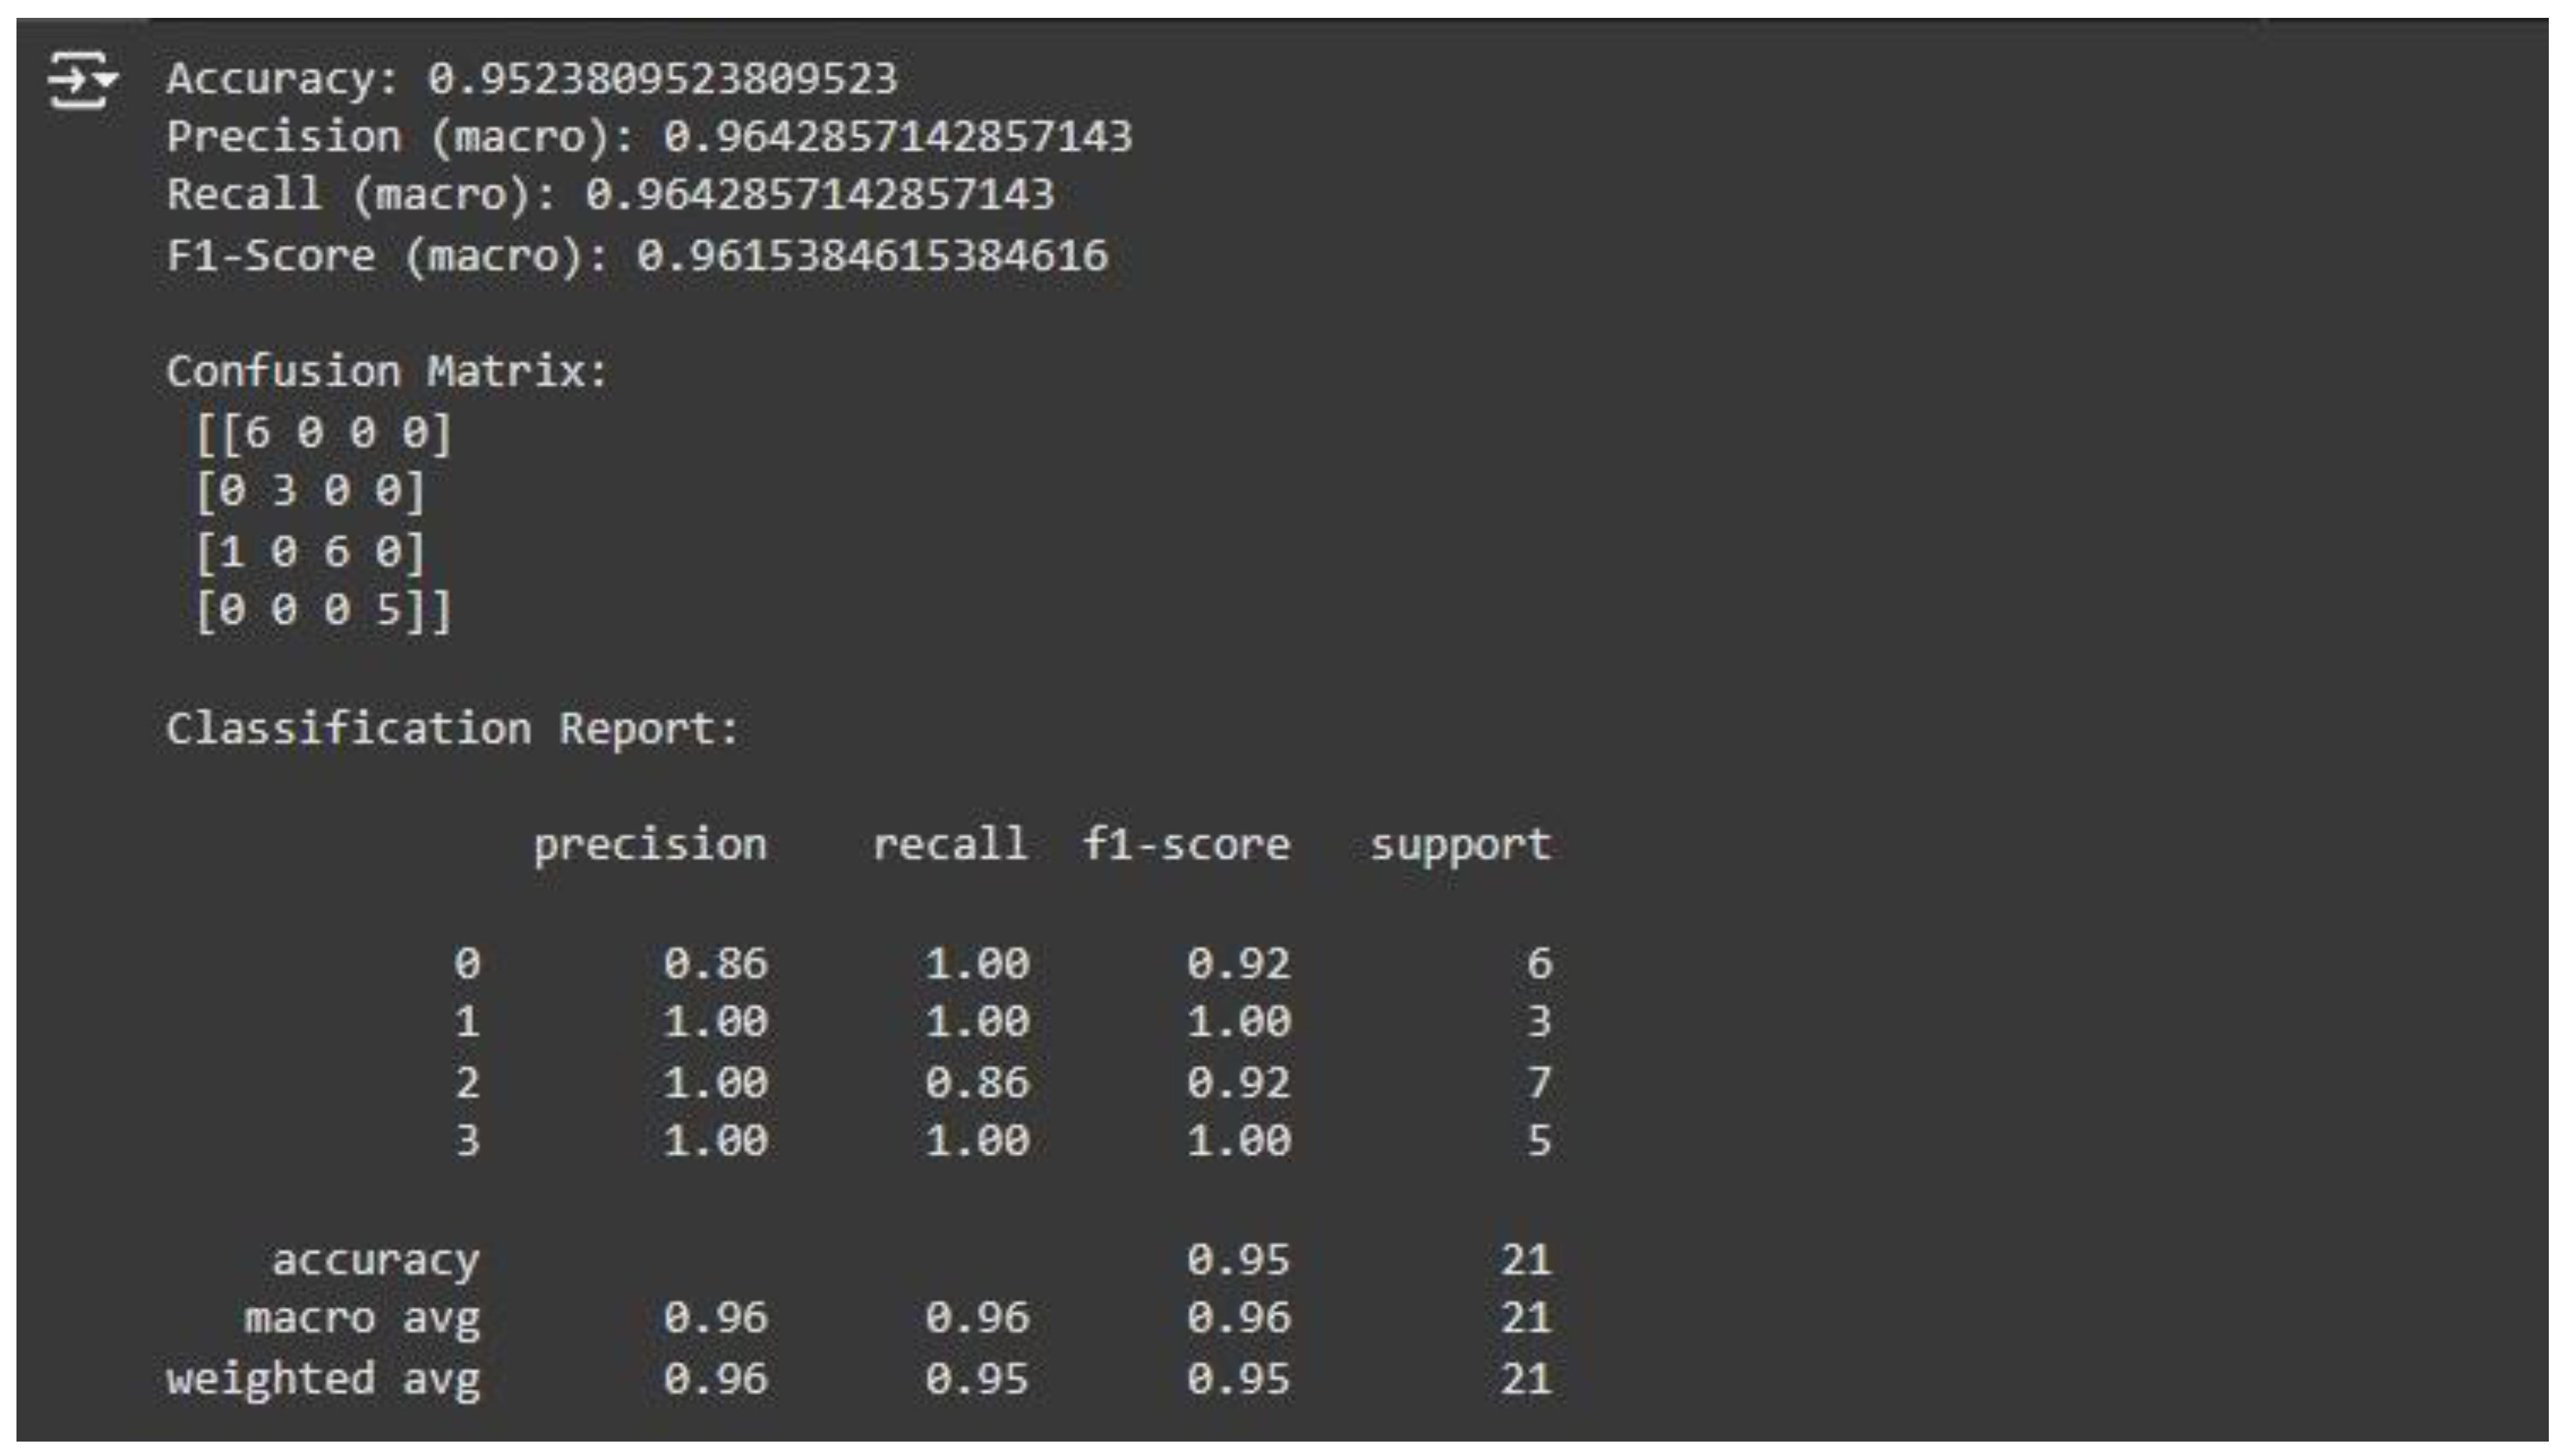
Figure 5.
Code for Plotting Confusion Matrix.
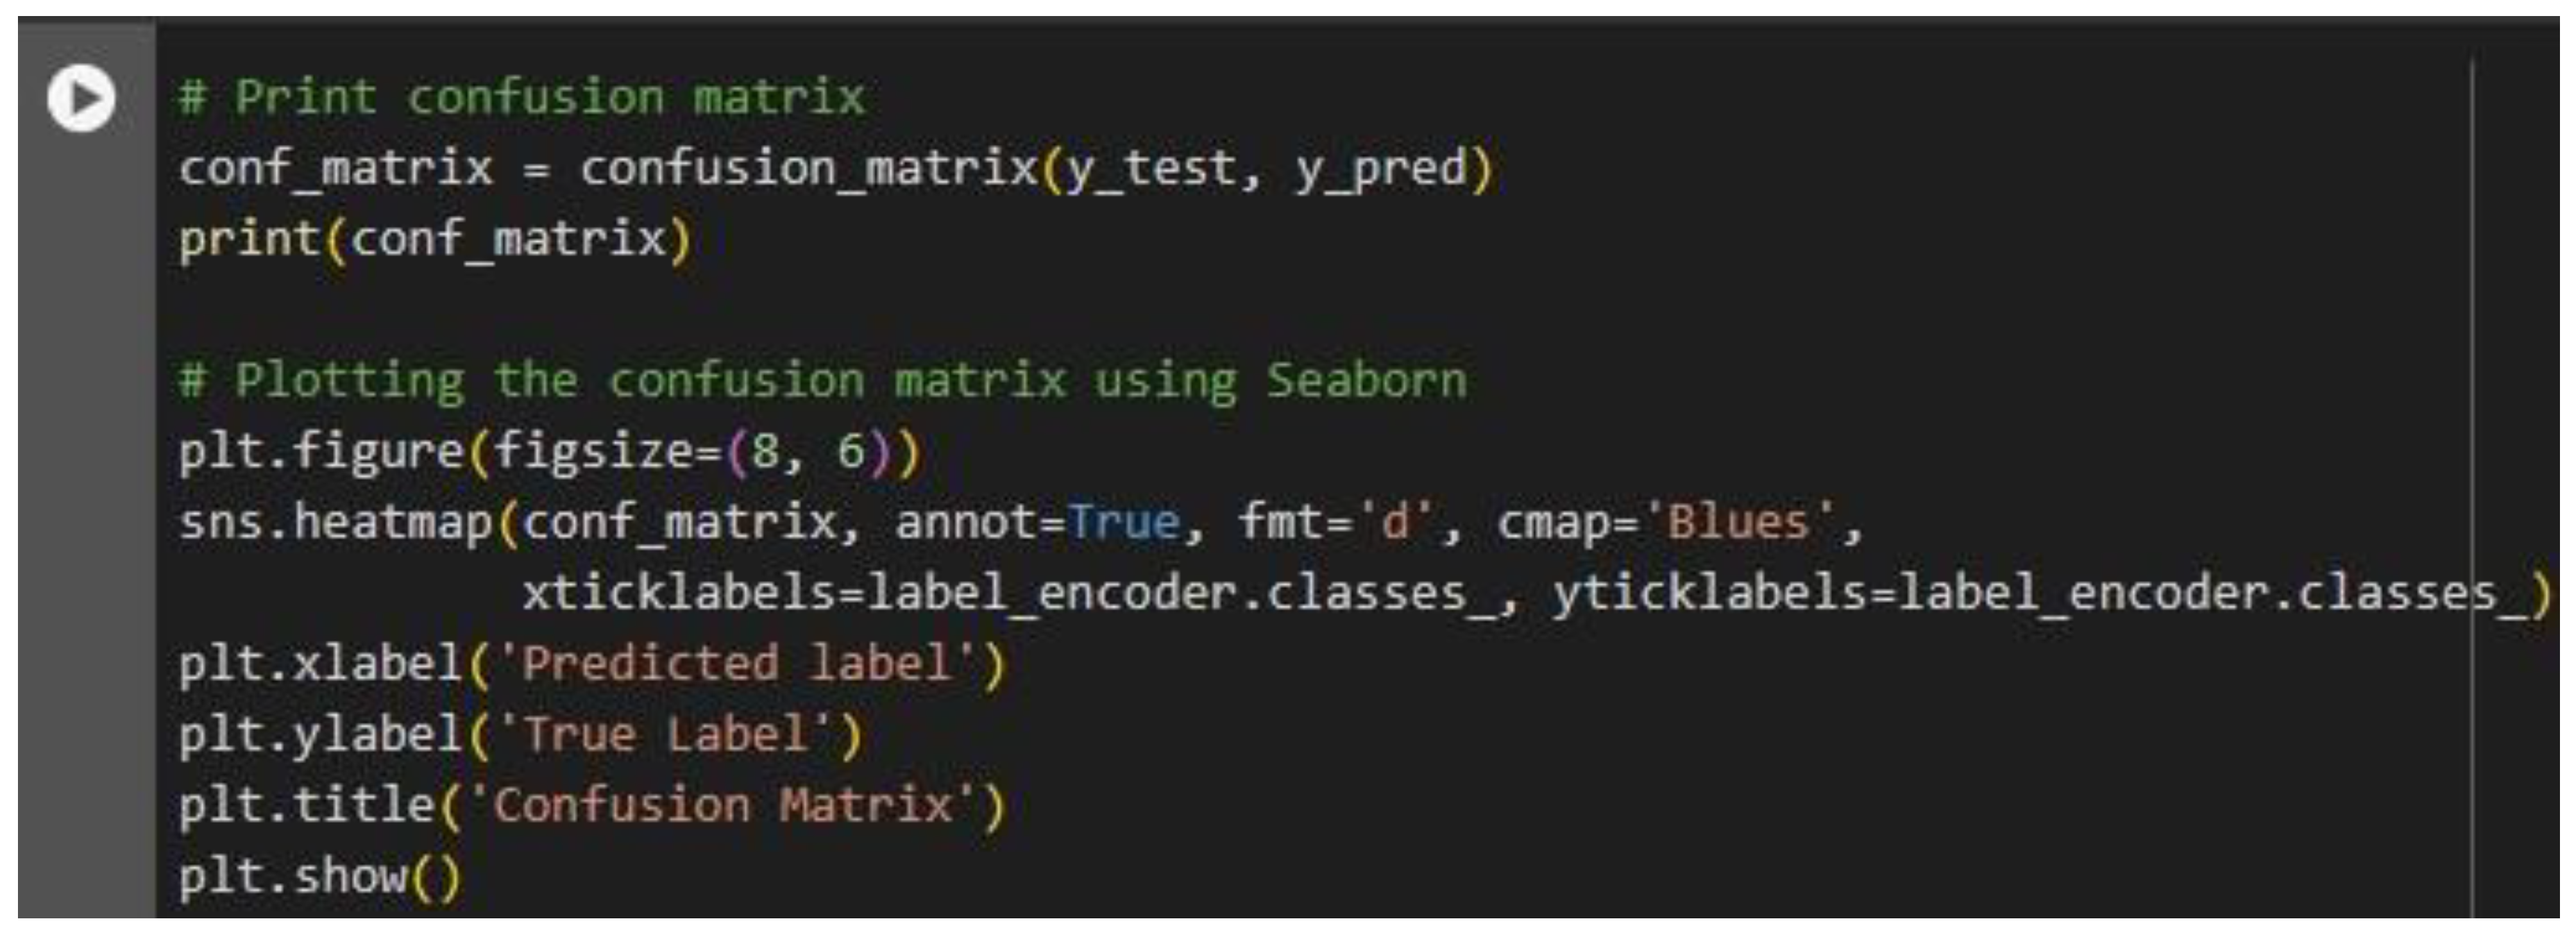
Figure 6.
Confusion Matrix Results.
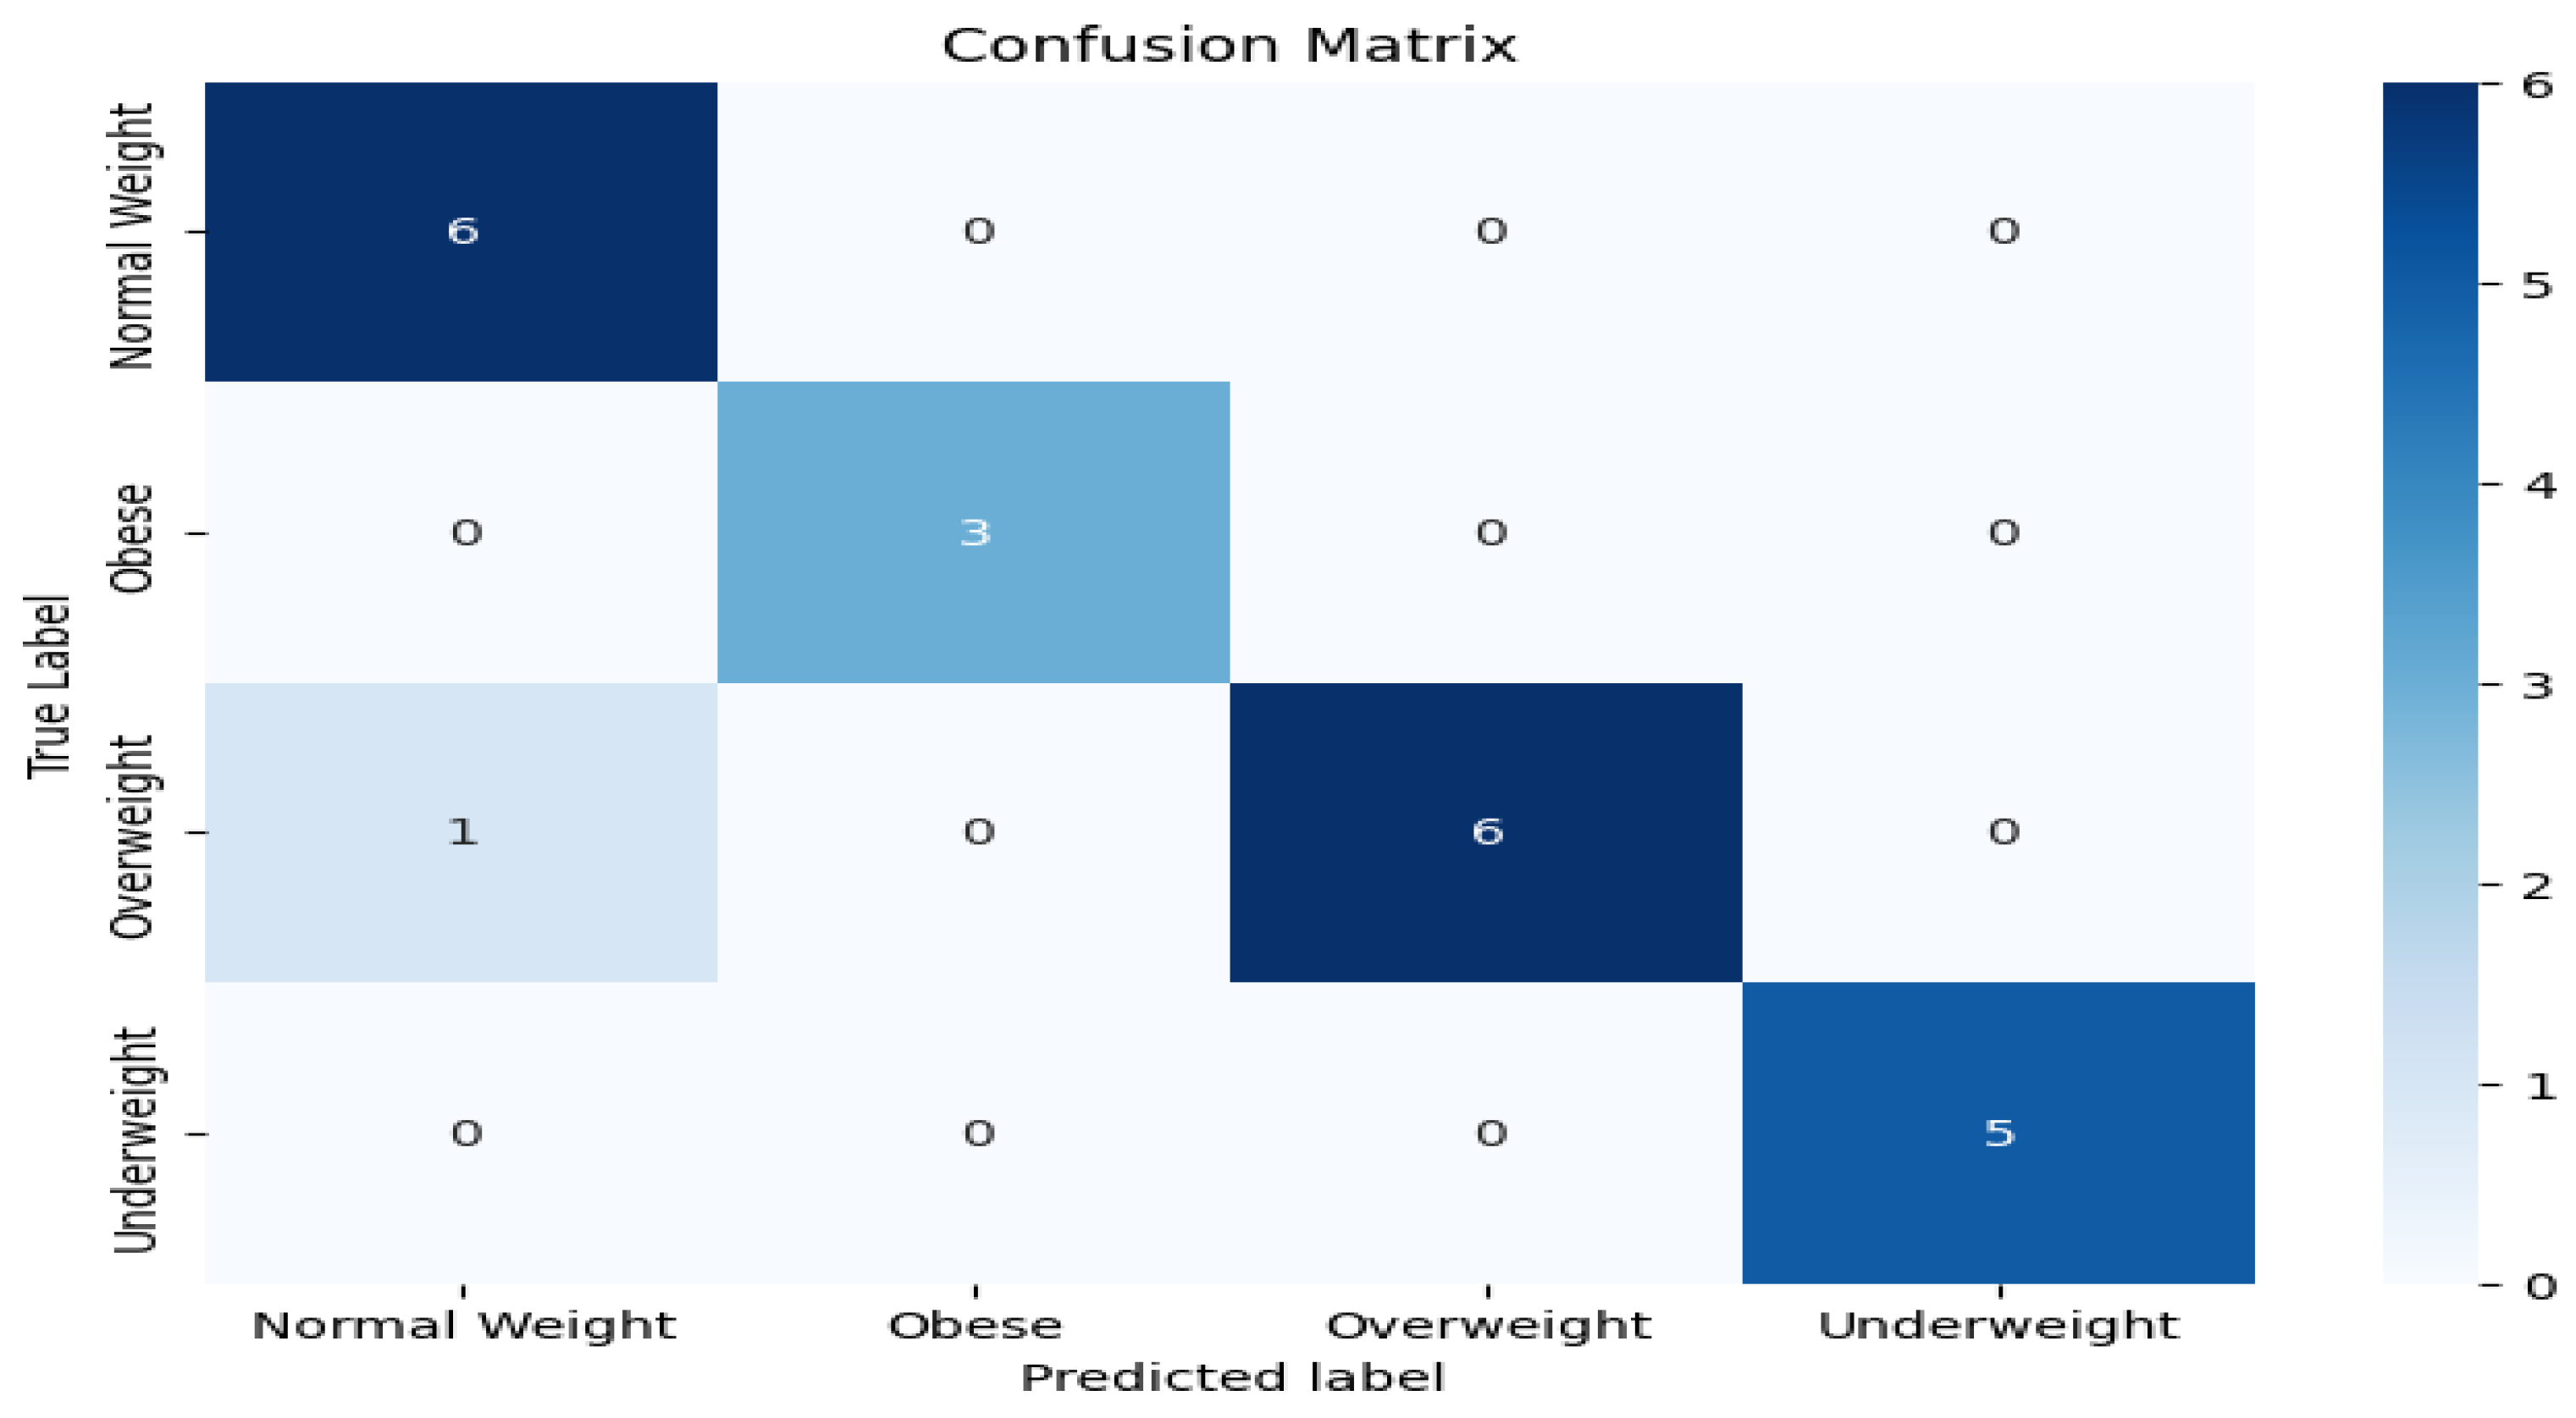
Figure 7.
Results of Classification Report.
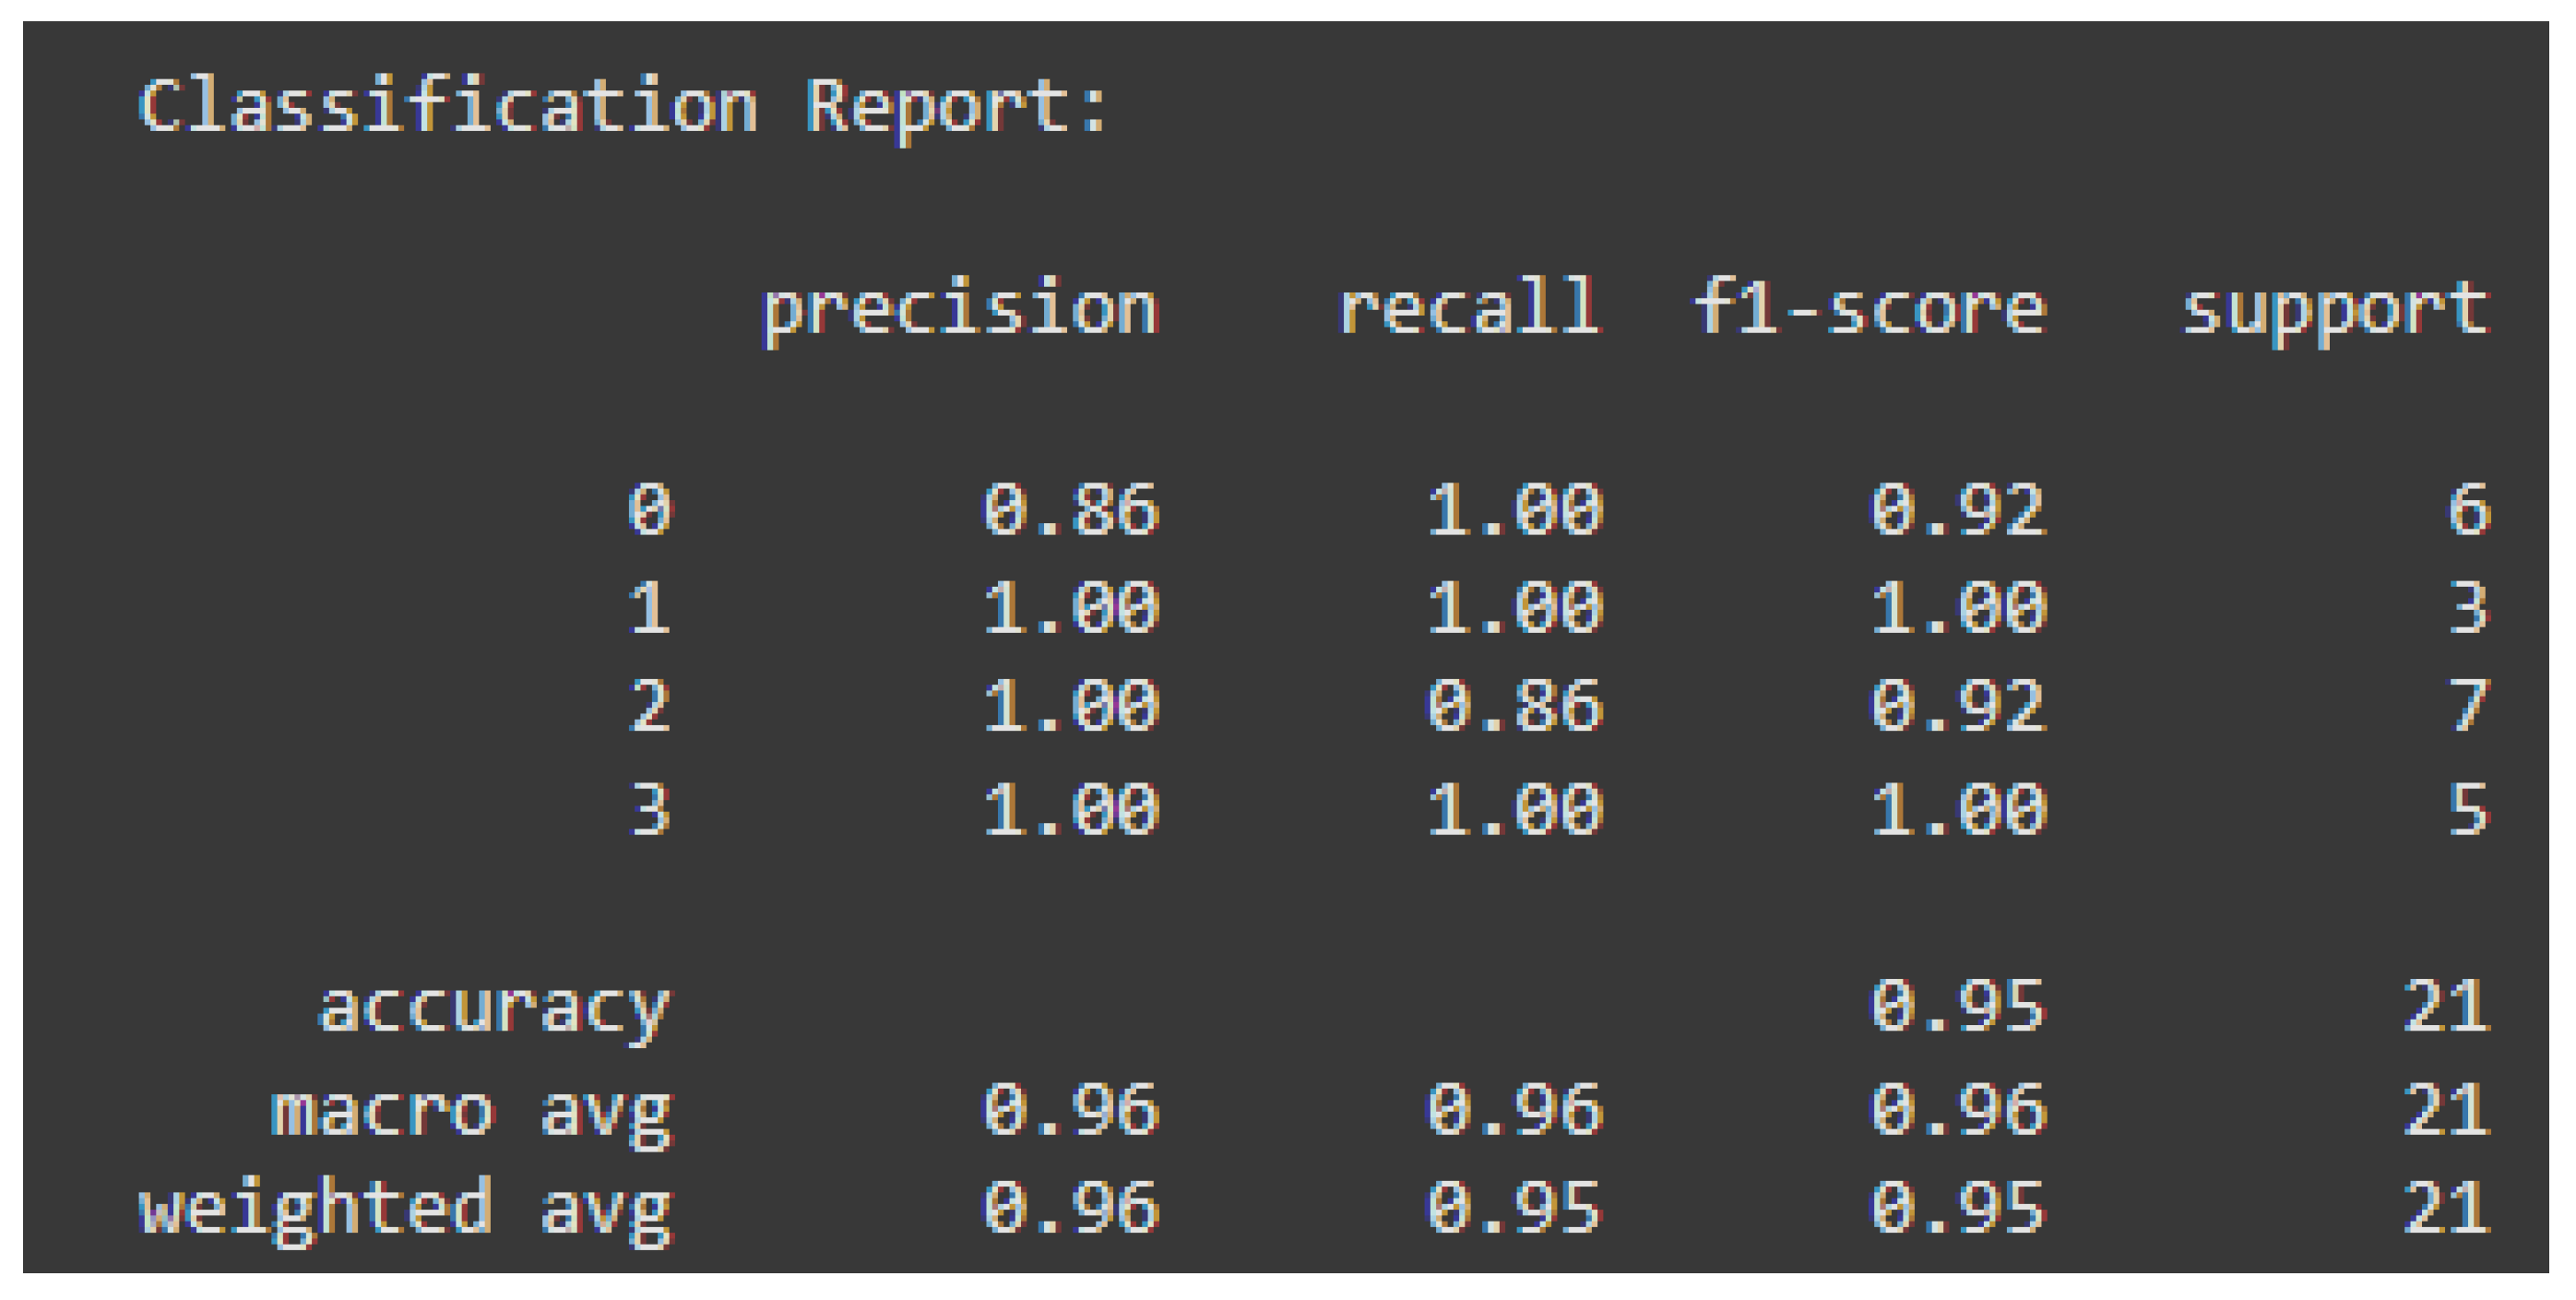
The classification report breaks down the precision, recall, and f1-scores for each class separately:
| Class Number | Class Name | Remarks |
| Class 0 | Underweight | Slightly lower precision (0.86) due to one instance being misclassified |
| Class 1 | Normal Weight | Perfect classification |
| Class 2 | Overweight | Slightly lower recall (0.86) due to one instance being misclassified. |
| Class 3 | Obese | Perfect classification |
According to the evaluation, the model consistently predicts most instances correctly. Making it highly reliable for this classification problem.
Conclusion
This paper reports on the successful application of the k-Nearest Neighbors (k-NN) algorithm for classifying individuals into weight classes from basic physical and demographic data. With 95.24% total accuracy and macro-averaged precision, recall, and F1-measures of over 96%, the model was highly reliable and reasonably well-balanced in performance for all the classes. Exploratory Data Analysis (EDA) also revealed BMI as the strongest feature with clear statistical and graphical discrimination across weight classes. Age patterns showed that underweight persons were more common in younger age groups, while obesity increased with advancing age, reflecting larger population trends. Gender was less related and had a lesser impact on classification. Strong positive correlation between BMI and the weight label further illustrated its relevance and adding it along with characteristics like height improved model performance overall. Removal of outliers, particularly extreme BMI values, enhanced model performance and data integrity. Because of its simplicity and high accuracy, the model has a high potential for application in healthcare settings to support early obesity or risk of malnutrition detection, enabling preventative intervention. To further improve minority class classification like “Obese” and “Overweight,” future work may include resampling techniques and addition of lifestyle, diet, or genetic attributes. Other machine learning methods, including Decision Trees or Random Forests, could be applied to solve data imbalance and complexity as well. Finally, the project demonstrates how easy-to-interpret models like k-NN can provide meaningful insights into public health when applied to real data.
References
- Suszko, M., Sobocki, J. and Imieliński, C. (2022). Mortality in extremely low BMI anorexia nervosa patients – implications of gastrointestinal and endocrine system dysfunction. Psychiatria Polska, 56(1), pp.89–100. [CrossRef]
- Putri, A. I., Husna, N. A., Cia, N. M., Arba, M. A., Aisyi, N. R., Pramesthi, C. H., & Irdayusman, A. S. (2024). Implementation of K-Nearest Neighbors, Naïve Bayes Classifier, Support Vector Machine and Decision Tree Algorithms for Obesity Risk Prediction. Public Research Journal of Engineering, Data Technology and Computer Science, 2(1), 26-33.
- Musa, F., & Basaky, F. (2022). Obesity prediction using machine learning techniques. Journal of Applied Artificial Intelligence, 3(1), 24-33.
- Dogra, V., Singh, A., Verma, S., Kavita, Jhanjhi, N. Z., & Talib, M. N. (2021). Analyzing DistilBERT for sentiment classification of banking financial news. In S. L. Peng, S. Y. Hsieh, S. Gopalakrishnan, & B. Duraisamy (Eds.), Intelligent Computing and Innovation on Data Science (Vol. 248, pp. 665-675). Springer. [CrossRef]
- Alkinani, M. H., Almazroi, A. A., Jhanjhi, N. Z., & Khan, N. A. (2021). 5G and IoT-based reporting and accident detection (RAD) system to deliver first aid box using unmanned aerial vehicle. Sensors, 21(20), 6905.
- Babbar, H., Rani, S., Masud, M., Verma, S., Anand, D., & Jhanjhi, N. (2021). Load balancing algorithm for migrating switches in software-defined vehicular networks. Computational Materials and Continua, 67(1), 1301-1316.
- Saeed, S., & Abdullah, A. (2021). Combination of brain cancer with hybrid K-NN algorithm using statistical analysis of cerebrospinal fluid (CSF) surgery. International Journal of Computer Science and Network Security, 21(2), 120-130.
- Saeed, S., & Abdullah, A. (2019). Analysis of lung cancer patients for data mining tool. International Journal of Computer Science and Network Security, 19(7), 90-105.
- Saeed, S., Abdullah, A., Jhanjhi, N. Z., Naqvi, M., & Nayyar, A. (2022). New techniques for efficiently k-NN algorithm for brain tumor detection. Multimedia Tools and Applications, 81(13), 18595-18616.
- Saeed, S., Abdullah, A., & Naqvi, M. (2019). Implementation of Fourier transformation with brain cancer and CSF images. Indian Journal of Science & Technology, 12(37), 1-16.
- Vineetha, B., Surendran, R., & Madhusundar, N. (2024, November). Enhancing Accuracy in Obesity Prediction and Nutrition Guidance through KNN and Decision Tree Models. In 2024 5th International Conference on Data Intelligence and Cognitive Informatics (ICDICI) (pp. 757-762). IEEE.
- Kim, H., Lim, D. H., & Kim, Y. (2021). Classification and prediction on the effects of nutritional intake on overweight/obesity, dyslipidemia, hypertension and type 2 diabetes mellitus using deep learning model: 4–7th Korea national health and nutrition examination survey. International Journal of Environmental Research and Public Health, 18(11), 5597.
- Priya, A. S., & Rani, T. U. Prediction of gestational diabetes mellitus using visceral fat measurements with enhanced accuracy rate by voted perceptron classifier and K-nearest neighbour classifier. In Hybrid and Advanced Technologies (pp. 190-196). CRC Press.
- Pereira, N. C., D’souza, J., Rana, P., & Solaskar, S. (2019, July). Obesity related disease prediction from healthcare communities using machine learning. In 2019 10th International Conference on Computing, Communication and Networking Technologies (ICCCNT) (pp. 1-7). IEEE.
- Amani, F., Mohamadnia, A., Amani, P., Abdollahi-Asl, S., & Bahadoram, M. (2022). Using machine learning method for classification body mass index of people for clinical decision. Journal of Renal Endocrinology, 8(1), e17072-e17072.
- Sari, I. K., Pardede, A. M. H., & Simanjuntak, M. (2024). Application of the K-Nearest Neighbor Method for Classification of Hypertension Diseases (Case Study: Stabat Health Center). Journal of Artificial Intelligence and Engineering Applications (JAIEA), 4(1), 181-186.
- Ayua, S. I. (2024). Random forest ensemble machine learning model for early detection and prediction of weight category. Journal of Data Science and Intelligent Systems, 2(4), 233-240.
- Rahmawati, M., Lestari, A. F., & Hardani, S. (2024). Phyton-Based Machine Learning Algorithm to Predict Obesity Risk Factors in Adult Populations. Paradigma-Jurnal Komputer dan Informatika, 26(1), 51-57.
- Nagarajan, S. G., Balasubramanian, V., Gonugunta, P., & Gudla, S. K. (2024). Obesity level prediction using deep learning approach–A comparative analysis. Engineering and Applied Science Research, 51(4), 540-554.
- Eldora, K., Fernando, E., & Winanti, W. (2024). Comparative Analysis Of Knn And Decision Tree Classification Algorithms For Early Stroke Prediction: A Machine Learning Approach. Journal Of Information Systems And Informatics, 6(1), 313-338.
- Vineetha Sankar, P., & Sreekumar, K. (2021). Utilizing the Data Mining Techniques for Obesity Prognosis Based on Eating and Lifestyle Routines of Adolescents and Adults. In Advanced Computing and Intelligent Technologies: Proceedings of ICACIT 2021 (pp. 373-388). Singapore: Springer Singapore.
- Suresh, C., Kiranmayee, B. V., Jahnavi, M., Pampari, R., Ambadipudi, S. R., & Hemadri, S. S. P. (2022, February). Obesity prediction based on daily lifestyle habits and other factors using different machine learning algorithms. In Proceedings of Second International Conference on Advances in Computer Engineering and Communication Systems: ICACECS 2021 (pp. 397-407). Singapore: Springer Nature Singapore.
- Aldughayfiq, B., Ashfaq, F., Jhanjhi, N. Z., & Humayun, M. (2023). Explainable AI for retinoblastoma diagnosis: interpreting deep learning models with LIME and SHAP. Diagnostics, 13(11), 1932.
- Kumar, M. S., Vimal, S., Jhanjhi, N. Z., Dhanabalan, S. S., & Alhumyani, H. A. (2021). Blockchain based peer to peer communication in autonomous drone operation. Energy Reports, 7, 7925-7939.
- Attaullah, M., Ali, M., Almufareh, M. F., Ahmad, M., Hussain, L., Jhanjhi, N., & Humayun, M. (2022). Initial stage COVID-19 detection system based on patients’ symptoms and chest X-ray images. Applied Artificial Intelligence, 36(1), 2055398.
- Lee, S., Abdullah, A., & Jhanjhi, N. Z. (2020). A review on honeypot-based botnet detection models for smart factory. International Journal of Advanced Computer Science and Applications, 11(6).
- Shah, I. A., Jhanjhi, N. Z., & Laraib, A. (2023). Cybersecurity and blockchain usage in contemporary business. In Handbook of Research on Cybersecurity Issues and Challenges for Business and FinTech Applications (pp. 49-64). IGI Global.
- Muzafar, S., & Jhanjhi, N. Z. (2020). Success stories of ICT implementation in Saudi Arabia. In Employing Recent Technologies for Improved Digital Governance (pp. 151-163). IGI Global.
- Gill, S. H., Razzaq, M. A., Ahmad, M., Almansour, F. M., Haq, I. U., Jhanjhi, N. Z., ... & Masud, M. (2022). Security and privacy aspects of cloud computing: a smart campus case study. Intelligent Automation & Soft Computing, 31(1), 117-128.
- Jhanjhi, N. Z., Humayun, M., & Almuayqil, S. N. (2021). Cyber security and privacy issues in industrial internet of things. Computer Systems Science & Engineering, 37(3).
Figure 1.
Age vs Count of each Label.
Figure 2.
Box plots of BMI vs Label.
Figure 3.
Label vs Count of each Label.
Disclaimer/Publisher’s Note: The statements, opinions and data contained in all publications are solely those of the individual author(s) and contributor(s) and not of MDPI and/or the editor(s). MDPI and/or the editor(s) disclaim responsibility for any injury to people or property resulting from any ideas, methods, instructions or products referred to in the content. |
© 2025 by the authors. Licensee MDPI, Basel, Switzerland. This article is an open access article distributed under the terms and conditions of the Creative Commons Attribution (CC BY) license (http://creativecommons.org/licenses/by/4.0/).
Copyright: This open access article is published under a Creative Commons CC BY 4.0 license, which permit the free download, distribution, and reuse, provided that the author and preprint are cited in any reuse.


