
Submitted:
13 April 2025
Posted:
14 April 2025
You are already at the latest version
Abstract
Ecological sustainable development is of great importance in the present age. The traditional free-range feeding mode of Tibetan aromatic pigs in Tibet is gradually being replaced by a semi-housed feeding mode due to the development of modern economic industry. In this study, we analysed the physicochemical properties and microbial composition of the soil under the original ecological environment and semi-housed feeding mode. The study revealed that the activities of Tibetan balsam pigs resulted in the disruption of the original shallow ecological structure of the soil, while the presence of faeces led to an increase in bacterial flora and the spoilage of fodder. Furthermore, the soil under the semi-housed mode exhibited an accumulation of nitrogen, potassium and organic carbon in the shallow layer. The abundance of species was found to be significantly lower than that observed in the original soil environment. At the soil's gate level, the abundances of Proteobacteria ( 31.05% and 32.33%), Bacteroidota (10.48% and 24.90%), and Firmicutes (38.32% and 4.31%) were higher. In contrast, the abundances of Chloroflexi (0.63% and 1.78%), Verrucomicrobiota (0.64% and 1.9 2%), and Planctomycetota (0.82% and 2.67%) were lower. At the level one Metabolism pathway, the Metabolism of terpenoids and polyketides, Lipid metabolism and Xenobiotics biodegradation and metabolism were significantly different (P< 0.05). Glycan biosynthesis and metabolism and Biosynthesis of other secondary metabolites were highly significantly different (P< 0.01). In conclusion, the results of this experiment have demonstrated the significant impact of the semi-enclosed mode on the shallow soil layer. In order to facilitate targeted adjustments for later soil ecological restoration or sustainable use, it is crucial to consider the soil's physicochemical properties and microbial structure.
Keywords:
Tibetan pig
; soil
; semi-housed feeding
; contaminant
1. Introduction
China is currently the world’s leading pig-farming nation. Pig farming is a crucial factor in the development of China’s animal husbandry industry and a fundamental pillar of the country’s economic progress. Vast quantities of pig manure accumulate in the soil as pig farming develops and grows, and they are applied onto farmland as organic fertilisers, substantially influencing the soil [1,2,3,4]. The Tibetan pig is a distinct breed of swine found in Tibet, known for their ability to thrive in harsh alpine environments and grazing conditions [5,6,7]. Tibetan pigs are typically active in rural fields when raised using grazing methods. However, a significant number of Tibetan pigs were lost in the 2018 African swine fever outbreak. As a result, the Tibetan pig farming industry has been severely impacted, leading to the adoption of the semi-housed mode of farming. Nonetheless, this shift has presented new challenges for the industry. The Tibetan pig primarily roams in rural fields; however, when housed semi-permanently, their range of activity is constrained. As a result, their waste accumulates on the soil where they forage. Farmers then recycle Tibetan pig excreta as an essential fertiliser during agricultural production, ultimately resulting in significant impacts on soil nutrients, heavy metal content, and microbial biomass [8,9,10].
Due to the rapid development of Tibetan pig farming in Tibet, the emergence of large-scale and intensive breeding bases has been observed. It also increased the number of pigs and led to a higher growth rate in pig manure production. Organic pig manure fertilisation has become a popular method of manure management [11,12]. Proper application of pig manure to fields reduces the environmental pollution index associated with it, enhancing soil aggregates and increasing microbial diversity. These factors improve soil fertility, resulting in better crop growth and yield [13,14,15].
Plants require diverse nutrients for growth, such as carbon, hydrogen, oxygen, nitrogen, phosphorus, potassium, calcium, and magnesium. The most important nutrients for plant growth are nitrogen, phosphorus, and potassium, which are majorly depleted during harvesting but can be partially replenished in the soil via roots and residues. Hence, these nutrients must be supplemented during the plant growth process. Pig manure contains high levels of nitrogen, phosphorous, potassium, and other elements [16,17]. A sufficient amount of manure should be added to improve the fertility of the soil. The influence of pig manure on soil nutrients can be categorised as follows: 1. Suitable use of organic fertiliser can significantly alter the physical and chemical properties of the soil. The fertiliser is enriched with organic nutrients, which release excess nutrients during decomposition. The decomposition of organic acid stimulates other soil nutrients, thereby hastening the metamorphosis of soil nutrients, enhancing the content of quick-acting soil nutrients, and subsequently improving soil fertility [18,19,20]. 2. Soil nitrogen content is a significant indicator of soil fertility. It is widely acknowledged that using organic fertiliser is an effective method to enhance soil nitrogen storage, resulting in increased soil nitrogen, phosphorus, and potassium supply—the three critical nutrients required for crop growth. This, in turn, is essential to the growth and development of crops. The phosphorus and potassium levels in the farmland soil have significantly improved with the continuous application of hog manure water. This increased its ability to supply plants with phosphorus, potassium, and other necessary nutrients [21,22,23,24].
2. Materials and Methods
2.1. Sample Collection
The sample collection area for this study was situated in Bayi District, Linzhi City, Tibet Autonomous Region, China. The region has a plateau temperate humid and semi-humid monsoon climate, with granite weathering accumulation in the soil parent material. The dominant soil type is brown forest soil, and the area experiences high rainfall in the summer. The soil surface organic matter content is notably high 7.97%, with a pH value ranging from 5.5 to 7.5, and exhibiting over 52% forest cover. The particle size of the surface soil is predominantly powdery grain (71.42%), followed by sand (21.06%) and clay (7.52%). The normal group collected soil without human intervention, while the control group collected soil under the Tibetan pig grazing pattern. The soil collection was carried out by extending 300 cm downward from the ground surface (0, 10, 20, 40, 80, 150, and 300 cm, respectively). Three replicated samples were obtained from the same layer of soil in different locations of each group, for a total of 42 samples. After being collected, the samples were rapidly frozen in liquid nitrogen and stored at –80 °C until subsequent 16S and physicochemical analyses.
2.2. Physical and Chemical Properties Analysis
Briefly, 5.00 g of air-dried soil samples (particles smaller than 2 mm) were added to a triangle bottle along with 50.00 mL of an ammonium acetate solution. The bottle was placed in a reciprocating oscillator, and the rubber stopper was tightly plugged in. The solution was then oscillated at approximately 120 times/min for 30 min while the temperature was maintained at 20–25 °C. Subsequently, the suspension was filtered using filter paper, and the filtrate was collected so that potassium could be directly measured using a flame photometer.
Moreover, 2.00 g of air-dried soil samples were passed through a 100-mesh sieve (0.15 mm), which were then evenly spread in the outer compartment of the diffusion dish. The dish was gently rotated horizontally to disperse the samples flat. Subsequently, 2 mL of 2% boric acid solution was added to the edge of the outer compartment of the dish, along with a drop of a mixed indicator. Finally, an alkaline indicator was applied to the edge of the outer chamber. Then, 2 mL of 2% boric acid solution and a drop of the mixed indicator were poured into the interior of the diffusion dish (which had been previously soaked in dilute acid). Afterwards, alkaline glycerol was applied to the periphery of the outer chamber of the dish. After rotating the cap slowly to expose one side of the outer chamber at the small notch of the cap, the lid was transferred to the outer chamber using a pipette. Then, 10 mL of 1.0 mol/L sodium hydroxide solution was added to the outer chamber with a pipette, and the cap was immediately tightened by rotating it slowly. The diffusion dish was rotated horizontally to mix the solution with the soil. This was followed by tying it with a rubber band and placing it in a 40 °C incubator for 24 h. Then, the ammonia absorbed in the boric acid solution was titrated with a 0.01 mol/L 1/2 sulphuric acid standard solution, resulting in a colour change from blue-green to reddish. The colour change indicates the endpoint of the process.
Air-dried soil samples were heated to a temperature above 900 °C in a combustion furnace. Excess barium hydroxide solution was used to absorb the carbon dioxide produced and produce barium carbonate precipitate. After the reaction, the remaining barium hydroxide was titrated with an oxalic acid standard solution. The carbon dioxide production was calculated using the difference in the volume of oxalic acid standard solution consumed between the blank titration and the sample titration.
Organic carbon content in the soil was calculated based on the carbon dioxide production. Measurement of pH and conductivity of samples was carried out through the utilization of a pH meter and a conductivity meter.
2.3. DNA Extraction and 16SrDNA Amplicon Sequencing
The DNA was extracted according to the instructions provided with the Soil Microbial DNA Kit (Tiangen Biochemical Technology Co). DNA purity and concentration were determined using the Nanodrop 2000 (Thermo Fisher Scientific) equipment. Primers 341F and 806R were used for the amplification of the V3-V4 region using polymerase chain reaction (PCR). The PCR conditions were as follows: initial denaturation at 94 °C for 2 min, denaturation at 98 °C for 10 s, annealing at 62 °C for 30 s, extension at 68 °C for 30 s for 30 cycles, and a final extension at 68 °C for 5 min. The DNA amplicons were extracted on a 2% agarose gel and subsequently purified using the AxyPrep DNA Gel Extraction Kit (Axygen Biosciences, Union City) following the manufacturer’s instructions and then sequencing.
2.4. Bioinformatic and Statistical Analyses
After acquisition, the raw sequencing data were analysed for statistical reliability and biological validity. Any data that were deemed to be of low quality or biologically meaningless were subsequently excluded. The sequencing data underwent correction via Reads data filtering, utilizing FASTP (version 0.18.0). Next, the Tags were spliced and subsequently filtered using FLASH (version 1.2.11). Data filtering process: USEARCH software (version 9.2.64) was used for analysis. The UCHIME algorithm was implemented to identify and eliminate the 16S chimeric sequences and obtain the final effective data (Effective Tags). Operational taxonomic unit (OTU) clustering was conducted using the UPARSE algorithm. Tag representative sequences with the highest abundance in OTUs were selected during the process of their constructing. Subsequently, these representative sequences were annotated with the species database. The number of Tag sequences at each taxonomic level was counted for each sample based on the annotation information. The statistics provided an overview of the features of each sample OTU, low abundance OTUs, tag annotations, and other pertinent information based on the abundance data of OTUs and species annotation information. During the process of producing OTUs/ASVs, representative sequences (referring to the Tag or ASV consistency sequence with the highest abundance in the OTUs) were selected and annotated with the database for species identification using the Naïve Bayesian assignment algorithm of the RDP Classifier. The confidence threshold was set at 0.8~1. The Chao1, Simpson, and Alpha diversity indices were computed using the QIIME technique, and the ecofunctional mapping of bacteria was generated by employing the FAPROTAX database and associated software. Tax4Fun (version 1.0) was used for the Kyoto encyclopedia of genes and genomes functional analyses.
2.5. Statistical Analyses
The data were analysed using Statistical Package for the Social Sciences software (version 26). Pearson correlation coefficients were calculated based on species abundance tables using the R language psych package. Intergroup differences in microbiome were analysed by LEFse using Tukey HDS, R language pROC package, Welch’s t-test, T-test, and Wilcox rank sum test.
3. Results
3.1. Soil Physicochemical Properties Under Different Treatments
The chemical properties of the soil were analysed, and as revealed in Figure 1A, the soil pH in the normal group decreased, followed by an increase with depth, whereas in the control group, the overall change in soil pH increased with depth. A noticeable variance was observed between the normal and control groups in the shallow soil layer while inspecting the nitrogen content of the soil. However, the nitrogen content increasingly appeared consistent as soil depth increased. These findings are illustrated in Figure 1B. The examination of the soil organic carbon content revealed that, except for the data obtained from the soil surface layer, which exhibited greater variability, the organic carbon content of the remaining groups decreased with increasing soil depth (Figure 1C). The potassium content of the soil was tested and it was found that the control soil had a considerably higher potassium content than the normal group in the upper layer, and then reduced but remained higher than the normal group in the soil layer starting from a depth of 40 cm. These results are illustrated in Figure 1D. Finally, the soil resistivity test revealed that the soil conductivity of the normal group remained constant at 0.25 s/m, whereas that of the control group decreased with increasing soil depth (Figure 1E).
3.2. Sequence Analysis
The study involved 16S microbial sequencing of 42 samples, and the results are presented in Schedule 1. The two treatment groups yielded 4760 OTUs through comparison and clustering of valid sequences, of which 1463 were identical. As illustrated in Figure 2A,B, the dilution curves of the samples and the Rnak curves of the species demonstrate that sufficient sequencing volume and richness were achieved for all samples. Additionally, sequencing volume and richness were able to accurately reflect microbial diversity information in the samples. Following the results demonstrated in Figure 2C, the two treatment groups were subjected to the difference test, and a significant distinction was identified between them (P < 0.01).
A statistical analysis of species richness was performed during the experiment. The results indicated that the control group had a significantly lower species richness than the normal group (P < 0.01). However, the species richness of the control group slowly recovered with an increase in soil depth until it reached the level of the normal group. Proteobacteria (31.05% and 32.33%), Bacteroidota (10.48% and 24.90%), and Firmicutes (38.32% and 4.31%) were more abundant at the gate level of the soil. In contrast, Chloroflexi (0.63% and 1.78%), Verrucomicrobiota (0.64% and 1.92%), and Planctomycetota (0.82% and 2.67%) had lower abundances. Notably, Firmicutes abundance was significantly higher in the control group and recovered to approximately the normal group level as soil depth increased. At the level of known genera, reduced abundance was observed for Pedobacter (5.65% and 3.01%), Flavobacterium (7.09% and 0.98%), Sphingomonas (4.13% and 1.88%), and Flavisolibacter (2.92% and 0.93%), and increased abundance was found in Acinetobacter (4.84% and 18.89%), Solibacillus (1.09% and 15.10%), TM7a (1.30% and 4.83%), Kurthia (0.14% and 5.97%), Proteiniclasticum (0.71% and 4.60%), and Lysinibacillus (0.48% and 4.36%). Solibacillus was highly abundant at soil depths of 10–40 cm, while Kurthia also exhibited high abundance at shallow depths (Figure 3A–F). Upset Wayne plot analysis was conducted on the species composition at the phylum and genus levels in both groups, revealing that the species structure of the control group had significantly changed compared to the normal group (Figure 3G,H).
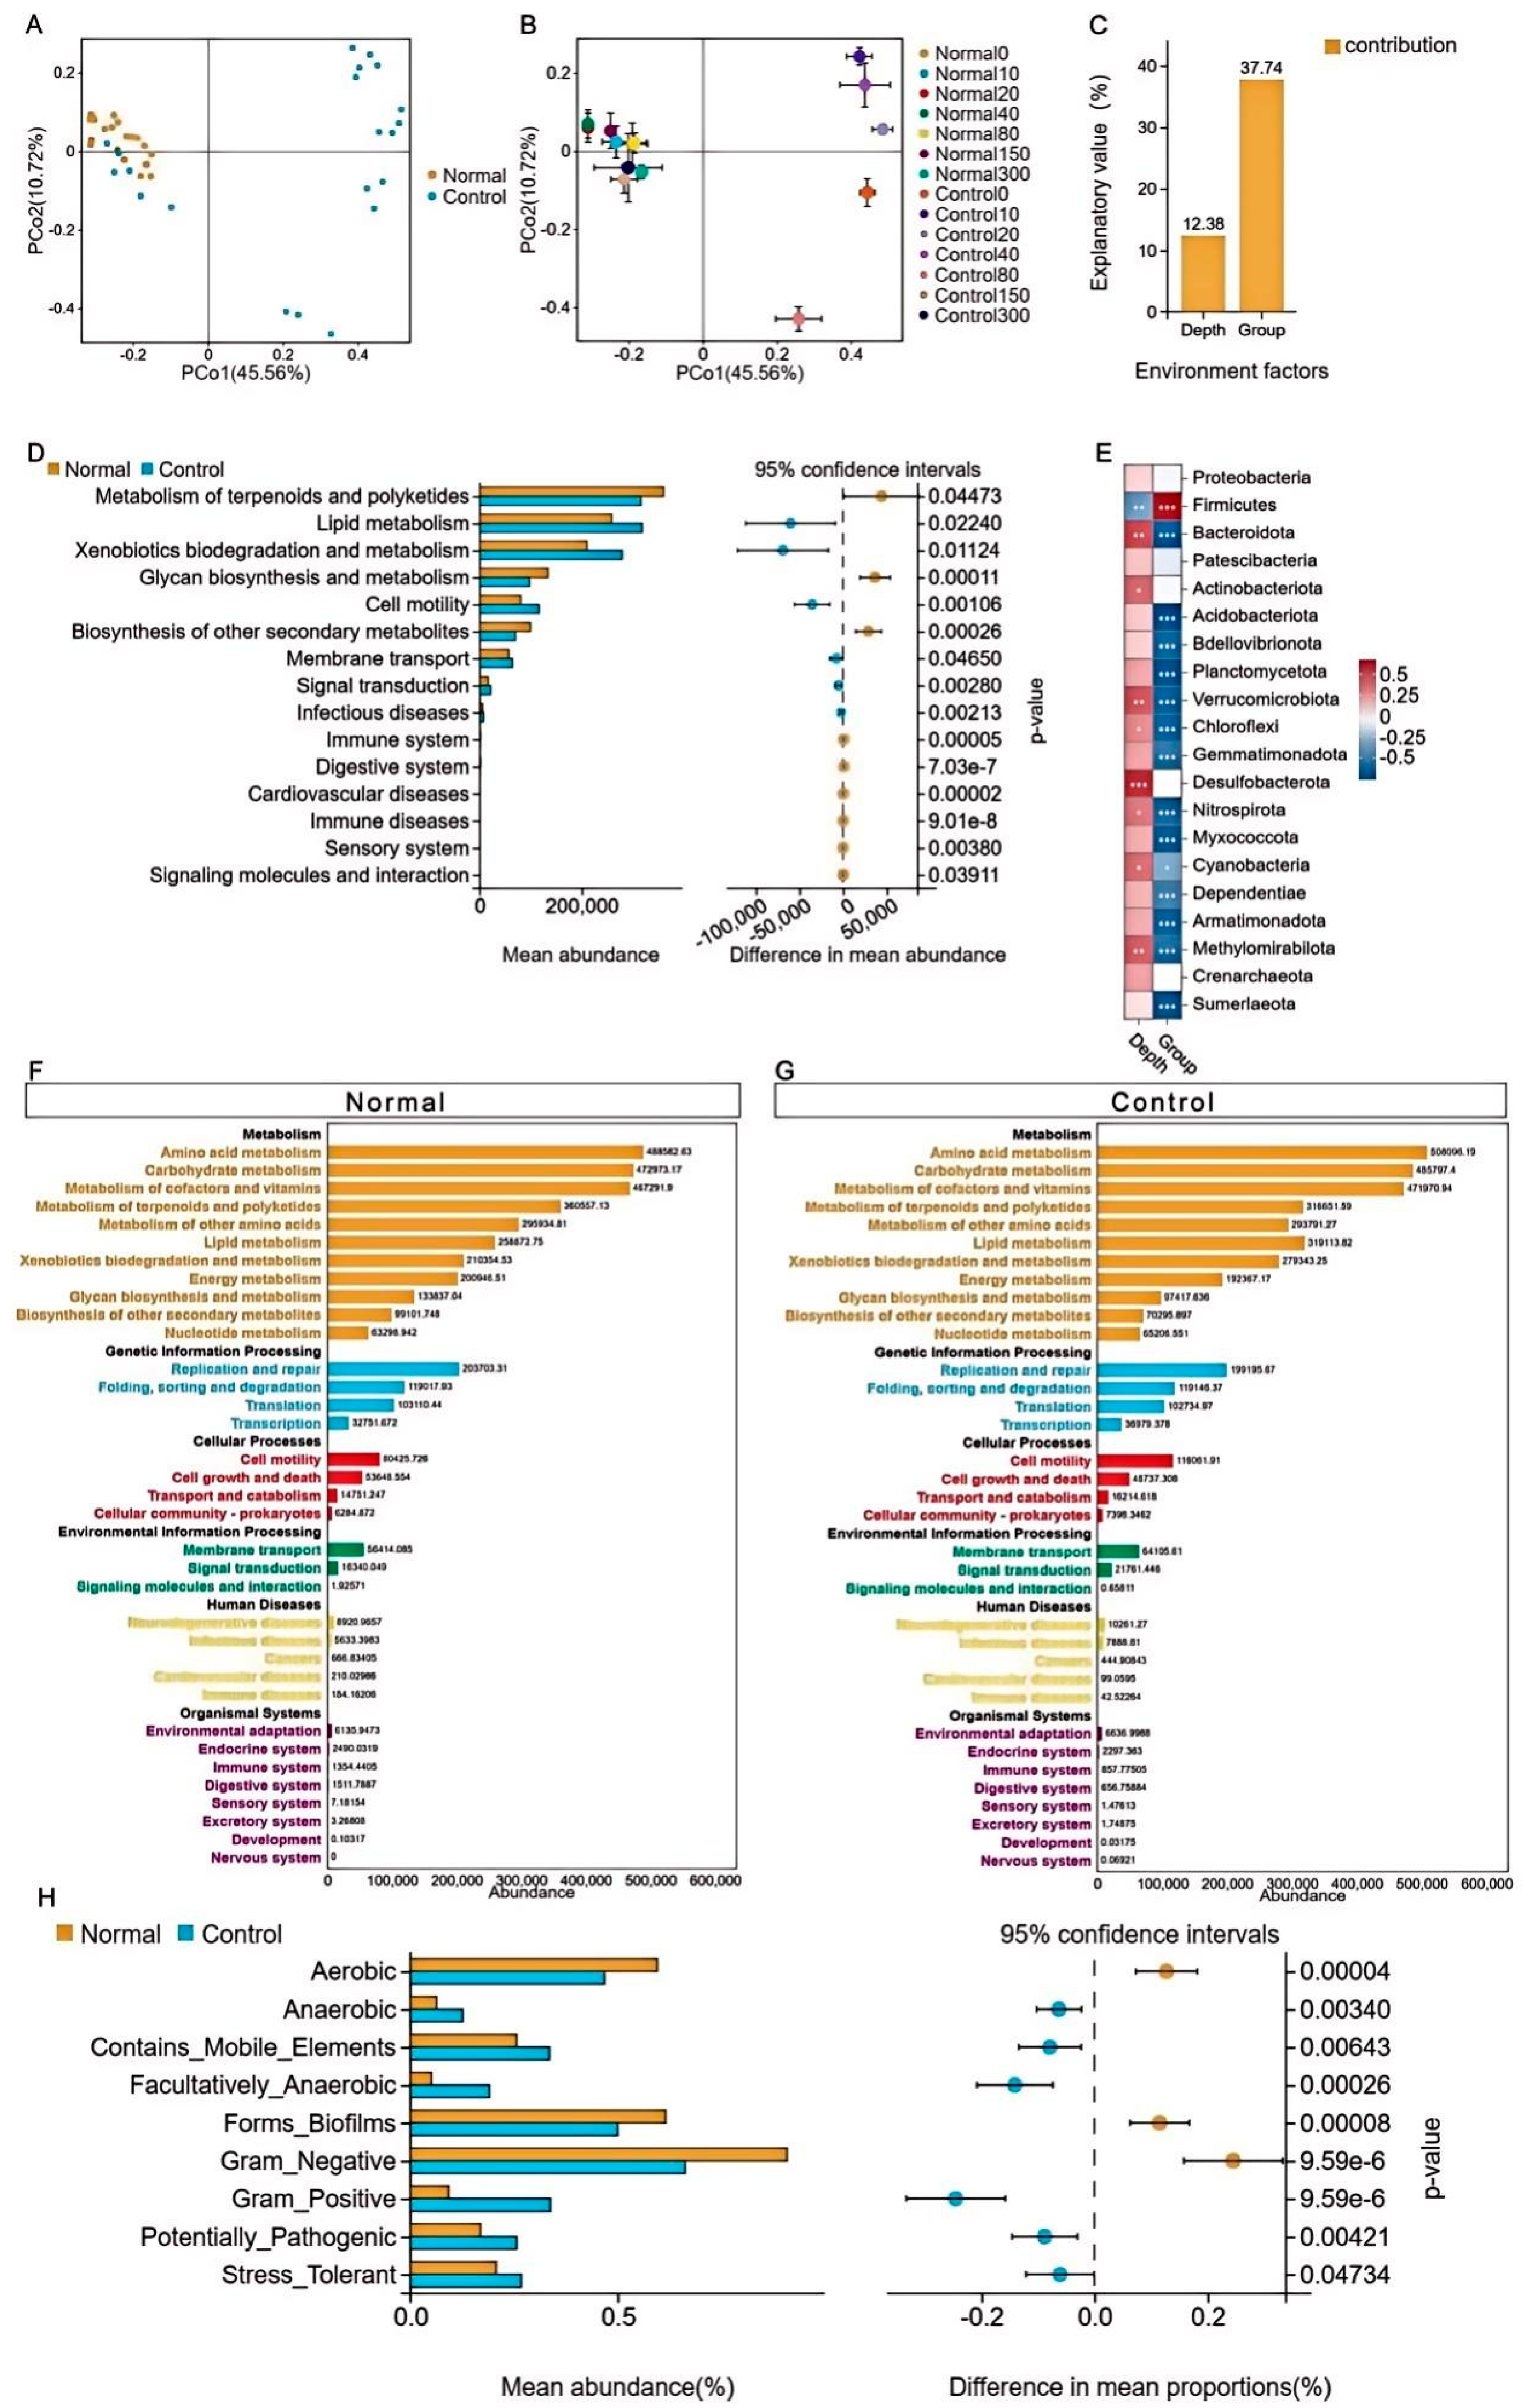
The similarity of the sample pieces from the two treatment groups was analysed. It was found that samples from the normal group converged, while samples from the control group converged with the normal group at soil depths of 150 and 300 cm. Following this, the impact of environmental factors combined with grouping and soil depth was examined. The results revealed that grouping treatments had the greatest influence on the distribution of species and that there was a highly significant difference in Firmicutes (P < 0.01), consistent with previous analyses of species composition (Figure 4A–D). Following this, functional prediction analysis was performed, and the results identified that, at the level one metabolism pathway, terpenoids and polyketides metabolism, lipid metabolism, and xenobiotics biodegradation and metabolism were significantly different (P < 0.05), while glycan biosynthesis and metabolism and biosynthesis of other secondary metabolites were highly significantly different (P < 0.01). There was a highly significant difference in cell motility (P < 0.01) in the cellular processes pathway at level one. Similarly, the differences were significant in membrane transport and signaling molecules and interaction (P < 0.05) in the environmental information processing pathway at level one. Highly significant differences were observed in signal transduction (P < 0.01). The differences were significant (P < 0.01) in signal transduction. There were highly significant differences in infectious, cardiovascular, and immune diseases in the human diseases pathway at level one (P < 0.01). Additionally, highly significant differences (P < 0.01) were observed between sensory, immune, and digestive systems in the organismal systems pathway at level one (Figure 4E–G). Phenotypic classification and abundance prediction of the samples revealed that the abundance of anaerobic, gram_positive, and potentially_pathogenic in the control group was highly significantly higher than in the normal group (P < 0.01), stress_ tolerant was significantly higher than the normal group (P < 0.05). While aerobic, Forms_Biofilms and Gram_Negative were highly significantly higher in the normal group than in the control group (P < 0.01) (Figure 4H).
4. Discussion
This study determined that all samples in both treatment groups exhibited pH levels higher than 7.5. This outcome was attributed to the inherent properties of the soil in the region. The study revealed that the pH values in the soil at 0–40 cm depth were lower than those in the normal group compared to the deeper soil. This occurrence can be attributed to the favourable climate in the Linzhi region, reduced exploitation of natural resources, and an abundance of decayed vegetation, which is more concentrated in the topsoil. This phenomenon results in acidification of the shallow soil and is more significant in the superficial layer [25]. Concurrently, it was noted that both pH levels as soil depth increased. Moreover, the impact of group factors dwindled between 150–300 cm [26]. Some studies indicated that applying hog manure often increases soil pH [27]. The experimental control group caused a significant alteration in soil pH at depths of 0-40 cm. Organic carbon in soil helps to preserve and reinforce its structure [28]. Nitrogen is an essential indicator of soil fertility, whilst potassium is crucial for plant growth [29].
Soil conductivity reveals the quantity of all salts present in the soil, which can significantly contribute to soil acidification and salinization [30]. The experiment identified that the faeces from the control group of semi-housed Tibetan pigs played a significant role in altering the physicochemical properties of the soil. The analysis indicated that certain indices in the shallow soil layer exhibited substantial changes, and the trend remained consistent among the control and normal groups as the depth increased. The high deposition of faecal matter on the soil surface imparted compositional changes that altered the physicochemical properties of the soil. Moreover, salts accumulate through infiltration under the influence of rainwater in the open air, changing the conductivity of the soil.
Microorganisms have a significant impact on soil properties, which can reflect the quality, purpose, and function of soil and illustrate the intrinsic changes in soil amendment. Additionally, several studies have demonstrated that mixed microbiota can effectively metabolise polycyclic aromatic hydrocarbons in the soil. Therefore, the examination of microbial indicators in soil plays an indispensable role [31,32]. During the experiment, an analysis of soil microorganisms revealed that the presence of Tibetan pigs decreased the diversity of soil species in comparison to the original landscape soil. Furthermore, an inverse relationship was identified between soil layer depth and microbial diversity, with shallower soil being more significantly impacted. Firmicutes displayed a noteworthy increase in the control group and were concentrated in the superficial layer of soil at the phylum classification level. Moreover, it has been observed that the abundance of Firmicutes plummets as the soil depth approaches 80 cm, which is related to the activities of Tibetan pigs in the region. The Firmicutes bacterial microbiome is predominately beneficial for intestinal health, thus supporting homeostasis [33]. The intestines of Tibetan pigs contain a high population of Firmicutes [34], which are regularly expelled alongside faecal matter into the soil.
Bacteroidota are commonly abundant in plant rhizosphere and primarily participate in the decomposition of organic matter [35]. The significant prevalence of Bacteroidota in the normal group, compared to the reduced prevalence in the comparison group, is attributable to extensive plant coverage in the former, sustaining an unspoiled ecological environment. Conversely, the emergence of the semi-housed mode in the comparison group resulted in frequent activities of Tibetan pigs, damaging the plants and negatively affecting Bacteroidota abundance through faeces and other factors. There was a notable decline in aerobic, forms_biofilms, and gram_negative related phenotypes, while an increase in anaerobic, facultatively_anaerobic, and gram_positive phenotypes in microbial phenotyping. This change can be attributed to the entry of anaerobic and gram-positive bacteria into the soil environment via the faeces of Tibetan pigs and the decomposition of feed, leading to a dramatic change in the biological activity and composition of the environment. Microbial functions analysis identified significant increases in lipid metabolism, xenobiotics biodegradation and metabolism, and cell motility. These findings are related to the microorganisms present in Tibetan pig manure compared to the original soil. The metabolism of terpenoids and polyketides was primarily associated with fungi in the small ecosystem. However, adding faeces negatively affected the original ecosystem, causing a decline in the population of functional bacteria.
5. Conclusions
In conclusion, this study investigated the environmental soil stress of Tibetan pig grazing in the Tibetan Plateau region. For this purpose, the soil physicochemical properties and microbial composition at various depths in the Tibetan pig activity site under semi-housed feeding mode were compared with the control soil. The results demonstrated that the soil physicochemical properties and microbial diversity in the Tibetan pig activity area experienced substantial alterations, indicating that the shallower the soil depth, the higher the content of nitrogen, phosphorus, potassium, and organic carbon, the higher the abundance of thick-walled phylum, anaerobic, and gram-positive bacteria, and the significantly lower abundance of aerobic and gram-negative bacteria, indicating that the Tibetan pig’s grazing activities, movement, foraging, and other behaviours resulted in a variety of elements of the shallow soil. This suggests that the movement and feeding behaviour of Tibetan pigs during grazing activities resulted in the accumulation of various elements in shallow soil and significant changes in soil microbial abundance, which negatively impact the soil ecosystem. This study provides essential data for restoring soil ecosystems in the Tibetan Plateau after grazing by Tibetan pigs, which is a significant scientific basis for protecting and restoring ecological environments in high-altitude areas.
Author Contributions
Conceptualization, Jian Zhang and Feifei Yan; Methodology, Jian Zhang; Validation, Feifei Yan and Jian Zhang; Formal Analysis, Feifei Yan; Resources, Jian Zhang and Mengqi Duan; Data Curation, Feifei Yan; Writing–Original Draft Preparation, Jian Zhang and Feifei Yan; Writing–Review & Editing, Hongliang Zhang and Mengjia Han; Supervision, Yangzom Chamba and Peng Shang; Project Administration, Yangzom Chamba and Peng Shang; Funding Acquisition, Peng Shang.
Funding
National Natural Science Foundation project (32360843); National Key Research and Development Project (2022YFD1600900); China Agricultural University-Tibet College of Agriculture and Animal Husbandry Joint Fund for Scientific Research (2023TC055); Graduate Education Innovation Program Project of Xizang Agricultural and Animal Husbandry University (YJS2023-18).
Institutional Review Board Statement
Not applicable.
Informed Consent Statement
Not applicable.
Data Availability Statement
The datasets used and/or analysed during the current study are available from the corresponding author upon reasonable request. All data generated or analysed during this study are included in this published article (and its Supplementary Information files).
Conflicts of Interest
The authors declare no conflict of interest.
Appendix A
Appendix A.1

Table A1.
Soil sample test results.
| Sample Name | Raw Reads | Clean Reads | Raw Tags | Clean Tags | Chimera | Effective Tags | Effective Ratio (%) | OTUs |
|---|---|---|---|---|---|---|---|---|
| Normal 0 | 125108 | 124780 | 123531 | 122445 | 23515 | 98930 | 79.08 | 2736 |
| Normal 0-1 | 132844 | 132770 | 132128 | 131700 | 12557 | 119143 | 89.69 | 3070 |
| Normal 0-2 | 125415 | 125343 | 124653 | 124143 | 9659 | 114484 | 91.28 | 2338 |
| Normal 10 | 122593 | 122336 | 121236 | 119692 | 22404 | 97288 | 79.36 | 2742 |
| Normal 10-1 | 129734 | 129653 | 128969 | 128609 | 9329 | 119280 | 91.94 | 2417 |
| Normal 10-2 | 136557 | 136463 | 135778 | 135288 | 9969 | 125319 | 91.77 | 1998 |
| Normal 20 | 129944 | 129614 | 128440 | 126827 | 23568 | 103259 | 79.46 | 2757 |
| Normal 20-1 | 133669 | 133587 | 132927 | 132553 | 11939 | 120614 | 90.23 | 2408 |
| Normal 20-2 | 110594 | 110526 | 109882 | 109499 | 6674 | 102825 | 92.98 | 1970 |
| Normal 40 | 117860 | 117599 | 116545 | 115909 | 20483 | 95426 | 80.97 | 2708 |
| Normal 40-1 | 135529 | 135452 | 134770 | 134413 | 10371 | 124042 | 91.52 | 2841 |
| Normal 40-2 | 134302 | 134220 | 133493 | 133094 | 7683 | 125411 | 93.38 | 2274 |
| Normal 80 | 117333 | 117031 | 116015 | 115032 | 21778 | 93254 | 79.48 | 2151 |
| Normal 80-1 | 130913 | 130839 | 130062 | 129662 | 12446 | 117216 | 89.54 | 2755 |
| Normal 80-2 | 123067 | 122981 | 122192 | 121791 | 10053 | 111738 | 90.79 | 2638 |
| Normal 150 | 121090 | 120814 | 119676 | 119092 | 21856 | 97236 | 80.3 | 2860 |
| Normal 150-1 | 126962 | 126887 | 126224 | 125908 | 10819 | 115089 | 90.65 | 2813 |
| Normal 150-2 | 118840 | 118763 | 118068 | 117735 | 5884 | 111851 | 94.12 | 1799 |
| Normal 300 | 119870 | 119608 | 118613 | 117902 | 22802 | 95100 | 79.34 | 2793 |
| Normal 300-1 | 130204 | 130127 | 129467 | 129158 | 12897 | 116261 | 89.29 | 2787 |
| Normal 300-2 | 124511 | 124436 | 123651 | 123294 | 10029 | 113265 | 90.97 | 2330 |
| Control 0 | 125995 | 125663 | 124336 | 123596 | 21459 | 102137 | 81.06 | 991 |
| Control 0-1 | 128710 | 128622 | 127880 | 127592 | 12807 | 114785 | 89.18 | 1270 |
| Control 0-2 | 130978 | 130894 | 130110 | 129791 | 12565 | 117226 | 89.5 | 1548 |
| Control 10 | 134698 | 134276 | 132930 | 132048 | 17142 | 114906 | 85.31 | 1216 |
| Control 10-1 | 121159 | 121087 | 120369 | 120072 | 10940 | 109132 | 90.07 | 1633 |
| Control 10-2 | 125142 | 125049 | 124252 | 123814 | 11497 | 112317 | 89.75 | 2016 |
| Control 20 | 123508 | 123157 | 121757 | 120882 | 20237 | 100645 | 81.49 | 923 |
| Control 20-1 | 130562 | 130489 | 129746 | 129421 | 11666 | 117755 | 90.19 | 1325 |
| Control 20-2 | 121527 | 121450 | 120656 | 120321 | 9600 | 110721 | 91.11 | 1495 |
| Control 40 | 137067 | 136689 | 135194 | 134337 | 23816 | 110521 | 80.63 | 1310 |
| Control 40-1 | 130754 | 130680 | 130011 | 129653 | 12910 | 116743 | 89.28 | 1979 |
| Control 40-2 | 137990 | 137888 | 137090 | 136634 | 12078 | 124556 | 90.26 | 2118 |
| Control 80 | 130777 | 130465 | 129350 | 128046 | 19958 | 108088 | 82.65 | 1094 |
| Control 80-1 | 133769 | 133701 | 132970 | 132606 | 12301 | 120305 | 89.93 | 1804 |
| Control 80-2 | 135601 | 135517 | 134804 | 134295 | 10328 | 123967 | 91.42 | 1791 |
| Control 150 | 85325 | 85138 | 84318 | 83896 | 15608 | 68288 | 80.03 | 2093 |
| Control 150-1 | 93418 | 93360 | 92896 | 92620 | 7769 | 84851 | 90.83 | 2375 |
| Control 150-2 | 96913 | 96856 | 96273 | 95874 | 5652 | 90222 | 93.1 | 2027 |
| Control 300 | 132493 | 132175 | 130910 | 129936 | 23805 | 106131 | 80.1 | 2534 |
| Control 300-1 | 135658 | 135587 | 134867 | 134480 | 11279 | 123201 | 90.82 | 3442 |
| Control 300-2 | 124172 | 124114 | 123383 | 123070 | 6928 | 116142 | 93.53 | 2463 |
References
- Kang, Y.; et al. Impacts of supplementing chemical fertilizers with organic fertilizers manufactured using pig manure as a substrate on the spread of tetracycline resistance genes in soil. Ecotoxicology and Environmental Safety 2016, 130, 279–288. [Google Scholar] [CrossRef] [PubMed]
- Li, X.; et al. Long-term changes in organic and inorganic phosphorus compounds as affected by long-term synthetic fertilisers and pig manure in arable soils. Plant and Soil 2022, 472, 239–255. [Google Scholar] [CrossRef]
- Hamm, A.C.; et al. Bacterial communities of an agricultural soil amended with solid pig and dairy manures, and urea fertilizer. Applied Soil Ecology 2016, 103, 61–71. [Google Scholar] [CrossRef]
- Zhou, X.; et al. Turning pig manure into biochar can effectively mitigate antibiotic resistance genes as organic fertilizer. Science of The Total Environment 2019, 649, 902–908. [Google Scholar] [CrossRef]
- Shang, P.; et al. Identification of lncRNAs and Genes Responsible for Fatness and Fatty Acid Composition Traits between the Tibetan and Yorkshire Pigs. International Journal of Genomics 2019, 2019, 5070975. [Google Scholar] [CrossRef]
- Shang, P.; et al. Plateau Adaptation Gene Analyses Reveal Transcriptomic, Proteomic, and Dual Omics Expression in the Lung Tissues of Tibetan and Yorkshire Pigs. Animals 2022, 12, 1919. [Google Scholar] [CrossRef]
- Zhou, R.; et al. The Meishan pig genome reveals structural variation-mediated gene expression and phenotypic divergence underlying Asian pig domestication. Mol Ecol Resour 2021. [Google Scholar] [CrossRef]
- Chen, Q.-L.; et al. Do manure-borne or indigenous soil microorganisms influence the spread of antibiotic resistance genes in manured soil? Soil Biology and Biochemistry 2017, 114, 229–237. [Google Scholar] [CrossRef]
- Chen, G.; et al. Animal manures promoted soil phosphorus transformation via affecting soil microbial community in paddy soil. Science of The Total Environment 2022, 831, 154917. [Google Scholar] [CrossRef]
- Zhang, Y.; et al. Animal wastes as fertilizers enhance growth of young walnut trees under soil drought conditions. Journal of the science of food and agriculture 2020, 100, 3445–3455. [Google Scholar] [CrossRef]
- Wang, K.; et al. Transformation of dissolved organic matters in swine, cow and chicken manures during composting. Bioresource Technology 2014, 168, 222–228. [Google Scholar] [CrossRef]
- Wang, K.; et al. Transformation of organic matters in animal wastes during composting. Journal of Hazardous Materials 2015, 300, 745–753. [Google Scholar] [CrossRef] [PubMed]
- Laconi, A.; et al. Microbial community composition and antimicrobial resistance in agricultural soils fertilized with livestock manure from conventional farming in Northern Italy. Science of The Total Environment 2021, 760, 143404. [Google Scholar] [CrossRef] [PubMed]
- Tyrrell, C.; et al. Differential impact of swine, bovine and poultry manure on the microbiome and resistome of agricultural grassland. Science of The Total Environment 2023, 886, 163926. [Google Scholar] [CrossRef] [PubMed]
- Brown, M.D.; et al. Fecal and soil microbiota composition of gardening and non-gardening families. Scientific Reports 2022, 12, 1595. [Google Scholar] [CrossRef]
- Piash, M.I.; Iwabuchi, K.; Itoh, T.; Uemura, K. Release of essential plant nutrients from manure- and wood-based biochars. Geoderma 2021, 397, 115100. [Google Scholar] [CrossRef]
- Hayashi, S.; Hara, M.; Katoh, M. Improvement on Plant Uptake of Inorganic Nutrients Fertilized by Migration of Water-Soluble Organic Matter From Animal Manure-Based Compost. Journal of Soil Science and Plant Nutrition 2022, 22, 3399–3413. [Google Scholar] [CrossRef]
- Vahidi, M.J.; Sayyari Zahan, M.H.; Bayat, H.; Parsa, Z. Short-term changes of soil physicochemical properties affected by organic modifier type and its application method. Archives of Agronomy and Soil Science 2023, 69, 3015–3029. [Google Scholar] [CrossRef]
- Demir, Z. Effects of Vermicompost on Soil Physicochemical Properties and Lettuce (Lactuca sativa Var. Crispa) Yield in Greenhouse under Different Soil Water Regimes. Communications in Soil Science and Plant Analysis 2019, 50, 2151–2168. [Google Scholar] [CrossRef]
- Nahar, M.S.; et al. Differential effects of raw and composted manure on nematode community, and its indicative value for soil microbial, physical and chemical properties. Applied Soil Ecology 2006, 34, 140–151. [Google Scholar] [CrossRef]
- Wu, H.; et al. Effects of irrigation and nitrogen fertilization on greenhouse soil organic nitrogen fractions and soil-soluble nitrogen pools. Agricultural Water Management 2019, 216, 415–424. [Google Scholar] [CrossRef]
- Jian, S.; et al. Soil extracellular enzyme activities, soil carbon and nitrogen storage under nitrogen fertilization: A meta-analysis. Soil Biology and Biochemistry 2016, 101, 32–43. [Google Scholar] [CrossRef]
- Chen, X.; et al. Long-term excessive phosphorus fertilization alters soil phosphorus fractions in the acidic soil of pomelo orchards. Soil and Tillage Research 2022, 215, 105214. [Google Scholar] [CrossRef]
- Wang, C.; Xie, Y.; Tan, Z. Soil potassium depletion in global cereal croplands and its implications. The Science of the total environment 2023, 907, 167875. [Google Scholar] [CrossRef]
- Sun, W.; et al. Effects of climate change and anthropogenic activities on soil pH in grassland regions on the Tibetan Plateau. Global Ecology and Conservation 2023, 45, e02532. [Google Scholar] [CrossRef]
- Reeves, J.L.; Liebig, M.A. Depth Matters: Soil pH and Dilution Effects in the Northern Great Plains. Soil Science Society of America Journal 2016, 80. [Google Scholar] [CrossRef]
- Luo, P.; et al. Long-Term Application of Pig Manure to Ameliorate Soil Acidity in Red Upland. Agriculture 2023, 13, 1837. [Google Scholar] [CrossRef]
- Liu, Y.; et al. Meta-analysis on the effects of types and levels of N, P, and K fertilization on organic carbon in cropland soils. Geoderma 2023, 437, 116580. [Google Scholar] [CrossRef]
- Gao, X.-s.; et al. Spatial variability of soil total nitrogen, phosphorus and potassium in Renshou County of Sichuan Basin, China. Journal of Integrative Agriculture 2019, 18, 279–289. [Google Scholar] [CrossRef]
- Liu, J.; et al. Effect of Different Fertilization Measures on Soil Salinity and Nutrients in Salt-Affected Soils. Water 2023, 15, 3274. [Google Scholar] [CrossRef]
- Wang, B.; et al. Effect of mixed soil microbiomes on pyrene removal and the response of the soil microorganisms. Science of The Total Environment 2018, 640-641, 9–17. [Google Scholar] [CrossRef] [PubMed]
- Schloter; et al. Microbial indicators for soil quality. Biology & Fertility of Soils Cooperating Journal of the International Society of Soil Science 2018. [Google Scholar]
- Malinowska, A.M.; Schmidt, M.; Chmurzynska, A. Diet quality, anthropometrics, and gut microbiota composition in healthy adults. Proceedings of the Nutrition Society 2020, 79, E369. [Google Scholar] [CrossRef]
- Shang, P.; et al. Environmental exposure to swine farms reshapes human gut microbiota. Chemosphere 2022, 307, 135558. [Google Scholar] [CrossRef]
- Bulgarelli, D.; Schlaeppi, K.; Spaepen, S.; Themaat, E.V.L.V.; Schulze-Lefert, P. Structure and functions of the bacterial microbiota of plants. Annual Reviews 2013. [Google Scholar] [CrossRef]
Figure 1.
Results of soil physicochemical property measurements.
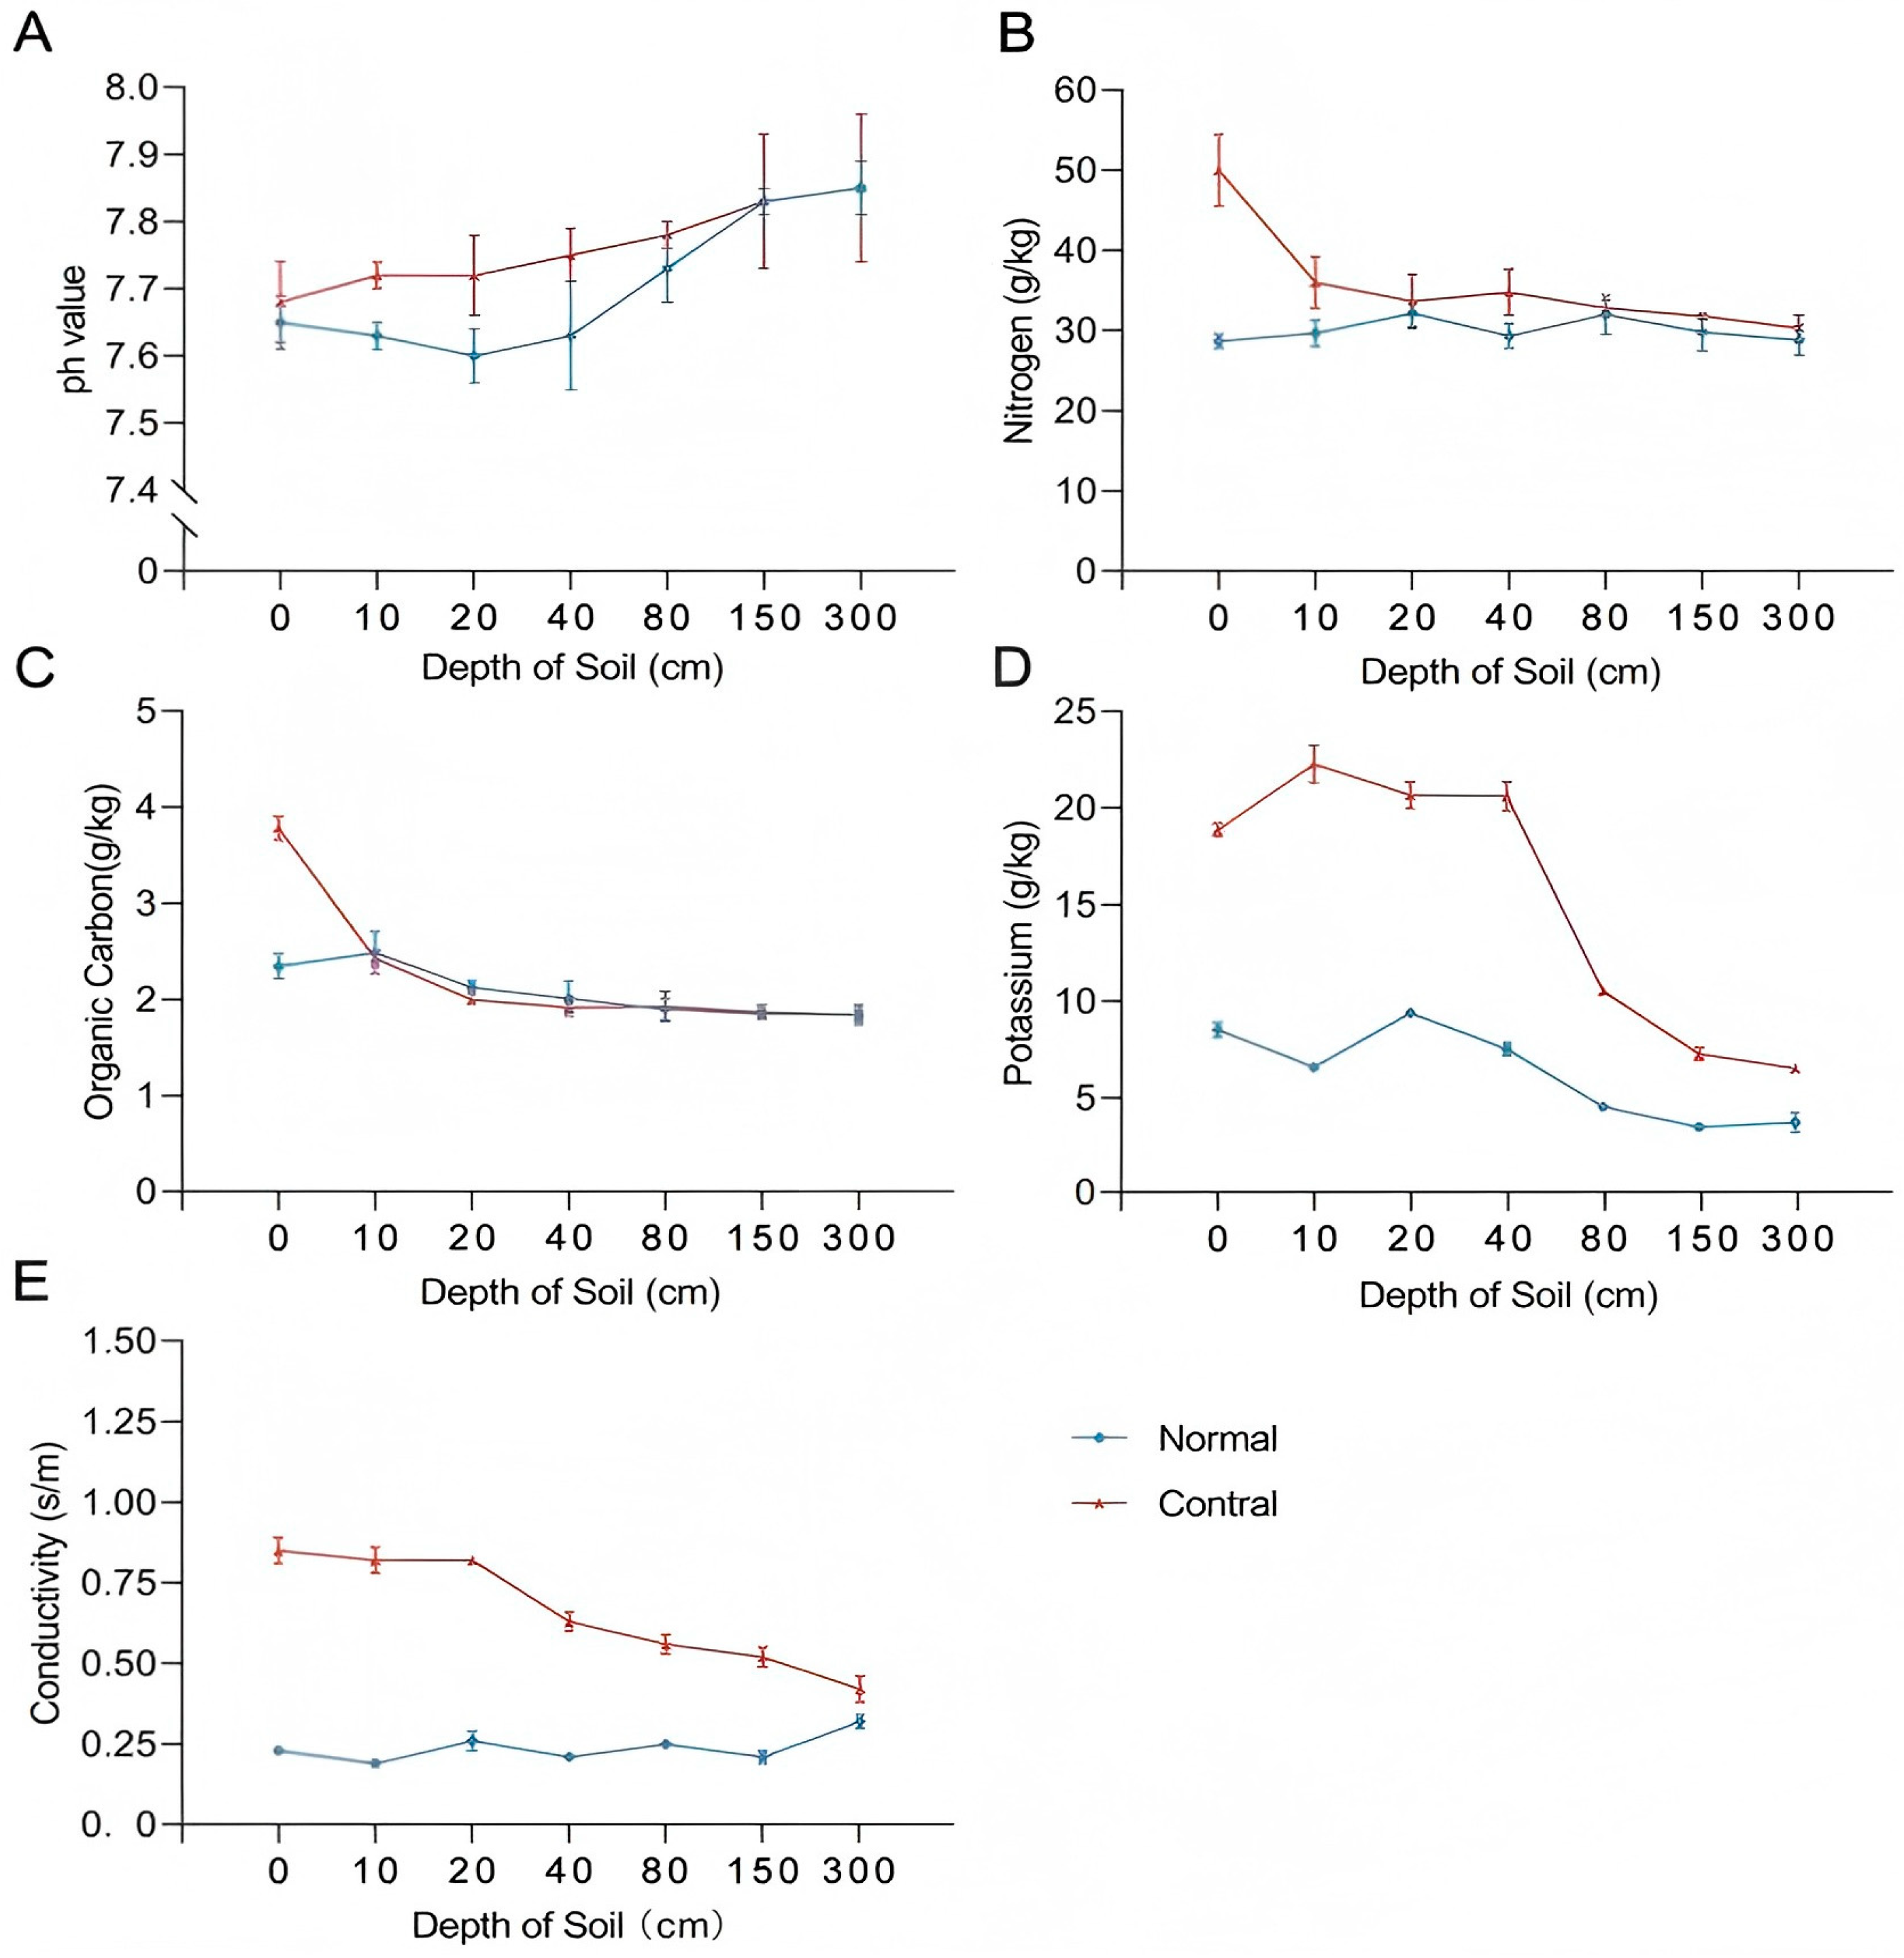
Figure 2.
(A) Dilution curves; (B) Species Rank curves; (C) Welch’s t-test.
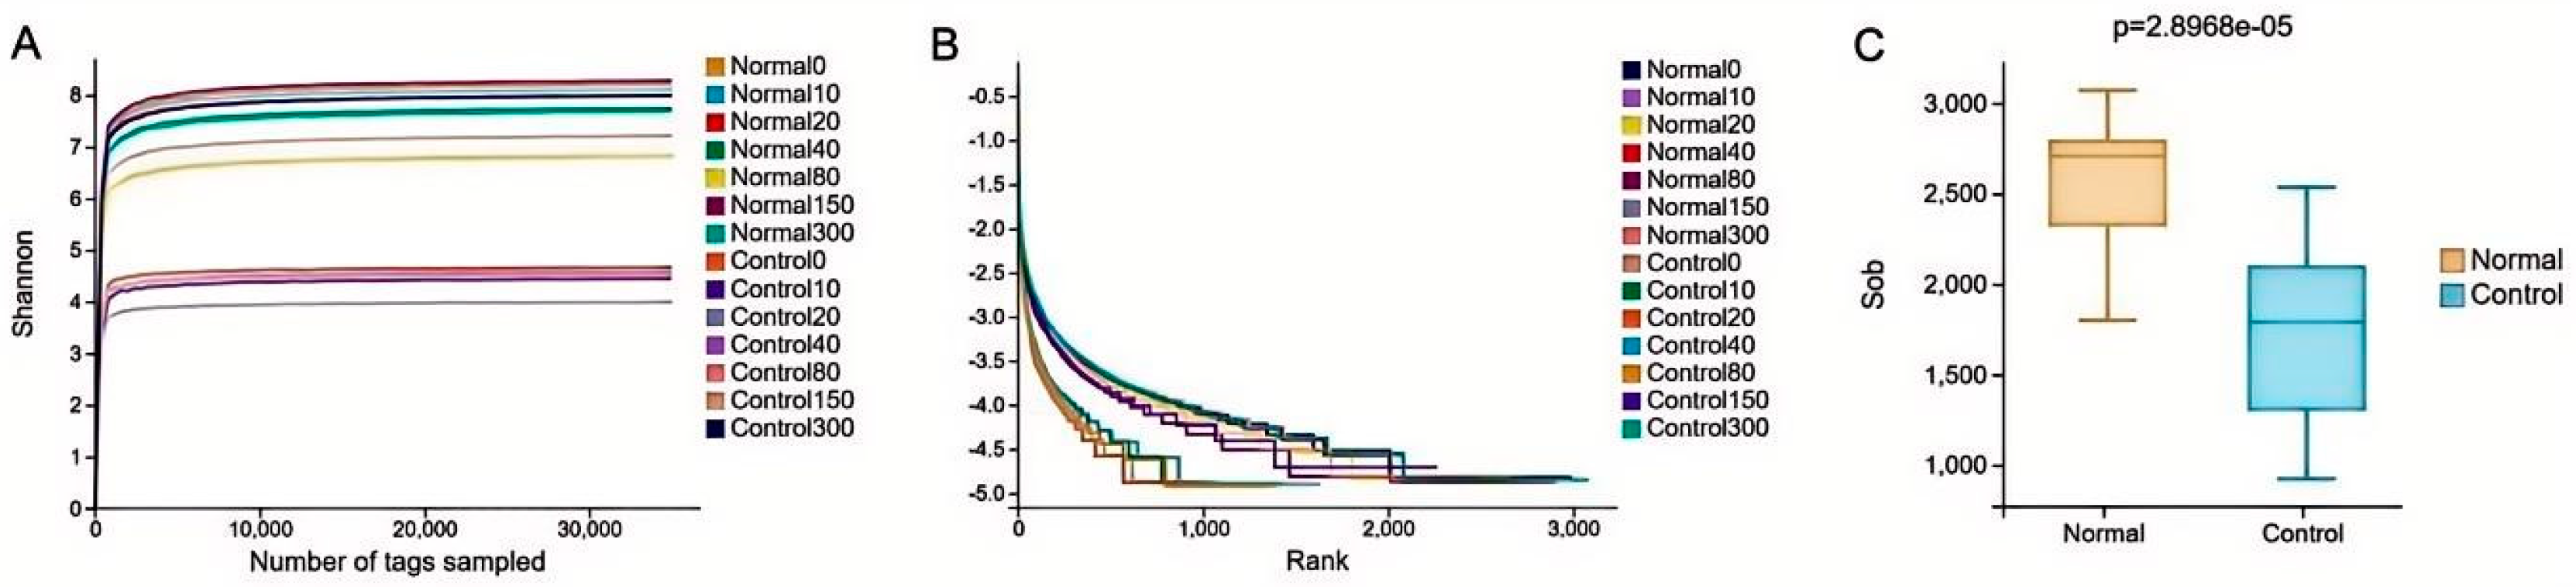
Figure 3.
Species composition and richness in the samples.
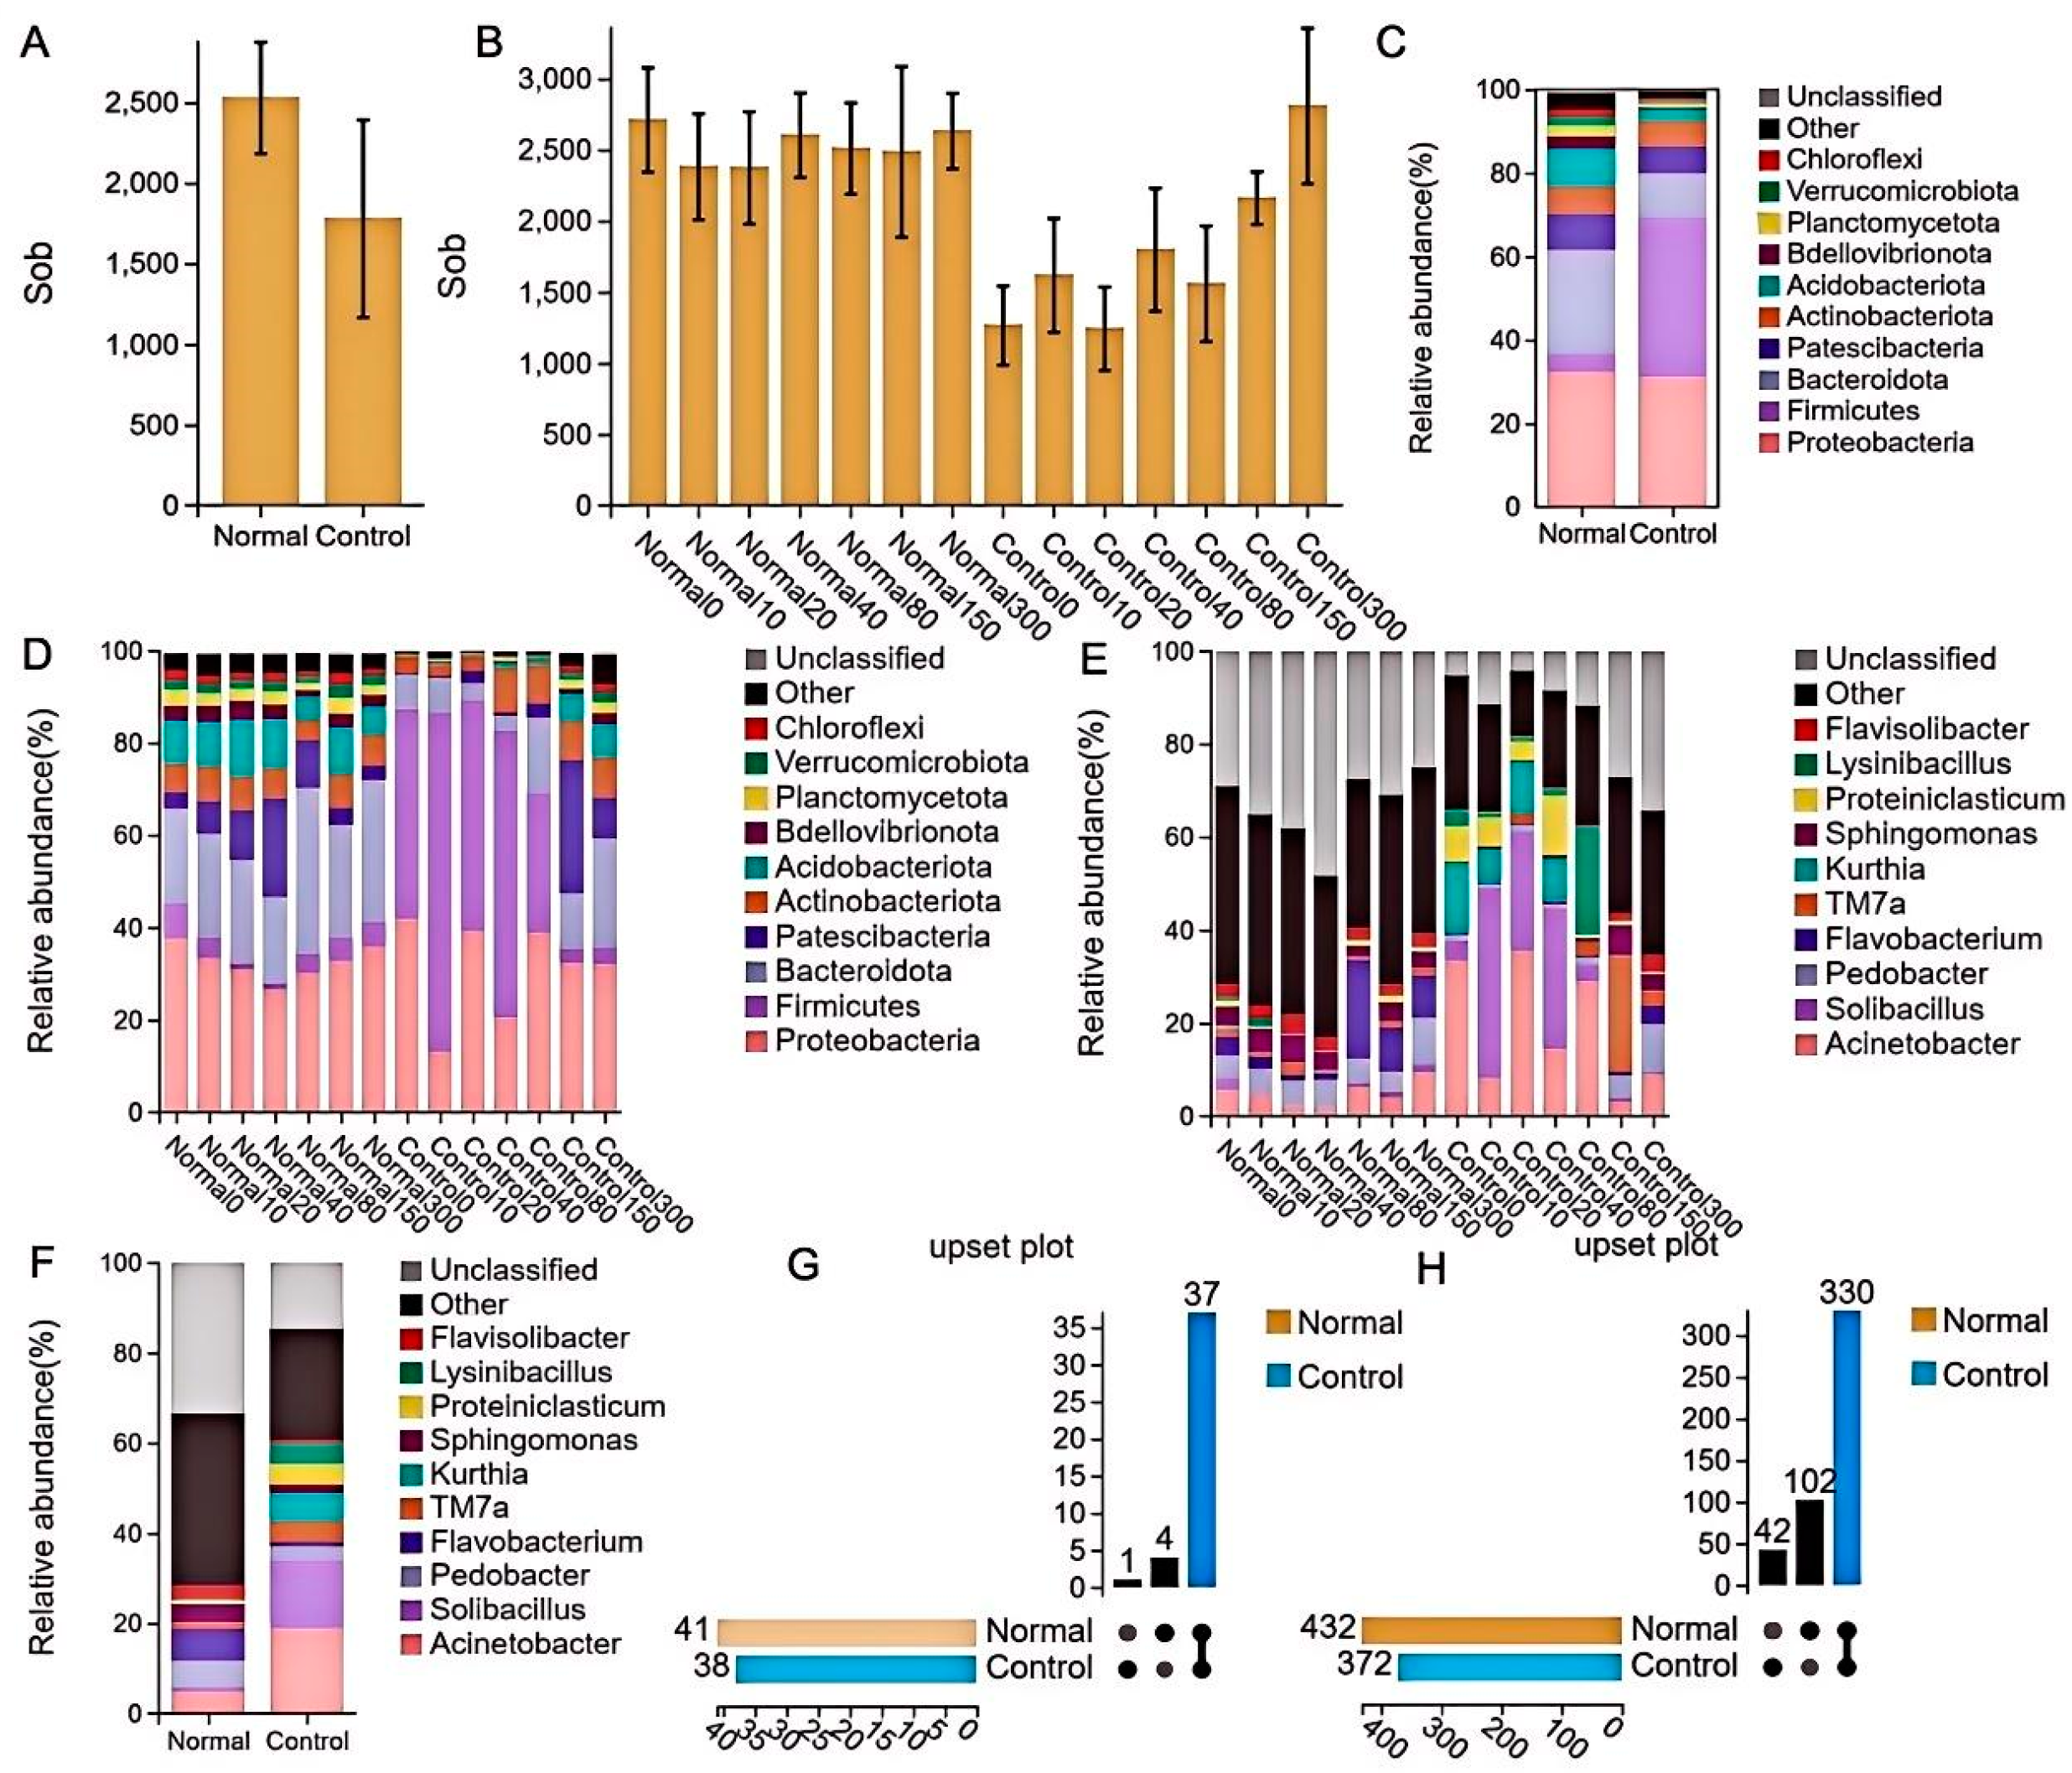
Figure 4.
Species difference test and functional distribution.
Disclaimer/Publisher’s Note: The statements, opinions and data contained in all publications are solely those of the individual author(s) and contributor(s) and not of MDPI and/or the editor(s). MDPI and/or the editor(s) disclaim responsibility for any injury to people or property resulting from any ideas, methods, instructions or products referred to in the content. |
© 2025 by the authors. Licensee MDPI, Basel, Switzerland. This article is an open access article distributed under the terms and conditions of the Creative Commons Attribution (CC BY) license (http://creativecommons.org/licenses/by/4.0/).
Copyright: This open access article is published under a Creative Commons CC BY 4.0 license, which permit the free download, distribution, and reuse, provided that the author and preprint are cited in any reuse.


