
Submitted:
13 April 2025
Posted:
14 April 2025
You are already at the latest version
Abstract
Nephelium lappaceum is a tropical fruit reported for various bioactivities, including antidiabetic, analgesic, anti-inflammatory, immunomodulatory, antioxidant, anticancer, and antimicrobial properties. This study aimed to determine the total polyphenol content in different types of rambutan fruit peel extracts (RFPE) from Sulawesi Island and combine it with multivariate calibration analysis. Four types of RFPE, namely rambutan aceh (RA), rambutan rapiah (RR), rambutan garuda (RG), and rambutan lengkeng (RL), were extracted using the maceration method with variations in solvents (70% ethanol and 96% ethanol) and the amount of ethanol solvent (500 ml, 1000 ml, and 1500 ml), resulting in 24 extracts. The wavelength measurements were conducted using FTIR in the 400–4000 cm-1 range, combined with the partial least squares (PLS) method with leave-one-out validation. The research revealed that the highest total polyphenol content was found in RA RFPE with 70% ethanol solvent (1000 ml), reached 12.474 mg equivalent rutin/g extract. Based on the variations, the total polyphenol content followed the RA > RR > RL > RG, 70% ethanol solvent > 96% ethanol solvent, and 1000 ml solvent > 1500 ml > 500 ml. In the wavelength range of 341.40-3429.43 cm-1, variations in RFPE extracts were detected containing functional groups such as hydroxyl groups, carboxylic acids, aromatic rings, and carbonyl groups as polyphenols. Validation of the rutin compound in RFPE extract variations showed SD values ranging from 0.0000 to 0.5686, % CV from 0.01 to 0.25, and using 2 PLS components resulted in optimal values with X variance 0.999870, R-Sq 0.994407, and R-Sq (pred) 0.991514. The FTIR spectrum and multivariate calibration analysis provide an accurate model for determining compounds in various natural extracts.
Keywords:
Partial Least Square
; Nephelium lappaceum
; Spectroscopy
; Polyphenol
1. Introduction
Nephelium lappaceum L., commonly known as rambutan, is a tropical fruit renowned for its juicy and sweet flavor. Belonging to the Sapindaceae family, this fruit has gained global popularity because of its delectable taste [1]. Rambutan is a significant fruit commodity in various regions, including Southeast Asia, Australia, South America, and several African countries [2]. Rambutan availability extends beyond fresh consumption, contributing to processed industrial products such as canned fruit, juices, jams, jellies, marmalades, and various spreads [3].
In addition to its role as a food source, rambutan is reported to contribute in providing health benefits, showcasing potential bioactivities such as antidiabetic, analgesic, anti-inflammatory, immunomodulatory, antioxidant, anticancer and antimicrobial properties [1,2,4,5]. The extract from rambutan fruit peel (RFPE), which was once overlooked, is now the focus of research because of its rich chemical composition. The chemical composition of RFPE includes cellulose, hemicellulose, and lignin, with percentages of 24.28%, 11.62%, and 35.34%, respectively.
Furthermore, rambutan peel contains a number of phenolic compounds [6]. Previous study demonstrated the influence of ethanol concentration on the extraction of phenolic compounds from RFPE and found that 60% ethanol yields the highest phenolic extract [7]. In another report, extraction with 80.85% ethanol can also produce high phenolic yields [8]. RFPE is particularly intriguing because of the presence of major phenolic compounds such as rutin [1,9]. Rutin is one of the polyphenolic compounds reported to have a significant content in methanol extracts of RFPE [10]. The rutin content can be detected using UV–Vis spectrophotometry at a wavelength of 271.44 nm [11]. Methods for determining the total polyphenol content in medicinal plants vary; however, some commonly used methods include thin-layer chromatography, high-performance liquid chromatography, capillary electrophoresis, and spectrophotometry.
In this research, spectrophotometry is the main focus because of its ability to determine the total polyphenol content in plants [12]. This method is based on light absorption at a specific wavelength by polyphenolic compounds, allowing quantitative concentration measurement. The main advantages of spectrophotometry are its simplicity, speed of analysis, and ability to be used for a large number of samples at a lower cost compared to the other methods. For the characterization of compounds in the extract, particularly concerning rutin, the use of Fourier transform infrared spectroscopy (FTIR) is crucial.
FTIR provides a spectrum depicting the interactions between molecules and IR light, which can be used to identify the chemical bonds and functional groups present in the sample. Multivariate analysis using FTIR can yield accurate and precise results for the detection of natural compounds [13]. This research will optimize the total polyphenol content in various RFPE variations using different ethanol solvent concentrations (70% and 96%) and varying total solvent volumes (500 ml, 1000 ml, and 1500 ml). In addition, the study will consider variations of RFPE from Sulawesi Island, such as rambutan aceh (RA), rambutan rapiah (RR), rambutan garuda (RG), and rambutan lengkeng (RL). This research will encompass the application of chemometrics and multivariate calibration analysis to validate rutin in RFPE extract variations. By combining spectrophotometry and FTIR methods, this study is expected to profoundly understand the composition of RFPE compounds, particularly rutin. Validating rutin in RFPE variations will be a crucial step to ensure the accuracy and consistency of the analysis results, contributing significantly to a deeper understanding of the potential applications of rambutan fruit peel in the health field and as a source of raw materials for traditional medicine in the future.
2. Materials and Methods
In this study, the extract samples used were derived from ethanol extracts of rambutan fruit peel (RFPE) obtained from Sulawesi Island. RFPE was collected from four regions in Sulawesi, Indonesia. Rambutan authentication was conducted at the Faculty of Pharmacy, Hasanuddin University, Makassar, South Sulawesi, Indonesia. Rutin’s reference standards (purity ≥98%) were procured from East Merck, Darmstadt, Germany.
2.1. Sample Preparation
The RFPE was cut into small pieces and dried in an oven at 40–50 oC. The dried RFPE was then pulverized. A total of 100 g of each RFPE powder was macerated with various solvents, namely 96% and 70% ethanol, the amount of ethanol solvent (500 ml, 1000 ml, and 1500 ml), and rambutan peel types (RA, RR, RG, and RL) for three days, with daily stirring. After this process, the resulting extract was filtered and evaporated in a vacuum at 60–80 oC followed by freeze-drying. Twenty-four types of RFPE extracts were obtained as listed in Table 1 and their respective code types. The percentage yield of the extract was calculated using the following formula [14]:
% Yield extract = Weight of dried extracts x 100%
Weight of dried materials
Weight of dried materials
2.2. Polyphenol Identification
The procedure followed standard protocols for qualitatively testing polyphenols using thin-layer chromatography (TLC). Extracts from each RFPE, 1 mg/10 mL (4 µl), were spotted onto RP-18 silica gel plates. The plates were then placed in a chamber saturated with mobile phase composed of methanol: H2O in a 1:1 ratio. Observations were made at two UV wavelengths: 245 and 366 nm. Subsequently, the TLC plates were sprayed with a citric acid-boric acid spray reagent to visualize color changes in the spots where yellow (orange), blue or green colors can be formed [15]. The retention factor (Rf) values of the spots were compared with the rutin standard, with spots present in each extract.
2.3. UV-Vis Analysis of Rutin
2.3.1. Preparation of the Standard Solution and Standard Curve
A standard solution with a concentration of 1000 μg/ml of rutin was prepared following the outlined procedure: precisely weighing 100 mg of rutin and dissolving it in a 1:1 v/v solution of 95% ethanol. The solution was further diluted to achieve concentrations of 20, 40, 60, 80, and 100 μg/ml . From each solution, 0.5 mL was pipetted and mixed with 1.5 mL of 95% ethanol, 0.1 mL of 10% AlCl3 solution, 0.1 mL of 1 M acetic acid (CH3COOH), and 2.8 mL of distilled water. The mixture was allowed to stand for 30 min. Subsequently, the absorbance was measured using a UV-Vis spectrophotometer (PG Instruments T92+) to identify the maximum wavelength of rutin, which was determined to be 398 nm [16]. The standard curve, as shown, was generated with a regression equation of y=0.0048x + 0.0365 (R2=0.9954).
2.3.2. Total Polyphenol Content in the Rambutan Peel Extract
A total of 24 RFPE extract samples, each weighing 10 mg, were prepared, and stock solutions with a concentration of 100 μg/ml were created. From this stock solution, 0.5 mL was mixed with 1.5 mL of 95% ethanol, 0.1 mL of 10% AlCl3 solution, 0.1 mL of 1 M acetic acid, and 2.8 mL of distilled water. The mixture was then incubated for 30 min at room temperature. After incubation, the absorbance of the solution was measured using a UV-Vis spectrophotometer (PG Instruments T92+), and the maximum wavelength of rutin was identified at 398 nm [16]. Measurements were performed in triplicate for each sample. The total polyphenol content was then calculated on the basis of a previously constructed calibration curve using rutin standards and inserted using the following formula:
Total polyphenol content = C V fp
g
g
Description: C = Phenolic concentration (x-value)
V = Volume of extract used (mL)
fp = Dilution factor
g = Weight of the sample used
2.4. Analysis of Extracts Using an FTIR
The FTIR spectrum measurements were conducted following the method described by Tejamukti et al. [13] with modifications. A total of 24 extract samples and rutin standards were weighed at 5 mg and then mixed with 5 mg of KBr in 5 mL of analytical-grade methanol. Measurements were performed using a Perkin Elmer Spectrum GX FTIR spectrophotometer with a deuterated triglycine sulfate detector. Sixteen scans were performed per sample within the absorption data range from 400 to 4000 cm-1.
2.5. Data Analysis
The data analysis involved investigating the influence of solvent variation, solvent volume, and types of rambutan peel extracts (RFPE) on the total polyphenol content using an interaction and main plot. The standard deviation (SD), average calculation, and percentage coefficient of variation (CV) were also measured. Furthermore, the multivariate calibration method partial least squares (PLS) regression was employed for model selection and rutin validation in extract variations. The evaluated parameters include the R-squared (R2), PRESS (predicted residual error sum of squares), R-squared predicted (R-Sq pred), and X variance. The analysis was performed using Minitab® version 18 software (Minitab Incorporation, USA).
3. Results
In this research, extractions were performed from 24 types of rambutan originating from variations in ethanol solvent (70% and 96%) and solvent volume (500 ml, 1000 ml, and 1500 ml) between samples and solvents, as well as four types of rambutan peel varieties from Sulawesi Island, namely RA, RR, RG, and RL. Preliminary tests on polyphenol content, as recorded in Table 1, indicate that all extracts contain polyphenols, with extract yield percentages ranges between 9.51 and 15.68%. The use of a ethanol in this research suggested effective extraction in achieving higher yields, which is in agreement with previous findings [14].
TLC was conducted using an RP-18 silica gel stationary phase and a mobile phase eluent of methanol: H2O (1:1). The TLC analysis showed a retention factor (Rf) value of 0.3 under UV light at 245 and 366 nm. In addition, positive results in the polyphenol test indicated that the extract contains rutin compounds. Previous studies have identified major phenolic compounds in RFPE peel, such as geraniin, ellagic acid, quercetin, rutin, and corilagin [2,17].
The properties of the rutin compounds were further confirmed using a UV–Vis spectrophotometer, which revealed maximum absorption at a wavelength of 398 nm [16]. This finding is consistent with that of Mirgorod et al. (2013) [18], who stated that rutin compounds have three absorption peaks in the UV– Vis spectrum at 270, 320, and 398 nm. Thus, this research provides an in-depth insight into the composition of rutin in the extract, particularly concerning polyphenol and rutin compound contents. Identifying these compounds provides a crucial foundation for a better understanding of their potential applications in health, particularly for extracts such as RA, RR, RG, and RL originating from Sulawesi Island.
Based on the data analysis presented in Table 2, it can be concluded that the variation in the RFPE extract significantly affects the total polyphenol content. Specifically, the RA-type extracts showed higher polyphenol content than the RR, RL, and RG extracts. Furthermore, the solvent comparison also influences the results, in which 70% ethanol solvent yielded higher polyphenol content than 96% ethanol solvent. This is align with the report by Lohvina et al.[19] on seed extracts of Trigonella foenum-graecum varieties, indicating that 70% ethanol solvent shows the highest total phenolic content compared with 30%, 50%, and 96% solvents (v/v). Moreover, the solvent volume also plays a crucial role, where the use of 1000 ml solvent yields a higher polyphenol content than the use of 1500 ml and 500 ml. Significant impact of the extraction solvent in producing total phenolics (TPC), polyphenols (TFC), proanthocyanidins (TPrC), and saponins (TSC) from the root of S. chinensis by Ngo et al., 2017 [20].

Table 2.
Total polyphenol content in various rambutan fruit peel extract (RFPE) types, ethanol solvent variations, and ethanol quantity from Sulawesi Island.
Table 2.
Total polyphenol content in various rambutan fruit peel extract (RFPE) types, ethanol solvent variations, and ethanol quantity from Sulawesi Island.
| Rambutan fruit peel extracts | Standar compound | Ethanol (%) | Ethanol (ml) |
Absorbance (a.u) |
SD |
Mean |
% CV | Polyphenols Total (mgg-1) |
Polyphenols Rate (mgg-1) |
| RA | Rutin | 70 | 500 | 0.4492 | 0.0014 | 0.4506 | 0.31 | 11.893 | 11.888 |
| 0.4506 | 11.881 | ||||||||
| 0.4520 | 11.891 | ||||||||
| 1000 | 0.6429 | 0.0004 | 0.6429 | 0.06 | 12.475 | 12.474 | |||
| 0.6433 | 12.483 | ||||||||
| 0.6425 | 12.466 | ||||||||
| 1500 | 0.6319 | 0.0001 | 0.6319 | 0.02 | 12.245 | 12.245 | |||
| 0.6320 | 12.247 | ||||||||
| 0.6318 | 12.243 | ||||||||
| RR | Rutin | 70 | 500 | 0.4998 | 0.0001 | 0.4998 | 0.01 | 9.493 | 9.493 |
| 0.4999 | 9.495 | ||||||||
| 0.4998 | 9.493 | ||||||||
| 1000 | 0.5810 | 0.0001 | 0.5809 | 0.01 | 12.854 | 12.850 | |||
| 0.5809 | 12.848 | ||||||||
| 0.5810 | 12.848 | ||||||||
| 1500 | 0.5687 | 0.5686 | 0.0003 | 0.06 | 10.929 | 10.928 | |||
| 0.5690 | 10.935 | ||||||||
| 0.5683 | 10.921 | ||||||||
| RG | Rutin | 70 | 500 | 0.4555 | 0.0001 | 0.4554 | 0.01 | 8.571 | 8.569 |
| 0.4554 | 8.568 | ||||||||
| 0.4554 | 8.568 | ||||||||
| 1000 | 0.5363 | 0.0001 | 0.5363 | 0.02 | 10.254 | 10.252 | |||
| 0.5363 | 10.252 | ||||||||
| 0.5362 | 10.252 | ||||||||
| 1500 | 0.6065 | 0.0001 | 0.6064 | 0.02 | 11.716 | 11.713 | |||
| 0.6063 | 11.712 | ||||||||
| 0.6063 | 11.712 | ||||||||
| RL | Rutin | 70 | 500 | 0.4838 | 0.0001 | 0.4837 | 0.02 | 10.081 | 10.079 |
| 0.4836 | 10.079 | ||||||||
| 0.4836 | 10.079 | ||||||||
| 1000 | 0.3769 | 0.0000 | 0.3769 | 0.01 | 11.295 | 11.289 | |||
| 0.3768 | 11.285 | ||||||||
| 0.3768 | 11.287 | ||||||||
| 1500 | 0.4809 | 0.0001 | 0.4808 | 0.02 | 10.621 | 10.621 | |||
| 0.4807 | 10.621 | ||||||||
| 0.4808 | 10.621 | ||||||||
| RA | Rutin | 96 | 500 | 0.6150 | 0.0003 | 0.6148 | 0.05 | 8.439 | 8.468 |
| 0.6144 | 8.468 | ||||||||
| 0.6149 | 8.497 | ||||||||
| 1000 | 0.6136 | 0.0001 | 0.6135 | 0.01 | 11.864 | 11.863 | |||
| 0.6135 | 11.862 | ||||||||
| 0.6136 | 11.864 | ||||||||
| 1500 | 0.5502 | 0.0002 | 0.5502 | 0.03 | 10.543 | 10.543 | |||
| 0.5504 | 10.547 | ||||||||
| 0.5500 | 10.539 | ||||||||
| RR | Rutin | 96 | 500 | 0.5875 | 0.0002 | 0.5874 | 0.03 | 11.321 | 11.317 |
| 0.5872 | 11.314 | ||||||||
| 0.5873 | 11.316 | ||||||||
| 1000 | 0.6611 | 0.0002 | 0.6609 | 0.03 | 11.185 | 11.185 | |||
| 0.6608 | 11.183 | ||||||||
| 0.6608 | 11.185 | ||||||||
| 1500 | 0.4854 | 0.0001 | 0.4854 | 0.02 | 9.193 | 9.193 | |||
| 0.4853 | 9.191 | ||||||||
| 0.4855 | 9.195 | ||||||||
| RG | Rutin | 96 | 500 | 0.3880 | 0.0010 | 0.3889 | 0.25 | 7.164 | 7.184 |
| 0.3890 | 7.185 | ||||||||
| 0.3899 | 7.204 | ||||||||
| 1000 | 0.4949 | 0.0001 | 0.4950 | 0.03 | 9.391 | 9.393 | |||
| 0.4951 | 9.395 | ||||||||
| 0.4950 | 9.393 | 9.228 | |||||||
| 1500 | 0.4875 | 0.0005 | 0.4871 | 0.10 | 9.237 | ||||
| 0.4871 | 9.229 | ||||||||
| 0.4866 | 9.218 | ||||||||
| RL | Rutin | 96 | 500 | 0.5280 | 0.0001 | 0.5279 | 0.01 | 9.143 | 9.151 |
| 0.5280 | 9.156 | ||||||||
| 0.5279 | 9.156 | ||||||||
| 1000 | 0.5863 | 0.0002 | 0.5860 | 0.04 | 6.933 | 6.931 | |||
| 0.5858 | 6.931 | ||||||||
| 0.5859 | 6.931 | ||||||||
| 1500 | 0.5539 | 0.0000 | 0.5539 | 0.01 | 9.102 | 9.098 | |||
| 0.5539 | 9.095 | ||||||||
| 0.5539 | 9.097 |
Notably, the highest polyphenol content was recorded in the RA extract type using 70% ethanol solvent in 1000 ml (8), reaching 12.474 mg equivalent rutin/g extract, as shown in Figure 1 and Table 2. In contrast, the lowest polyphenol content was found in RL using 96% ethanol solvent in 1000 ml (23), with a 6.931 mg equivalent rutin/g extract value. Based on the variations, the total polyphenol content was in the order of RA > RR > RL > RG, 70% ethanol solvent > 96% ethanol solvent, and solvent volume of 1000 ml > 1500 ml > 500 ml. These results are supported by interaction and main analysis, which indicates that the combination of rambutan peel extracts (RFPE) and solvents significantly impacts polyphenol content and is responsible for pharmacological effects by Sekar, M. 2020 [21].
The range of total polyphenol content in RFPE extracts from Sulawesi Island varies between 6.931 and 12.850 mg equivalent rutin/g extract, reflecting substantial variation in these compound contents. Absorbance measurements on 24 variations of RFPE extracts showed values between 0.3768 and 0.6433 in Table 2, with standard deviation (SD) values ranging from 0.0000 to 0.5686. Furthermore, the percentage coefficient of variation (% CV) analysis shows a range between 0.01 and 0.25. Low %CV values indicate a relatively low level of variation, indicating that the measurement results are relatively stable and consistent. Conversely, a high percentage CV may indicate uncertainty or greater fluctuations in the data (Crump, M. L. (1981) [22].
The FTIR spectra of the RFPE peel variations are shown in Figure 2. This study analyzed 24 variations of the rambutan peel extract (RFPE) peel, solvent variations, and one standard rutin compound using FTIR spectrophotometry at wavenumbers of 400–4000 cm-1. They were scanned in the form of percentage transmittance (%T). Rutin compounds were detected at 3743-3228 cm-1 (O-H stretching), 2936 cm-1, 2900 cm-1 (-CH2 stretching), 1759 cm-1 (-C=O group), 1652 cm-1, 1596 cm-1 (-C=C), 1499 cm-1 (aromatic ring), 1359 cm-1, 1289 cm-1 (C-O-C) (Das and Kalita, 2014). The results of the rutin compound spectrum are at positions 3425.58 cm-1 (O-H stretching), 2933.73 cm-1, 2906.73 cm-1 (-CH2 stretching), 1654.92 cm-1, 1600.92 cm-1 (-C=C), 1504.48 cm-1, 1456.26 cm-1 (aromatic ring), 1361.74 cm-1, 1294.24 cm-1 (C-O-C), 1170.79 cm-1, 1130.29 cm-1 (C-O), and 806.25 cm-1, 717.52 cm-1 (C-H). Rutin compounds were detected in the wavenumber range of 717.52-3425.58 cm-1. Based on this research, solvent and RFPE variations were detected at different wavenumbers, namely using 70% ethanol solvent at 341.40-3520.09 cm-1 and 96% ethanol solvent at 341.40-3429.43 cm-1, but generally not significantly different. Functional groups found in rutin compounds were also found in variations of rambutan peel extract from Sulawesi Island, namely (O-H stretching), (-CH2 stretching), (-C=C), (aromatic ring), (C-O-C), (C-O), and (C-H). Signals of the main functional groups of polyphenolic compounds from rambutan, such as hydroxyl groups (3235.69 cm-1), carboxylic acids (1702.49 cm-1), aromatic rings (1445.47 cm-1), and carbonyl groups (1080.80 cm-1) were determined as the most important (Mendez-Flores et al., 2018) [23].
The combination of FTIR spectra with multivariate PLS calibration can be an effective tool for quantitative analysis [13]. To perform quantitative analysis of the analytes in RFPE extracts, PLS compared predictor variable values of% transmittance in a specific wavenumber region between extract variations and standard rutin. Wavelength values from percent transmittance were combined to obtain new variables (principal components or PC) or PLS factors. PC and factors were used to model the analyte concentration. The data obtained from the FTIR analysis were then used for multivariate PLS calibration [13]. PLS analyzes several components to calibrate the predictor variables of RFPE extract variations with dependent variables of rutin compounds. In effective model selection using PLS calibration, the values of R-Sq (R-squared or R2), PRESS (predicted residual error sum of squares), R-Sq (pred) or R-squared predicted, and X variance can be observed. The R-squared (R-Sq or R2) value is the coefficient of determination invariant for the linear transformation of the distribution of independent variables, and a value close to one produces good predictions regardless of the scale in which the variable is measured [24]. The coefficient of determination (R2) is widely used as the most suitable statistic to describe the agreement between the model’s predictions and those observed empirically. R2 expresses the proportion of variance in the dependent variable explained by the model [25]. The predicted residual error sum of squares (PRESS) is the model’s predictability and is often represented by the square of the correlation coefficient between observed phenotypic and predicted values or residual errors predicted by the sum of squares. SS is the total sum of squares of phenotypic values. PRESS as a criterion for evaluating regression models differs from using an estimated residual sum of squares (ERESS) [26].
In this study, the prediction of the rutin compound content was conducted using FTIR spectroscopy. Rambutan peel variations (RA, RR, RG, and RL) and variations in the amount of 70% ethanol solvent (500 ml, 1000 ml, and 1500 ml) were explored in the wavelength range of 759.95 cm−1 – 3520.09 cm-1 according to the standard rutin used. Using 96% ethanol solvent showed wavelength detection between 759.95 cm−1 – 3437.15 cm−1, while standard rutin gave wavelengths between 717.15 cm−1 – 3425.58 cm−1. Modeling using the partial least squares (PLS) method in Table 3 with leave-one-out validation showed that the best model for predicting rutin content was obtained with variations in the type of rambutan peel and variations in the amount and concentration of 70% ethanol solvent, with X variance values of 0.999788, R-Sq 0.994053, and R-Sq (pred) 0.988571, while the use of 96% ethanol solvent produced a model with X variance 1.000000, R-Sq 0.998340, and R-Sq (pred) 0.99536. These results indicate that the normal spectrum, the first derivative, using 96% ethanol solvent, provides the most accurate FTIR spectrum predictions for determining the rutin content in the mentioned wavelength range. In Figure 3, the PLS response plot for rutin in RFPE extracts from Sulawesi Island obtained the number of components selected was 2 with X variance 0.999870, R-Sq 0.994407, and R-Sq (pred) 0.991514 between variables of RFPE extract variations and standard rutin overall, namely all types of rambutan peel, types and amounts of ethanol solvent.
Conclusion
The optimization of the total polyphenol content in various extracts of rambutan peel (RA, RR, RG, and RL), types of ethanol solvent (70% and 96%), and the amount of ethanol solvent (500 ml, 1000 ml, and 1500 ml) showed that the highest total polyphenol content was found in RA type RFPE with 70% ethanol solvent (1000 ml), amounting to 12.474 mg equivalent rutin/g extract. Based on the variation variables using interaction and main effect plots, the total polyphenol content in RA > RR > RL > RG, 70% ethanol solvent > 96% ethanol, and the amount of solvent 1000 ml > 1500 ml > 500 ml. In the measurement of spectra using FTIR, extract variations were detected at wavelengths of 341.40-3429.43 cm-1, containing functional groups such as (O-H stretching), (-CH2 stretching), (-C=C), (aromatic ring), (C-O-C), (C-O), and (C-H) as functional groups of polyphenolic compounds. Validation of rutin compounds in RFPE extract variations showed SD values of 0.0000–0.5686, % CV of 0.01–0.25, PLS values, and 2 selected components, resulting in optimal values at X variance 0.999870, R-Sq 0.994407, and R-Sq (pred) 0.991514. The use of PLS for cross-validation with the leave-one-out validation method shows that the obtained model is good and can be used as a reference for assessing the content of active compounds in each extract variation.
Author Contributions
W conceptualized and designed the study; W and BY performed the experiments and collected the data; W, BY, NB, SS and AR analyzed and interpreted the results; W, and BYprepared the initial manuscript; and BY, AR and GM reviewed and approved the final version of the manuscript.
Acknowledgments
The authors would like to thank the Faculty of Pharmacy at Hasanuddin University in Makassar, Indonesia, for providing essential laboratory facilities.
Conflicts of Interest
The authors declare no conflict of interest.
References
- Tsong, J. L., Goh, L. P. W., Gansau, J. A., & How, S. E. (2021). Review of Nephelium lappaceum and Nephelium ramboutan-ake: a high potential supplement. Molecules, 26(22), 7005. [CrossRef]
- Tingting, Z., Xiuli, Z., Kun, W., Liping, S., & Yongliang, Z. (2022). A review: extraction, phytochemicals, and biological activities of rambutan (Nephelium lappaceum L) peel extract. Heliyon. [CrossRef]
- Jahurul, M. H. A., Azzatul, F. S., Sharifudin, M. S., Norliza, M. J., Hasmadi, M., Lee, J. S., Patricia, M., Jinap, S., George, M. R. A., Khan, M. F., & Zaidul, I. S. M. (2020). Functional and nutritional properties of rambutan (Nephelium lappaceum L.) seed and its industrial application: A review. Trends in Food Science & Technology, 99, 367-374. [CrossRef]
- Sukmandari, N. S., Dash, G. K., Jusof, W. H. W., & Hanafi, M. (2017). A Review on Nephelium lappaceum L. Research Journal of Pharmacy and Technology, 10(8), 2819-2822.
- Mahmood, K., Kamilah, H., Alias, A. K., & Ariffin, F. (2018). Nutritional and therapeutic potentials of rambutan fruit (Nephelium lappaceum L.) and the by-products: a review. Journal of Food Measurement and Characterization, 12, 1556-1571. [CrossRef]
- Hernández-Hernández, C., Aguilar, C. N., Rodríguez-Herrera, R., Flores-Gallegos, A. C., Morlett-Chávez, J., Govea-Salas, M., & Ascacio-Valdés, J. A. (2019). Rambutan (Nephelium lappaceum L.): Nutritional and functional properties. Trends in food science & technology, 85, 201-210. [CrossRef]
- Chaiwarit, T., Kantrong, N., Sommano, S. R., Rachtanapun, P., Junmahasathien, T., Kumpugdee-Vollrath, M., & Jantrawut, P. (2021). Extraction of tropical fruit peels and development of hpmc film containing the extracts as an active antibacterial packaging material. Molecules, 26(8), 2265. [CrossRef]
- Sun, L., Zhang, H., & Zhuang, Y. (2012). Preparation of free, soluble conjugate, and insoluble-bound phenolic compounds from peels of rambutan (Nephelium lappaceum) and evaluation of antioxidant activities in vitro. Journal of Food Science, 77(2), C198-C204. [CrossRef]
- Nguyen, N. M. P., Le, T. T., Vissenaekens, H., Gonzales, G. B., Van Camp, J., Smagghe, G., & Raes, K. (2019). In vitro antioxidant activity and phenolic profiles of tropical fruit by-products. International Journal of Food Science & Technology, 54(4), 1169-1178. [CrossRef]
- Phuong, N. N. M., Le, T. T., Van Camp, J., & Raes, K. (2020). Evaluation of antimicrobial activity of rambutan (Nephelium lappaceum L.) peel extracts. International journal of food microbiology, 321, 108539. [CrossRef]
- Xu, H., Li, Y., Tang, H. W., Liu, C. M., & Wu, Q. S. (2010). Determination of rutin with UV-Vis spectrophotometric and laser-induced fluorimetric detections using a non-scanning spectrometer. Analytical letters, 43(6), 893-904. [CrossRef]
- Zhu, H., Wang, Y., Liu, Y., Xia, Y., & Tang, T. (2010). Analysis of flavonoids in Portulaca oleracea L. by UV–vis spectrophotometry with comparative study on different extraction technologies. Food Analytical Methods, 3, 90-97. [CrossRef]
- Tejamukti, E. P., Setyaningsih, W., Irnawati, Yasir, B., Alam, G., & Rohman, A. (2020). Application of FTIR spectroscopy and HPLC combined with multivariate calibration for analysis of xanthones in mangosteen extracts. Scientia Pharmaceutica, 88(3), 35. [CrossRef]
- Yasir, B., Astuti, A. D., Raihan, M., Natzir, R., Subehan, S., Rohman, A., & Alam, G. (2022). Optimization of Pagoda (Clerodendrum paniculatum L.) Extraction Based By Analytical Factorial Design Approach, Its Phytochemical Compound, and Cytotoxicity Activity. Egyptian Journal of Chemistry, 65(9), 421-430.
- Suhendi, A., Hanwar, D., Santoso, B., Wicaksono, A. N., & Widiana, L. (2018). Antioxidant activity of non polar and semipolar fractions of ethanol extract of zingiber zerumbet smith leaves by spectrophotometer and ELISA reader. Journal of Pharmaceutical Sciences and Research, 10(3), 439-441.
- Zu, C., Zhao, X., & Du, X. (2014). Enhanced water-solubility of Licorice extract microparticle prepared by antisolvent precipitation process. Advanced Powder Technology, 25(2), 787-794. [CrossRef]
- Nguyen, N. M. P., Le, T. T., Vissenaekens, H., Gonzales, G. B., Van Camp, J., Smagghe, G., & Raes, K. (2019). In vitro antioxidant activity and phenolic profiles of tropical fruit by-products. International Journal of Food Science & Technology, 54(4), 1169-1178. [CrossRef]
- Mirgorod, Y. A., Borodina, V. G., & Borsch, N. A. (2013). Investigation of interaction between silver ions and rutin in water by physical methods. Biophysics, 58, 743-747. [CrossRef]
- Lohvina, H., Sándor, M., & Wink, M. (2021). Effect of Ethanol Solvents on Total Phenolic Content and Antioxidant Properties of Seed Extracts of Fenugreek (Trigonella foenum-graecum L.) varieties and determination of phenolic Composition by HPLC-ESI-MS. Diversity, 14(1), 7. [CrossRef]
- Ngo, T. V., Scarlett, C. J., Bowyer, M. C., Ngo, P. D., & Vuong, Q. V. (2017). Impact of different extraction solvents on bioactive compounds and antioxidant capacity from the root of Salacia chinensis L. Journal of Food Quality, 2017. [CrossRef]
- Sekar, M. (2020). Rambutan fruits extract in aging skin. In Aging (pp. 303-307). Academic Press. [CrossRef]
- Crump, M. L. (1981). Variation in propagule size as a function of environmental uncertainty for tree frogs. The American Naturalist, 117(5), 724-737. [CrossRef]
- Mendez-Flores, A., Hérnandez-Almanza, A., Sáenz-Galindo, A., Morlett-Chávez, J., Aguilar, C. N., & Ascacio-Valdés, J. (2018). Ultrasound-assisted extraction of antioxidant polyphenolic compounds from Nephelium lappaceum L.(Mexican variety) husk. Asian Pacific journal of tropical medicine, 11(12), 676-681.
- Chicco, D., Warrens, M. J., & Jurman, G. (2021). The coefficient of determination R-squared is more informative than SMAPE, MAE, MAPE, MSE and RMSE in regression analysis evaluation. PeerJ Computer Science, 7, e623. [CrossRef]
- Valbuena, R., Hernando, A., Manzanera, J. A., Görgens, E. B., Almeida, D. R., Silva, C. A., & García-Abril, A. (2019). Evaluating observed versus predicted forest biomass: R-squared, index of agreement or maximal information coefficient?. European Journal of Remote Sensing, 52(1), 345-358. [CrossRef]
- Xu, S. (2017). Predicted residual error sum of squares of mixed models: an application for genomic prediction. G3: Genes, Genomes, Genetics, 7(3), 895-909. [CrossRef]
Figure 1.
Interaction and main effect plots of the influence of rambutan fruit peel extract (RFPE) types, ethanol solvent variations, and ethanol quantity on the total polyphenol content.
Figure 1.
Interaction and main effect plots of the influence of rambutan fruit peel extract (RFPE) types, ethanol solvent variations, and ethanol quantity on the total polyphenol content.
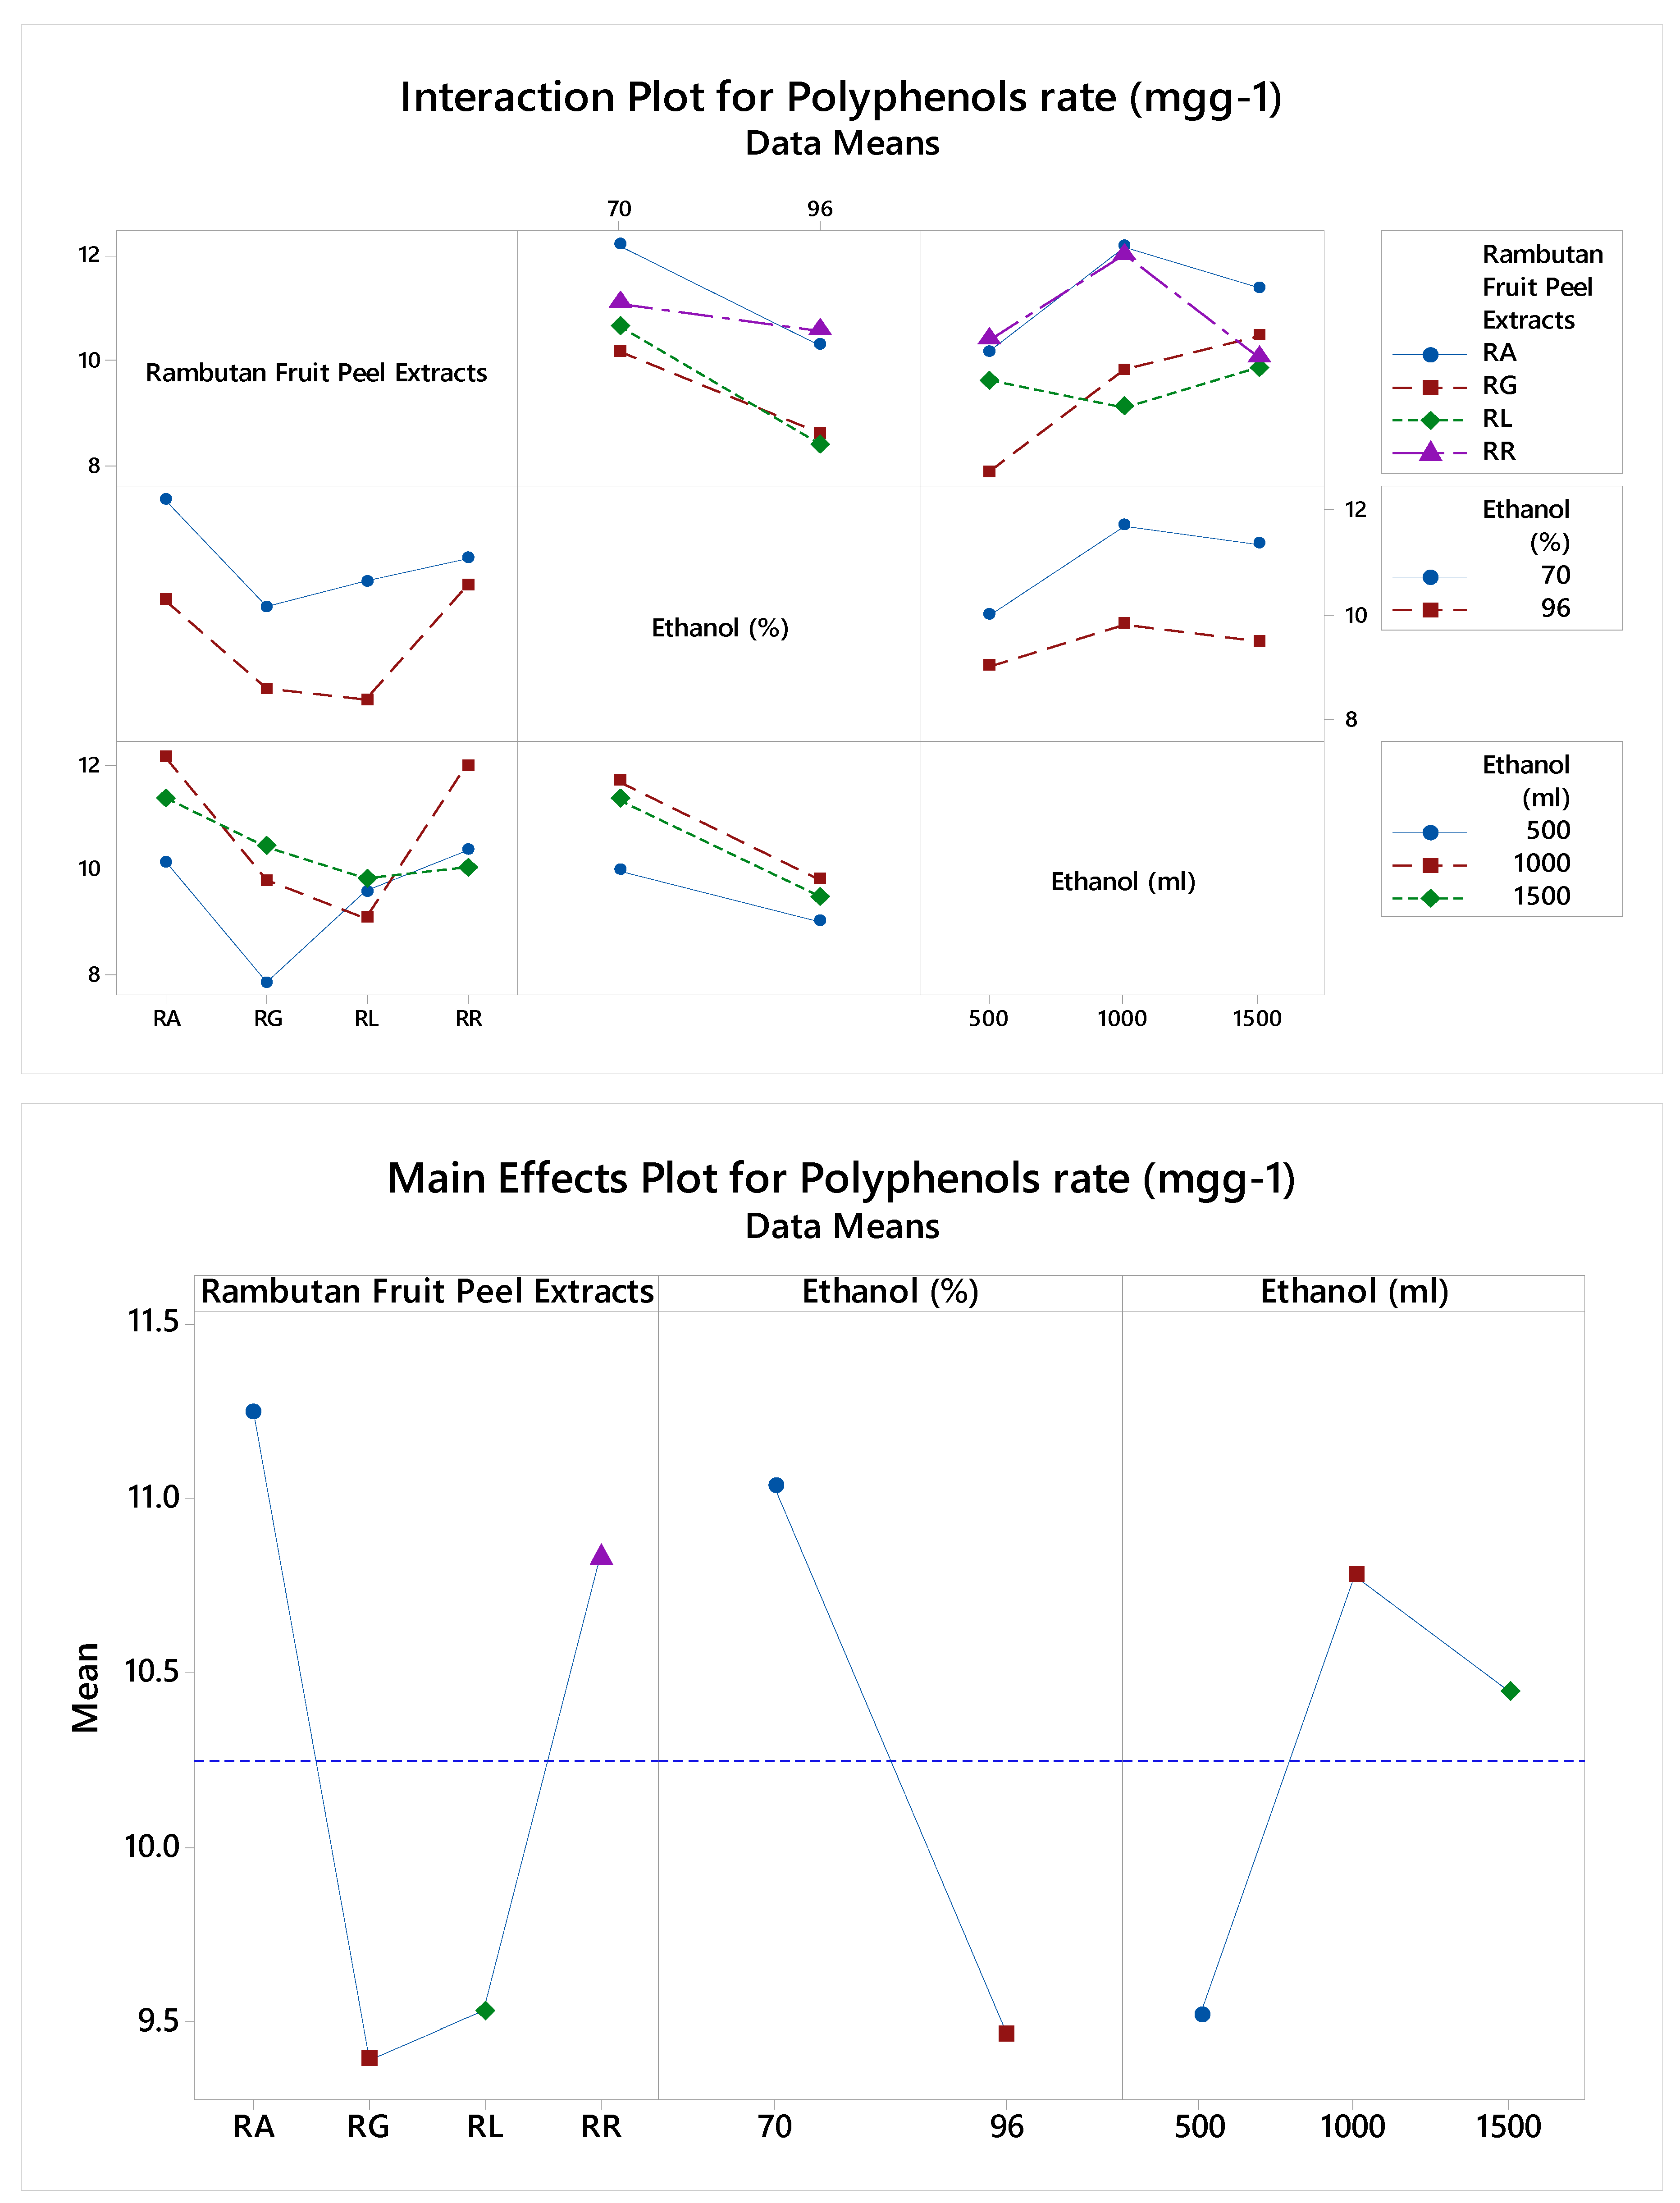
Figure 2.
Spectra of various extracts of rambutan fruit peel extract (RFPE), ethanol solvent variations, and ethanol quantity using the FTIR method at wavelengths 400 - 4000 cm-1. Black line = rutin; and 1 - 24 = Extract variations as coded in Table 1.
Figure 2.
Spectra of various extracts of rambutan fruit peel extract (RFPE), ethanol solvent variations, and ethanol quantity using the FTIR method at wavelengths 400 - 4000 cm-1. Black line = rutin; and 1 - 24 = Extract variations as coded in Table 1.

Figure 3.
Partial Least Squares (PLS) Response plot for rutin in RFPE extracts from Sulawesi Island.
Figure 3.
Partial Least Squares (PLS) Response plot for rutin in RFPE extracts from Sulawesi Island.
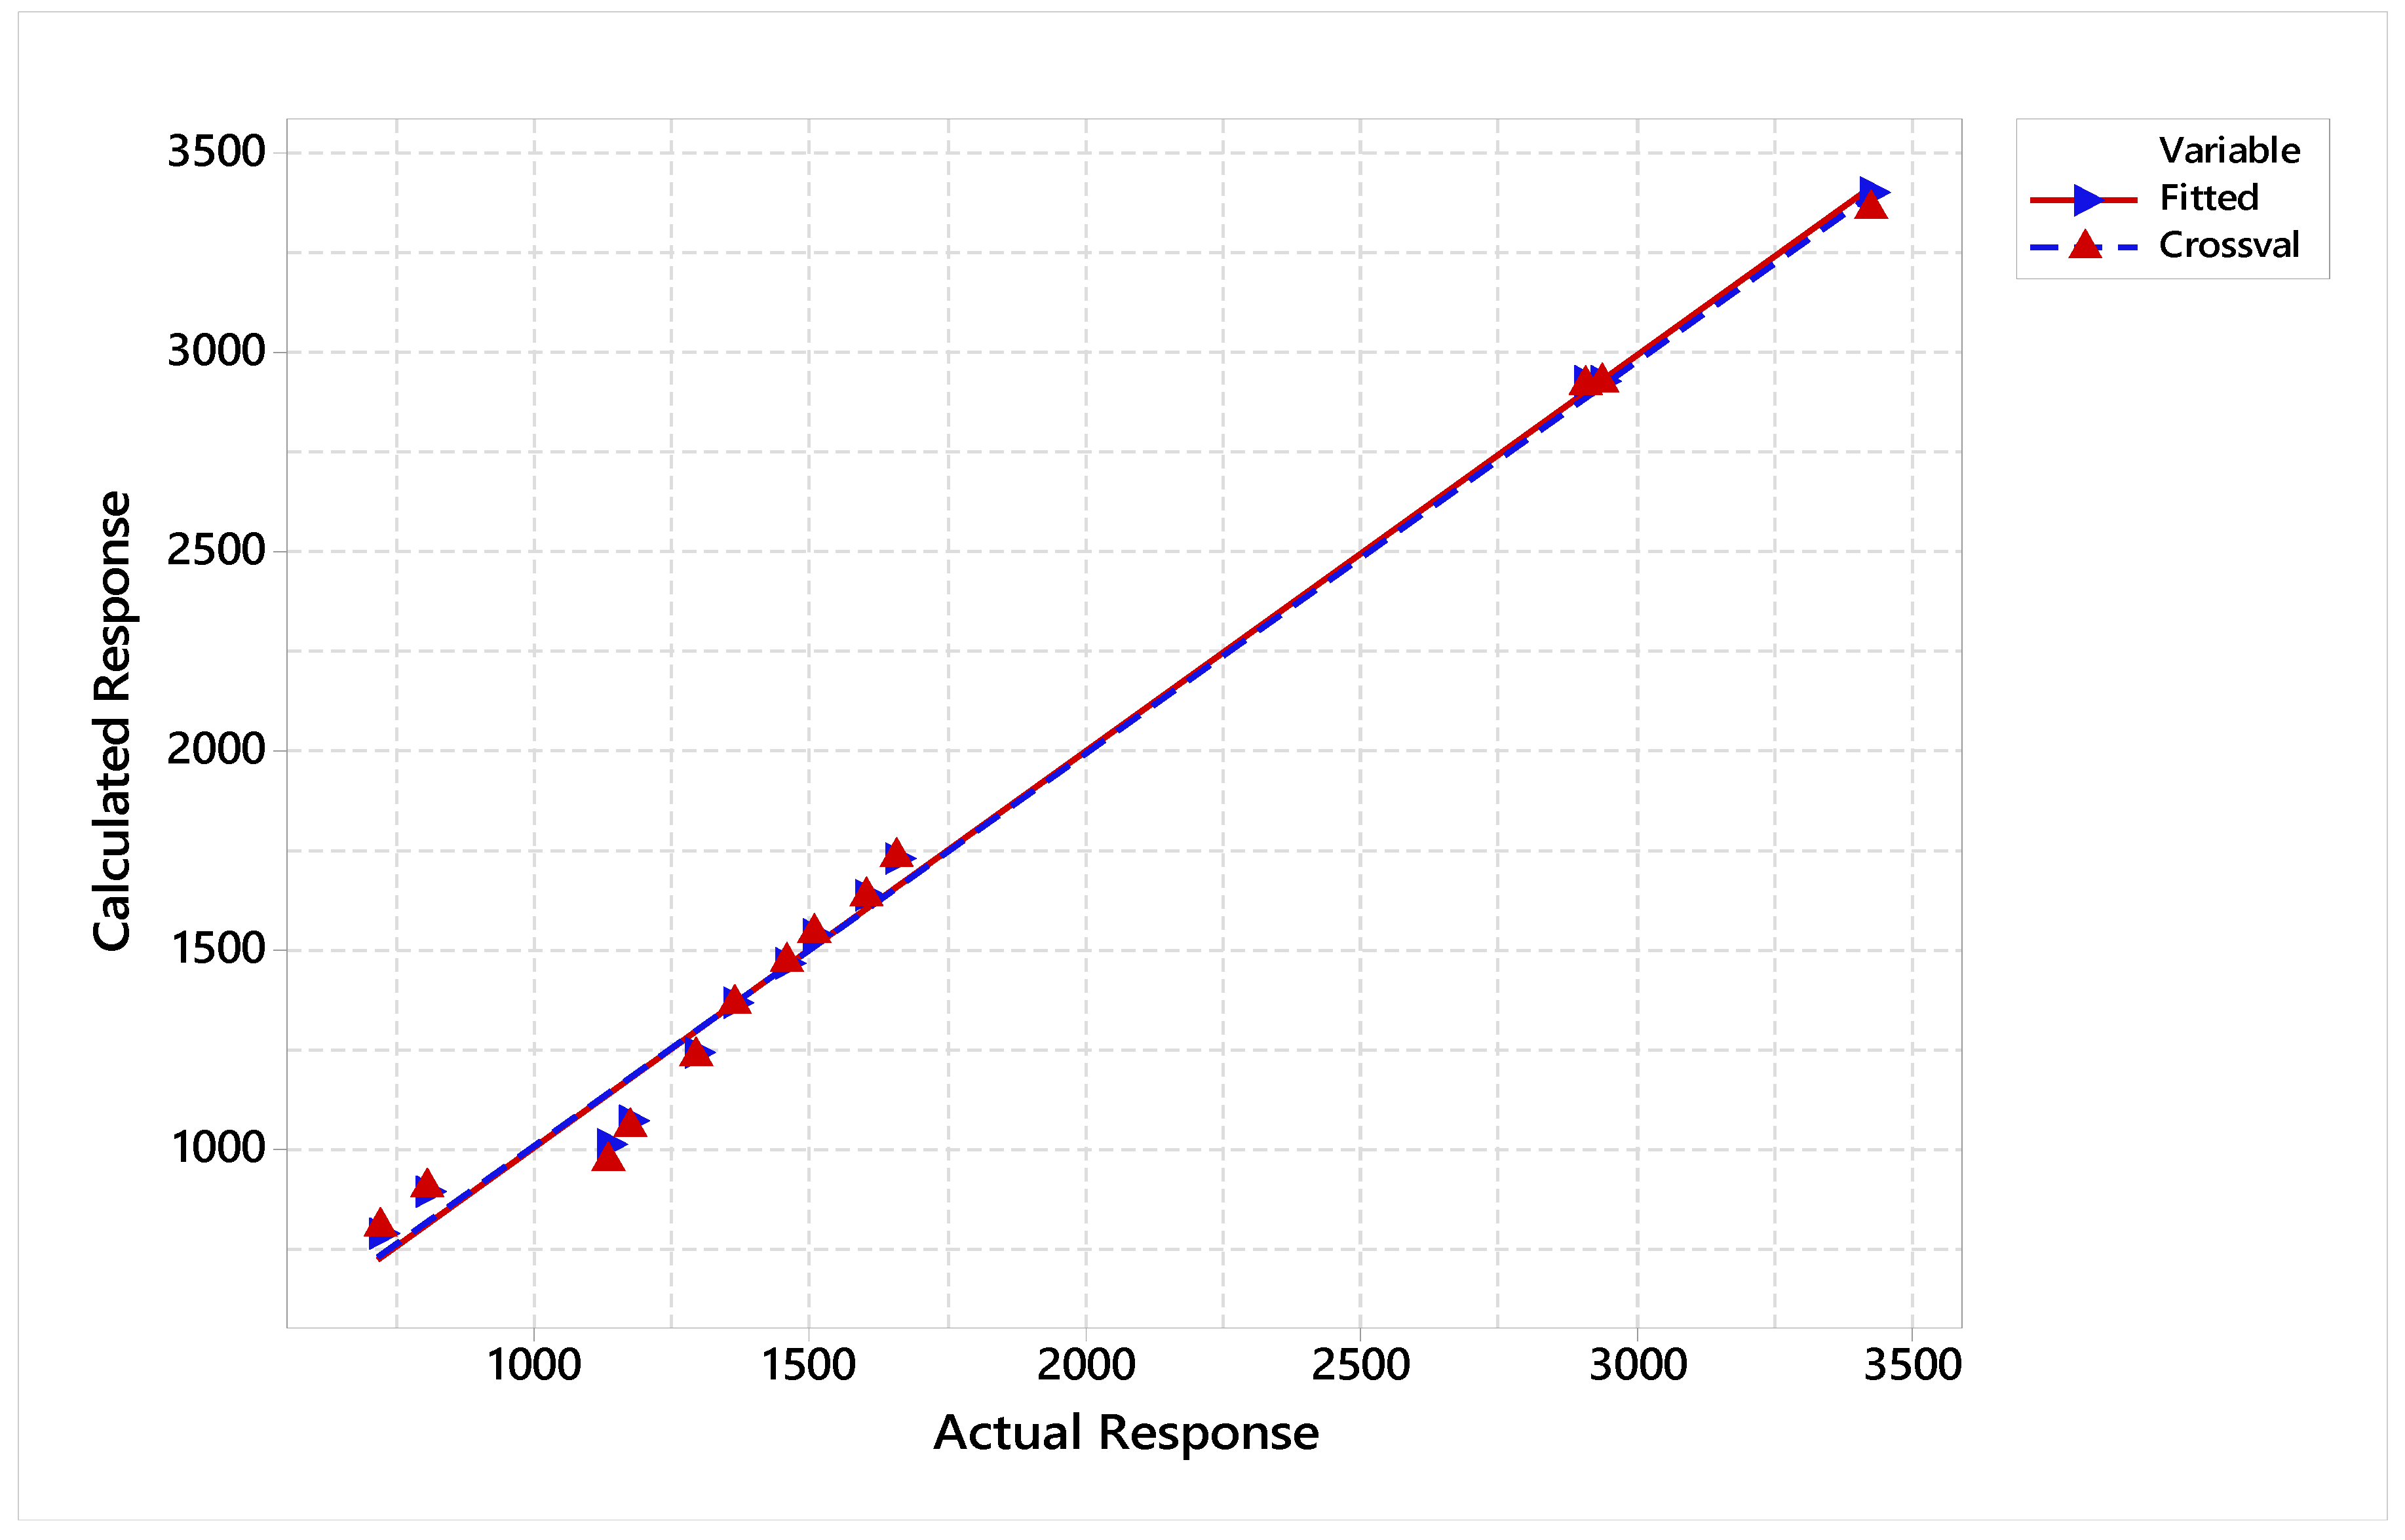
Table 1.
The influence of rambutan fruit peel extracts variation, ethanol concentration, and amount of ethanol solvent on the % yield of extracts from sulawesi island.
Table 1.
The influence of rambutan fruit peel extracts variation, ethanol concentration, and amount of ethanol solvent on the % yield of extracts from sulawesi island.
| Sample code | Rambutan fruit peel extracts | Ethanol Concentration (%) |
Ethanol Volume (ml) | Dry simplicia (g) |
Extract obtained (g) | Yield extracts (%) |
Polyphenol content |
| 1 | RA | 70 | 500 | 100 | 10.04 | 10.04 | + |
| 2 | RA | 70 | 1000 | 100 | 11.26 | 11.26 | + |
| 3 | RA | 70 | 1500 | 100 | 12.99 | 12.99 | + |
| 4 | RA | 96 | 500 | 100 | 11.18 | 11.18 | + |
| 5 | RA | 96 | 1000 | 100 | 13.28 | 13.28 | + |
| 6 | RA | 96 | 1500 | 100 | 14.02 | 14.02 | + |
| 7 | RR | 70 | 500 | 100 | 12.24 | 12.24 | + |
| 8 | RR | 70 | 1000 | 100 | 13,04 | 13.04 | + |
| 9 | RR | 70 | 1500 | 100 | 14.13 | 14.13 | + |
| 10 | RR | 96 | 500 | 100 | 13.15 | 13.15 | + |
| 11 | RR | 96 | 1000 | 100 | 14.17 | 14.17 | + |
| 12 | RR | 96 | 1500 | 100 | 14.37 | 14.37 | + |
| 13 | RG | 70 | 500 | 100 | 10.51 | 9.510 | + |
| 14 | RG | 70 | 1000 | 100 | 11.17 | 11.17 | + |
| 15 | RG | 70 | 1500 | 100 | 11.75 | 11.75 | + |
| 16 | RG | 96 | 500 | 100 | 14.68 | 14.68 | + |
| 17 | RG | 96 | 1000 | 100 | 15.39 | 15.39 | + |
| 18 | RG | 96 | 1500 | 100 | 15.68 | 15.68 | + |
| 19 | RL | 70 | 500 | 100 | 12.34 | 12.34 | + |
| 20 | RL | 70 | 1000 | 100 | 13.47 | 13.47 | + |
| 21 | RL | 70 | 1500 | 100 | 14.62 | 14.62 | + |
| 22 | RL | 96 | 500 | 100 | 13.44 | 13.44 | + |
| 23 | RL | 96 | 1000 | 100 | 14.12 | 14.12 | + |
| 24 | RL | 96 | 1500 | 100 | 15.29 | 15.29 | + |
Table 3.
Statistical parameters of multivariate calibrations using Partial Least Squares (PLS) for quantitative analysis of rutin in various extracts, based on FTIR spectra, with cross-validation leave-one-out.
Table 3.
Statistical parameters of multivariate calibrations using Partial Least Squares (PLS) for quantitative analysis of rutin in various extracts, based on FTIR spectra, with cross-validation leave-one-out.
| Rambutan fruit peel extracts | Ethanol (ml) | Ethanol (%) |
Extracts wavenumber (cm-1) |
Rutin wavenumber (cm-1) |
Model selection and validation for Rutin | |||
| X variance | R-Sq | PRESS | R-Sq (pred) | |||||
| RA | 500 | 70 | 1049.28-759.95 | 1170.79-717.52 | 0.971787 | 0.901956 | 62178 | 0.600937 |
| RR | 1000 | 1213.23-759.95 | 1294.24-717.52 | 0.989160 | 0.885387 | 89450 | 0.638176 | |
| RG | 1500 | 1340.53-759.95 | 1361.74-717.52 | 0.994415 | 0.883783 | 90686 | 0.735130 | |
| RL | 1448.54-759.95 | 1456.26-717.52 | 0.996537 | 0.903870 | 84844 | 0.817003 | ||
| 1519.91-759.95 | 1504.48-717.52 | 0.997518 | 0.917515 | 86928 | 0.851104 | |||
| 1616.35-759.95 | 1600.92-717.52 | 0.998159 | 0.933134 | 86125 | 0.883797 | |||
| 1714.72-759.95 | 1654.92-717.52 | 0.998586 | 0.941857 | 90331 | 0.900298 | |||
| 2856.58-759.95 | 2906.73-717.52 | 0.999515 | 0.987438 | 110009 | 0.967084 | |||
| 2926.01-759.95 | 2933.73-717.52 | 0.999666 | 0.991040 | 107098 | 0.980337 | |||
| 3520.09-759.95 | 3425.58-717.52 | 0.999788 | 0.994053 | 99569 | 0.988571 | |||
| RA | 500 | 96 | 1051.20-759.95 | 1170.79-717.52 | 0.997504 | 0.933426 | 33638 | 0.784108 |
| RR | 1000 | 1219.01-759.95 | 1294.24-717.52 | 0.998986 | 0.907671 | 74229 | 0.699744 | |
| RG | 1500 | 1352.10-759.95 | 1361.74-717.52 | 0.999433 | 0.897296 | 82636 | 0.758640 | |
| RL | 1448.54-759.95 | 1456.26-717.52 | 0.999637 | 0.914121 | 74999 | 0.838237 | ||
| 1521.84-759.95 | 1504.48-717.52 | 0.999732 | 0.925542 | 77459 | 0.867324 | |||
| 1618.28-759.95 | 1600.92-717.52 | 0.999798 | 0.939353 | 77078 | 0.896003 | |||
| 1712.79-759.95 | 1654.92-717.52 | 0.999838 | 0.946882 | 81671 | 0.909857 | |||
| 2856.58-759.95 | 2906.73-717.52 | 1.000000 | 0.995588 | 66051 | 0.980237 | |||
| 2926.01-759.95 | 2933.73-717.52 | 0.999990 | 0.993319 | 58802 | 0.989204 | |||
| 3437.15-759.95 | 3425.58-717.52 | 1.000000 | 0.998340 | 38890 | 0.995536 | |||
Disclaimer/Publisher’s Note: The statements, opinions and data contained in all publications are solely those of the individual author(s) and contributor(s) and not of MDPI and/or the editor(s). MDPI and/or the editor(s) disclaim responsibility for any injury to people or property resulting from any ideas, methods, instructions or products referred to in the content. |
© 2025 by the authors. Licensee MDPI, Basel, Switzerland. This article is an open access article distributed under the terms and conditions of the Creative Commons Attribution (CC BY) license (http://creativecommons.org/licenses/by/4.0/).
Copyright: This open access article is published under a Creative Commons CC BY 4.0 license, which permit the free download, distribution, and reuse, provided that the author and preprint are cited in any reuse.


