Submitted:
11 April 2025
Posted:
14 April 2025
You are already at the latest version
Abstract
Background/Objectives: Bacteria rarely live in well-defined environment. Even in the biotechnological reactors cells are surrounded by hundreds of byproducts and their derivatives, let alone complex microbial communities in the gut or soil. Yet all modern genome-scale metabolic (GEM) models were developed with minimal media in mind.Methods: In this study, we propose the use of a novel FBA-PRCC (Flux Balance Analysis – Partial Rank Correlation Coefficient) approach for the analysis of GEM models under nutrient-rich conditions. This method combines flux space sampling with global sensitivity analysis (GSA), enabling a more comprehensive understanding of the metabolic behavior of organisms beyond traditional constraint-based modeling techniques. Results: Using FBA-PRCC, we identify two novel modes of species–metabolite interaction: attraction and avoidance. These concepts offer a framework to quantify and utilize interspecies metabolic dependencies, potentially transforming how we understand community function in microbiomes. Our results show that sensitivity coefficients provide complementary insights to standard knockout analysis, Flux Variability Analysis (FVA), and CoPE-FBA. However, analysis of auxotrophic mutants reveals that sensitivity coefficients are highly non-robust in the presence of alternative pathways: even weakly active bypasses can suppress signals from key metabolic routes.Conclusions: While FBA models are usually developed for well-characterized laboratory strains in controlled conditions, they fail when applied to bacteria in the complex environments like the human gut or skin. Better description of the metabolite transport and new modelling approaches are required to overcome this problem.

Keywords:
flux-balance analysis
; global sensitivity analysis
; genome-scale metabolic models
; rich environment
Introduction
Flux-based analysis (FBA) of whole-genome metabolic reconstructions (GEM) stands as a computational method at the forefront of systems biology and metabolic engineering [1,2]. This sophisticated approach plays a pivotal role in modeling and analyzing the intricate networks of biochemical reactions that constitute an organism's metabolism. The essence of FBA lies in its ability to provide a quantitative framework, offering predictions and insights into the dynamic flow of metabolites through cellular metabolic pathways under specific environmental or physiological conditions [3].
Whole-genome metabolic reconstructions (GEMs) serve as foundational datasets representing the entirety of biochemical reactions that an organism's genome encodes. These reconstructions encompass a detailed inventory of metabolic pathways, including reactions, metabolites, and associated enzymes. GEMs are constructed based on the genomic information of an organism, and they serve as a comprehensive roadmap of its metabolic potential. Recent advances in the GEM reconstruction reviewed in [4]
Flux-based analysis, when applied to GEMs, takes advantage of the stoichiometry and connectivity information embedded within these reconstructions. It operates on the principle of mass balance, considering the conservation of mass, charges, elements and metabolic moieties throughout the network. FBA enables the determination of flux distributions, representing the rates at which metabolites converts by different reactions within the cellular metabolism. The process begins by defining an objective function, typically the optimization of a specific cellular process, such as biomass production, ATP generation, or substrate utilization. FBA then employs linear programming techniques to find the optimal distribution of flux values through the metabolic network that maximizes or minimizes the chosen objective function, subject to the constraints imposed by the system [1].
In practical terms, FBA allows researchers to simulate and predict how an organism's metabolism responds to various conditions. For example, FBA can be used to analyze how changes in nutrient availability, genetic modifications, or environmental factors influence the distribution of metabolic fluxes. This predictive capability is particularly valuable in metabolic engineering, where researchers aim to design or optimize microbial strains for the production of specific compounds, such as biofuels, pharmaceuticals, or industrial chemicals [5,6,7,8,9].
Another area of the active use of FBA models is in the medical application. Development of the human metabolic reconstruction [10,11] and reorganization it with tissue specific submodels into integrated whole-body model [12] open the avenue for a better understanding of the pathological processes such as cancer development [13,14]. Apart from human GEM, number of large collection of models were created by manual curation [2], semi-automated reconstruction [15,16], or fully-automated reconstruction [17] techniques.
What is common between all such reconstructions, as was noted by Van Pelt-KleinJan with coauthors [18], is that all of them are based on experimental flux data from limited media growth. This is reasonable from experimental point of view, as single carbon source experiment allows to compare experimental growth rate with essentiality data from the model. But that type of model identification impose some limitations to the interpretation of the model results in nutrient-rich set up. The rich environment is very common as in biotechnological application, for example in the food industry [19,20] and when bacteria participate in the community and interact with its members by production and consumption of nutrients [21]. The interaction between pathways utilizing different substrates make solution space more complex and increase number of non-unique solutions to the optimization FBA problem. In [18] authors propose the technique using enumeration of Elementary Conversion Modes to overcome that limitation. In this paper we propose the use of alternative approach [22] for analysis of the GEM FBA solution space in the nutrient-rich environment, which is based on sampling flux space and global sensitivity analysis (GSA),.
The randomized sampling of the FBA solution space is widely used for analysis of model behaviour [23,24]. The great advantage of sampling is that it does not require any objective function to be optimized, so it allows to identify hidden relationships between reactions, genes and metabolites imposed by the physical, chemical and kinetic constraints applied to the metabolic network. That approach allow identification of the high-rate backbone of the model [25], analysis of flux correlations and identification of flux modules [26]. Number of algorithms were developed for the sampling solution space [27]. However, there are approaches of sampling, which are different from straightforward Monte-Carlo. Loghmani et al. [28] combine random flux sampling with Flux Variability Analysis (FVA) to separate reactions into “robust” and “sensitive” groups. In our FBA-PRCC approach [22] we are sampling not the flux values space, but the parameter space of the FBA model which defines the reaction boundaries to identify reactions and enzymes that significantly influence the cost function via GSA techniques.
The Global Sensitivity Analysis (GSA) is an approach used in dynamic modelling to evaluate the impact of parameters on the model output [29,30,31,32]. Application of GSA techniques to the FBA GEM models recently gain interest, for example Damiani and co-authors implement Sobol’s variance based indices to understand how variation of exchange reaction constraint influences the growth rate [33,34].
In FBA-PRCC we apply Partial Rank Correlation GSA technique [29] to the FBA model by vary flux bounds and estimate its influence on target objective function. We called reaction sensitive if at least one of its bound values show statistically significant effect on the objective function. Like Damiani we optimized biomass production and restrict ourselves by estimate sensitivity coefficients of exchange reactions constraints to identify which exometabolites influence the growth of bacteria.
There are two key differences between Sobol’s variance-based indices and Partial Rank Correlation coefficients: (i) Sobol’s method is extremely computationally expensive, and (ii) it provides only value of the index, while PRCC gives both value and sign of the influence. Later, we will discuss how sensitivity coefficient sign could be interpret in terms of specie-metabolite interaction. Another difference is that PRCC suppose the monotonicity in relationships between the variable value and the target function. That type of dependence is difficult to prove, but we must clarify that the lack of monotonicity would blur dependence and make PRCC insignificant, but if PRCC is already significantly differ from zero the monotonicity could be considered proven. In other word we could miss some sensitive variable due to non-monotonic dependency, but if the target function is already sensitive to the variable it will stay sensitive.
In this paper we will use growth rate as the FBA target function and restrict ourselves to the analysis of media components, i.e. we will estimate sensitivity indices for the exchange reactions boundaries to understand which components of the rich media significantly influence the growth of the bacteria despite the presence or absence of other components.
Materials and Methods
The metabolic network with metabolites and reactions is described by a stoichiometry matrix . The -th entry of , , is the stoichiometric coefficient of the -th metabolite in the -th reaction. Any reaction flux vector that satisfies equation contains reaction fluxes describing some steady state of the system. In Flux Balance Analysis [1] the optimization problem is solved to identify unique solution vector such that for , where is the objective coefficient vector, and reaction bounds are and .
There is a special type of reaction in the constraint-based modelling called 'boundary reactions', which usually describe the exchange of metabolites between the extracellular compartment next to the cell and the external bulk environment. Usually, such reactions represent availability of the components of the media the bacteria growth in. We are interested in the estimation of the sensitivity of the objective function to the values of boundary reaction bounds to analyze role of various media components in bacteria growth and survival.
Our approach consists of three steps:
- Define parameter space: for irreversible boundary reactions only one parameter ( or ) is created, for reversible boundary reactions two parameters created for each reaction -- and .
- Generate a set of quasi-random low-discrepancy points in the parameter space. Update parameters (reaction bounds) and find the optimal objective value for each point in the parameter space.
- Remove from parameters bounds of reactions, which have unique flux value in all solutions.
- Calculate Partial Rank Correlation Coefficient (PRCC) for each parameter and objective values. The statistical significance of the PRCC value is estimated by as described by Marino et al [29]. The sufficiency of the sample size for reliable PRCC estimation is controlled by the top-down coefficient of concordance (TDCC): when TDCC between PRCC vectors calculated at different sample sizes exceed the threshold of 0.9, sample size is considered sufficient for analysis.
The GEM model of E. coli str. K-12 substr. MG1655 was taken from the AGORA2 collection [16] in SBML format. Mutant model ΔhisD was created by removing reactions HISTLOX and HISTDOX which controlled by hisD gene, encoding Histidinol dehydrogenase. Mutant model ΔhisD with no AlaHis transport was created by removing ALAHIStex to prevent assimilation of the AlaHis dipeptide. Mutant model ΔtrpB was created by removing reactions TRPS1, TRPS2, and TRPS3, which depends upon trpB gene encoding tryptophan synthase α-chain.
The random sampling of the exchange model constraint was performed with the Sobol quasi-random low-discrepancy sequence [29,35] that was generated with the python Quasi-Monte Carlo submodule of the SciPy v.1.7.3 [36]. Model simulation was performed with the Cobrapy v.0.25.0 [37]. All calculations are performed with Python version 3.10.2.
PRCC calculations were performed with R package ‘sensitivity’ version 1.28.0 [38]. TDCC values are calculated by ‘ODEsensitivity’ R package version 1.1.2 [39]. All calculations are performed with R version 4.2.1 [40].
All simulations were performed on the OIST HPC cluster with 8CPU and 64GB per job. Sobol points generation, application to the reaction boundaries and optimization of objectives were performed in chunks of 8192 per job. Calculations of the PRCC sensitivity coefficients were performed on 524288 Sobol points, obtained from 64 jobs per model, in chunks of 10 features per job. Convergence of the calculation was controlled by TDCC between consecutive datasets different in 8192 Sobol points. The TDCC value between 516096 and 524288 was 0.979 (Supplementary Table1). The average execution time is 30 minutes per job for the Sobol point calculations. Average models, such as `Escherichia_coli_BW25113`, with number of exchange boundaries around 500 needs about hour to calculate ten PRCC values over 500K Sobol points on the node with 16 CPUs and 256Gb of memory. The large model, such as `Escherichia_coli_str_K_12_substr_MG1655`, which has more than 1100 exchange boundaries, need 14 hours to calculate ten PRCC values over 500K Sobol points on the node with 16 CPUs and 256Gb of memory. Memory footprint growth rapidly with the number of Sobol points: 262K points fits into 32Gb of memory, while 390K requires 64Gb and 450K requires 128Gb.
Results
For the analysis of the role of nutrient availability on the bacterial growth FBA uses so-called extracellular metabolites and exchange reactions. Flux through exchange reaction represents consumption of the compound if its value is negative and production if it is positive. So, for all metabolites that could be consumed by the cell exchange reactions have negative lower bound and for all metabolites that could be exported from the cell corresponding exchange reaction have positive upper boundary. To visualize this, we could draw arrow from cell to metabolite for production flux and from metabolite to cell for consumption flux (Figure 1A).
The exchange reaction in the standard FBA paradigm represents passive diffusion so interpretation of the positive PRCC values is straightforward. Positive sensitivity of the upper bound indicate that the growth positively correlates with the rate of metabolite production, so we could call such metabolite product. In a similar manner positive sensitivity coefficient of lower bound means that growth significantly depends upon consumption of the corresponding metabolite (Figure 1A).
Interpretation of the negative coefficient is more challenging. Negative PRCC value for the upper/lower bound indicate that increase in rate of the metabolite diffusion from/to the cell corresponds to decrease of the growth. In that situation cell would try to decrease the corresponding diffusion rate, and as the diffusion rate is defined by the concentration gradient the obvious way to decrease the rate is to decrease the gradient. For the upper bound it would mean to find the niche with high concentration of the corresponding metabolite, so cell could still produce it but won’t lose it via diffusion. For the lower bound it would mean to find the niche with low concentration of the correspondent metabolite, so there is nothing to consume. According to this line of reason we will call metabolites with negative upper bound PRCC value attractant and metabolites with negative lower bound PRCC – repellent (Figure 1B).
We sampled absolute value of each non-zero constraints of exchange reactions and analyzed nutrient sensitivity of the Escherichia coli K12 sub-strain MG1655 GEM from AGORA2 collection [16] together with two autotrophic mutants ΔhisD and ΔtrpB, which are deficient in biosynthesis of histidine and tryptophan correspondently [21]. Analysis of the autotrophic mutants shows that in the rich media condition ΔhisD mutant is not sensitive to the presence of L-histidine in the media. It appears that the model contains another source of histidine available: it can use dipeptide AlaHis as the external source of L-histidine. To analyze the true autotrophic histidine-dependent model it is possible to remove AlaHis exchange reaction from the model, but it would change the dimensionality of the model parameter space and makes it impossible to calculate solutions of this model at the same set of Sobol points as the other three models. To keep parameter space undisturbed, we block the AlaHis assimilation by removing ALAHIStex reaction from the ΔhisD mutant model.
3.Analysis of the wild-type model behavior
For each boundary we have estimate its PRCC value significance and kept only those with p-value below 0.The size of the sampling was controlled by the top-down coefficient of concordance (TDCC) and estimation of a significance of the difference between PRCC coefficients obtained in consecutive jobs of 8192 Sobol points as described in [29]. The TDCC values are plotted on the Supplementary Figures S1-S5 and the significance of the difference for the selected parameters are plotted on the Supplementary Figures S6-S7.
Out of 1120 constraints in the model about 53% (594) correspond to reactions, which are blocked (have zero flux value) in the solution of all simulated Sobol points (Supplementary Table S23). This means that processing of the corresponded metabolites would require that both boundaries for the exchange reactions should have the same sign. Negative if we enforce consumption or positive to enforce production. However, most of these reactions describe drug metabolism and corresponding metabolites could not be considered as media components anyway. Parameters of the blocked reactions were removed from consideration.
Among remaining parameters only 6% (68) have PRCC value significantly different from zero with p-value below 0.Out of these 68 constraints 31 exchange reactions have lower bound sensitive (Table 1, Supplementary Table S4) and 30 have upper bound sensitive (Table 1, Supplementary Table S5). There is one metabolite, which have both constraints significantly sensitive: Glycerol 3-phosphate, which means that both production and consumption significantly influences growth rate.
From Supplementary Table S4 it could be seen that set of substrates is quite different from what usually returned by knockout analysis. Highest PRCC value (0.73) is shown by the consumption of Nicotinamide ribotide (NMN), which is NAD precursor. Next thre positions are occupied by 2-Oxobutanoate (0.24), L-threonine (0.19), and Citrate (0.05) which are not often found in the list of essential metabolites. Some aminoacids such as lysin, arginine, proline, and glutamate are sensitive substrates with relatively low PRCC value. All ions, which comes directly to the biomass formation reaction within the model, are also among significantly sensitive metabolites, but their PRCC values are quite small. Among unexpected substrates are several drugs. Some of them, such as Norverapamil Glucuronide, could be metabolized by bacterial glucuranidase and used up by the cell or excreted and reabsorbed by the host. Appearance of other drugs among highly sensitive substrates, such as Neoprontosil and 1,2,4-Triaminobenzene, are complete mistery, because they are involved in the complex network of interconversions which require NADH/NADPH.
The Supplementary Table S5, which shows the most significantly sensitive products, contains more interesting results. Highest PRCC value (0.70) is shown by the Propionate, which followed by Acetate (0.55) and Acetoacetate (0.52). Theese metabolite are known to participate in signalling interaction between gut epithelium and microbiota, their high sensitivity coefficients could also show that the metabolism overflow [41,42] is not the exception strategy, but quite common regime. The CO2, which is most expected product, is located on the sixth place with PRCC value 0.Sulfanilamide (0.03) and Prontosil (0.01) are products of metabolisation of Neoprontosil and 1,2,4-Triaminobenzene, while Norverapamil (0.005) is the product of Norverapamil Glucuronide hydrolysis. Some metabolites, such as Succinate and Glycerol 3-phosphate, are listed as both product and substrate, which means that the parameter space contains areas, where growth coupled with production or consumption of such compounds. Our analysis shows that those areas are non-ovelapping.
Metabolites that belong to the two new types Attranctants and Repellents ( Negative row of the Table 1) are shown in the Supplementary Tables S6 and S7 correspondently. As expected PRCC values in those tables are much smaller in the absolute value compare to the Substrates and Products. It is also expected that all 3 Repellents are drug molecules. Interesting that L-serine (-0.003) and Glycerol (-0.0025) are two Attractants. It would be more naturally to see them among Substrates.
3.Analysis of the Auxotrophic Mutant Model Behavior
To check how sensitivity coefficients reflect changes in the structure of the metabolic network we have created two auxotrophic mutant models of E. coli: ΔtrpB and ΔhisD, in which we block the biosynthesis of Tryptophan and Histidine correspondently.
The Supplementary Tables S19, S20, S21, and S22 shows Substrates, Products, Attractants and Repellents for the ΔtrpB model. As expected, L-tryptophan become significantly sensitive substrate with PRCC value 0.The rest of the substrate table remains the same with slightly smaller PRCC values and minor changes in order at the end of the table. Similar rearrangements could be seen in the Products table. The D-glucitol appears in the Repellents table with PRCC value -0.003 and three new metabolites become significantly sensitive Attractants: Thiamin (-0.008), Riboflavin (-0.004), and calcium (-0.0025). That makes calcium both substrate and attractant in this model.
The Supplementary Tables S9, S10, S11, and S12 shows Substrates, Products, Attractants and Repellents for the ΔhisD model, and comparison with the wild-type results from Supplementary Tables S4, S5, S6, and S7 shows that they are almost the same apart from tiny variation in PRCC values. Careful analysis of the model shows that there is another source of the histidine in the media definition: cell can import AlaHis dipeptide. To check that this influx makes model insensitive to the presence of L-histidine in the media we modify the ΔhisD model by removing ALAHIStex to prevent assimilation of the AlaHis dipeptide. The naïve approach of removing exchange reaction EX_alahis(e) would change the structure of the parameter space and render modified model results incomparable with other models in this analysis, so blocking ALAHIStex keeps the EX_alahis(e) active and at the same time makes pool of periplasmic AlaHis empty.
The Supplementary Tables S14, S15, S16, and S17 shows Substrates, Products, Attractants and Repellents for the ΔhisD model with blocked AlaHis assimilation, and as expected L-histidine become the fourth sensitive substrate with PRCC value 0.In a way similar to the ΔtrpB model Products table did not change, but Attractants remains the same as in the wild-type model and from Repellents disappear one drug.
Our analysis is implemented in such a way, that all four models are simulated in the same set of 524288 Sobol points representing different media compositions. That makes it possible to compare not only cost function values between model, but optimal flux through any selected reaction. To check is the presence of AlaHis in the media and its influx really render the ΔhisD model insensitive to the presence of L-histidine in the media, we check the “activity” of the EX_his_L(e) and EX_alahis(e) reactions boundaries. Concept of the boundary activity was introduced in [18] but could be traced to the Palsson book [43], where active constraints were called dominant and inactive redundant. Activity of the boundary is calculated by changing its value and checking changes in the cost function. If extension of the boundary cause increase in the cost function the boundary considered active. Figure 2 shows how the values of low bounds of the L-histidine and AlaHis exchange reactions influence the growth rate. It could be seen that the presence of L-histidine controls the growth rate only of wild-type model in the narrow interval of its values, while AlaHis constraint is barely ever active. What is surprising is that the picture does not change in the ΔhisD model. This keeps the question why presence in the model of insignificant bypath render model insensitive to the presence of L-histidine in the media open. Despite that the second mutation gave expected results exact explanation why PRCC coefficient of the low bound of the EX_his_L(e) reaction in the ΔhisD model is missing.
Discussion
Mechanistic understanding of the role of different components of the rich media for the growth and physiology of microorganisms is of paramount importance for solving both scientific and technological problems. Overflow metabolism, which cause overproduction of byproducts in the nutrient-rich environment, could decrease yield in biotechnological reactor and make specie the keystone in the complex microbial community. In this paper we have shown how global sensitivity analysis could be used to address this problem. We have used Sobol low-discrepancy sequence [30,35,44] to create wide range of media compositions by sampling 524288 quasi-random points from the 1120 dimensional space of the exchange reaction boundaries from the E. coli str. K-12 substr. MG1655 model, which was taken from the AGORA2 collection [16]. Using the same set of Sobol media, we find the optimal growth rate for four models: wild-type model, ΔhisD model, which was created by removing reactions HISTLOX and HISTDOX which controlled by hisD gene, encoding Histidinol dehydrogenase, ΔhisD model with no AlaHis transport, which was created by blocking ALAHIStex reaction in the ΔhisD model to prevent assimilation of the AlaHis dipeptide, and ΔtrpB model, which was created by removing reactions TRPS1, TRPS2, and TRPS3, which depends upon trpB gene encoding tryptophan synthase α-chain. It should be noted that unlike the traditional flux space sampling [45,46] we sample reaction boundary values thus changing the shape of the solution polytope and analyzing the influence on the growth rate. We have calculated Partial Rank Correlation Coefficient (PRCC) [29] between exchange reaction bounds and growth rate as the sensitivity measure of influx or outflux of particular metabolite.
We have shown that the set metabolites, which influx/outflux to the model is important for the growth rate is quite different from what usually considered as essential metabolites. For example, four most important outflux metabolites demonstrates that the owerflow of the metabolism is the common situation in rich media, containing a lot of different metabolites ready to be consumed.
Being correlation coefficient PRCC provides not only magnitude of the sensitivity, but the direction as well. Interpretation of the positive PRCC values is straightforward: those metabolites are substrates and products of the bacterial metabolic network. To interpret the negative PRCC values we have introduced two new modes of specie-metabolite interaction could be added to the standard consumption and production. Avoidance interaction describes the interaction in which cell looking for the environment with low concentration of the metabolite, for example, some microaerophile strains demonstrate avoidance link with the oxygen (data not shown). Attraction interaction on the other side makes cell look for the environment with high concentration of the metabolite, for example to prevent loss of the important intermediate via passive transport. We provide names for the negative sensitivity interactions (attraction and avoidance) based upon passive diffusion interpretation, which of course could be wrong due to regulation that is not included in the model. For example, attraction interaction (negative sensitivity of the upper bound) could be due to exchange reaction in the model, which normally blocked either transcriptionally, like lactose transporter, or by other means. But we will keep those names, as they easy to remember and interpret in the case of uncontrolled exchange.
Our results show that sensitivity coefficients provide complementary insights to standard knockout analysis, Flux Variability Analysis (FVA), and CoPE-FBA. Apart from ions, which directly incorporated into the biomass production reaction none of essential molecules appears in the significantly sensitive metabolite lists identified by the FBA-PRCC. However, analysis of auxotrophic mutants reveals that sensitivity coefficients are highly non-robust in the presence of alternative pathways: even weakly active bypasses can suppress signals from key metabolic routes.
Conclusions
This section is not mandatory but can be added to the manuscript if the discussion is unusually long or complex.
Supplementary Materials
The following supporting information can be downloaded at the website of this paper posted on Preprints.org, Supplementary document.
Author Contributions
Conceptualization, A.S.; methodology, A.S.; software, A.S.; resources, A.S. and I.G.; data curation, A.S.; writing—original draft preparation, A.S.; writing—review and editing, A.S. and I.G.; visualization, A.S.; supervision, I.G.; funding acquisition, I.G. All authors have read and agreed to the published version of the manuscript.
Data Availability Statement
The original data presented in the study are openly available in Zenodo at DOI:10.5281/zenodo.14978096, simulation pipeline source code is available from GitHub https://github.com/lptolik/FBA-PRCC, figures and table preparation code is included into Supplementary document.
Acknowledgments
We are grateful for the help and support provided by the Scientific Computing and Data Analysis section of Research Support Division at OIST. Original bacterial icon was designed by macrovector_official / Freepik.
Conflicts of Interest
The authors declare no conflicts of interest.
Abbreviations
The following abbreviations are used in this manuscript:
| GSA | Global sensitivity analysis |
| FBA | Flux-balance analysis |
| FVA | Flux-variability analysis |
| GEM | whole-genome metabolic reconstructions |
| CoPE-FBA | Comprehensive Polyhedra Enumeration Flux Balance Analysis |
| PRCC | Partial Rank Correlation Coefficient |
References
- Orth, J.D.; Thiele, I.; Palsson, B.Ø. What Is Flux Balance Analysis? Nat Biotechnol 2010, 28, 245–248. [Google Scholar] [CrossRef] [PubMed]
- Norsigian, C.J.; Pusarla, N.; McConn, J.L.; Yurkovich, J.T.; Dräger, A.; Palsson, B.O.; King, Z. BiGG Models 2020: Multi-Strain Genome-Scale Models and Expansion across the Phylogenetic Tree. Nucleic Acids Research 2019, gkz1054. [Google Scholar] [CrossRef] [PubMed]
- Thiele, I.; Palsson, B.Ø. A Protocol for Generating a High-Quality Genome-Scale Metabolic Reconstruction. Nat Protoc 2010, 5, 93–121. [Google Scholar] [CrossRef] [PubMed]
- Fang, X.; Lloyd, C.J.; Palsson, B.O. Reconstructing Organisms in Silico: Genome-Scale Models and Their Emerging Applications. Nat Rev Microbiol 2020, 18, 731–743. [Google Scholar] [CrossRef]
- Tian, M.; Kumar, P.; Gupta, S.T.P.; Reed, J.L. Metabolic Modeling for Design of Cell Factories. In Systems Biology; Nielsen, J., Hohmann, S., Eds.; Wiley-VCH Verlag GmbH & Co. KGaA: Weinheim, Germany, 2017; pp. 71–107. ISBN 978-3-527-69613-0. [Google Scholar]
- Burgard, A.P.; Pharkya, P.; Maranas, C.D. Optknock: A Bilevel Programming Framework for Identifying Gene Knockout Strategies for Microbial Strain Optimization. Biotechnol. Bioeng. 2003, 84, 647–657. [Google Scholar] [CrossRef]
- McAnulty, M.J.; Yen, J.Y.; Freedman, B.G.; Senger, R.S. Genome-Scale Modeling Using Flux Ratio Constraints to Enable Metabolic Engineering of Clostridial Metabolism in Silico. BMC Syst Biol 2012, 6, 42. [Google Scholar] [CrossRef]
- Oyetunde, T.; Bao, F.S.; Chen, J.-W.; Martin, H.G.; Tang, Y.J. Leveraging Knowledge Engineering and Machine Learning for Microbial Bio-Manufacturing. Biotechnology Advances 2018, 36, 1308–1315. [Google Scholar] [CrossRef]
- Sen, P. Flux Balance Analysis of Metabolic Networks for Efficient Engineering of Microbial Cell Factories. Biotechnology and Genetic Engineering Reviews 2022, 1–34. [Google Scholar] [CrossRef]
- Ma, H.; Sorokin, A.; Mazein, A.; Selkov, A.; Selkov, E.; Demin, O.; Goryanin, I. The Edinburgh Human Metabolic Network Reconstruction and Its Functional Analysis. Mol Syst Biol 2007, 3, 135. [Google Scholar] [CrossRef]
- Thiele, I.; Swainston, N.; Fleming, R.M.T.; Hoppe, A.; Sahoo, S.; Aurich, M.K.; Haraldsdottir, H.; Mo, M.L.; Rolfsson, O.; Stobbe, M.D.; et al. A Community-Driven Global Reconstruction of Human Metabolism. Nat Biotechnol 2013, 31, 419–425. [Google Scholar] [CrossRef]
- Thiele, I.; Sahoo, S.; Heinken, A.; Hertel, J.; Heirendt, L.; Aurich, M.K.; Fleming, R.M. Personalized Whole-body Models Integrate Metabolism, Physiology, and the Gut Microbiome. Mol Syst Biol 2020, 16. [Google Scholar] [CrossRef] [PubMed]
- Gatto, F.; Ferreira, R.; Nielsen, J. Pan-Cancer Analysis of the Metabolic Reaction Network. Metabolic Engineering 2020, 57, 51–62. [Google Scholar] [CrossRef] [PubMed]
- Özcan, E.; Çakır, T. Reconstructed Metabolic Network Models Predict Flux-Level Metabolic Reprogramming in Glioblastoma. Front. Neurosci. 2016, 10. [Google Scholar] [CrossRef] [PubMed]
- Magnúsdóttir, S.; Heinken, A.; Kutt, L.; Ravcheev, D.A.; Bauer, E.; Noronha, A.; Greenhalgh, K.; Jäger, C.; Baginska, J.; Wilmes, P.; et al. Generation of Genome-Scale Metabolic Reconstructions for 773 Members of the Human Gut Microbiota. Nat Biotechnol 2017, 35, 81–89. [Google Scholar] [CrossRef]
- Heinken, A.; Hertel, J.; Acharya, G.; Ravcheev, D.A.; Nyga, M.; Okpala, O.E.; Hogan, M.; Magnúsdóttir, S.; Martinelli, F.; Nap, B.; et al. Genome-Scale Metabolic Reconstruction of 7,302 Human Microorganisms for Personalized Medicine. Nat Biotechnol 2023. [Google Scholar] [CrossRef]
- Lieven, C.; Beber, M.E.; Olivier, B.G.; Bergmann, F.T.; Ataman, M.; Babaei, P.; Bartell, J.A.; Blank, L.M.; Chauhan, S.; Correia, K.; et al. MEMOTE for Standardized Genome-Scale Metabolic Model Testing. Nat Biotechnol 2020, 38, 272–276. [Google Scholar] [CrossRef]
- Van Pelt-KleinJan, E.; De Groot, D.H.; Teusink, B. Understanding FBA Solutions under Multiple Nutrient Limitations. Metabolites 2021, 11, 257. [Google Scholar] [CrossRef]
- Mendoza Farías, S.N. Metabolic Modeling of Microorganisms and Dynamics of Microbial Communities in the Food Industry. Ph.D. Thesis, Vrije Universiteit, Amsterdam, 2023; p. HFE63732620240130. [Google Scholar]
- Qiu, S.; Zeng, H.; Yang, Z.; Hung, W.; Wang, B.; Yang, A. Dynamic Metagenome-scale Metabolic Modeling of a Yogurt Bacterial Community. Biotech & Bioengineering 2023, 120, 2186–2198. [Google Scholar] [CrossRef]
- Kost, C.; Patil, K.R.; Friedman, J.; Garcia, S.L.; Ralser, M. Metabolic Exchanges Are Ubiquitous in Natural Microbial Communities. Nat Microbiol 2023. [Google Scholar] [CrossRef]
- Sorokin, A.; Goryanin, I. FBA-PRCC. Partial Rank Correlation Coefficient (PRCC) Global Sensitivity Analysis (GSA) in Application to Constraint-Based Models. Biomolecules 2023, 13, 500. [Google Scholar] [CrossRef]
- Herrmann, H.A.; Dyson, B.C.; Vass, L.; Johnson, G.N.; Schwartz, J.-M. Flux Sampling Is a Powerful Tool to Study Metabolism under Changing Environmental Conditions. npj Syst Biol Appl 2019, 5, 32. [Google Scholar] [CrossRef]
- Schellenberger, J.; Palsson, B.Ø. Use of Randomized Sampling for Analysis of Metabolic Networks. Journal of Biological Chemistry 2009, 284, 5457–5461. [Google Scholar] [CrossRef] [PubMed]
- Almaas, E.; Kovács, B.; Vicsek, T.; Oltvai, Z.N.; Barabási, A.-L. Global Organization of Metabolic Fluxes in the Bacterium Escherichia Coli. Nature 2004, 427, 839–843. [Google Scholar] [CrossRef]
- Papin, J.; Reed, J.; Palsson, B. Hierarchical Thinking in Network Biology: The Unbiased Modularization of Biochemical Networks. Trends in Biochemical Sciences 2004, 29, 641–647. [Google Scholar] [CrossRef] [PubMed]
- Fallahi, S.; Skaug, H.J.; Alendal, G. A Comparison of Monte Carlo Sampling Methods for Metabolic Network Models. PLoS ONE 2020, 15, e0235393. [Google Scholar] [CrossRef]
- Loghmani, S.B.; Veith, N.; Sahle, S.; Bergmann, F.T.; Olivier, B.G.; Kummer, U. Inspecting the Solution Space of Genome-Scale Metabolic Models. Metabolites 2022, 12, 43. [Google Scholar] [CrossRef]
- Marino, S.; Hogue, I.B.; Ray, C.J.; Kirschner, D.E. A Methodology for Performing Global Uncertainty and Sensitivity Analysis in Systems Biology. Journal of Theoretical Biology 2008, 254, 178–196. [Google Scholar] [CrossRef]
- Lebedeva, G.; Sorokin, A.; Faratian, D.; Mullen, P.; Goltsov, A.; Langdon, S.P.; Harrison, D.J.; Goryanin, I. Model-Based Global Sensitivity Analysis as Applied to Identification of Anti-Cancer Drug Targets and Biomarkers of Drug Resistance in the ErbB2/3 Network. European Journal of Pharmaceutical Sciences 2012, 46, 244–258. [Google Scholar] [CrossRef]
- Sorokin, A.; Sorokina, O.; Armstrong, J.D. RKappa: Statistical Sampling Suite for Kappa Models. In Hybrid Systems Biology; Maler, O., Halász, Á., Dang, T., Piazza, C., Eds.; Lecture Notes in Computer Science; Springer International Publishing: Cham, 2015; Vol. 7699, pp. 128–142. ISBN 978-3-319-27655-7. [Google Scholar]
- Sorokin, A.; Sorokina, O.; Douglas Armstrong, J. RKappa: Software for Analyzing Rule-Based Models. In Modeling Biomolecular Site Dynamics; Hlavacek, W.S., Ed.; Methods in Molecular Biology; Springer New York: New York, NY, 2019; Vol. 1945, pp. 363–390. ISBN 978-1-4939-9100-6. [Google Scholar]
- Damiani, C.; Pescini, D.; Nobile, M.S. Global Sensitivity Analysis of Constraint-Based Metabolic Models. In Computational Intelligence Methods for Bioinformatics and Biostatistics; Lecture Notes in Computer Science; Raposo, M., Ribeiro, P., Sério, S., Staiano, A., Ciaramella, A., Eds.; Springer International Publishing: Cham, 2020; Vol. 11925, pp. 179–186. ISBN 978-3-030-34584-6. [Google Scholar]
- Nobile, M.S.; Coelho, V.; Pescini, D.; Damiani, C. Accelerated Global Sensitivity Analysis of Genome-Wide Constraint-Based Metabolic Models. BMC Bioinformatics 2021, 22, 78. [Google Scholar] [CrossRef]
- Renardy, M.; Joslyn, L.R.; Millar, J.A.; Kirschner, D.E. To Sobol or Not to Sobol? The Effects of Sampling Schemes in Systems Biology Applications. Mathematical Biosciences 2021, 337, 108593. [Google Scholar] [CrossRef]
- Virtanen, P.; Gommers, R.; Oliphant, T.E.; Haberland, M.; Reddy, T.; Cournapeau, D.; Burovski, E.; Peterson, P.; Weckesser, W.; Bright, J.; et al. SciPy 1.0: Fundamental Algorithms for Scientific Computing in Python. Nat Methods 2020, 17, 261–272. [Google Scholar] [CrossRef] [PubMed]
- Ebrahim, A.; Lerman, J.A.; Palsson, B.O.; Hyduke, D.R. COBRApy: COnstraints-Based Reconstruction and Analysis for Python. BMC Syst Biol 2013, 7, 74. [Google Scholar] [CrossRef] [PubMed]
- Iooss, B.; Veiga, S.D.; Janon, A.; Pujol, G.; Broto, B.; Boumhaout, K.; Delage, T.; Amri, R.E.; Fruth, J.; Gilquin, L.; et al. Sensitivity: Global Sensitivity Analysis of Model Outputs; 2022. [Google Scholar]
- Weber, F.; Theers, S. ODEsensitivity: Sensitivity Analysis of Ordinary Differential Equations; 2019. [Google Scholar]
- R Core Team. R: A Language and Environment for Statistical Computing; R Core Team: Vienna, Austria, 2022. [Google Scholar]
- Shimada, T.; Nakazawa, K.; Tachikawa, T.; Saito, N.; Niwa, T.; Taguchi, H.; Tanaka, K. Acetate Overflow Metabolism Regulates a Major Metabolic Shift after Glucose Depletion in Escherichia Coli. FEBS Letters 2021, 595, 2047–2056. [Google Scholar] [CrossRef]
- Szenk, M.; Dill, K.A.; De Graff, A.M.R. Why Do Fast-Growing Bacteria Enter Overflow Metabolism? Testing the Membrane Real Estate Hypothesis. Cell Systems 2017, 5, 95–104. [Google Scholar] [CrossRef] [PubMed]
- Palsson, B.Ø. Systems Biology: Properties of Reconstructed Networks, 1st ed.; Cambridge University Press, 2006; ISBN 978-0-521-85903-5. [Google Scholar]
- Adams, R.; Clark, A.; Yamaguchi, A.; Hanlon, N.; Tsorman, N.; Ali, S.; Lebedeva, G.; Goltsov, A.; Sorokin, A.; Akman, O.E.; et al. SBSI: An Extensible Distributed Software Infrastructure for Parameter Estimation in Systems Biology. Bioinformatics 2013, 29, 664–665. [Google Scholar] [CrossRef] [PubMed]
- Price, N.D.; Schellenberger, J.; Palsson, B.O. Uniform Sampling of Steady-State Flux Spaces: Means to Design Experiments and to Interpret Enzymopathies. Biophysical Journal 2004, 87, 2172–2186. [Google Scholar] [CrossRef]
- Kuriya, Y.; Murata, M.; Yamamoto, M.; Watanabe, N.; Araki, M. Prediction of Metabolic Flux Distribution by Flux Sampling: As a Case Study, Acetate Production from Glucose in Escherichia Coli. Bioengineering 2023, 10, 636. [Google Scholar] [CrossRef]
Figure.
FBA-PRCC sign interpretation. A – correspondence between bounds and flux directions; B – free diffusion interpretation of bounds with negative PRCC coefficients.
Figure.
FBA-PRCC sign interpretation. A – correspondence between bounds and flux directions; B – free diffusion interpretation of bounds with negative PRCC coefficients.

Figure.
Influence of the Histidine (A and C) and AlaHis (B and D) influx boundary on the biomass production in the wild-type (A and B) and ΔhisD (C and D) models. Sobol points where the boundary was active shown in red and placed on different panels. Boundary considered active if its move cause change in the objective functions.
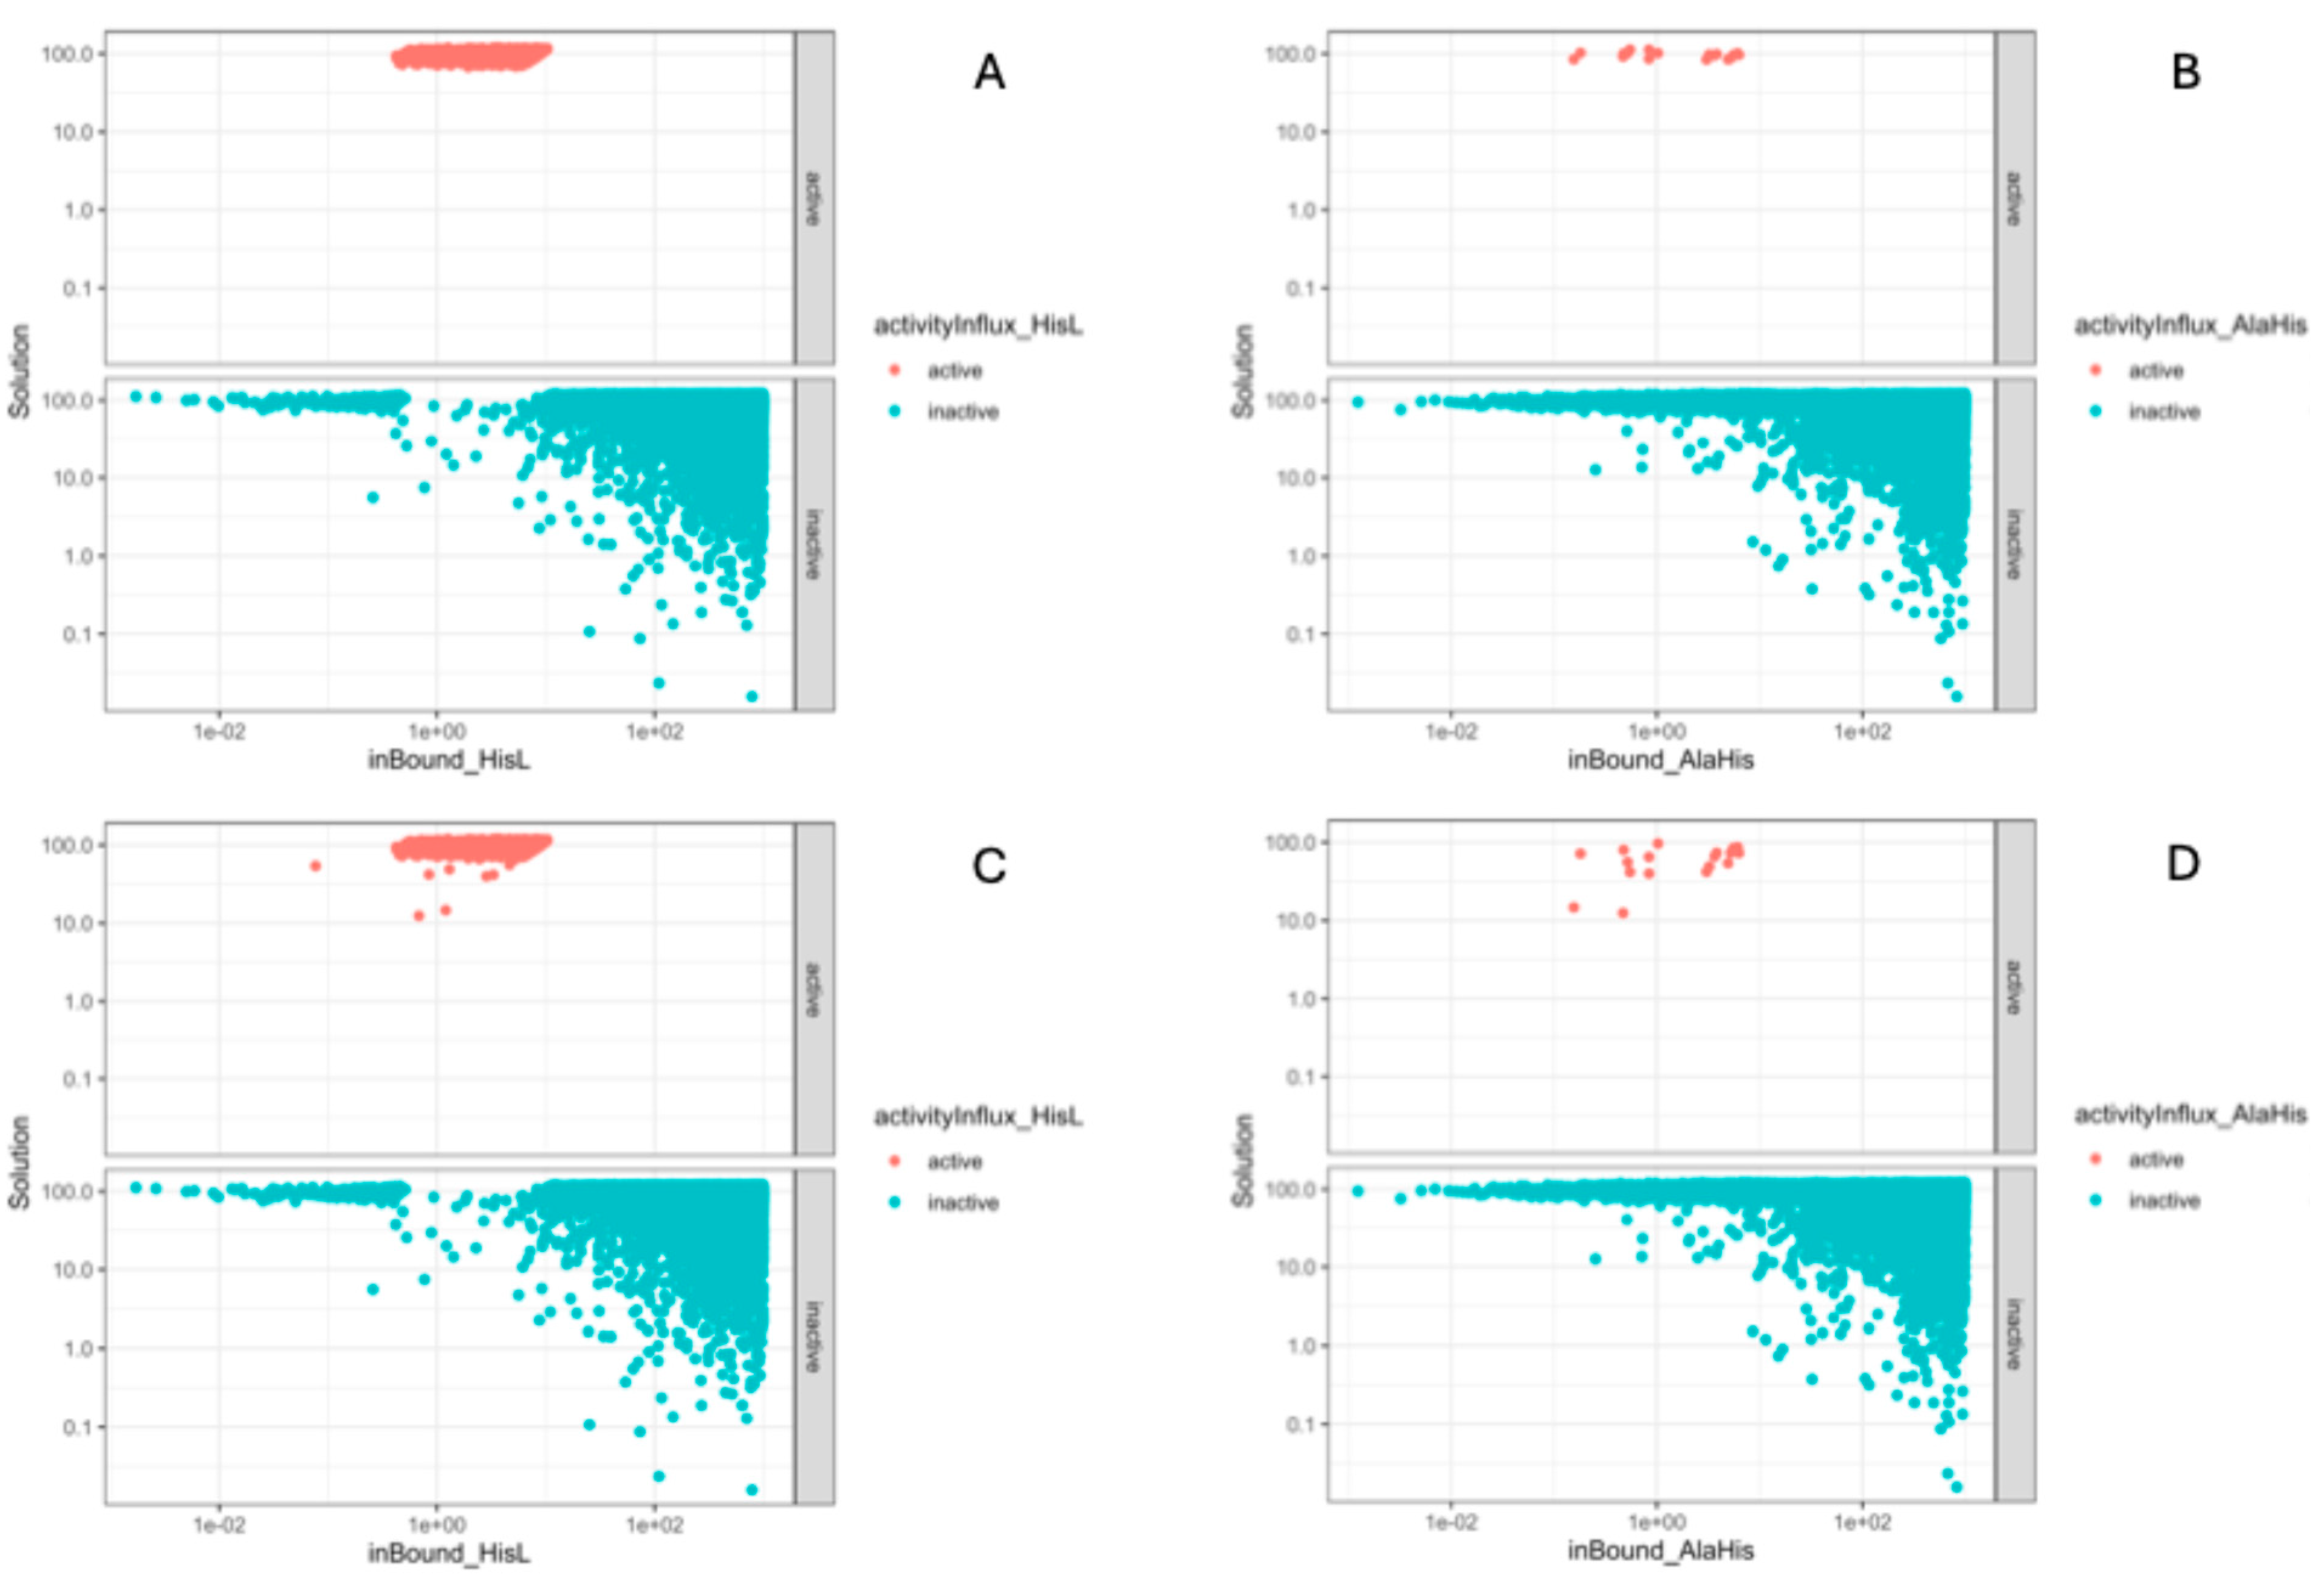

Table.
Sign distribution among sensitivity coefficients for the wild-type model.
| Sign/Boundary | Lower | Upper |
|---|---|---|
| Negative | 3 | 4 |
| Positive | 31 | 30 |
Disclaimer/Publisher’s Note: The statements, opinions and data contained in all publications are solely those of the individual author(s) and contributor(s) and not of MDPI and/or the editor(s). MDPI and/or the editor(s) disclaim responsibility for any injury to people or property resulting from any ideas, methods, instructions or products referred to in the content. |
© 2025 by the authors. Licensee MDPI, Basel, Switzerland. This article is an open access article distributed under the terms and conditions of the Creative Commons Attribution (CC BY) license (http://creativecommons.org/licenses/by/4.0/).
Copyright: This open access article is published under a Creative Commons CC BY 4.0 license, which permit the free download, distribution, and reuse, provided that the author and preprint are cited in any reuse.


