
Submitted:
11 April 2025
Posted:
11 April 2025
You are already at the latest version
Abstract
Purpose - The manufacturing sector drives industrialisation and contributes substantially to economic growth and employment creation. Despite this, it faces challenges of diminishing size and lack of competitiveness, mainly due to operational uncertainty. This study aims to develop an approach to managing operational uncertainty with Industry 4.0 and 5.0 technologies.Design /methodology/approach - The study employed a multimethod quantitative design based on the post-positivist paradigm, with data collected from 22 experts and 262 responses from a manufacturing firms' survey. It uses an integrated fuzzy decision-making trial and evaluation laboratory (DEMATEL) with structural equation modelling partial least squares (PLS-SEM) and fuzzy set qualitative comparative analysis (fsQCA). Findings - The results reveal that growing geopolitical tension, cost of living-driven consumer behavioural change, pandemic turbulence, lack of energy stability and security, and entrenchment power of large firms are causal dimensions of operational uncertainty. Industry 4.0 and 5.0 technologies with capabilities for scenario planning and supply chain integration, flexible production and mass customisation, real-time system and process monitoring and response, root cause analysis, and sustainable solutions can manage operational uncertainty. These technologies are artificial intelligence, the Internet of Things, big data analytics and, to a lesser extent, advanced robotics, blockchain, and augmented and virtual reality.Originality - The study advanced the modified neo-configuration theory and a new integrated methodology (fuzzy-DEMATEL-PLS-SEM-fsQCA) to develop solutions for sustained performance during operational uncertainty in manufacturing. This research offers valuable information to advance the subject and make meaningful changes in day-to-day manufacturing operations and promote practical real-world issue solving.
Keywords:
operational uncertainty
; industry 4.0 and 5.0 technologies
; organisational learning
; sustained performance
; qualitative comparative analysis (QCA)
; modified neo-configurational perspective
1. Introduction
The manufacturing sector is crucial in driving economic growth, providing stability during economic downturns, and significantly contributing to the gross domestic product (GDP) of a country (Attiah, 2019; Wan et al., 2022). Szirmai (2012) explained that the characteristics of the manufacturing sector facilitate long-term economic growth and supported the notion that manufacturing drives industrialisation and can serve as the primary engine of growth. Critically, manufacturing also has a reduced susceptibility to economic shocks compared to other industries (Cantore et al., 2017). The South African Reserve Bank (2020) supports this view, arguing that these characteristics have led many countries, including South Africa, to prioritise manufacturing as a sector for development initiatives. Despite its importance, the manufacturing sector has challenges (Ndung’u et al., 2022; United Nations Industrial Development Organisation (UNIDO), 2020). Central to these challenges is the diminishing size of this sector in nearly all regions (Hauge, 2023) and the lack of competitiveness (UNIDO, 2024). In particular, African economies have experienced development and restricted diversification in recent decades, and progress in manufacturing output has, at best, stagnated or declined despite efforts to boost the sector (Nnyanzi et al., 2022). In South Africa, the manufacturing sector was responsible for about 13% of the country's GDP in 2021, which is almost half of the 24% it represented in 1990. By 2023, this figure has remained steady at around 13% (World Bank Group, 2024).
The underwhelming performance of manufacturing in Africa in recent years has cast doubt on the prospects of industrial-driven development on the continent (Ndung’u et al., 2022; Rodrik, 2018). These challenges are exacerbated by the prevailing operational uncertainties that negatively impact manufacturing firms (Li et al., 2024; Shi et al., 2023). Despite these challenges, Aryeetey and Baffour (2022) contend that Africa can still achieve manufacturing-led industrialisation by improving Africa's global manufacturing competitiveness. This supports the earlier assertions of Signé and Johnson (2018), who argued that Africa has the potential to emerge as a prominent manufacturing hub due to certain competitive advantages it offers compared to other developing regions where industrialisation appears to have reached a plateau. These challenges test the resolve of the manufacturing sector in terms of survival, growth, and sustainability (Alsamhi et al., 2022; Mollah, 2019; Shepherd and Suddaby, 2017). A response is required to address such operations management problems (Walker et al., 2015). Thus, there is a need, among others, for manufacturing firms to effectively manage complexity in their operating environment. This is particularly urgent for the manufacturing sector in South Africa and most African countries. This requires research, as very little is known about the combined impact and management of operational uncertainty on a firm's performance. Such a response is essential to enhance theoretical development that contributes towards expertise surrounding operational management.
This study aims to develop an approach to managing operational uncertainty with Industry 4.0 and 5.0 technologies. The remainder of the paper discusses the theoretical foundation of the study, linking theory to methodology and the configuration model. It is followed by the methodology, which outlines how the study was conducted, and then the results of the study. The latter part of the paper discusses the results, the theoretical and methodological contributions of the study, and the implications for manufacturing. The final part of the study is conclusion which also discusses the limitations of the study and direction for future research.
2. Theory and Propositions
2.1. Complexity and Configurational Theory
The study is based on complexity (Sammut-Bonnici, 2014) and configurational theory (Fiss et al., 2013; Pla-Barber et al., 2020). Complexity theory provides an overarching high-level view or context which was detailed or operationalised using configurational theory. Complexity theory generally emphasises dynamic interactions within systems (Malacina and Lintukangas, 2024) and emergent properties (Byrne, 2005; Leydesdorff, 2008), while configurational theory focuses on the specific arrangements or configurations of elements within a system that lead to particular outcomes (Iannacci and Kraus, 2022). Complexity theory often employs dynamic systems analysis to study emergent behaviours, with operational uncertainty regarded as emergent behaviour in manufacturing. On the other hand, configurational theory uses set-theoretic methods such as qualitative comparative analysis (QCA) to identify and analyse configurations to respond to this operational uncertainty (Byrne, 2005; Park and Mithas, 2020). In configurational theory, the reduction of uncertainty is a key aspect, as configurations are seen as a way to stabilise and globalise system interactions, providing a measure of synergy within complex systems (Leydesdorff, 2008). Configurations serve to evaluate multiple factors while preserving a significant and coherent aspect of organisational reality and providing a complete framework for a subject (Ambrosini et al., 2009). Misangyi et al. (2017) posited that the origin of configurational research involves organisational studies which were inspired by systems thinking. Configurational theorising is centred around three fundamental principles: (1) conjunctural causation - other factors influence the impact of one factor; (2) equifinality - different combinations of factors might result in the same outcome; and (3) causal asymmetry - causes that result in the presence of a particular outcome may differ significantly from the causes that result in the lack of that outcome (Iannacci and Kraus, 2022; Pattyn et al., 2022).
Linking theory and methodology operationalise configurational theory with qualitative comparative analysis (QCA) (Park and Mithas, 2020). Ragin (2009) argued that this is an ideal method for assessment of the 'combined effect' as well as the 'interaction relationship'. Thiem (2016) posited that Qualitative Comparative Analysis (QCA) is one of the most formalised configurational comparative methods as it integrates both qualitative and quantitative methods. QCA is a valuable method for both theory building and testing (Oana et al., 2021) Misangyi et al. (2017), argued that configuration analytical models are useful in theory building, theory extension, and theory testing. Thus, QCA is used for theory building by identifying necessary and sufficient conditions for outcomes, particularly in complex causal relationships. It is increasingly used in various disciplines to synthesise evidence and develop theories. Pappas and Woodside (2021) also employed a configurational approach to analyse a theory.
2.2. Configuration Model
The QCA allows research to systematically compare cases and identify the necessary and sufficient conditions for outcomes. It facilitates the exploration of complex causal relationships and helps to formulate theoretical propositions. Through its configurational approach, QCA enables testing these propositions against empirical data, thus contributing to the refinement of theories and enhancing the robustness of research findings (Greckhamer et al., 2018). The QCA can be applied using the deductive approach for theory testing and the inductive approach for theory building (Misangyi et al., 2017). Pappas and Woodside (2021) also employed a configurational approach to analyse a theory, while Cooper and Glaesser (2016) demonstrated the value of using asymmetric tests to both advance theory and provide useful empirical models of the occurrence of multiple realities. Pappas and Woodside (2021) explained that the QCA uses combinations of causal conditions that result in an outcome. Huang et al. (2024) argued that the QCA allows causal complexity analysis and multiple interaction effects associated with conjunctural, causation equifinality, and causal asymmetry that are difficult to capture using conventional research methods. The present research developed a configuration model to explain sustained performance. Figure 1 shows a set-theoretic configuration model that conceptualises the constructs and demonstrates their multiple asymmetric relationships.
The causal conditions were first the operational uncertainty (X) and its dimensions (Mtotywa and Mohapeloa, 2025). These include geopolitical tension (GPT), policy and regulatory uncertainty (PRU), the cost of living-driven consumer behaviour change (CLC), pandemic turbulence (PDT), and energy stability and security (ESS). In addition, it also included the skills for future industrial work (SFW) and the entrenchment power of large firms (EPL), generational work behaviour and ethics (GWB), and process capability and variations (PCV) (Mtotywa and Mohapeloa, 2025).
Proposition 1:
Within these nine dimensions of operational uncertainty, there are some which are causes and others are effects.
Second, Industry 4.0 and 5.0 technologies (W). These include the Internet of Things (IoT) and enhanced connectivity, artificial intelligence (AI), big data, augmented and virtual reality (AR/VR), blockchain, advanced robotics and robotic systems, additive manufacturing (3D printing), and quantum computing and their capabilities (Akundi et al., 2022; Belhadi et al., 2024; Kumar et al., 2019; Noble et al., 2022) . The third is organisational learning (Ivaldi et al., 2022; Tan and Olaore, 2022). Tan and Olaore (2022) posited that organisational learning has an all-encompassing effect on operations and employee productivity to, thus, increase efficiency across the board, in all departments, and at all levels of management. Basten and Haamann (2018) suggested that with the help of organisational learning, firms may pool their employees' expertise to solve complex problems. This underpins the importance of learning within companies to improve and achieve their objectives. Firms that are more adept at learning are better positioned to capitalise on emerging opportunities and respond to emerging dangers, particularly those that require considerable organisational change. This strategic approach is crucial to effectively managing the inherent strengths and threats associated with Industry 4.0 (Ivaldi et al., 2022). Sustained performance may manifest itself or not through various combinations of constructs, including operational uncertainty, Industry 4.0 and 5.0, and organisational learning. The outcomes of interest are analysed using Boolean minimisation.
Proposition 2:
Combinations of OPU(2), IRT, and OLN conditions lead to high or low sustained performance.
3. Methodology
The research obtained ethical clearance approval from the University Human Research Ethics Committee (RU-HREC), approval number 2023-7527-8189. This study is part of a larger doctoral research.
3.1. Research Design
The study employed a multi-quantitative method design from a singular paradigm (Morse, 2003; Hunter and Brewer, 2015; Wellman et al., 2023). The multimethod is beneficial in research as it has the ability to generate and test theory in a single study (Wellman et al., 2023). Choi et al. (2016) posited that adopting multi-methods significantly advances the field of operational management. In this study, we used a multi-quantitative design, with one phase using expert assessment and the other using a manufacturing firms survey.
3.2. Sample and Data Collection
The target population of the present study consisted of manufacturing companies in South Africa.
For experts, the non-probability sampling using judgment sampling techniques was used to sample these participants (Blumberg et al., 2014), while for the firm survey, it was a multistage nonprobability sampling, which is deemed effective in improving the generalisability of the study.
The expert assessment and the survey were conducted in a hybrid form: online and face-to-face, with the online assessment using SurveyMonkey® or email response. Each expert had the opportunity to meet with the researcher to explain the study to them.
The study had 22 experts, which were deemed adequate to provide a more comprehensive view while reducing bias and increasing the robustness of the decision-making process (Brownstein et al., 2019). Experts for this research were selected based on their competence and experience, which was at least ten years of experience in academia and industry in operations management and policy development (Abdullah et al., 2023). The experts' experience ranged from 11-15 years to more than 25 years. Many experts, especially those in engineering and production fields, had technical degrees (e.g., BEng, MEng, Ph.D. in Science, and Chemical Engineering), blended with postgraduate management degrees (MBAs, Ph.D., and DBA). The experts were from various manufacturing industries, including automotive, food and beverage, metals, machinery and equipment, chemical products, wood products, petroleum, textiles, and clothing. In addition, there were experts from consultancy, academia, and policy making. For the firm survey, 262 responses were obtained, which equates to a response rate of 68.3%. from the determined sample of 384 (Cochran; 1977), which is an acceptable response rate (Nulty, 2008). Gauteng had the highest representation (37.0%), followed by the Western Cape (14.9%) and KwaZulu-Natal (14.5%). These provinces constituted two thirds of the responses (66.4%). This is followed by representations of the Northwest (13.7%), the Eastern Cape (6.87%) and the Free State (4.58%). The response was from across the manufacturing industries with Food and beverage being the largest industry segment, accounting for 23.7%, Coke, Petroleum, Chemical Products, Rubber and Plastic (22.1%) and Metal, Metal Products, Machinery and Equipment (20.6%). Transport Equipment also has notable representation (17.6%), while Other Industries were combined 16.0%.
3.3. Data Analysis
The survey data were imported into IBM Statistical Package for Social Science version 29, where descriptive and inferential statistics were used to analyse the data, SmartPLS version 4 for measurement and structural model and fsQCA version 4.1. Initially, the data were coded, then screened, and cleaned. The missing values were less than the 10% threshold (Dong and Peng, 2013) and there were also no common method variance issues in the data, with Harman’s single factor test being 11.67%, which is better than the 50% threshold (Jordan and Troth, 2020). Optimal solutions were developed using qualitative comparative analysis (fsQCA) (Cangialosi, 2023; Scheider and Wageman, 2012) from the combination of enhanced 4-step process:
Step 1: Selection and validation of the causal conditions of operational uncertainty with fuzzy DEMATEL.
Step 2: Build configuration
Step 3: Causal Conditions-Based PLS-SEM measurement and structural models
Step 4: Develop configurations - solutions (fsQCA)
Step 1: Fuzzy-DEMATEL
In the present research, causal conditions were empirically developed using a fuzzy decision-making trial and evaluation laboratory (DEMATEL). A fuzzy DEMATEL is a multi-criteria method for visualising the structure of complex causal-effect relationships (López-Ospina et al., 2022). The research adapted its approach from Lin and Wu (2008) and Yeh and Huang (2014) with measures of consistency for the DEMATEL method from (Shieh and Wu, 2016) creating seven sub-steps.
Sub-step 1: Decision goals, set of criteria, and decision-makers
Experts denote preferences and assign causalities using triangular fuzzy numbers (Jassbi et al., 2011) with the outcome averaged with the equation:
where
is the average of the assessment by the experts, p = is the number of the experts.
Sub-step 2: Design the fuzzy linguistic scale.
The five-point scale was selected for the operational uncertainty assessment based on the level of its influence on manufacturing operations. The degree of influence is expressed using five linguistic terms and triangular fuzzy numbers.
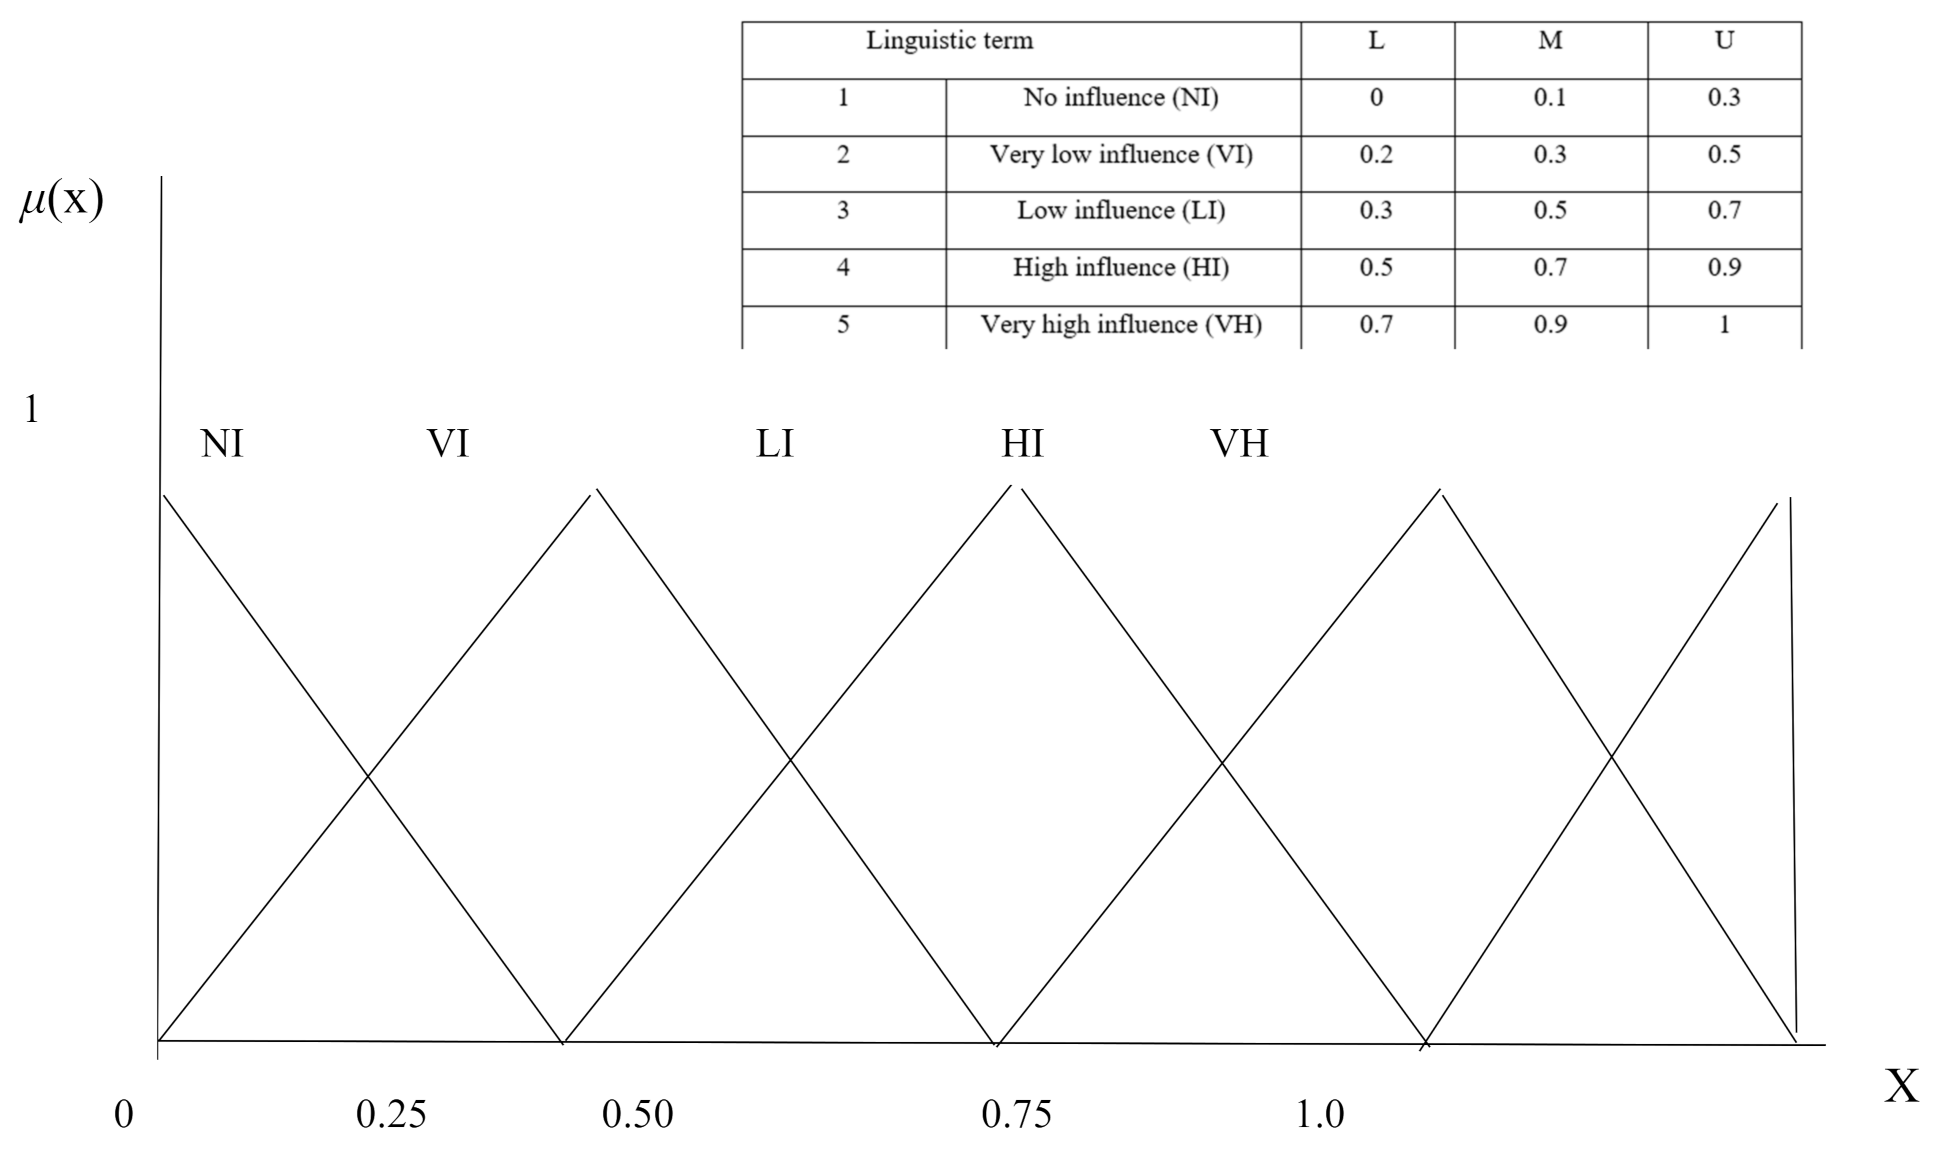
Sub-step 3a: Generate a fuzzy matrix
Each expert, p, generates the matrix using the linguistic valuation with the linguistic terms using the level of influence and the linguistic fuzzy scale triangular numbers, lower-median-upper limits (l-m-u).
Sub-step 3b: Measure the agreement and consistency of decision-makers
Kendall’s coefficient of concordance (W) was employed to assess the degree of agreement among the decision-makers (Teles, 2012). This method is a non-parametric approach for three or more distinct ranks. Kendall’s W is analysed based on the following equation:
where
= individual rated criteria (dimension),
is the number of decision-makers where
> 2, in this study
= 22 rating
– dimensions, with:
where
is a sum-of-squares statistics deviation over the row cumulates of ranks,
.
is the mean for the
values. The Kendall’s W
concordance
statistics
(Marcinkiewicz, 2017),
which range from 0 to 1, can be obtained from the equation:
In addition, an analysis was conducted with acceptable levels of agreement to evaluate individual-level consistency using the corrected item-total correlation. The item-total correlation refers to the degree of linear association between an individual item and the overall scale total. The greater the correlation among experts, the higher the inter-item correlations. The experts were evaluated to yield 22 expert-total correlations. The correlation of each expert with the aggregate of the other 21 experts. The corrected-item total correlation is denoted as follows:
where
…
are the experts and
being the Pearson correlation and
.
The Intraclass Correlation Coefficient (ICC) values indicate the level of agreement or reliability among the experts’ ratings for each construct (Shrout & Fleiss,1979). Based on the ICC interpretation of > 0.90: Excellent agreement, 0.75 - 0.90: Good agreement, 0.50 - 0.75: Moderate agreement and < 0.50: Poor agreement.
Step 3c: Generate the mean fuzzy direct-relation matrix
The arithmetic mean was then developed from the experts' assessment to generate the direct relation matrix. This was based on all 22 experts, as they were all retained after Kendall’s coefficient of concordance (W), Corrected item-total correlation, and intraclass correlation. The intraclass correlation analysis was based on a two-way correlation coefficient focusing on absolute agreement (closeness of the expert measures to each other). The direct relation matrix generated is the same as the expert's pairwise comparison matrix.
Step 4: Normalise the fuzzy direct relation matrix
Conversion from a linear to a normalised scale was conducted to obtain a compatible scale (Yeh & Huang, 2014). The normalised fuzzy direct-relation matrix can then be determined with the following equation:
Where
Step 5: Determine fuzzy total-relation matrix
The fuzzy total-relation matrix can be determined with the following equation:
where
is the fuzzy total relation-matrix from the normalised direct relation-matrix,
.
and the element of the fuzzy total-relation matrix is expressed as:
, and calculated with equations as follows:
Step 6: Deffuzify matrices of total relationships
Step 7: Causal analysis
Causal relation analysis is used to determine the most important factor and how it is classified to understand the cause and effect. This is determined with the following equations:
where
is the sum of rows while
is the sum of the columns.
represents the
degree of importance of the factor,
and D-R represents the
net effects that the factor contributes to the system. A graph is developed to depict a cause-effect diagram.
Step 2: Build configuration
Fiss (2007), and later supported by Woodside et al. (2018), posited that configurations can emerge conceptually or empirically; both are designed to characterise "what" configurations exist in the area of interest. In the present study, the configurations were built based on the model in Figure 1. The causal conditions were operational uncertainty (X) dimensions were classified as causal in Fuzzy-DEMATEL, Industry 4.0 and Industry 5.0 technologies and their capabilities (W), organisational learning (Z) and outcome being sustained performance (Y).
Step 3: PSL-SEM measurement and structural model
The study analysed the measurement model for validity and the reliability and structural model to understand the level of the relationship between conditions and outcomes. with structural equation modelling partial least squares (PLS-SEM).
The model was also evaluated for explanatory power, R2, effect size, f2 and
predictive relevance, Stone-Geisser
Q2 (Hair et al., 2019). The f2 measures a specific causal condition on an outcome condition by examining the change in R² when a dimension is included versus when it is excluded from the model. The f2 is formulated as follows (Cohen, 1988):
where
is the
value of the outcome condition when a specific operational uncertainty dimension is included, while
is the
value of the outcome condition when a specific operational uncertainty dimension is included in the model. The
is its explanatory power assesses the proportion of variance in an outcome condition explained by its causal conditions, analysed with the equation:
where
is the sum of the squares of the residuals that are unexplained variance in the causal outcome, while
is the total sum of squares of the total variance in outcome variance given as an observed value around the mean. The predictive relevance,
Stone-Geisser
Q2
of the endogenous variables
is calculated using the following equation:
Step 4: Develop fsQCA – solutions
The fsQCA was developed based on Boolean algebra, and the Boolean minimisation methods can be used to capture patterns of multiple-conjunctural causality and to simplify complex data structures rationally and comprehensively. Three Boolean operations are used, these being the negation operations (~), logical AND (*) and logical OR (+) (Rasoolimanesh et al., 2021). The input of the conditions to the fsQCA was the standardised latent scores from the PLS-SEM (Rasoolimanesh et al., 2021; Sukhov et al., 2023). This was followed by the identification and assignment of observations the set of members (Ragin, 2009), calibrated based on the percentile approach proposed by Rasoolimanesh et al. (2021). This percentile uses 3 = full membership, 0 = cross-over, and -3 for non-membership, where the full membership represents 99.9% percentile while -3 is 0.1% percentile (Rasoolimanesh et al., 2021). Calibration allowed the analysis of the data and identifies the high and low levels of predictor and outcome to identify sufficient and necessary conditions (Papas and Woodside, 2021; Schneider and Wagemann, 2012). The cutoff frequency for conditions (raw coverage) was greater than or equal to 3 for the analysis. This helps to ensure that very few conditions regarded as not meaningful are filtered out. The consistency and coverage of the configurations help identify the sufficiency and necessity of the configuration for the specific outcome (Ragin, 2009). Consistency highlights the proportion of the cases that are present in a combination for the specific outcome with the consistency calculated (Ragin, 2009):
where is the fuzzy-set membership score of the configuration for each case, . is the membership outcome of the case, while represents the lowest membership of and . A consistency score of 0.8 confirms the sufficiency of the configuration.
Coverage indicates how well the configurations explain the outcome of interest (Rasoolimanesh et al., 2021) and is determined using the following formula:
A coverage score of 0.2 confirms the sufficiency of the configuration with fuzzy set membership scores higher than 0.5 obtained from the configurations (Ragin, 2009; Rasoolimanesh et al., 2021).
4. Results
4.1. Causal Conditions of Operational Uncertainty with Fuzzy DEMATEL
The purpose of the decision was to determine the relationship and interdependence of the factors. This is based on nine dimensions of operational uncertainty, which are used as sets of criteria. Generate a fuzzy matrix, measure the agreement and consistency of decision makers, and generate the mean fuzzy direct-relation matrix. Kendall’s W concordance degree scale with its corresponding Chi-square (χ2) (Marcinkiewicz, 2017). All dimensions had a W > 0.30 (Moslem et al., 2019). The analysis was also conducted with acceptable levels of agreement to evaluate individual-level consistency using the corrected item-total correlation. The results suggest excellent agreement among experts. Intraclass correlation (ICC) indicated the level of agreement or reliability between the experts’ ratings for each construct ICC > 0.90 (Shrout and Fleiss, 1979). The arithmetic mean was then developed from the experts' assessment to generate the direct relation matrix. The generated direct relation matrix is the same as the pairwise comparison matrix of experts. Conversion from linear to normalised scale is conducted to obtain a compatible scale. Then the normalised fuzzy direct relation matrix was then determined. The fuzzy total relation matrix was determined in this system. The fuzzy total relation matrix was critical in identifying and quantifying the causal relationships among factors in this complex system. Causal relation analysis was performed to determine the most important factor and how it is classified to understand the cause and effect (Table 1).
Figure 2 shows the model of significant relations that focuses on causes and effects. This model can be represented as a diagram in which the values of (D+R) are placed on the horizontal axis and the values of (D-R) are placed on the vertical axis. The coordinate system determines the position and interaction of each factor with a point in the coordinates (D+ R, D-R).
The horizontal vector (D + R) represents the degree of importance each dimension plays in the entire system. In other words, (D + R) indicates both factor i’s impact on the whole system and other system factors’ impact on the factor. Regarding the degree of importance, CLC is first and SFW, EPL, ESS, PRU, GWB, PCV, PDT, and GPT are next. In this study, GPT, CLC, PDT, ESS and EPL are considered causal variables, and PRU, GWB, SFW and PCV are regarded as effects. The results support Proposition 1 that within these nine operational uncertainty dimensions, there are some which are causes and others are effects.
4.2. Build Configurations
Table 2 provides information on the conditions for building the configurations. The approach in the building was that the model must have more than one but not more than seven causal conditions. This is in line with the recommendations of Fainshmidt et al. (2020, p.457), who argued that “models with more than seven causal conditions can be constructed in principle, but given the large number of parameters involved, the results can become difficult to interpret and such models should therefore be avoided”. At the same time these authors explained that a single causal condition is rarely sufficient to explain the presence of a particular outcome.
4.3. Structural Models – Direct Effect of Causal Model
The measurement and structural model with the five casual conditions used are presented in Figure 3. The model was analysed and showed good model fit using SRMR = 0.078. This was a good fit as it was better than both the conservative value of 0.080 (Hu and Bentler, 1998) and the recommended threshold of 0.10 (Henseler et al., 2014). The model had good reliability and validity with all values for reliability >0.7 and AVE for convergence validity > 0.50 and discriminant validity using HTMT less than .
The model had acceptable explanatory and predictive power (Shmueli et al., 2019). This was important because the validity and utility would be compromised if it did not have such capabilities. The model had an acceptable predictive power with Stone-Geisser Q2 > 0. Although the model had a lower R² = 0.060, it was deemed acceptable as the model demonstrates acceptable predictive relevance (Q²) (Suhan and Achar, 2016), as well as model performance with acceptable SRMR (Yusif et al., 2020).
4.4. Geopolitical Tension
fsQCA solutions based on the latent variable score were performed for the conditions in the presence of geopolitical tension. Analysis and solution were based on the Quine-McCluskey model algorithm. The causal conditions were GPT, OLN, SPSI, FPMC, RPMR, AI, BCC, while the outcome is SPF. The unique latent variable (LV) scores developed from the truth table were analysed using logical minimisation to identify the sufficient and necessary conditions (Schneider and Wagemann, 2012). The raw consistency measures the consistency of a configuration that leads to an outcome. A total of 32 alternatives were produced from the truth table after removing the alternatives with fewer than three cases (cutoff = 3). A standard analysis was conducted which included causal combinations to achieve sustainable performance during growing geopolitical tension. A threshold of ≥ 0.75 (Mejía-Trejo, 2023) was used as the guide for consistency, also noting and there is also a more stringent guide of > 0.80 from other authors such as Ragin (2009), with coverage greater than 0.2. This was considered sufficient to generate the outcome. A combined use of intermediate and parsimonious results was used to identify the core and peripheral conditions (Fiss, 2011). When examining parsimonious solutions, conditions; SPSI and ~cGPT were present in both solutions and have high consistency and coverage, indicating that they are the core conditions, while the others are peripheral conditions. These core causal conditions are strongly linked to the outcome by leveraging the present or absent conditions (Ragin, 2009). The analysis produced 12 solutions for high sustained performance (SPF). In Table 3, the presence of the condition is indicated by a black circle, while the absence is indicated by an empty circle, while the blank space indicated by ‘do not care’ is based on the guide by Fiss (2011) guide. The large circle denotes the core condition, while the small circle represents the peripheral condition. The coverage and consistency were good. Solution coverage indicated how well the combination of conditions explain the outcome. In these results, it was 0.832 implying that the solution covers about 83.2% of the cases. The solution consistency accounts for how well the combination of conditions consistently predicts the outcome, which in this case was 0.799, implying a consistency of 79.9%. Within these 12 solutions, four had the presence of geopolitical tension (GPT), and this is the main focus, as it is assumed to be present in the firm. These are solutions 1, 7, 8 and 10.
Parsimonious solution (Core conditions): SPSI (coverage – 0.802, consistency – 0.793), ~GPT (coverage – 0.777, consistency – 0.783). Necessary conditions: SPSI: consistency – 0.802, coverage 0.793. Source: Authors To achieve sustained performance in the presence of GPT, it may be combined with solution 1 (AI in the absence of FPMC, RPMR and BCC) or solution 7 (OLN, FPMC and AI), solution 8 (SPSI, FPMC, AI in the absence of BCC), and solution 10 (AI in the absence of OLN, FPMC and BCC). There are six solutions that show the achievement of high sustained performance in the absence of GPT. A necessary condition analysis was conducted for these solutions. Rihoux and Ragin (2009) posited that the necessary condition is regarded as the superset of the outcome. In this analysis, the SPSI had strong consistency – 0.802, coverage 0.793 appeared to be a candidate to explain the variations in high SFP. This is despite not reaching > 0.9. Despite this, in the strictest term these solutions have no necessary condition (Ragin, 2009). Four specific subpropositions were tested based on solutions 1, 7, 8, and 10 regarding the achievement of high sustained performance in the presence of geopolitical tension when managed with the Industry 4.0 and 5.0 technologies capabilities. Solution 1 and 10 are the same for the presence of GPT and AI. The other three subpropositions are provided in Figure 4a-c. The X-axis typically represents the degree of membership in a causal condition, while the Y-axis represents the degree of membership in the outcome (Meja Trejo, 2023). Consistency measures the degree to which cases with a high membership in the condition also have a high membership in the outcome, and coverage assesses the extent to which the condition accounts for the outcome (Cangialosi, 2023). When looking at the presence of operational uncertainty in combination with organisational learning and Industry 4.0 and 5.0 technologies and capabilities. With high XY for solution 8, (0.876) and solution 7 (0.871), and moderate to low XY, this indicates that the proposition is partially supported and that the high performance depends on a large group of firms. However, it does not predict all the cases. The same applies to solution 1.
4.4.2. Energy Stability and Security
For energy stability and security, the allotment of solution scores (truth table) and the solutions for sufficient configurations of high sustained performance were also developed. There were 11 solutions (Table 4). In these solutions, there are five solutions in the presence of operational uncertainty due to energy stability and security, resulting in high SPF when combined with security, Industry 4.0 and 5.0 technology capabilities, and organisational learning. Solution 6 has a high SPF in the presence of ESS when combined with RCAS, AI, and BDA in the absence of SPSI. Solution 8 is in combination with RCAS, RPMR and SPSI. The other solution that would result in a high SPF is solution 9, 10 and 11 in the presence of AI, and sometimes OLN and SPSI. There was no necessary condition from the necessary condition analysis.
The XY plot shows that the proposition is partially supported with high XY and moderate to low X ≥Y (Figure 4d-h)
4.4.3. Operational Uncertainty Construct
SPSI and OLN were regarded the core conditions as they were present in both the parsimonious and intermediate solution and had higher coverage and consistency (≥0.85). PEHS, AI and ARVR, although they appeared in the parsimonious and intermediate solution, were still regarded peripheral conditions as their solutions had coverage <0.50 or coverage was <0.85. The intermediate solution results show that the coverage of the solution was 0.686 and consistency was 0.864 (Table 5).
Thus, the solution covers about 68.6% of the cases, and the consistency of the solution accounts for the combination of conditions that consistently predicts the outcome was 86.4%. Only individual solutions with coverage ≥0.2 and coverage ≥0.75 were reported. The solution – OPU2*OLN*~PEHS*AI*~ARVR denoted as solution 0 was used for a specific proposition. This proposition looked at the presence of operational uncertainty in combination with organisational learning and artificial intelligence. The XY plot is present in Figure 4i showing the consistency to which the observations were plotted with XY = 0.855 while the X ≥Y = 0.448. With high XY moderate to low X ≥Y = 0.448, indicate that proposition that is partially supported that the solution with high performance depends on large group of the firm, however it does not predict all the cases thus not fully advancing the theory. Papas and Woodside (2021) posit that consistency above 0.80 can serve as a guide for theoretical advancement. The fsQCA results show that there exist multiple configurations that can lead to high sustained performance. This supports proposition 2 that combinations of OPU(2), IRT, and OLN conditions lead to high or low sustained performance.
5. Discussion
5.1. Development of Framework
An integrated approach was useful, as fuzzy DEMATEL separated the nine dimensions into causes and effects (López-Ospina et al., 2022). The study identified the causal dimensions: geopolitical tension, cost-of-living-driven consumer behavioural change, pandemic turbulence, energy stability and security, and the power of large firms. The effect conditions were skills for future work, generational work behaviour and ethics, process capability and variations, and policy and regulatory uncertainty. The PLS-SEM structural model, the results show that of the five causal dimensions, there was a statistically significant negative relationship between geopolitical tension and sustained performance and between operational uncertainty due to inadequate energy stability and security. The other three were not significant.
The rise in geopolitical tensions is one of the important dimensions of operational uncertainty. Geopolitical tensions lead to supply chain disruption (Ali et al., 2024; Bednarski, 2023), increased costs (Charpin and Cousineau, 2024), and regulatory changes can restrict market access, forcing firms to adapt their supply chain networks to comply with new regulations or face penalties (Charoenwong et al., 2023). The fsQCA analysis shows solutions that are candidates to achieve high sustained performance in the presence of growing political tension. These include the use of artificial intelligence or the use of AI in combination with technologies that can enable flexible production (FPMC) and mass customisation and organisation learning conditions to manage geopolitical tension. This finding can also have implications for other countries in Africa that are faced with the same domino effect due to dependency on the countries that has heightened geopolitical tensions. Furthermore, there is also the operational uncertainty of energy stability and security. The availability of a stable energy supply is closely related to economic and industrial sustainability. South African manufacturing industries remain among the most energy-intensive industries (Kan et al., 2020). Dewa et al. (2020) explained that unstable energy supply (loadshedding) had resulted in the manufacturing sector experiencing production halts and increased downtime, which compromises delivery schedules and overall productivity. Mashapu and Mathaba (2024) reported that in some cases load-shedding has led to a substantial increase in operational costs. The results of the analysis of the study yielded solutions that can lead to high sustained performance in the presence of operational uncertainty due to energy stability and security. This can be achieved when combined with root cause analysis and sustainable solutions, with artificial intelligence and big data analytics. It can also be achieved in the presence of ESS in combination with scenario planning and supply chain integration, root cause analysis and sustainable solutions, real-time monitoring and response, and organisational learning. The other alternative is the presence of AI and others in AI, organisational learning, root cause analysis, and sustainable solutions. There is also an option of quantum computing, but this might depend on the complexity of the problem that needs root cause analysis. These findings may have lessons and implications for other countries facing challenges of energy instability. This aligned with the relevance of the study in African countries. There was also a solution that was produced in this study that also looked at the presence of operational uncertainty in combination with organisational learning and artificial intelligence. This configuration is similar to some of the configurations proposed for other scenarios. AI, FPMC and SPSI can potentially help to manage the operational uncertainty due to geopolitical tensions. SPSI and FPMC are mainly facilitate by AI, IoT and Blockchain. At the same time, the analysis shows that to effectively manage the operational uncertainty of energy stability and security, the firm needs technologies capable of scenario planning and supply chain integration, real-time system and process monitoring, root cause analysis, and sustainable solutions, with AI and BDA. In addition, augmented reality (AR) and virtual reality (VR). AR and VR can be used for different training experiences and applications (Xie et al., 2021).
PwC (2024) South Africa manufacturing analysis highlights the steps the manufacturing firm can implement to improve their business, including strengthening the supply chain with IoT AI and specifically sensors, robotics, and decision intelligence systems. These assertions are in agreement with the solutions from fsQCA for sustained performance during the time of growing geopolitical tensions, which are combinations of Industry 4.0 and 5.0 capabilities and organisational learning.
In this study a framework was developed that provides the outcome of the configurations model (Figure 5). This starts with the existence of operational uncertainty showing how the associated dimensions influence manufacturing operations from supply chain disruption through increase in the cost of production, market access restrictions to compromise knowledge management. Industry 4.0 and 5.0 technologies are available to business managers who can use these technologies to manage these operational determinants. This analysis leads to operational improvement and sustained high performance with particular configurations.
5.2. Theoretical Perspective
The study focused on the extension of the theory, within the area of operations management in the manufacturing sector, using an integrated approach which allowed modification of the neo-configurational theory proposed by Misangyi et al. (2017). Misangyi et al. (2017) argued that QCA emerged as part of the second wave of configurational management development to deal with the "void in tools capable of fully capturing causal complexity. Miller (2018) recommended strengthening empirical research using QCA, using theory and conceptual debates to guide research, employing case narratives to guide research scope and interpret profiles, blending quantitative and qualitative analyses, and establishing the significance of configurations, among other things. Greckhamer et al. (2018, p.492) confirmed that the neo-configurational perspective was driven by a set-analytic approach and went further explaining that unlike Miller (2018), the “neo-configurational perspective is ‘scale-free’ because it applies not only to the organisational level, but also to phenomena at the intra-organisational and supra-organisational levels. Thus, this study discusses the modified theoretical perspective from the premise of the neo-configurational theory, while also considering some of recommendations of the Miller (2018) and the response of Greckhamer et al. (2018).
This study employed an integrated approach of fuzzy-DEMATEL with PLS-SEM and QCA for the modified neo-configurational theory. The fuzzy-DEMATEL is a useful hybrid approach that not only integrates both qualitative and quantitative data, but it also leverages fuzzy logic to handle the inherent uncertainty and subjectivity in qualitative assessments (Lin, 2014; Yeh and Huang, 2014). The research method used in the present study obtained qualitative evaluations from experts, which were then integrated with quantitative data to form a comprehensive analysis framework (Jin, 2022). Thus, this approach takes into account the recommendation of Miller (2018) to combine quantitative and qualitative analyses and Greckhamer et al. (2018) to build conceptually meaningful and empirically configurational theory. Importantly, when building theory falsifiability and utility should be used as the two criteria for evaluating the theory (Bacharach , 1989).
The falsifiability assesses whether the theory is constructed in such a way that it is empirically refutable. The study provides evidence of the falsifiability of this theoretical perspective (Bacharach, 1989). The critical components of a theory are indicators, constructs, and their relationships. Guided by the limits, a theory evaluation was performed using propositions. Good theory-building research methods are those that, like a theory itself, we specified the variables which are also causal conditions, which are the operational uncertainty and its dimensions, Industry 4.0 and 5.0 technologies contribute, and organisational learning with the outcome being sustained performance. Furthermore, there was a narrow focus on a specific topic on operational uncertainty and management using Industry 4.0 and 5.0 technologies; these technologies benefit from these technologies showing clear, coherent, causal chain constructs, and offer the relevant propositions (Wacker, 1998). The indicators showed adequate variance for logical analysis and adequate reliability for stability. The falsifiability of the constructs was determined with convergence validity using AVE, discriminant validity with the Fornell-Larcker criterion, cross-loadings, and the Heterotrait-Monotrait criterion (HTMT). It was also carried out with predictive validity based on the explanatory power, R2, effect size, f2 and predictive relevance, Q2 (Hair et al., 2019). Utility analysis determines whether the theory is useful, can be explained, and can predict the constructs, variables, and their links. In addition, utility evaluates whether the theory includes both the logical, which involves scope, and the empirical, which provides for explanation and prediction. This was confirmed in the present study with different methods, fuzzy-DEMATEL, PLS-SEM, and QCA. The scope must ensure that the variables included in the theoretical system are sufficient but parsimonious (Bacharach, 1989).
This modified neo-configurational theoretical perspective subscribes to the same foundational core tenets of causal asymmetry, conjunctural causation, and equifinality (Meuer and Fiss, 2020). The new wave of research directly focuses on causal complexity (Misangyi et al., 2017), the neo-configurational perspective enables researchers to more adequately theorise and empirically examine causal complexity, and this expectation is similar to the modified neo-configuration theory. Causal asymmetry was assumed testing the overall operational uncertainty for the presence and absence of the outcome. There was also conjunctural causation and evidence of equifinality with four solutions for a growing political tensions-based model and five solutions for an energy stability and security-based model that would lead to sustained high performance. Based on structure and levels of operational uncertainty, there is evidence of emergence tenets. This study postulates that there is a need for an additional tenet, an emergent core tenet in neo-configurational theory. This is as was evident from the empirical analysis that operational certainty has multiple dimensions. To help understand this complex phenomenon through the interplay of multiple causal dimensions. rather than isolating single mechanisms. This tenet is mainly associated with the complexity theory (Turner and Baker, 2019). However, it explains that the emergence occurs when systems properties or levels of the complex firms are generated by agent self-organisation. This is especially relevant because emergence and causality are interconnected, with new causality arising at higher levels of abstraction that cannot be attributed to individual properties alone (Yuan et al., 2023). The emergent change, which is based on Industry 4.0 and 5.0 technologies and organisational learning, can generally arise in reaction to external environment alterations, which can be diverse. Emergent change enables firms to maintain adaptability and responsiveness to unplanned or unforeseen changes. As such, this modified neo-configurational theoretical perspective subscribes to core tenets of configurational theory and the emergent tenet of complexity theory.
6. Conclusions
The study concludes that the growing geopolitical tension, the change in consumer behaviour driven by the cost of living, pandemic turbulence, lack of energy stability and security, and entrenchment power of large firms are causal dimensions of operational uncertainty. These causal dimensions were used for the PLS-SEM and fsQCA analysis, with the results showing a negative significant relationship between the two dimensions, growing political tension and energy stability, and security uncertainty with sustained performance. Industry 4.0 and 5.0 technologies with capabilities for scenario planning and supply chain integration, flexible production and mass customisation, real-time system and process monitoring and response, root cause analysis, and sustainable solutions can manage operational uncertainty. These technologies are artificial intelligence, the Internet of Things, big data analytics and, to a lesser extent, advanced robotics, blockchain, and augmented and virtual reality.
The study advanced the modified neo-configuration theory and a new integrated methodology (fuzzy-DEMATEL-PLS-SEM-fsQCA) to develop solutions for sustained performance during operational uncertainty in manufacturing. This research offers valuable information to advance the subject and make meaningful changes in day-to-day manufacturing operations and promote practical real-world issue solving. There are several limitations to the study worthy of highlighting. Industry 4.0 and 5.0 technologies were not exhaustive. The study acknowledges that there are other integrated Industry 4.0 and 5.0 technologies and/or individual technology extensions that form smart factories in manufacturing that can be employed to manage operational uncertainty. Also, fsQCA though partially advanced the theory, it did not fully advance the theory as not all cases were above the consistency above 0.80 (Papas and Woodside, 2021). This study should serve as a base for further research on managing of operational uncertainty with Industry 4.0 and 5.0 technologies. Further research need to be done to manage operational uncertainty with technology. It can include research from BRICS+ partner countries such as China (Asif et al., 2024; Liu et al., 2022; Wang et al., 2023) and India (Gupta et al., 2021) as they are advanced in Industry 4.0 and 5.0 technologies and integration to manufacturing to improve efficiency and competitiveness.
References
- Abdullah, F.M., Al-Ahmari, A.M., Anwar, S., 2023. A Hybrid Fuzzy Multi-Criteria Decision-Making Model for Evaluating the Influence of Industry 4.0 Technologies on Manufacturing Strategies. Machines 11, 310. [CrossRef]
- Akundi, A., Euresti, D., Luna, S., Ankobiah, W., Lopes, A., Edinbarough, I., 2022. State of Industry 5.0—Analysis and Identification of Current Research Trends. Appl. Syst. Innov. 5, 27. [CrossRef]
- Alsamhi, M.H., Al-Ofairi, F.A., Farhan, N.H.S., Al-ahdal, W.M., Siddiqui, A., 2022. Impact of Covid-19 on firms’ performance: Empirical evidence from India. Cogent Bus. Manag. 9, 2044593. [CrossRef]
- Ambrosini, V., Collier, N., Jenkins, M. 2009. A configurational approach to the dynamics of firm level knowledge. Journal of Strategy and Management, 2(1), 4–30.
- Aryeetey, E., Baffour, P.T., 2022. African competitiveness and the business environment: Does manufacturing still have a role to play? J. Afr. Econ. 31, i33–i58.
- Asif, M., Yang, L., Hashim, M., 2024. The role of digital transformation, corporate culture, and leadership in enhancing corporate sustainable performance in the manufacturing sector of China. Sustainability 16, 2651.
- Attiah, E., 2019. The Role of Manufacturing and Service Sectors in Economic Growth: An Empirical Study of Developing Countries. Eur. Res. Stud. J. XXII, 112–127. [CrossRef]
- Bacharach, S. B., 1989. Organizational Theories: Some Criteria for Evaluation. The Academy of Management Review, 14(4), 496. [CrossRef]
- Basten, D., Haamann, T., 2018. Approaches for Organizational Learning: A Literature Review. Sage Open 8, 2158244018794224. [CrossRef]
- Belhadi, A., Kamble, S., Subramanian, N., Singh, R.K., Venkatesh, M., 2024. Digital capabilities to manage agri-food supply chain uncertainties and build supply chain resilience during compounding geopolitical disruptions. Int. J. Oper. Prod. Manag. 44, 1914–1950. [CrossRef]
- Brownstein, N.C., Louis, T.A., O’Hagan, A., Pendergast, J., 2019. The Role of Expert Judgment in Statistical Inference and Evidence-Based Decision-Making. Am. Stat. 73, 56–68. [CrossRef]
- Byrne, D., 2005. Complexity, Configurations and Cases. Theory, Culture & Society, 22, 5, 95–111. [CrossRef]
- Cangialosi, N., 2023. Fuzzy-Set Qualitative Comparative Analysis (fsQCA) in Organizational Psychology: Theoretical Overview, Research Guidelines, and A Step-By-Step Tutorial Using R Software. Span. J. Psychol. 26, e21. [CrossRef]
- Cantore, N., Clara, M., Lavopa, A., Soare, C., 2017. Manufacturing as an engine of growth: Which is the best fuel? Struct. Change Econ. Dyn. 42, 56–66. [CrossRef]
- Charoenwong, B., Han, M., Wu, J., 2023. Trade and Foreign Economic Policy Uncertainty in Supply Chain Networks: Who Comes Home? Manuf. Serv. Oper. Manag. 25, 126–147. [CrossRef]
- Charpin, R., Cousineau, M., 2024. Friendshoring: how geopolitical tensions affect foreign sourcing, supply base complexity, and sub-tier supplier sharing. Int. J. Oper. Prod. Manag.
- Choi, T., Cheng, T.C.E., Zhao, X., 2016. Multi-Methodological Research in Operations Management. Prod. Oper. Manag. 25, 379–389. [CrossRef]
- Cohen, J, 1988. Set Correlation and Contingency Tables. Applied Psychological Measurement, 12(4), 425–434. [CrossRef]
- Cooper, B., Glaesser, J., 2016. Exploring the robustness of set theoretic findings from a large n fsQCA: an illustration from the sociology of education. Int. J. Soc. Res. Methodol. 19, 445–459. [CrossRef]
- Cochran, W. G., 1977. Sampling techniques. Johan Wiley & Sons Inc.
- Dewa, M., Van Der Merwe, A., & Matope, S., 2020. Production scheduling heuristics for frequent load-shedding scenarios: a knowledge engineering approach. South African Journal of Industrial Engineering, 31, 3. [CrossRef]
- Dong, Y., Peng, C.-Y.J., 2013. Principled missing data methods for researchers. SpringerPlus 2, 222. [CrossRef]
- Fiss, P. C. (2011). Building Better Causal Theories: A Fuzzy Set Approach to Typologies in Organization Research. Academy of Management Journal, 54, 2, 393–420. [CrossRef]
- Fiss, P. C., Marx, A., & Cambré, B., 2013. Chapter 1 configurational theory and methods in organizational research: Introduction. In Configurational theory and methods in organizational research (pp. 1–22). Emerald Group Publishing Limited. Available online: https://www.emerald.com/insight/content/doi/10.1108/S0733-558X(2013)0000038005/full/html.
- Greckhamer, T., Furnari, S., Fiss, P.C., Aguilera, R.V., 2018. Studying configurations with qualitative comparative analysis: Best practices in strategy and organization research. Strateg. Organ. 16, 482–495. [CrossRef]
- Gupta, H., Kumar, A., Wasan, P., 2021. Industry 4.0, cleaner production and circular economy: An integrative framework for evaluating ethical and sustainable business performance of manufacturing organizations. J. Clean. Prod. 295, 126253.
- Hair, J.F., Risher, J.J., Sarstedt, M. and Ringle, C.M., 2019. When to use and how to report the results of PLS-SEM. European business review, 31, 1, 2-24.
- Hauge, J., 2023. Manufacturing-led development in the digital age: how power trumps technology. Third World Q. 44, 1960–1980. [CrossRef]
- Henseler, J., Dijkstra, T.K., Sarstedt, M., Ringle, C.M., Diamantopoulos, A., Straub, D.W., Ketchen, D.J., Hair, J.F., Hult, G.T.M., Calantone, R.J., 2014. Common Beliefs and Reality About PLS: Comments on Rönkkö and Evermann (2013). Organ. Res. Methods 17, 182–209. [CrossRef]
- Hu, L., Bentler, P.M., 1998. Fit indices in covariance structure modeling: Sensitivity to underparameterized model misspecification. Psychol. Methods 3, 424–453. [CrossRef]
- Huang, S., Burton-Jones, A., Xu, D., 2024. A configurational theory of digital disruption. Inf. Syst. J. 34, 1737–1786. [CrossRef]
- Iannacci, F., & Kraus, S., 2022. Configurational theory: A review. TheoryHub. Book (ISBN: 978-1-7396044-0-0).
- Ivaldi, S., Scaratti, G. and Fregnan, E., 2022. Dwelling within the fourth industrial revolution: organizational learning for new competences, processes and work cultures. Journal of Workplace Learning, 34, 1, 1-26.
- Jassbi, J., Mohamadnejad, F., & Nasrollahzadeh, H. 2011. A Fuzzy DEMATEL framework for modeling cause and effect relationships of strategy map. Expert Systems with Applications, 38(5), 5967–5973. [CrossRef]
- Jin, W., 2022. An expanded DEMATEL decision-making method by mixing qualitative and quantitative data, in: Wu, F., Liu, J., Chen, Y. (Eds.), International Conference on Computer Graphics, Artificial Intelligence, and Data Processing (ICCAID 2021). Presented at the International Conference on Computer Graphics, Artificial Intelligence, and Data Processing (ICCAID 2021), SPIE, Harbin, China, p. 10. [CrossRef]
- Jordan, P.J., Troth, A.C., 2020. Common method bias in applied settings: The dilemma of researching in organizations. Aust. J. Manag. 45, 3–14. [CrossRef]
- Kan, K., Mativenga, P., & Marnewick, A., 2020. Understanding energy use in the South African manufacturing industry. Procedia CIRP, 91, 445–451. [CrossRef]
- Kumar, S., Tiwari, P., Zymbler, M., 2019. Internet of Things is a revolutionary approach for future technology enhancement: a review. J. Big Data 6, 111. [CrossRef]
- Leydesdorff, L., 2008. Configurational Information as Potentially Negative Entropy: The Triple Helix Model. Entropy 10, 391–410. [CrossRef]
- Li, Mingxing, Qu, T., Yan, M., Li, Ming, He, Z., Huang, G.Q., 2024. Out-of-Order Architecture for Real-Time Data-Driven Resilient Planning and Scheduling of Cyber-Physical Manufacturing Systems, in: 2024 IEEE 20th International Conference on Automation Science and Engineering (CASE). Presented at the 2024 IEEE 20th International Conference on Automation Science and Engineering (CASE), IEEE, Bari, Italy, pp. 3328–3333. [CrossRef]
- Lin, P.H., 2014. A General Framework of Dealing with Qualitative Data in DEA: A Fuzzy Number Approach, in: Emrouznejad, A., Tavana, M. (Eds.), Performance Measurement with Fuzzy Data Envelopment Analysis, Studies in Fuzziness and Soft Computing. Springer Berlin Heidelberg, Berlin, Heidelberg, pp. 61–87. [CrossRef]
- Liu, J., Qian, Y., Yang, Y., Yang, Z., 2022. Can artificial intelligence improve the energy efficiency of manufacturing companies? Evidence from China. Int. J. Environ. Res. Public. Health 19, 2091.
- López-Ospina, H., Pardo, D., Rojas, A., Barros-Castro, R., Palacio, K., & Quezada, L., 2022. A revisited fuzzy DEMATEL and optimization method for strategy map design under the BSC framework: selection of objectives and relationships. Soft Computing, 26(14), 6619-6644.
- Malacina, I., Lintukangas, K., 2024. On the edge: a multilevel perspective on innovation complexities and dynamic attractors in the supply network. Int. J. Oper. Prod. Manag. [CrossRef]
- Marcinkiewicz, E. (2017). Pension Systems Similarity Assessment: An Application of Kendall’s W to Statistical Multivariate Analysis. Contemporary Economics, II, 303-314. Available online: https://ssrn.com/abstract=3197225.
- Mashapu, L. D., & Mathaba, T. N. D., 2024. The Economic Impact of Load Shedding in Industry: A South African Case Study. 2024 International Conference on Electrical, Computer and Energy Technologies (ICECET, 1–6. [CrossRef]
- Mejía Trejo, J., 2023. Qualitative Comparative Analysis. VOLUME II. FUZZY-SET (fsQCA) Theory and Practice, Primera edicion. ed. Academia Mexicana de Investigación y Docencia en Innovación SC (AMIDI). [CrossRef]
- Meuer, J., & Fiss, P. C., 2020. Qualitative comparative analysis in business and management research. In Oxford research encyclopedia of business and management. Oxford University Press. Available online: https://www.peerfiss.com/s/Meuer-Fiss-ORE-2020.pdf.
- Miller, D., 2018. Challenging trends in configuration research: Where are the configurations? Strategic Organization, 16(4), 453–469. [CrossRef]
- Misangyi, V.F., Greckhamer, T., Furnari, S., Fiss, P.C., Crilly, D., Aguilera, R., 2017. Embracing Causal Complexity: The Emergence of a Neo-Configurational Perspective. J. Manag. 43, 255–282. [CrossRef]
- Morse, J.M., 2003. Principles of Mixed Methods. Handb. Mix. Methods Soc. Behav. Res. 189.
- Moslem, S., Ghorbanzadeh, O., Blaschke, T., Duleba, S., 2019. Analysing Stakeholder Consensus for a Sustainable Transport Development Decision by the Fuzzy AHP and Interval AHP. Sustainability 11, 3271. [CrossRef]
- Mtotywa, M.M., Mohapeloa, M, 2025. Multidimensionality of operational uncertainty in manufacturing: Exploring emergent and non-linearity perspective. Unpublished.
- Ndung’u, N., Shimeles, A., Ngui, D., 2022. The Old Tale of the Manufacturing Sector in Africa: The Story Should Change. J. Afr. Econ. 31, i3–i9.
- Nnyanzi, J.B., Kavuma, S., Sseruyange, J., Nanyiti, A., 2022. The manufacturing output effects of infrastructure development, liberalization and governance: evidence from Sub-Saharan Africa. J. Ind. Bus. Econ. 49, 369–400. [CrossRef]
- Nulty, D.D., 2008. The adequacy of response rates to online and paper surveys: what can be done? Assess. Eval. High. Educ. 33, 301–314. [CrossRef]
- Oana, I.-E., Schneider, C.Q., Thomann, E., 2021. Qualitative comparative analysis using R: A beginner’s guide. Cambridge University Press.
- Pappas, I.O., Woodside, A.G., 2021. Fuzzy-set Qualitative Comparative Analysis (fsQCA): Guidelines for research practice in Information Systems and marketing. Int. J. Inf. Manag. 58, 102310. [CrossRef]
- Park, Y., Mithas, S., 2020. Organized complexity of digital business strategy: A configurational perspective. Mis Q. 44.
- Pattyn, V., Álamos-Concha, P., Cambré, B., Rihoux, B., Schalembier, B., 2022. Policy Effectiveness through Configurational and Mechanistic Lenses: Lessons for Concept Development. J. Comp. Policy Anal. Res. Pract. 24, 33–50. [CrossRef]
- Pla-Barber, J., Villar, C., & Benito-Sarriá, G., 2020. Configurational Theory in Traditional Manufacturing Industries: A New Model of High-Performing Small and Medium-Sized Enterprises. Sustainability, 12, 17, 6818. [CrossRef]
- Ragin, C.C., 2009. Measurement Versus Calibration: A Set-Theoretic Approach, in: Box-Steffensmeier, J.M., Brady, H.E., Collier, D. (Eds.), The Oxford Handbook of Political Methodology. Oxford University Press, pp. 174–198. [CrossRef]
- Rasoolimanesh, S.M., Ringle, C.M., Sarstedt, M., Olya, H., 2021. The combined use of symmetric and asymmetric approaches: partial least squares-structural equation modeling and fuzzy-set qualitative comparative analysis. Int. J. Contemp. Hosp. Manag. 33, 1571–1592. [CrossRef]
- Rodrik, D., 2018. An African growth miracle? J. Afr. Econ. 27, 10–27.
- Sammut-Bonnici, T., 2014. Complexity theory.
- Schneider, C.Q., Wagemann, C., 2012. Set-theoretic methods for the social sciences: A guide to qualitative comparative analysis. Cambridge University Press.
- Shi, R., He, Y., Cai, Y., Yang, X., Feng, T., 2023. An Uncertain Operational Risk-Oriented Approach for Manufacturing System Functional Failure Prognosis, in: 2023 Global Reliability and Prognostics and Health Management Conference (PHM-Hangzhou). Presented at the 2023 Global Reliability and Prognostics and Health Management Conference (PHM-Hangzhou), IEEE, Hangzhou, China, pp. 1–6. [CrossRef]
- Shieh, J.-I., Wu, H.-H., 2016. Measures of Consistency for DEMATEL Method. Commun. Stat. - Simul. Comput. 45, 781–790. [CrossRef]
- Shmueli, G., Sarstedt, M., Hair, J.F., Cheah, J.-H., Ting, H., Vaithilingam, S., Ringle, C.M., 2019. Predictive model assessment in PLS-SEM: guidelines for using PLSpredict. Eur. J. Mark. 53, 2322–2347. [CrossRef]
- Shrout, P.E., Fleiss, J.L., 1979. Intraclass correlations: Uses in assessing rater reliability. Psychol. Bull. 86, 420–428. [CrossRef]
- Signé, L., Johnson, C., 2018. The potential of manufacturing and industrialization in Africa. Afr. Growth Initiat.
- South African Reserve Bank, 2020. Occasional Bulletin of Economic Notes OBEN/20/01.
- Suhan, S, Achar, A.P., 2016. Assessment of PLS-SEM Path Model for Coefficient of Determination and Predictive Relevance of Consumer Trust on Organic Cosmetics. Ushus - J. Bus. Manag. 15, 1–19. [CrossRef]
- Sukhov, A., Friman, M., Olsson, L.E., 2023. Unlocking potential: An integrated approach using PLS-SEM, NCA, and fsQCA for informed decision making. J. Retail. Consum. Serv. 74, 103424. [CrossRef]
- Szirmai, A. 2012. Industrialisation as an engine of growth in developing countries, 1950–2005. Struct. Change Econ. Dyn. 23, 406–420. [CrossRef]
- Tan, F.Z. and Olaore, G.O., 2021. Effect of organizational learning and effectiveness on the operations, employees productivity and management performance. Vilakshan-XIMB Journal of Management, 19(2), 110-127.
- Teles, J. (2012). Concordance coefficients to measure the agreement among several sets of ranks. Journal of Applied Statistics, 39(8), 1749–1764. [CrossRef]
- Turner, J. R., & Baker, R. M. (2019). Complexity Theory: An Overview with Potential Applications for the Social Sciences. Systems, 7(1), 4. [CrossRef]
- Thiem, A. 2016. Standards of good practice and the methodology of necessary conditions in qualitative comparative analysis. Polit. Anal. 24, 478–484.
- United Nations Industrial Development Organisation, 2020. UNIDO: Industrial development report 2020: Industrializin... - Google Scholar [WWW Document]. Available online: https://scholar.google.com/scholar_lookup?title=Industrial%20development%20report%202020.%20Industrializing%20in%20the%20digital%20age&author=UNIDO&publication_year=2019 (accessed on 12 March 2024).
- United Nations Industrial Development Organisation (UNIDO), 2024. South Africa Competitive Industrial Performance Index 2024.
- Wacker, J. G., 1998. A definition of theory: research guidelines for different theory-building research methods in operations management. Journal of operations management, 16(4), 361-385.
- Walker, R.M., Chen, J., Aravind, D., 2015. Management innovation and firm performance: An integration of research findings. Eur. Manag. J. 33, 407–422. [CrossRef]
- Wan, X., Kazmi, S.A.A., Wong, C.Y., 2022. Manufacturing, Exports, and Sustainable Growth: Evidence from Developing Countries. Sustainability 14, 1646. [CrossRef]
- Wang, K.-L., Sun, T.-T., Xu, R.-Y., 2023. The impact of artificial intelligence on total factor productivity: empirical evidence from China’s manufacturing enterprises. Econ. Change Restruct. 56, 1113–1146.
- Wellman, N., Tröster, C., Grimes, M., Roberson, Q., Rink, F., Gruber, M., 2023. Publishing Multimethod Research in AMJ: A Review and Best-Practice Recommendations. Acad. Manage. J. 66, 1007–1015. [CrossRef]
- Woodside, A.G., Nagy, G., Megehee, C.M., 2018. Applying complexity theory: A primer for identifying and modeling firm anomalies. J. Innov. Knowl. 3, 9–25. [CrossRef]
- World Bank Group, 2024. Manufacturing, value added (% of GDP) - South Africa.
- Xie, B., Liu, H., Alghofaili, R., Zhang, Y., Jiang, Y., Lobo, F. D., Li, C., Li, W., Huang, H., Akdere, M., Mousas, C., & Yu, L.-F. , 2021. A Review on Virtual Reality Skill Training Applications. Frontiers in Virtual Reality, 2, 645153. [CrossRef]
- Yeh, T.-M., & Huang, Y.-L. (2014). Factors in determining wind farm location: Integrating GQM, fuzzy DEMATEL, and ANP. Renewable Energy, 66, 159–169. [CrossRef]
- Yuan, B., Jiang, Z., Lyu, A., Wu, J., Wang, Z., Yang, M., Liu, K., Mou, M., Cui, P., 2023. Emergence and Causality in Complex Systems: A Survey on Causal Emergence and Related Quantitative Studies. [CrossRef]
- Yusif, S., Hafeez-Baig, A., Soar, J., Teik, D.O.L., 2020. PLS-SEM path analysis to determine the predictive relevance of e-Health readiness assessment model. Health Technol. 10, 1497–1513. [CrossRef]
Figure 1.
Configurations of the study.
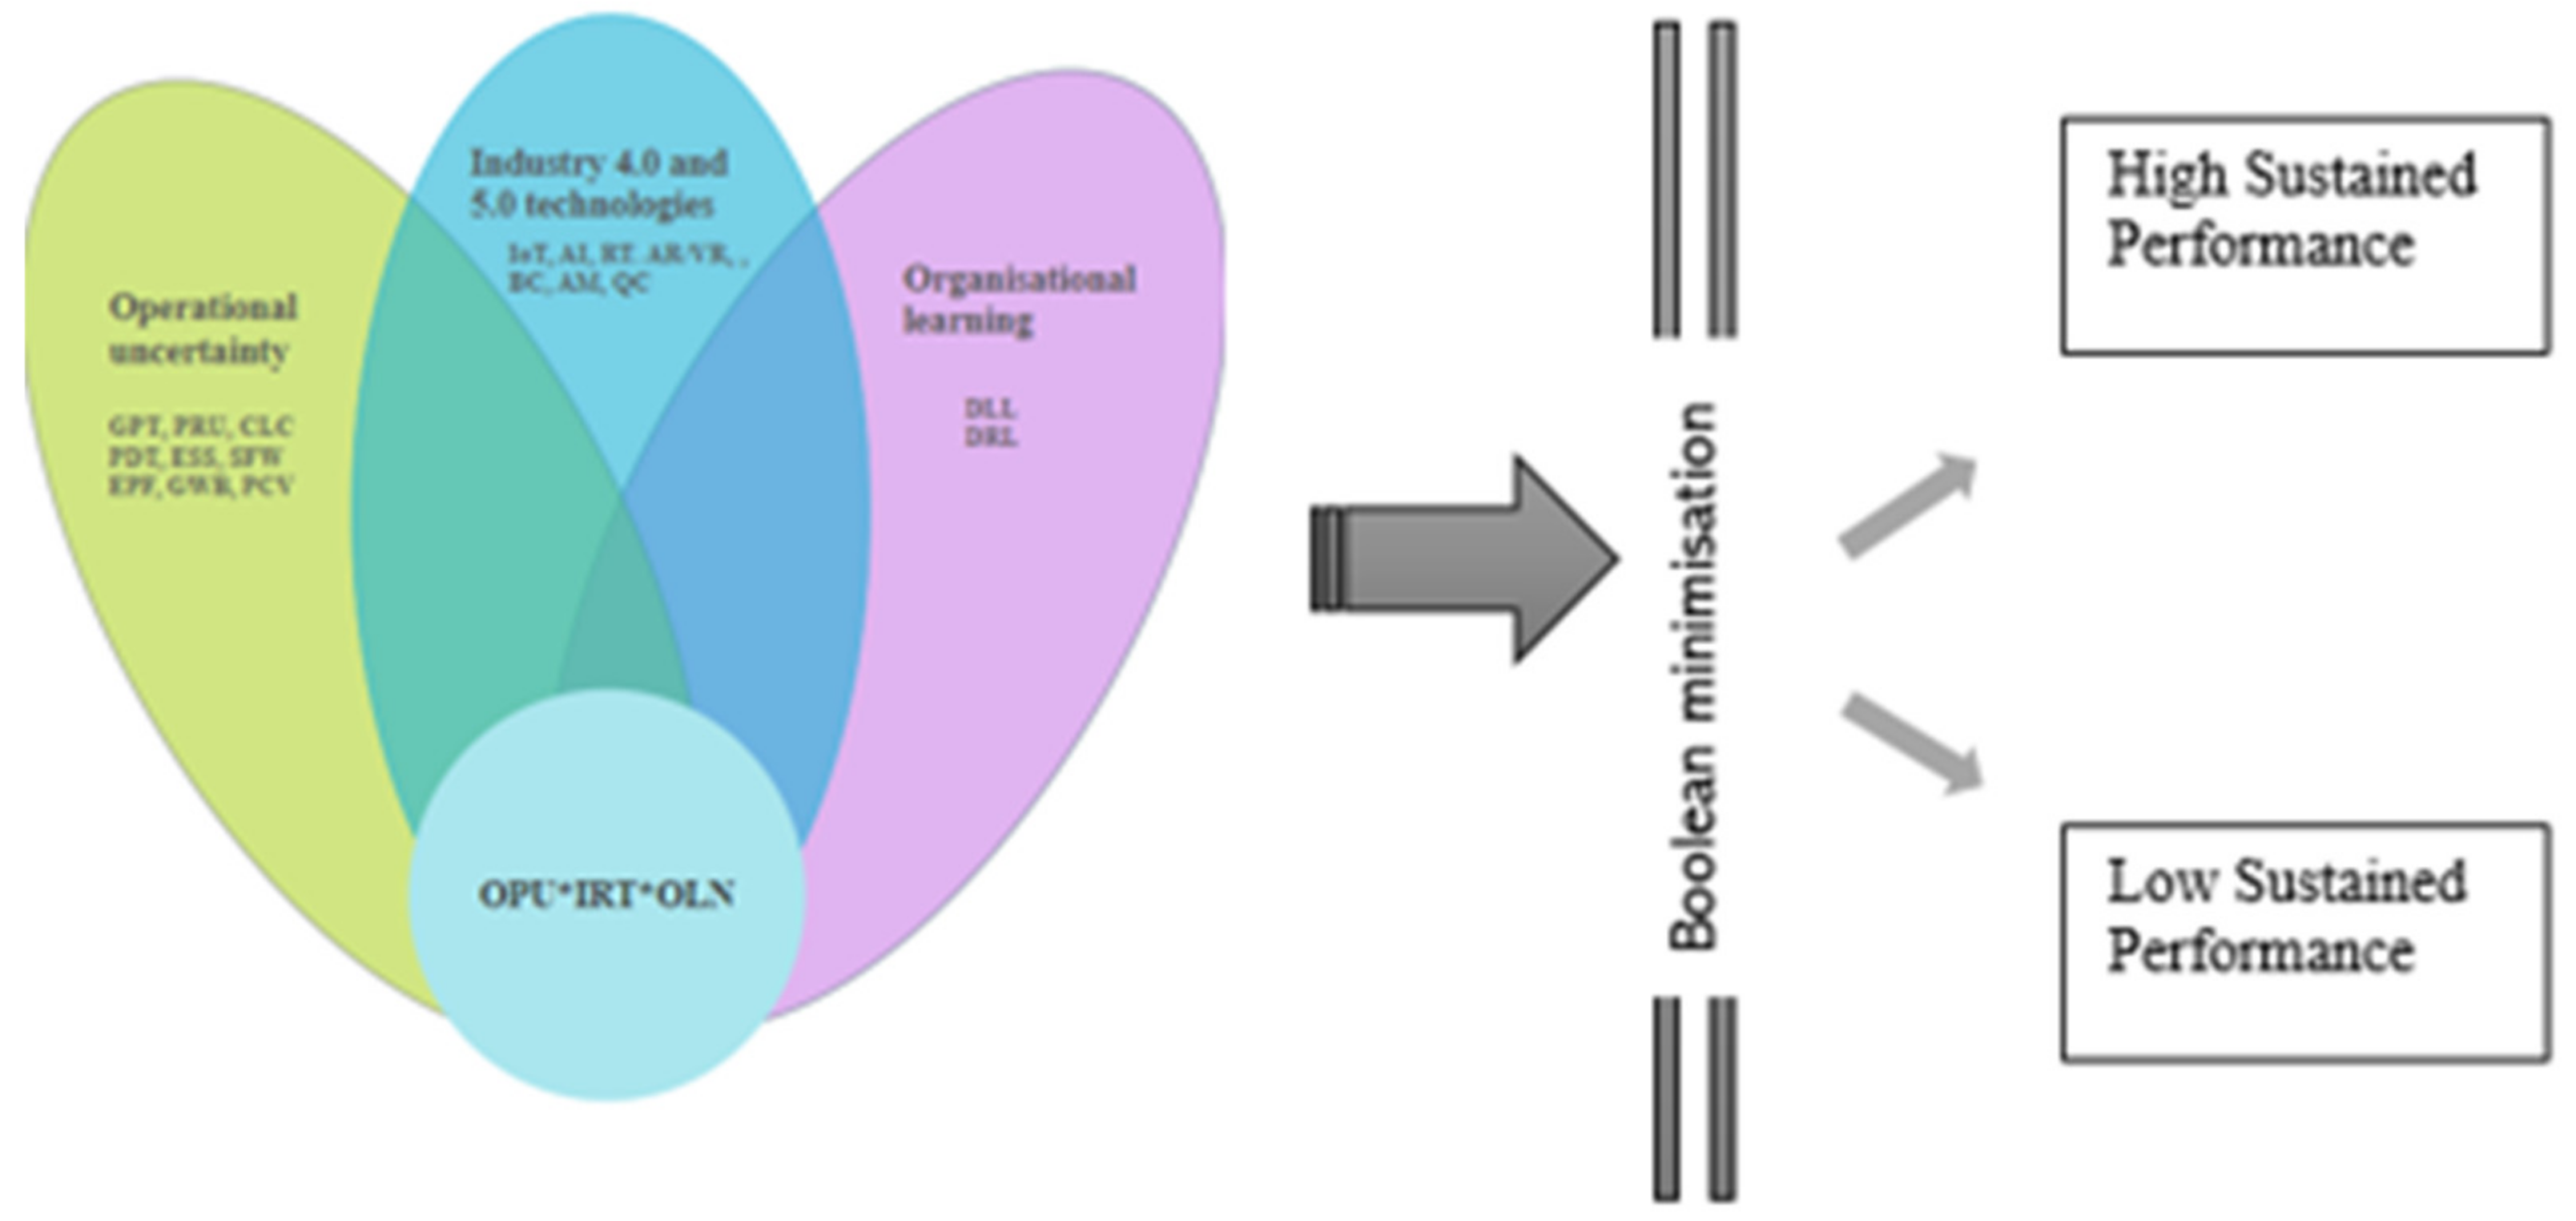
Figure 2.
Cause-effect diagram.
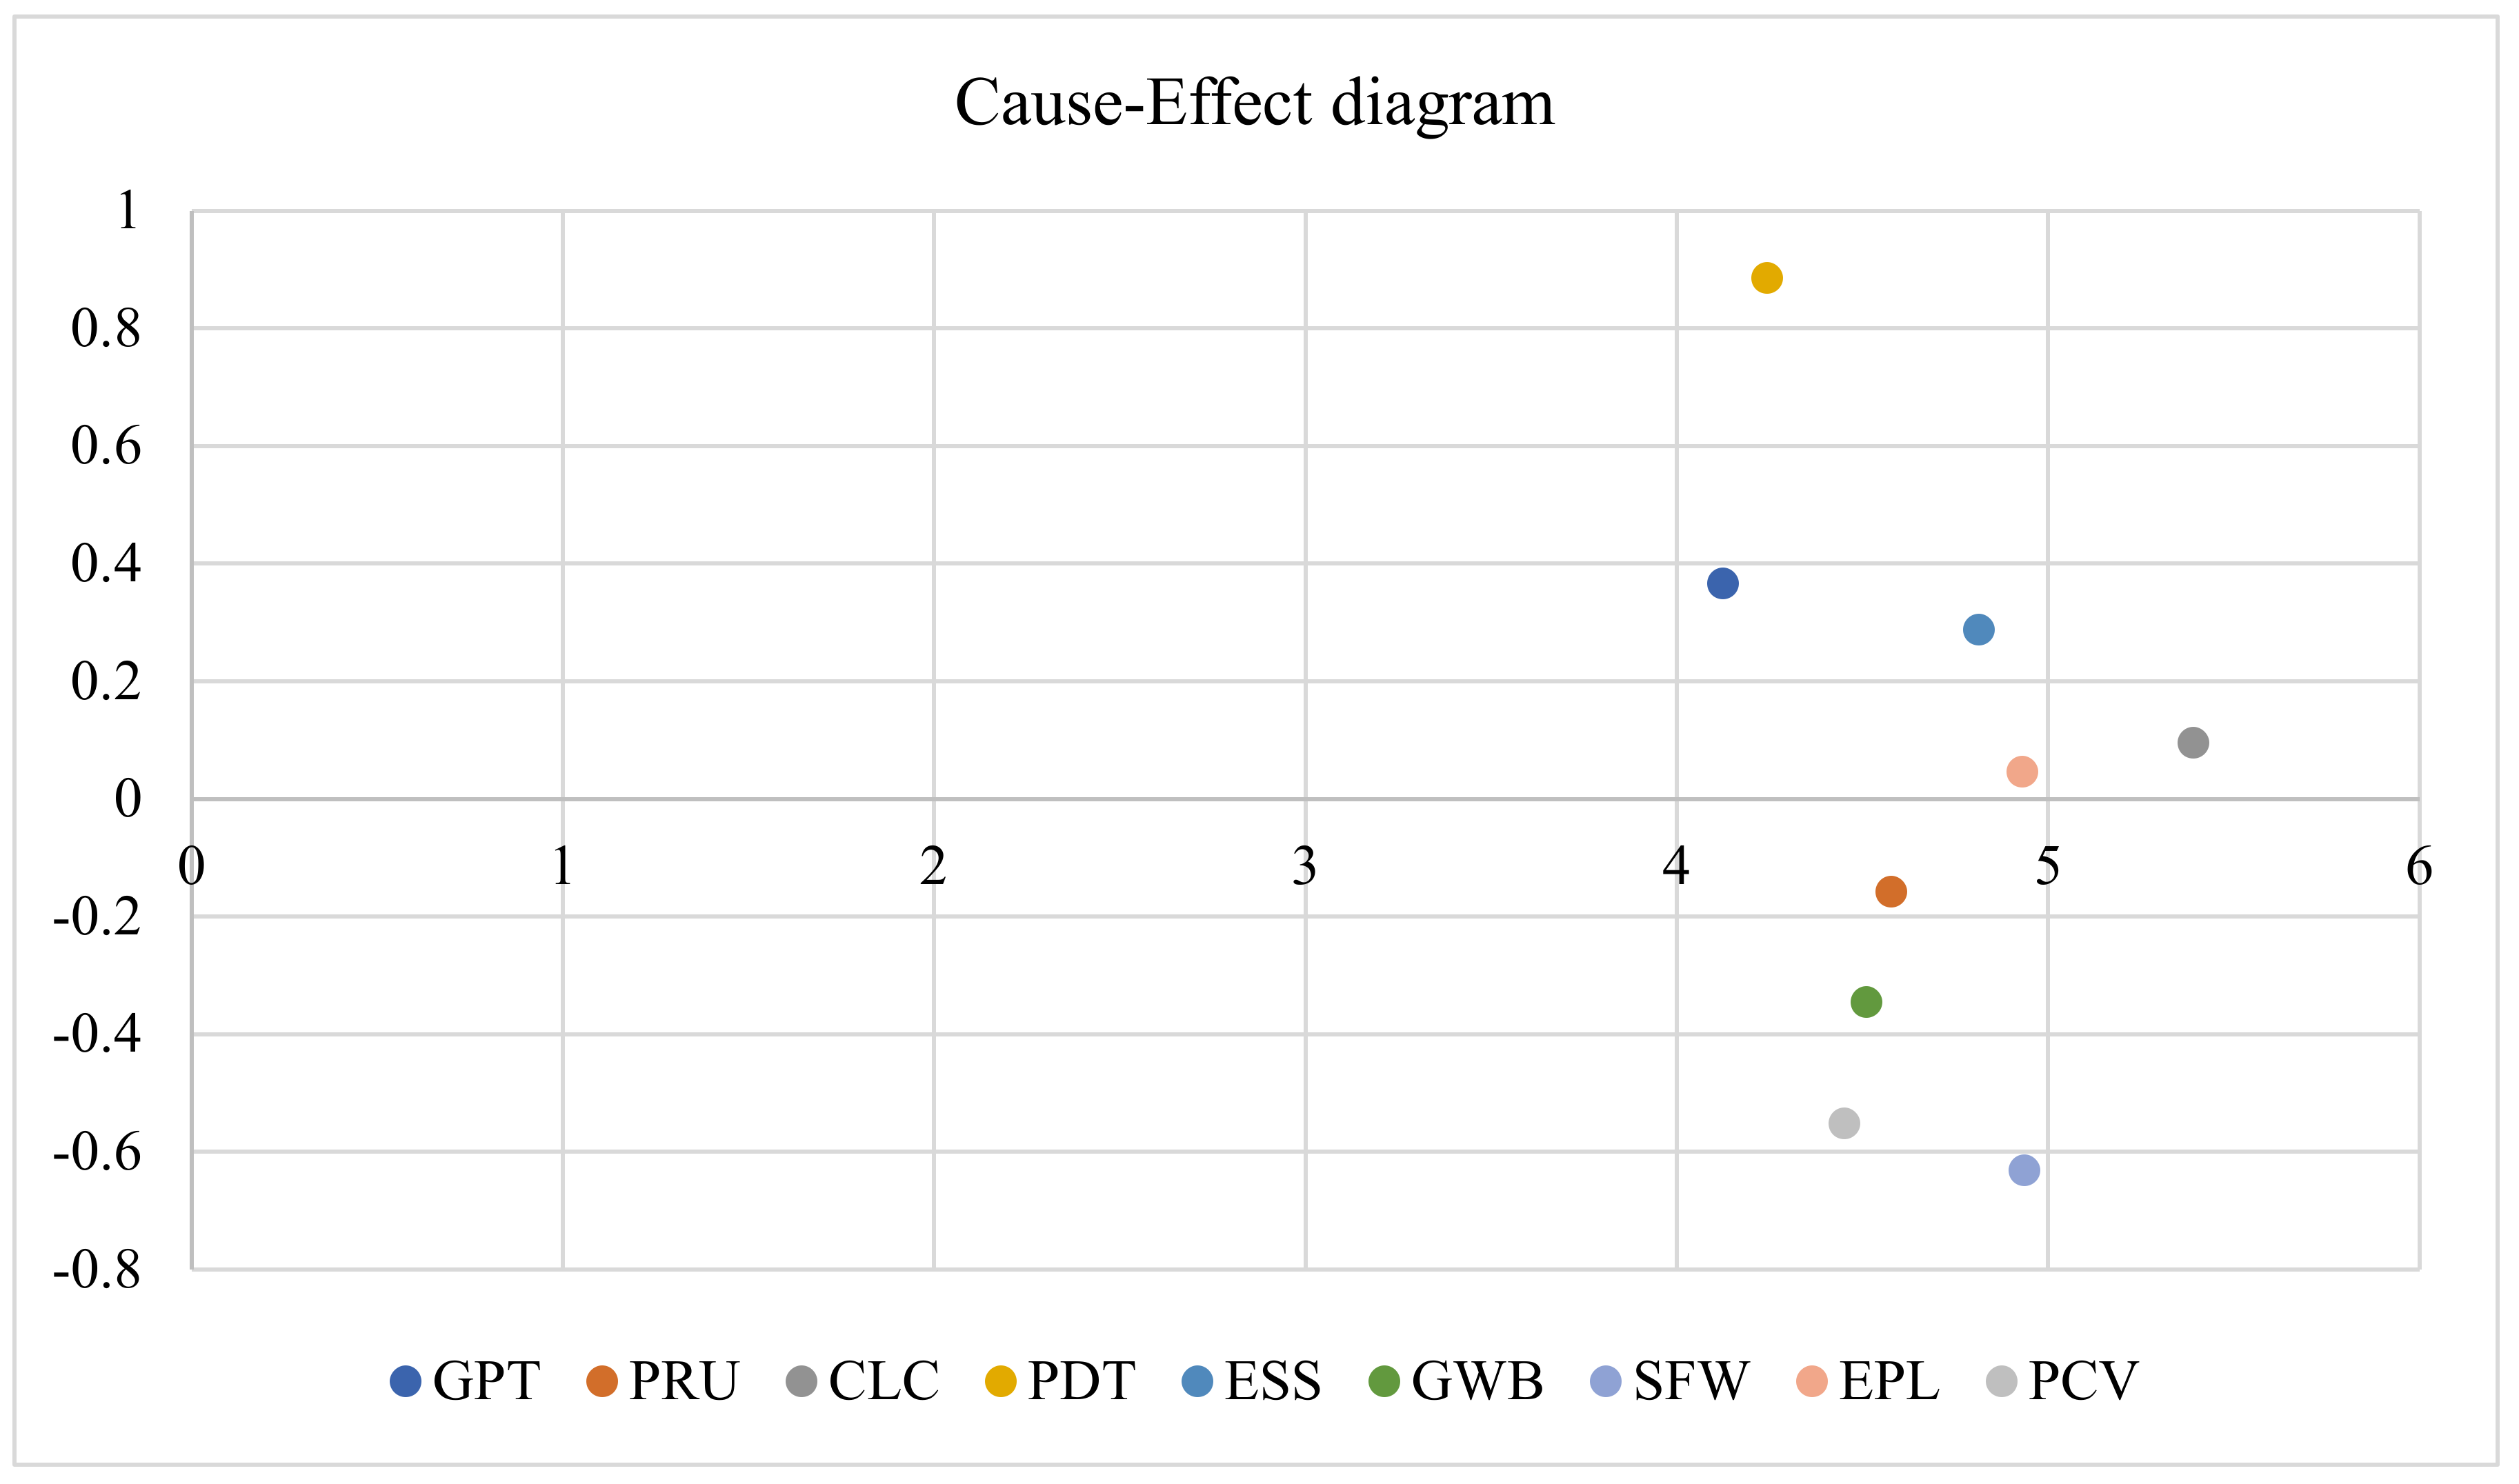
Figure 3.
Measurement and structural model of the causal conditions with outcome, SPF.
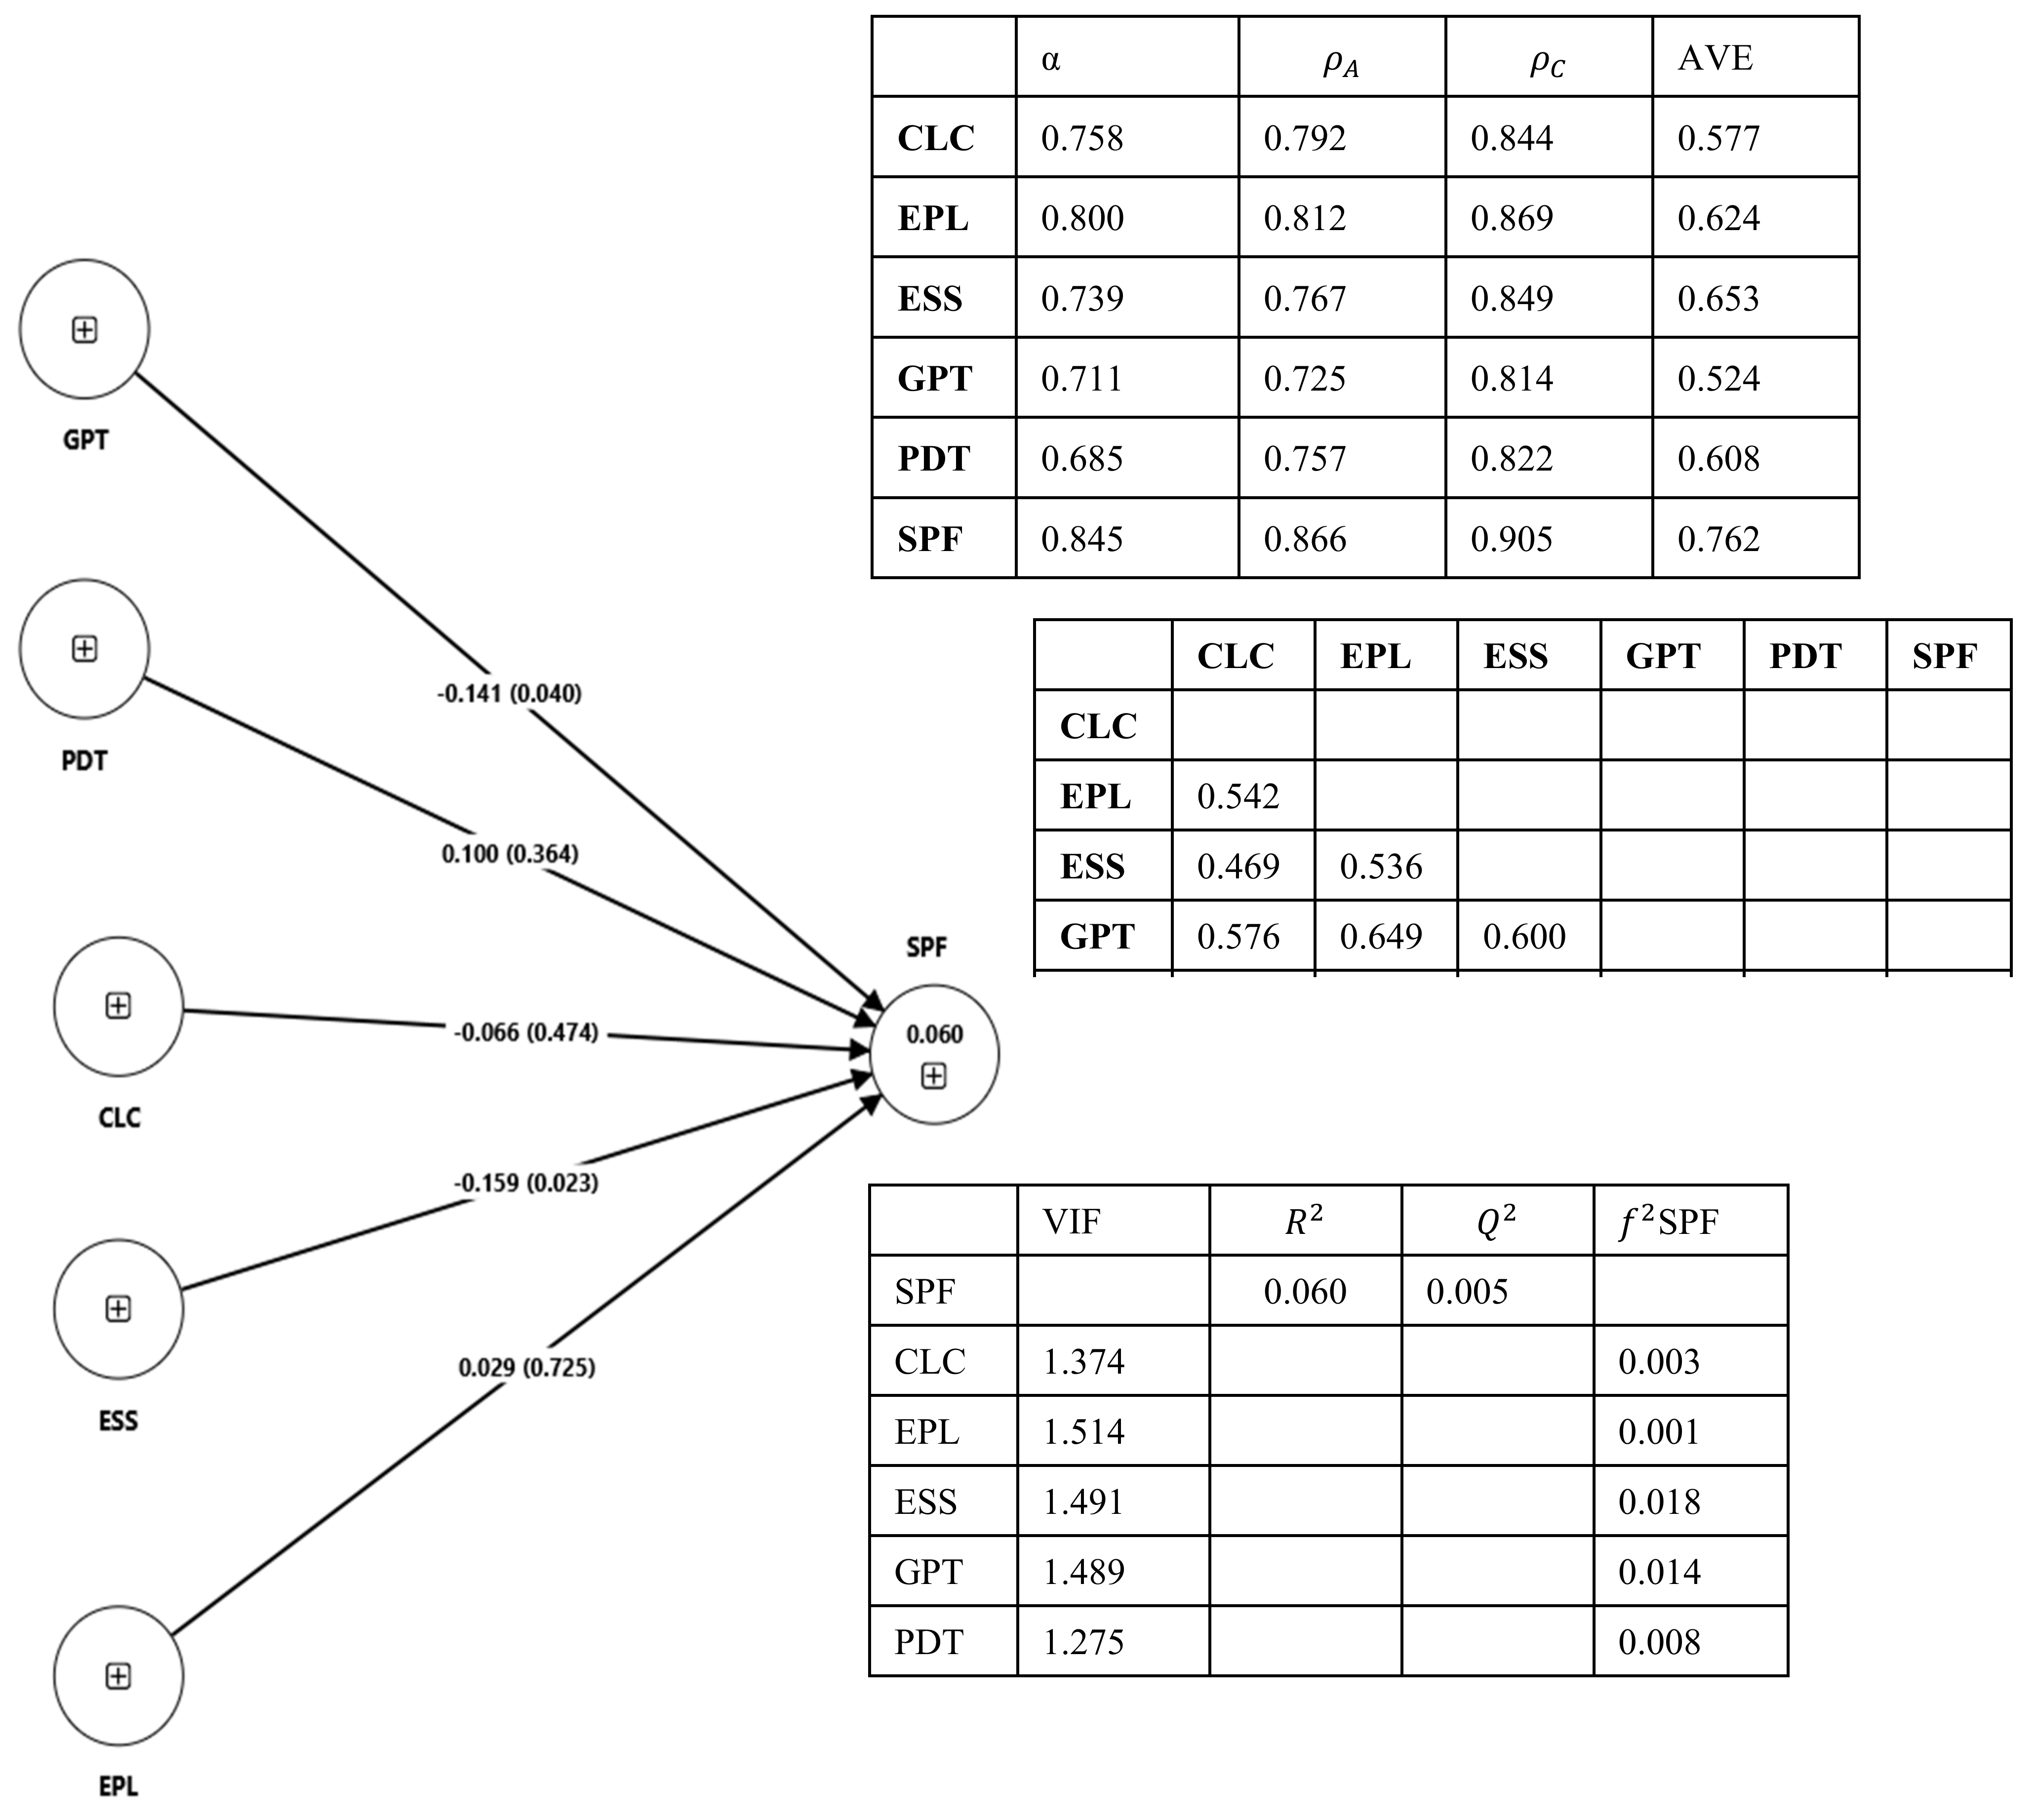
Figure 4.
XY Plots of fsQCA for solutions in the presence of GPT, ESS and OPU2.
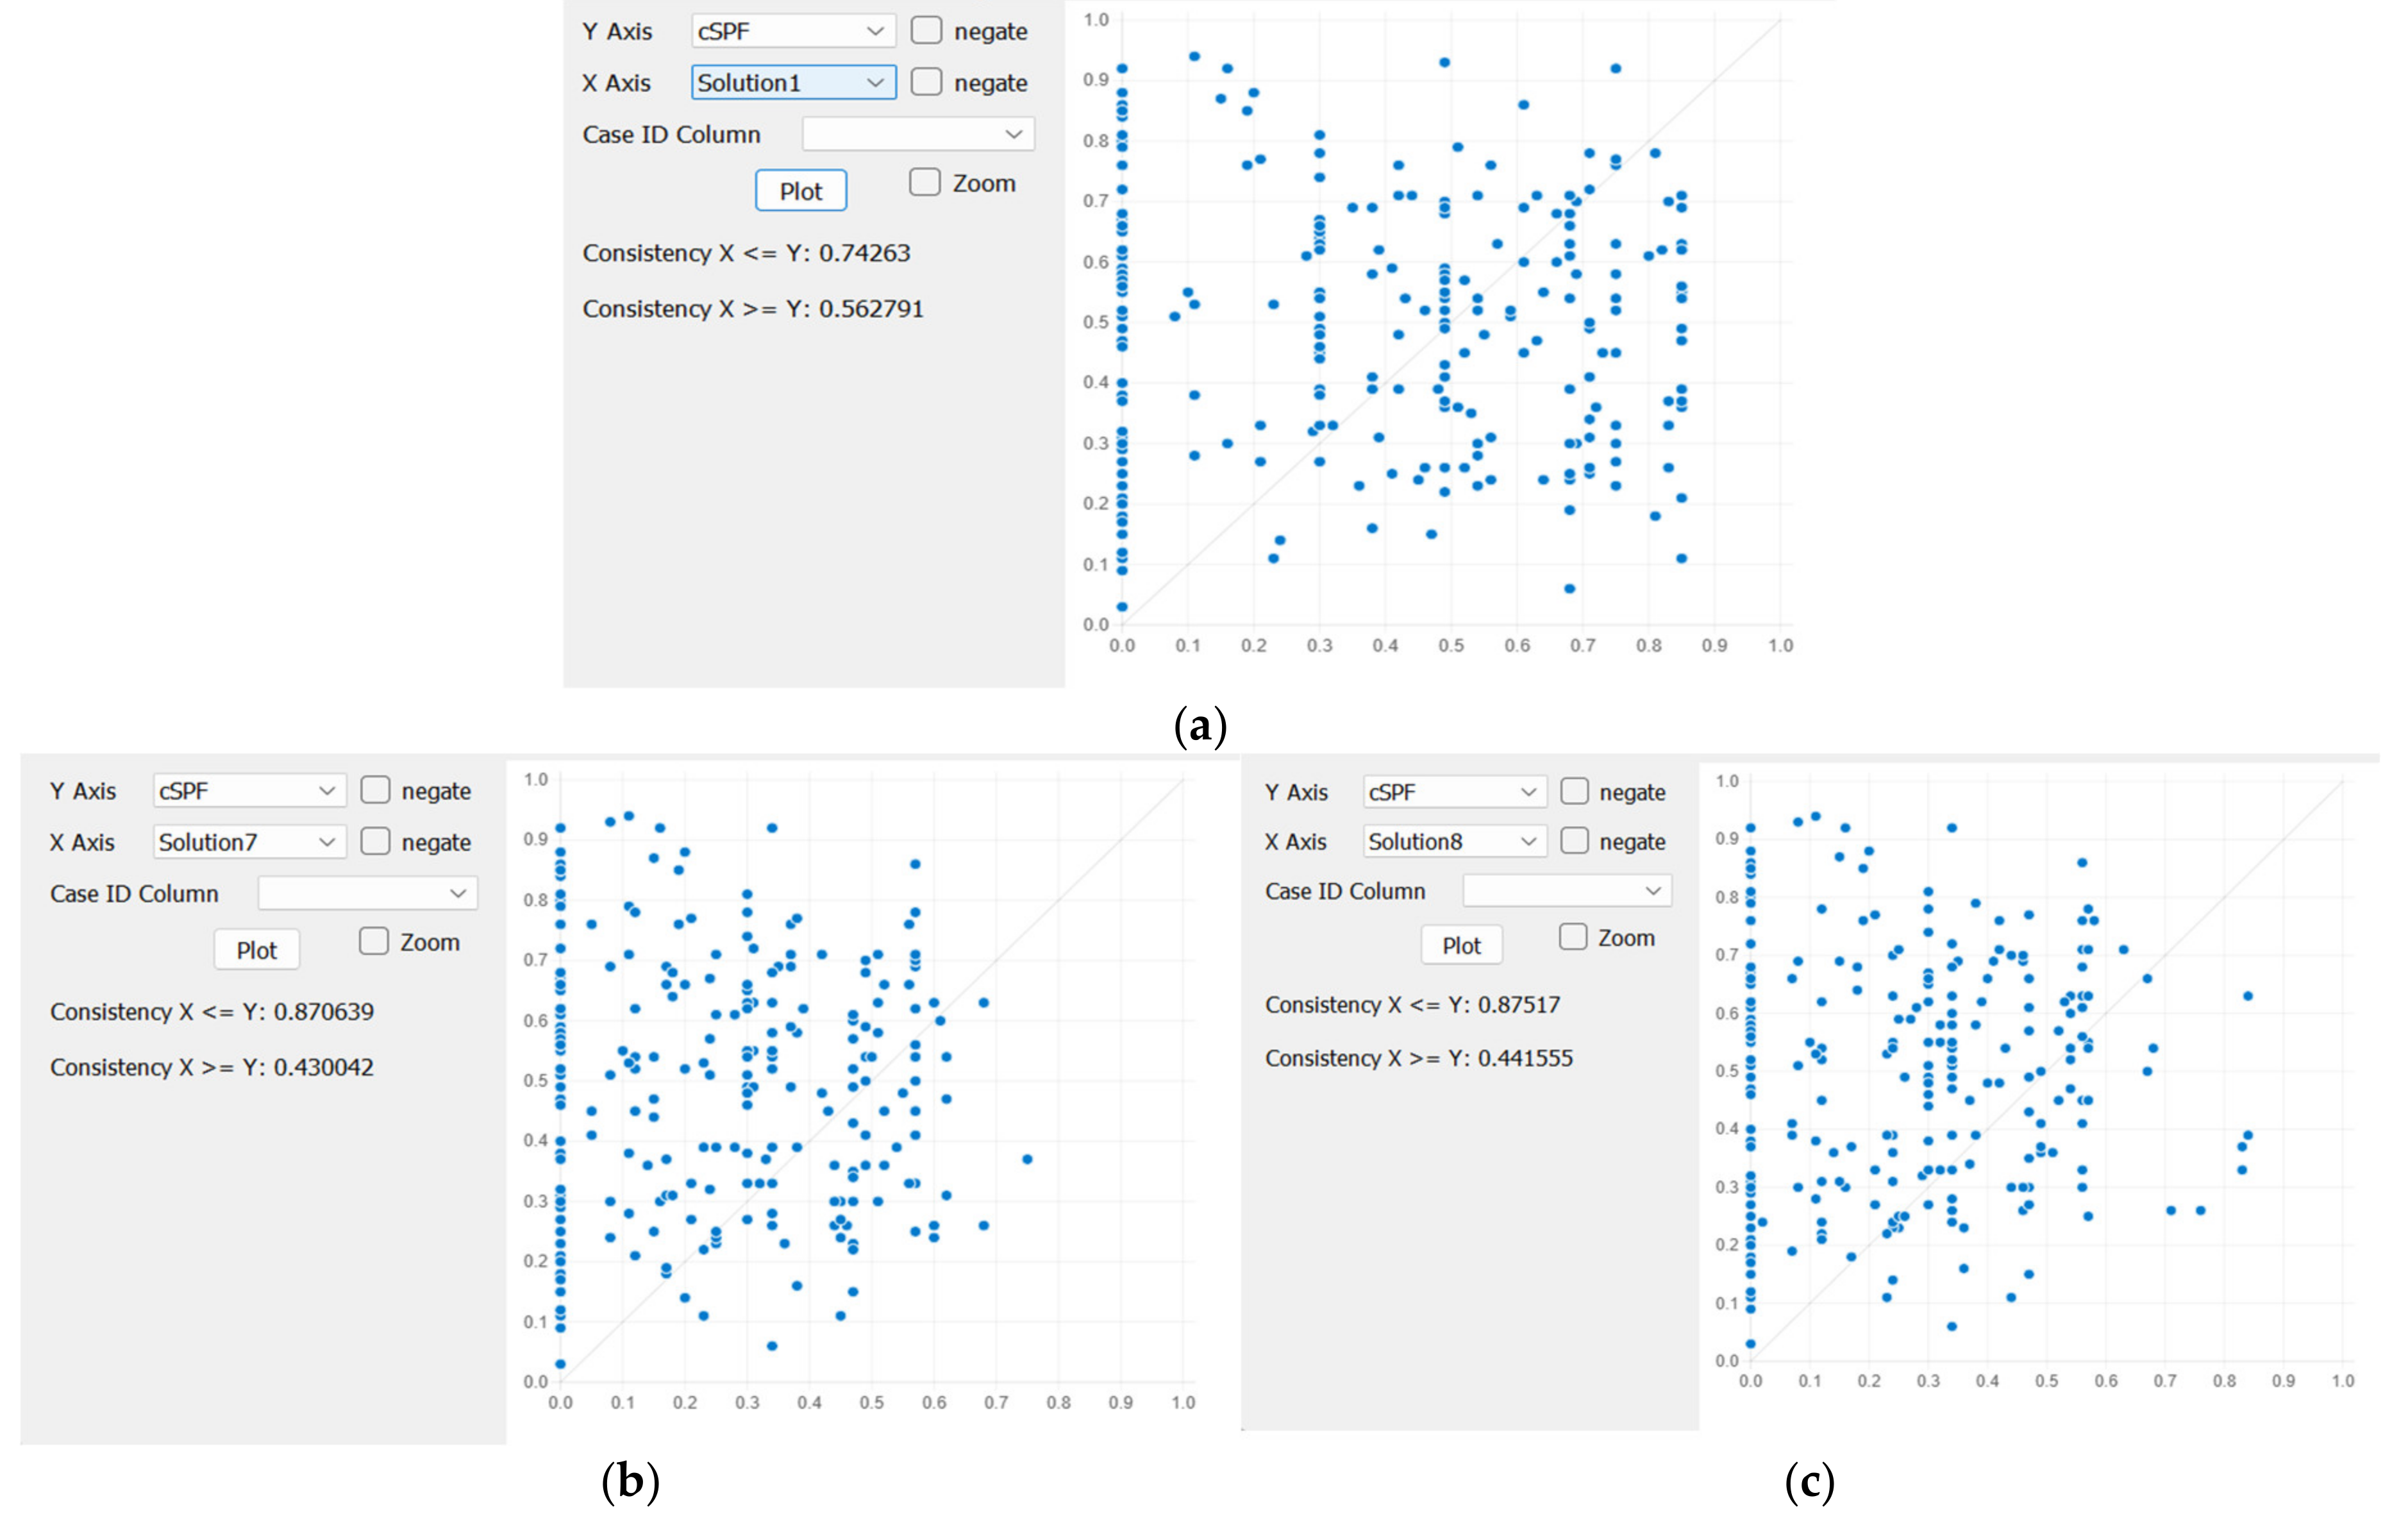
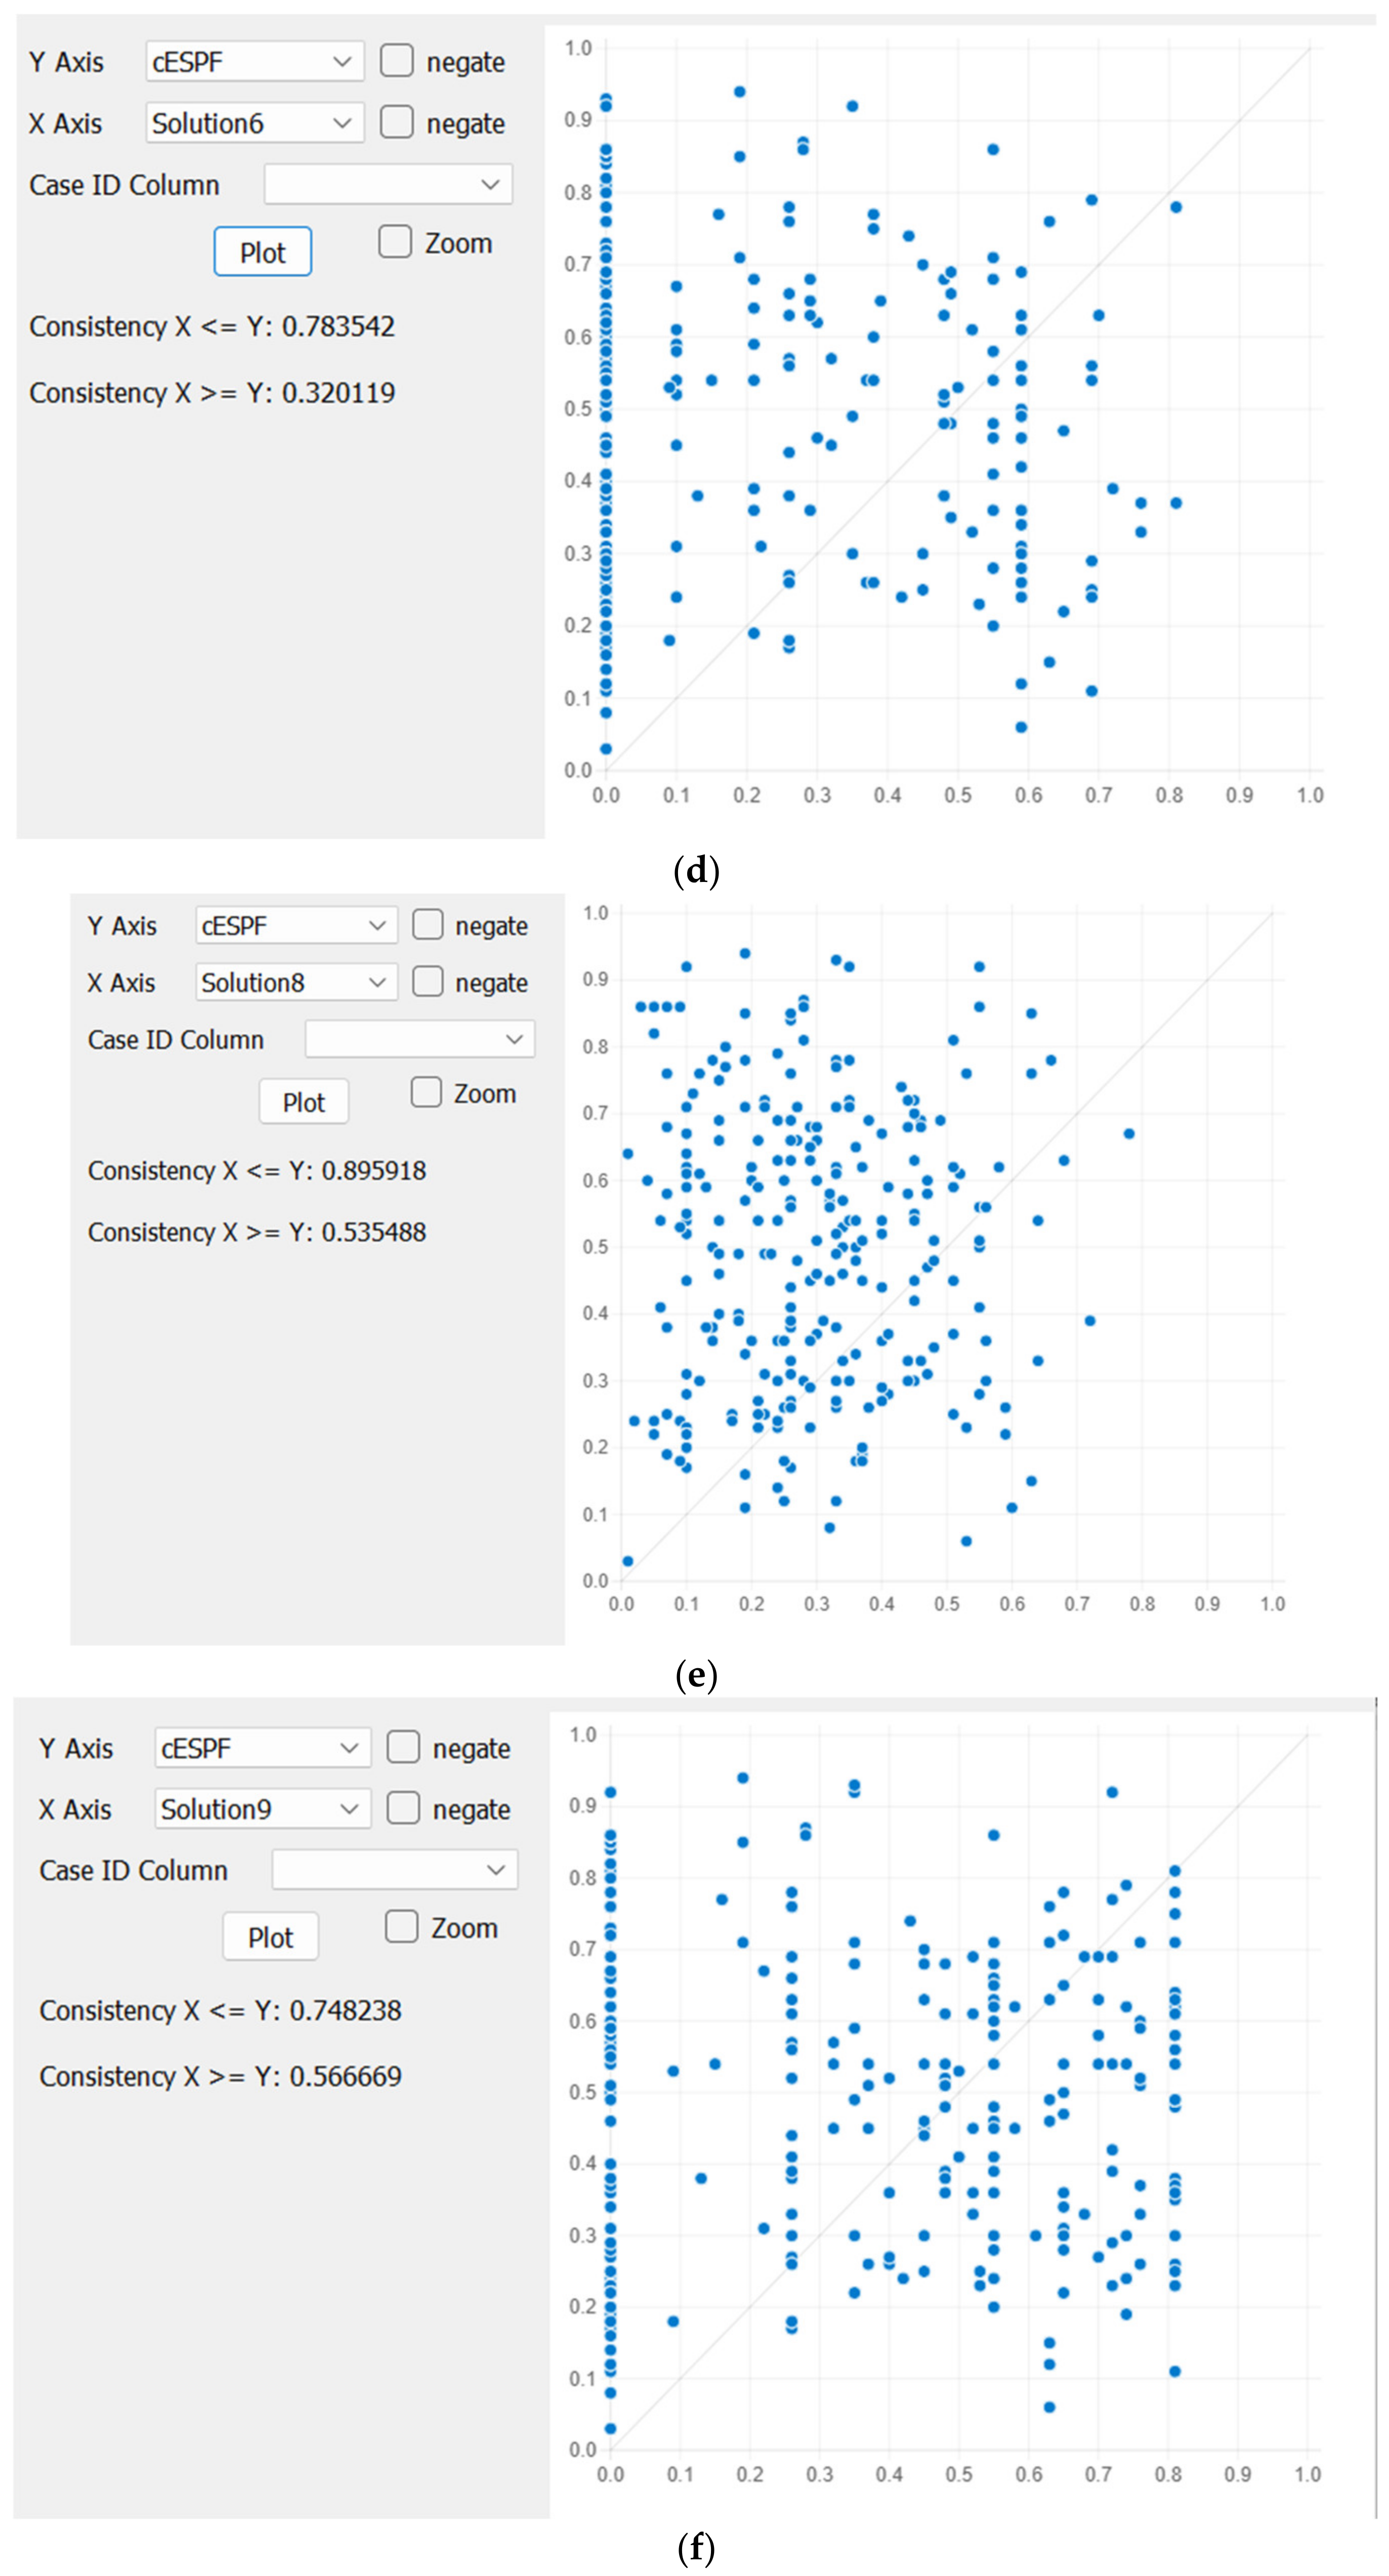

Figure 5.
Framework of analysis of operational uncertainty. Source: Authors.
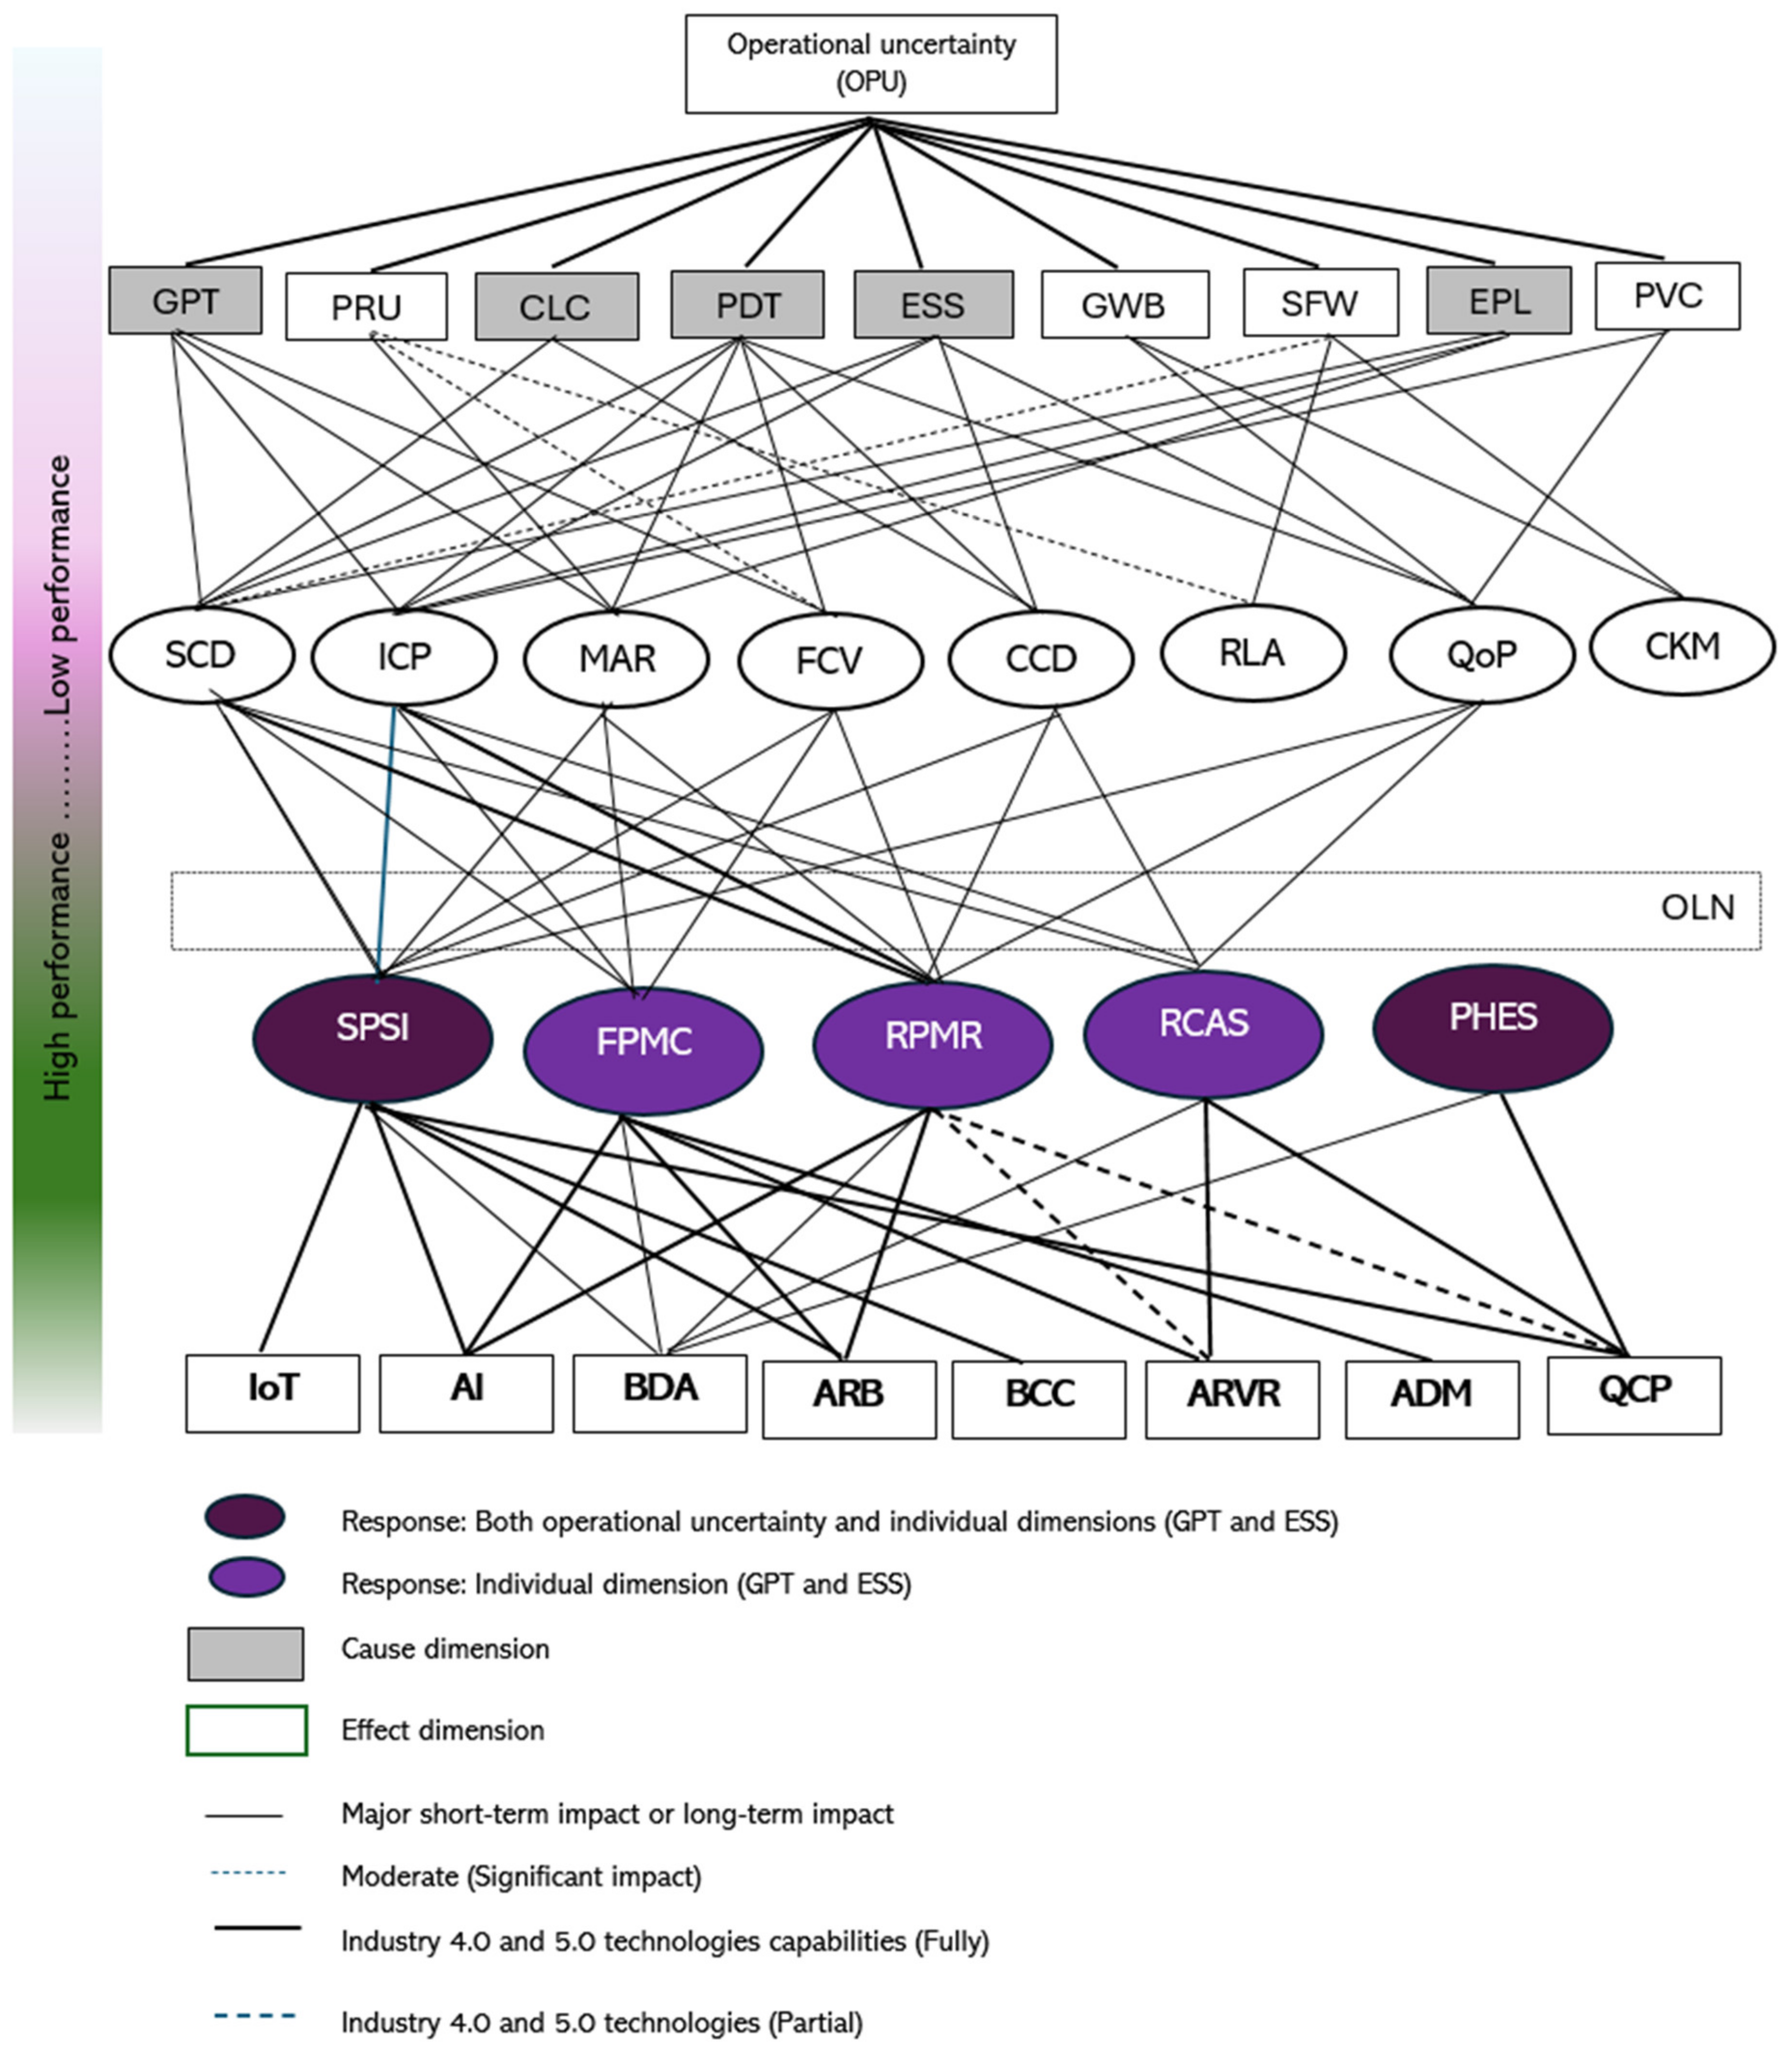

Table 1.
Output of the model.
| R | D | D+R | D-R | |
| GPT | 1,878 | 2,245 | 4,123 | 0,367 |
| PRU | 2,366 | 2,21 | 4,576 | -0,157 |
| CLC | 2,647 | 2,743 | 5,39 | 0,096 |
| PDT | 1,677 | 2,564 | 4,241 | 0,886 |
| ESS | 2,262 | 2,55 | 4,812 | 0,288 |
| GWB | 2,427 | 2,082 | 4,509 | -0,345 |
| SFW | 2,783 | 2,152 | 4,935 | -0,631 |
| EPL | 2,441 | 2,488 | 4,929 | 0,047 |
| PCV | 2,5 | 1,949 | 4,45 | -0,551 |
Source: Authors.
Table 2.
Conditions for fsQCA analysis.
| Causal condition Operational uncertainty (X) Validation method: Fuzzy-DEMATEL |
Causal condition Industry 4.0 and 5.0 technologies (W) Validation method: Heatmap, PLS-SEM measurement model |
Causal condition Organisational learning (Z) Validation method: Corrected Item-total correlation, Pearson correlation |
Outcome (Y) Sustained performance Validation method: PLS-SEM measurement model |
| Model I: Growing political tensions (GPT) | Scenario planning and supply chain integration (SPSI)** Flexible production and mass customisation (FPMC) Real-time system and process monitoring and response (RPMR) IoT, AI, ARB, BCC |
Organisational learning (OLN) | Sustained performance (SPF) |
| Model II: Cost of living-driven consumer behavioural change (CLC) | Scenario planning and supply chain integration (SPSI) Flexible production and mass customization (FPMC) IoT, AI, BCC, ARB, BDA* |
||
| Model III: Pandemic turbulence (PDT) | Scenario planning and supply chain integration (SPSI) Flexible production and mass customisation (FPMC) Real-time system and process monitoring and response (RPMR) Protective ecosystem (human and system) (PEHS) IoT, AI, BCC, ARB, BDA*, ARVR, QCP |
||
| Model IV: Operational uncertainty of energy stability and security (ESS) | Real-time system and process monitoring and response (RPMR) Scenario planning and supply chain integration (SPSI) Root cause analysis and sustainable solutions (RCAS) IoT, AI, ARB, BDA*, ARVR |
||
| Model V: Entrenchment power of large firms (EPL) | Scenario planning and supply chain integration (SPSI) IoT, AI, BCC, ARB |
**SPSI – developed from integration of SPFP and SCIC due to discriminant lack of validity. Source: Authors The path coefficients for the structural model show that GPT has a statistically significant negative relationship with SPF (β = -0.141, p < .05). There was also a statistically negative relationship between ESS and SPF (β = -0.159, p < .05). The other three paths were not statistically significant. As such, the main focus of the fsQCA was on the two significant pathways.
Table 3.
Sufficient configurations of high sustained performance in the presence of geopolitical tension and industry 4.0 and 5.0 technologies capabilities and organisational learning.
Table 3.
Sufficient configurations of high sustained performance in the presence of geopolitical tension and industry 4.0 and 5.0 technologies capabilities and organisational learning.
| Solution | ||||||||||||
| Configuration | 1 | 2 | 3 | 4 | 5 | 6 | 7 | 8 | 9 | 10 | 11 | 12 |
| GPT | ⏺ | ◯ | ◯ | ◯ | ⏺ | ⏺ | ◯ | ⏺ | ◯ | ◯ | ||
| OLN | ⏺ | ⏺ | ⏺ | ⏺ | ⏺ | ◯ | ◯ | ⏺ | ◯ | |||
| SPSI | ⬤ | ⬤ | ⬤ | ⬤ | ⬤ | ◯ | ◯ | ◯ | ||||
| FPMC | ○ | ⏺ | ○ | ⏺ | ⏺ | ○ | ○ | ○ | ⏺ | |||
| RPMR | ○ | ⏺ | ⏺ | ⏺ | ⏺ | ○ | ○ | |||||
| AI | ⏺ | ⏺ | ⏺ | ⏺ | ⏺ | ⏺ | ⏺ | ⏺ | ⏺ | ⏺ | ||
| BCC | ○ | ○ | ○ | ○ | ○ | ○ | ○ | ○ | ○ | ○ | ○ | |
| Raw coverage | 0.388 | 0.499 | 0.377 | 0.371 | 0.381 | 0.519 | 0.383 | 0.393 | 0.453 | 0.355 | 0.376 | 0.327 |
| Unique coverage | 0.011 | 0.008 | 0.004 | 0.003 | 0.002 | 0.010 | 0.007 | 0.008 | 0.027 | 0.005 | 0.056 | 0.004 |
| Consistency | 0.869 | 0.899 | 0.886 | 0.895 | 0.899 | 0.887 | 0.874 | 0.870 | 0.906 | 0.895 | 0.933 | 0.936 |
| Overall solution coverage 0.832 | ||||||||||||
| Solution consistency 0.799 | ||||||||||||
| High SPF: PSPF = f(GPT, OLN, SPSI, FPMC,RPMR, AI, BCC) Note: Black circles indicate the presence of conditions, and empty circles indicate the absence of condition | ||||||||||||
| Large circle: core condition small circle: peripheral condition blank space: "don't care condition | ||||||||||||
Table 4.
Sufficient configurations of high sustained performance in the presence of energy stability and security and industry 4.0 and 5.0 technologies capabilities and organisational learning.
Table 4.
Sufficient configurations of high sustained performance in the presence of energy stability and security and industry 4.0 and 5.0 technologies capabilities and organisational learning.
| Solution | |||||||||||
| Configuration | 1 | 2 | 3 | 4 | 5 | 6 | 7 | 8 | 9 | 10 | 11 |
| ESS | ○ | ○ | ⏺ | ⏺ | ⏺ | ⏺ | ⏺ | ||||
| OLN | ◯ | ⬤ | ⬤ | ⬤ | ◯ | ⬤ | ⬤ | ||||
| RCAS | ⏺ | ○ | ⏺ | ⏺ | ⏺ | ⏺ | ○ | ⏺ | ○ | ||
| RPMR | ⏺ | ○ | ○ | ⏺ | ⏺ | ○ | ⏺ | ○ | ○ | ○ | |
| SPSI | ⬤ | ◯ | ⬤ | ⬤ | ◯ | ⬤ | ◯ | ◯ | ⬤ | ||
| AI | ⏺ | ⏺ | ⏺ | ⏺ | ⏺ | ⏺ | ⏺ | ⏺ | |||
| BDA | ○ | ⏺ | ⏺ | ⏺ | ⏺ | ⏺ | |||||
| Raw coverage | 0.476 | 0.299 | 0.316 | 0.413 | 0.418 | 0.282 | 0.293 | 0.535 | 0.393 | 0.388 | 0.386 |
| Unique coverage | 0.007 | 0.011 | 0.012 | 0.011 | 0.008 | 0.007 | 0.003 | 0.045 | 0.003 | 0.004 | 0.007 |
| Consistency | 0.850 | 0.883 | 0.901 | 0.921 | 0.901 | 0.867 | 0.885 | 0.896 | 0.912 | 0.932 | 0.943 |
| Overall solution coverage 0.825 | |||||||||||
| Solution consistency 0.810 | |||||||||||
| Note: Black circles indicate the presence of conditions, and empty circles indicate the absence of condition | |||||||||||
| Large circle: core condition small circle: peripheral condition blank space: "don't care condition Source: Authors | |||||||||||
Table 5.
Sufficient configurations of high sustained performance in the presence of operational uncertainty and industry 4.0 and 5.0 technologies capabilities and organisational learning.
Table 5.
Sufficient configurations of high sustained performance in the presence of operational uncertainty and industry 4.0 and 5.0 technologies capabilities and organisational learning.
| Solution | ||||
| Configuration | 1 | 2 | 3 | |
| Configuration for High SPF | OPU2 | ⏺ | ○ | |
| OLN | ⬤ | ◯ | ||
| PEHS | ○ | ○ | ||
| SPSI | ⬤ | |||
| AI | ⏺ | ⏺ | ||
| ARVR | ○ | |||
| BDA | ⏺ | |||
| Raw coverage | 0.280 | 0.260 | ||
| Unique coverage | 0.043 | 0.021 | ||
| Consistency | 0.895 | 0.925 | ||
| Overall solution coverage 0.686 | ||||
| Solution consistency 0.864 | ||||
| Configuration for low SPF | OPU2 | ○ | ⏺ | ⏺ |
| OLN | ◯ | ⬤ | ||
| PEHS | ○ | ○ | ||
| SPSI | ⬤ | ◯ | ◯ | |
| AI | ⏺ | ⏺ | ⏺ | |
| ARVR | ||||
| BDA | ⏺ | ⏺ | ⏺ | |
| Raw coverage | 0.255 | 0.304 | 0.301 | |
| Unique coverage | 0.011 | 0.001 | 0.001 | |
| Consistency | 0.924 | 0.914 | 0.909 | |
| Overall solution coverage 0.636 | ||||
| Solution consistency 0.849 | ||||
| High SPF | SPF = f(OPU2, OLN, PEHS, SPSI,AI, ARVR, BDA | |||
| Low SPF | ~SPF = f(cOPU2, OLN, PEHS, SPSI,AI, ARVR, BDA | |||
| Large circle: core condition small circle: peripheral condition blank space: "don't care condition | ||||
Disclaimer/Publisher’s Note: The statements, opinions and data contained in all publications are solely those of the individual author(s) and contributor(s) and not of MDPI and/or the editor(s). MDPI and/or the editor(s) disclaim responsibility for any injury to people or property resulting from any ideas, methods, instructions or products referred to in the content. |
© 2025 by the authors. Licensee MDPI, Basel, Switzerland. This article is an open access article distributed under the terms and conditions of the Creative Commons Attribution (CC BY) license (http://creativecommons.org/licenses/by/4.0/).
Copyright: This open access article is published under a Creative Commons CC BY 4.0 license, which permit the free download, distribution, and reuse, provided that the author and preprint are cited in any reuse.


