Submitted:
10 April 2025
Posted:
10 April 2025
You are already at the latest version
Abstract
This study assesses thermal comfort and indoor air quality (IAQ) across different zones within a hypermarket located in Gombak, Selangor, Malaysia, a region characterized by a tropical climate with high humidity and temperature. Key indicators, including Predicted Mean Vote (PMV), Percentage of People Dissatisfied (PPD), and IAQ parameters such as carbon dioxide (CO2), total volatile organic compounds (TVOC), PM2.5, and PM10, were evaluated. Significant disparities were observed between zones, with the cafeteria (Zone 5) recording the highest discomfort levels, marked by a PPD of 50%, CO2 concentrations of 900 ppm, and TVOC levels reaching 1500 ppb, primarily due to cooking activities and inadequate ventilation. In contrast, the intermediate retail zone (Zone 3) demonstrated favourable conditions, with a PPD of 12% and PMV values within the recommended range. These findings were benchmarked against ASHRAE 55 and Köppen-Geiger climate classification standards, emphasising the need for targeted improvements to enhance the thermal comfort and IAQ of the hypermarket indoor environment.
Keywords:
hypermarket
; tropical climate
; thermal comfort
; indoor air quality
; predicted mean vote
; percentage of people dissatisfied
; ASHRAE Standards
; Koppen-Geirger Climate Classification
1. Introduction
Thermal comfort and Indoor Air Quality (IAQ) are critical factors influencing the usability and efficiency of commercial buildings, particularly in hot-humid climates like Malaysia [1). Previous research highlights the importance of understanding occupant preferences and adaptive behaviors to achieve optimal indoor environmental conditions [2,3]. The functionality and attractiveness of public spaces are directly influenced by outdoor thermal comfort, which affects both human thermal sensation and the commercial viability of such spaces [4].
Hypermarkets, as expansive retail environments, encounter unique challenges in maintaining IAQ and thermal comfort due to fluctuating occupancy levels, diverse activity patterns, and ventilation demands [5]. The efficiency of HVAC systems, building envelope performance, and operational strategies play a crucial role in regulating indoor conditions. Given that a significant proportion of time is spent indoors, maintaining an optimal thermal environment is essential for occupant well-being, workplace comfort, and overall productivity [6].
This research examines IAQ and thermal comfort in a hypermarket located in Gombak, Selangor, Malaysia. The region’s humid tropical climate presents persistent challenges, including high ambient temperatures and elevated humidity levels, which directly impact indoor environmental conditions. Hypermarkets consist of multiple functional zones, such as retail shopping areas, food service sections, and storage spaces, each with distinct environmental requirements. A comprehensive assessment of these areas is necessary to ensure that all zones provide a comfortable and efficient indoor atmosphere for various users.
To evaluate the existing environmental conditions, key parameters are benchmarked against internationally recognized standards such as ASHRAE 55 [7] and WHO guidelines[8]. Factors such as temperature fluctuations, humidity levels, air circulation efficiency, and pollutant concentrations are analyzed to identify discrepancies and potential areas for improvement. The findings serve as a foundation for implementing targeted interventions that optimize indoor thermal conditions while enhancing energy efficiency, ultimately promoting sustainable facility management.
A multidisciplinary approach integrating both quantitative and qualitative methodologies is employed to address IAQ and thermal comfort concerns. Real-time environmental monitoring, occupant surveys, and computational modeling techniques are utilized to provide a comprehensive analysis of current conditions and potential enhancements. By adopting a zone-specific evaluation framework and adaptive strategies, the study contributes to the development of scalable solutions that can be applied to similar commercial environments in Malaysia and other tropical regions. [26]
Ensuring a well-regulated indoor environment is essential for health, productivity, and energy efficiency in hypermarkets, which accommodate a diverse range of users, including shoppers, employees, and suppliers [9,10]. The climatic conditions in Gombak impose significant stress on HVAC systems, increasing operational costs and complicating thermal regulation. Additionally, the varying thermal loads in different hypermarket sections, such as retail zones with high foot traffic, storage areas with temperature-sensitive goods, and cafeterias generating heat and airborne pollutants from cooking activities, further complicate environmental management. Addressing these challenges through effective IAQ and thermal control strategies is imperative for maintaining a comfortable, sustainable, and operationally efficient indoor space.
Figure 1.
The image above was retrieved from Google Maps. Coordinate: 3.2212543917377117, 101.67086682334372.
Figure 1.
The image above was retrieved from Google Maps. Coordinate: 3.2212543917377117, 101.67086682334372.
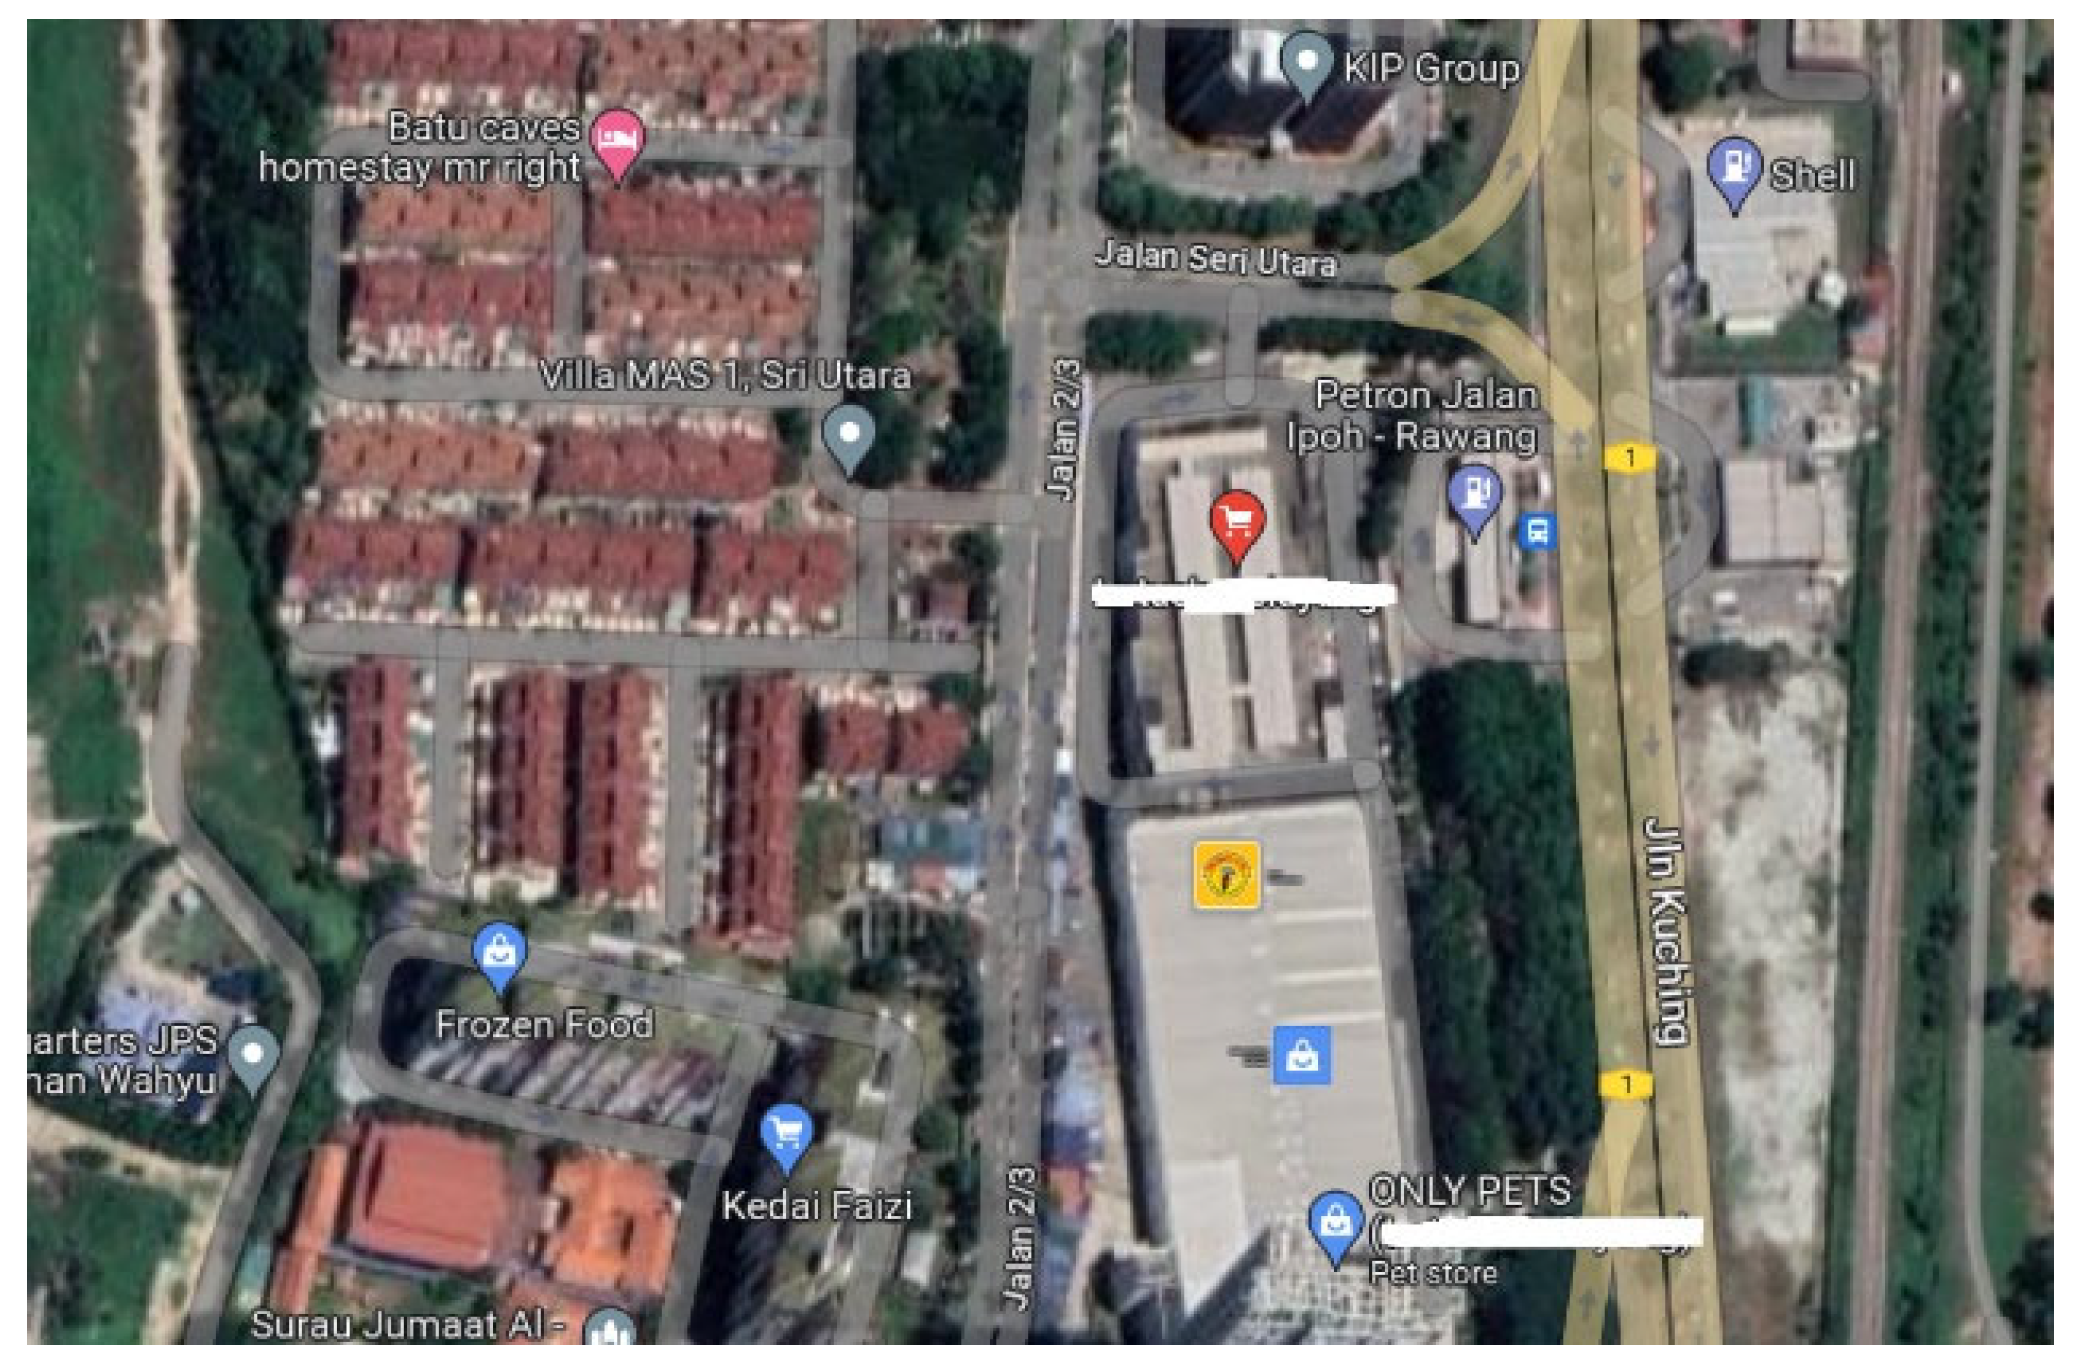
Picture 1 above is a view of the hypermarket in study.
While global standards such as ASHRAE 55 and WHO guidelines provide benchmarks for indoor environmental quality, their direct applicability to Malaysian hypermarkets remains limited due to regional climatic variations and operational complexities [7,8]. Existing studies on thermal comfort and IAQ in commercial spaces often focus on isolated metrics, lacking an integrated perspective on dynamic environmental interactions.
This research addresses this gap by adopting a comprehensive, multidisciplinary approach, incorporating real-time monitoring of thermal comfort indices (PMV, PPD) and IAQ indicators (CO₂, TVOC, PM2.5, PM10). Using a hypermarket as a case study, this research establishes a replicable framework for optimizing indoor environments in high-traffic commercial spaces. It bridges the gap between theoretical benchmarks and real-world applications, contributing to Malaysia’s sustainability goals while offering insights applicable to similar tropical climates. This dual focus makes it valuable for both local policymakers and the global research community. [27]
2. Project Background
The study was conducted at a prominent hypermarket in the Gombak district of Selangor Darul Ehsan, Malaysia. Gombak is located in the humid tropical climate zone, characterized by consistently high temperatures and humidity levels throughout the year. [11] The unique environmental challenges of this region, combined with the operational complexities of a hypermarket, necessitate a comprehensive assessment of the indoor environmental quality.
The hypermarket represents a microcosm of the issues faced by commercial buildings in Malaysia, particularly in terms of maintaining thermal comfort and Indoor Air Quality. [12] Achieving optimal indoor environmental conditions in such spaces is crucial, as it directly impacts the health, productivity, and satisfaction of the occupants [34].
This research investigates and enhances thermal comfort and Indoor Air Quality (IAQ) in a hypermarket located in Selangor, specifically within the Gombak district. The hypermarket serves as a key commercial hub, attracting a high volume of customers and staff. Selangor's humid tropical climate poses unique challenges for maintaining optimal indoor conditions, with elevated temperatures and humidity contributing to discomfort and energy inefficiency.
The hypermarket has 2 floors with an approximately total built-up area of 50,000 square meters. This study adopts a multi-zone approach to address these challenges comprehensively, aiming to provide actionable solutions tailored to both climatic conditions and operational needs.
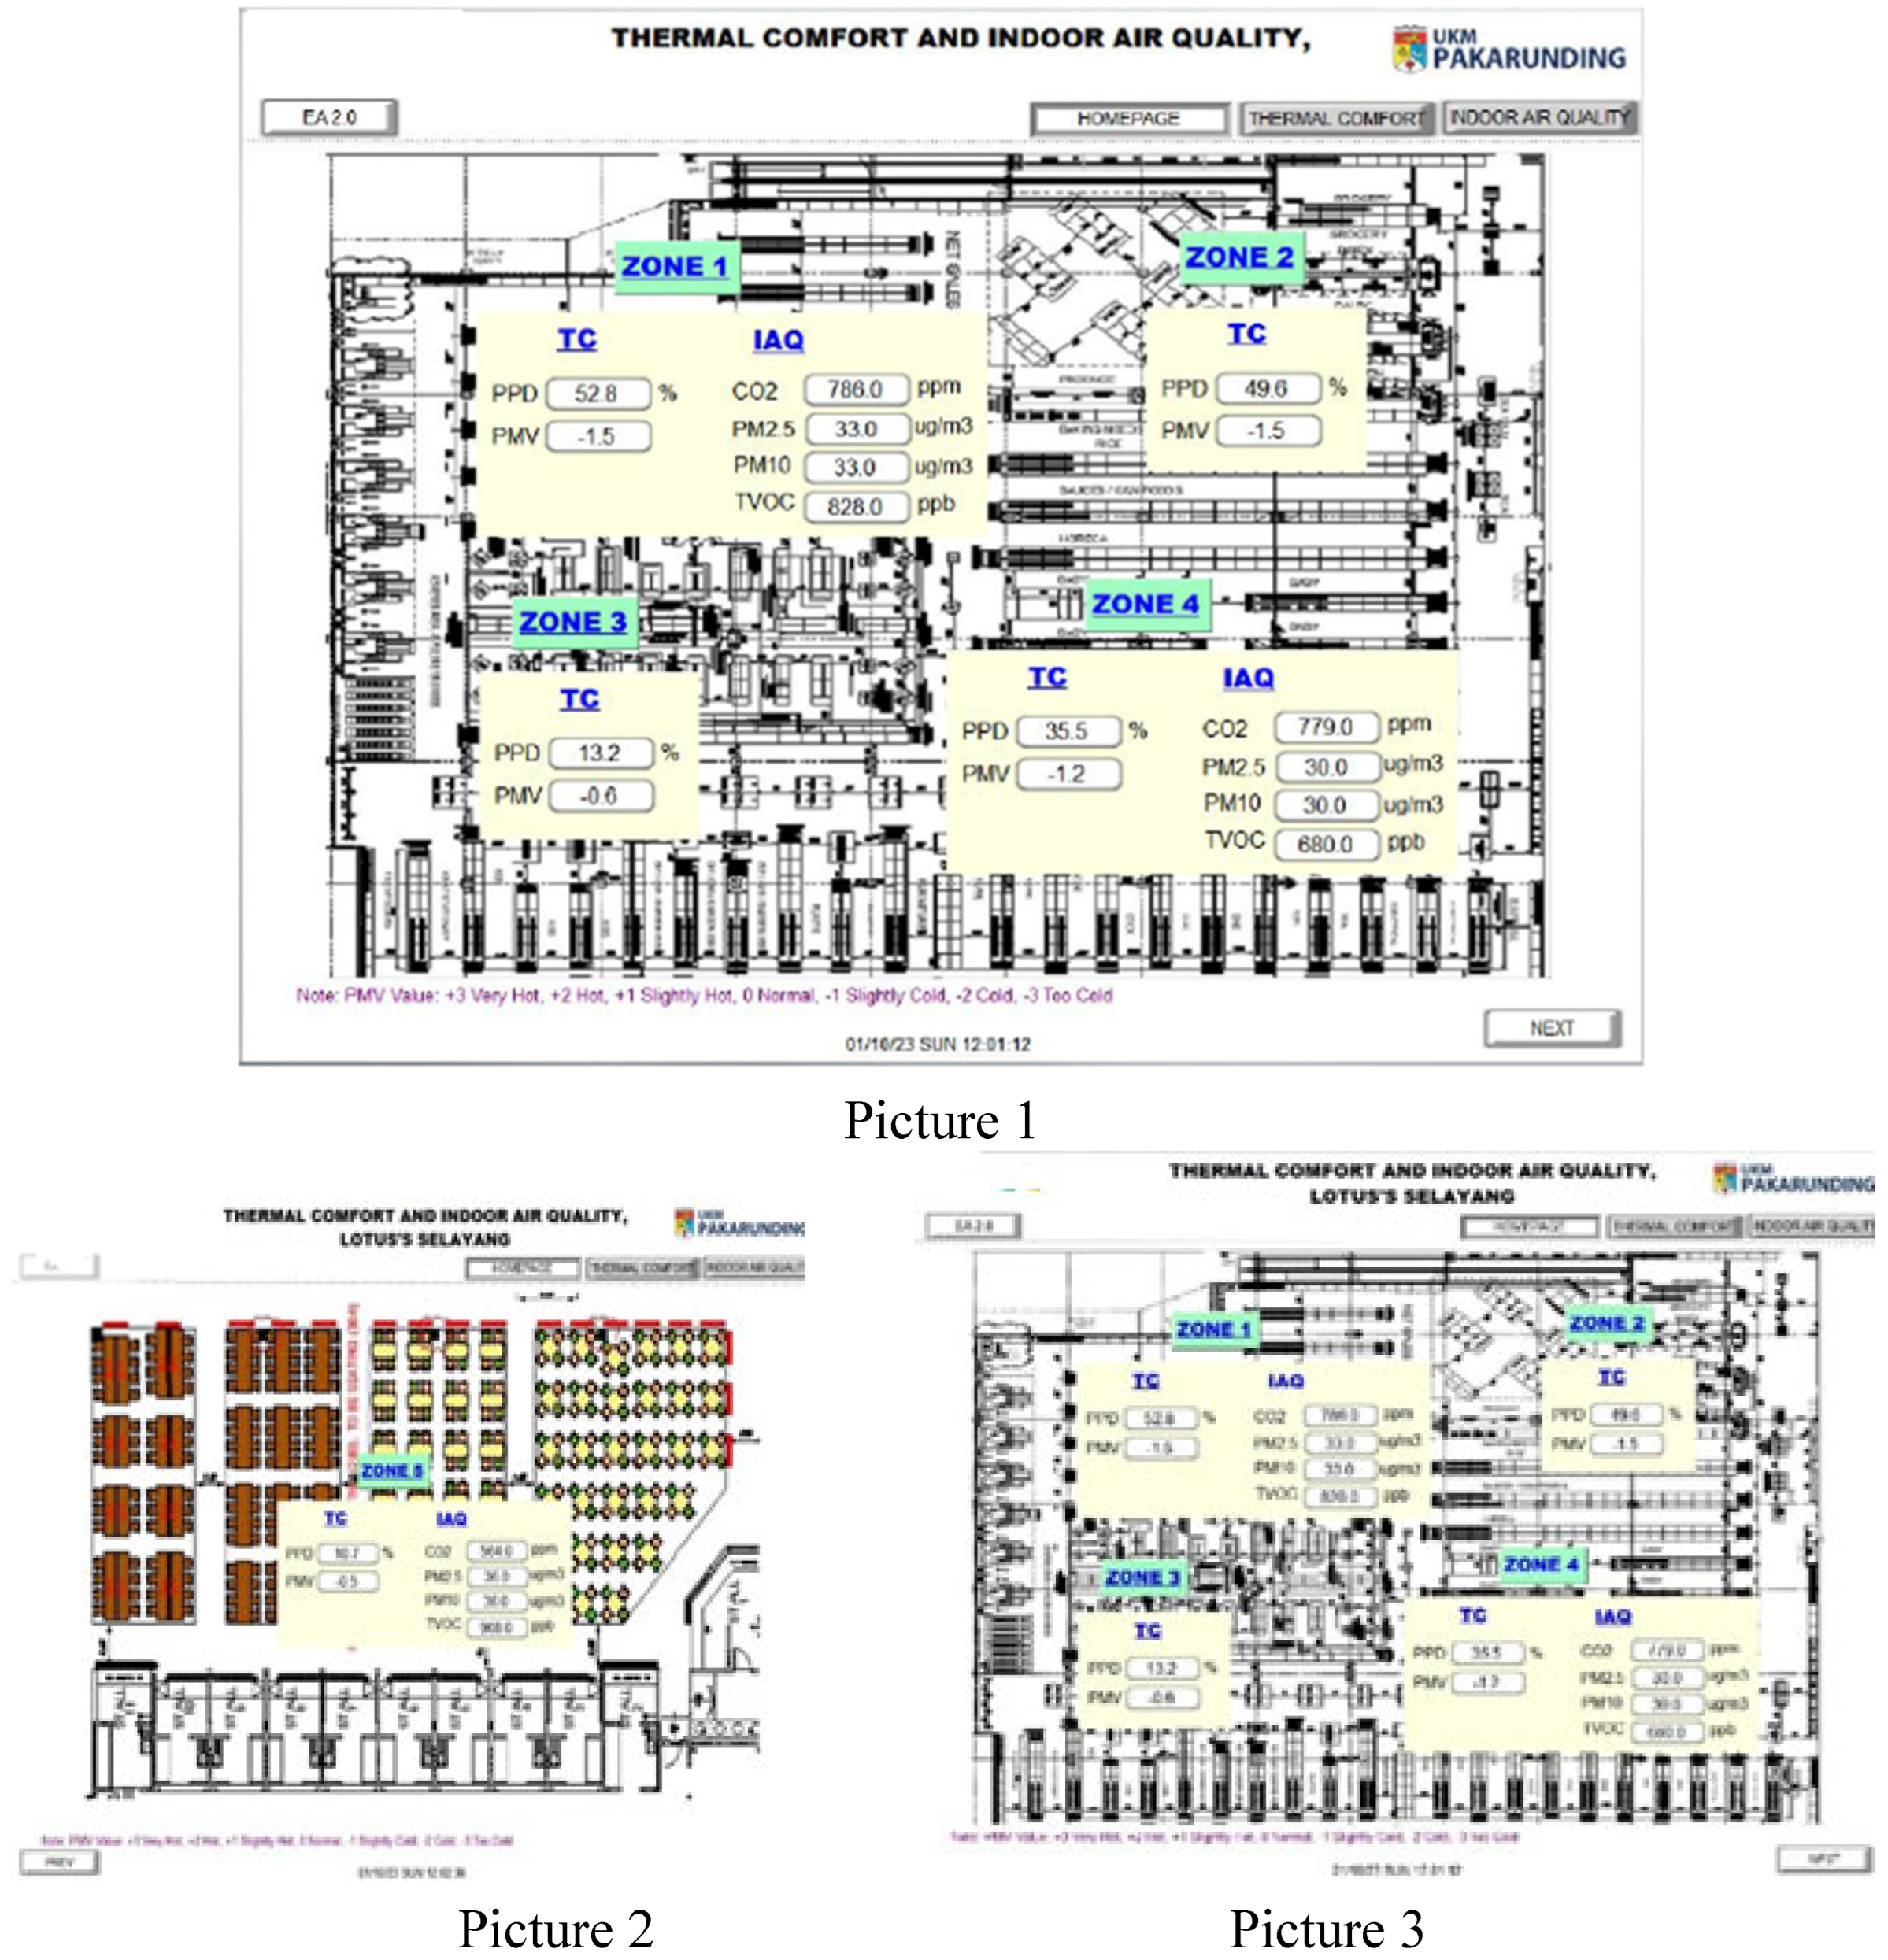
The study site is located at Hypermarket. The Hypermarket is divided into 5 Zones. Zone 1, 2, 3 and 4 are the retail zones, and Zone 5 is the cafeteria area.
Figure 2.
1,2, and 3 above are temperature mapping by zone.
3. Research Objectives
The primary objectives of this study are:
- To assess the current state of thermal comfort and IAQ across the hypermarket's zones, focusing on key parameters such as PMV, PPD, temperature, humidity, air quality, and airflow.
- To identify unique issues within each zone, such as high pollutant levels or thermal imbalances.
- To develop targeted solutions to improve indoor environmental conditions while maintaining energy efficiency.
Indoor environmental quality significantly impacts occupant health, productivity, and energy efficiency in commercial buildings [9,13]. Thermal comfort and IAQ are primary components, with standards such as ASHRAE 55 and ASHRAE 62 providing benchmarks for acceptable conditions [9,10]. While previous studies have focused on isolated parameters, this research integrates thermal and IAQ assessments across distinct zones of a hypermarket.
4. Methodology
4.1. Design Study
This study divided the hypermarket categorized into five zones. The hypermarket faced specific operational challenges, such as managing diverse indoor environmental conditions across zones. High-traffic areas like Zone 1 required consistent cooling to ensure customer comfort. Zones 4 and 5 encountered inadequate ventilation and elevated pollutant levels. Addressing these varied demands required tailored approaches to maintain energy efficiency and occupant satisfaction.
Zone 1: Retail Area (Baseline)
Zone 2: Retail Area (Peripheral)
Zone 3: Retail Area (Intermediate)
Zone 4: Retail Area (Rear)
Zone 5: Cafeteria Area
Each zone reflects a unique operational and environmental dynamic, requiring tailored approaches for evaluating and optimising thermal comfort and Indoor Air Quality (IAQ). High-traffic areas like Zone 1 present challenges in balancing customer comfort with energy efficiency, necessitating precise HVAC adjustments to maintain optimal conditions. Meanwhile, zones with lower foot traffic, such as Zone 4, demand strategies to minimise overcooling while ensuring air circulation. Additionally, areas like Zone 5 must contend with operational complexities from cooking activities, contributing to elevated heat loads and pollutant levels. These diverse demands highlight the need for zone-specific solutions to achieve overall environmental optimisation.
4.2. Study Site
This study was carried out in a well-known hypermarket situated in Gombak, Selangor Darul Ehsan, Malaysia, an area that experiences a humid tropical climate. The hypermarket is an extensive commercial establishment spanning multiple levels and supporting various operations, including retail sales, dining services, and logistical activities.
To facilitate a detailed environmental assessment, the study site was segmented into five zones. Zones 1 to 4 encompass retail sections, while Zone 5 is designated as the cafeteria, where food preparation and consumption take place. This zoning approach enables a comparative analysis of indoor conditions across different functional areas.
4.3. Sensors and Data Acquisition
The IAQ parameters were measured using calibrated instruments installed at strategic locations throughout the hypermarket. Dedicated Carbon Dioxide sensors were used to monitor indoor CO2 levels, while a specialized sensor was employed to quantify the concentrations of Total Volatile Organic Compounds. Particulate Matter with diameters of 2.5μm (PM2.5) and 10μm were measured using optical particle counters.
The data acquisition system logged real-time measurements at regular intervals, enabling temporal and spatial analysis of the IAQ conditions.

| Table 1. Table 1. Equipment. | Manufacturer | Function | Range | Reference |
HUM-N-LCD 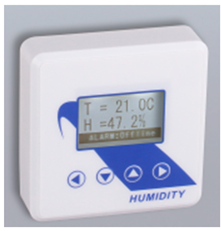
|
Humidity | Humidity & Temperature Monitoring | 0-100% RH, -40~150°C | HUM-N-LCD Sensor Datasheet, 2024 |
Globe Temperature 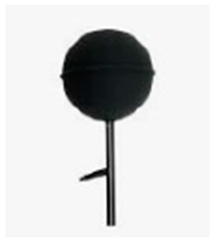 |
Custom Made | Globe Temperature Measurement | - | Globe Temperature Sensor Specifications, 2024 |
| Equipment |
Manufacturer | Function | Range | Reference |
CMT3092X 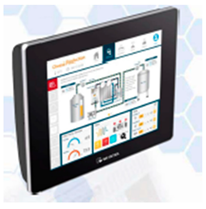
|
Weintek | Screen Monitoring | - | CMT3092X User Manual, 2024 |
MQ-137 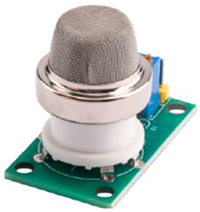
|
Custom Made | NOX Detection | 5-500ppm | Gas Sensor MQ-137 Technical Sheet, 2024 |
MQ-131 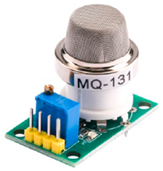
|
Custom Made | Ozone Detection | 10-1000ppm | Gas Sensor MQ-131 Specifications, 2024 |
MQ-138 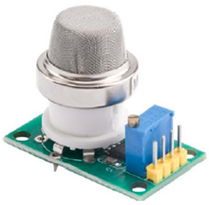
|
Custom Made | Formaldehyde Detection | 1-100ppm | Gas Sensor MQ-138 Technical Datasheet, 2024 |
| Equipment |
Manufacturer | Function | Range | Reference |
MQ-9 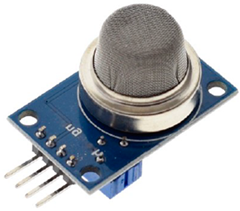
|
Custom Made | Carbon Monoxide Detection | 10-1000ppm CO | Gas Sensor MQ-9 Manual, 2024 |
AirLab & PM2.5 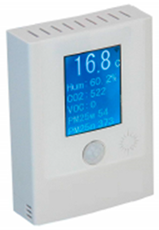
|
Custom Made | Air Quality Monitoring | PM1.0 to PM10, CO2 0-40000ppm | AirLab & PM2.5 Sensor Guide, 2024 |
Air Flow Sensor 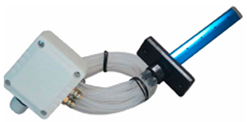
|
Custom Made | Air Flow Measurement | -1500 to +1500 Pa | AirFlow Sensor Technical Datasheet, 2024 |
Temperature Sensors 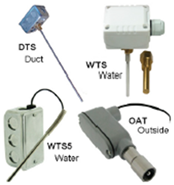
|
Custom Made | Temperature Measurement | -200°C to 300°C | Temperature Sensor Reference Manual, 2024 |
4.4. Data Collection
Environmental parameters were monitored over a one-month period using calibrated sensors, with measurements taken hourly to capture diurnal variations. The study was conducted during the peak summer season, under consistent weather conditions characterized by high humidity and elevated outdoor temperatures, to reflect the region's Köppen-Geiger Climate Classification "Cfa" classification [4]. Selangor's humid tropical climate significantly influences the hypermarket's operations by increasing HVAC loads to combat persistent heat and humidity. The elevated moisture levels necessitate enhanced ventilation to prevent the accumulation of pollutants and maintain air quality. Additionally, seasonal variations in temperature and humidity highlight the importance of adaptive HVAC strategies tailored to local climatic conditions to ensure both energy efficiency and occupant comfort. Measurements included:
- a)
- Thermal Comfort: PMV and PPD values collected at hourly intervals.
- b)
- IAQ Parameters: CO2 (ppm), TVOC (ppb), PM2.5 (µg/m³), and PM10 (µg/m³) collected at multiple locations within each zone.
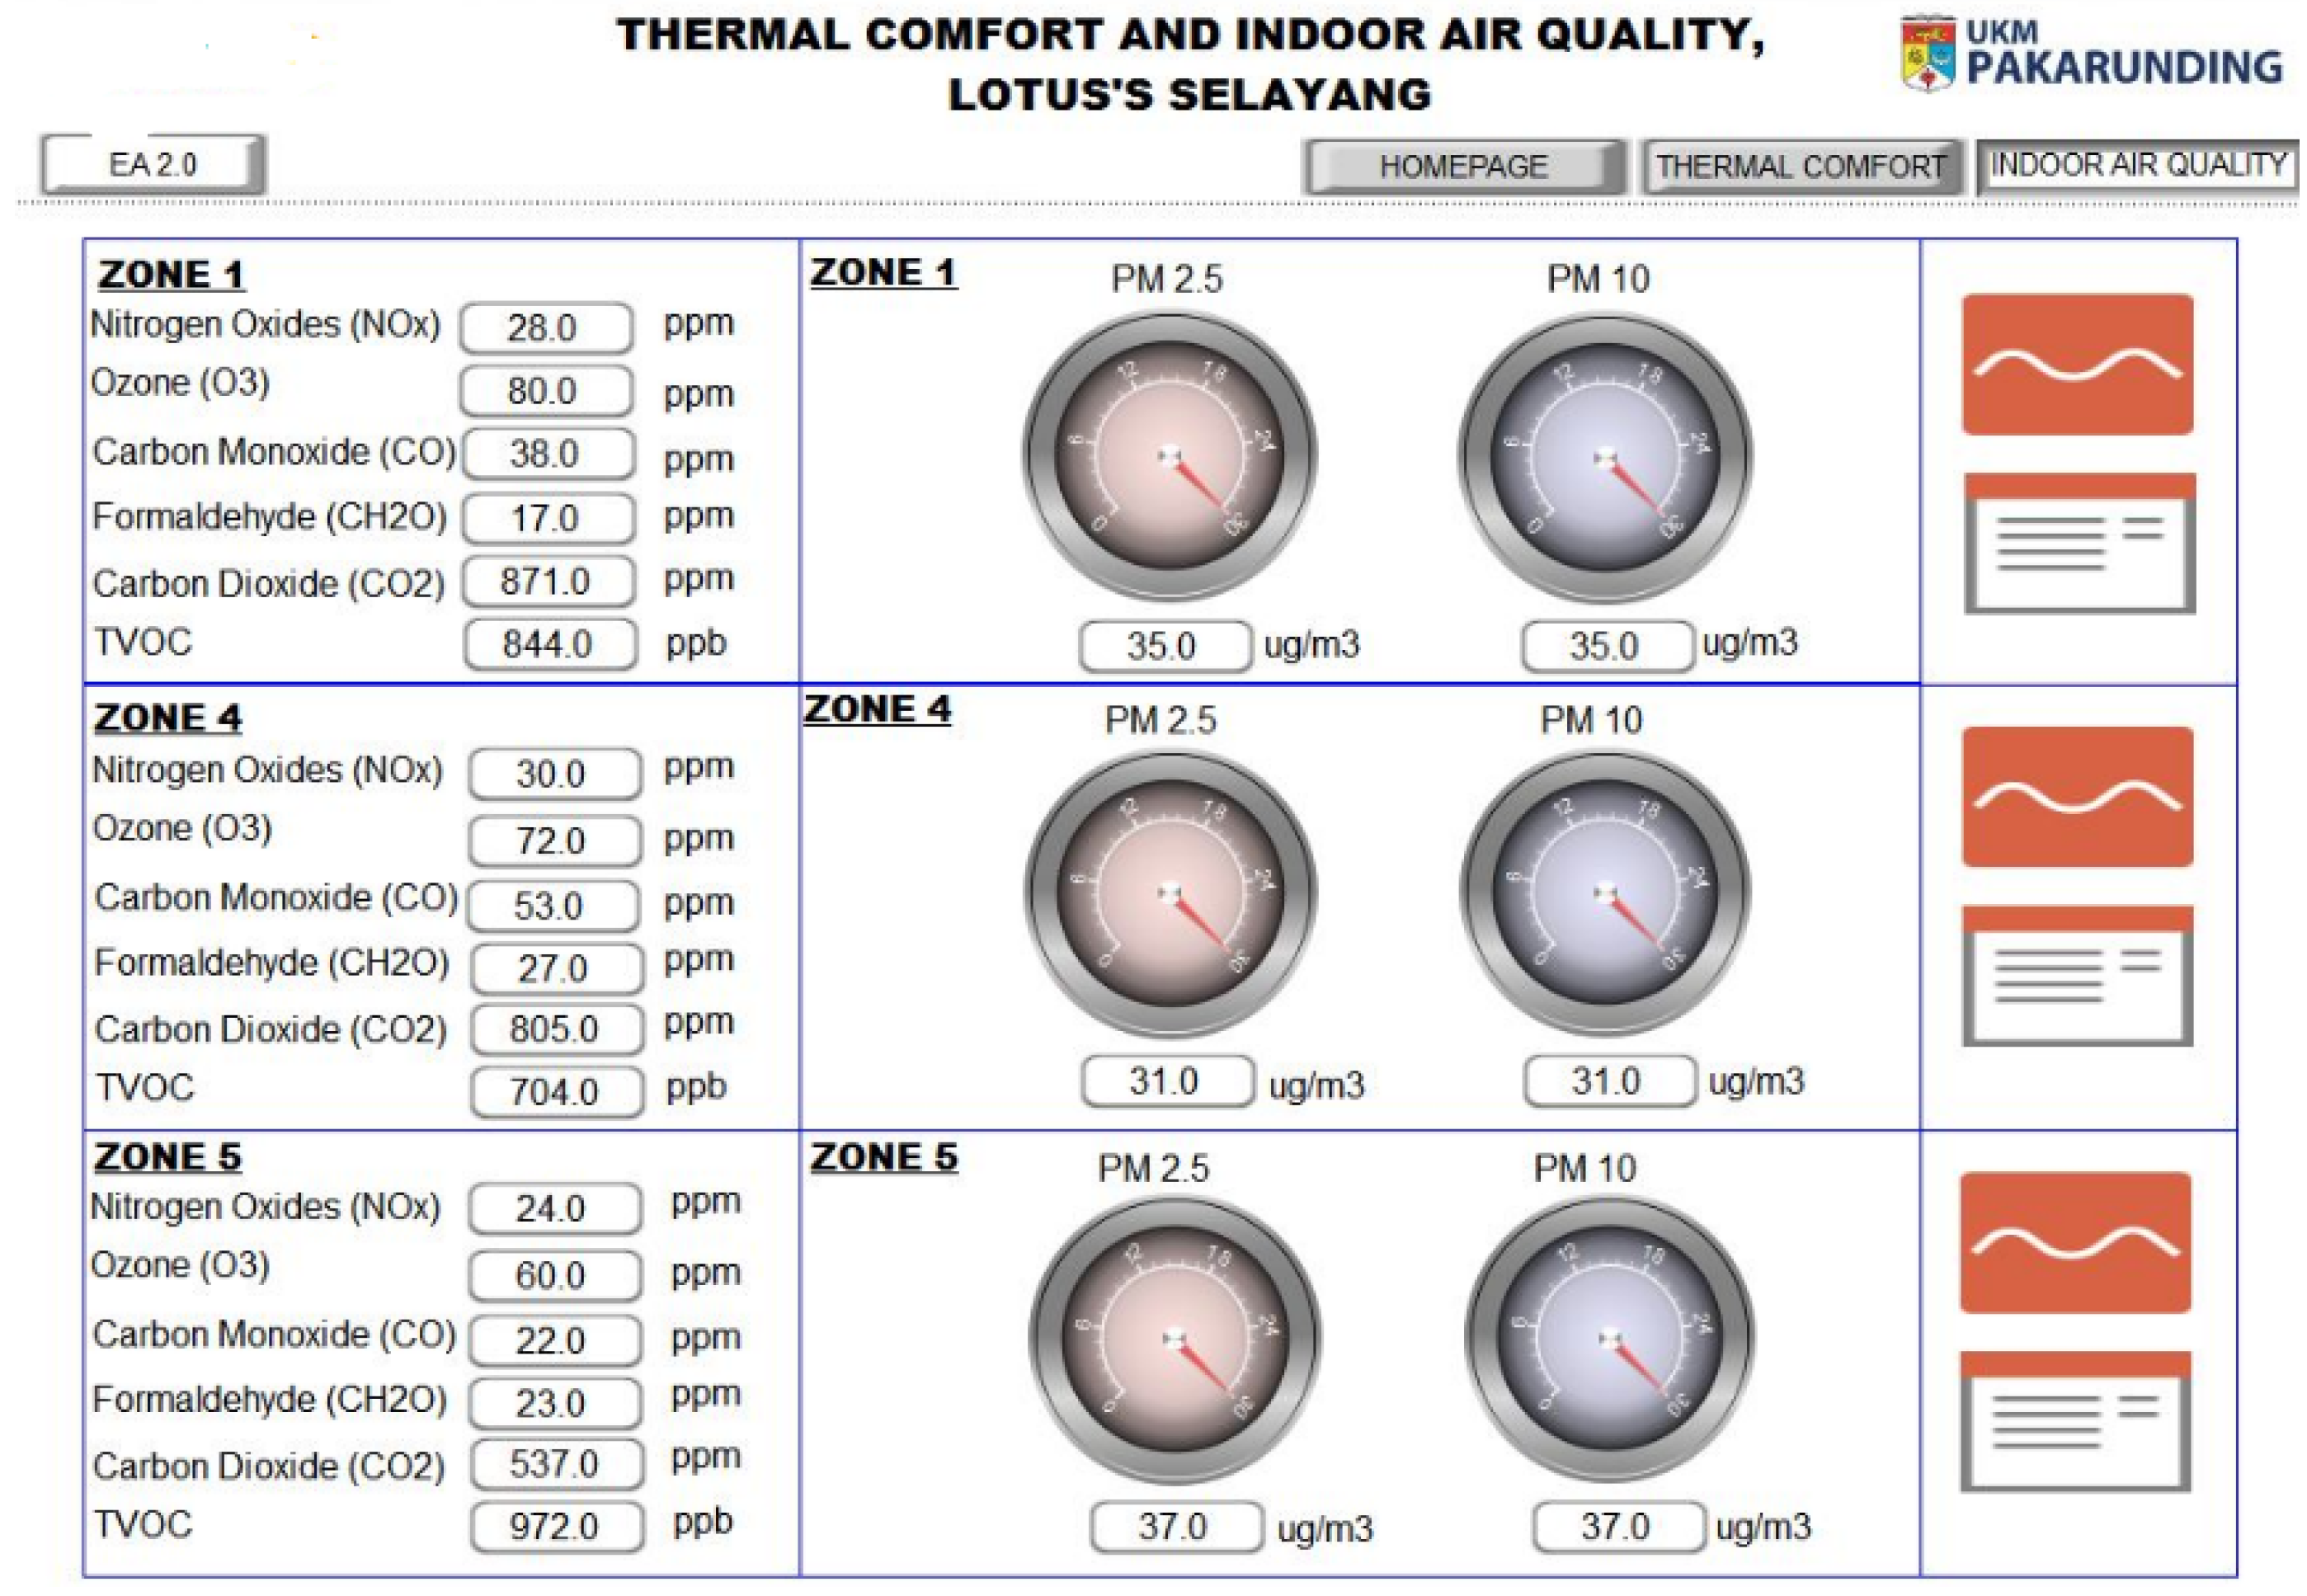
Figure 3.
Graphical Representation of the Data Collection Dashboard.
4.5. Method Used for Data Collection
Below are the tables showing the measurement parameters, unit, and standards compliance for thermal comfort and indoor air quality (IAQ). However, the radiant temperature, air velocity, humidity, and ambient temperature are used to compute the Predicted Mean Vote (PMV) and Percentage of People Dissatisfied (PPD).
| No | Parameters | Unit | Range | Reference |
| 1 | PMV (Predicted Mean Vote) | +3 (hot) and -3(Cold) ASHRAE 55 / ISO 7730 / MS 1525 comfort range -0.5 to 0.5 | ASHRAE 55 [7], ISO 7730 [15], MS 1525 [16] | |
| 2 | PPD (Percentage of People Dissatisfied) | % | ASHRAE 55 / ISO 7730 / MS 1525 Below 20% |
ASHRAE 55 [7], ISO 7730 [15], MS 1525 [16] |
| 3 | Carbon Dioxide (CO2) | ppm | 1000 ppm (ASHRAE 62) | ASHRAE 62 [13] |
| 4 | PM2.5 (Particulate Matter) | μg/m3 | 35 μg/m3 (microgram per cubic meter) for 24 24-hour periods (New Malaysia Ambient Air Quality Standard or NMAAQS) for WHO is 25 μg/m3 | NMAAQS [17], WHO [8] |
| 5 | PM10 (Particulate Matter) | μg/m3 | 100 μg/m3 (microgram per cubic meter) for 24-hour periods (New Malaysia Ambient Air Quality Standard or NMAAQS) | NMAAQS [17] |
| 6 | TVOC | ppb | 3 ppm or 3000 ppb (DOSH) | DOSH [18] |
| 7 | Formaldehyde (CH2O) | ppb | 0.75ppm or 750 ppb measured as an 8 hr time exposure (OSHA) | OSHA [19] |
5. Thermal Comfort Models: PMV and PPD
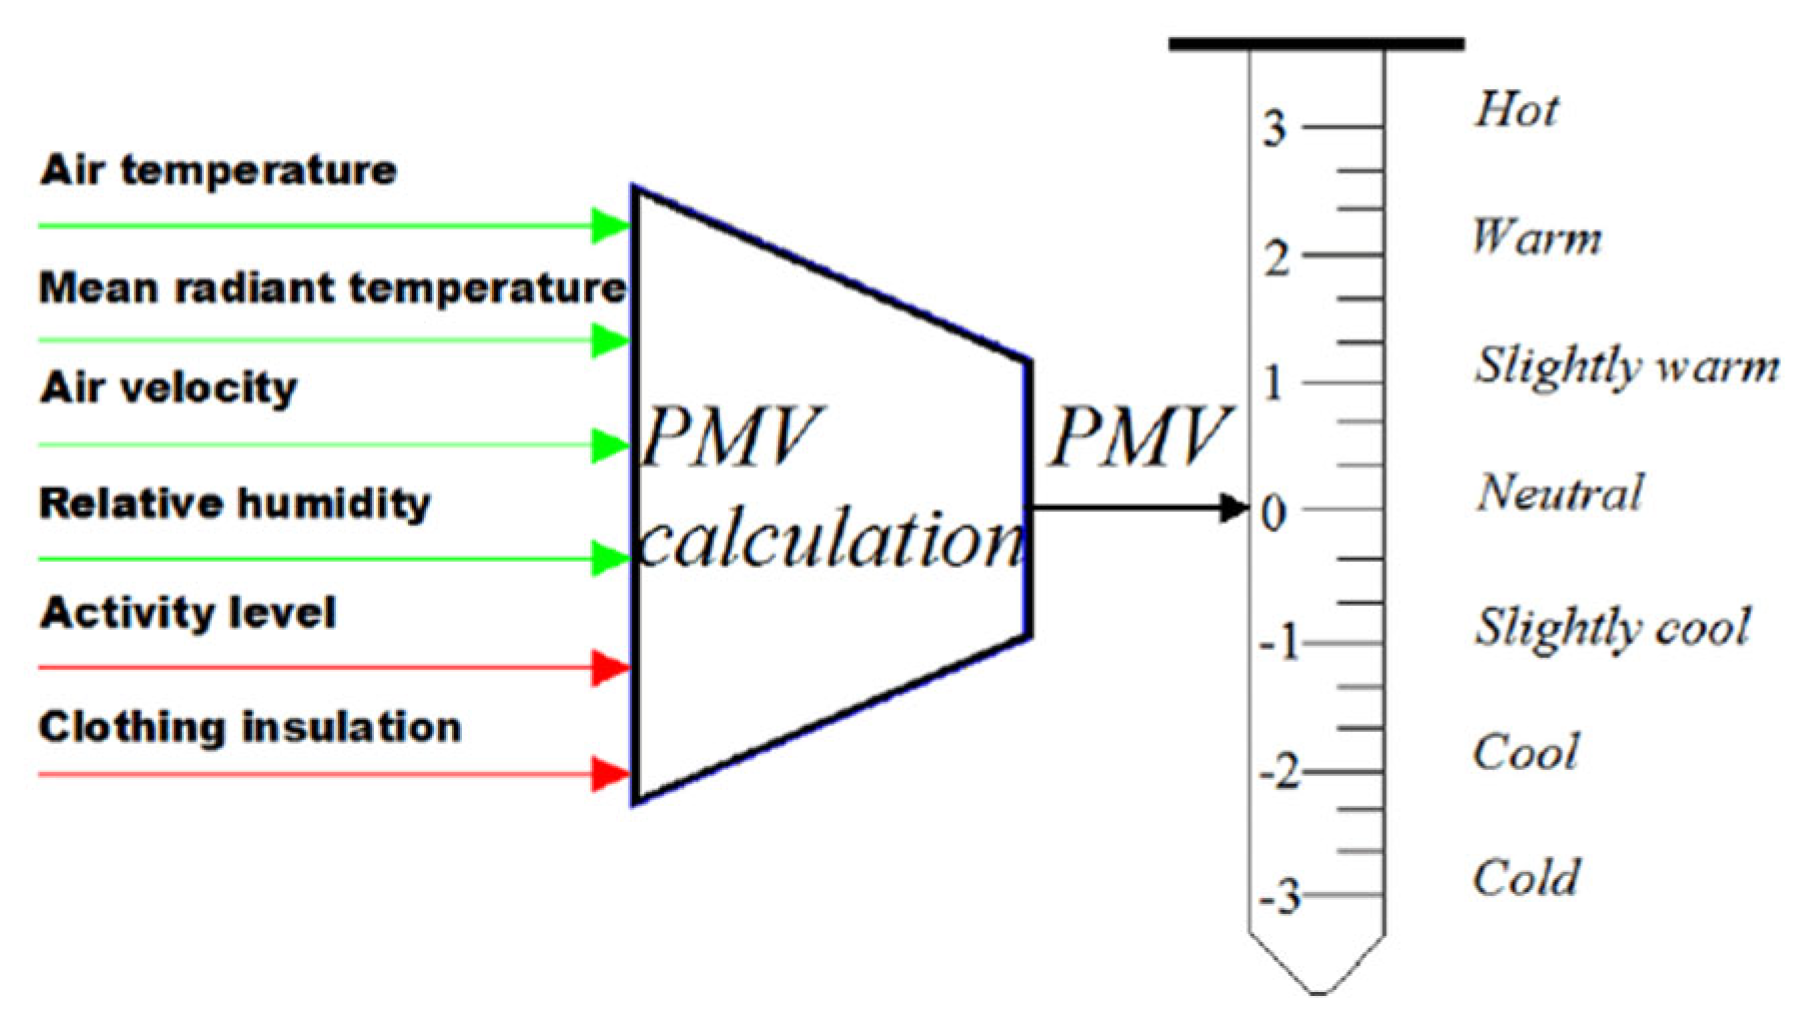
To assess thermal comfort in the hypermarket, the Predicted Mean Vote (PMV) and Predicted Percentage of Dissatisfied (PPD) models were employed. These models, rooted in ASHRAE Standard 55 [7), provide a quantitative framework for evaluating the thermal environment. The PMV model considers key parameters, including air temperature, air velocity, relative humidity, mean radiant temperature, metabolic rate, and clothing insulation. By balancing these variables, PMV predicts the average thermal sensation of a group of occupants on a scale from -3 (cold) to +3 (hot).
The PPD model complements PMV by estimating the percentage of occupants likely to feel dissatisfied under the given thermal conditions. This dual approach ensures a comprehensive analysis of thermal comfort, allowing the study to identify zones with significant deviations from optimal conditions.
The Thermal Comfort or PMV and PPD equation are as following:
The ASHRAE 55 standard provides an alternative formula for calculating the Predicted Mean Vote(PMV) that differs slightly from the original PMV formula. The formula based on ASHRAE 55 is as follows:
PMV = 0.3035 – 0.028 * M – 0.000013 * M^2 + 0.000487 * M * (T_a-100) + 0.0105 * v_a^15 + f-cl [t_cl – 35.0) / (3.96 * 10^(-8) * f_c * (t_s – t_cl) + 0.1) – 4.0]
Where:
M is the metabolic rate in met units
T_a is the dry bulb ait temperature in °C
v-a is the air velocity in m/s
f_cl is the clothing insulation in clo units
t_cl is the average surface temperature of the clothing in °C
t_s is the mean radiant temperature in °C
f_c is the convective heat exchange coefficient in W/(m^2∙K)
Whilst the Percentage of People Dissatisfied (PPD) eqution is derevied from PMV readings. The PPD equation is as follows:
PPD is a measure of the number of people likely to feel uncomfortably warm or cool in a given environment, i.e., the number of people voting -3, -2, +2 or +3 within the PMV scale.
PPD = 100 – 95.0 exp [-(0.03353 PMV4 + 0.2179 PMV2)]
The PPD index predicts the number of thermally dissatisfied people within a large group. The rest of the group would vote -1,0 or +1 on the PMV scale. The minimum PPD is 5%.
Figure 4.
6. IAQ Assessment
Indoor Air Quality was assessed through measurements of Carbon Dioxide, Total Volatile Organic Compounds, Particulate Matter (PM2.5 and PM10). The hypermarket's IAQ parameters, namely CO2, TVOC, PM2.5, and PM10, were measured across the diverse zones, and the findings were compared against the ASHRAE 62 and WHO guidelines.
The study's comprehensive analysis of the hypermarket's thermal comfort and IAQ revealed distinct challenges across the various zones.
Key IAQ Metrics and Their Calculations:
• CO2 Concentration:
• PM2.5 and PM10 Concentrations:
• Relative Humidity (RH):
7. Benchmarking against ASHRAE 55 and ASHARE 62 Standards
Data were analyzed using statistical tools to identify trends, anomalies, and interrelations between thermal comfort and IAQ. The results were benchmarked against:
According to ISO 7730 [15], PMV and PPD indices provide a robust framework for evaluating thermal comfort across various indoor environments [14]. Comparative analyses with existing literature were made to validate findings [15], and recommendations were designed to address observed discrepancies [21]. These references particularly emphasize validated IAQ audit protocols and the need for thermal comfort alignment in office environments, which are applicable to the challenges identified in Zone 5.
8. Results and Discussion
The data measurement results and analysis are based on each of the parameters. Each of the parameters is analysed based on the respective zones.
The following graph shows the overall trend from the 4th to 8th October 2023.
8.1. Thermal Comfort Analysis
8.1.1. Predicted Mean Vote (PMV)
This bar chart presents the Predicted Mean Vote (PMV) values for each zone. The PMV index quantifies thermal comfort on a scale from -3 (cold) to +3 (hot), with values between -0.5 and +0.5 considered optimal for indoor environments (marked with dashed lines).
Figure 5.
PMV values recorded across different zones, illustrating variations in thermal comfort conditions.
Figure 5.
PMV values recorded across different zones, illustrating variations in thermal comfort conditions.
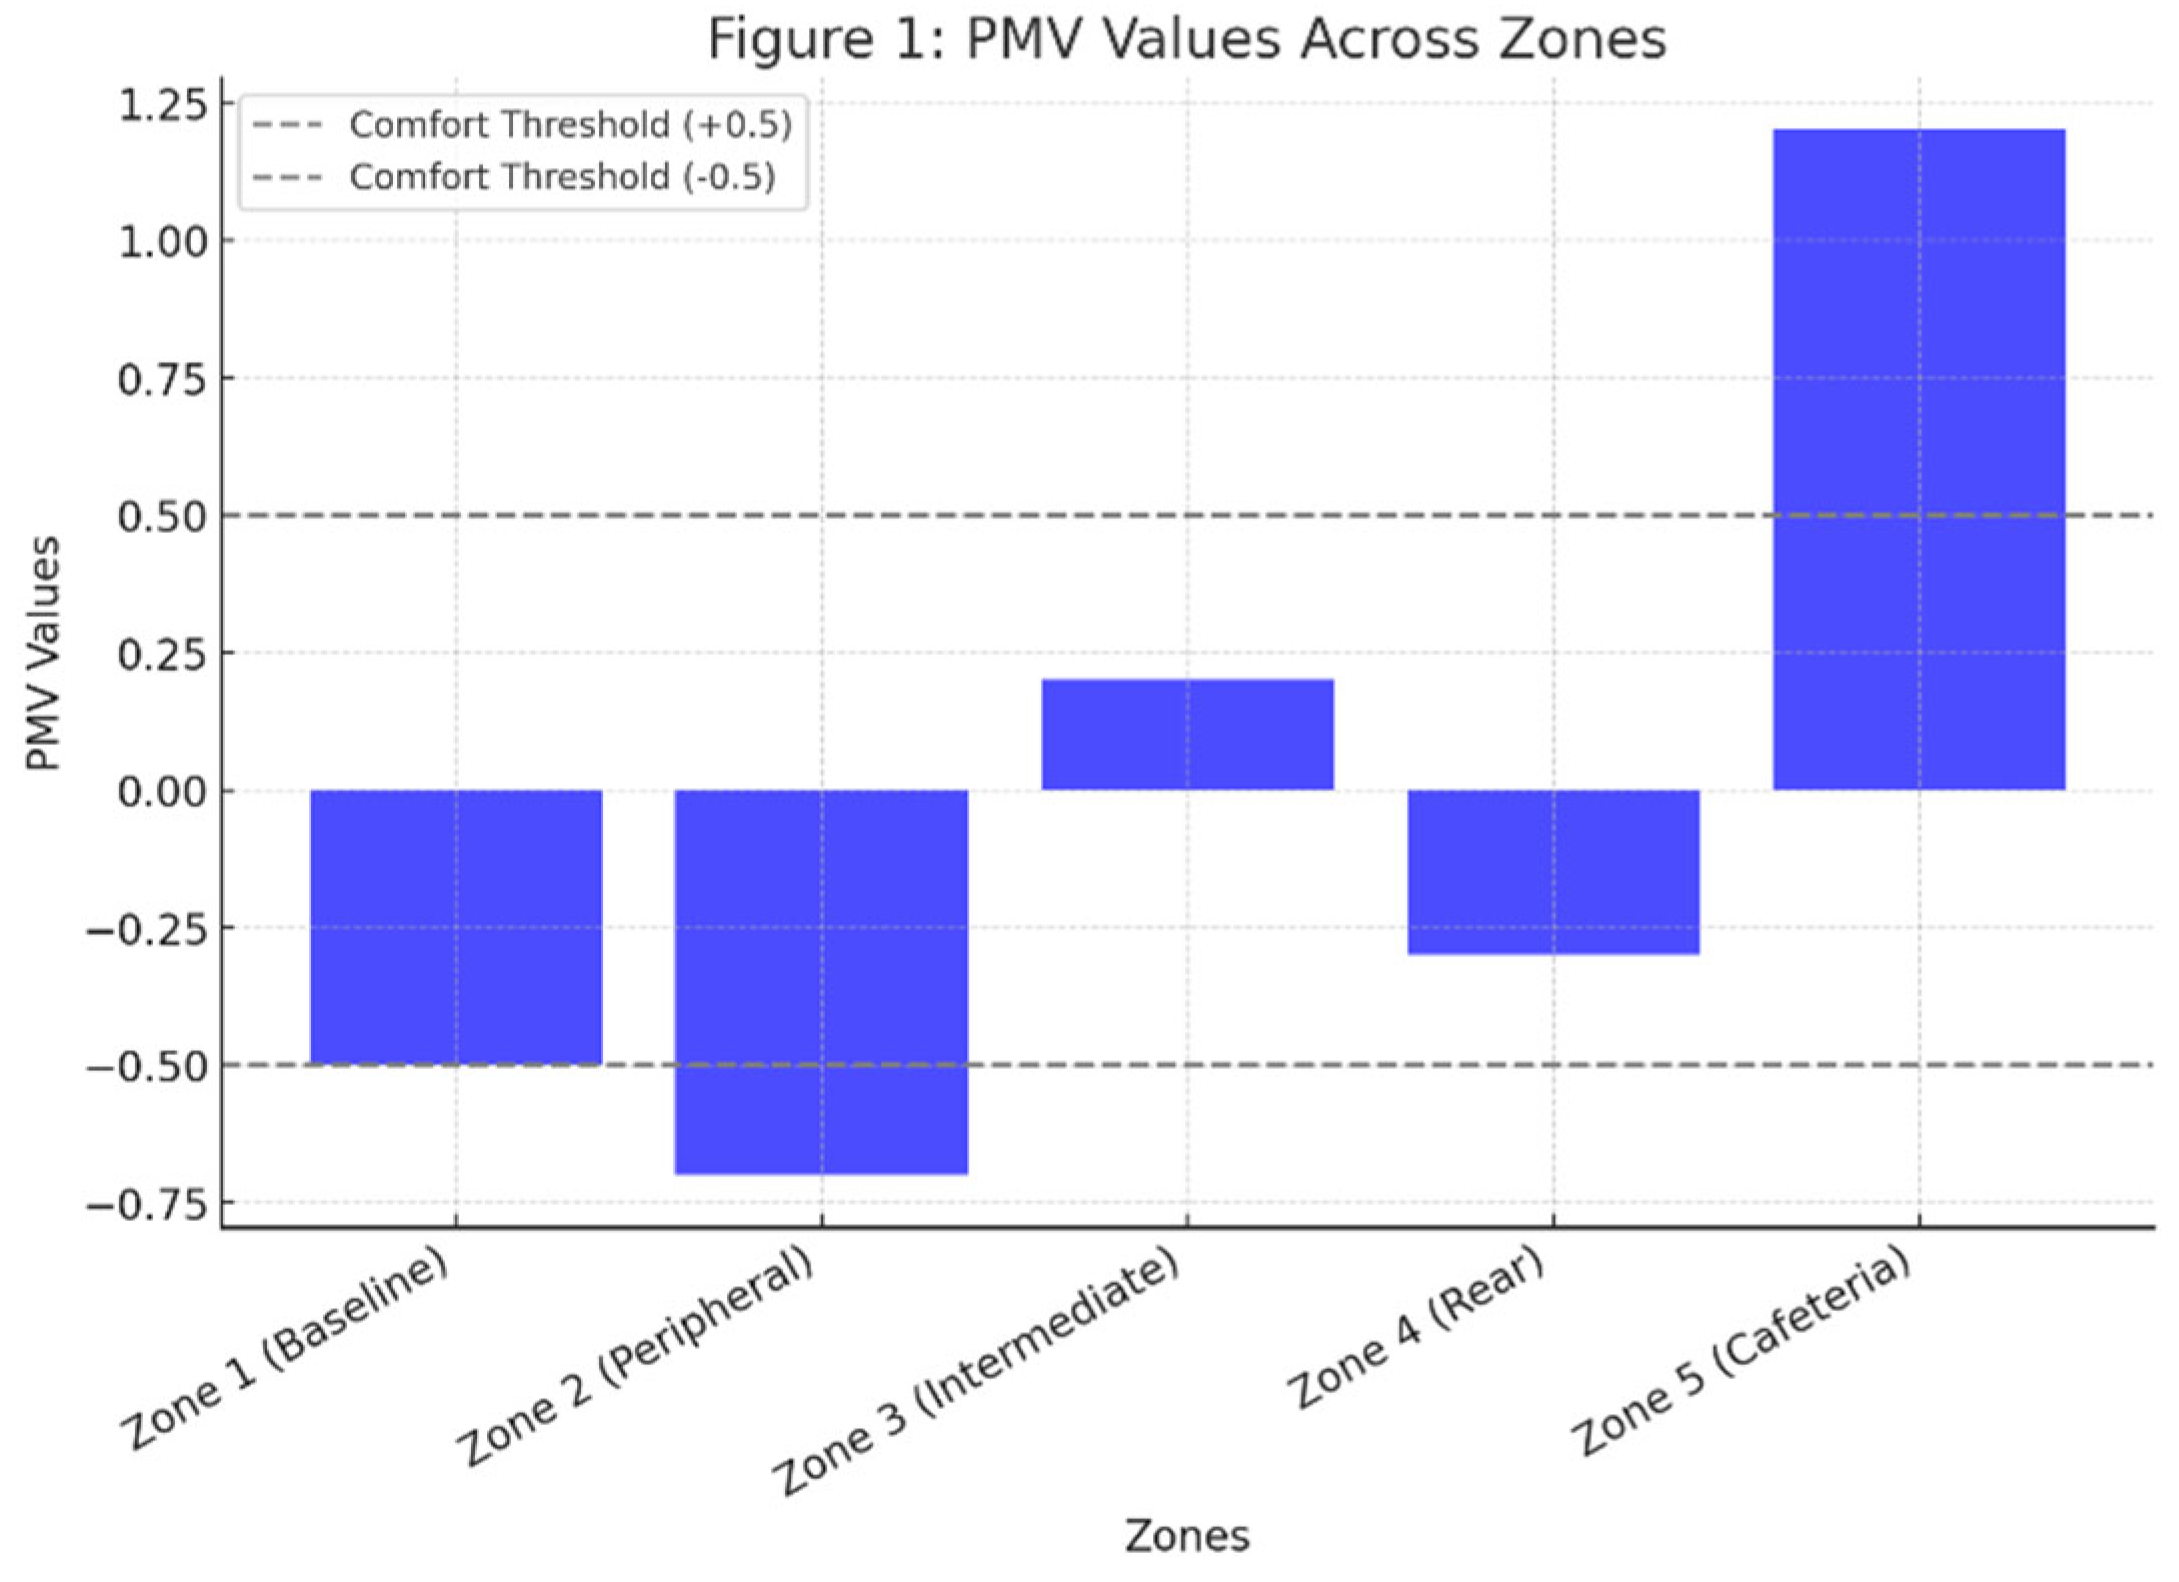
- Zone 1 (Baseline): PMV -0.5, reflecting slightly cool conditions due to effective cooling strategies.
- Zone 2 (Peripheral): PMV -0.7, indicating overcooling due to low occupancy and excessive cooling.
- Zone 3 (Intermediate): PMV 0.2, suggesting near-neutral conditions, ensuring balanced comfort.
- Zone 4 (Rear): PMV -0.3, reflecting slightly cool conditions caused by suboptimal ventilation control.
- Zone 5 (Cafeteria): PMV 1.2, significantly exceeding the comfort threshold, indicating excessive warmth due to cooking activities and inadequate cooling.
8.1.2. Percentage of People Dissatisfied (PPD) Across Zones
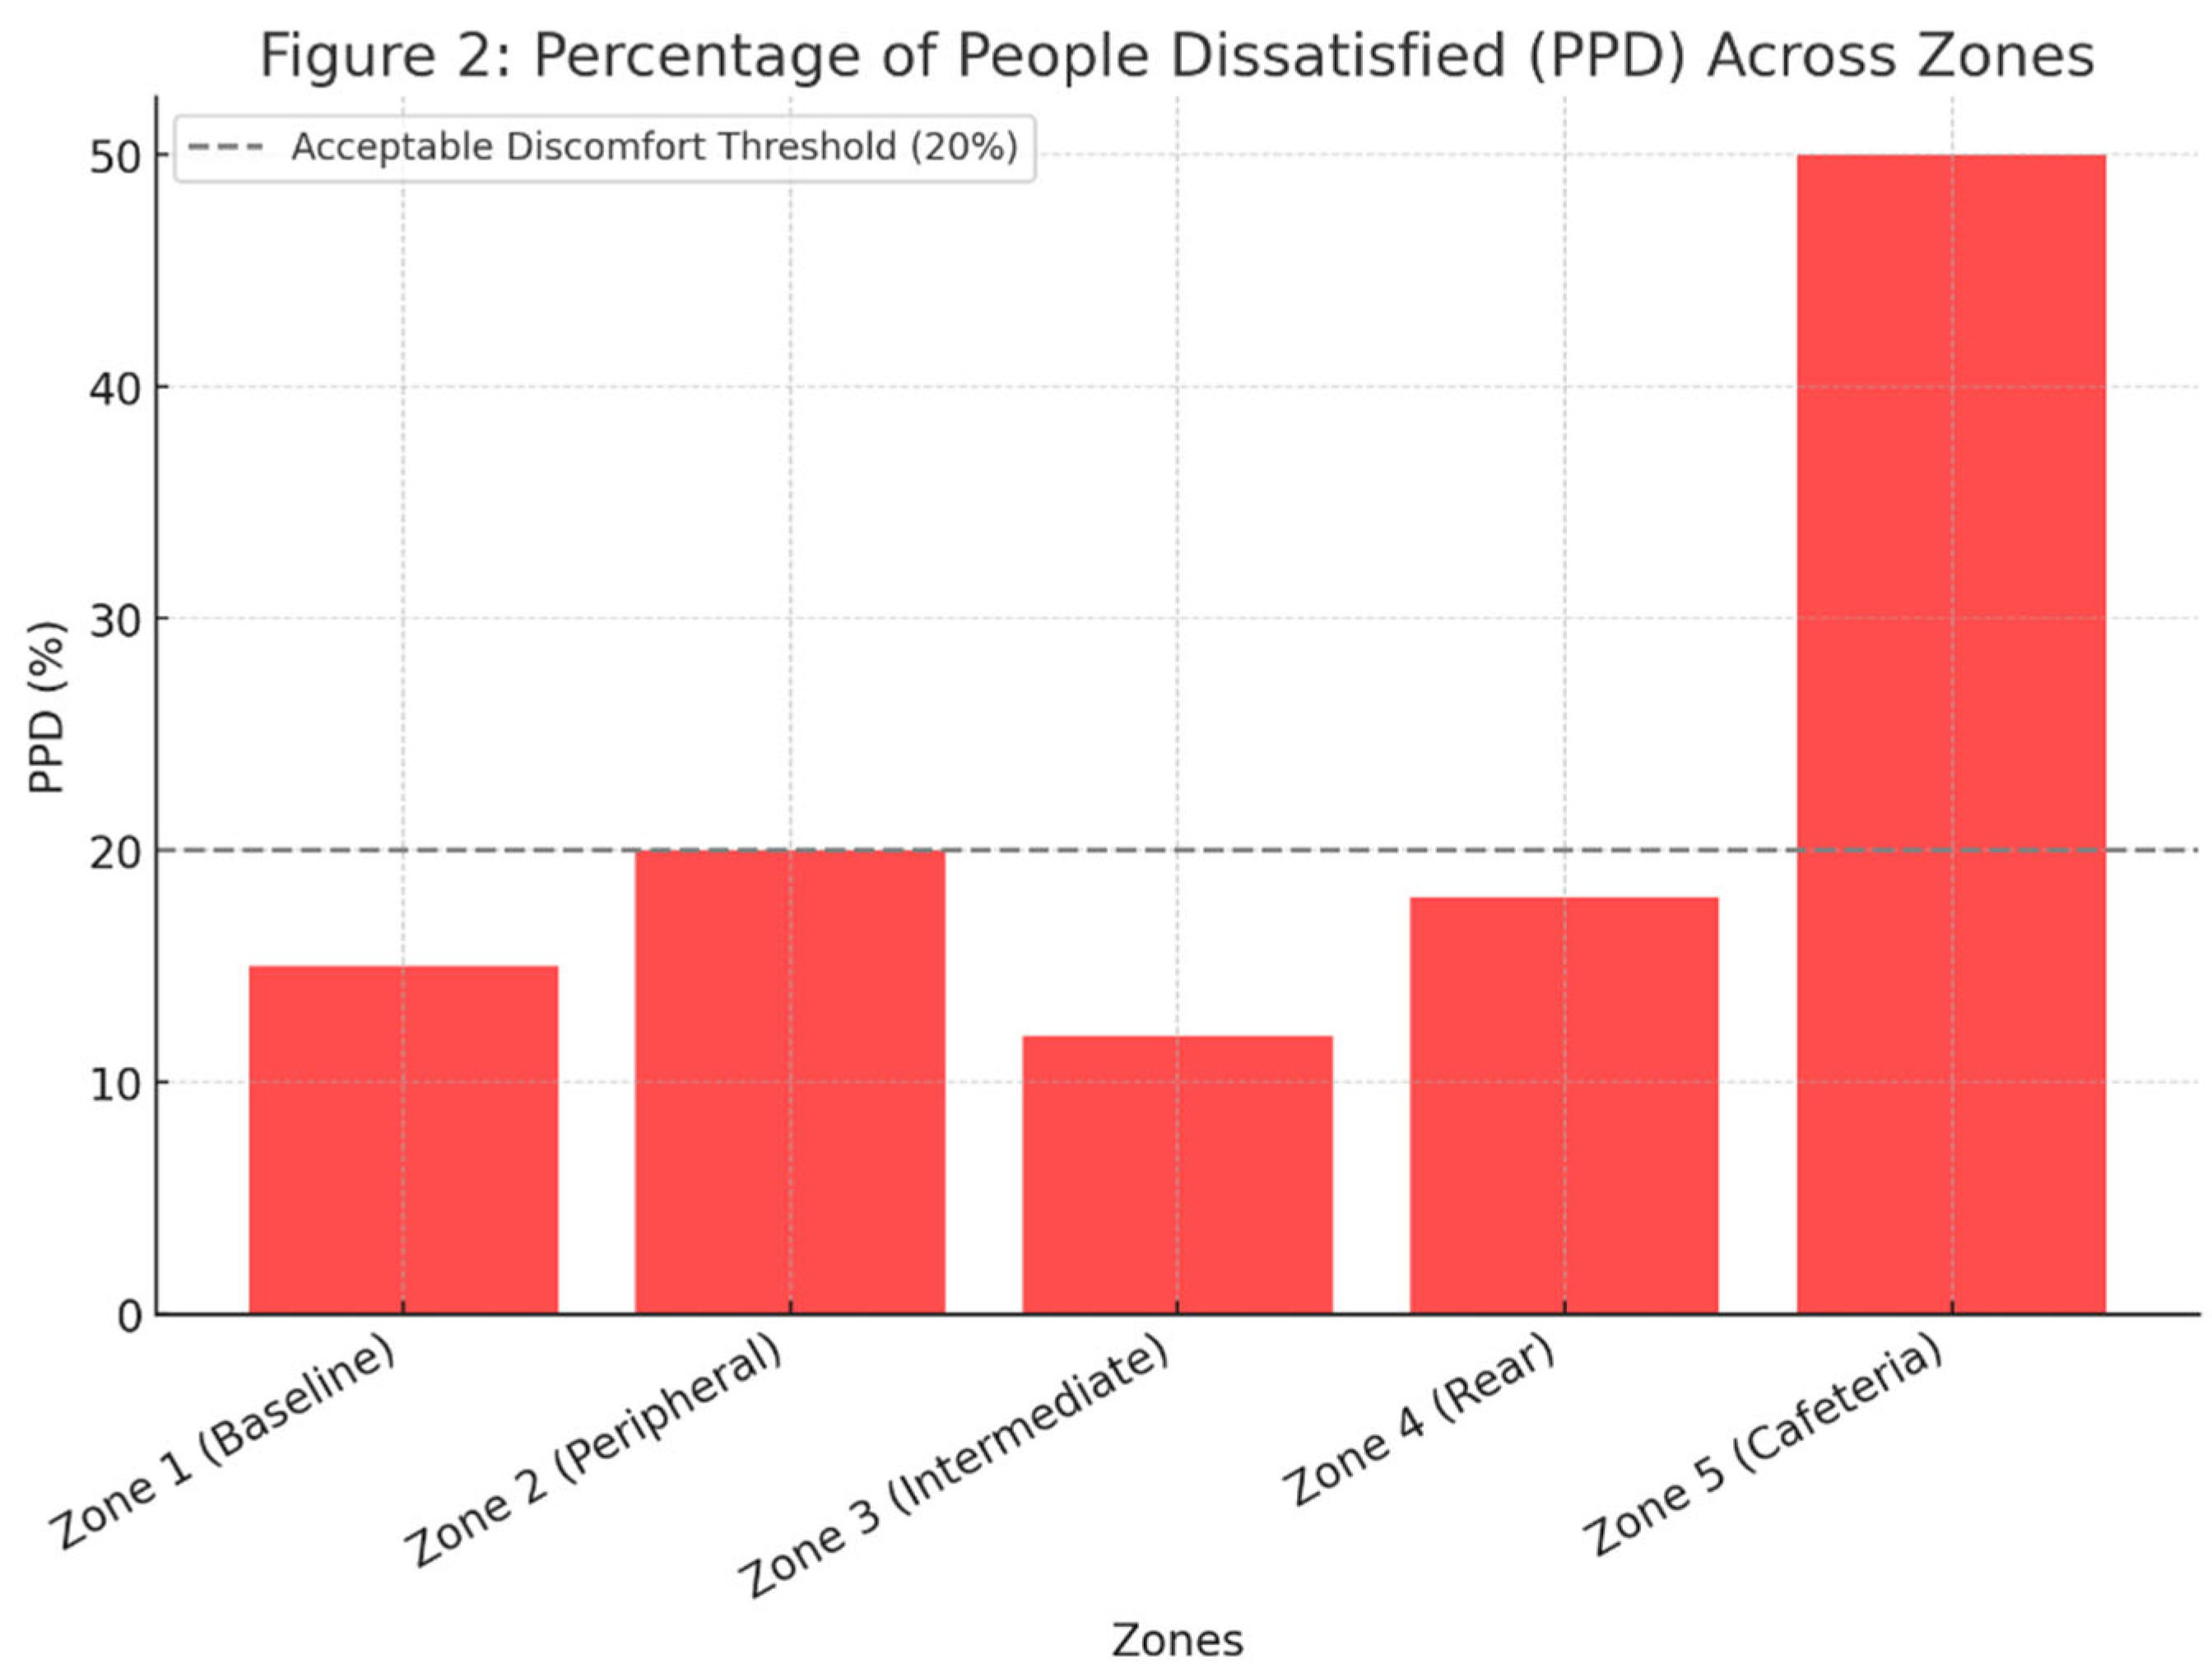
The PPD index estimates the proportion of occupants likely to experience thermal discomfort, with values below 20% considered acceptable. This bar chart highlights dissatisfaction levels across different zones, with the 20% acceptability threshold marked with a dashed line.
Figure 6.
Percentage of People Dissatisfied (PPD) across zones, highlighting areas with significant thermal discomfort.
Figure 6.
Percentage of People Dissatisfied (PPD) across zones, highlighting areas with significant thermal discomfort.
Findings:
- Zone 1 (Baseline): PPD = 15%, indicating moderate dissatisfaction, particularly during non-peak hours when cooling is excessive.
- Zone 2 (Peripheral): PPD = 20%, at the threshold of acceptability, highlighting discomfort due to overcooling.
- Zone 3 (Intermediate): PPD = 12%, the lowest dissatisfaction rate, confirming optimal thermal comfort in this zone.
- Zone 4 (Rear): PPD = 18%, showing moderate dissatisfaction, particularly during peak occupancy periods.
- Zone 5 (Cafeteria): PPD = 50%, the highest dissatisfaction level, driven by excessive heat and inadequate cooling measures.
8.1.3. Air Quality Analysis
CO₂ Concentration (ppm)
CO₂ levels serve as an indicator of indoor air quality and ventilation effectiveness. Zones with higher occupancy or poor ventilation tend to exhibit elevated CO₂ concentrations.
Figure 6.
CO₂ levels measured across zones, indicating ventilation efficiency and occupancy-related variations.
Figure 6.
CO₂ levels measured across zones, indicating ventilation efficiency and occupancy-related variations.
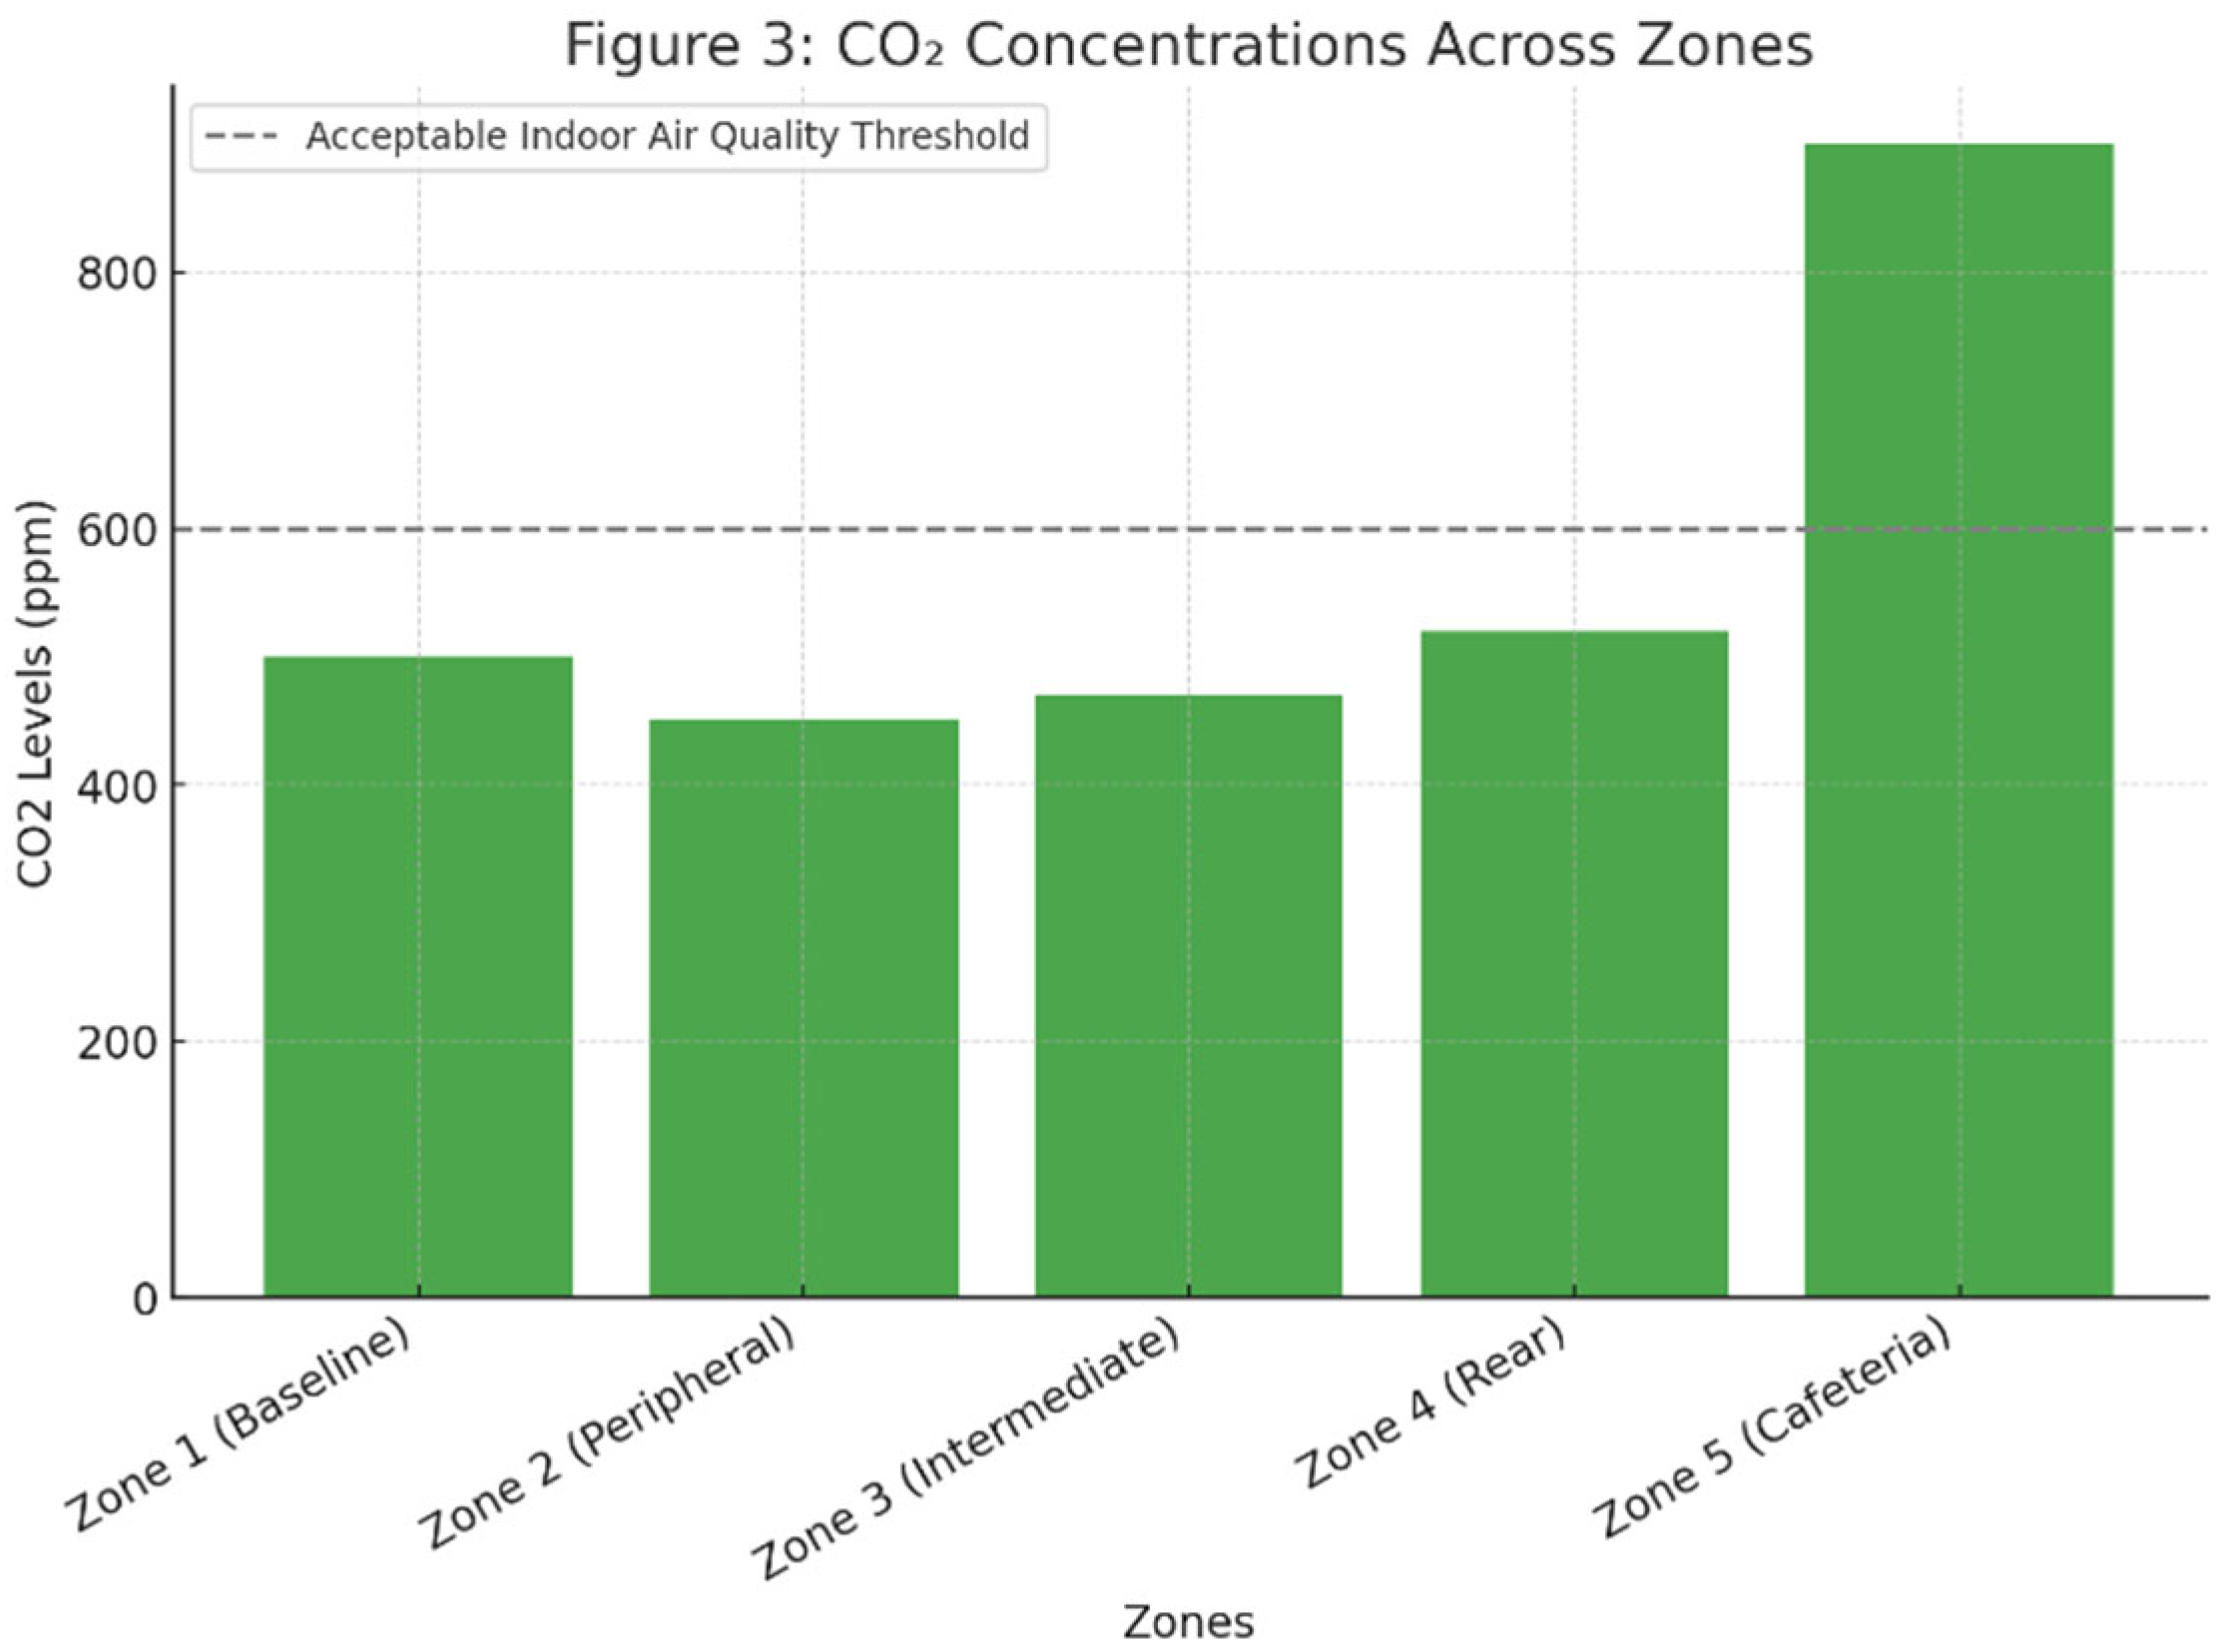
- Zone 1 (Baseline): CO₂ levels were 500 ppm, indicating adequate ventilation in this high-traffic zone.
- Zone 2 (Peripheral): Lower at 450 ppm, consistent with reduced occupancy.
- Zone 3 (Intermediate): Moderately balanced at 470 ppm, suggesting effective air exchange.
- Zone 4 (Rear): Slightly elevated at 520 ppm, which may be due to less effective ventilation mechanisms in this enclosed area.
- Zone 5 (Cafeteria): Significantly high at 900 ppm, indicating poor ventilation and high occupant density contributing to discomfort.
CO₂ accumulation in the cafeteria is particularly concerning, as prolonged exposure to elevated levels can impair cognitive function and occupant well-being. Improved air circulation and enhanced ventilation rates are necessary for this zone.
8.1.4. Total Volatile Organic Compounds (TVOC) (ppb)
TVOC levels provide insights into gaseous pollutants originating from cleaning agents, building materials, and human activities. The study found substantial variation in TVOC concentrations across zones.
- Zone 1 (Baseline): 820 ppb, indicating moderate exposure in a high-activity area.
- Zone 2 (Peripheral): 700 ppb, lower due to minimal pollutant sources.
- Zone 3 (Intermediate): 750 ppb, reflecting balanced conditions.
- Zone 4 (Rear): 850 ppb, elevated due to VOC emissions from stored materials.
- Zone 5 (Cafeteria): 1500 ppb, significantly high, linked to cooking emissions and insufficient ventilation.
The extreme TVOC concentration in Zone 5 (Cafeteria) highlights pollutant accumulation from food preparation activities, which may impact indoor air quality and respiratory health. This finding emphasizes the need for enhanced extraction systems and proper airflow management.
8.1.5. Particulate Matter (PM2.5 & PM10)
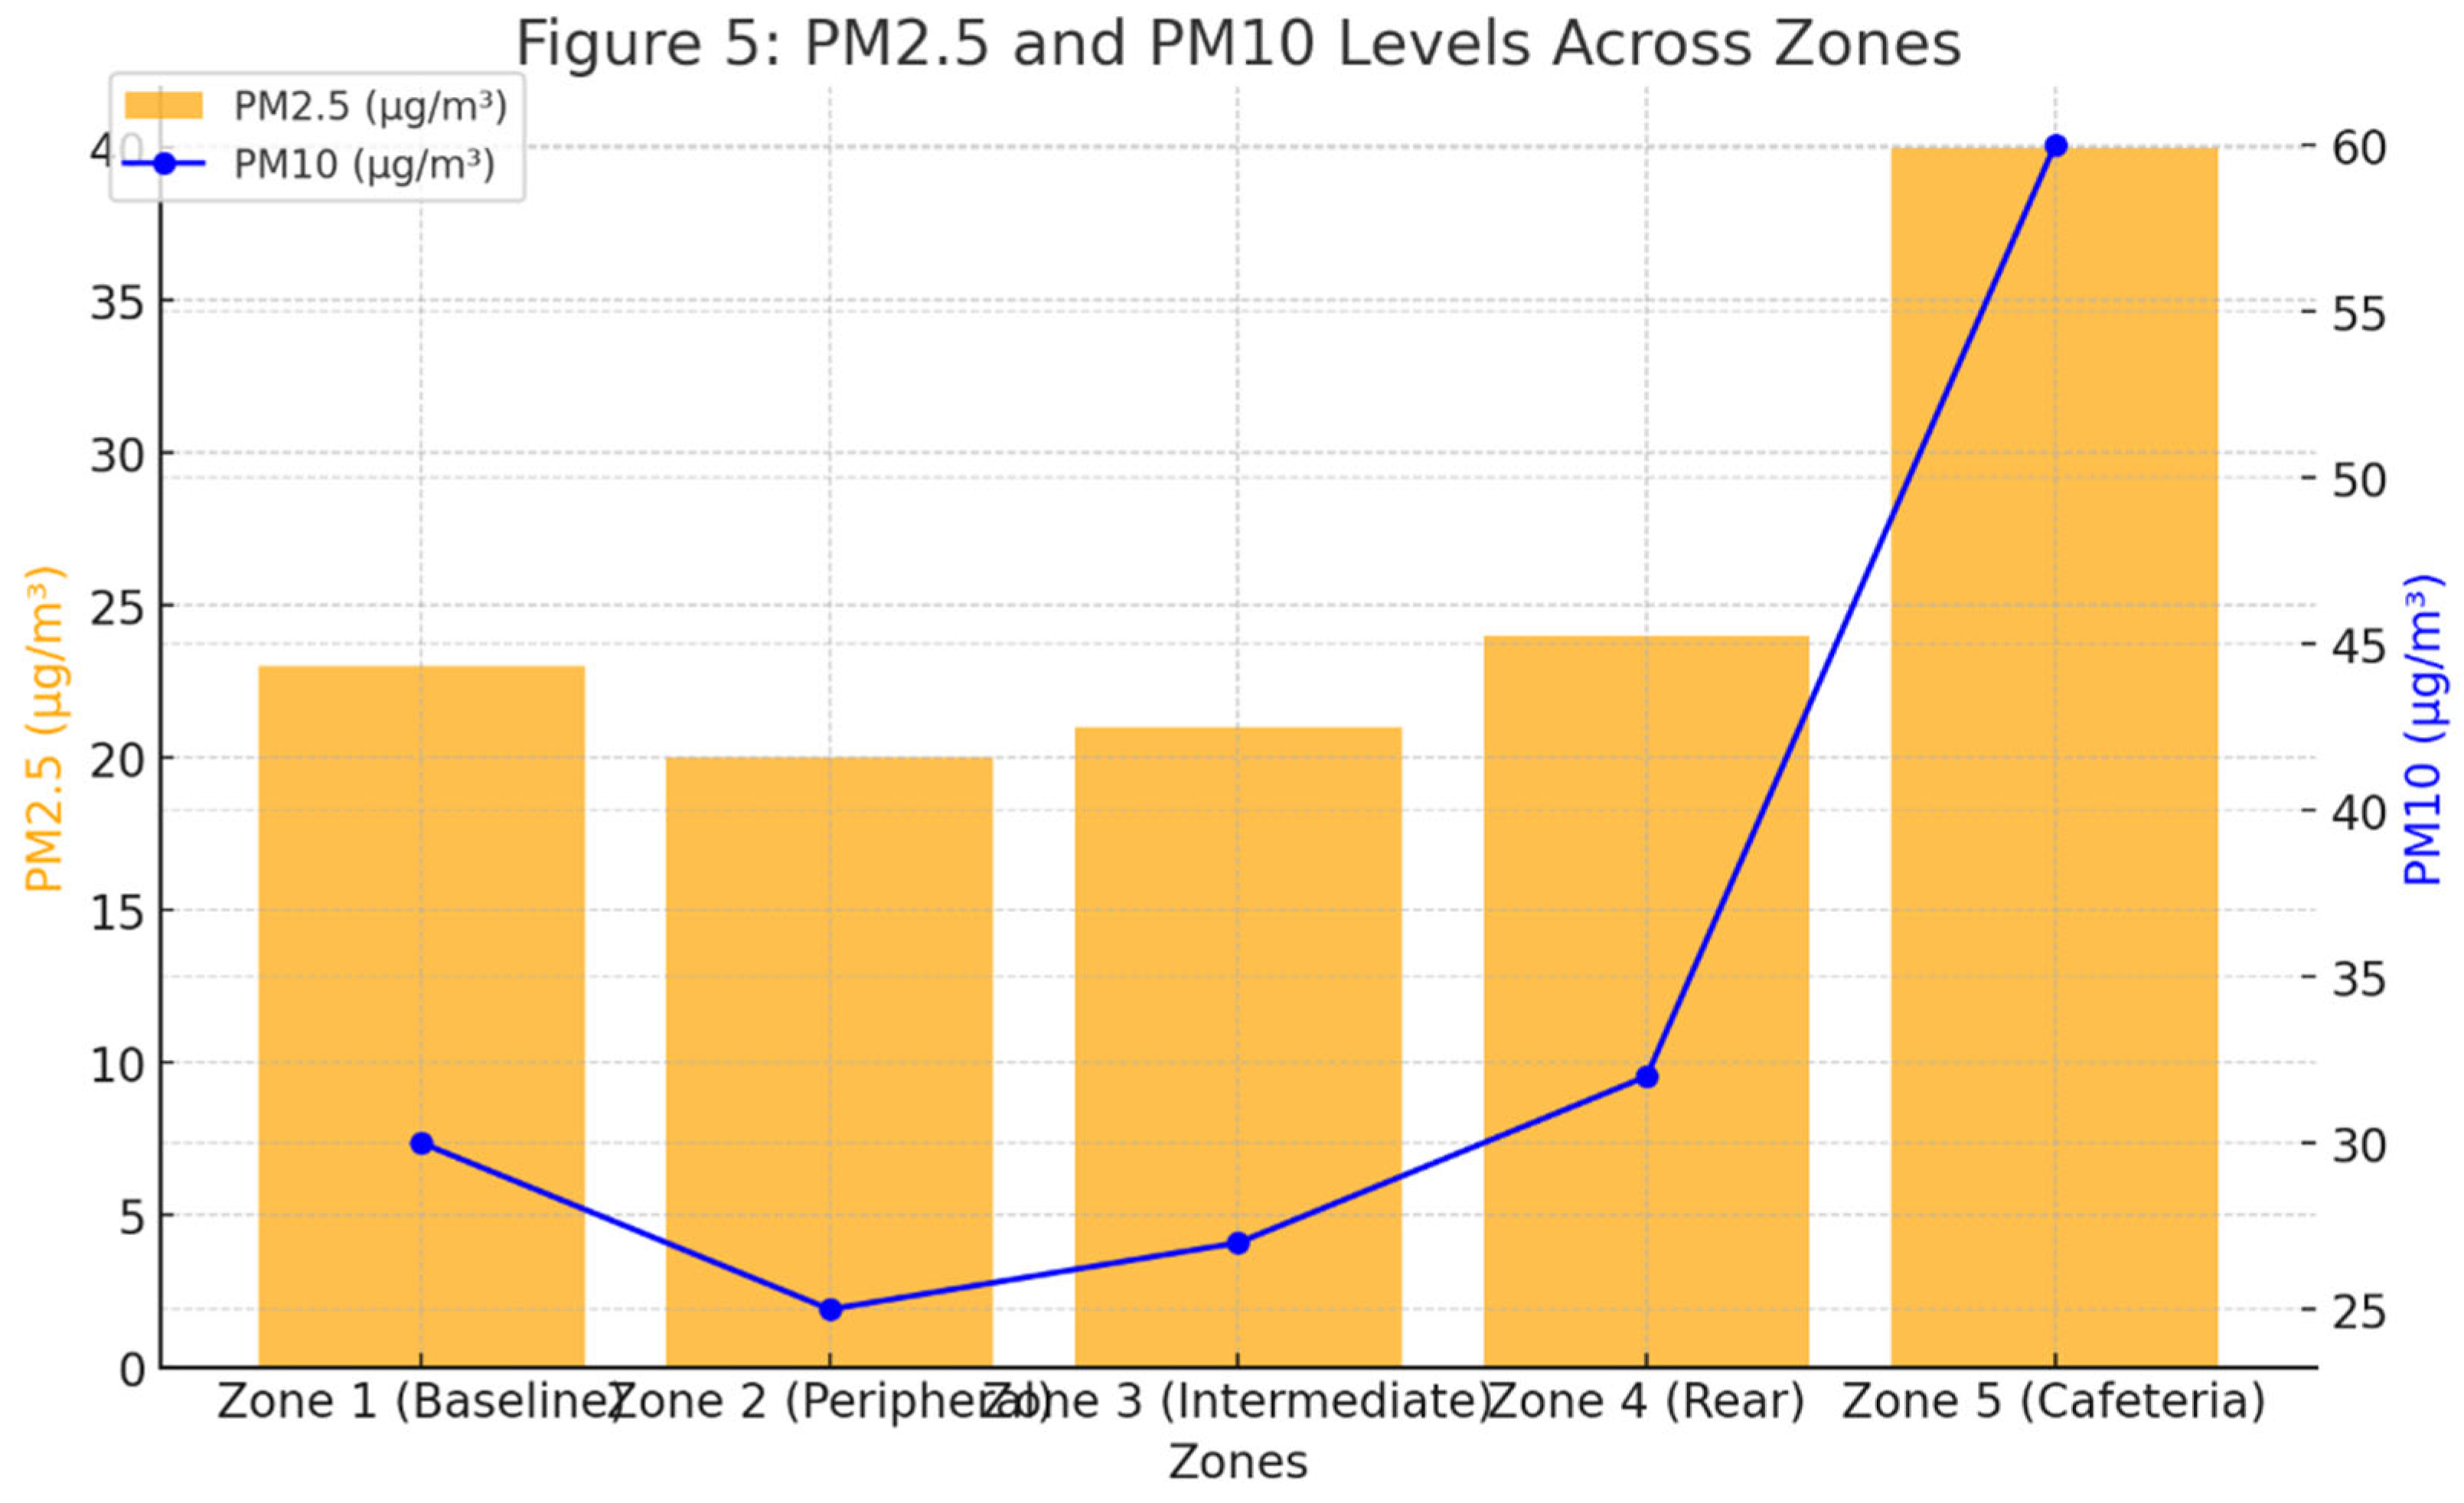
Particulate matter (PM) levels, particularly PM2.5 and PM10, directly impact indoor air quality and respiratory health. Areas with cooking activities or poor filtration showed higher concentrations.
PM2.5 (µg/m³)
- Zone 1: 23 µg/m³, moderate due to occupant activity and material use.
- Zone 2: 20 µg/m³, consistent with minimal dust and particulates.
- Zone 3: 21 µg/m³, reflecting balanced environmental conditions.
- Zone 4: 24 µg/m³, slightly elevated, likely due to storage dust and suboptimal air circulation.
Zone 5 (Cafeteria): 40 µg/m³, exceeding recommended limits due to cooking emissions and inadequate filtration.
PM10 (µg/m³)
- Zone 1: 30 µg/m³, within acceptable limits for retail spaces.
- Zone 2: 25 µg/m³, lower due to limited particulate sources.
- Zone 3: 27 µg/m³, indicating moderate activity-related emissions.
- Zone 4: 32 µg/m³, reflecting dust accumulation from storage materials.
- Zone 5 (Cafeteria): 60 µg/m³, significantly high, indicating substantial airborne particulate emissions from cooking activities.
Zones 4 and 5 showed elevated PM levels, particularly in the cafeteria, where cooking emissions contribute to poor air quality. This highlights the need for improved air filtration and ventilation measures.
8.2. PMV, PPD and IAQ Analysis (By Zone)
8.2.1. Zone 1: Retail Area (Baseline)
(i) Thermal Comfort Analysis
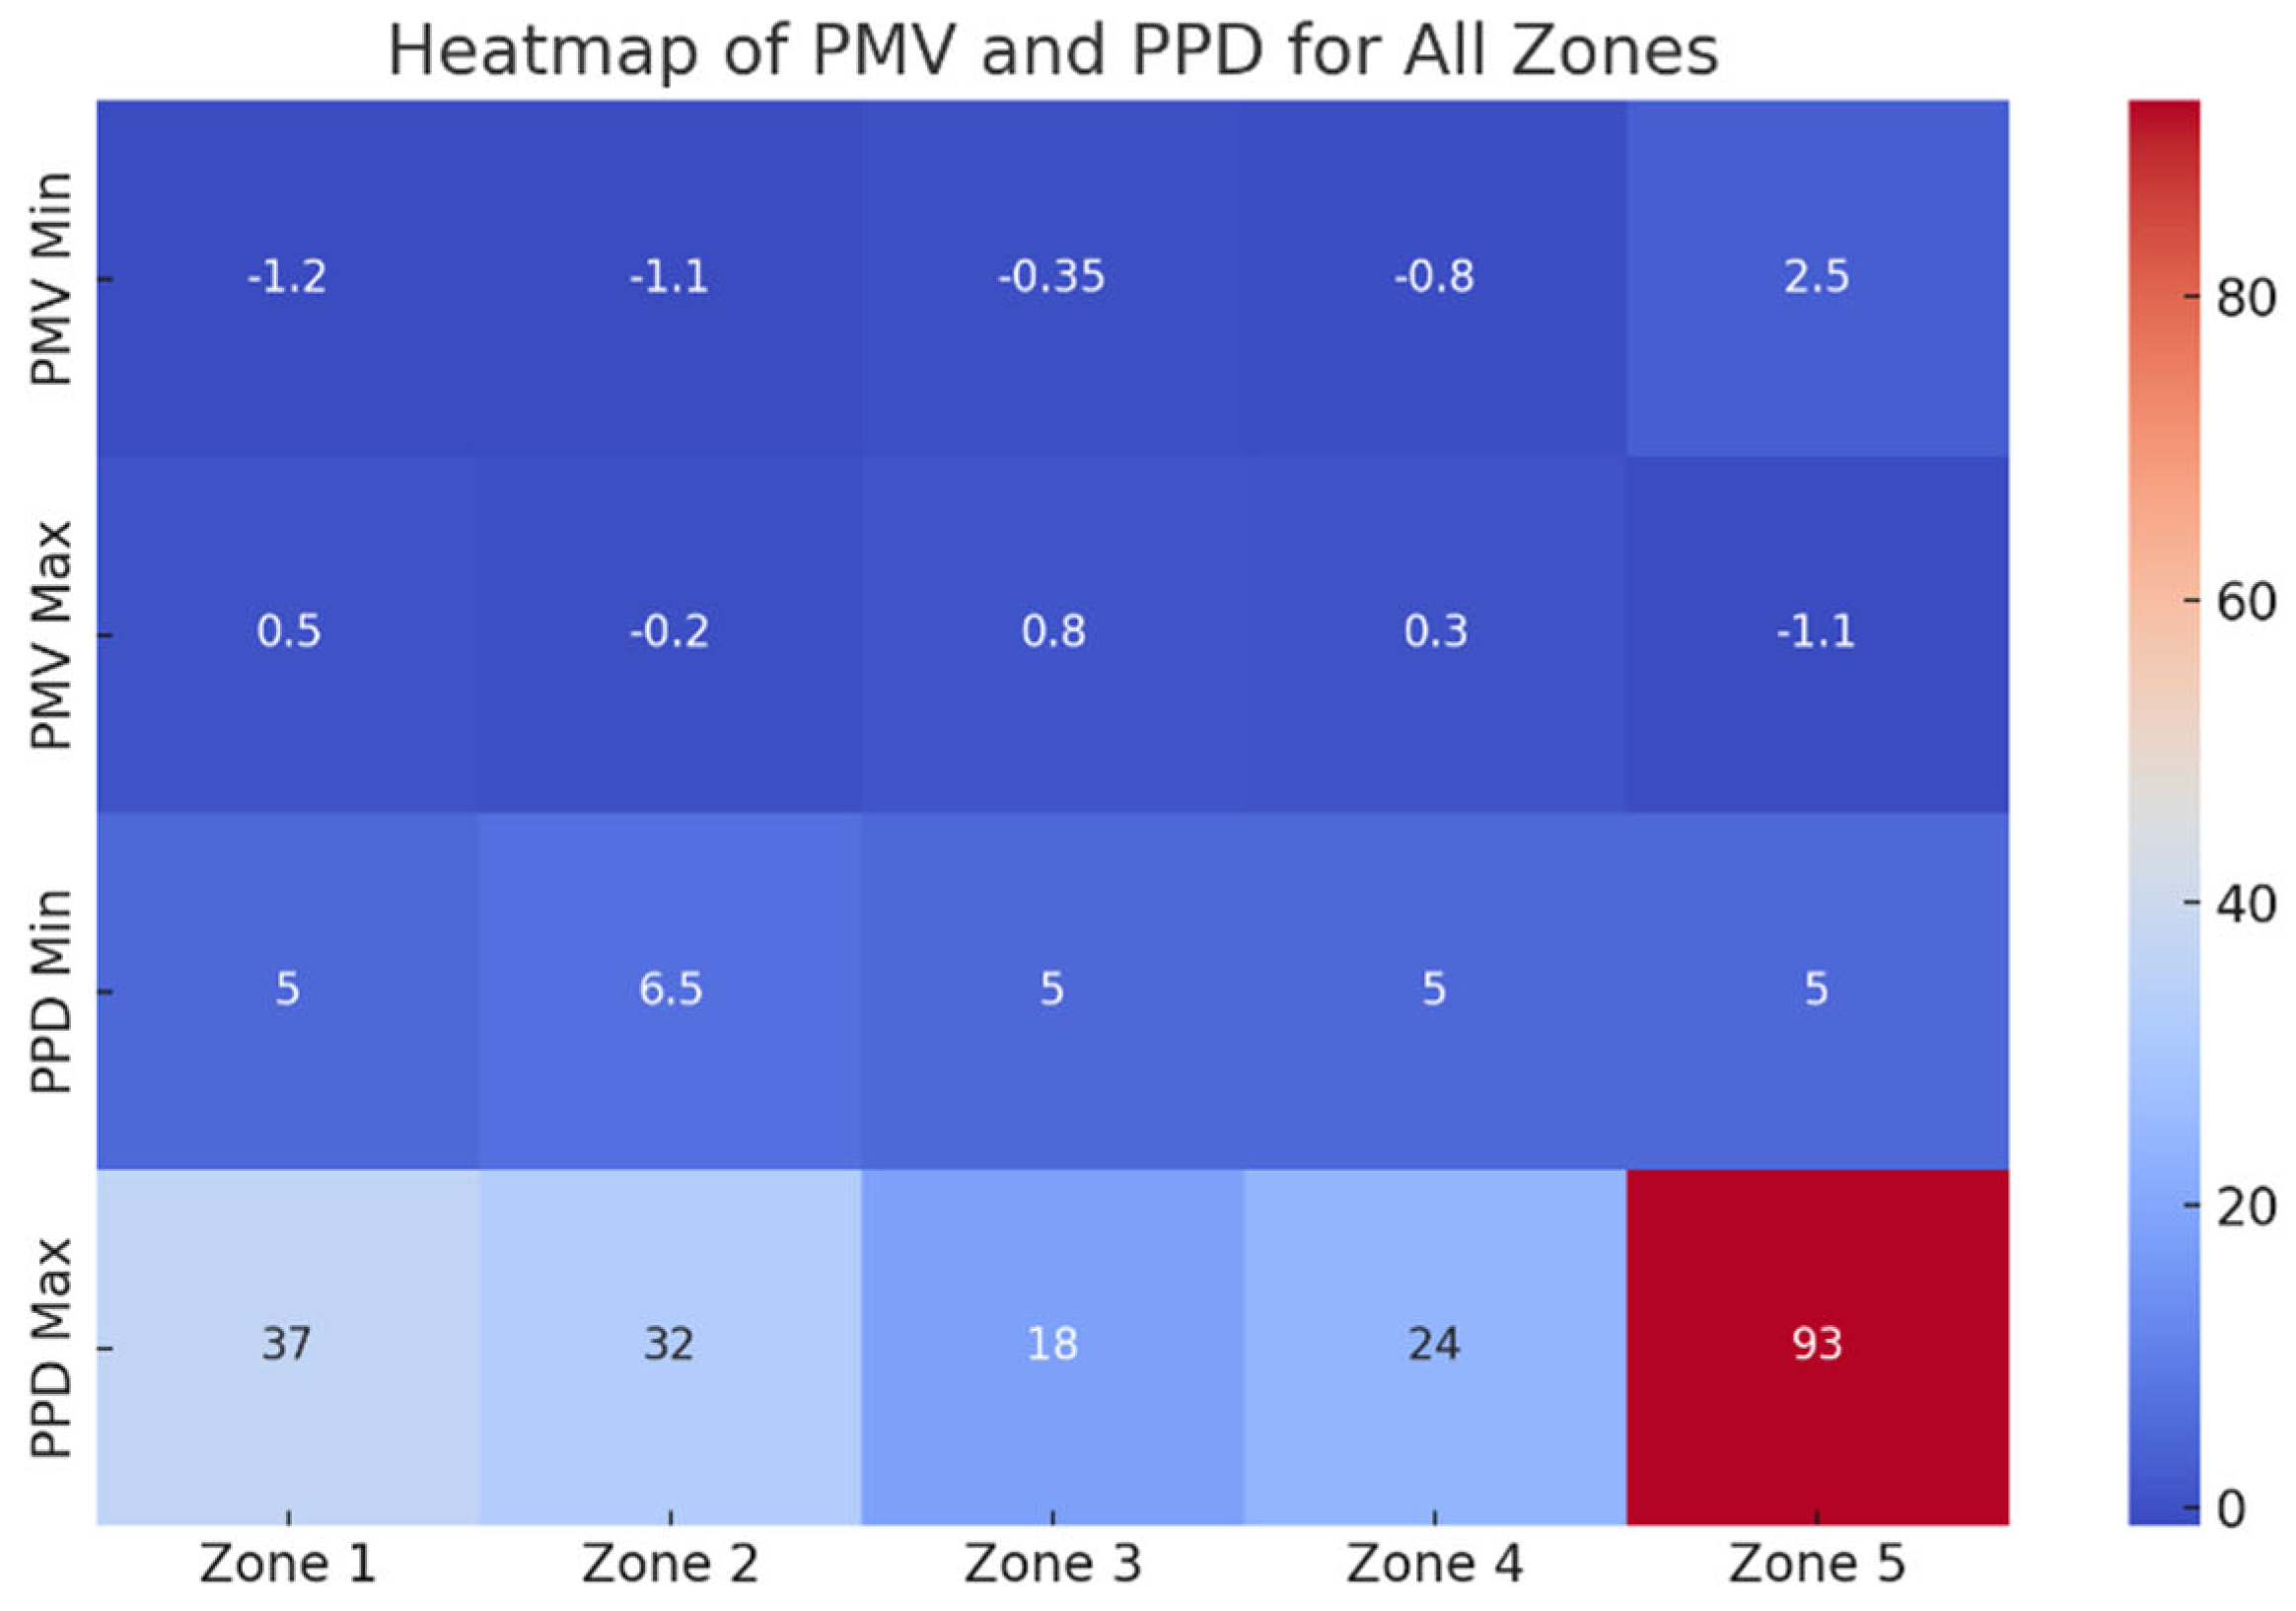
The PMV values in Zone 1 ranged from 0.5 to -1.25, indicating conditions from slightly warm to slightly cool. During the early hours, PMV values leaned towards slightly cool (-0.5 to -1.25) due to the air conditioning system running at peak efficiency. This cycle reversed by evening as thermal loads increased, resulting in slightly warm conditions closer to 0.5. PPD trends mirrored this behavior, with dissatisfaction peaking at 37% during warmer periods. These results highlight a recurring imbalance in maintaining optimal thermal comfort.
(ii) Indoor Air Quality (IAQ)
CO2 levels in Zone 1 were mostly within the ASHRAE 62 standard of 1000 ppm, although occasional peaks were observed during high occupancy periods. This aligns with the zone’s status as a high-traffic retail area. TVOC levels remained moderate, reflecting appropriate material use and effective ventilation.
Analysis: The slightly cool conditions during non-peak hours suggest overuse of cooling systems, potentially leading to increased energy consumption. Conversely, slight overheating during high foot traffic hours indicates insufficient adaptive control. Ventilation appears adequate but could be optimized to handle fluctuating CO2 levels better. Improving thermostat settings and ventilation schedules can enhance both thermal comfort and IAQ while reducing operational costs.
The naming of "Baseline" for Zone 1 indicates its role as the primary retail area with the highest traffic and activity. This serves as a reference point for evaluating other zones, where its high energy demands and IAQ variations provide critical insights for targeted improvements.
8.2.2. Zone 2: Retail Area (Peripheral)
(i) Thermal Comfort Analysis
Zone 2’s PMV values ranged from -0.2 to -1.15, indicating slightly cool to neutral conditions. PMV trends show a gradual shift to cooler conditions as air conditioning systems activate. PPD values ranged from 6.5% to 32.5%, with dissatisfaction exceeding 20% during mid-day hours. These findings reveal a consistent discomfort trend, particularly when cooling surpasses the recommended threshold of -0.5 PMV.
(ii) Indoor Air Quality (IAQ)
IAQ data for Zone 2 is not detailed in the report. However, the lower traffic in this peripheral zone suggests better air quality compared to high-density areas like Zone 1.
Analysis: The overcooling in Zone 2 during operational hours indicates an imbalance in HVAC control. While the slightly cool conditions may benefit customers briefly entering the area, extended exposure could cause discomfort. Adaptive cooling strategies, such as using temperature sensors to adjust outputs dynamically, are recommended to achieve balance. Moreover, regular monitoring of IAQ parameters is crucial for maintaining overall indoor quality.
The term "Peripheral" describes Zone 2’s location at the outer edges of the retail space, which experiences lower traffic. This naming highlights its distinct thermal and IAQ dynamics compared to the more active central zones.
8.2.3. Zone 3: Retail Area (Intermediate)
(i) Thermal Comfort Analysis
PMV values for Zone 3 ranged from 0.8 to -0.35, demonstrating a slight warm-to-neutral condition. This zone’s PMV remained within ASHRAE 55 limits during the day but leaned toward slightly warm conditions during the evening. PPD values ranged from 5% to 17.9%, remaining well below the 20% threshold. The relatively stable thermal conditions suggest moderate comfort levels.
(ii) Indoor Air Quality (IAQ)
IAQ data for Zone 3 is limited, but the lower PPD suggests minimal impact from air pollutants. Ventilation appears to handle the moderate traffic levels effectively.
Analysis: Zone 3’s stable thermal performance indicates effective HVAC design. However, slight warming during operational hours could be addressed by fine-tuning air conditioning settings. Maintaining moderate ventilation rates can sustain IAQ levels while balancing energy efficiency. Implementing a periodic review of temperature and air quality trends will help sustain optimal comfort.
The "Intermediate" designation for Zone 3 reflects its balanced position between high-traffic and peripheral zones. This naming underscores its moderate activity level and relatively consistent environmental conditions.
8.2.4. Zone 4: Retail Area (Rear)
(i) Thermal Comfort Analysis
PMV values in Zone 4 ranged from 0.3 to -0.8, representing slightly warm to slightly cool conditions. This zone demonstrated a daily cycle, with neutral-to-warm conditions during non-peak hours and a shift to cooler conditions during peak cooling periods. PPD values ranged from 5% to 24%, occasionally exceeding the ASHRAE 55 recommended maximum of 20%.
(ii) Indoor Air Quality (IAQ)
CO2 levels in Zone 4 were within ASHRAE 62 limits except for brief spikes during peak occupancy. TVOC and other pollutants were well-managed, suggesting effective ventilation and pollutant control.
Analysis: Zone 4’s thermal discomfort during peak cooling suggests inefficiencies in HVAC zoning. Overcooling is a key issue, especially given the low PPD during non-peak hours. A solution lies in refining cooling schedules and incorporating localized controls. Ventilation is largely adequate but could be supplemented with CO2 monitoring to prevent periodic exceedances.
The "Rear" label for Zone 4 indicates its location at the back of the retail space, which typically has quieter functions and lower direct heat loads. This naming helps focus attention on its unique ventilation challenges and lower activity level compared to other zones.
8.2.5. Zone 5: Cafeteria Area
(i) Thermal Comfort Analysis
Zone 5 experienced the widest range of PMV values, from -1.1 to 2.5, indicating conditions from slightly cool to warm. PPD values peaked at 93% during operational hours, making this the least comfortable zone. The extreme heat is primarily due to cooking activities, coupled with insufficient cooling capacity to manage thermal loads.
(ii) Indoor Air Quality (IAQ)
Zone 5’s IAQ was notably impacted by elevated CO2 and TVOC levels from cooking emissions. While ventilation systems were in place, they were insufficient to control pollutant concentrations consistently.
Analysis: The thermal discomfort and IAQ issues in Zone 5 highlight the need for significant HVAC upgrades. Dedicated exhaust systems for cooking areas and increased cooling capacity are critical to mitigate the heat and pollutants generated. Advanced filtration systems could further enhance IAQ.
The designation "Cafeteria Area" for Zone 5 reflects its primary function as a high-activity zone with specific environmental challenges. This naming emphasizes the need for specialized HVAC solutions tailored to its unique requirements.
The WHO [8] guidelines for indoor air quality recommend CO2 concentrations not exceeding 1000 ppm, which highlights the need for immediate action in Zone 5 where levels reached 900 ppm [15]. Prolonged exposure to elevated CO2 levels can impair cognitive performance and decision-making, as demonstrated in multiple IAQ studies. For Zone 5, the combination of high CO2 and TVOC levels further exacerbates the potential for respiratory discomfort and long-term health risks among occupants. Addressing these deviations through enhanced ventilation and air purification systems is critical to maintaining acceptable indoor air quality and safeguarding occupant well-being.
9. Köppen-Geiger Climate Analysis
The regional climate for the hypermarket’s location falls under the Köppen-Geiger classification "Cfa" (Humid Subtropical), which is characterized by hot, humid summers and mild winters.
Findings reveal discrepancies between indoor conditions and expected adjustments based on outdoor Köppen-Geiger parameters.
- a)
- Zone 5’s high temperature and humidity levels reflect insufficient adaptation to summer conditions.
- b)
- Overcooling in Zones 1 and 2 during non-peak hours indicates potential inefficiencies in HVAC control.
The findings align with de Dear and Brager [20], who advocate for climate-adaptive thermal comfort models in naturally ventilated buildings. Specifically, they emphasize the integration of occupant-controlled systems, such as operable windows and ceiling fans, to enhance adaptability. These recommendations highlight the potential for localized adjustments to address thermal comfort discrepancies, particularly in zones like Zone 5, where overheating persists. Furthermore, their findings suggest the need for seasonal calibration of HVAC systems to better align indoor environments with Köppen-Geiger Climate Classification expectations, ensuring a balance between energy efficiency and occupant comfort.
Figure 7.
shows a heatmap linking Köppen-Geiger Climate Classification expectations with observed indoor conditions to identify adaptation gaps.
Figure 7.
shows a heatmap linking Köppen-Geiger Climate Classification expectations with observed indoor conditions to identify adaptation gaps.
This heatmap visually illustrates which zones deviate significantly from expected thermal comfort levels and air quality benchmarks, emphasising areas like Zone 5 where misalignments are most pronounced. By identifying these gaps, targeted interventions such as refined HVAC strategies and localised adjustments can be proposed to enhance alignment with regional climatic needs.
10. Recommendations
Based on the findings, several recommendations can be made to enhance thermal comfort and indoor air quality in the hypermarket:
IAQ Solutions for Gombak Hypermarket: Enhanced Filtration Systems: Install advanced air purification units, such as HEPA filters for particulate matter (PM2.5 and PM10) and activated carbon filters for Total Volatile Organic Compounds (TVOC). These systems can significantly reduce pollutant levels, particularly in high-stress areas like Zone 5 [28].
Ventilation Optimization: Increase outdoor air exchange rates to mitigate high Carbon Dioxide (CO2) concentrations. Deploy demand-controlled ventilation systems that use real-time CO2 sensors to adjust airflow dynamically based on occupancy [29]
Localized Air Quality Control: Introduce localized air scrubbers or portable air purifiers in zones with specific IAQ challenges, such as cafeterias and storage areas [30]
Humidity Management: Implement dehumidification systems to address Gombak's high relative humidity. These systems will prevent moisture buildup, reduce microbial growth, and enhance air quality.
IoT-Enabled Monitoring: Integrate smart air quality sensors that monitor pollutant levels in real time, providing actionable insights for proactive maintenance and operational adjustments[31].
Zone 5 (Cafeteria Area): First, install dedicated exhaust systems and advanced air filtration, such as HEPA filters with a minimum efficiency rating of 99.97% for particulate removal or activated carbon filters for mitigating odors and volatile organic compounds. According to ASHRAE 62.1-2019 standards, these systems should be designed to handle variable pollutant loads while maintaining optimal airflow rates. Integrating these systems with smart air quality monitors to dynamically adjust filtration levels based on real-time pollutant measurements can align with recommended best practices for improving IAQ in high-demand zones like Zone 5[32,33].
Zones 1-4: Optimize HVAC schedules and zoning controls and regularly monitor IAQ parameters to prevent deviations.
Köppen-Geiger Climate alignment: Design HVAC systems calibrated to local climatic needs, considering Köppen-based seasonal and geographical variations. Dynamic temperature and humidity control strategies, along with robust filtration, will be crucial for maintaining thermal comfort and IAQ in Gombak's tropical rainforest climate.
Thermal Comfort Solutions for Gombak Hypermarket: Adaptive Thermal Comfort: Adopt a more flexible approach to thermal comfort, aligning with ISO 7730 and ASHRAE 55 adaptive comfort models. These standards acknowledge occupants' dynamic thermal expectations and their ability to adapt to local climatic conditions, allowing for a wider range of acceptable temperatures.
Energy Efficiency: Implementing IoT-enabled HVAC systems, as discussed by Singh, Garg and Persily [21,25], can dynamically adjust conditions to optimize both energy efficiency and occupant comfort. For example, the ASHRAE Energy Efficiency Reports [22] detail a case study of a commercial office building in Singapore that achieved a 25% reduction in energy consumption and improved thermal comfort metrics by implementing IoT-enabled HVAC systems. These systems utilized real-time data from occupancy sensors and environmental monitors to regulate airflow and temperature dynamically, aligning operational efficiency with occupant needs.
Occupant Feedback Integration: Conduct periodic surveys to validate PMV and PPD metrics and enhance user-centric improvements. Examples of survey questions could include: 'How satisfied are employees with the temperature and air quality in their work area?' and 'Is there any discomfort experienced during specific times of the day?'. Methods such as anonymous online questionnaires or in-person interviews can ensure a broad feedback collection. Using Likert scales [23] to quantify comfort levels or open-ended responses to gather detailed observations can provide actionable insights.
11. Conclusions
This study comprehensively assessed thermal comfort and indoor air quality (IAQ) performance in a hypermarket located in Gombak, Selangor Darul Ehsan, Malaysia, revealing zone-specific variations in environmental conditions. The results underscore the necessity of tailored strategies to mitigate the challenges posed by the region’s tropical climate.
By integrating quantitative assessments including Predicted Mean Vote (PMV), Percentage of People Dissatisfied (PPD), and key IAQ indicators with qualitative insights from occupant surveys, the study provides a holistic evaluation of environmental performance. While Zones 1 to 4 generally align with acceptable thresholds, Zone 5 exhibits significant deviations, characterized by elevated PMV and PPD values, as well as increased concentrations of CO₂ and TVOCs. These findings highlight the need for targeted interventions to enhance ventilation efficiency and overall indoor environmental quality.
As this study recommends, integrating advanced HVAC strategies addresses these issues and aligns with sustainable building practices. For instance, IoT-enabled systems provide real-time adjustments to ensure energy-efficient and occupant-focused solutions. Adaptive cooling, localized controls, and improved ventilation systems reflect an alignment with global benchmarks such as ASHRAE 55 [7], ASHRAE 62 [13], and WHO guidelines [8]. These enhancements are particularly critical in high-demand areas like Zone 5, where operational activities exacerbate environmental stresses.
Moreover, applying climate-adaptive strategies informed by Köppen-Geiger classification standards illustrates the potential for systemic improvements in commercial settings. Seasonal calibrations, occupant feedback integration, and the adoption of innovative air filtration solutions collectively contribute to achieving long-term sustainability goals. By addressing the interplay between energy efficiency and occupant well-being, this study provides a replicable framework for other commercial environments. Specifically, the hypermarket faces operational challenges such as maintaining consistent Indoor Air Quality (IAQ) in the cafeteria zone, where cooking activities generate elevated heat loads and pollutants. Similarly, storage areas must contend with high heat accumulation due to inadequate ventilation. These challenges require targeted solutions, including advanced HVAC adjustments and localized environmental controls, to optimize indoor conditions across diverse operational zones.
The implications of this research extend beyond the hypermarket setting, serving as a reference point for future studies aiming to balance thermal comfort, IAQ, and energy efficiency. In conclusion, this comprehensive approach underscores the importance of multidisciplinary strategies to create healthier, more sustainable indoor environments while fostering compliance with international standards and improving occupant satisfaction. Integrating PMV, PPD, and IAQ metrics with Köppen-Geiger Climate Classification, informed HVAC strategies provides a comprehensive framework for optimizing indoor environments, enhancing occupant comfort, and ensuring energy efficiency [24,25]. This approach can serve as a model for similar commercial settings.
References
- González-Longo, C., & Sahabuddin, M. F. M. (2019). High-Rise Social Housing in Hot-Humid Climates: Towards an ‘Airhouse’ Standard for Comfort. Applied Sciences, 9(23), 4985. [CrossRef]
- Feriadi, H., Ng, E., Sekhar, C., & Cheong, D. (2003). Adaptive behaviour and thermal comfort in Singapore’s naturally ventilated housing. Building Research & Information, 31(1), 13.
- Baird, G., & Field, C. (2012). Thermal comfort conditions in sustainable buildings – Results of a worldwide survey of users’ perceptions. Renewable Energy, 49, 44. [CrossRef]
- Ma, X., Fukuda, H., Zhou, D., & Wang, M. (2019). Study on outdoor thermal comfort of the commercial pedestrian block in hot-summer and cold-winter region of southern China-a case study of The Taizhou Old Block. Tourism Management, 75, 186. [CrossRef]
- Suhaila, H., Suhaimi, I., Mohamed, M. A., Mustaffa, M. T., Kartini, A., & Atikah, A. (2019). Thermal Comfort Study of a Classroom in Northern Malaysia: A CFD Approach. IOP Conference Series: Materials Science and Engineering, 670(1), 012011. [CrossRef]
- Koh, K., Al-Kayiem, H. H., & Kurnia, J. C. (2018). Thermal Comfort Assessment of an Office Building in Tropical Climate Condition. MATEC Web of Conferences, 225, 1003. [CrossRef]
- ASHRAE (2020). Standard 55 - Thermal Environmental Conditions for Human Occupancy. American Society of Heating, Refrigerating, and Air-Conditioning Engineers. Available on ASHRAE Website.
- WHO. (2010). WHO guidelines for indoor air quality: selected pollutants. World Health Organization.
- Wyon, D. P. (2004). The effects of indoor air quality on performance and productivity. Indoor Air, 14(s7), 92–101. [CrossRef]
- Fanger, P. O. (1970). Thermal Comfort: Analysis and Applications in Environmental Engineering. McGraw-Hill.
- Abdullah, N. M., Mohammad, W. M. Z. W., Shafei, M. N., Sukeri, S., Idris, Z., Arifin, W. N., Nozmi, N., Saudi, S. N. S., Samsudin, S., Zainudin, A.-W., Hamat, R. A., Ibrahim, R., Masri, S. N., Saliluddin, S. M., Daud, A., Osman, M., & Jamaluddin, T. Z. M. T. (2019). Leptospirosis and its prevention: knowledge, attitude and practice of urban community in Selangor, Malaysia. BMC Public Health, 19(1). [CrossRef]
- Abass, F., Ismail, L. H., Wahab, I. A., Mabrouk, W. A., & Kabrein, H. (2021). Indoor thermal comfort assessment in office buildings in hot-humid climate. IOP Conference Series: Materials Science and Engineering, 1144(1), 012029. [CrossRef]
- ASHRAE (2019). Standard 62.1 - Ventilation for Acceptable Indoor Air Quality. American Society of Heating, Refrigerating, and Air-Conditioning Engineers.
- Beck, H. E., Zimmermann, N. E., McVicar, T. R., Vergopolan, N., Berg, A., & Wood, E. F. (2018). Present and future Köppen-Geiger climate classification maps at 1-km resolution. Scientific Data, 5, 180214. [CrossRef]
- ISO 7730. (2005). Ergonomics of the Thermal Environment.
- Department of Standards Malaysia. (2014). MS 1525:2014 - Code of Practice on Energy Efficiency and Use of Renewable Energy for Non-Residential Buildings. Department of Standards Malaysia.
- U.S. Environmental Protection Agency. (2023). National Ambient Air Quality Standards (NAAQS) Table.
- Department of Occupational Safety and Health (DOSH). (2010). Industry Code of Practice on Indoor Air Quality 2010. Ministry of Human Resources Malaysia.
- Department of Occupational Safety and Health. (2022). Guidelines on Monitoring of Airborne Chemical Hazardous to Health 2022. Ministry of Human Resources, Malaysia.
- de Dear, R., & Brager, G. (2002). Thermal comfort in naturally ventilated buildings: revisions to ASHRAE Standard 55. Energy and Buildings. Available on ScienceDirect.
- Singh, M., & Garg, N. (2020). IoT-enabled intelligent HVAC systems for thermal comfort and energy efficiency in buildings. Journal of Building Engineering. Available on Elsevier.
- ASHRAE Energy Efficiency Reports (2020). Case studies on IoT-enabled HVAC systems. American Society of Heating, Refrigerating, and Air-Conditioning Engineers. Available on ASHRAE Website.
- Claveria, O. (2021). A new metric of consensus for Likert-type scale questionnaires: An application to consumer expectations. [CrossRef]
- Brager, G. S., & de Dear, R. J. (1998). Thermal adaptation in the built environment: a literature review.
- Almeida, S. M., Silva, A. V., & Sarmento, S. (2017). Indoor air quality and thermal comfort: Validation of a new model for heat exposure risk assessment. Building and Environment, 124, 1-12.
- Zen, I. S., Al-Amin, A. Q., & Doberstein, B. (2019). Mainstreaming climate adaptation and mitigation policy: Towards multi-level climate governance in Melaka, Malaysia. In Urban Climate (Vol. 30, p. 100501). Elsevier BV. [CrossRef]
- Rajoo, K. S., Karam, D. S., Abdu, A., Rosli, Z., & Gerusu, G. J. (2021). Urban Forest Research in Malaysia: A Systematic Review [Review of Urban Forest Research in Malaysia: A Systematic Review]. Forests, 12(7), 903. Multidisciplinary Digital Publishing Institute. [CrossRef]
- Khean, C. C., & Yih, T. Y. (2018). A Review of the Effectiveness Study of Botanical Components That Improves Air Filtration [Review of A Review of the Effectiveness Study of Botanical Components That Improves Air Filtration]. IOP Conference Series Earth and Environmental Science, 167, 12033. [CrossRef]
- Naamandadin, N. A., Noor, S. N. A. M., Zainol, N. Z., Awang, A. H., Rahman, S. A. A., Mohamad, K., & Ahmad, M. N. (2020). Improving Indoor Environmental Quality (IEQ) and Comfortability of Lecture Rooms: Case Study – UniCITI Alam Campus, Padang Besar, Malaysia. In IOP Conference Series Materials Science and Engineering (Vol. 743, Issue 1, p. 12027). [CrossRef]
- Levasseur, M.-E., Poulin, P., Campagna, C., & Leclerc, J. (2017). Integrated Management of Residential Indoor Air Quality: A Call for Stakeholders in a Changing Climate [Review of Integrated Management of Residential Indoor Air Quality: A Call for Stakeholders in a Changing Climate]. International Journal of Environmental Research and Public Health, 14(12), 1455. [CrossRef]
- Kaur, S., Sharma, S., & Bawa, S. (2019). Smart Indoor Air Quality Monitoring System. In International Journal of Recent Technology and Engineering (IJRTE) (Vol. 8, p. 989).
- Dai, X., Shang, W., Liu, J., Min, X., & Wang, C. (2023). Achieving better indoor air quality with IoT systems for future buildings: Opportunities and challenges [Review of Achieving better indoor air quality with IoT systems for future buildings: Opportunities and challenges]. The Science of The Total Environment, 895, 164858. Elsevier BV. [CrossRef]
- NAFA Air Filtration Best Practice Guidelines. (2023). https://www.nafahq.org/download-nafa-air-filtration-best-practice-guidelines/.
- Sari, K. A. M., Mastaza, K. F. A., Rahman, M. A. A., Saji, N., Muslim, R., Mustafa, M. S. S., & Tong, Y. G. (2019). Assessment of indoor air quality parameters at Ambulatory Care Centre XYZ, Malaysia. In IOP Conference Series Earth and Environmental Science (Vol. 373, Issue 1, p. 12013). [CrossRef]
Disclaimer/Publisher’s Note: The statements, opinions and data contained in all publications are solely those of the individual author(s) and contributor(s) and not of MDPI and/or the editor(s). MDPI and/or the editor(s) disclaim responsibility for any injury to people or property resulting from any ideas, methods, instructions or products referred to in the content. |
© 2025 by the authors. Licensee MDPI, Basel, Switzerland. This article is an open access article distributed under the terms and conditions of the Creative Commons Attribution (CC BY) license (http://creativecommons.org/licenses/by/4.0/).
Copyright: This open access article is published under a Creative Commons CC BY 4.0 license, which permit the free download, distribution, and reuse, provided that the author and preprint are cited in any reuse.


