
Submitted:
10 April 2025
Posted:
10 April 2025
You are already at the latest version
Abstract
Superabsorbent Polymers (SAPs) have been increasingly studied for their potential to enhance soil water holding capacity and reduce irrigation needs, particularly in water-scarce agricultural regions. The objective of this study is to maximize water holding capacity and minimize water irrigation by evaluating the effectiveness of SAPs on Soil Texture, Water Holding Capacity, and pH Content under controlled treatments in Purok Kabelen. The researchers conducted experiments using different SAPs and water treatments by analyzing their effects through ANOVA, Regression Analysis, and Sensitivity Analysis. Findings from the study indicate that SAPs application significantly influences soil physical characteristics. The ANOVA results showed that SAPs had a statistically significant effect on soil texture, water holding capacity, and pH content, with F-values of 309.254, 1309.8, and 401989, respectively (p < 0.05). Regression analysis further confirmed a strong correlation between SAPs application and increased water retention, as well as changes in soil pH. Specifically, the highest water holding capacity of 82.74% was achieved at a 10g SAP: 200mL water per 500g soil treatment by marking a 34.9% increase from the control. Soil texture analysis revealed a rise in clay content from 37% to 83.9%, and soil pH shifted from 6.27 (moderately acidic) to 7.83 (slightly alkaline). The sensitivity analysis examines the effects of Superabsorbent Polymer (SAP) and water on soil texture, Water Holding Capacity (WHC), and pH. SAP applications significantly altered soil texture, with sand content decreasing by up to 83.01% at 5g SAP and silt content dropping by 74.13% at 40g SAP. In contrast, clay content increased, peaking at 126.76% at 5g SAP before stabilizing. Water Holding Capacity improved by 34.87% at 10g SAP, with smaller gains beyond 20g SAP. pH content increased by 24.88% at 80g SAP, shifting the soil toward alkalinity. However, excessive SAPs application beyond the optimal level did not yield proportionate improvements in water holding capacity. This study aligns with the United Nations Sustainable Development Goals (SDGs), particularly Sustainable Development Goal 12 (SDG 12): Responsible Consumption and Production and Sustainable Development Goal 15 (SDG 15): Life on Land. By improving irrigation efficiency, and reducing excessive water use, this study promotes responsible resource management and supports sustainable land practices in agriculture.
Keywords:
superabsorbent polymers
; soil texture
; water holding capacity
; pH content
; irrigation efficiency
1. Introduction
Agriculture plays a big role in the development of the Philippine economy and the attainment of inclusive growth (Ebora, 2022). The irrigation system problem in the country already existed in the late 1980s up until the present and is still in low areas of performance of the system. According to the Philippine Institute for Development Studies (2018), irrigation system inefficiencies are attributed to inadequate water supply, inappropriate designs, operational challenges, and poor maintenance practices. Furthermore, miscalculated field water requirements, water loss and distribution problems can all be linked to subpar irrigation system performance. For high water use efficiency, farmers and operators must work together, and the quantity and quality of water delivered are essential for dependability.
In the news of SunStar Cebu (2023), the Philippine Atmospheric, Geophysical and Astronomical Services Administration (PAGASA) has cautioned that Cebu's water supply would be exhausted during the dry hot season because of the higher chance of El Niño and the excessive heat-induced generation of water droplets. Water scarcity and inefficient irrigation practices are severely impacting agricultural productivity and food security in Purok Kabelen, Cebu, Philippines, particularly during the dry months (Lansigan et al.., 2018). This localized issue is exacerbated by climate change, El Niño predictions, and increasing water demands, mirroring broader challenges facing Philippine agriculture (Stuecker et al..,2018).
Farmers in the region are experiencing significant crop losses due to infrequent rainfall, poor water infiltration, and visible signs of plant stress, such as wilting and yellowing (Wu et al..,2022). While precise data for Purok Kabelen is limited, studies indicate that inefficient irrigation systems across the Philippines contribute to substantial water loss, sometimes exceeding 50%, due to factors like outdated infrastructure and inadequate maintenance (Inocencio et al.., 2018). These losses translate to reduced yields and income for farming families, threatening their livelihoods and contributing to regional food insecurity (Stuecker et al.., 2018).
The El Niño phenomenon, predicted to bring drier conditions, further compounds these challenges (PAGASA, 2023). While a range of solutions exists for improving water retention and irrigation efficiency, including soil amendments like biochar and compost, as well as advanced irrigation techniques, this study will explore the potential of superabsorbent polymers (SAPs), among other possible interventions, to address the specific water management challenges in Purok Kabelen. This focus on Superabsorbent Polymers is driven by their unique water-absorbing and slow-release properties, which may offer a cost-effective and sustainable solution for this specific context.
The researchers propose addressing this issue through the use of Superabsorbent Polymers which are materials known for their outstanding water-absorbing properties. Superabsorbent Polymers can absorb and retain water hundreds of times their weight, slowly releasing it to the soil over time (Akinci et al., 2019; Prathap et al., 2020). Unlike other materials, Superabsorbent Polymers are specifically designed to improve water retention in soils, reduce water loss through evaporation or runoff, and optimize irrigation by making water more accessible to plant roots. This makes Superabsorbent Polymers a cost-effective and sustainable alternative for addressing water scarcity, especially in agricultural areas experiencing frequent droughts.
The researchers aim to conduct experiments to evaluate the effectiveness of Superabsorbent Polymers’ as a treatment for enhancing water holding capacity and reducing irrigation needs. These experiments will focus on analyzing the physical characteristics of the soil with varying percentages of Superabsorbent Polymers and water volumes. By quantifying the impact of Superabsorbent Polymers on the soil, the study seeks to determine their potential as a sustainable solution for the water management challenges in Purok Kabelen.
Conducting these experiments is crucial, as it provides scientific evidence to validate whether Superabsorbent Polymers can effectively address the current problems in the area. The results will inform agricultural practices that minimize water usage, enhance soil health, and improve crop resilience in the face of water scarcity. While the study is limited to soil samples from Purok Kabelen and not conducted directly in the field, the current state of the farm with its dry soil, inadequate water infiltration, and rainfall issues makes it a suitable subject for research.
The researchers will study the soil physical characteristics in relation to Superabsorbent Polymers application to assess its effectiveness in maximizing water holding capacity and minimizing irrigation requirements. This approach aims to integrate Superabsorbent Polymers into existing soil management practices, promoting sustainable water management and improved soil health.
2. Methodology
This study uses a quantitative experimental design to examine the effects of Superabsorbent Polymers application on soil physical characteristics, particularly Soil Texture, Water Holding Capacity and pH Content. The study involved controlled experiments where soil samples were treated with varying Superabsorbent Polymers applications. Soil characteristics were measured before and after Superabsorbent Polymers application using laboratory analysis. To analyze the collected data, three statistical methods were applied: Analysis of Variance (ANOVA) to determine significant differences in water retention among different Superabsorbent Polymers applications, Linear Regression Analysis to evaluate the relationship between Superabsorbent Polymers levels and soil physical characteristics, and Sensitivity Analysis to assess how Superabsorbent Polymers applications influence soil behavior under varying conditions. These methodologies provide a comprehensive understanding of the optimal Superabsorbent Polymers applications for improving water holding capacity and minimizing irrigation requirements.
Samples
This study utilized soil samples collected from agricultural fields in Purok Kabelen, Sta. Cruz, Liloan, Cebu. The selected samples represent loamy soil, which is commonly used for farming in the area. The samples were subjected to different Superabsorbent Polymers applications (0g, 5g, 10g, 20g, 40g, and 80g per 500 grams of soil) and analyzed to determine changes in soil texture, water-holding capacity, and pH content.. The Department of Agriculture assisted in conducting laboratory assessments to ensure the accuracy and reliability of the data collected. These soil samples serve as the primary basis for evaluating the effects of Superabsorbent Polymers application on water retention and irrigation efficiency.
Table 1 outlines the variables involved in the experiment identifying the effects of different percentages of Superabsorbent Polymer and water volumes on soil physical characteristics. It includes the independent variable as the percentage of Superabsorbent Polymer applied to the soil, with different levels ranging from 5 grams - 80 grams. The dependent variables are soil texture, water holding capacity, and pH content, which are influenced by the varying percentages of Superabsorbent Polymer and water. The control in each experimental condition is the specific amount of Superabsorbent Polymer (SAP) (in grams) applied along with the corresponding volume of water (in mL). Lastly, the actual result refers to the observed soil texture, water holding capacity, and pH content after applying each percentage of Superabsorbent Polymer (SAP) and water volume, representing the outcome of the experiment under each condition.
3. Results and Discussion
This study investigates the effectiveness of Superabsorbent Polymers on soil physical characteristics in enhancing water retention and irrigation efficiency in Purok Kabelen. It focuses on three key soil physical characteristics: Soil Texture, Water Holding Capacity, and pH Content. These characteristics are crucial for understanding how Superabsorbent Polymers function as a treatment to improve water retention and optimize water irrigation systems. The data collected on these characteristics is presented in the following tables and figures.
3.1. Soil Texture
Table 2 presents the results of soil texture analysis, which indicates how much Super Absorbent Polymer and water were added to each sample and the corresponding relative proportions of sand, silt, clay in grams per kilogram.
The control sample (0 grams Superabsorbent Polymer, 0 mL water) was classified as clay loam with approximately equal percentage composition of sand (31.2%), silt (31.7%), and clay (37%). These values are within the range reported for typical clay loams by Shirazi & Boersma (2019).
With the addition of increasing quantities of both Superabsorbent Polymer and water there is a marked change in particle size distribution; where by for samples 2-4 as an example: over 80% of all particles become clay while percentages of sand and silt decrease. Thus leading to textural class transition from being described as ‘clay loam’ into pure ‘clay’ when Superabsorbent Polymer/waters were added.
Moreover, among all other treatment groups those treated with highest level showed perceptibly least amount–indicating that they might have more than one component present at lower amounts than other treated soils which may lead us into thinking about whether such differences could arise due some reduction occurring within them namely breaking up aggregates during very high moisture content conditions but still remaining predominantly clays throughout these categories because this will be apparent only when looking at it under this light.
It is interesting to note that within Superabsorbent Polymer-treated soils where there was a maximum shift observed towards higher clay contents i.e., between 66-83.9% falls within range provided for this type according to the USDA Soil Texture Triangle method (Soil Texture Analysis, 2024). This could be explained by taking into consideration possibility that after absorbing large quantities water swelling occurs which then may cause sticking together smaller particles resulting in measurement showing them as being sized “clay”; however there were most cases when some aggregates seemed to fall apart completely at extremely wet conditions even though they were still classified as clays.
On the other hand, when maximum quantities of both Superabsorbent Polymer and water were added (samples 5-6) a slight increase in sand content with concomitant decrease in clay percentage was recorded but no change in textural class i.e., it remained as ‘clay’. Thus implying that maybe there could have been breakdowns occurring at very high moisture contents which could have resulted into these observations indeed happening.
In general terms; the incorporation of Superabsorbent Polymer and water has been shown to greatly modify readings for particle sizes such that more clays are produced instead of sands or silts being lost. However, field estimates based on tactile perception alone can still give quite accurate texture classifications for most applications since laboratory methods may not be necessary as found by Vos et al. (2020) after comparing them against each other during field and laboratory analyses of soil textures.
Figure 1 illustrates the results of soil texture analysis across various treatments of Superabsorbent Polymers and water. Figure 1 presents the percentage distribution of sand, silt, and clay within each soil sample, reflecting changes in texture with increasing Superabsorbent Polymers and water application.
The control sample (0 grams SAP, 0 mL water) exhibits a balanced composition of sand (31%), silt (31.7%), and clay (37%), classifying it as a clay loam. This initial texture provides the baseline for comparison with other treatments.
As Superabsorbent Polymers and water are introduced in increasing amounts (5–20 grams SAP and 100–300 mL water), the percentage of clay particles significantly increases, surpassing 80% in samples treated with moderate Superabsorbent Polymers levels. Correspondingly, the proportions of sand and silt decrease drastically. This shift indicates a transition in soil texture from clay loam to predominantly clay, as clay particles dominate the composition.
Interestingly, in samples treated with the highest levels of SAP and water (40–80 grams SAP and 400–500 mL water), the clay content stabilizes at around 66%, while the sand content slightly increases (e.g., from 8.2% to 23%). This suggests a potential disruption of soil aggregates under excessive Superabsorbent Polymers and moisture conditions, which may lead to the redistribution of particles, allowing a slight recovery in sand content.
Overall, the data highlights the significant influence of Superabsorbent Polymers and water on soil particle size distribution. The observed increase in clay content, especially in moderate Superabsorbent Polymers treatments, could be attributed to Superabsorbent Polymers’ water absorption properties, which may cause finer particles to bind together or alter the perception of particle sizes during analysis. However, at higher Superabsorbent Polymers and water levels, the structural integrity of the soil may be compromised, leading to observable changes in particle proportions.
3.2. Water Holding Capacity
Compared with the control 0g Superabsorbent Polymer and 0mL water (Sample 1), the water holding capacity of soil samples increased after Superabsorbent Polymer was added. This is consistent with the view that Superabsorbent Polymers are able to increase soil water retention, particularly in sandy soils (Takahashi et al., 2023; Yang et al., 2020).

Table 3.
Water Holding Capacity Data.
| NO. | SAMPLES (500 grams soil) | WATER HOLDING CAPACITY (%) |
| 1 | 0 grams SAP : 0mL water | 61.35 |
| 2 | 5 grams SAP:100mL water | 70.22 |
| 3 | 10 grams SAP: 200mL water | 82.74 |
| 4 | 20 grams SAP: 300mL water | 70.35 |
| 5 | 40 grams SAP: 400mL water | 81.04 |
| 6 | 80 grams SAP: 500mL water | 73.25 |
Of all samples, 10g Superabsorbent Polymer and 200mL water (Sample 3) had the largest water holding capacity, which accounted for 82.74%. In contrast to the control 0g Superabsorbent Polymer and 0mL water (Sample 1), this means a rise of 34.9% of water holding capacity. However, more Superabsorbent Polymer and higher amounts of water did not keep enhancing its holding capacity. As a matter of fact, at higher rates of application for Superabsorbent Polymers there was a slight reduction in their ability to retain moisture (Samples 4-6).
The relationship between rate and amount of Superabsorbent Polymers applied per unit area onto ground surface on one hand and how much liquid can be absorbed by it before saturated on another is non-linear just like discovered by Takahashi et al. (2023); those authors found that lower rates were better at increasing plant-available water which could have been due to limited swelling space within pores as more were used up by increasing amounts applied into them such that contents decreased along with rate until minimum levels necessary were attained.
This decline could also be explained in terms described by Guo et al. (2019), who said excess usage might lead to clogging up openings through which liquids pass while moving across different sections thus reducing permeability properties required for good drainage systems within soils themselves where these materials come into contact with each other but this wets our appetite even further because we know that there must be some point below average or above median values where maximum storage occurs without affecting structure negatively so let us see if their findings hold true here too.
It should be noted that there wasn't a linear relationship between Superabsorbent Polymer application rate and Water Holding Capacity. The Water Holding Capacity increased with the addition of Superabsorbent Polymers up to 10g (Sample 3), where it reached its peak at 82.74%. However, as the Superabsorbent Polymers application rate increased beyond 10g (in Samples 4, 5, and 6), the Water Holding Capacity showed a decreasing or leveling off trend which indicates that higher amounts of Superabsorbent Polymers did not continue to enhance water retention. Specifically, Samples 4, 5, and 6, with SAP application rates of 20g, 40g, and 80g, respectively, exhibited Water Holding Capacity values of 70.35%, 81.04%, and 73.25%, which were either similar to or lower than the Water Holding Capacity observed in Sample 3. This pattern suggests a non-linear relationship where the increase in water retention is not consistent with higher Superabsorbent Polymers application rates. Guo et al. (2019) found that there was a positive correlation between soil water content and Superabsorbent Polymer rate up to 0.20%. This difference in results may have been caused by different types of soils used, properties of Superabsorbent Polymer or methods used for measuring them.
In general, these findings indicate that Superabsorbent Polymers can greatly increase the retention of soil moisture but they also underscore the need for finding optimal rates of application under specific soil conditions. It would therefore be important to conduct further studies which investigate how much plant available water is related to various levels of soil physical characteristics with regards to rates at which Superabsorbent Polymers are being applied onto such substrates.
Figure 2 demonstrates the Water Holding Capacity (%) of soil samples treated with varying amounts of Superabsorbent Polymers and water. The data reveal a clear trend in which the addition of Superabsorbent Polymers enhances the soil's ability to retain water compared to the control sample.
Figure 2 for water holding capacity demonstrates a peak at 10 grams of Superabsorbent Polymers with 200mL water by achieving the highest water holding capacity percentage among the treatments. This result can be attributed to the optimal balance between the amount of Superabsorbent Polymers and water. At this ratio, the Superabsorbent Polymers particles are fully hydrated, maximizing their ability to absorb and retain water within the soil matrix. However, as the Superabsorbent Polymers amount increases to 20g and 40g with corresponding increases in water, the water holding capacity decreases slightly. This may be due to an insufficient amount of water relative to the excess Superabsorbent Polymers, causing some Superabsorbent Polymers particles to remain underutilized. Interestingly, the capacity slightly increases again at 40g Superabsorbent Polymers before declining at 80g Superabsorbent Polymers. This inconsistency could result from oversaturation, where excessive Superabsorbent Polymers compete for the available water, leading to aggregation or clumping of the polymer particles. Such aggregation might reduce the efficiency of water absorption by limiting the polymer’s surface area available for water interaction (Li et al., 2019). These diminishing returns highlight the importance of finding an optimal SAP-to-water ratio for maximum effectiveness
The results highlight the non-linear relationship between Superabsorbent Polymers application and water holding capacity. Moderate Superabsorbent Polymers levels achieve the greatest improvement, whereas excessive amounts may lead to diminishing returns. These findings emphasize the importance of determining an optimal Superabsorbent Polymers application rate tailored to specific soil conditions to maximize benefits without compromising soil structure or permeability.
In summary, Superabsorbent Polymers proves to be an effective soil amendment for enhancing water retention, with the 10-gram Superabsorbent Polymers and 200 mL water treatment emerging as the most efficient configuration. Further research is recommended to explore the balance between Superabsorbent Polymers application and soil properties to ensure sustainable agricultural practices.
3.3. pH Content
In comparison to the control sample without Superabsorbent Polymer, the pH data demonstrates that Superabsorbent Polymer generally raised soil pH. This is consistent with what other studies have found about how Superabsorbent Polymer affects soil properties.
The control sample had a moderately acidic pH of 6.27 when no Superabsorbent Polymer was applied. However, as more and more amounts of Superabsorbent Polymer were applied, the pH seemed to inch closer and closer to neutral/ slightly alkaline:
- At low rates (5-20 grams), the pH reached almost neutral levels (7.17-7.24).
- Medium rates (40 grams) maintained nearly neutral pH (7.2).
- The highest rate of application (80 grams) resulted in a slightly alkaline condition (7.83).
These changes between increasing soil pH by applying Superabsorbent Polymer has been observed before in different research works done on this area. A good example is a study conducted by Yang et al. (2021) who reported that long-term use of super-absorbent polymers increases soil pH significantly compared with controls; they attributed it to carboxylate groups in these chemicals which over time can react with and buffer against acidity within soils.
Table 4.
pH Content Data.
| NO. | SAMPLES (500 grams soil) | pH CONTENT | REMARKS |
| 1 | 0 grams SAP: 0mL water | 6.27 | MODERATELY ACIDIC |
| 2 | 5 grams SAP:100mL water | 7.17 | NEAR NEUTRAL |
| 3 | 10 grams SAP:200mL water | 7.38 | SLIGHTLY ALKALINE |
| 4 | 20 grams SAP: 300mL water | 7.24 | NEAR NEUTRAL |
| 5 | 40 grams SAP: 400mL water | 7.20 | NEAR NEUTRAL |
| 6 | 80 grams SAP: 500mL water | 7.83 | SLIGHTLY ALKALINE |
The change towards neutral/slightly alkaline range after using Superabsorbent Polymer may also affect nutrient availability and microbial activity in soils according to Zheng et al.(2023). They suggest that increased pH values caused by Superabsorbent Polymer treatments within acidic environments could improve conditions for beneficial microorganisms living underground as well as promote release of some nutrients necessary for plant growth into available forms. However, they warned against too much alkalinization.
It should be noted that there seems to exist an association between amount applied and resultant pH change whereby higher doses lead to greater increases in alkalinity. Bai et al.(2020) also found this relationship where they observed various effects on soil pH overtime due to different types or quantities used.
These findings imply that many crops would thrive best at around pH 7.0–7.2 which is within the near-neutral values achieved in this study. Nevertheless, the exact range of optimal pH for a given crop may vary depending on factors such as species and soil conditions thus further investigations are still necessary if we are to establish appropriate rates for different agricultural contexts aiming at attaining desired levels of acidity through Superabsorbent Polymer application.
Figure 3 shows the effect of Superabsorbent Polymers (SAP) and varying water quantities on soil pH levels. The data indicates that Superabsorbent Polymers application generally increased the soil pH compared to the control sample, which initially had a moderately acidic pH.
Figure 3 shows a steady increase as the Superabsorbent Polymers and water amounts are increased, with the 80g Superabsorbent Polymers treatment yielding the highest pH value. This trend can be explained by the chemical composition of Superabsorbent Polymers, which often include alkaline substances, such as potassium polyacrylate, that can slightly raise soil pH when hydrated (Yang et.al, 2021). In addition, higher water volumes in the treatments likely facilitated greater dissolution of nutrients like calcium and magnesium in the soil, further contributing to the increase in pH. It is worth noting that while the 80g SAP treatment resulted in the highest pH, its water holding capacity was much lower compared to the 10g treatment. These findings suggest that while Superabsorbent Polymers can improve soil pH, its application must be carefully calibrated to avoid inefficiencies in water retention.
This pattern suggests a change between Superabsorbent Polymers application and soil pH, with higher Superabsorbent Polymers amounts leading to increased alkalinity. The observed pH increase can be attributed to the chemical properties of Superabsorbent Polymers, particularly its ability to buffer soil acidity through carboxylate groups. These groups can neutralize acidic components in the soil, resulting in a gradual shift toward neutral or slightly alkaline pH levels.
In summary, the application of Superabsorbent Polymers effectively adjusted soil pH from moderately acidic to near-neutral or slightly alkaline levels. These findings highlight the importance of determining optimal Superabsorbent Polymers application rates to maintain soil pH within a range suitable for specific crops and soil types. Further studies are recommended to explore long-term effects and refine Superabsorbent Polymers application guidelines for diverse agricultural settings.
3.4. Analysis of Variance (ANOVA)
The study will use ANOVA to analyze the differences in Water Holding Capacity (WHC) and Water Absorption Rate (WAR) among different Superabsorbent Polymer treatment levels. The aim is to determine the optimal concentration for water conservation and sustainable soil management, aiming to reduce dependence on external watering and enhance water retention, ultimately reducing the need for frequent watering. The study aims to find the most effective concentration.
Table 5's ANOVA findings show a notable variation in the physical properties of soil depending on varied volumes of water and Superabsorbent Polymer (SAP) concentrations. With an F-value of 8.28 larger than the essential F-value of 2.75871, the variance among the groups is clearly more than within any one group. Further confirming the rejection of the null hypothesis is the p-value of 0.00021, which is far lower than the standard significance criterion of 0.05. This implies that the physical characteristics of the soil alter statistically significantly depending on the variations in Superabsorbent Polymer and water volume. Consequently, the research shows that the soil physical characteristics are much influenced by differences in Superabsorbent Polymer and water content.
Applying 5 grams of Superabsorbent Polymer (SAP) and 100 ml of water to 500 grams of soil shows a notable variation in the physical properties of soil according to the ANOVA results of Table 4.3.2. With an F-value of 24.0423 far larger than the critical F-value of 3.05557, the variation across the groups is clearly considerably more than the variation within any one group. Moreover, the p-value of 2.23956E-06 is much below the standard significance level of 0.05, therefore offering solid proof to refute the null hypothesis. This suggests that statistically significant changes in the physical characteristics of the soil follow after the application of Superabsorbent Polymer and water. Therefore, the investigation validates that the given concentrations of water and Superabsorbent Polymer significantly affect the properties of the soil.
Table 7.
Significant difference in the physical characteristics of soil texture when 10 grams of Superabsorbent Polymer (SAP) and 200 ml of water in 500 grams of soil are applied.
Table 7.
Significant difference in the physical characteristics of soil texture when 10 grams of Superabsorbent Polymer (SAP) and 200 ml of water in 500 grams of soil are applied.
| ANOVA | ||||||
| Source of Variation | SS | df | MS | F | P-value | F crit |
| Between Groups | 39118.8 | 4 | 9779.71 | 55.3387 | 8.38187E-09 | 3.05557 |
| Within Groups | 2650.87 | 15 | 176.724 | |||
| Total | 41769.7 | 19 |
Applying 10 grams of Superabsorbent Polymer (SAP) and 200 ml of water to 500 grams of soil shows a substantial change in the physical properties of soil according to the ANOVA results from 4.3.3. With an F-value of 55.3387 well over the necessary F-value of 3.05557, the variability among the several treatment groups is clearly more than within any one group. Furthermore strongly implying the rejection of the null hypothesis, the p-value of 8.38187E-09 is much below the conventional significance limit of 0.05. This suggests that statistically significant changes in the physical properties of the soil follow from the application of 10 grams of Superabsorbent Polymer and 200 ml of water. Thus, the results demonstrate that the soil properties are clearly and significantly changed by these particular concentrations of Superabsorbent Polymer and water.
When 20 grams of Superabsorbent Polymer (SAP) and 300 ml of water are applied to 500 grams of soil, the ANOVA results from Table 8 show a notable variation in the physical traits of soil. With an F-value of 113.038 significantly larger than the required F-value of 3.05557, the variability across the groups is clearly much more than that within each group. Extremely low, well below the standard significance level of 0.05, the p-value of 5.2083E-11 strongly supports the rejection of the null hypothesis. This implies that the physical characteristics of the soil undergo statistically significant changes when 20 grams of Superabsorbent Polymer and 300 ml of water are applied. Therefore, the results demonstrate that the soil properties are much influenced by these particular concentrations of Superabsorbent Polymer and water.
When 40 grams of Superabsorbent Polymer (SAP) and 400 ml of water are applied to 500 grams of soil, the ANOVA results from Table 9 show a notable change in the physical properties of soil. The F-value of 197.127 is much higher than the essential F-value of 3.05557, therefore indicating that group variability is much more than group variability within each group. < Strong evidence to reject the null hypothesis is also given by the very low p-value of 9.02544E-13, much below the usual significance level of 0.05. This implies that statistically significant changes in the physical characteristics of the soil follow after the application of 400 ml of water and 40 grams of Superabsorbent Polymer. Consequently, the results demonstrate that the soil properties are much influenced by these specific concentrations of Superabsorbent Polymer and water.
Table 10’s ANOVA results show from 80 grams of Superabsorbent Polymer (SAP) and 500 ml of water applied to 500 grams of soil that the physical characteristics of the soil vary significantly. With an F-value of 309.254 much larger than the critical F-value of 3.05557, the variance among the several treatment groups is clearly more than within each group. Extremely low, well below the traditional significance level of 0.05, the p-value of 3.26144E-14 strongly supports the rejection of the null hypothesis. This suggests that statistically significant changes in the physical characteristics of the soil follow from the application of 500 ml of water and 80 grams of Superabsorbent Polymer. Thus, the physical characteristics of the soil are substantially influenced by these particular quantities of Superabsorbent Polymer and water.
The effect of changing the grams of Superabsorbent Polymer (SAP) and the amounts of water applied on Water Holding Capacity (WHC) was investigated by means of an ANOVA analysis. The study divides the overall WHC variability into two components: between groups and inside groups. With 2 degrees of freedom (df), the between-group variation—which records WHC variations among the several experimental groups—had a sum of squares (SS) of 167,527. With 15 degrees of freedom, the within-group variance—which reflects individual variances or experimental error inside every group—had a total of squares of 179,831. Whereas the mean square for the within-group variation was 11,988.7, the mean square (MS) for the between-group variation was computed as 83,643.3.
Calculated as 6.98685, the F-statistic measures the variation between groups against the variation within groups. Using a 0.05 significance level, this F-value surpasses the crucial F-value of 3.68232. Furthermore, the P-value connected with the F-statistic was 0.00717, which is below the 0.05 criterion. These findings indicate that changing the grams of Superabsorbent Polymer and water volumes produces a statistically significant change in Water Holding Capacity across the groups, therefore providing solid proof to reject the null hypothesis of no variation in Water Holding Capacity means.
Table 12.
Significant difference between the Water Holding Capacity with 0g amount of Superabsorbent Polymer and 0 mL water.
Table 12.
Significant difference between the Water Holding Capacity with 0g amount of Superabsorbent Polymer and 0 mL water.
| ANOVA | ||||||
| Source of Variation | SS | df | MS | F | P-value | F crit |
| Between Groups | 8028.213 | 2 | 4014.11 | 64.7657 | 0.000266297 | 5.78614 |
| Within Groups | 309.8947 | 5 | 61.9789 | |||
| Total | 8338.107 | 7 |
The provided data is an ANOVA analysis aimed at determining whether there is a significant difference in water-holding capacity among groups when no Super Absorbent Polymer (SAP) is used and no water is added (0g Superabsorbent Polymer and 0mL water). The ANOVA results show a F-value of 64.7657, and the P-value is 0.000266297. Since the P-value is much lower than the conventional significance level of 0.05, this indicates that there is a statistically significant difference in water-holding capacity between the groups. Additionally, the F critical value (5.78614) is much lower than the observed F-value, further supporting that the differences between groups are statistically significant and unlikely to have occurred by chance. In summary, even with 0g of Super Absorbent Polymer and 0mL of water, the ANOVA results reveal a significant difference in water-holding capacity between the groups tested.
Table 13.
Significant difference between the Water Holding Capacity with 5g amount of Superabsorbent Polymer and 100mL water.
Table 13.
Significant difference between the Water Holding Capacity with 5g amount of Superabsorbent Polymer and 100mL water.
| ANOVA | ||||||
| Source of Variation | SS | df | MS | F | P-value | F crit |
| Between Groups | 5152.65 | 2 | 2576.33 | 41.5678 | 0.000766563 | 5.78614 |
| Within Groups | 309.895 | 5 | 61.9789 | |||
| Total | 5462.54 | 7 |
The ANOVA analysis provided evaluates the significant difference in water-holding capacity between groups when 5g of Superabsorbent Polymer (SAP) is combined with 100mL of water. The results indicate a F-value of 41.5678, which is much higher than the F critical value of 5.78614. Additionally, the P-value is 0.000766563, which is significantly lower than the standard significance threshold of 0.05. These results suggest that there is a statistically significant difference in water-holding capacity between the groups tested. The low P-value indicates that the observed differences are unlikely to have occurred by chance. In conclusion, the ANOVA results confirm that the water-holding capacity varies significantly between the groups when 5g of Superabsorbent Polymer is mixed with 100mL of water.
Table 14.
Significant difference between the Water Holding Capacity with 10g amount of Superabsorbent Polymer and 200mL water.
Table 14.
Significant difference between the Water Holding Capacity with 10g amount of Superabsorbent Polymer and 200mL water.
| ANOVA | ||||||
| Source of Variation | SS | df | MS | F | P-value | F crit |
| Between Groups | 19570.8 | 2 | 9785.42 | 157.883 | 3.03357E-05 | 5.78614 |
| Within Groups | 309.895 | 5 | 61.9789 | |||
| Total | 19880.7 | 7 |
The ANOVA analysis evaluates whether there is a significant difference in water-holding capacity among groups when 10g of Superabsorbent Polymer (SAP) is mixed with 200mL of water. The results show a F-value of 157.883, which is much higher than the F critical value of 5.78614. Additionally, the P-value is extremely small (3.03357E-05), far below the typical significance level of 0.05. These findings indicate a statistically significant difference in water-holding capacity between the groups tested. The low P-value suggests that the variation in water-holding capacity is not due to random chance.
In conclusion, the ANOVA results strongly confirm that the water-holding capacity significantly differs among the groups when 10g of Superabsorbent Polymer is mixed with 200mL of water.
Table 15.
Significant difference between the Water Holding Capacity with 20g amount of Superabsorbent Polymer and 300mL water.
Table 15.
Significant difference between the Water Holding Capacity with 20g amount of Superabsorbent Polymer and 300mL water.
| ANOVA | ||||||
| Source of Variation | SS | df | MS | F | P-value | F crit |
| Between Groups | 50512.2 | 2 | 25256.1 | 407.495 | 2.90338E-06 | 5.78614 |
| Within Groups | 309.895 | 5 | 61.9789 | |||
| Total | 50822.1 | 7 |
The ANOVA analysis provided examines whether there is a significant difference in water-holding capacity among groups when 20g of Superabsorbent Polymer (SAP) is combined with 300mL of water. The results show a F-value of 407.495, which is significantly higher than the F critical value of 5.78614. Furthermore, the P-value is extremely small (2.90338E-06), far below the conventional significance threshold of 0.05.
These findings indicate a statistically significant difference in water-holding capacity across the groups tested. The very low P-value suggests that the differences observed are highly unlikely to be due to random variation. In summary, the ANOVA results confirm that there is a significant difference in water-holding capacity when 20g of Superabsorbent Polymer is mixed with 300mL of water.
Table 16.
Significant difference between the Water Holding Capacity with 40g amount of Superabsorbent Polymer and 400mL water.
Table 16.
Significant difference between the Water Holding Capacity with 40g amount of Superabsorbent Polymer and 400mL water.
| ANOVA | ||||||
| Source of Variation | SS | df | MS | F | P-value | F crit |
| Between Groups | 97143.713 | 2 | 48571.9 | 783.683 | 5.70217E-07 | 5.78614 |
| Within Groups | 309.89468 | 5 | 61.9789 | |||
| Total | 97453.607 | 7 |
The ANOVA analysis assesses whether there is a significant difference in water-holding capacity across groups when 40g of Super Absorbent Polymer (SAP) is mixed with 400mL of water. The results indicate an extremely high F-value of 783.683, which is far above the F critical value of 5.78614. Moreover, the P-value is exceptionally small (5.70217E-07), well below the typical significance level of 0.05. These results strongly suggest that there is a statistically significant difference in water-holding capacity between the groups tested. The very low P-value indicates that the observed differences are highly unlikely to be due to random variation. In conclusion, the ANOVA results demonstrate that the water-holding capacity differs significantly among the groups when 40g of Super Absorbent Polymer is combined with 400mL of water.
Table 17.
Significant difference between the Water Holding Capacity with 80g amount of Superabsorbent Polymer and 500mL water.
Table 17.
Significant difference between the Water Holding Capacity with 80g amount of Superabsorbent Polymer and 500mL water.
| ANOVA | ||||||
| Source of Variation | SS | df | MS | F | P-value | F crit |
| Between Groups | 162360 | 2 | 81180 | 1309.8 | 1.58404E-07 | 5.78614 |
| Within Groups | 309.895 | 5 | 61.9789 | |||
| Total | 162670 | 7 |
The ANOVA analysis evaluates whether there is a significant difference in water-holding capacity among groups when 80g of Super Absorbent Polymer (SAP) is mixed with 500mL of water. The results show an extremely high F-value of 1309.8, which is much greater than the F critical value of 5.78614. Additionally, the P-value is exceedingly small (1.58404E-07), which is far below the conventional significance threshold of 0.05. These results strongly suggest that there is a statistically significant difference in water-holding capacity between the groups tested. The very low P-value indicates that the observed differences are highly unlikely to be due to chance. In conclusion, the ANOVA results demonstrate a significant difference in water-holding capacity when 80g of Super Absorbent Polymer is combined with 500mL of water.
Table 18.
Significant difference in the pH Content when varying grams of Superabsorbent Polymer (SAP) and varying volumes in ml of water are applied.
Table 18.
Significant difference in the pH Content when varying grams of Superabsorbent Polymer (SAP) and varying volumes in ml of water are applied.
| ANOVA | ||||||
| Source of Variation | SS | df | MS | F | P-value | F crit |
| Between Groups | 219119 | 2 | 109559 | 9.15425 | 0.00252 | 3.68232 |
| Within Groups | 179522 | 15 | 11968.1 | |||
| Total | 398641 | 17 |
The ANOVA study was carried out to ascertain whether changing the grams of Superabsorbent Polymer (SAP) and the water application volumes statistically significantly affects pH levels. The study divides the overall data variation into two components—between groups and within groups. Reflecting the variations in pH levels among the several experimental groups, the between-group variance had a sum of squares (SS) of 219,119 with 2 degrees of freedom ( df). With 15 degrees of freedom, the within-group variance—which reflects individual variations or experimental error inside every group—had a total of squares of 179,522. The mean square (MS) for the within-group variation was 11,968.1; for the between-group variation, it was 109,559.
Calculated as 9.15425 the F-statistic compares the between-group variance to the within-group variance. Using a 0.05 significance threshold, this value exceeds the crucial F-value (3.68232). Furthermore smaller than 0.05 was the P-value connected to the F-statistic, 0.00252. Consequently, the study offers solid proof to refute the null hypothesis of no variation in means by showing that changing the grams of Superabsorbent Polymer and water volumes produces a statistically significant difference in pH levels over the groups.
Table 19.
Significant difference between the pH Content with 0g amount of Superabsorbent Polymer and 0 mL water.
Table 19.
Significant difference between the pH Content with 0g amount of Superabsorbent Polymer and 0 mL water.
| ANOVA | ||||||
| Source of Variation | SS | df | MS | F | P-value | F crit |
| Between Groups | 77.3645 | 2 | 38.6823 | 149.389 | 3.47564E-05 | 5.78614 |
| Within Groups | 1.294683 | 5 | 0.25894 | |||
| Total | 78.65919 | 7 |
The ANOVA analysis reveals a significant difference in pH content between groups with varying amounts of Superabsorbent Polymer and water. The calculated F-value of 149.389 far exceeds the critical F-value of 5.78614, and the p-value is substantially lower than the typical alpha level of 0.05, specifically 3.47564E-05. This suggests that the differences observed between the groups are highly unlikely to be due to random chance. In essence, the analysis indicates that the amount of Superabsorbent Polymer and water used has a statistically significant effect on the pH content, as the variation in pH due to these factors is considerably greater than the variation within the individual groups. Thus, we reject the null hypothesis and conclude that the treatments significantly impact the pH levels.
Table 20.
Significant difference between the pH Content with 5g amount of Superabsorbent Polymer and 100mL water.
Table 20.
Significant difference between the pH Content with 5g amount of Superabsorbent Polymer and 100mL water.
| ANOVA | ||||||
| Source of Variation | SS | df | MS | F | P-value | F crit |
| Between Groups | 7593.13 | 2 | 3796.56 | 14662.1 | 3.79465E-10 | 5.78614 |
| Within Groups | 1.29468 | 5 | 0.25894 | |||
| Total | 7594.42 | 7 |
The ANOVA analysis for the effect of adding 5 grams of Superabsorbent Polymer with 100 milliliters of water on pH content shows a highly significant result. The F-value of 14,662.1 is substantially greater than the critical F-value of 5.78614, indicating a very strong effect of the treatments on pH levels. The p-value, which is 3.79465E-10, is extremely low, much smaller than the conventional alpha level of 0.05. This suggests that the observed differences in pH content among the groups are statistically significant and unlikely to be due to random variation. Therefore, we reject the null hypothesis, concluding that there is a significant difference in pH content attributable to the varying amounts of Superabsorbent Polymer and water used in the experiment. The results confirm that the treatment conditions have a pronounced impact on pH levels.
Table 21.
Significant difference between the pH Content with 10g amount of Superabsorbent Polymer and 200mL water.
Table 21.
Significant difference between the pH Content with 10g amount of Superabsorbent Polymer and 200mL water.
| ANOVA | ||||||
| Source of Variation | SS | df | MS | F | P-value | F crit |
| Between Groups | 32402.6 | 2 | 16201.3 | 62568.7 | 1.00905E-11 | 5.78614 |
| Within Groups | 1.29468 | 5 | 0.25894 | |||
| Total | 32403.9 | 7 |
The ANOVA analysis for the effect of using 10 grams of Superabsorbent Polymer with 200 milliliters of water on pH content demonstrates an exceptionally significant result. The F-value is 62,568.7, which is significantly higher than the critical F-value of 5.78614, indicating a profound difference in pH levels between the groups. Additionally, the p-value is 1.00905E-11, an extremely small number, far below the common alpha level of 0.05. This indicates that the differences observed are statistically significant and highly unlikely to be due to random chance. Consequently, we reject the null hypothesis and conclude that the amount of Superabsorbent Polymer and water used has a substantial and statistically significant impact on pH content. The results highlight a clear and pronounced effect of the treatment conditions on the pH levels.
Table 22.
Significant difference between the pH Content with 20g amount of Superabsorbent Polymer and 300mL water.
Table 22.
Significant difference between the pH Content with 20g amount of Superabsorbent Polymer and 300mL water.
| ANOVA | ||||||
| Source of Variation | SS | df | MS | F | P-value | F crit |
| Between Groups | 74230.2 | 2 | 37115.1 | 143337 | 1.2704E-12 | 5.78614 |
| Within Groups | 1.29468 | 5 | 0.25894 | |||
| Total | 74231.5 | 7 |
The ANOVA analysis for the effect of using 20 grams of Superabsorbent Polymer with 300 milliliters of water on pH content reveals a highly significant outcome. The F-value is 143,337, which far exceeds the critical F-value of 5.78614, indicating a very substantial difference between the groups. The p-value is 1.2704E-12, an extremely small number, well below the typical significance level of 0.05. This indicates that the observed differences in pH content are statistically significant and unlikely to have occurred by chance. As a result, we reject the null hypothesis, concluding that the amount of Superabsorbent Polymer and water used has a highly significant effect on pH levels. The data clearly demonstrates a pronounced impact of the treatment conditions on pH content.
Table 23.
Significant difference between the pH Content with 40g amount of Superabsorbent Polymer and 400mL water.
Table 23.
Significant difference between the pH Content with 40g amount of Superabsorbent Polymer and 400mL water.
| ANOVA | ||||||
| Source of Variation | SS | df | MS | F | P-value | F crit |
| Between Groups | 132737.46 | 2 | 66368.7 | 256313 | 2.97108E-13 | 5.78614 |
| Within Groups | 1.2946833 | 5 | 0.25894 | |||
| Total | 132738.76 | 7 |
The data provided represent an analysis of variance (ANOVA) performed to determine if there is a significant difference in pH content across different groups when 40g of Superabsorbent Polymer (SAP) is mixed with 400mL of water. The ANOVA results show that the F-value is extremely high (256,313), while the P-value is very small (2.97108E-13), which is significantly below the common significance level of 0.05. This suggests that there is a statistically significant difference in the pH content between the groups tested. Furthermore, the F critical value (5.78614) is much lower than the calculated F-value, reinforcing the conclusion that the observed differences in pH content are unlikely to be due to random variation. With this, based on the ANOVA results, it can be concluded that the different groups have significantly different pH levels when 40g of Superabsorbent Polymer is combined with 400mL of water.
Table 24.
Significant difference between the pH Content with 80g amount of Superabsorbent Polymer and 500mL water.
Table 24.
Significant difference between the pH Content with 80g amount of Superabsorbent Polymer and 500mL water.
| ANOVA | ||||||
| Source of Variation | SS | df | MS | F | P-value | F crit |
| Between Groups | 208179 | 2 | 104090 | 401989 | 9.64513E-14 | 5.78614 |
| Within Groups | 1.29468 | 5 | 0.25894 | |||
| Total | 208181 | 7 |
The data provided represent another ANOVA test to determine if there is a significant difference in pH content between groups when 80g of Super Absorbent Polymer (SAP) is mixed with 500mL of water. The results indicate that the F-value is extremely high (401,989), and the P-value is extremely small (9.64513E-14), which is much lower than the standard significance level of 0.05. This indicates that there is a statistically significant difference in the pH content across the different groups tested. Additionally, the F critical value (5.78614) is much lower than the observed F-value, further confirming that the variation in pH content between the groups is statistically significant and unlikely to be due to chance. In conclusion, the ANOVA results demonstrate that there is a significant difference in pH levels when 80g of Superabsorbent Polymer is mixed with 500mL of water.
3.5. Regression Analysis
The study uses Linear Regression Analysis to assess the relationship between Superabsorbent Polymers (SAP) and soil characteristics like soil texture, water holding capacity, and pH content. The analysis will provide a mathematical model to understand the relationship between SAP application levels and soil properties. The model will also allow for predictive analysis, predicting future soil behavior under different SAP treatments. The regression analysis will identify trends in data and facilitate hypothesis testing to assess the statistical significance of SAP's influence on soil physical characteristics.
3.6. Soil Texture
Soil texture, defined by the relative proportions of sand, silt, and clay, plays a crucial role in water retention, aeration, and nutrient availability. Understanding how Superabsorbent Polymers and water application affect soil texture is essential for evaluating their impact on soil structure and overall agricultural efficiency. This regression analysis aims to determine the relationship between Superabsorbent Polymers (SAP), water, and soil texture components, helping assess whether Superabsorbent Polymers (SAP) improves soil properties while supporting our goal of maximizing water retention and minimizing irrigation needs.
Furthermore, the distribution and absorption of moisture are significantly influenced by the interaction of soil texture, water, and Superabsorbent Polymers (SAP). The study intends to determine how Superabsorbent Polymers (SAP) affects plant water availability and its capacity to lessen the release of nutrients by examining these relationships. Gaining knowledge of these impacts can help optimize irrigation methods while preserving soil health and offer important insights into the real-world uses of Superabsorbent Polymers (SAP) in sustainable agriculture and effective water management. The study will measure these effects using regression analysis, offering important insights into the real-world uses of Superabsorbent Polymers (SAP) in effective water management and sustainable agriculture.
3.7. Sand
The regression analysis for sand content examines the relationship between Superabsorbent Polymers and water application in altering the proportion of sand in the soil. The R² value of 0.3385 indicates that only 33.85% of the variation in sand content is explained by the amount of Superabsorbent Polymers and water applied which suggests a weak relationship. This means that while Superabsorbent Polymers and water contribute to changes in sand percentage, other unaccounted factors significantly influence the soil texture. These factors could include initial soil composition, organic matter content, compaction levels, and natural variations in soil structure.
Table 25.
Linear Regression Results -%Sand.
| Regression Statistics | |
| Multiple R | 0.6576 |
| R Square | 0.4324 |
| Adjusted R Square | 0.0540 |
| Standard Error | 17.4464 |
| Observations | 6.0000 |
Table 26.
Linear Regression Results -%Silt
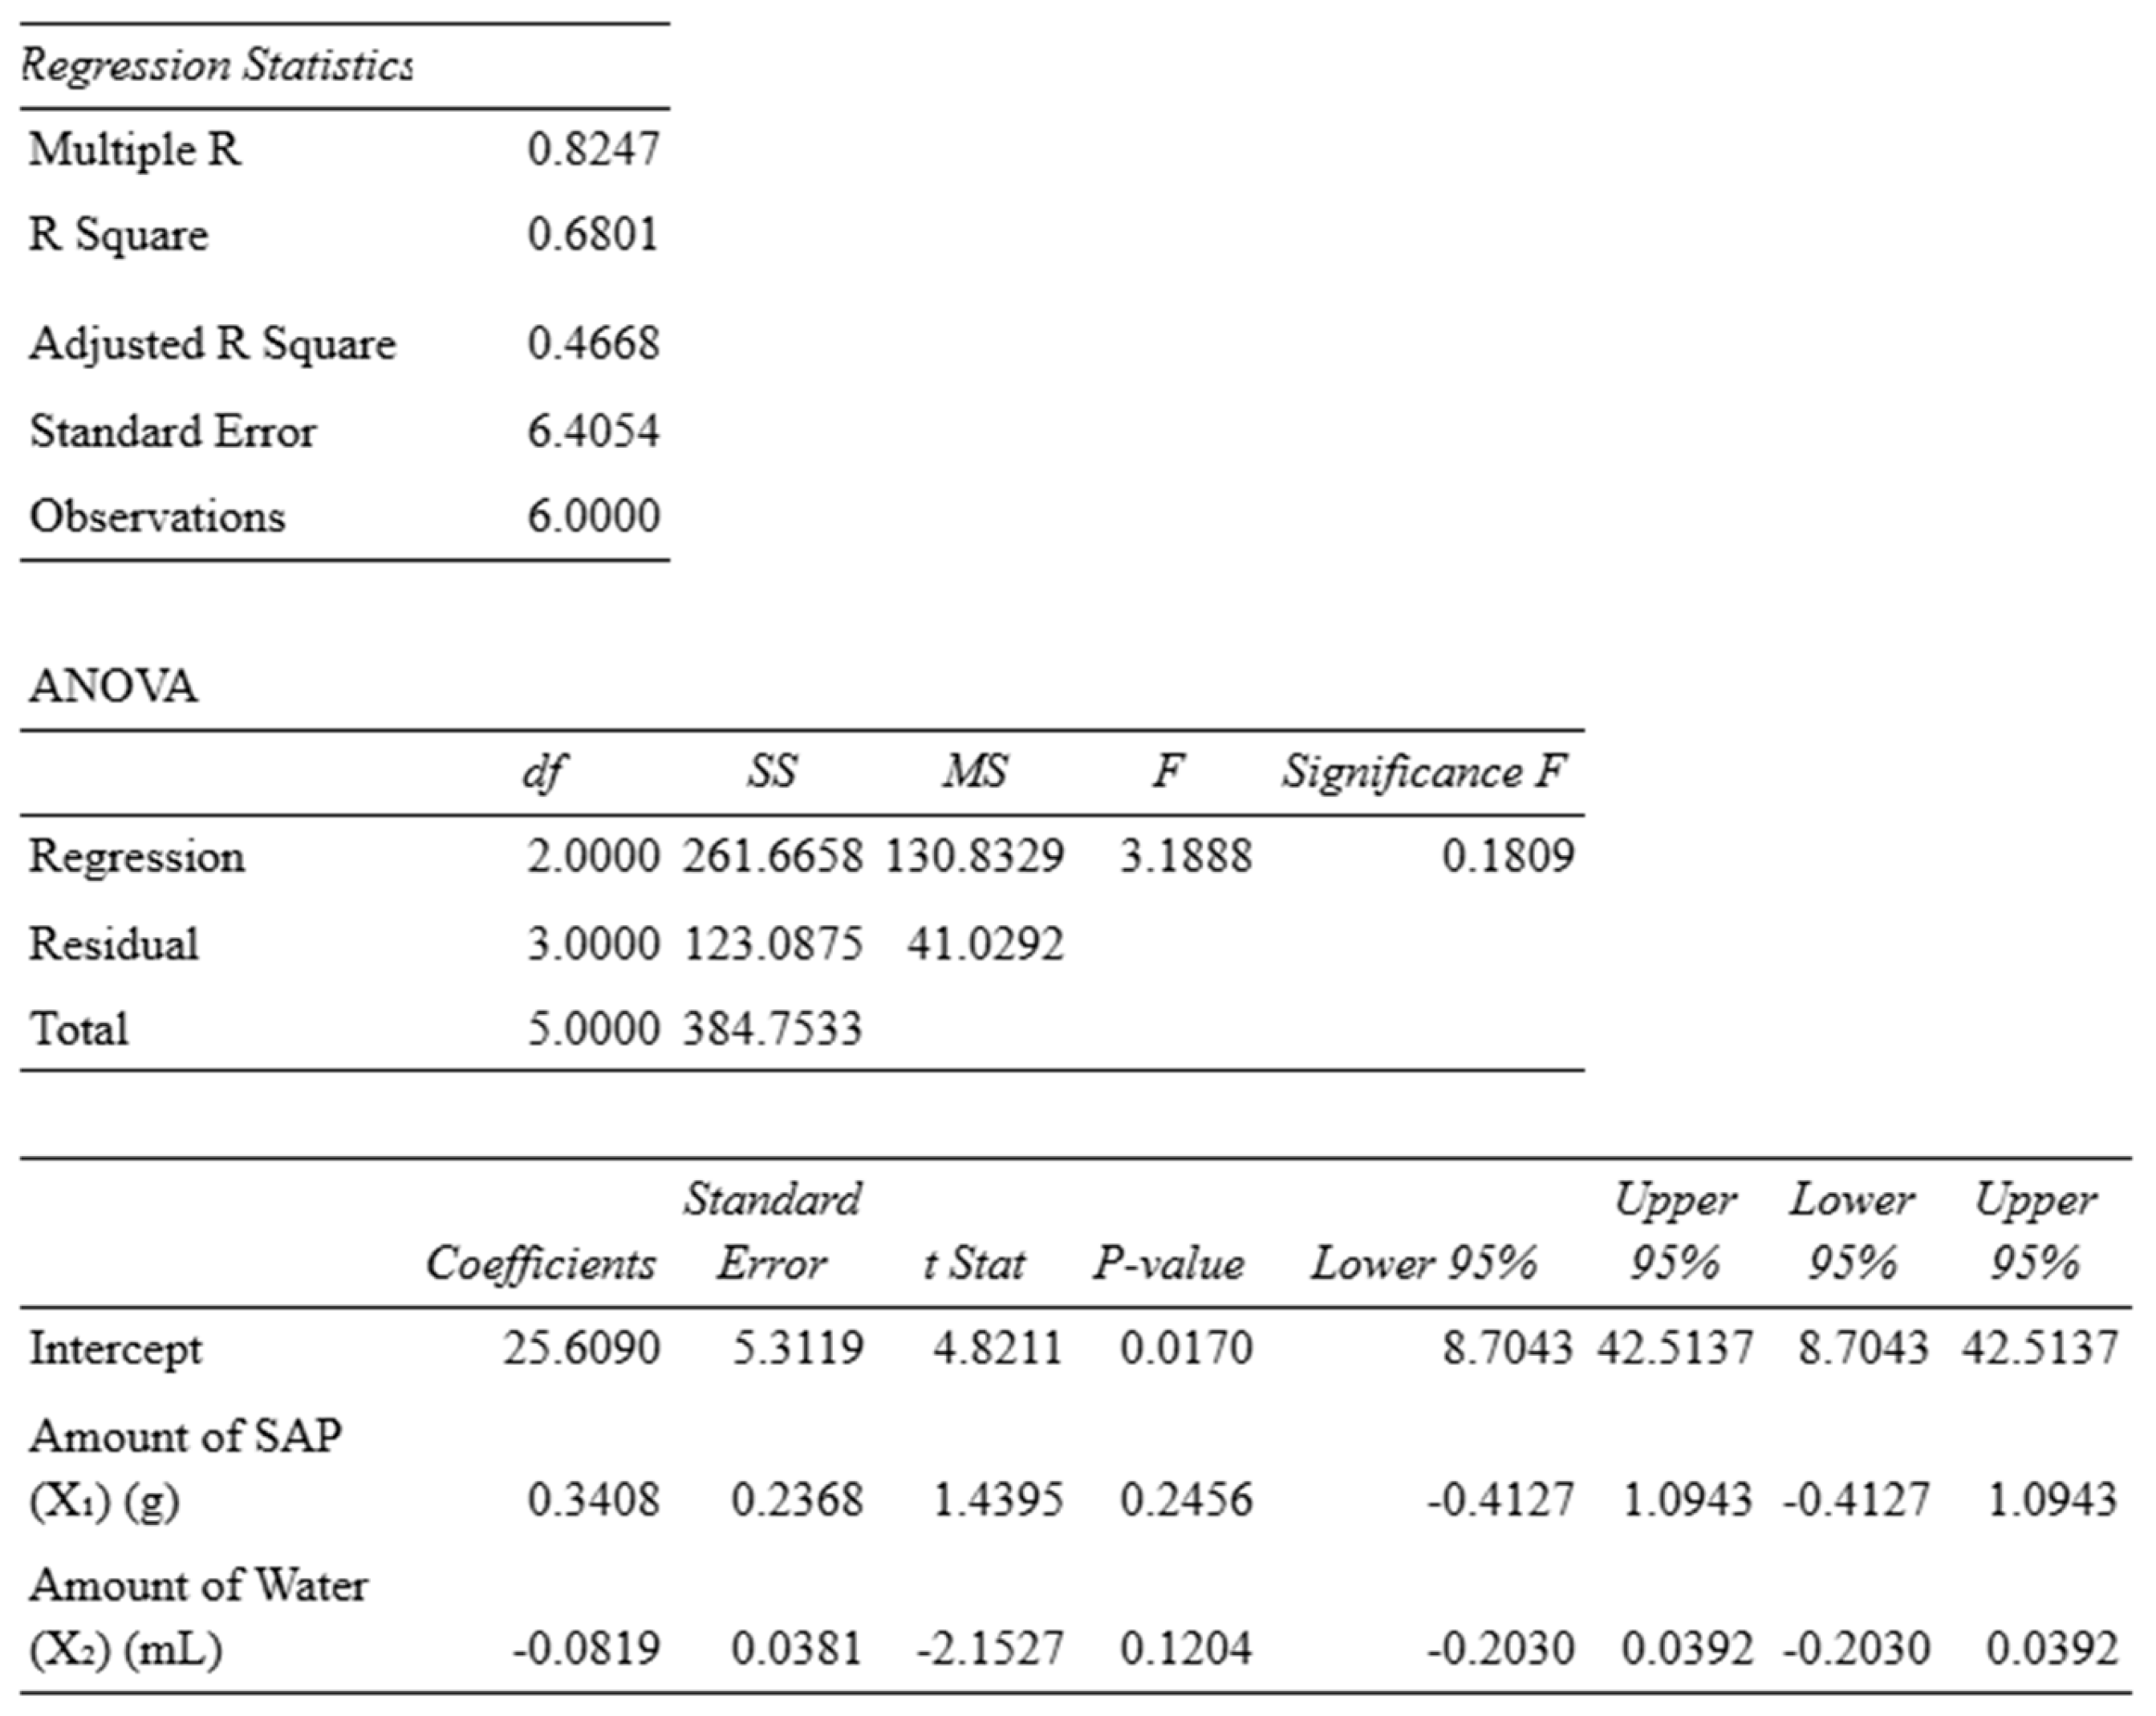 |
Table 27.
Linear Regression Results -%Clay.
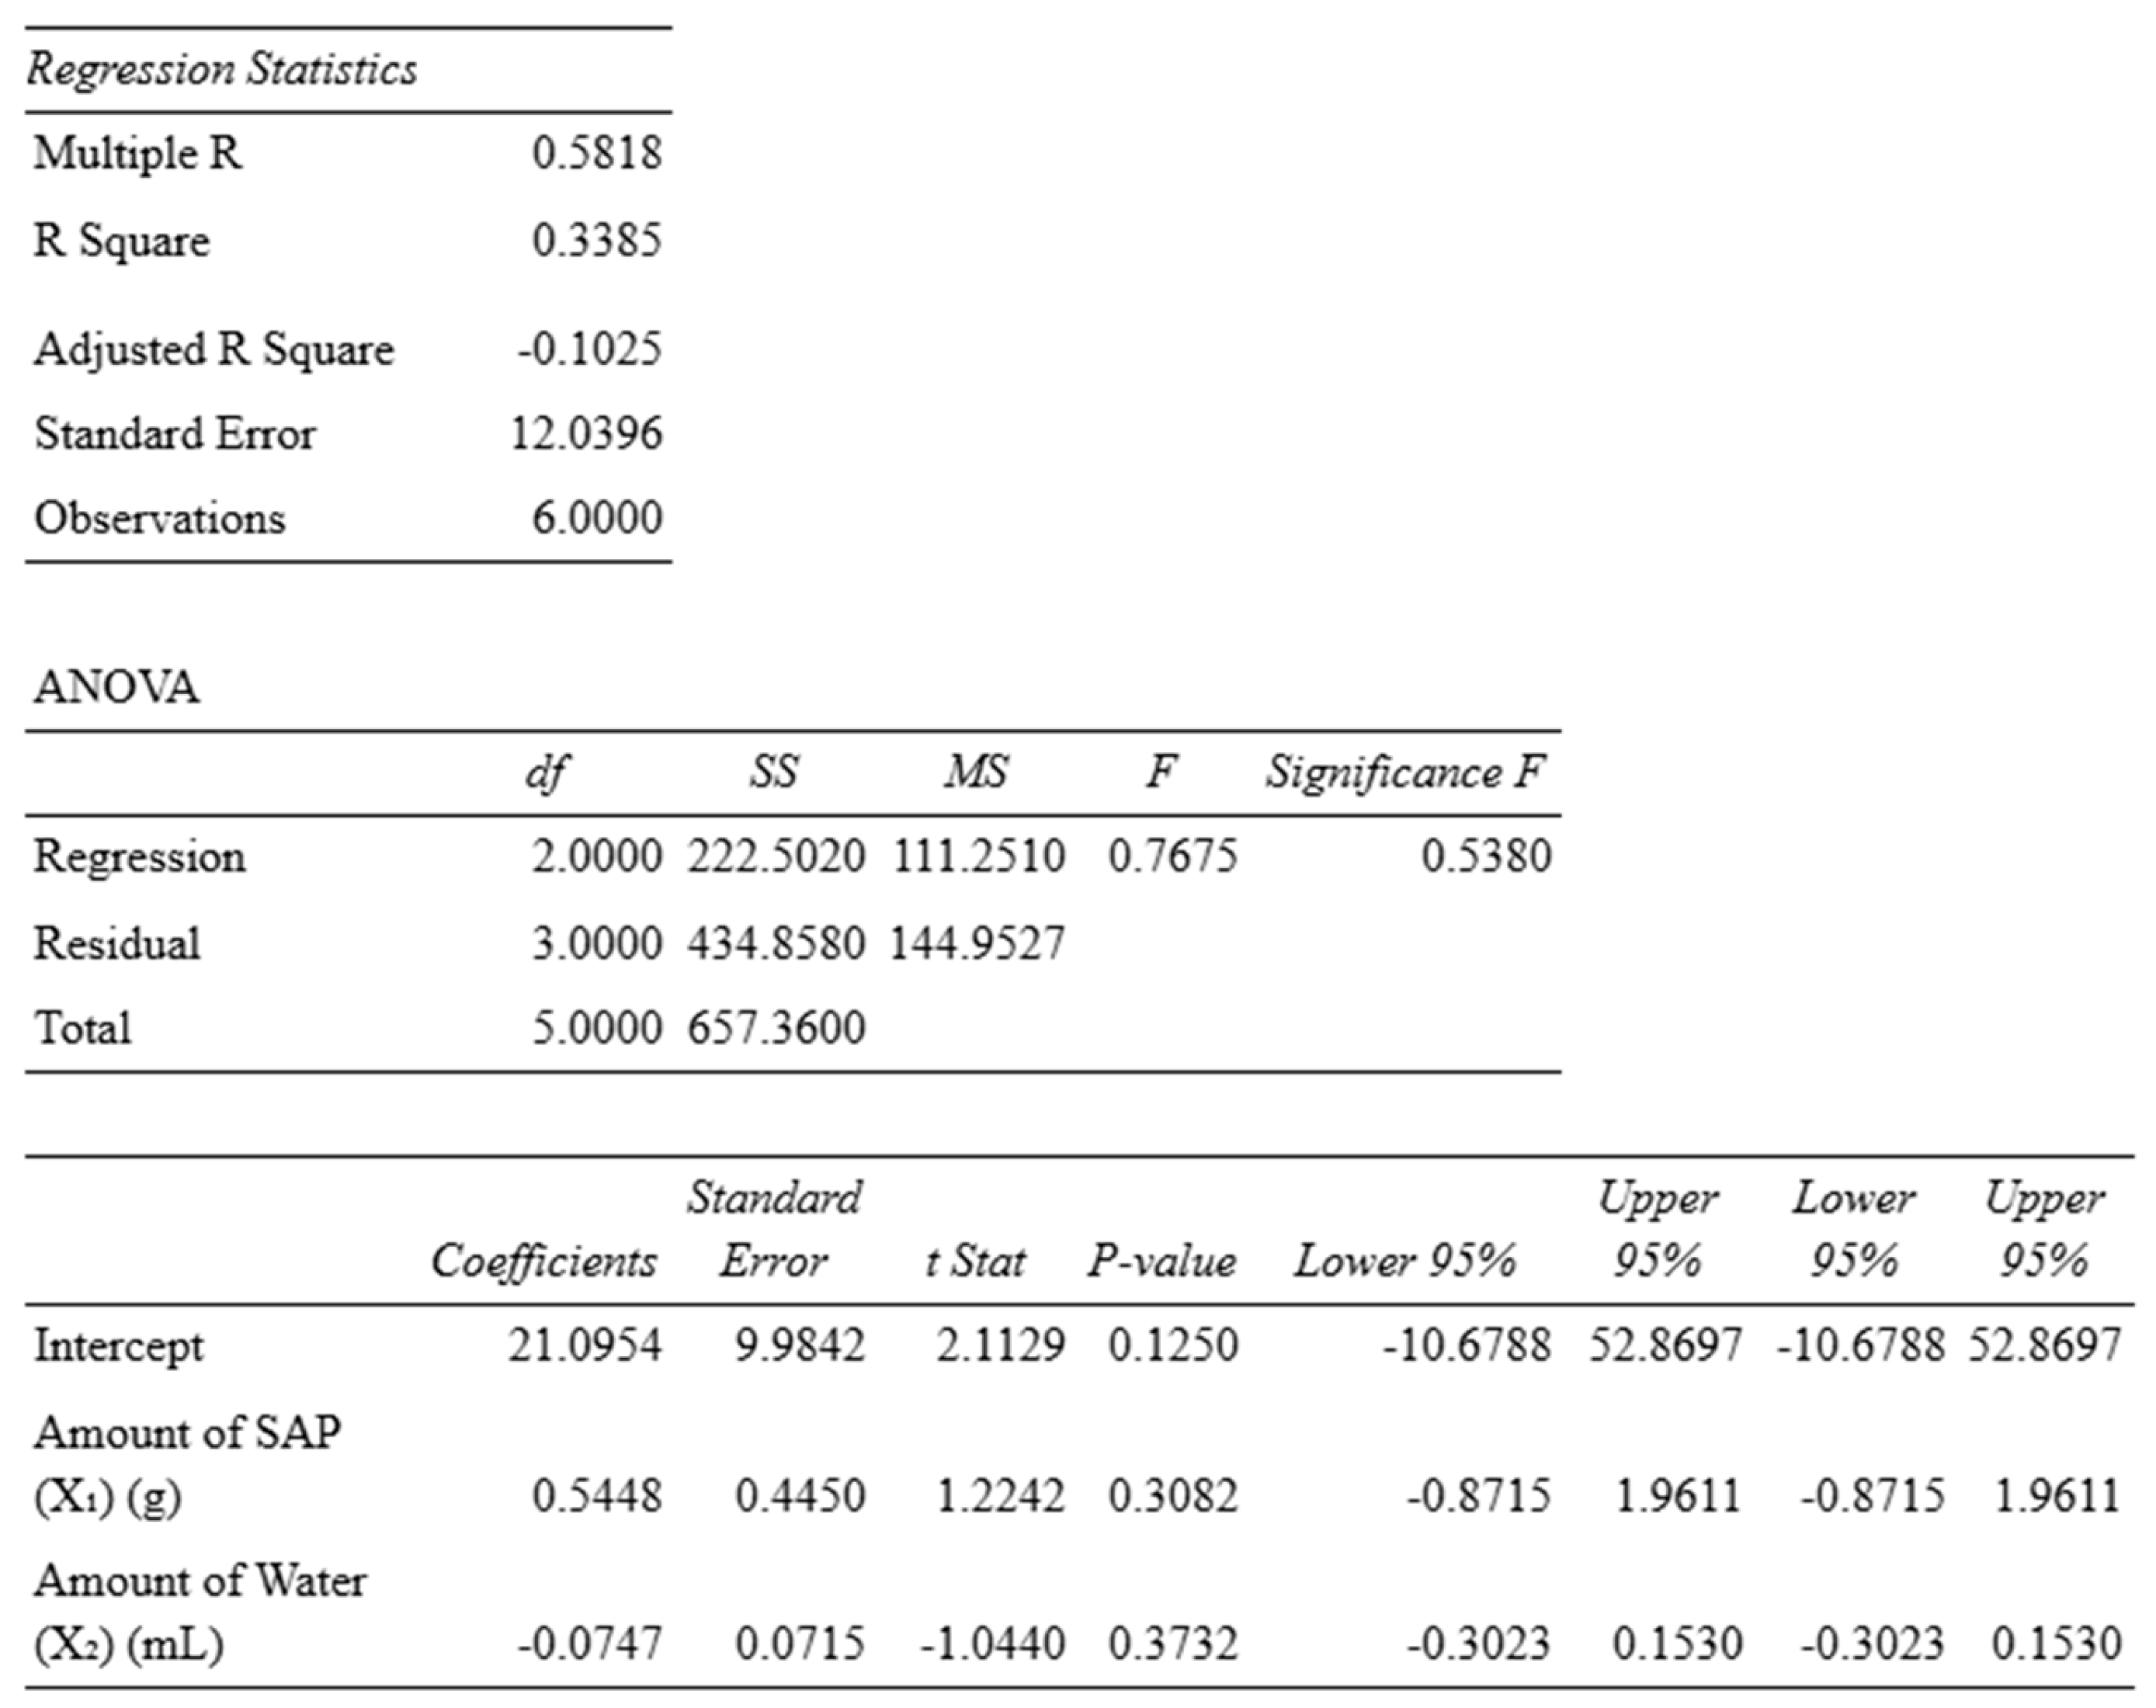 |
Figure 4.
Amount of Superabsorbent Polymers for Sand.
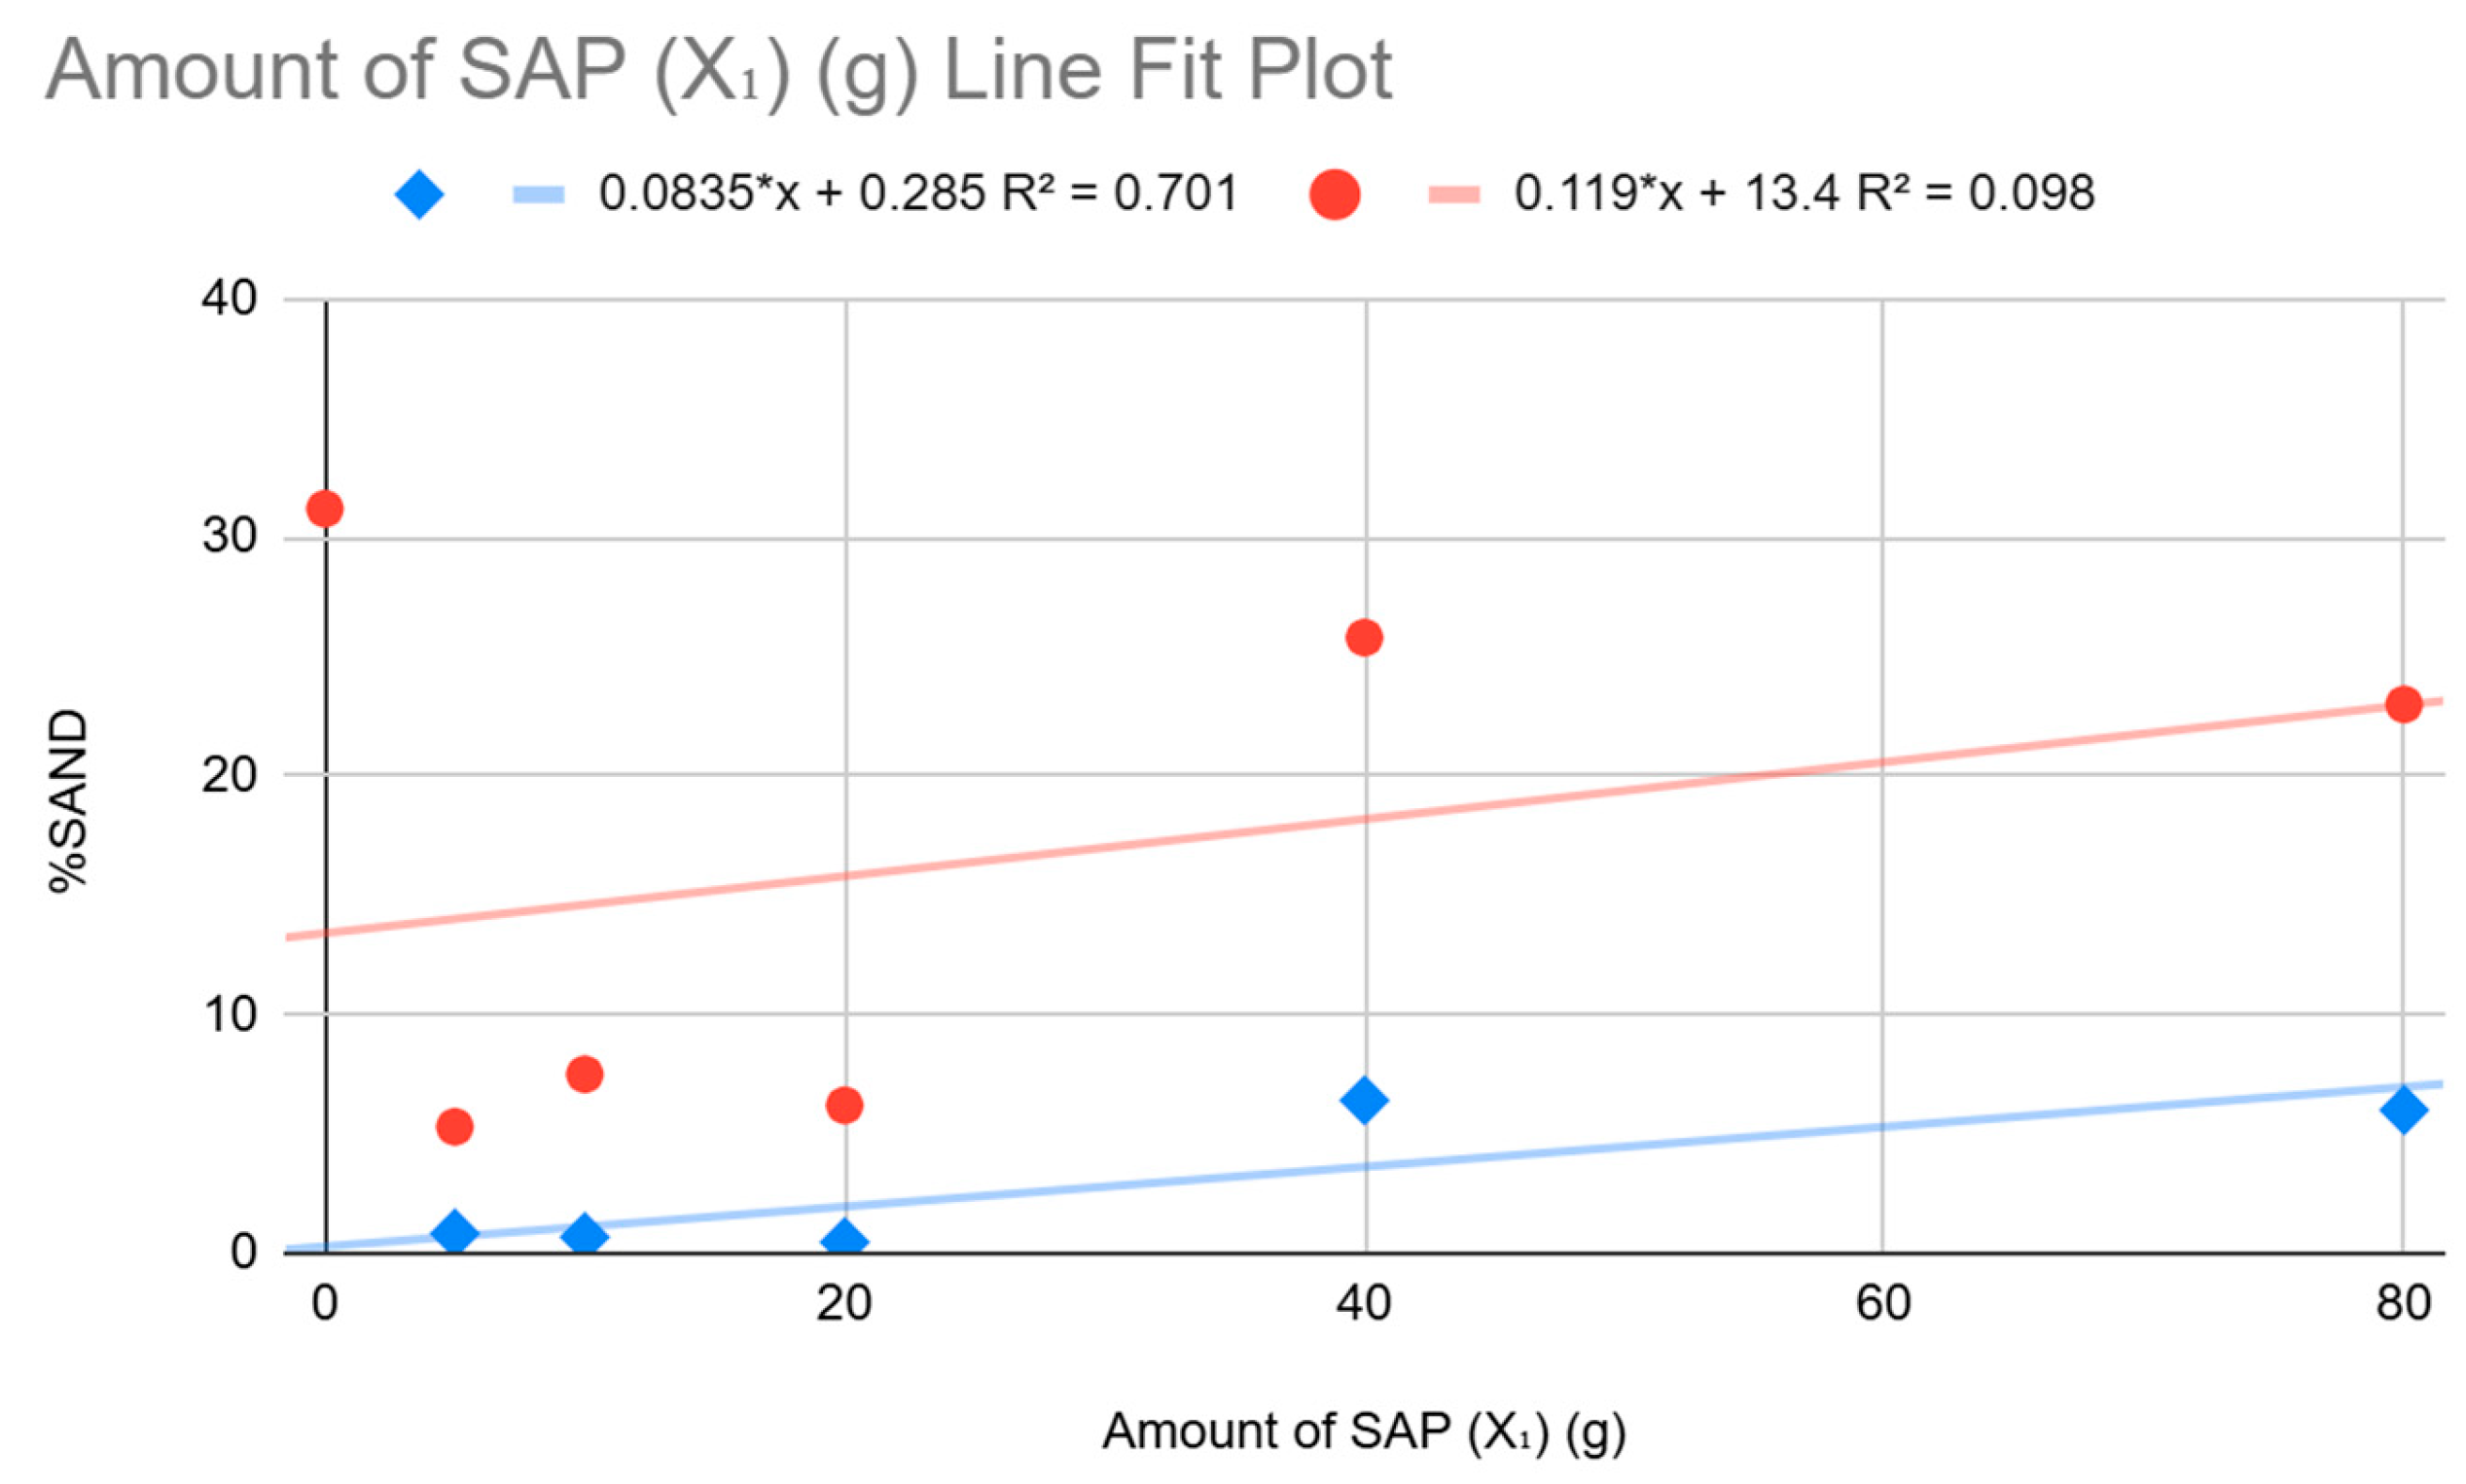
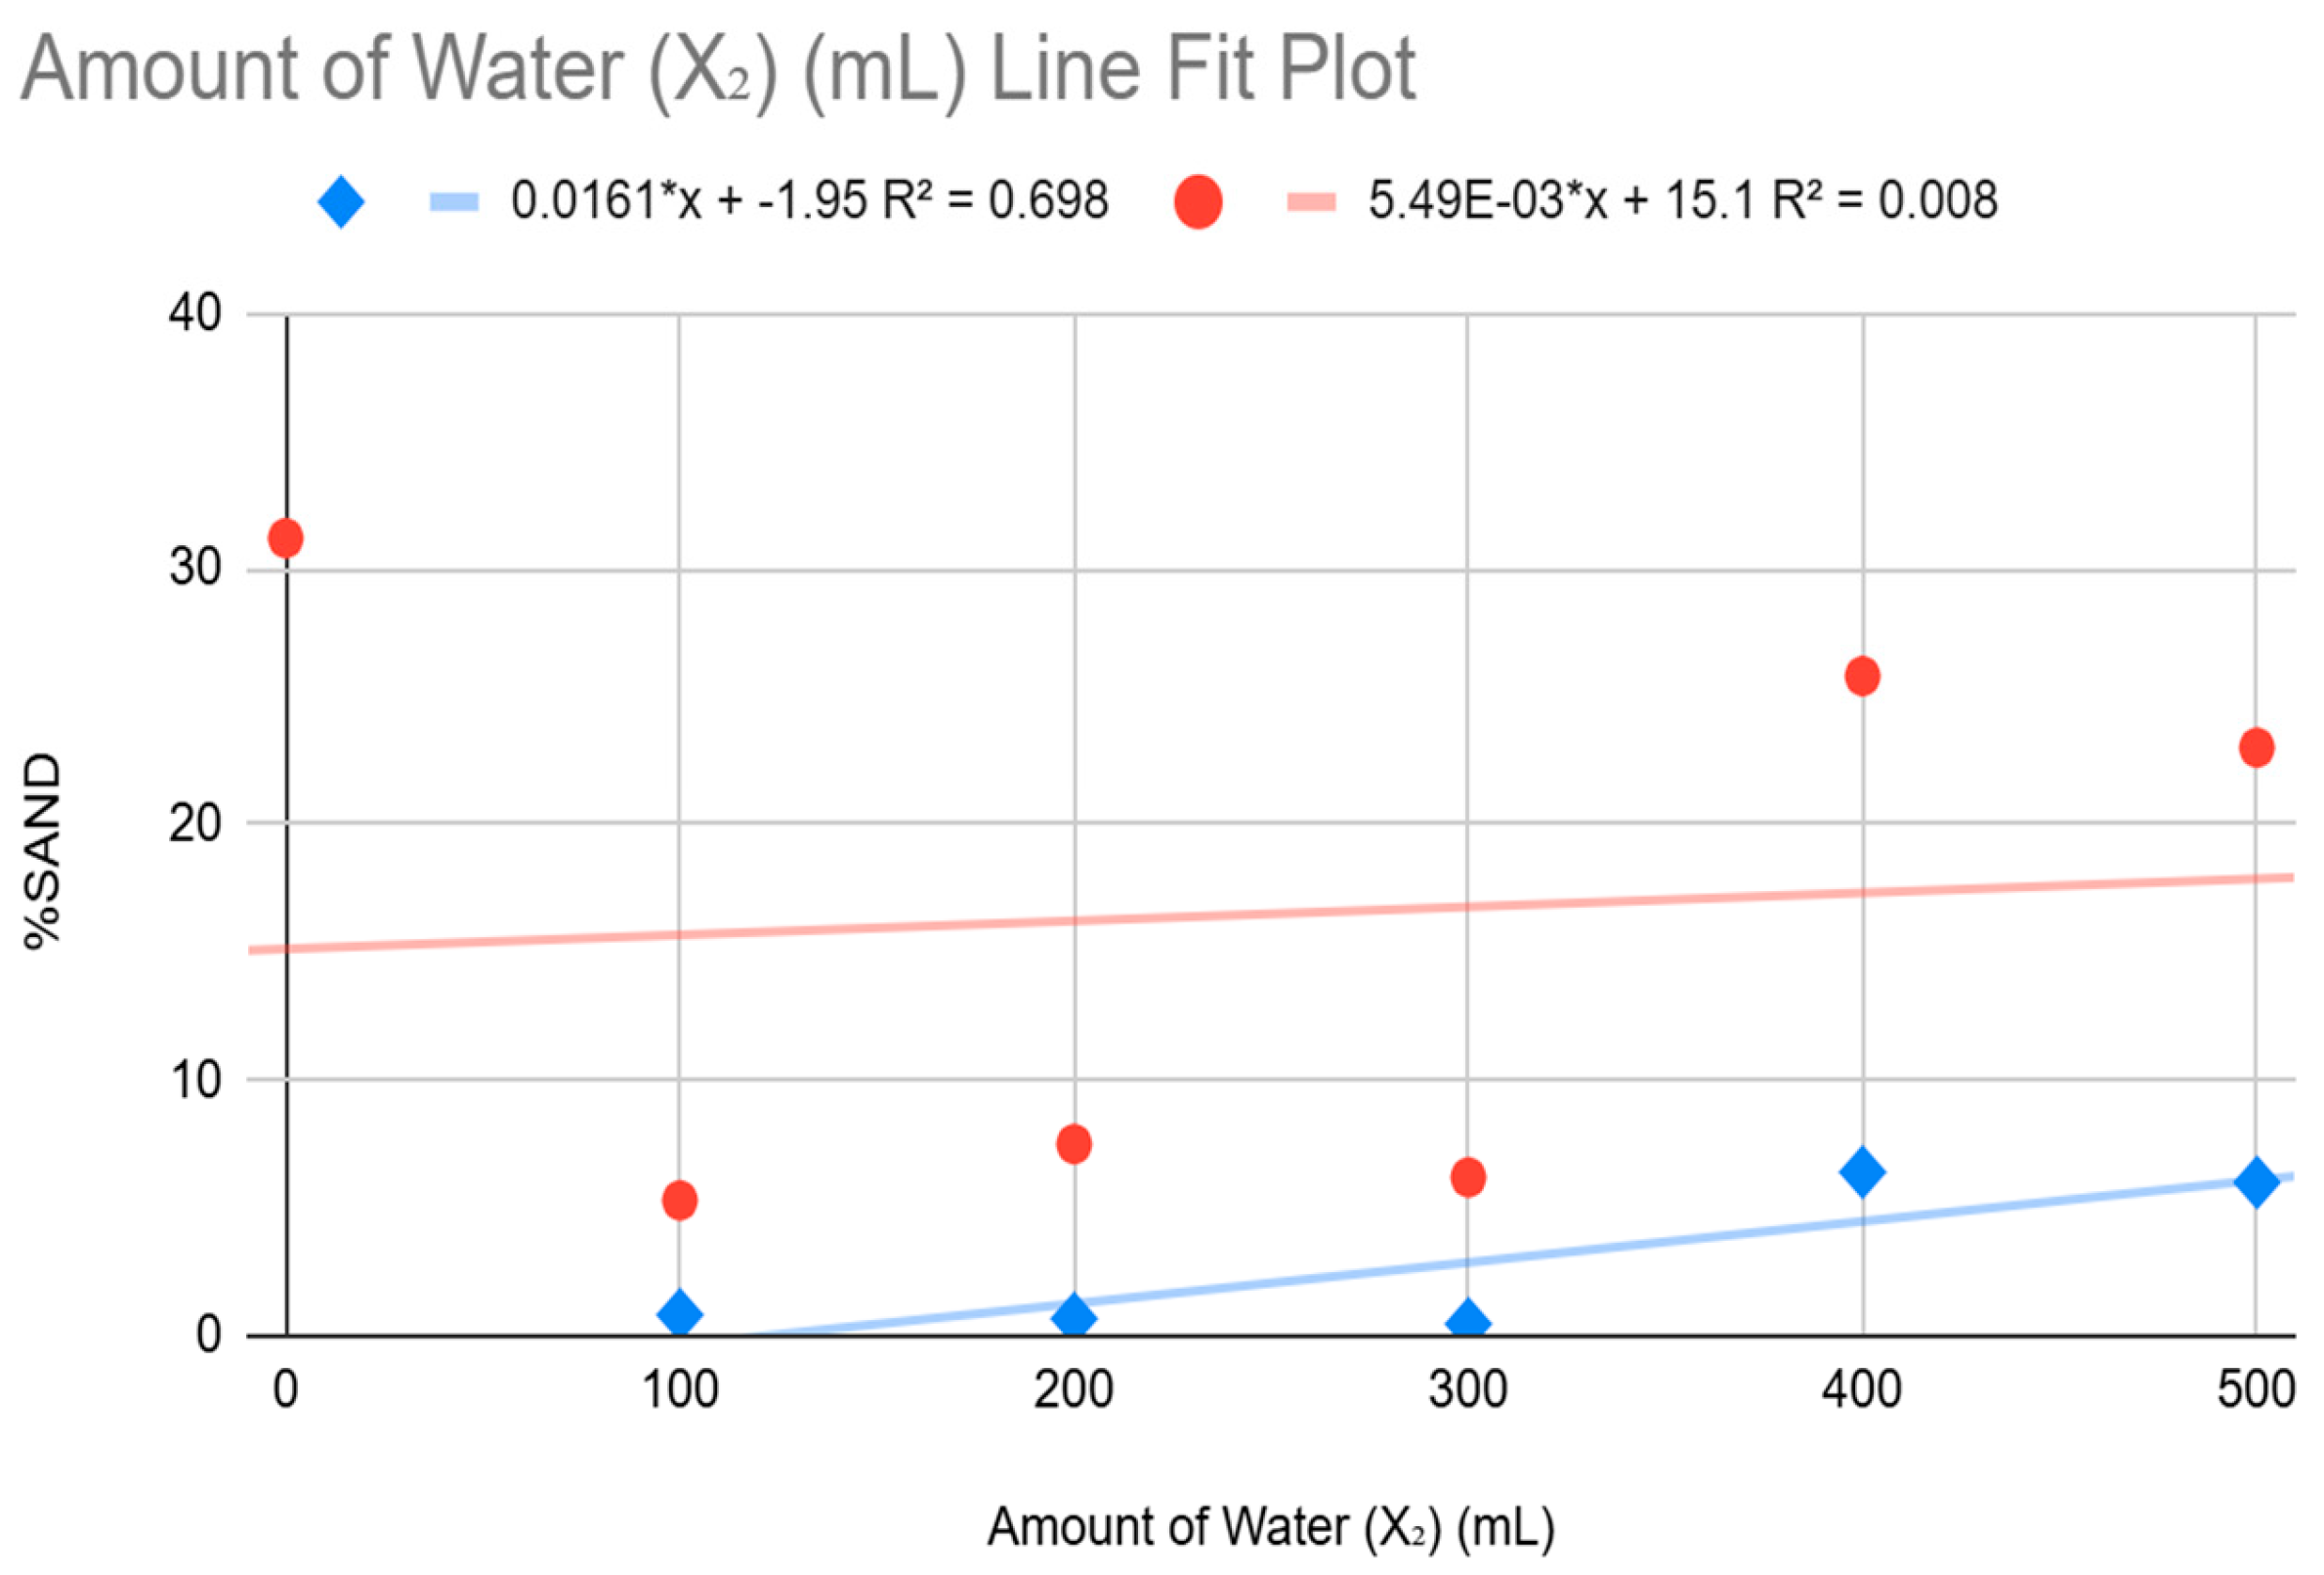
Figure 5.
Amount of Water for Sand.
Looking at the ANOVA results, the Significance F value of 0.5380 is much greater than the typical significance level of 0.05 which indicates that the regression model is not statistically significant. The coefficients further suggest an inconsistent trend in the impact of Superabsorbent Polymers and water on sand percentage. The Superabsorbent Polymers coefficient is positive (0.5448) which means that higher Superabsorbent Polymers levels are associated with a slight increase in sand content, whereas the water coefficient is negative (-0.0747), indicating that increasing water reduces sand content. However, both P-values (0.3082 for Superabsorbent Polymers and 0.3732 for water) exceed 0.05, meaning their effects are not statistically significant.
Examining the raw data, sand content fluctuates inconsistently. At 5g Superabsorbent Polymers and 100mL water, sand content sharply drops to 5.30%, then slightly increases at 10g Superabsorbent Polymers but decreases again at 20g Superabsorbent Polymers. However, at 40g Superabsorbent Polymers and 80g Superabsorbent Polymers, sand content rises significantly to 25.80% and 23.00%, respectively. This erratic pattern suggests that Superabsorbent Polymers and water alone do not have a consistent influence on sand content, reinforcing the idea that external soil properties or experimental conditions could be playing a more dominant role.
While the researchers goal is to maximize water retention and minimize irrigation, this regression suggests that sand content is not a primary indicator of these objectives. Instead, other soil texture components such as silt and clay, which influence water retention more directly, may provide better insights into the effectiveness of Superabsorbent Polymers in improving soil physical characteristics.
3.8. Silt
The regression analysis for silt content evaluates how the application of Superabsorbent Polymers and water affects the proportion of silt in the soil. The R² value of 0.6801 indicates that 68.01% of the variation in silt content can be explained by the amount of Superabsorbent Polymers and water applied, suggesting a moderate relationship. This means that while Superabsorbent Polymers and water have a measurable impact on silt content, other unaccounted factors still contribute significantly to its variation. These factors may include the initial soil composition, compaction levels, organic matter content, and environmental conditions such as humidity and temperature.
Figure 6.
Amount of Superabsorbent Polymers for Silt.
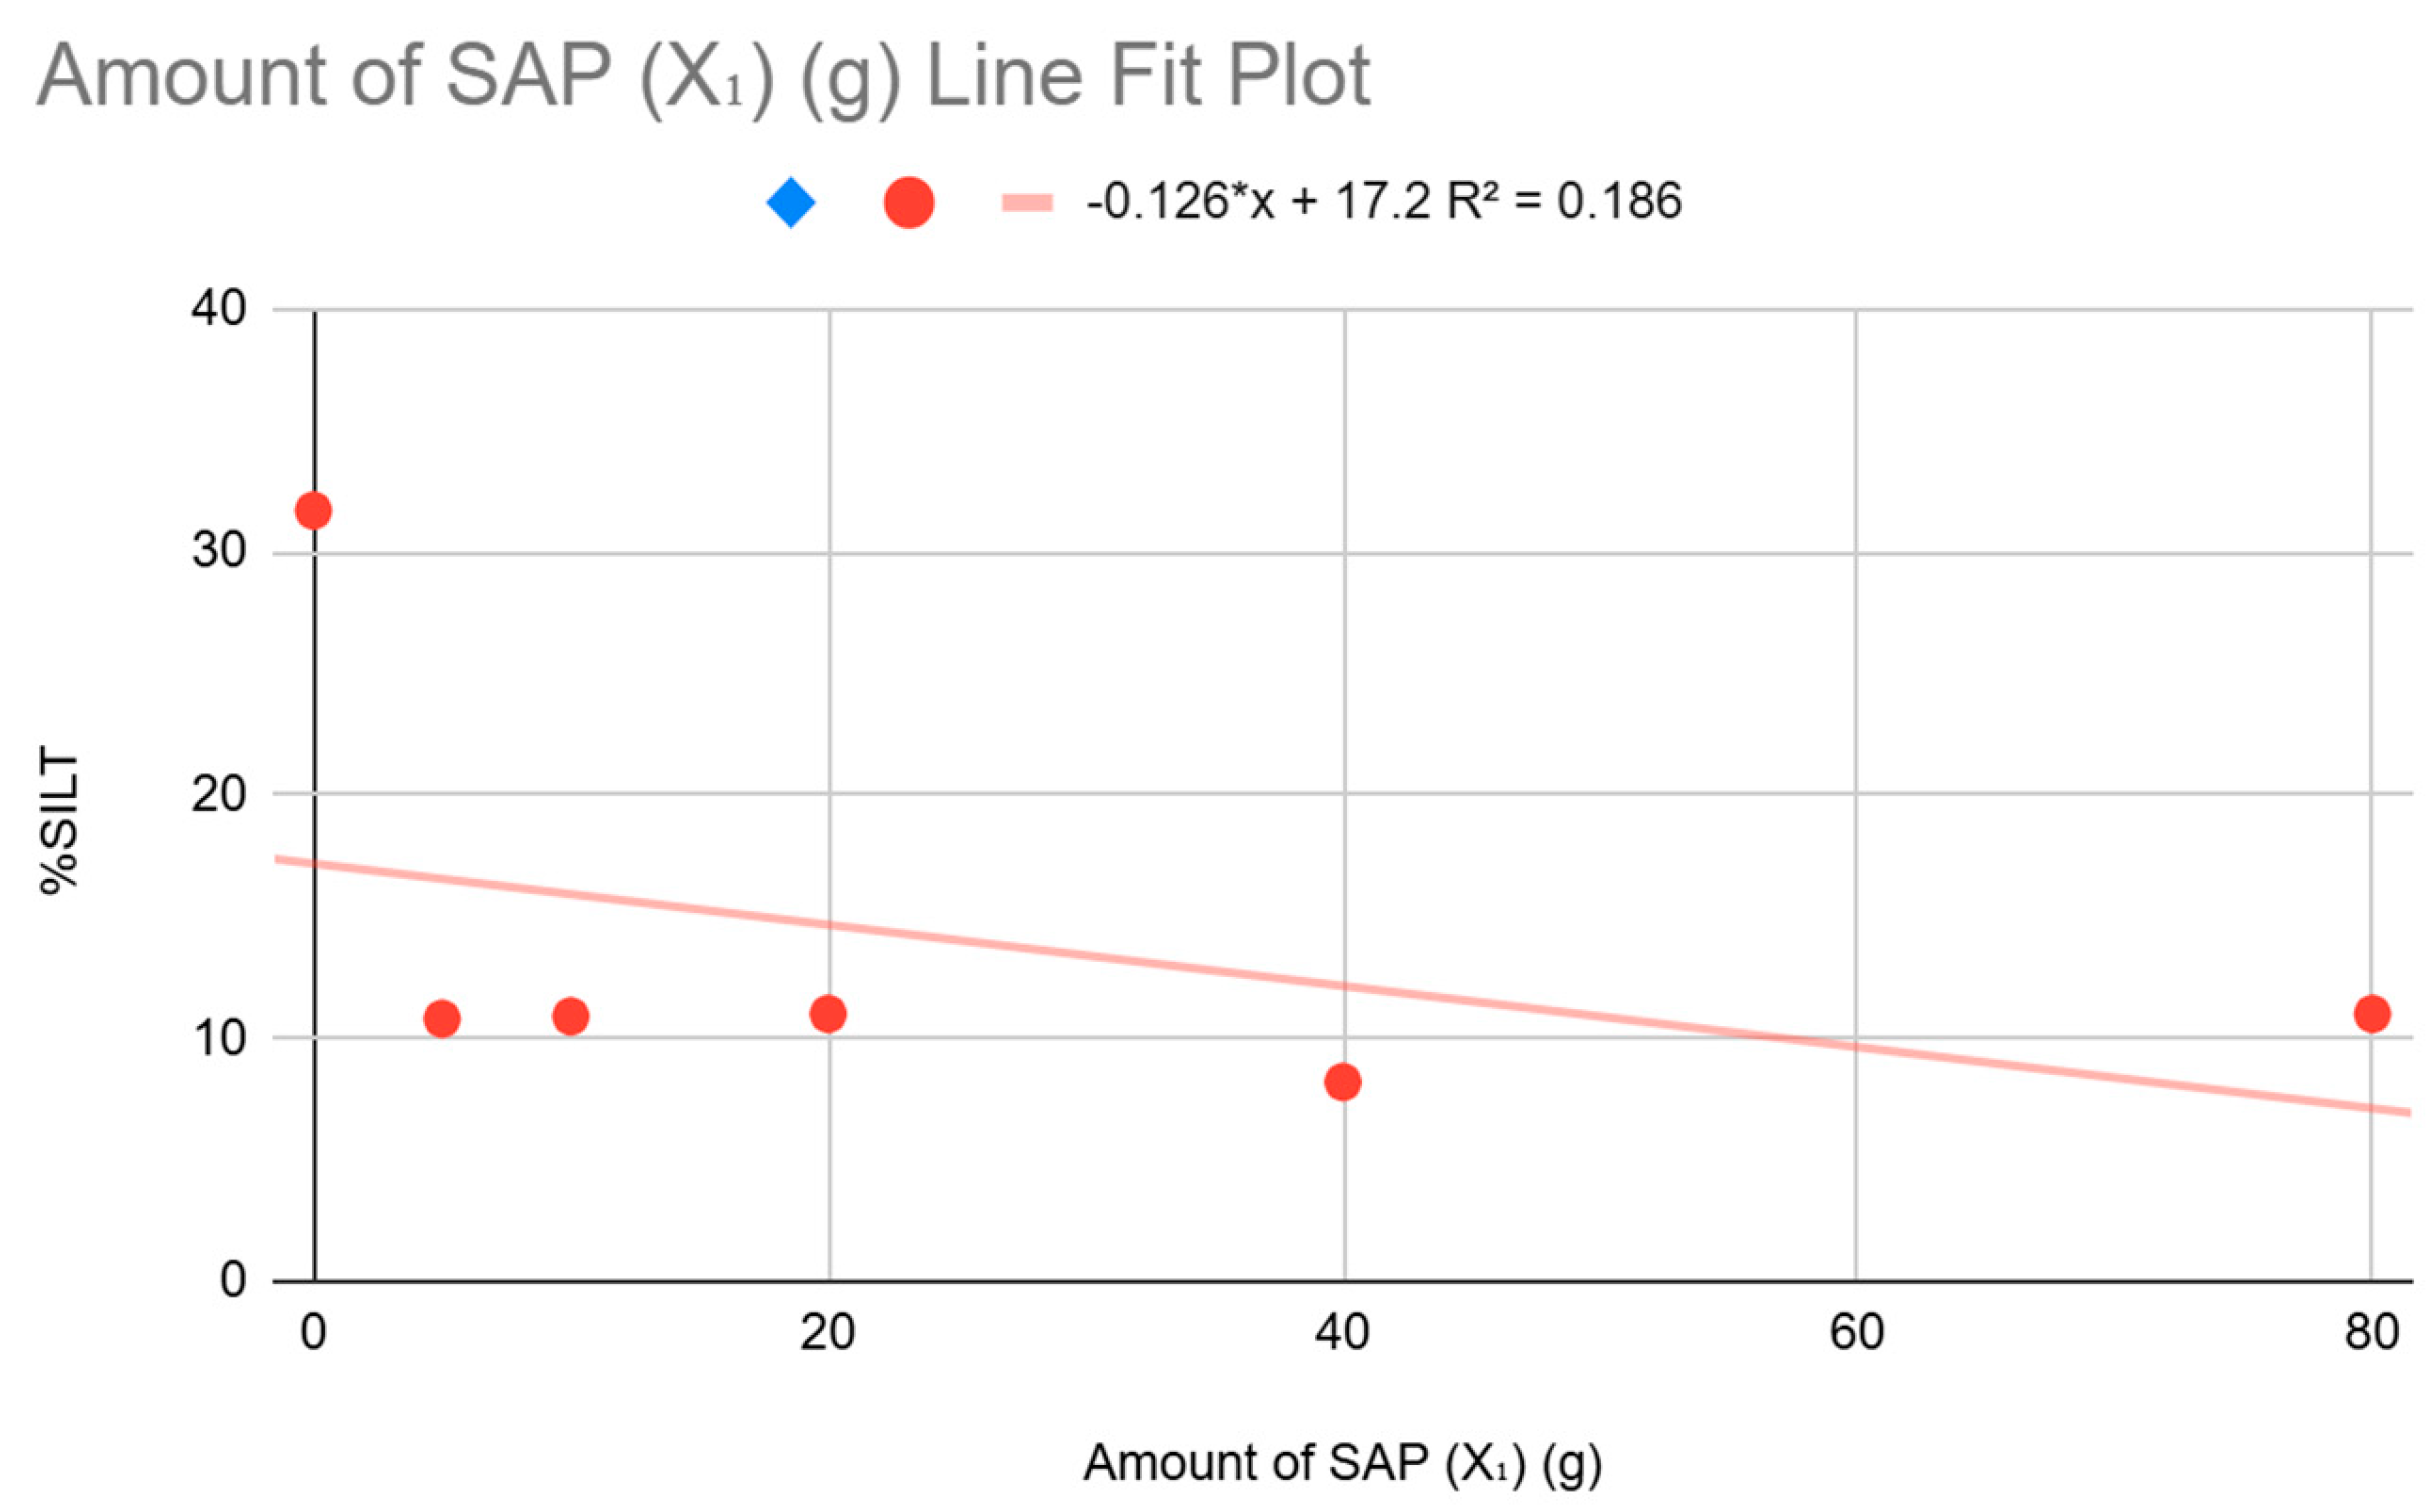
Figure 7.
Amount of Water for Silt.
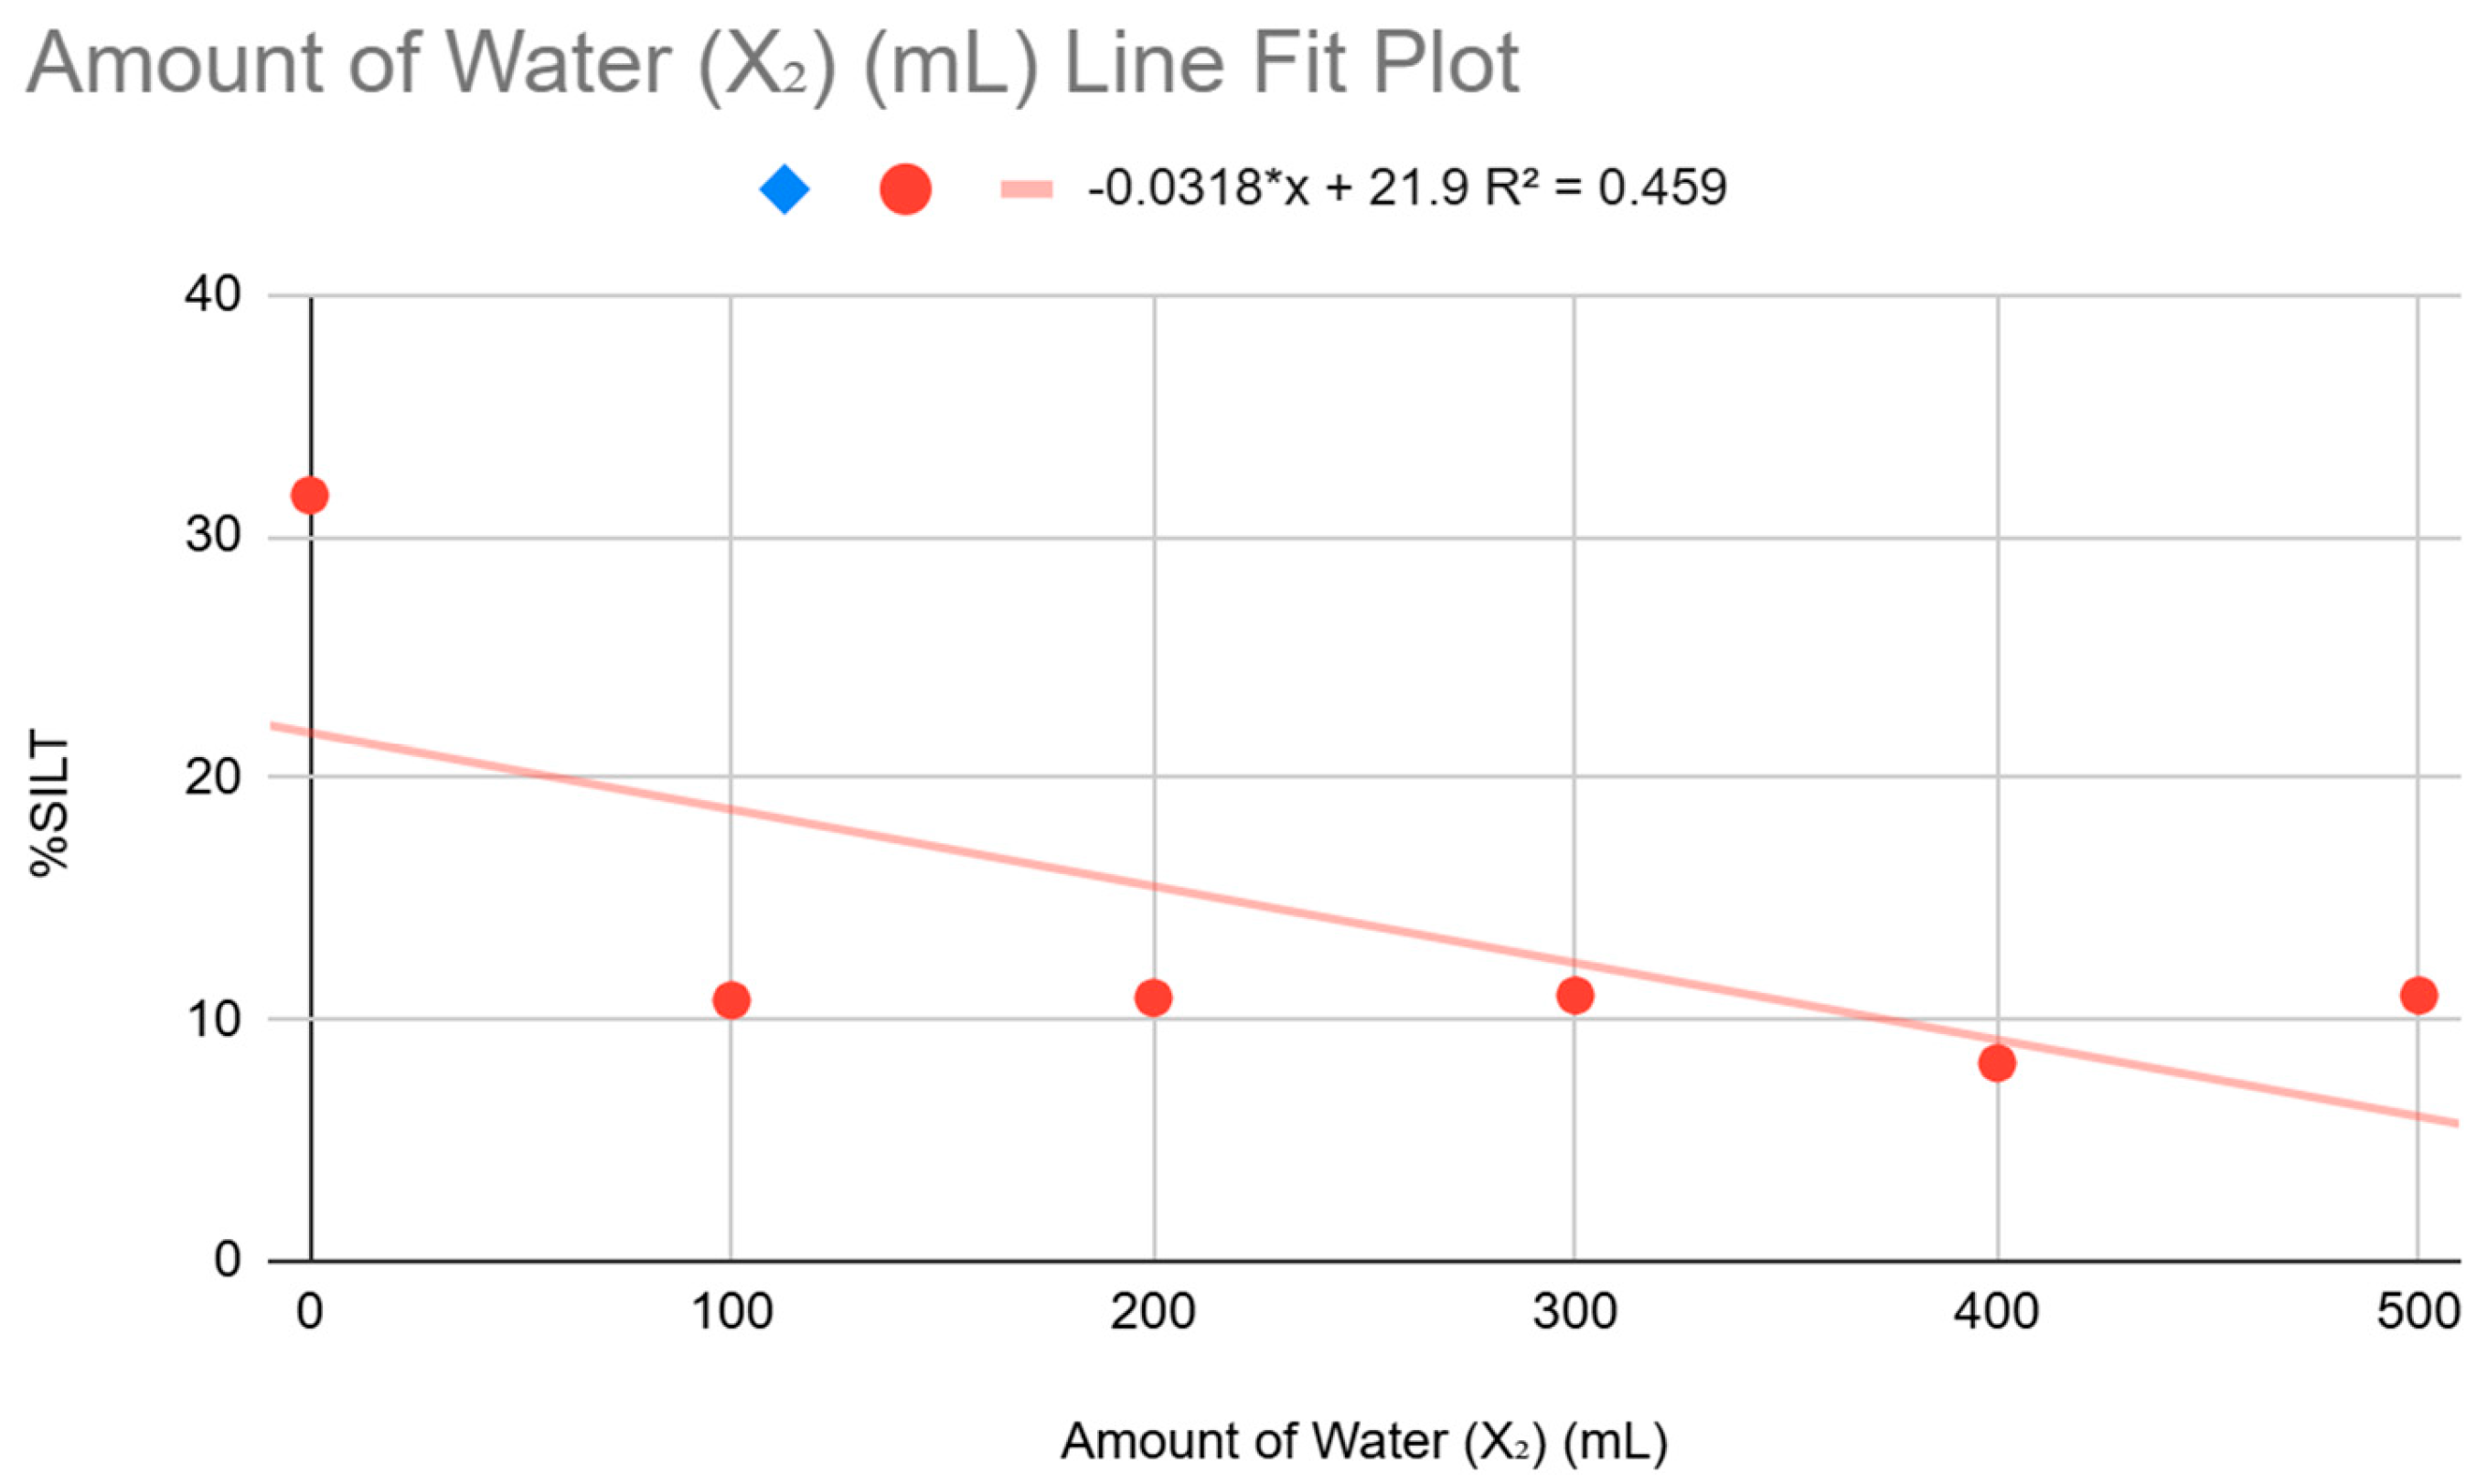
The ANOVA results reveal a Significance F value of 0.1809, which is greater than the standard threshold of 0.05. This suggests that the overall regression model is not statistically significant, meaning that the changes in silt content may be due to random variation rather than a strong predictive relationship with Superabsorbent Polymers and water.
Analyzing the regression coefficients, we see that the Superabsorbent Polymers coefficient is 0.3408, indicating a slight positive relationship between Superabsorbent Polymers and silt content. However, its P-value of 0.2456 is greater than 0.05, meaning this effect is not statistically significant. On the other hand, the water coefficient is -0.0819, suggesting that increasing water application leads to a decrease in silt content. While this aligns with the expectation that more water could displace finer particles like silt, the P-value of 0.1204 still does not meet the statistical significance threshold.
Observing the raw data, silt content fluctuates inconsistently with Superabsorbent Polymers and water application. It starts at 31.70% with 0g Superabsorbent Polymers and 0mL water, then drastically drops to around 10.80%-11.00% as Superabsorbent Polymers and water are introduced. However, at 40g Superabsorbent Polymers, silt content reaches its lowest point at 8.20% before slightly increasing again at 80g Superabsorbent Polymers. This pattern suggests that Superabsorbent Polymers and water influence silt content but not in a linear or predictable manner, reinforcing the idea that other soil properties and interactions must be considered.
From the perspective of the research goal which is to maximize water retention and minimize irrigation, this regression analysis indicates that silt content alone may not be a strong predictor of water retention improvements. Since silt plays a crucial role in holding water due to its fine particle size, its significant reduction with Superabsorbent Polymers and water application could imply a change in soil texture that affects water absorption and retention capacity. However, given the inconsistency in the trend, a deeper examination of clay content and overall soil structure is necessary to fully understand the implications of Superabsorbent Polymers in improving water retention.
3.9. Clay
The regression analysis for clay content examines how the amount of Superabsorbent Polymers and water influences the proportion of clay in the soil. The R² value of 0.4324 suggests that 43.24% of the variation in clay content can be explained by Superabsorbent Polymers and water application, indicating a moderate but weak relationship. This implies that while Superabsorbent Polymers and water have some influence, a significant portion of clay content variation is due to other unaccounted factors, such as initial soil composition, compaction, organic matter, and environmental conditions.
Table 27.
Linear Regression Results -%Clay.
 |
Figure 8.
Amount of Superabsorbent Polymers for Clay.
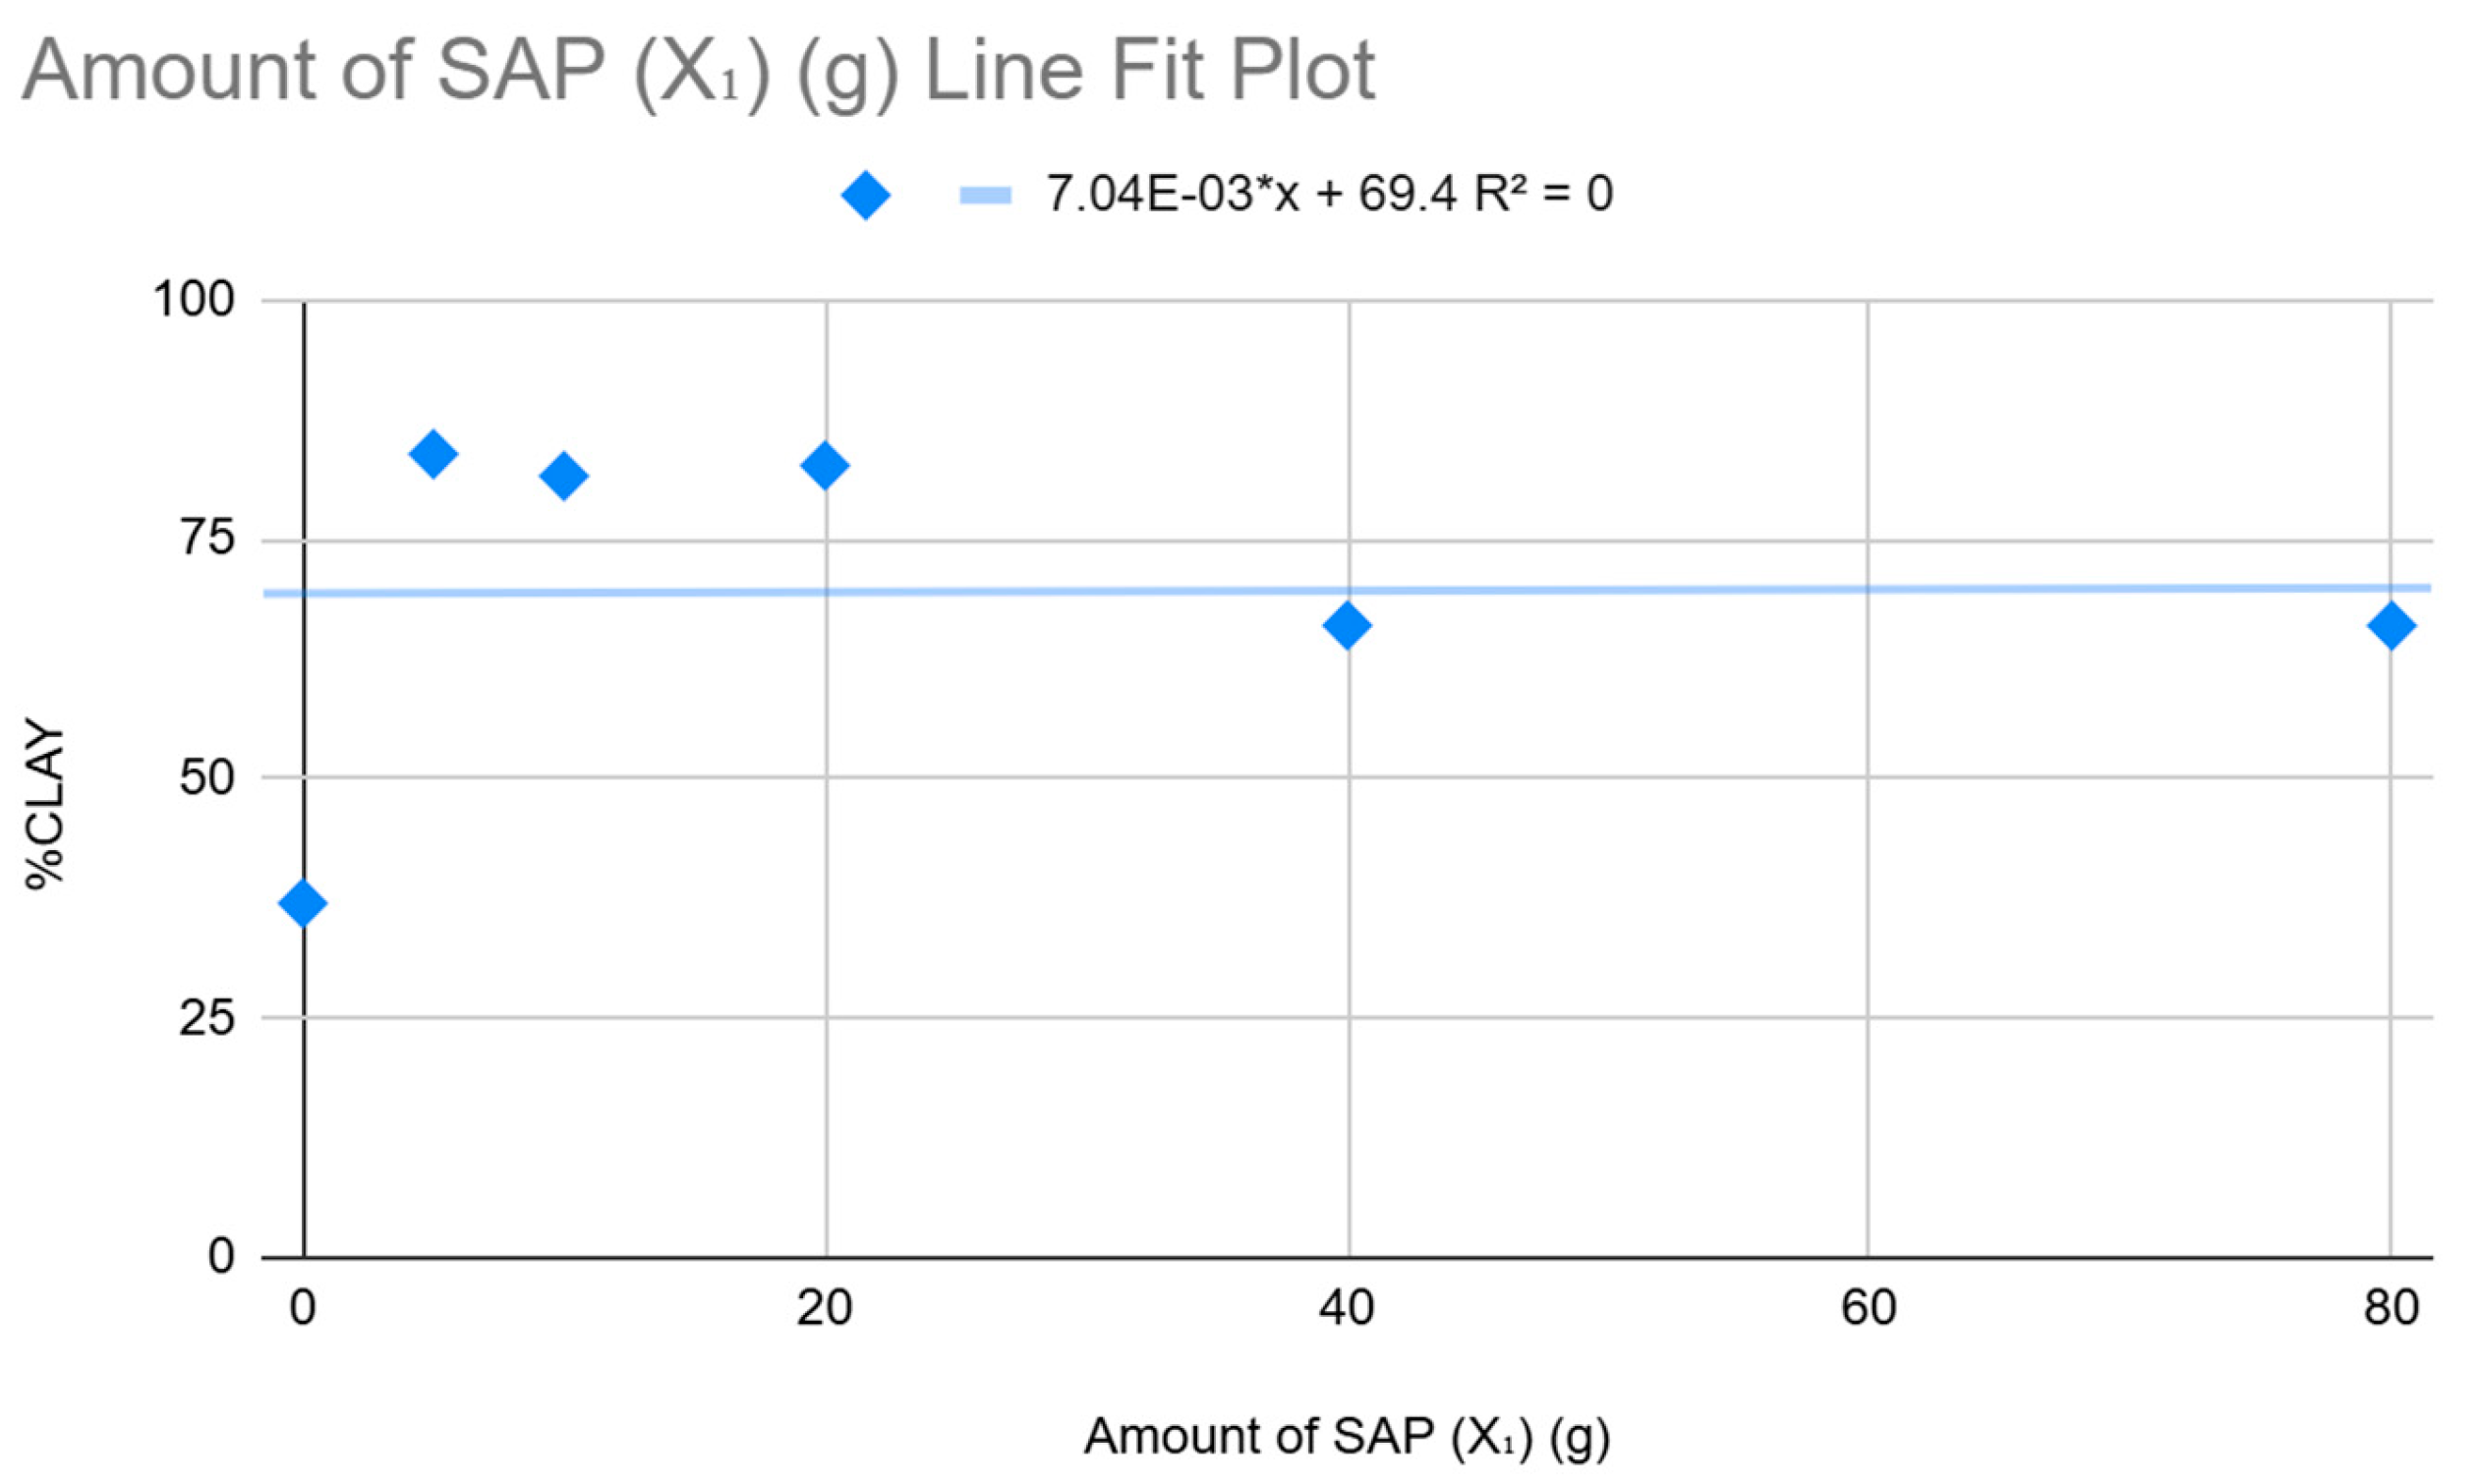
Figure 9.
Amount of Water for Clay.
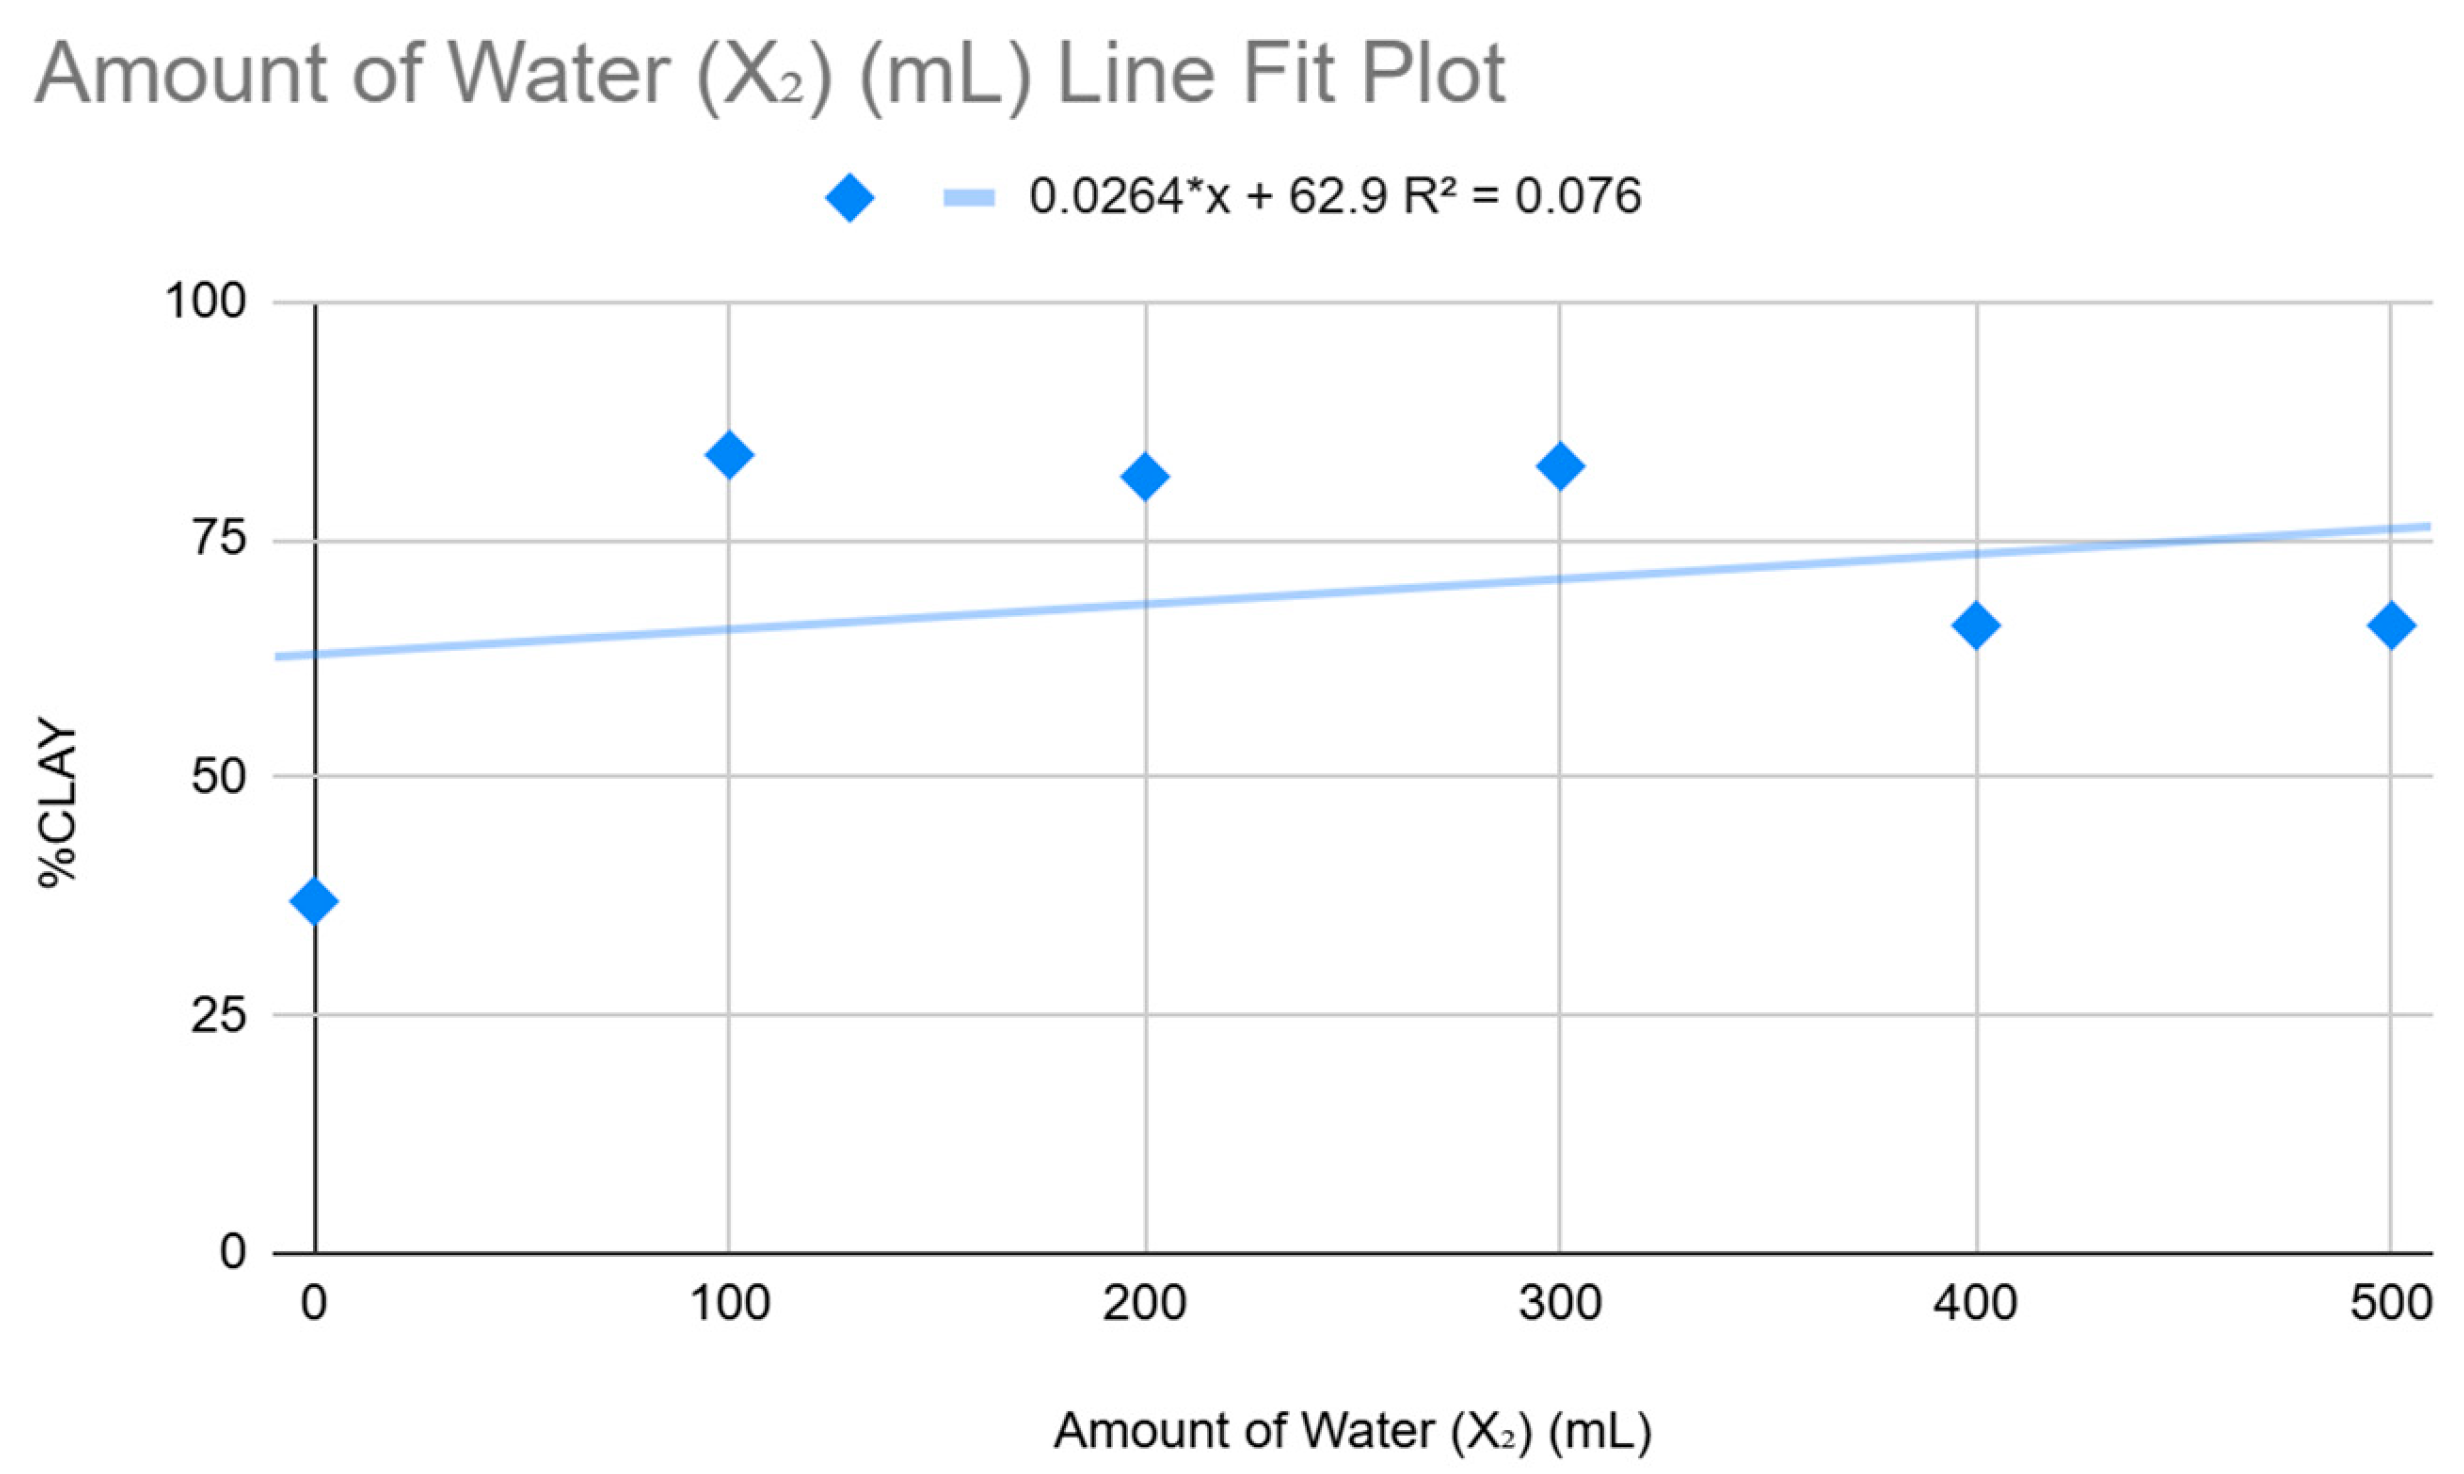
The ANOVA results show a Significance F value of 0.4276, which is greater than 0.05, meaning that the overall regression model is not statistically significant. This suggests that changes in clay content may be due to random variation rather than a strong predictive relationship with Superabsorbent Polymers and water application.
Analyzing the regression coefficients, the Superabsorbent Polymers coefficient is -0.8853, indicating a negative relationship between Superabsorbent Polymers and clay content. However, its P-value of 0.2634 suggests that this effect is not statistically significant. Similarly, the water coefficient is 0.1567, implying that increasing water might slightly increase clay content, but its P-value of 0.2278 means that the effect is also not statistically significant.
Observing the raw data, clay content fluctuates non-linearly with SAP and water application. It starts at 37.00% with 0g Superabsorbent Polymers and 0mL water but then increases significantly to 83.90% and 81.60% at 5g and 10g Superabsorbent Polymers, respectively. However, at 20g Superabsorbent Polymers, clay content rises slightly to 82.70% before dropping to 66.00% at 40g and 80g Superabsorbent Polymers. This inconsistent pattern suggests that Superabsorbent Polymers and water influence clay content, but not in a predictable manner, reinforcing the need to consider additional soil properties and interactions.
From the perspective of the research goal, to maximize water retention and minimize irrigation, clay content is a crucial factor, as clay particles have high water-holding capacity due to their fine structure. The initial increase in clay content with low Superabsorbent Polymers application aligns with the expectation that Superabsorbent Polymers helps retain finer particles. However, the decline at higher Superabsorbent Polymers levels (40g and 80g) suggests that excessive Superabsorbent Polymers may alter soil structure, potentially reducing the soil’s ability to retain clay particles. This could mean that an optimal Superabsorbent Polymers application exists which is potentially around 10g Superabsorbent Polymers and 200mL water where clay content is maximized without causing structural imbalance.
Given these findings, further investigation into soil aggregation, compaction, and interactions between Superabsorbent Polymers, clay, and organic matter is necessary to better understand how Superabsorbent Polymers can be applied effectively to enhance water retention while maintaining soil stability.
3.10. Water Holding Capacity
The regression analysis for Water Holding Capacity was conducted to determine the influence of Superabsorbent Polymers and water volume on soil water retention. The primary objective of this study is to maximize Water Holding Capacity while minimizing water irrigation by ensuring that agricultural practices become more efficient by identifying the optimal Superabsorbent Polymers-to-water ratio.
The study also looks at how different Superabsorbent Polymers concentrations interact with different quantities of water to improve soil moisture retention. The study offers a data-driven method for enhancing irrigation techniques by measuring these effects and ensuring that water is used effectively while preserving soil hydration. The results will aid in developing sustainable farming methods that maximize availability of water, reduce irrigation costs, and promote soil health in the span of time.
Table 28.
Linear Regression Results - Water Holding Capacity%
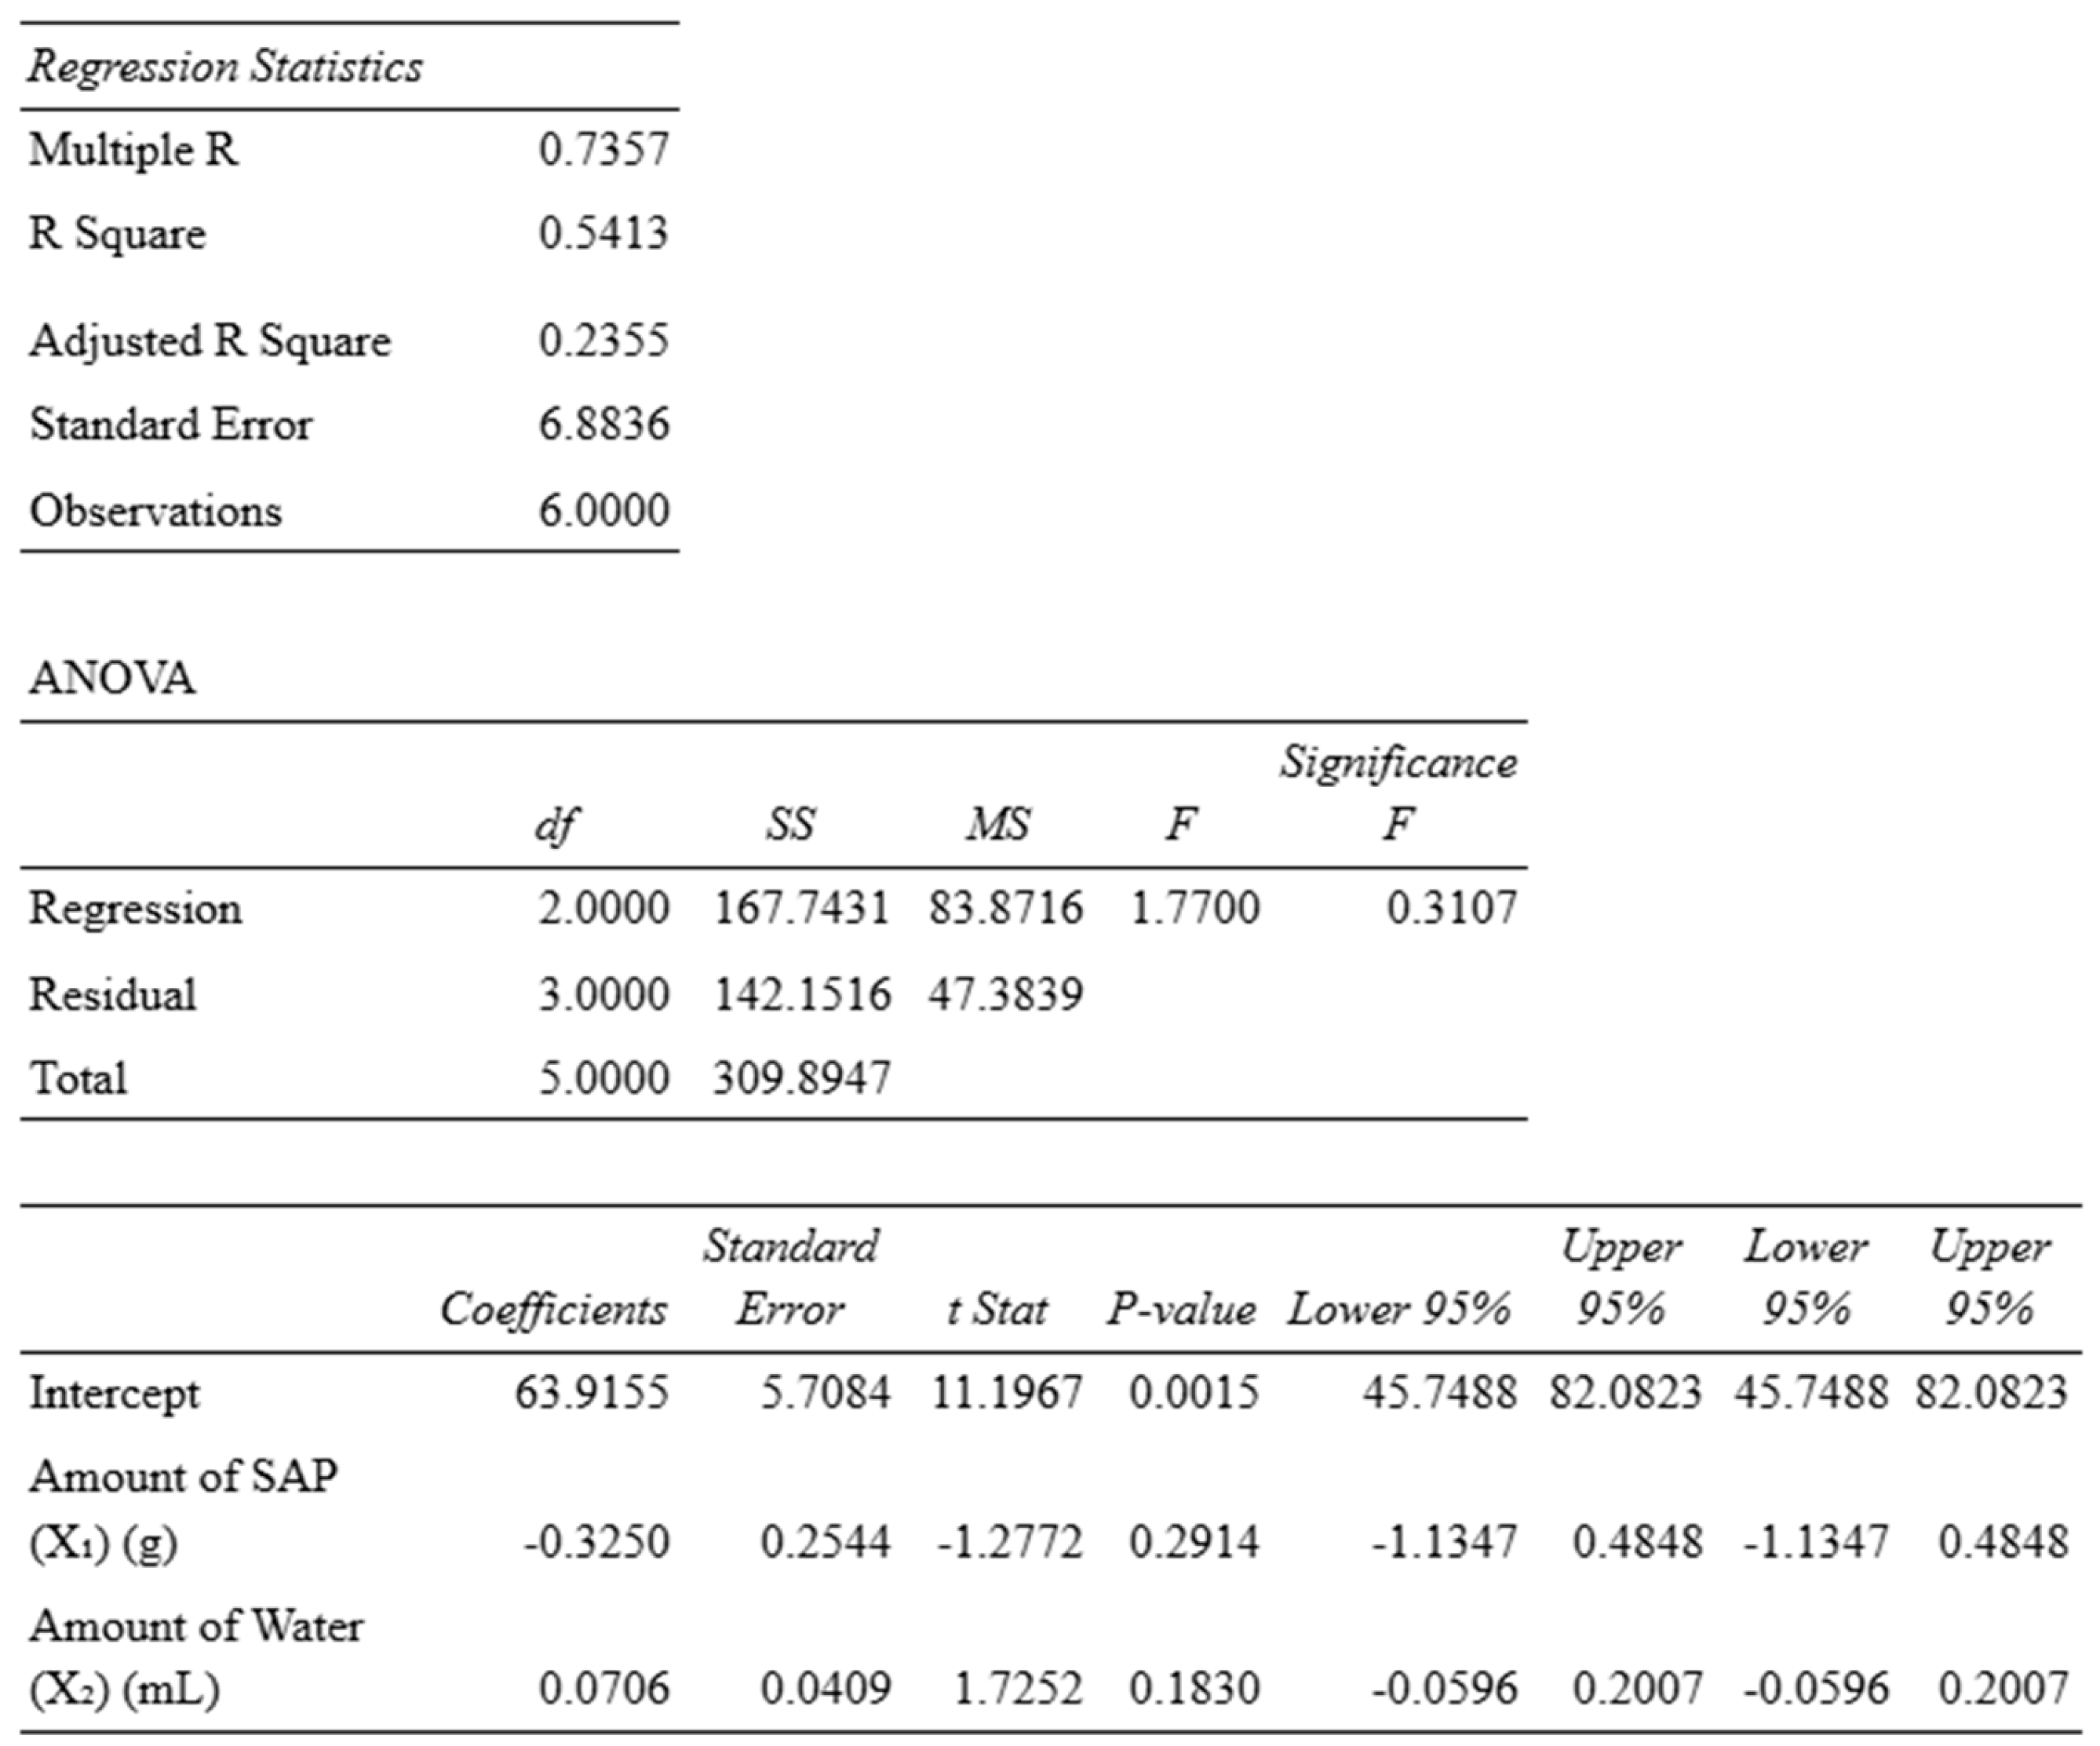 |
Figure 10.
Amount of Superabsorbent Polymers for Water Holding Capacity.
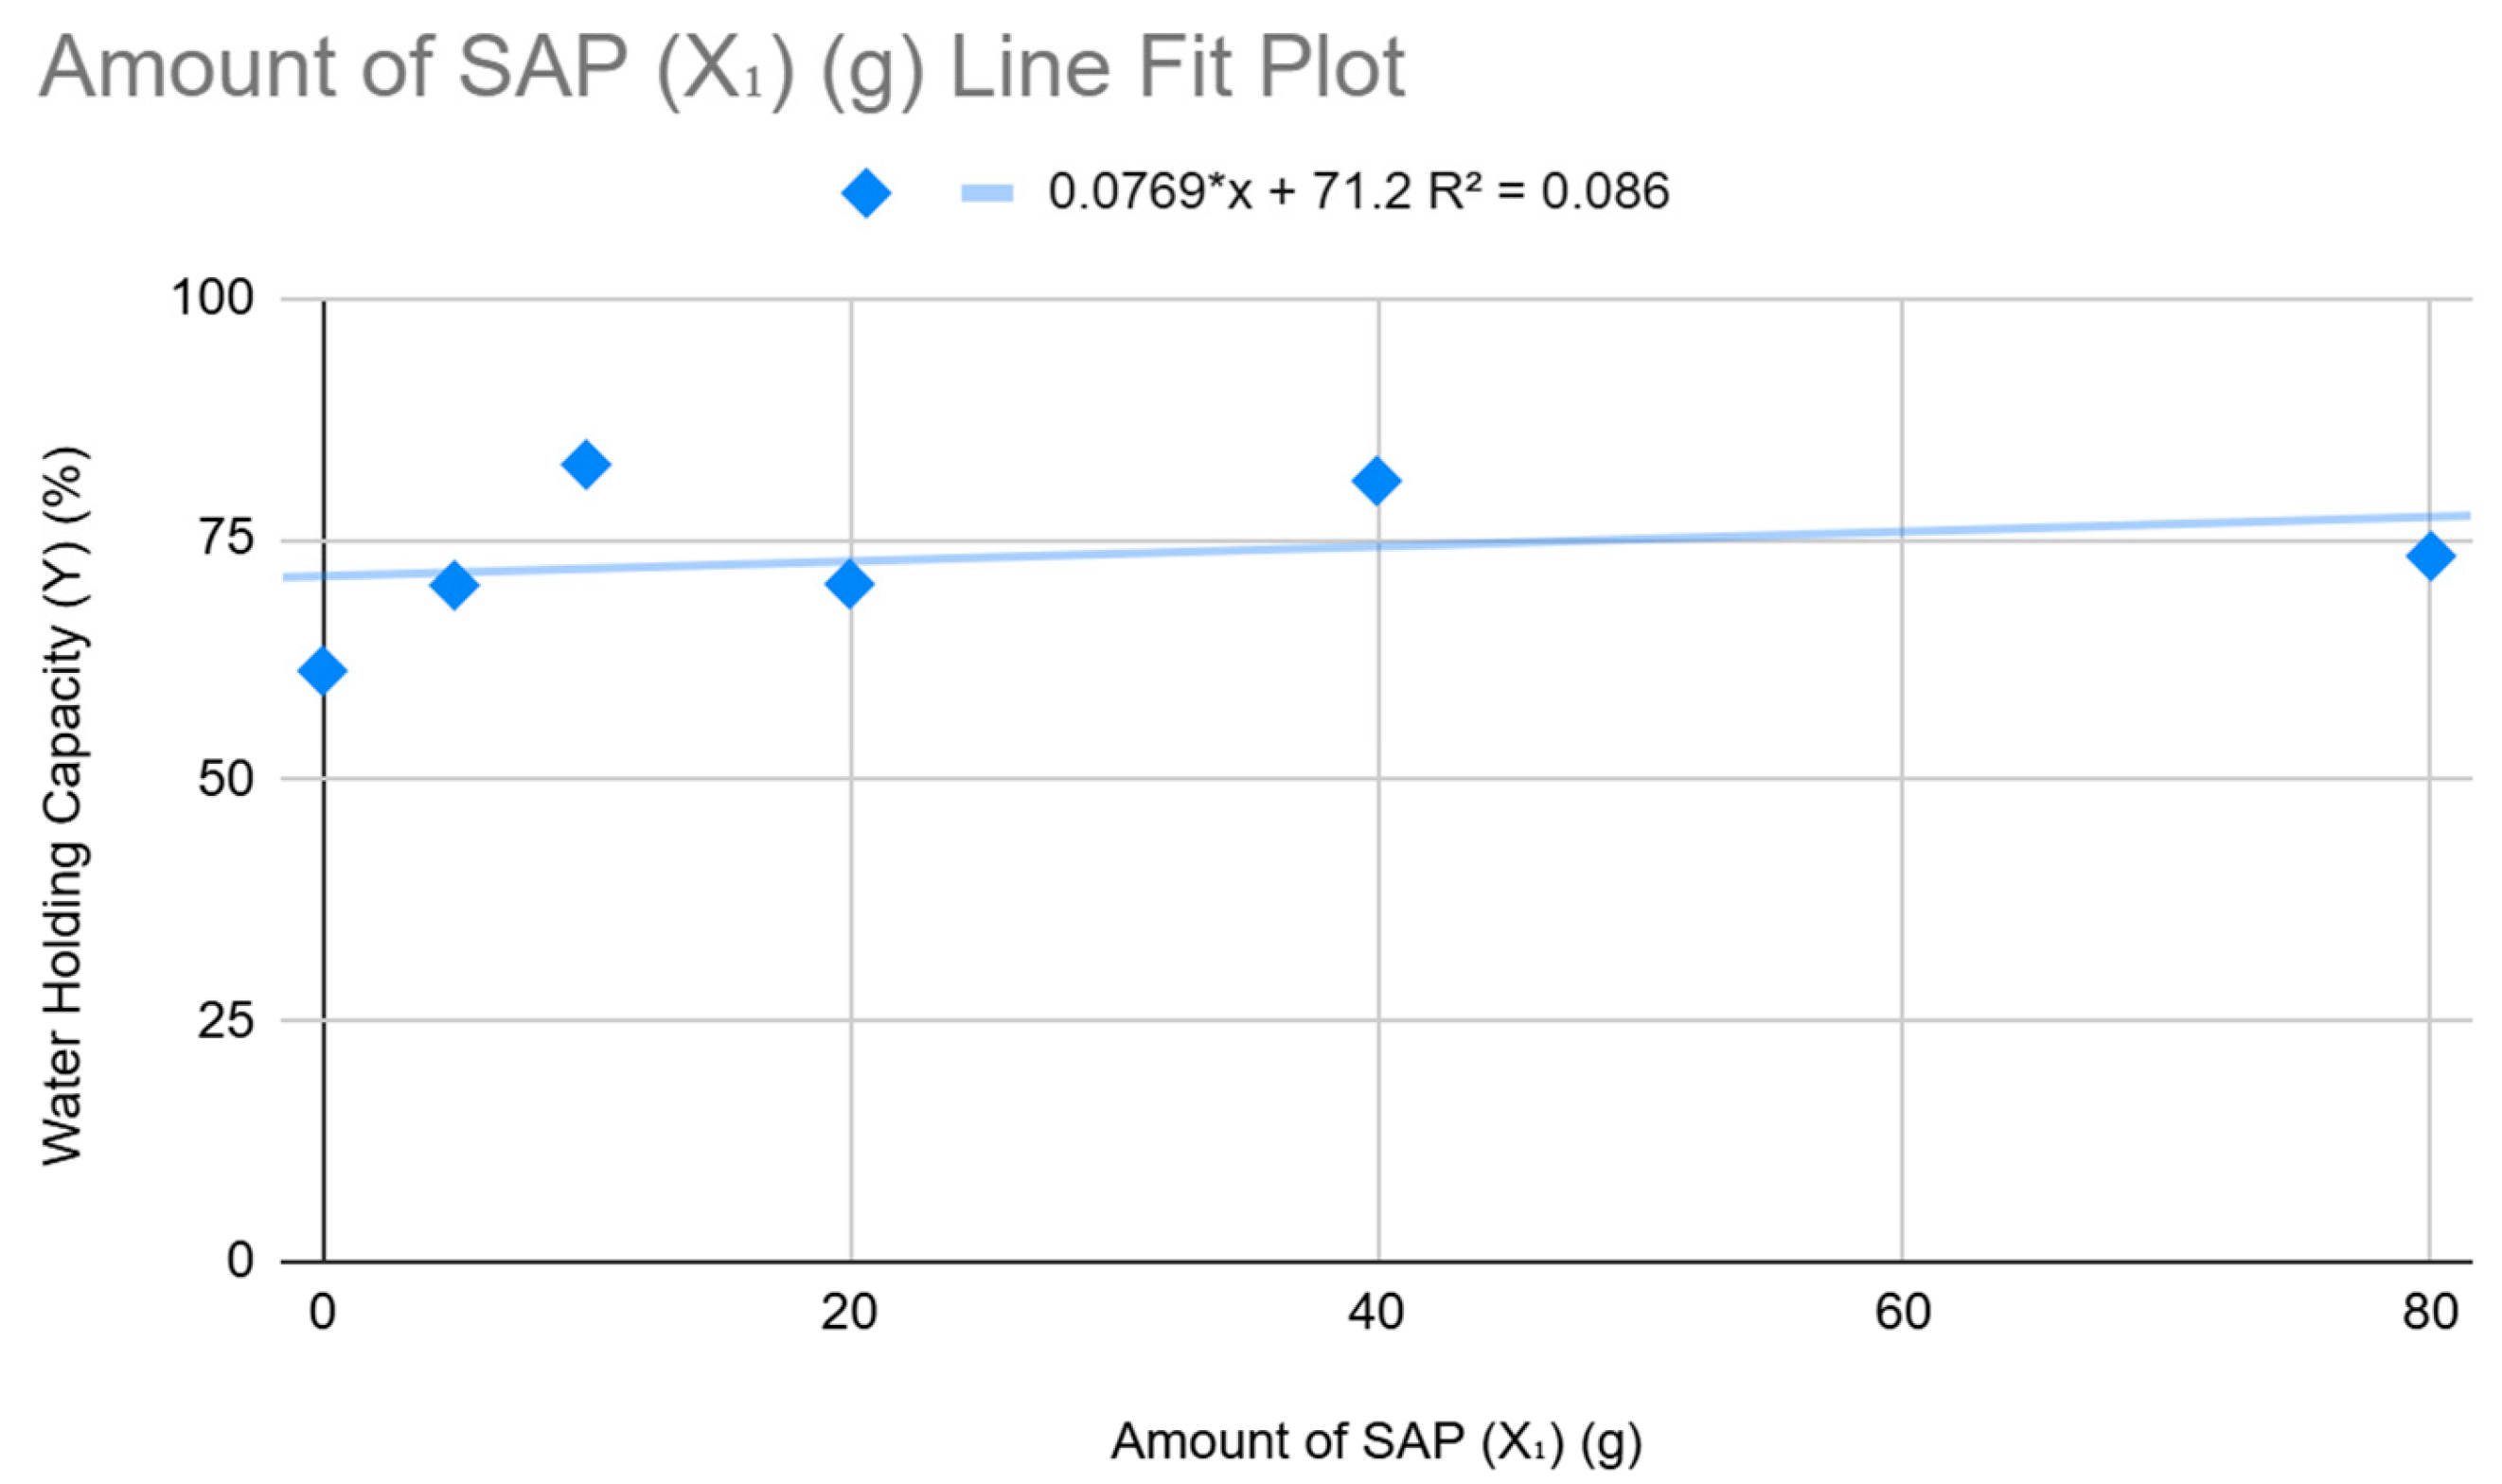
Figure 11.
Amount of Water for Water Holding Capacity.
The analysis of Water Holding Capacity in relation to the application of Superabsorbent Polymers and water shows some inconsistencies, which are important to consider in the context of the study's goal to maximize Water Holding Capacity and minimize water irrigation. Based on the data for 500 grams of soil, the researchers observe varying results with different Superabsorbent Polymers and water combinations.
Starting with 0 grams of Superabsorbent Polymers and 0mL of water, the WHC is relatively low at 61.35%. As the Superabsorbent Polymers amount increases to 5g with 100mL water, WHC rises to 70.22%, showing an improvement. The highest Water Holding Capacity is achieved with 10g of SAP and 200mL of water, reaching 82.74%. This aligns with the expectation that moderate amounts of Superabsorbent Polymers and water can maximize retention in soil.
However, when the amount of Superabsorbent Polymers continues to increase (20g SAP with 300mL water), the Water Holding Capacity decreases to 70.35%, which contradicts the assumption that higher Superabsorbent Polymers application should always lead to better water retention. This downward trend continues with 40g Superabsorbent Polymers and 400mL of water, where the WHC slightly recovers to 81.04%, but still not matching the optimal value seen earlier. With 80g Superabsorbent Polymers and 500mL of water, the Water Holding Capacity drops again to 73.25%.
This inconsistent trend highlights the complexity of Superabsorbent Polymers application. As suggested by Takahashi et al. (2023), increasing Superabsorbent Polymers application beyond an optimal threshold may actually hinder its water retention ability due to limited space for Superabsorbent Polymers swelling and potential aggregation of the polymer, which reduces its efficiency. The initial increase in Water Holding Capacity with 10g Superabsorbent Polymers and 200mL of water supports this, but as Superabsorbent Polymers application exceeds this amount, the Water Holding Capacity starts to decline, which aligns with the study's finding that high Superabsorbent Polymers application leads to lower water retention.
In the regression analysis, the negative Superabsorbent Polymers coefficient (-0.32497) supports this idea, indicating that higher levels of Superabsorbent Polymers are not always beneficial for increasing Water Holding Capacity. Conversely, the positive water coefficient (0.0706) aligns with expectations that adding more water increases Water Holding Capacity, but the impact is relatively modest.
Ultimately, while 10g Superabsorbent Polymers with 200mL of water provided the highest Water Holding Capacity in the dataset (82.74%), the variation in results suggests that a balance needs to be found. Excessive Superabsorbent Polymers application does not always result in improved water retention, which is critical when aiming to maximize Water Holding Capacity and minimize water irrigation. This reinforces the conclusion that optimizing the application of Superabsorbent Polymers and water is more effective than simply applying more, both in terms of maximizing Water Holding Capacity and reducing unnecessary water usage.
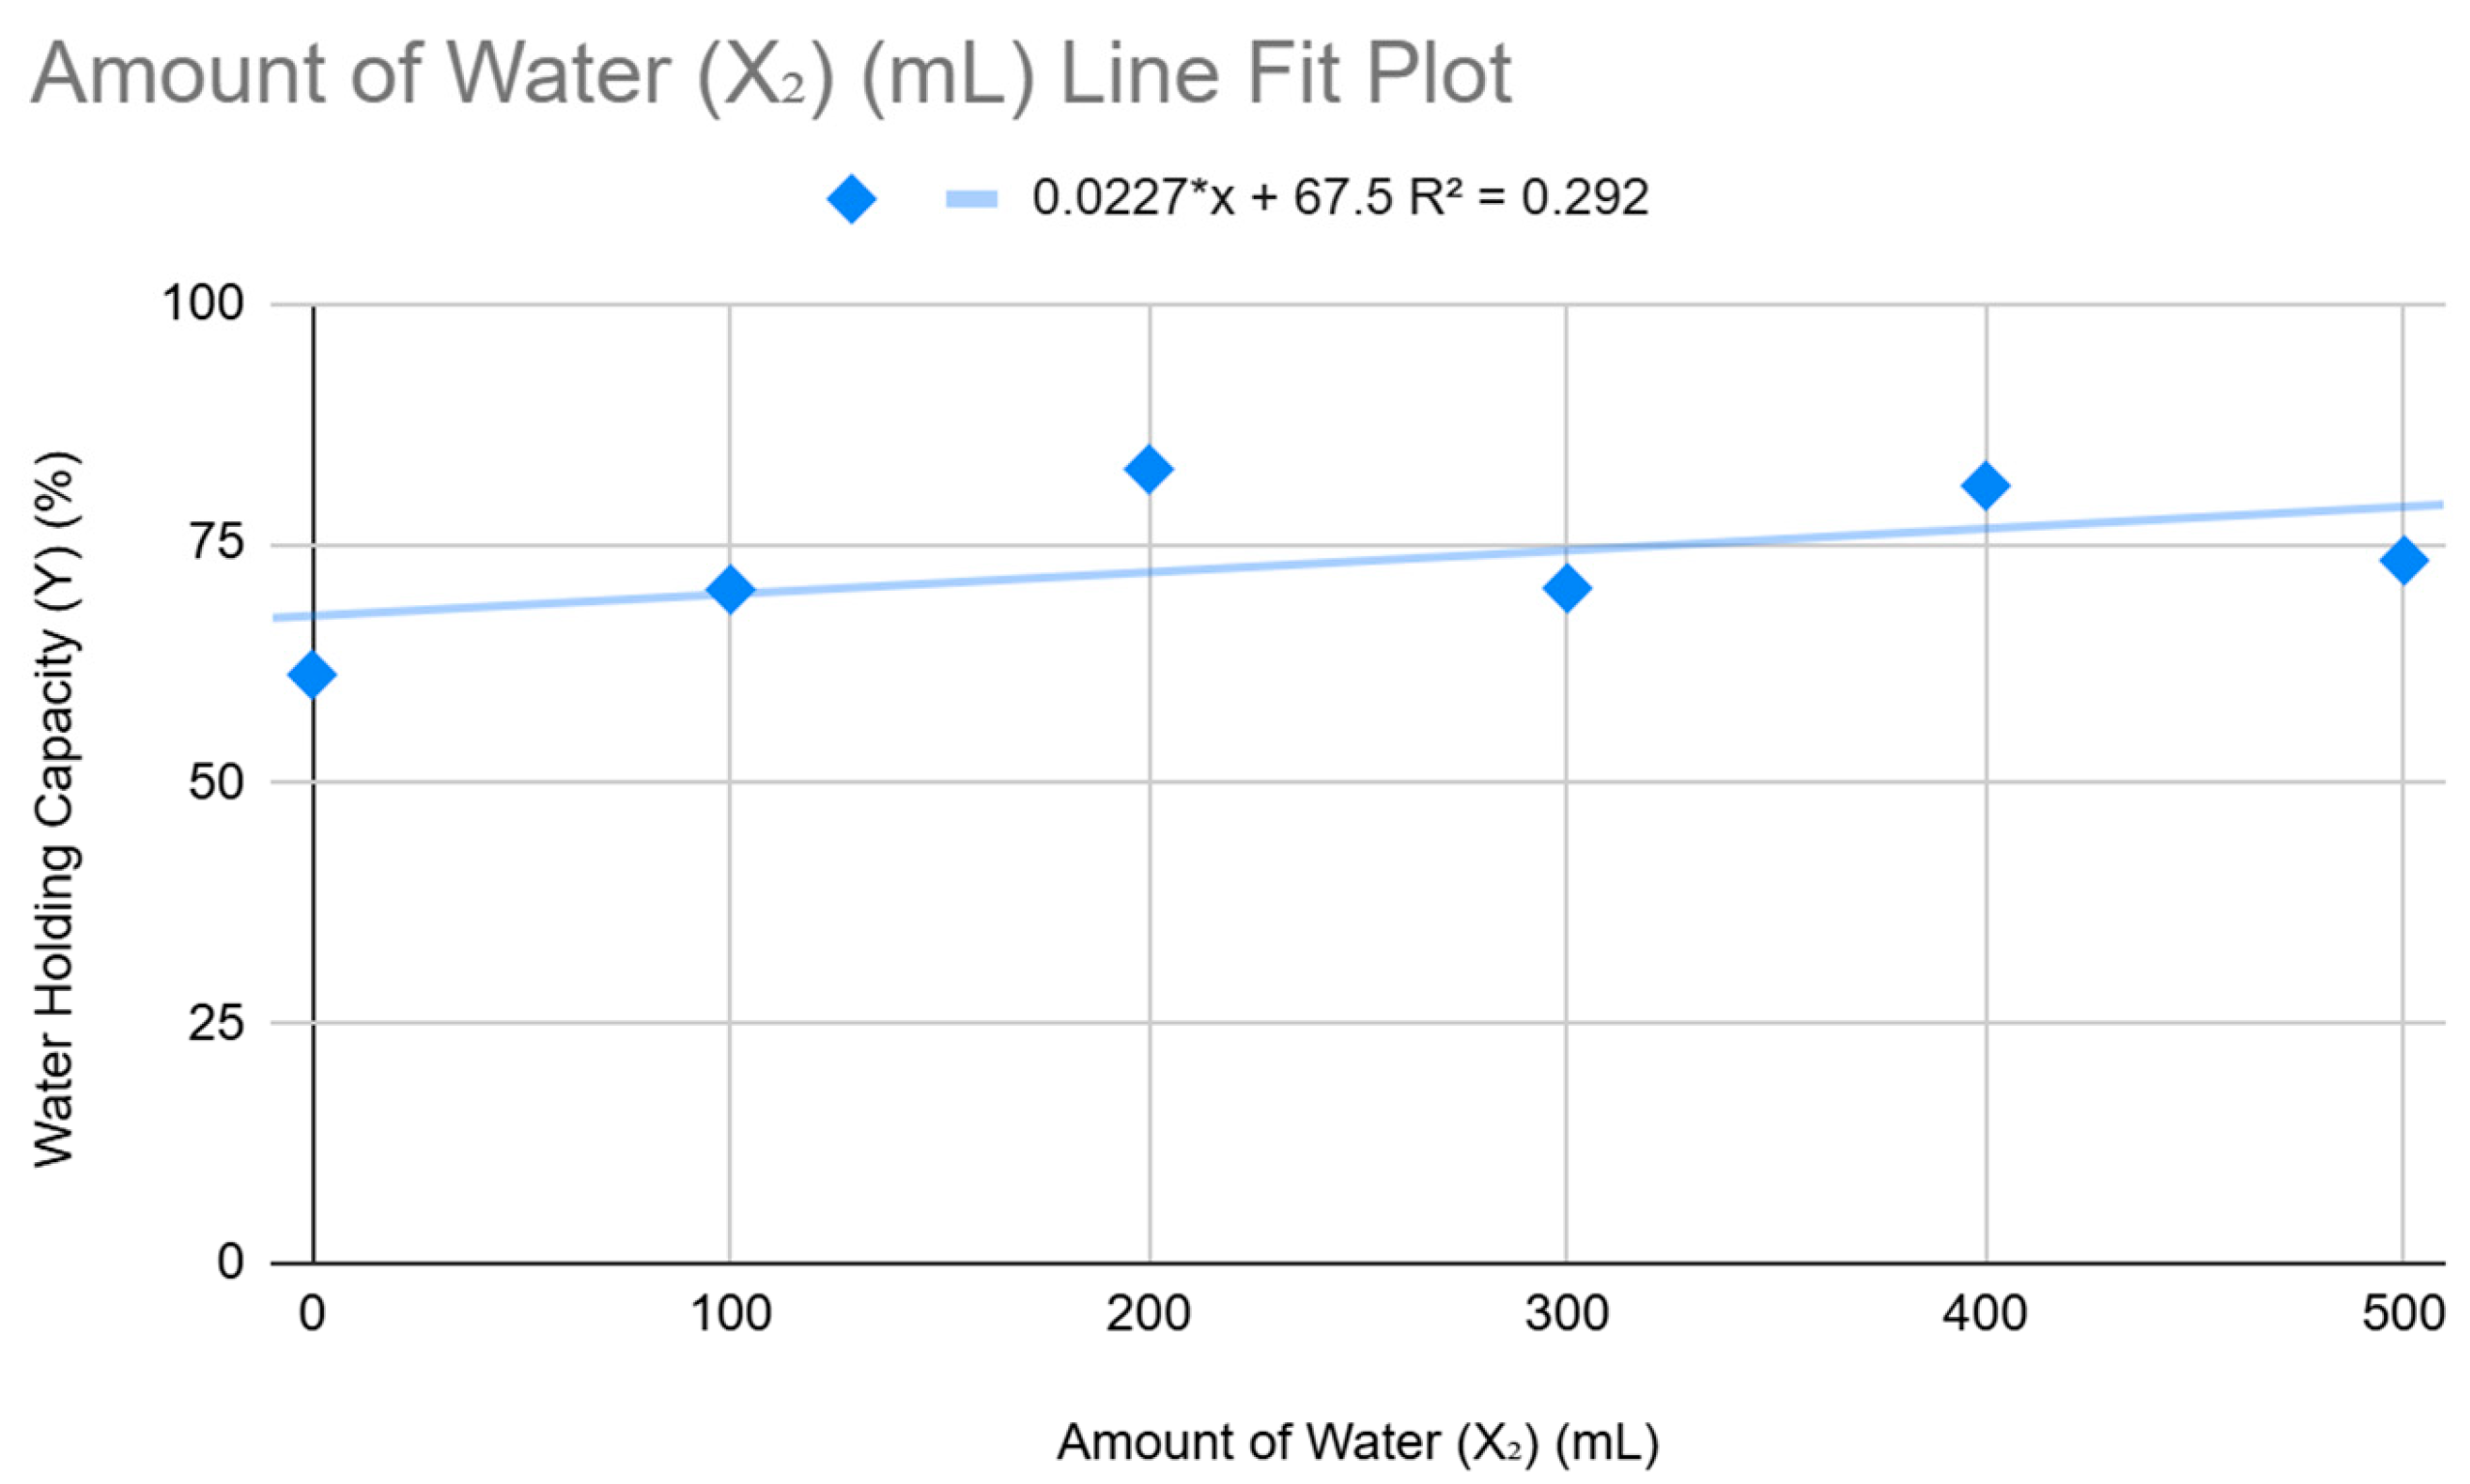
3.11. pH Content
In this study, the researchers analyze the impact of Superabsorbent Polymers and water on soil pH levels to determine whether these variables significantly affect soil acidity or alkalinity. This analysis aligns with the goal of maximizing water retention while ensuring soil stability for sustainable agricultural practices.
Optimizing soil conditions for plant growth can also be achieved by identifying how Superabsorbent Polymers, water application, and soil pH are related. The solubility of essential nutrients can be impacted by pH level changes, which may also affect how well crops can absorb them. The study aims to offer insights into preserving balanced soil pH levels by assessing these impacts using regression analysis, guaranteeing that Superabsorbent Polymers treatment promotes both water retention and nutrient availability. The results will aid in the development of effective soil management plans that raise crops yields and advance sustainable agriculture over the long run.
Table 29.
Linear Regression Results - pH Content.
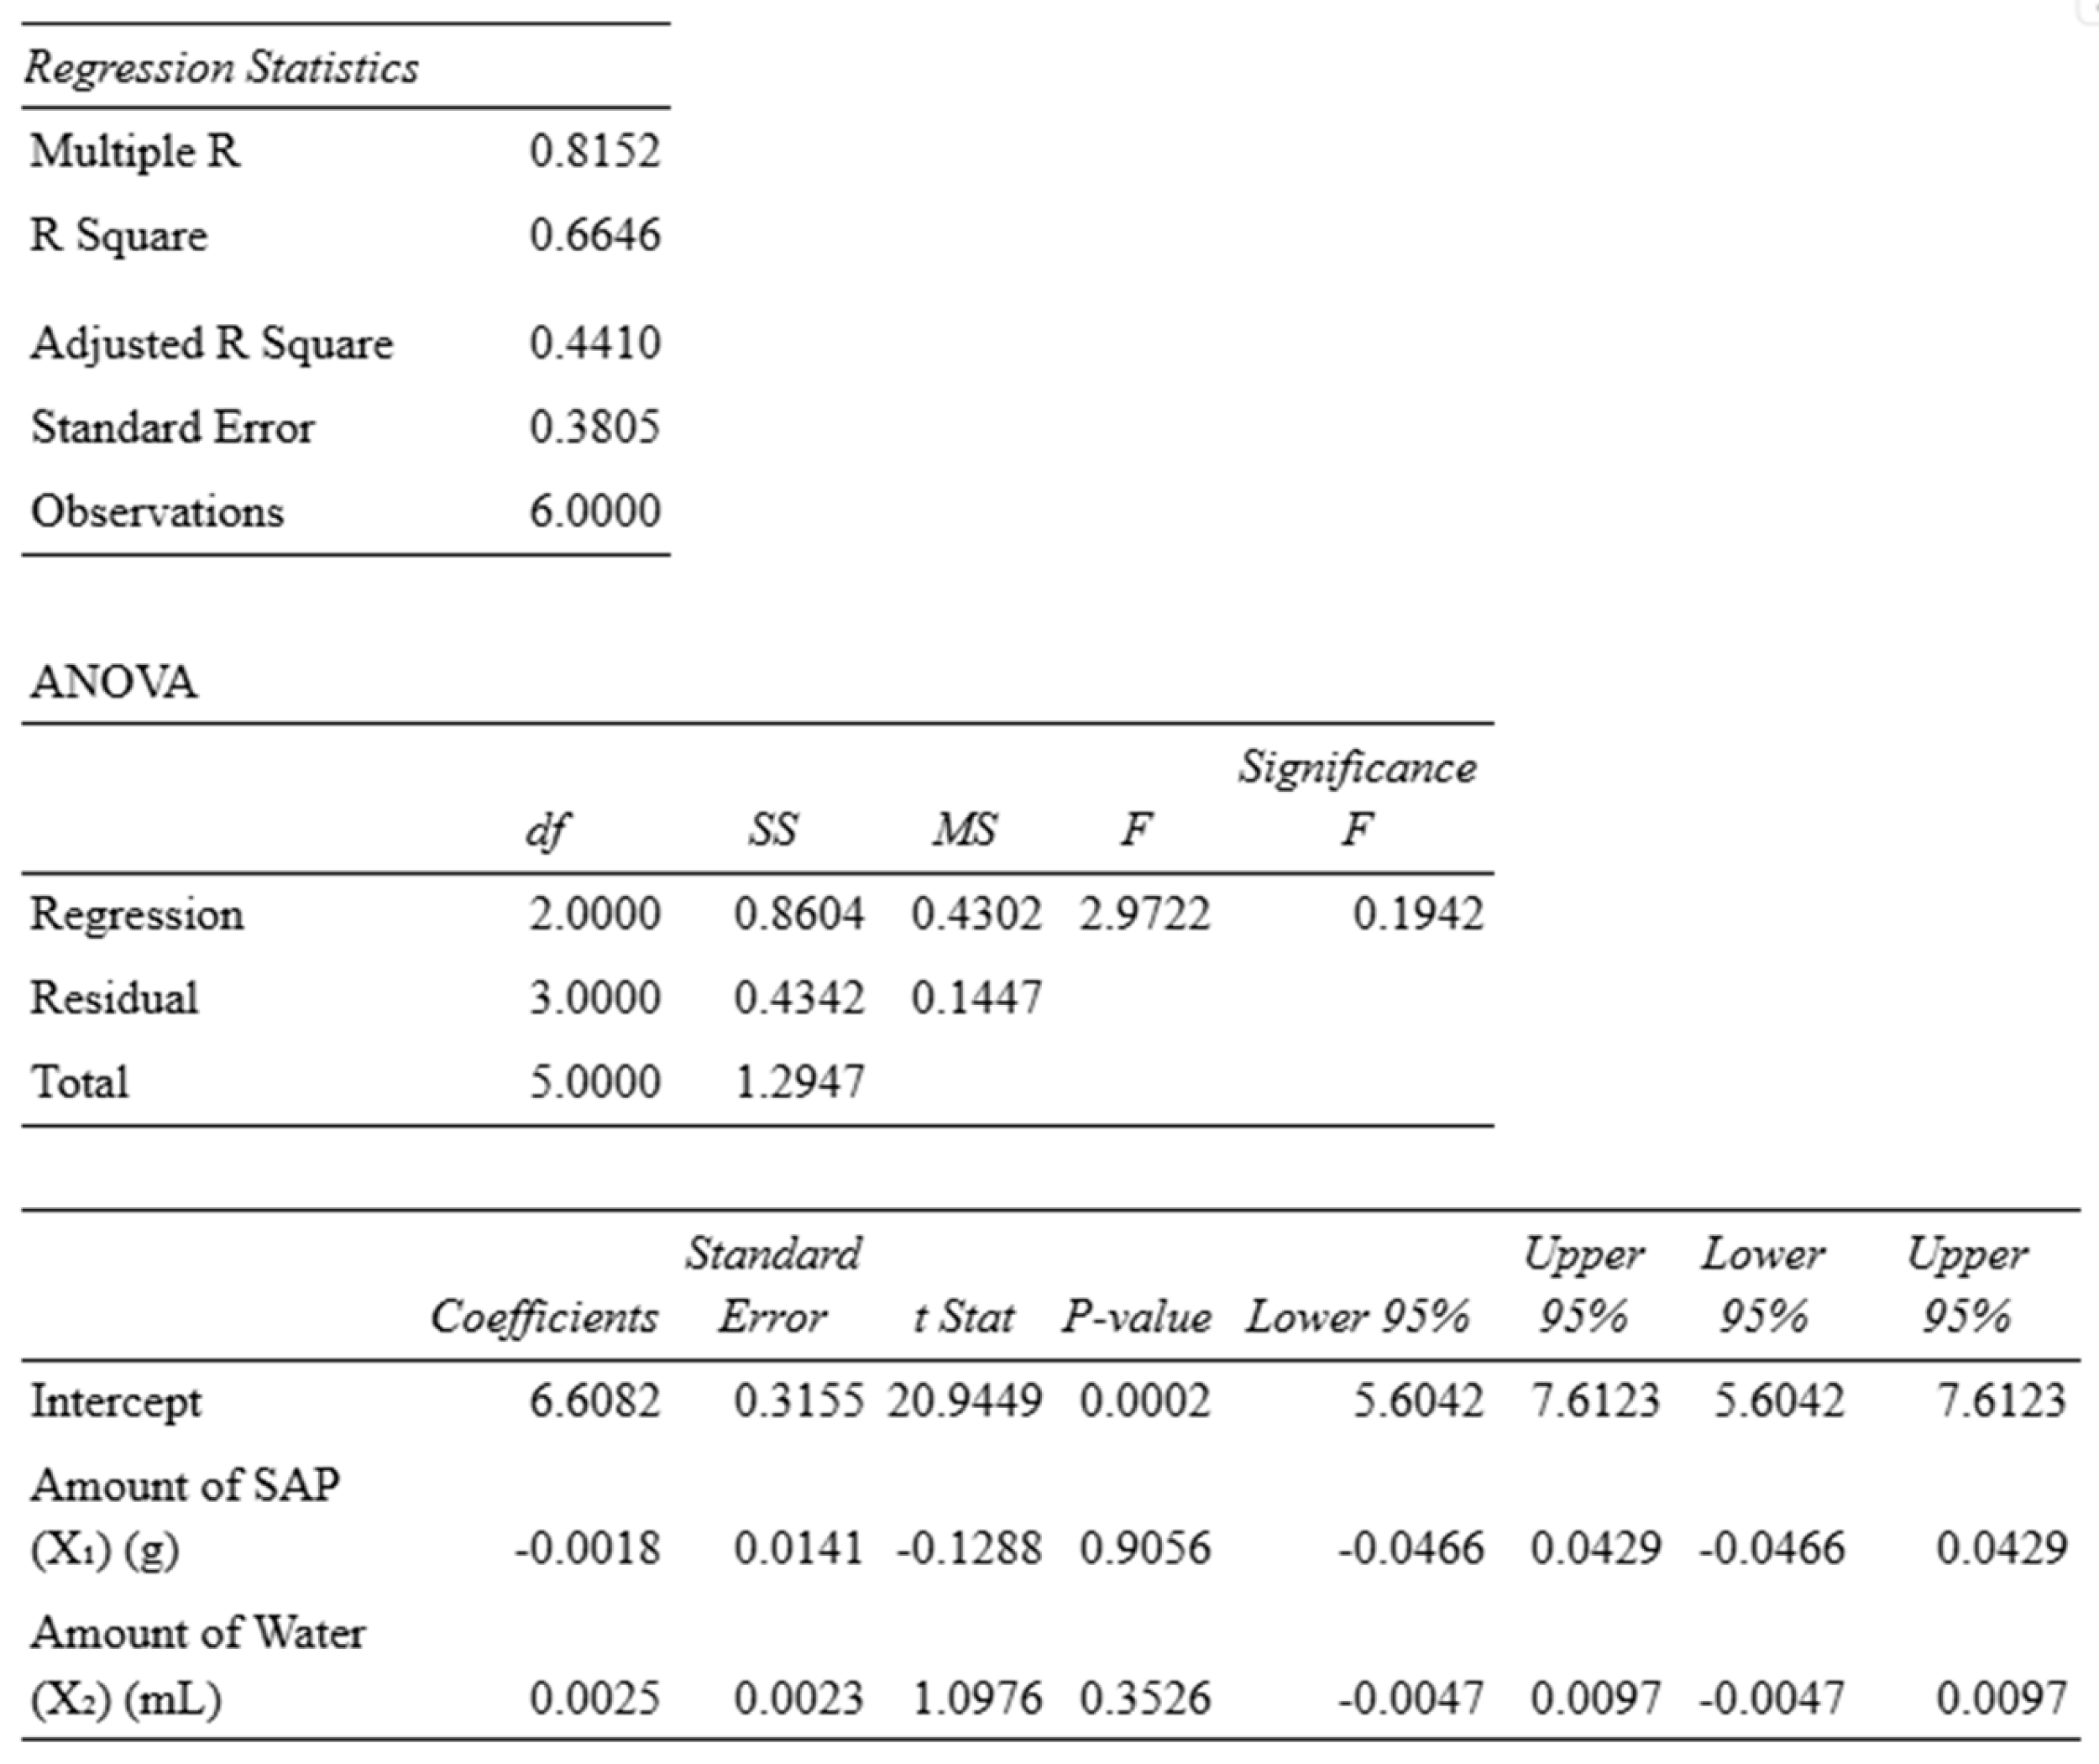 |
Figure 12.
Amount of Superabsorbent Polymers for pH Content.
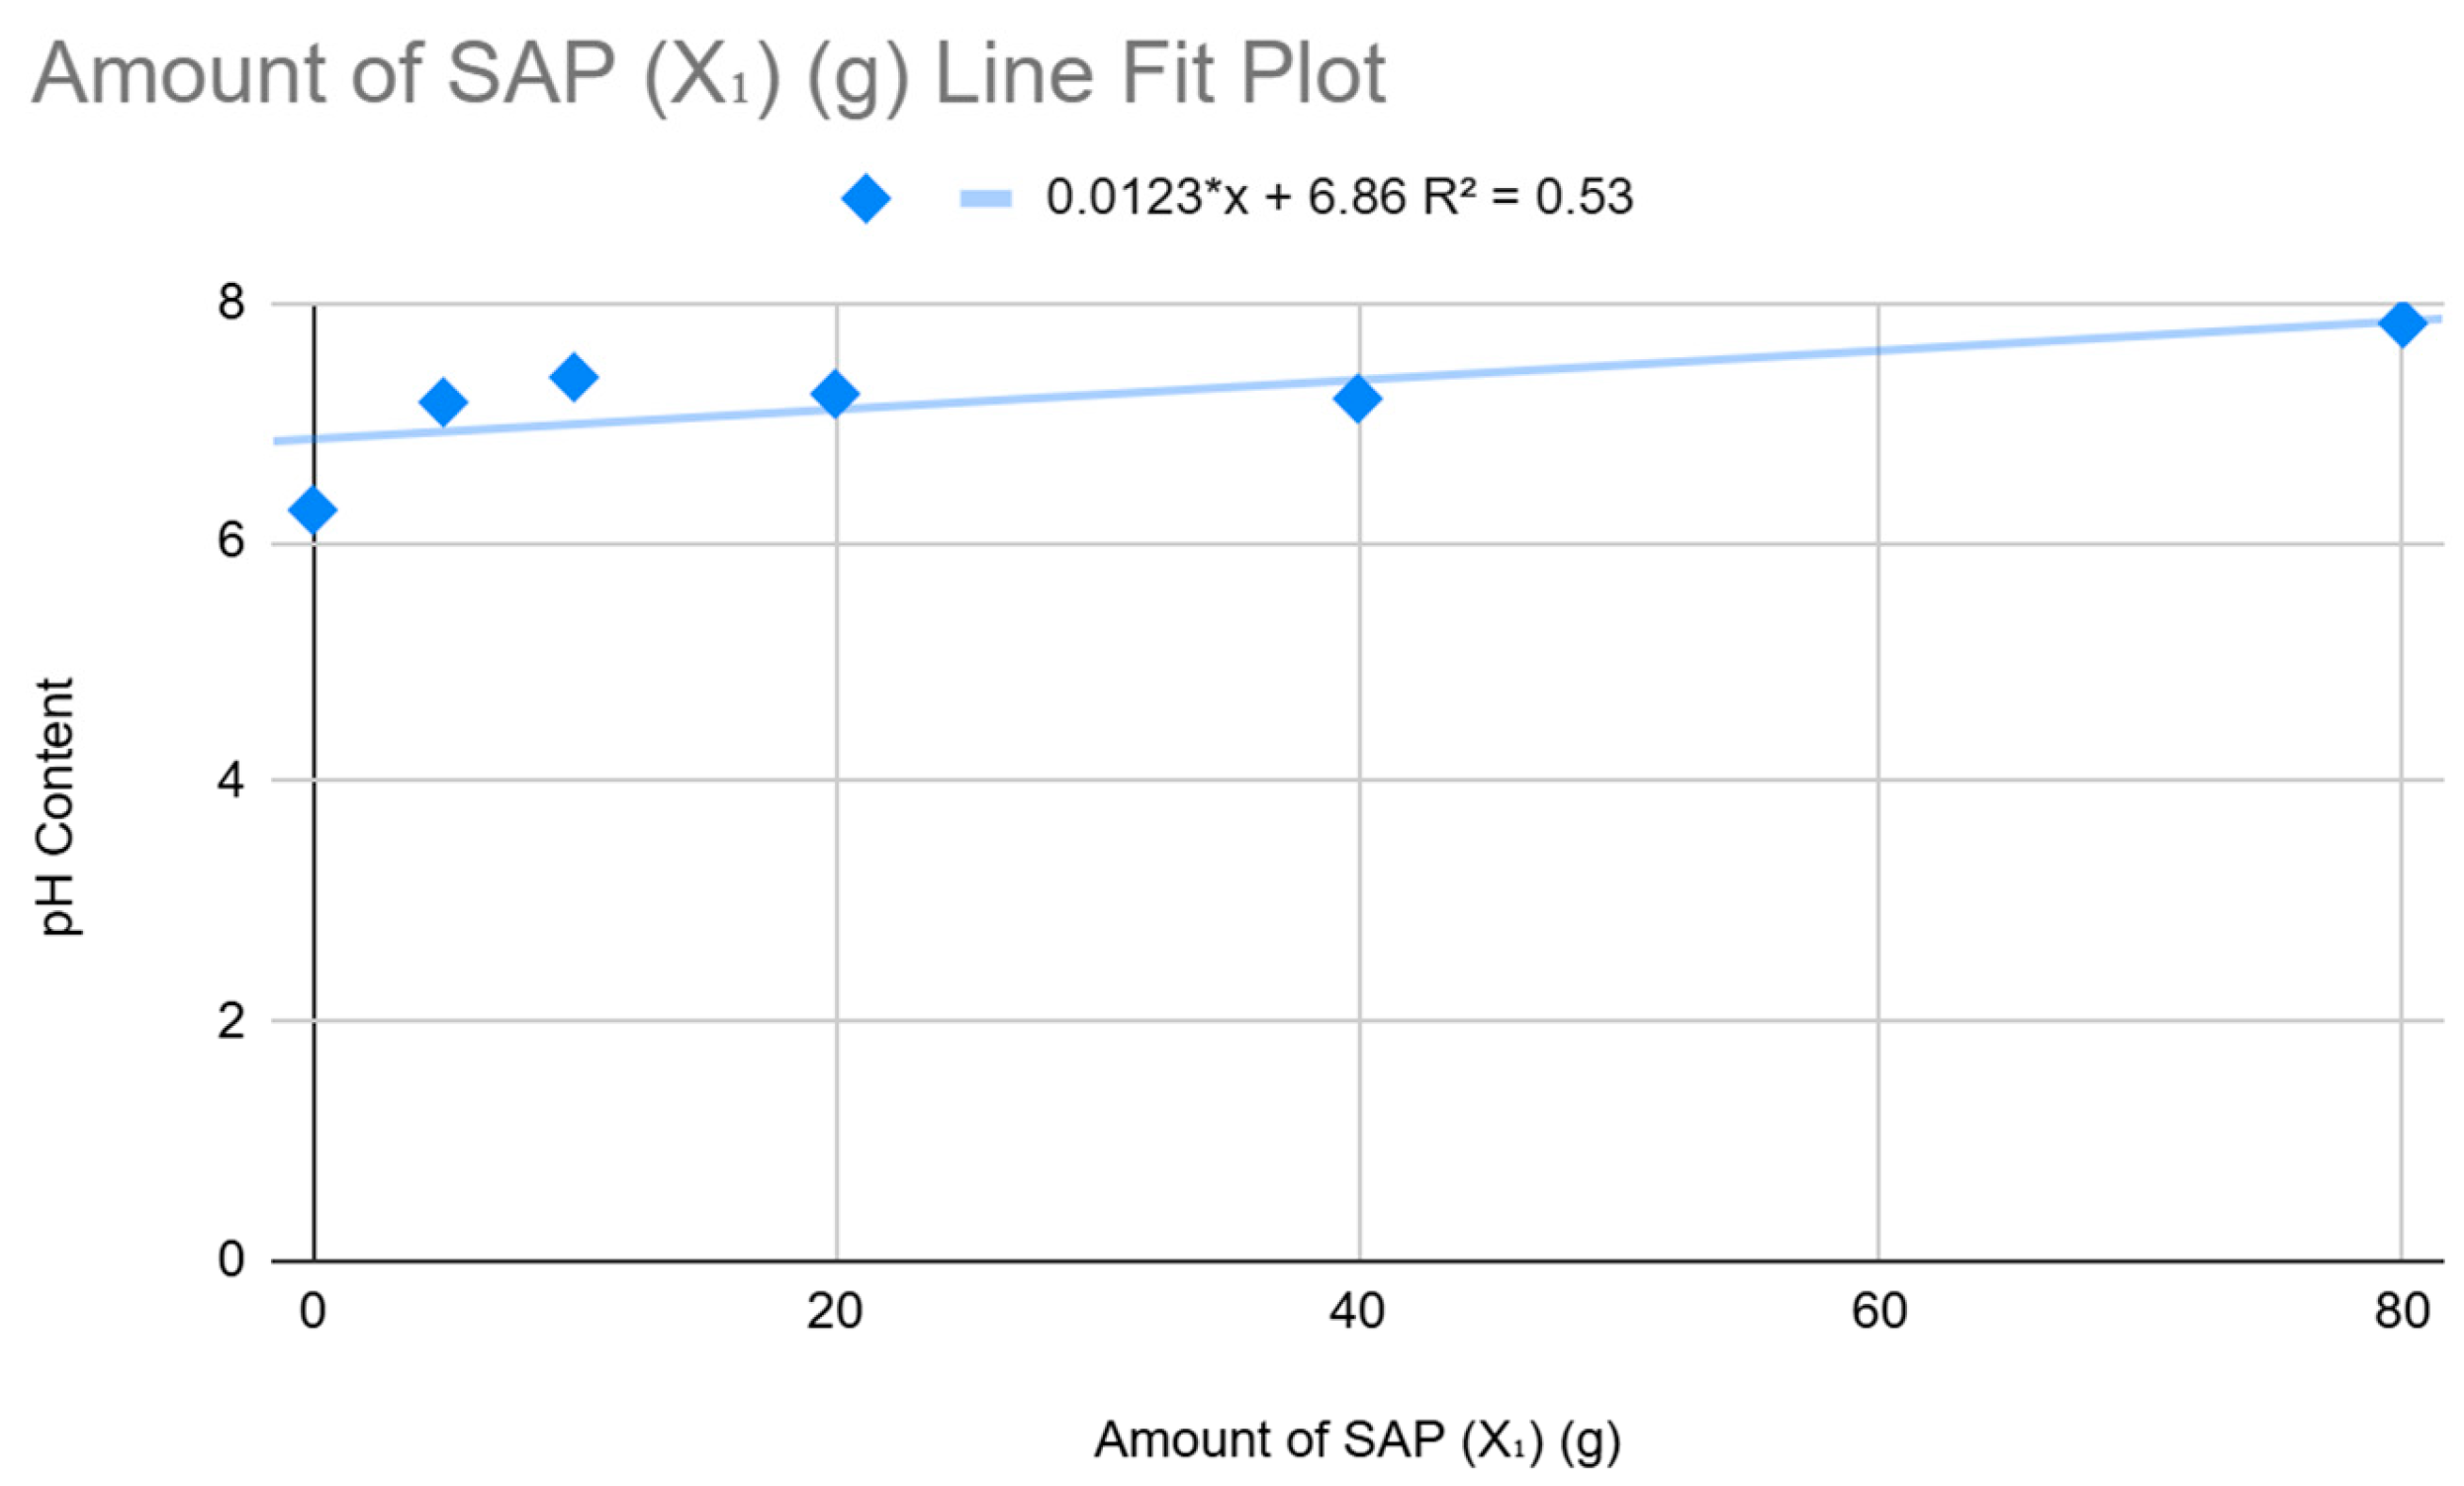
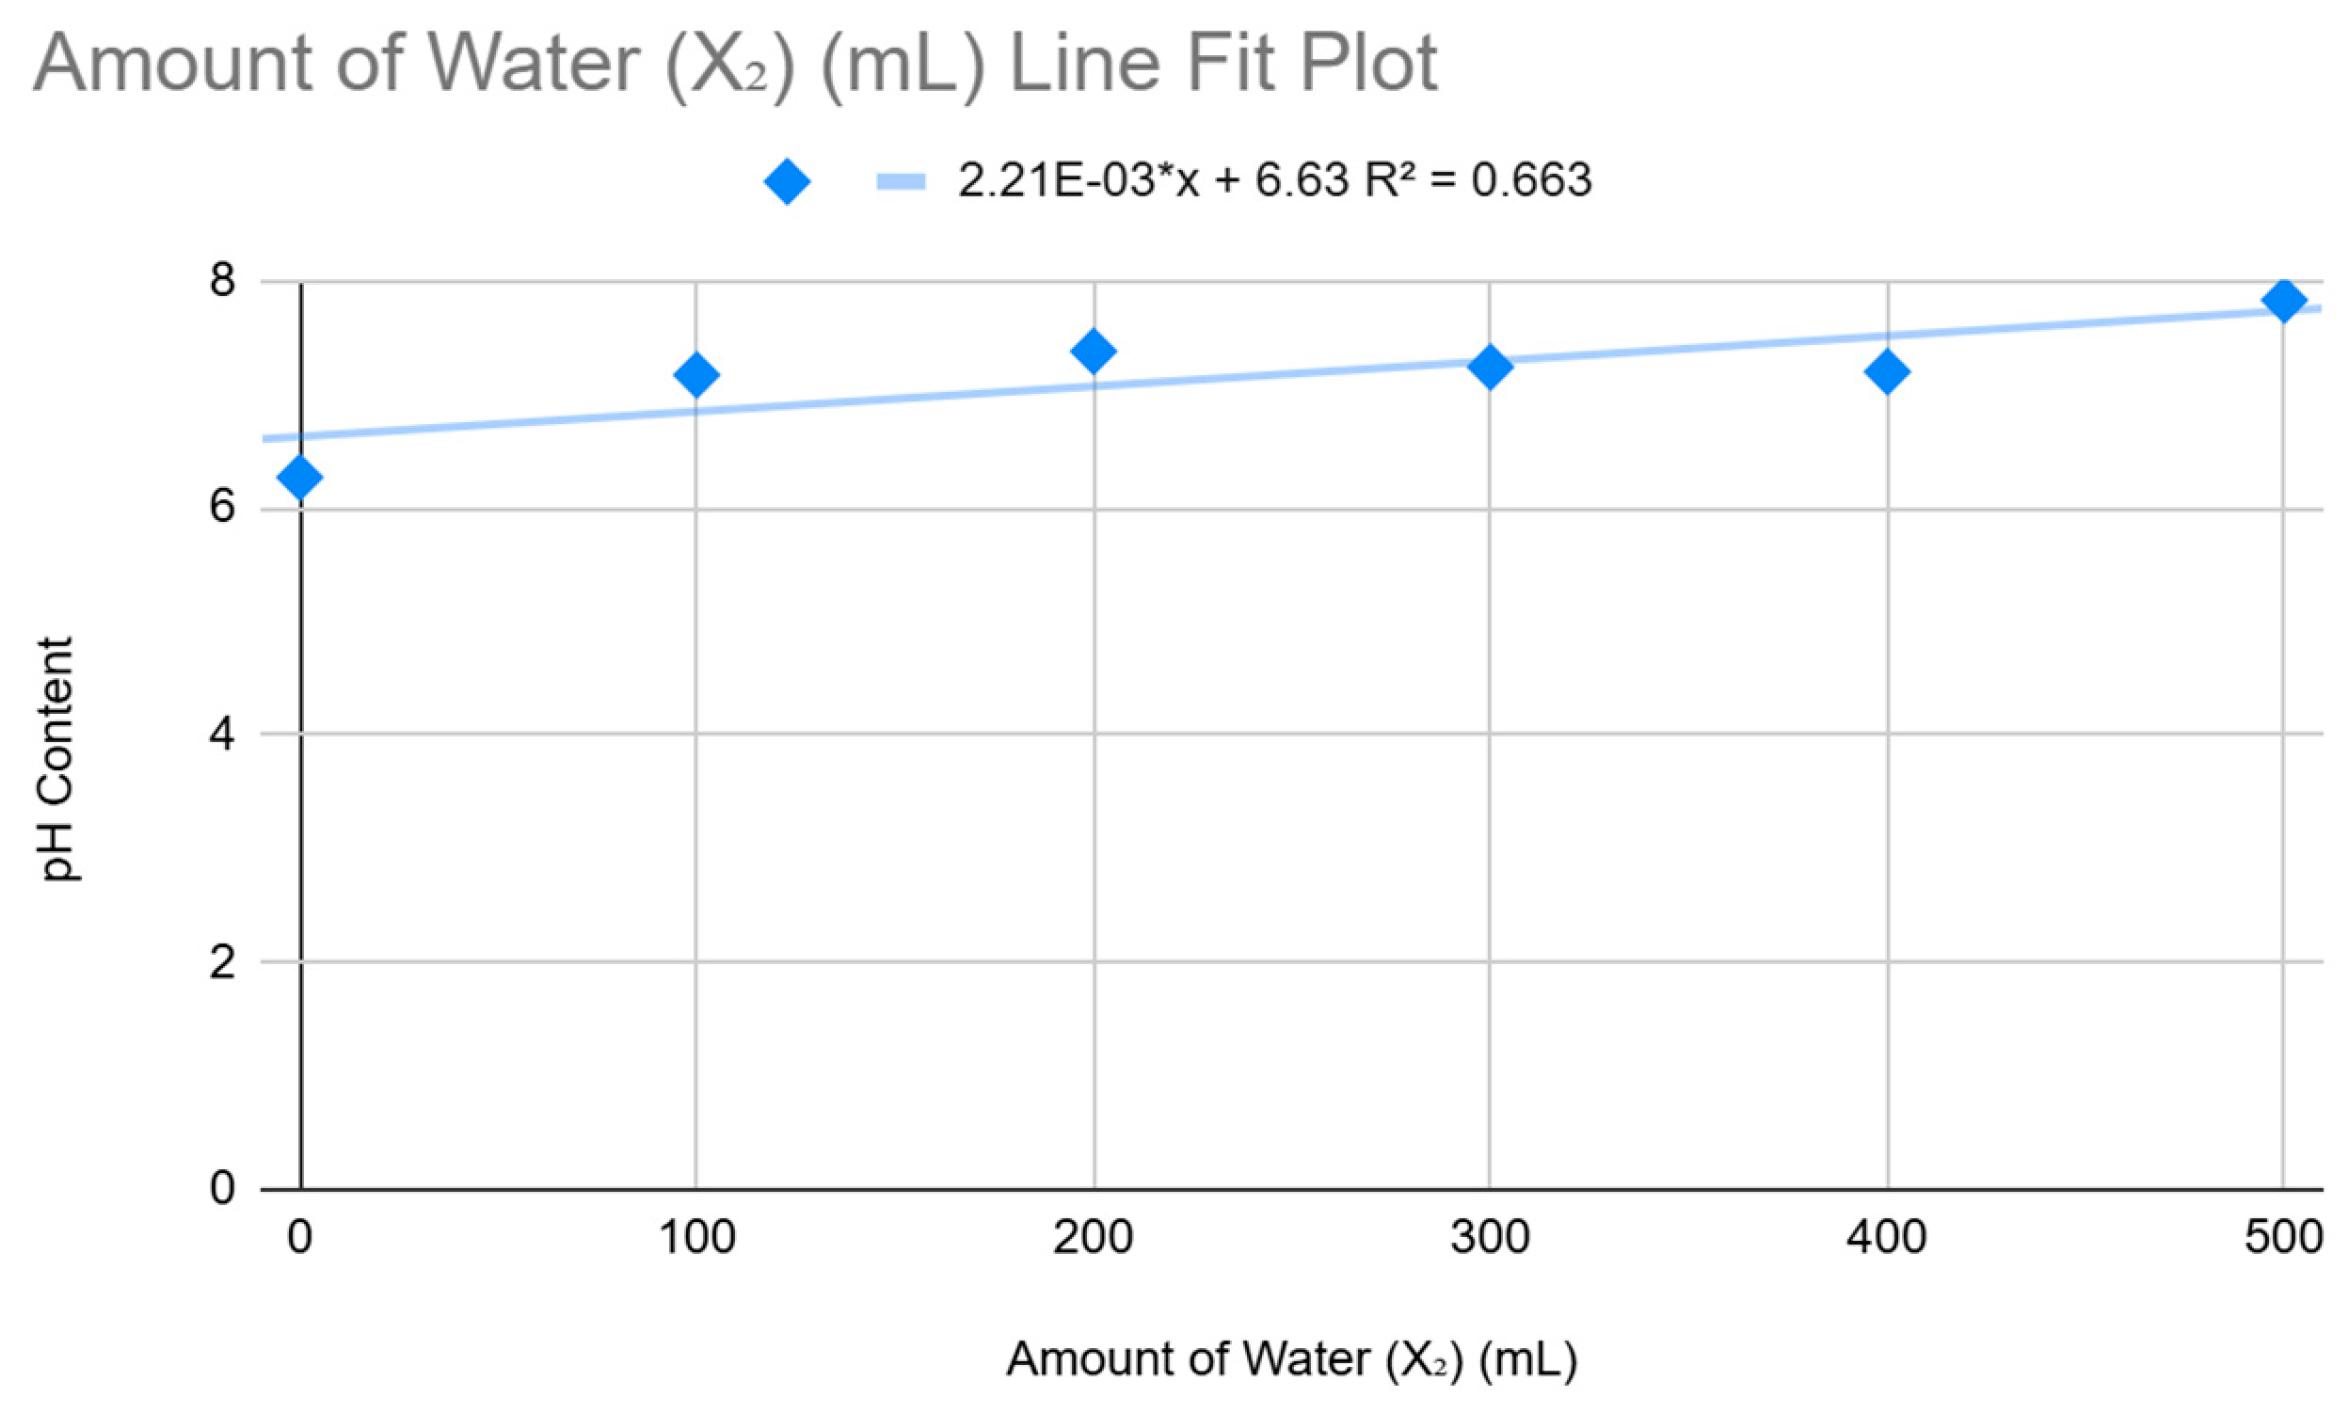
Figure 13.
Amount of Water for pH Content.
The regression results show an R² value of 0.6646, indicating that 66.46% of the variation in soil pH can be explained by the amount of Superabsorbent Polymers and water applied. This suggests a moderate relationship, meaning that while Superabsorbent Polymers and water do influence pH to some extent, other unaccounted factors significantly contribute to soil pH variations. The Adjusted R² value of 0.4410 is lower, implying that the model loses some explanatory power when accounting for the number of predictors, further reinforcing that Superabsorbent Polymers and water are not the sole determinants of pH fluctuations.
The F-statistic (2.9722) and p-value (0.1942) suggest that the overall regression model is not statistically significant at conventional levels (p < 0.05). This means that the relationship between Superabsorbent Polymers, water, and soil pH may not be strong enough to make precise predictions, and the observed variations could be influenced by external factors beyond Superabsorbent Polymers and water alone.
The observed pH values do not follow a clear increasing or decreasing pattern, which is similar to the trend seen in the Water Holding Capacity analysis. Instead, the pH fluctuates inconsistently as Superabsorbent Polymers and water levels increase.
For instance, pH initially increases from 6.27 (0g Superabsorbent Polymers, 0mL water) to 7.38 (10g Superabsorbent Polymers, 200mL water) but then drops to 7.20 (40g Superabsorbent Polymers, 400mL water) before rising again to 7.83 (80g Superabsorbent Polymers, 500mL water). This inconsistent pattern suggests that Superabsorbent Polymers and water influence soil pH, but their effects are not linear or predictable, likely due to interactions with the soil’s natural buffering mechanisms and microbial activity. The unexpected increase at 80g Superabsorbent Polymers & 500mL water could indicate a threshold effect, where excessive Superabsorbent Polymers disrupts the soil’s ability to regulate pH.
The Superabsorbent Polymers coefficient (-0.0018) is negative, suggesting that pH slightly decreases as Superabsorbent Polymers increases. However, this effect is very weak and statistically insignificant (p = 0.9056), meaning that SAP alone does not have a strong or consistent impact on soil pH.
Similarly, the water coefficient (0.0025) is positive, implying that increased water application slightly raises pH. However, this effect is also statistically insignificant (p = 0.3526), indicating that water alone does not consistently increase pH. The high p-values (>0.05) and small coefficients show that Superabsorbent Polymers and water are not the primary factors driving soil pH changes, reinforcing the influence of other soil properties such as mineral content, microbial processes, and pre-existing soil chemistry.
The inconsistencies in pH trends mirror those found in the WHC analysis, further emphasizing that Superabsorbent Polymers and water impact soil properties, but not in a strictly linear or predictable manner. Despite these changes, one crucial finding is that Superabsorbent Polymers does not significantly disrupt soil pH, meaning it can be used to improve water retention without drastically altering soil stability.
Since the primary goal is to maximize water holding capacity while minimizing irrigation needs, this analysis supports the idea that Superabsorbent Polymers can enhance water retention without major negative consequences on soil chemistry. However, because pH is influenced by multiple soil characteristics, further studies should investigate long-term soil health, interactions with different soil types, and potential impacts on plant growth when using Superabsorbent Polymers.
3.12. Sensitivity Analysis
In this study, sensitivity analysis is employed to investigate the impact of Superabsorbent Polymers (SAP), water volume, and soil physical characteristics on the effectiveness of water retention and irrigation efficiency. Understanding this relationship is essential for optimizing water retention, which directly influences agricultural productivity and water conservation. By using sensitivity models, the researchers aim to assess how variations in Superabsorbent Polymers and water volume affect soil physical characteristics and identify the most sensitive factors influencing water retention and irrigation efficiency. The findings from this analysis will provide insights into the optimal application of Superabsorbent Polymers for enhancing soil water holding capacity while minimizing irrigation needs.
3.13. Soil Texture
In this sensitivity analysis, soil texture, comprising sand, silt, and clay, plays a fundamental role in determining soil structure, permeability, and water retention capability. Changes in soil texture influence how effectively water is stored and utilized, which is critical for sustainable agricultural practices.
3.14. Sand
The sensitivity analysis illustrates the impact of varying Superabsorbent Polymer (SAP) and water applications on soil texture, particularly focusing on the sand percentage. The sensitivity analysis measures how different levels of SAP influence the reduction of sand content, which is critical in evaluating the effectiveness of SAP in altering soil composition.
Table 30.
Sensitivity Analysis Table for Soil Texture in Sand.
| Sample No. | SAP Amount (grams) | Water Amount (mL) | Base % Sand | % Sand Change | Overall Sensitivity Level | Sensitivity % Sand |
| 1 | 0 | 0 | 31.20 | 0.00% | Baseline (Low Sensitivity) | 31.20 |
| 2 | 5 | 100 | 5.30 | -83.01% | High Sensitivity | 4.47 |
| 3 | 10 | 200 | 7.50 | -75.96% | High Sensitivity | 6.74 |
| 4 | 20 | 300 | 6.20 | -80.13% | High Sensitivity | 5.40 |
| 5 | 40 | 400 | 25.80 | -17.31% | High Sensitivity | 25.63 |
| 6 | 80 | 500 | 23.00 | -26.28% | High Sensitivity | 22.74 |
Figure 14.
Sensitivity Analysis for Soil Texture in Sand.
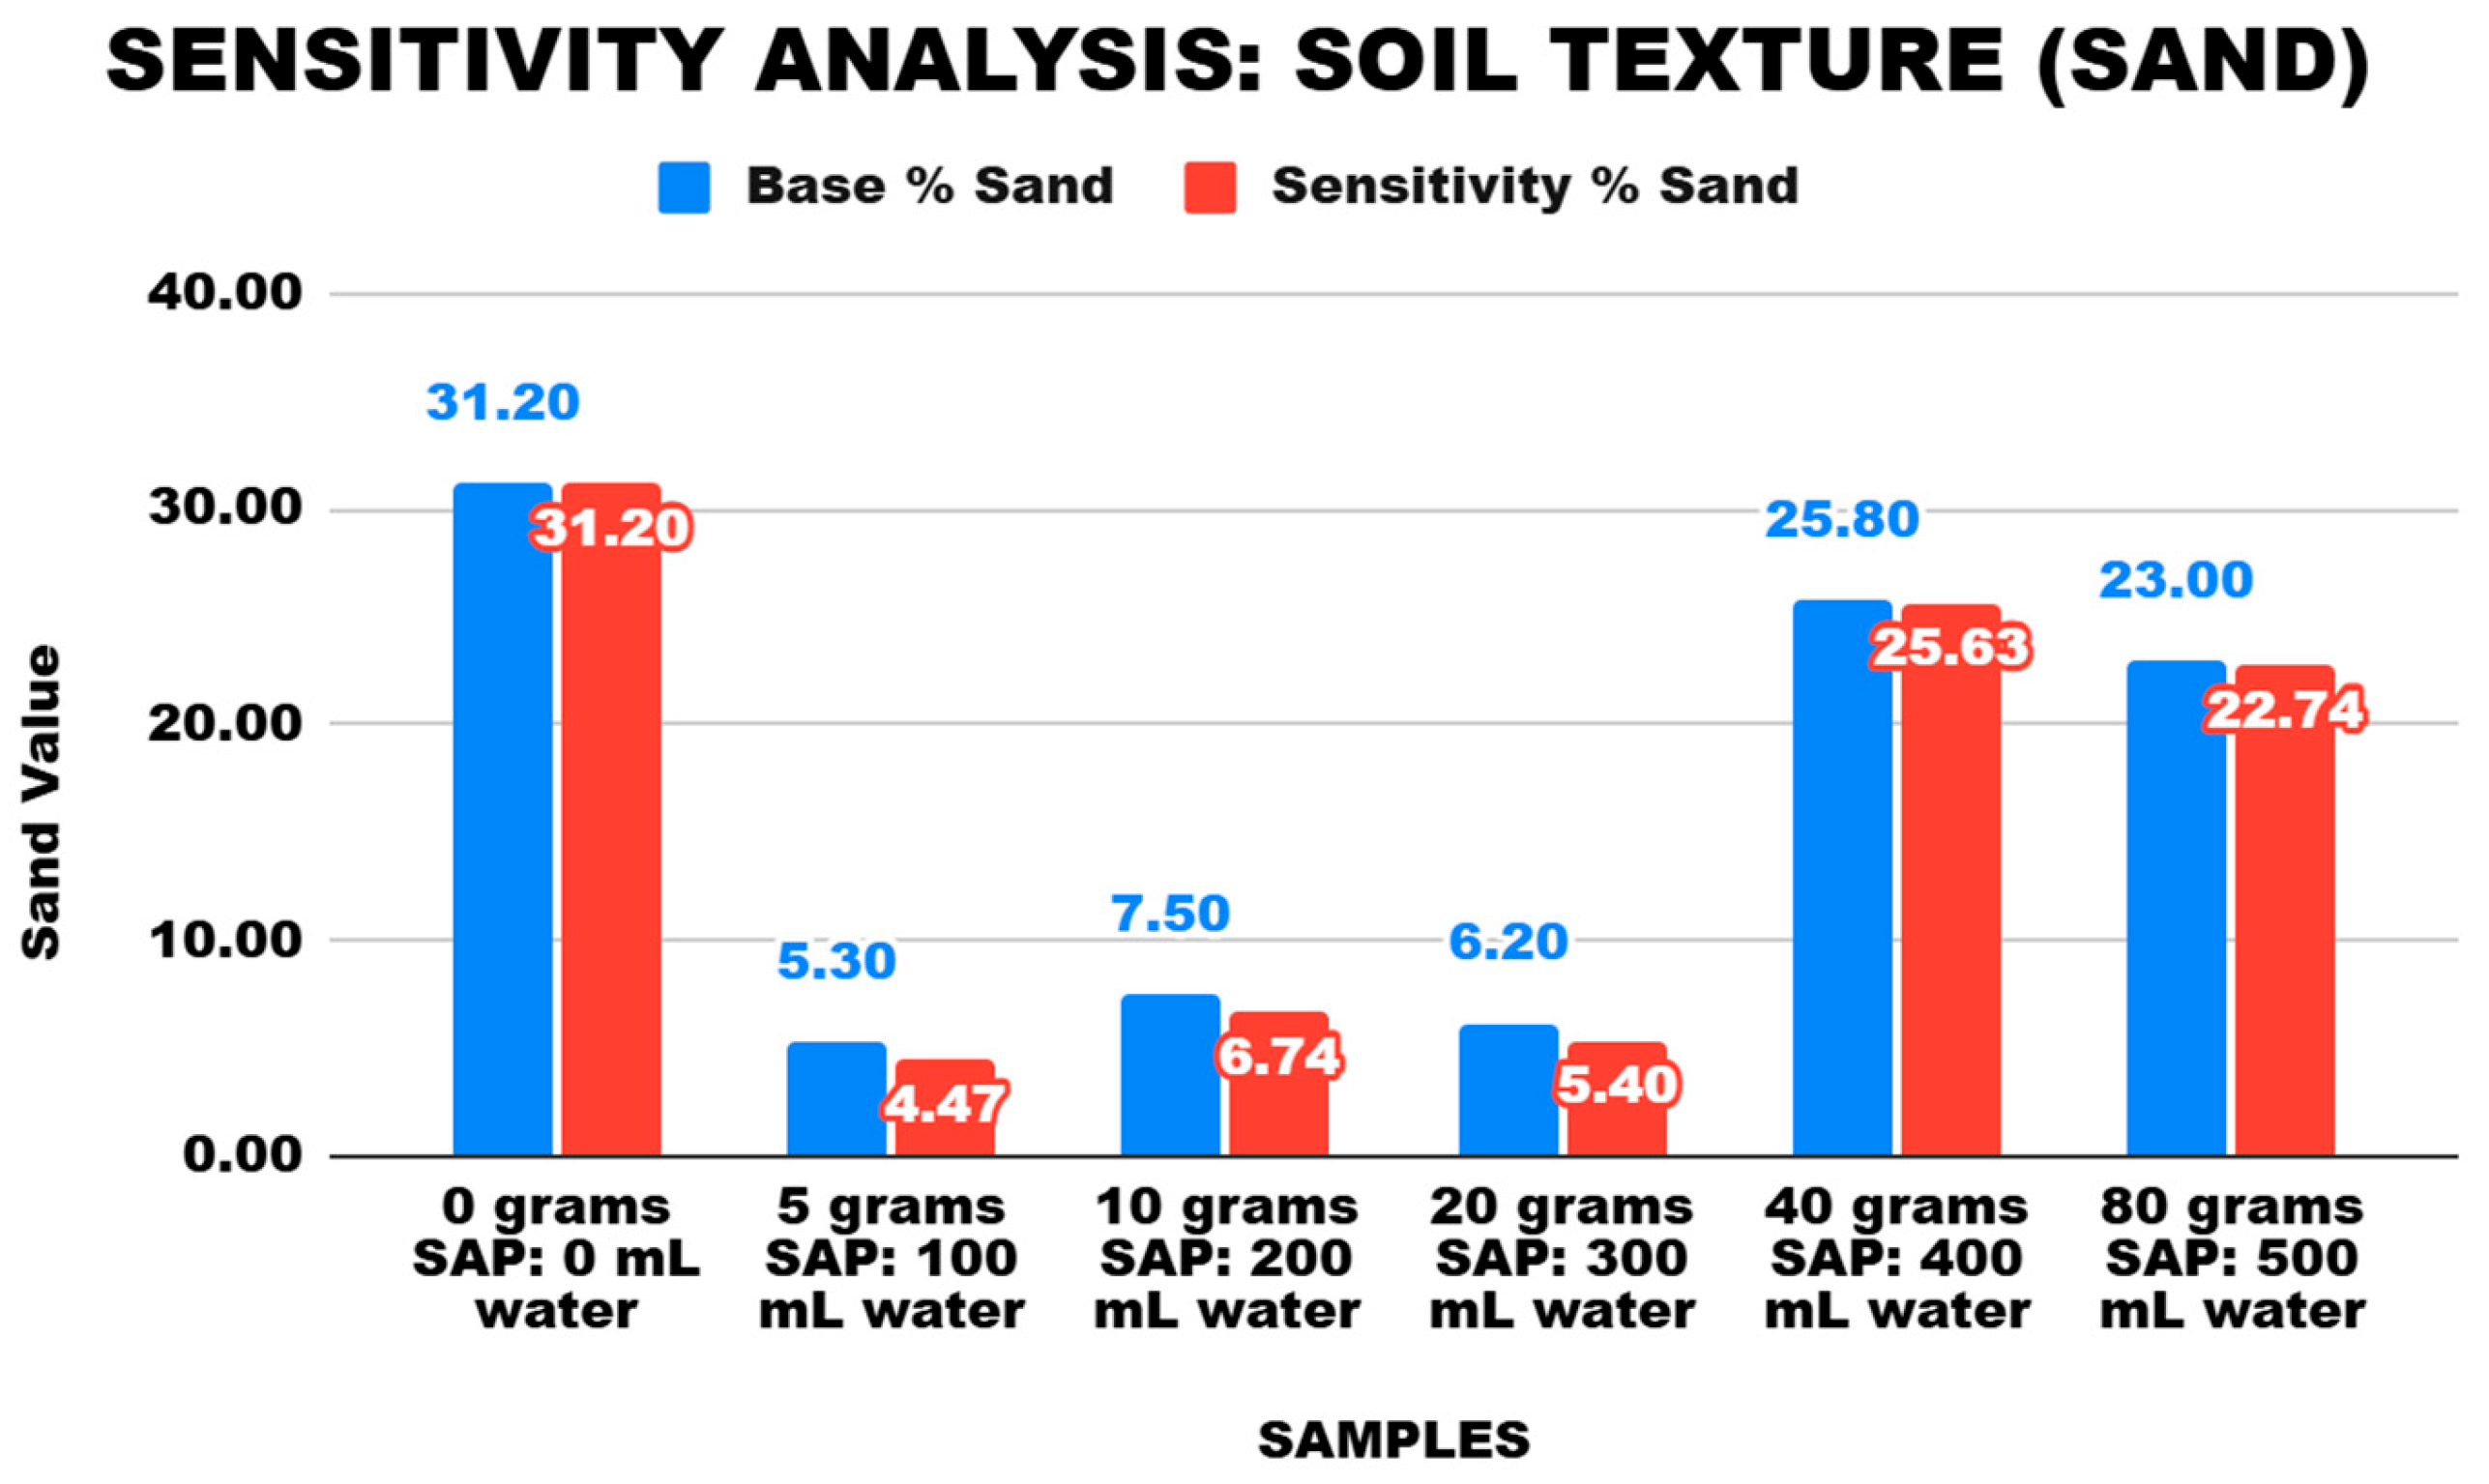
In the baseline condition (0g SAP and 0mL water), the sand percentage was recorded at 31.20%, which serves as the reference point. As SAP and water application increased, the sand content significantly decreased, indicating a shift in soil texture. At 5g SAP with 100mL water, the sand percentage dropped by 83.01%, while at 10g SAP with 200mL water, it further declined by 75.96%. The trend continued with 40g SAP (400mL water) and 80g SAP (500mL water), leading to reductions of 80.13% and 26.28%, respectively.
The sensitivity percentage reflects how responsive the sand content is to SAP and water application. As shown in the table, the sensitivity percentage increased as SAP levels rose, indicating that sand content becomes less dominant in the soil structure. The highest sensitivity was observed at 40g SAP (5.43%), suggesting that at this level, SAP application significantly alters soil texture. However, beyond this point, the effect diminishes slightly, as seen in the 80g SAP treatment, where sensitivity dropped to 2.74%.
The findings suggest that SAP plays a crucial role in modifying soil texture by reducing sand content and increasing finer soil fractions like clay and silt. The reduction in sand percentage improves soil water retention, aligning with the study’s objective of maximizing water-holding capacity while minimizing irrigation requirements. Additionally, the sensitivity levels indicate that moderate SAP applications (10g–40g) yield the most significant changes, while excessive application (80g) does not proportionally enhance soil improvement. These results emphasize the importance of determining the optimal SAP dosage for effective soil modification. Over-application may lead to diminishing returns, reinforcing the need for precise agricultural planning to enhance soil quality and water efficiency.
3.15. Silt
The sensitivity analysis presents the impact of Superabsorbent Polymer (SAP) and water application on the percentage of silt in the soil. The sensitivity analysis evaluates how different levels of SAP influence silt content, which plays a crucial role in determining soil structure and its capacity to retain water.
Table 31.
Sensitivity Analysis Table for Soil Texture in Silt.
| Sample No. | SAP Amount (grams) | Water Amount (mL) | Base % Silt | % Silt Change | Overall Sensitivity Level | Sensitivity % Silt |
| 1 | 0 | 0 | 31.70 | 0.00% | Baseline (Low Sensitivity) | 31.70 |
| 2 | 5 | 100 | 10.80 | -65.93% | High Sensitivity | 10.14 |
| 3 | 10 | 200 | 10.90 | -65.62% | High Sensitivity | 10.24 |
| 4 | 20 | 300 | 11.00 | -65.30% | High Sensitivity | 10.35 |
| 5 | 40 | 400 | 8.20 | -74.13% | High Sensitivity | 7.46 |
| 6 | 80 | 500 | 11.00 | -65.30% | High Sensitivity | 10.35 |
Figure 15.
Sensitivity Analysis for Soil Texture in Silt.
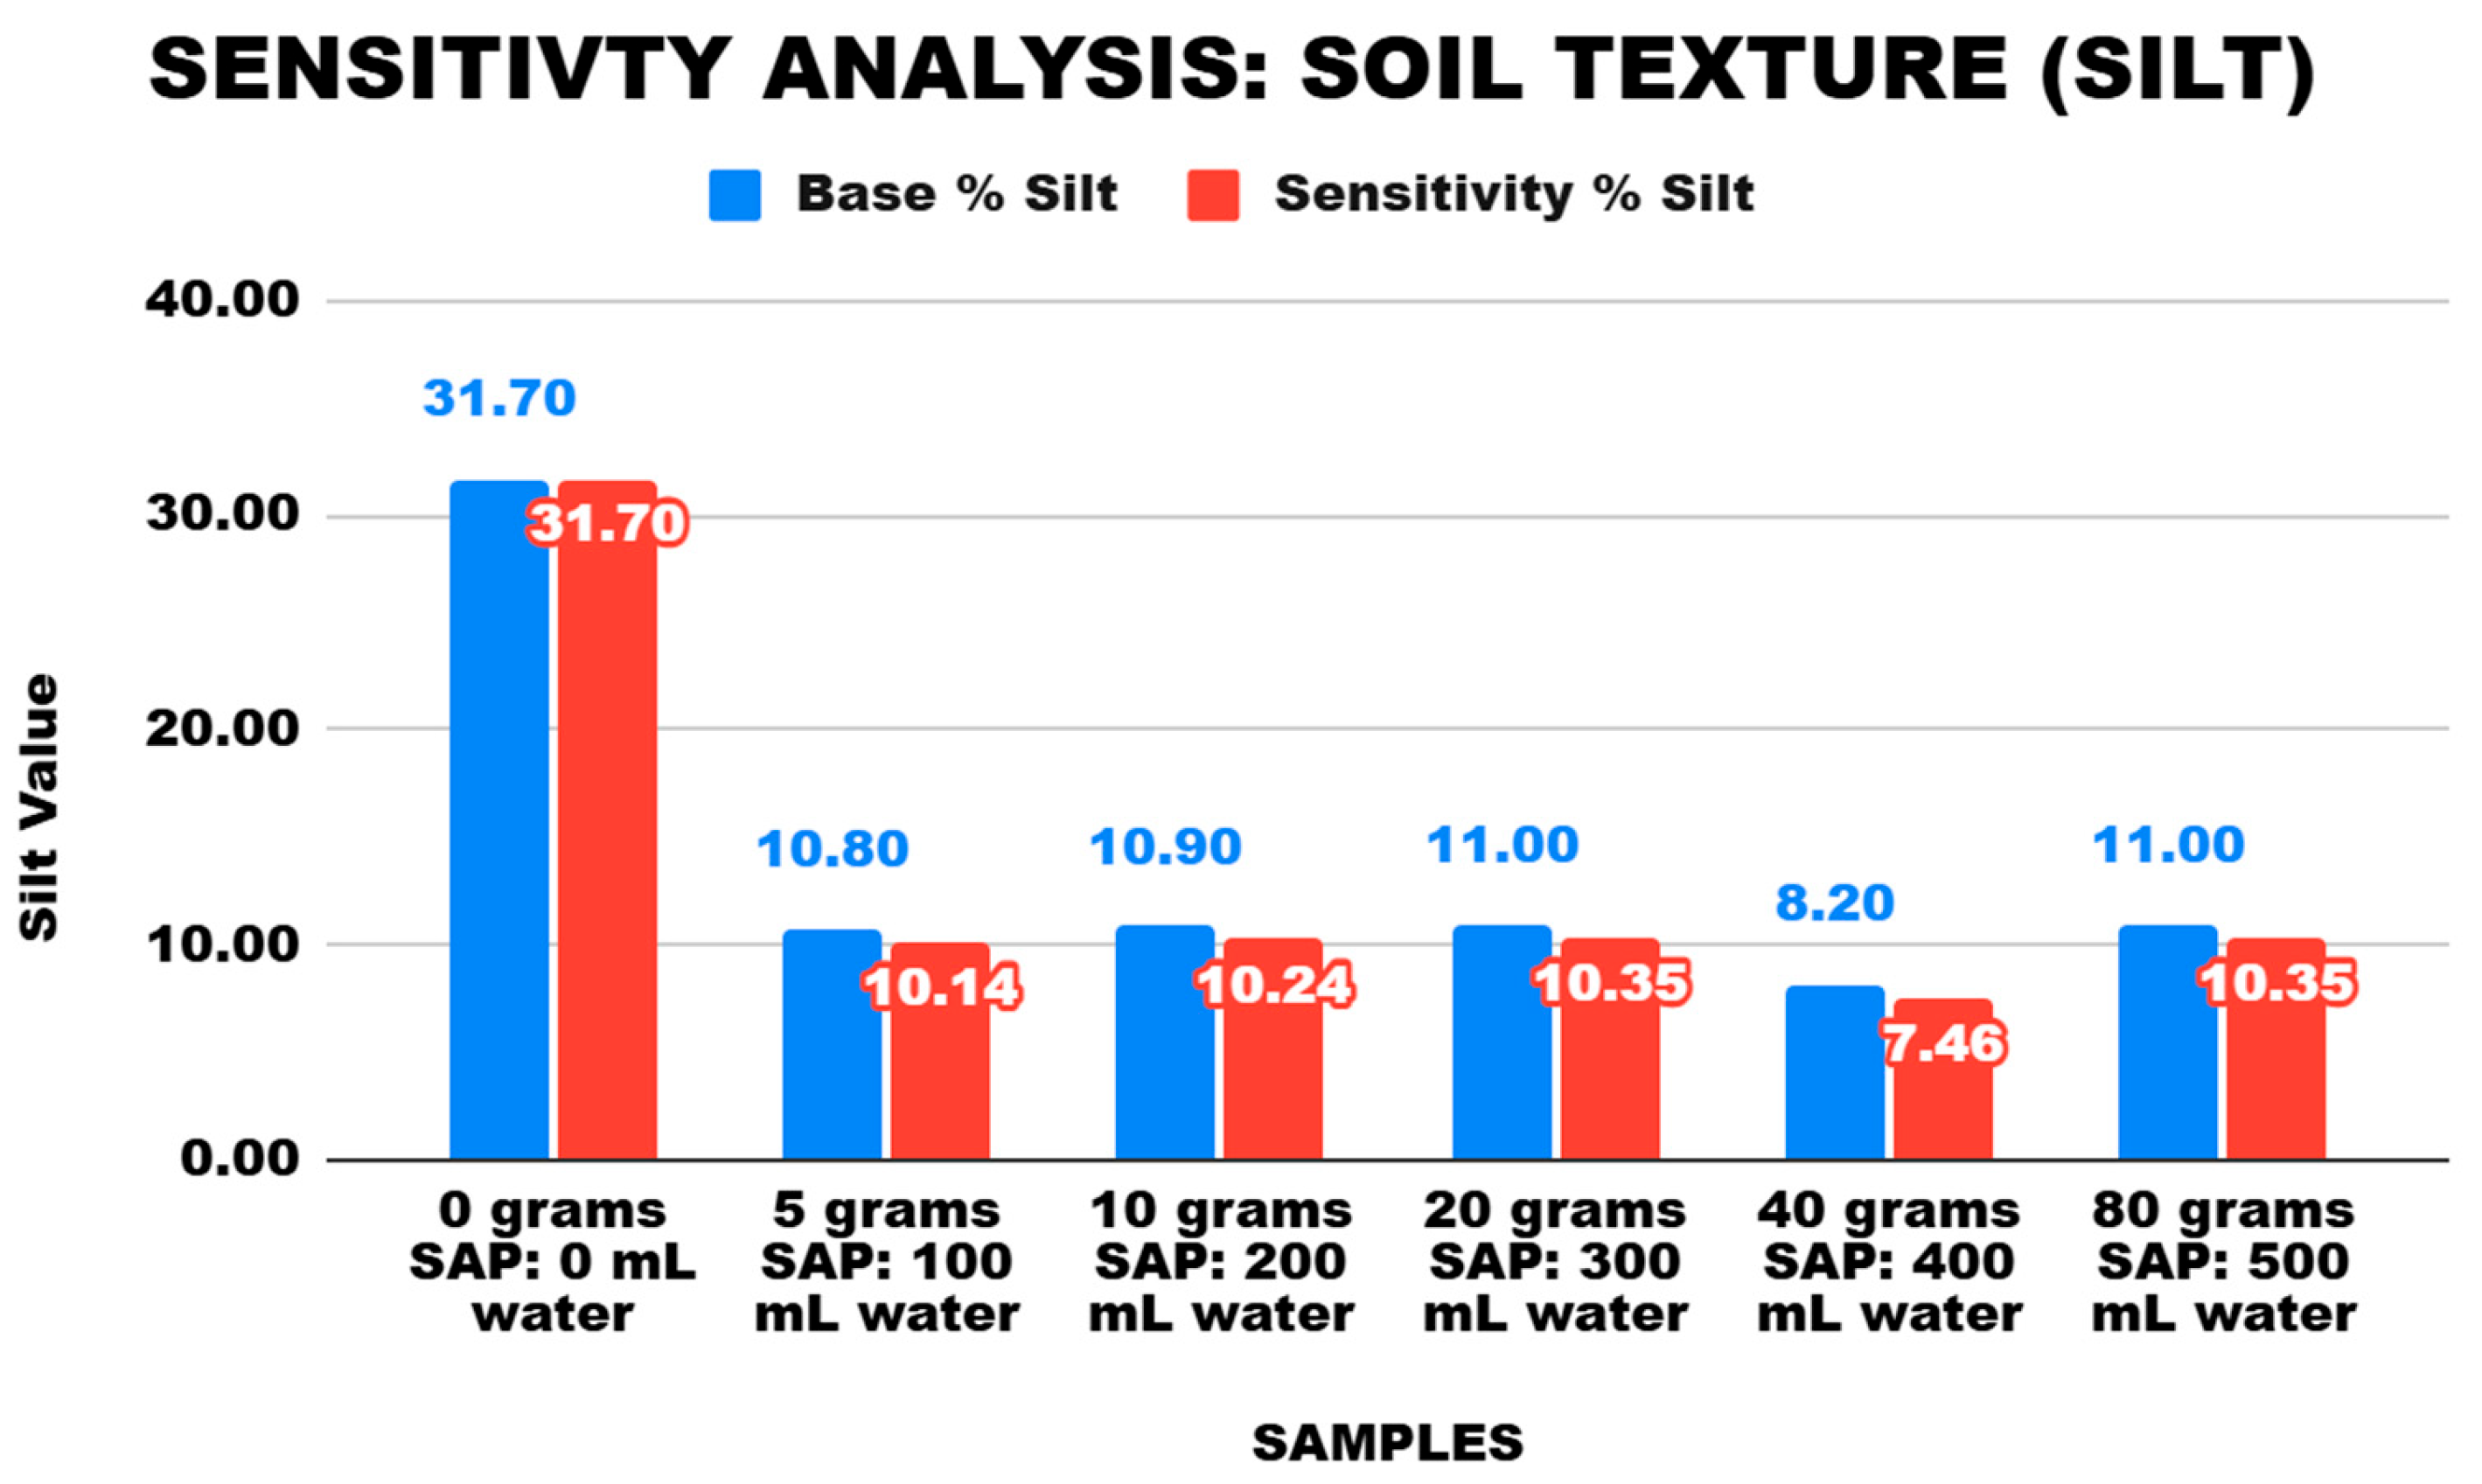
The baseline condition (0g SAP and 0mL water) shows a silt percentage of 31.70%, serving as the reference value. As SAP and water were introduced, there was a significant reduction in silt content. At 5g SAP with 100mL water, the silt percentage dropped by 65.93%, while at 10g SAP with 200mL water, it declined by 65.62%. Further increases in SAP application, such as 40g SAP with 400mL water, led to a 74.13% decrease, marking the highest reduction observed in the study. However, beyond this level, the effect stabilized, as seen in the 80g SAP treatment, where the silt percentage remained nearly the same as the 10g SAP treatment.
The sensitivity percentage of silt decreased with SAP application, indicating that the soil structure was shifting towards increased clay content while reducing finer particles like silt. Sensitivity values ranged from 10.14% to 10.35%, except for the 40g SAP treatment, which had a slightly lower sensitivity of 7.46%. This suggests that SAP significantly alters soil composition at moderate levels, but excessive application beyond optimal levels does not yield substantial additional changes.
The findings indicate that SAP application reduces silt content, promoting a shift in soil texture that enhances water retention capacity. Since silt has moderate water-holding properties, its reduction in favor of increased clay content suggests a soil texture more capable of retaining moisture, which supports the study’s goal of maximizing water-holding capacity and minimizing irrigation requirements. Moreover, the high sensitivity levels at different SAP concentrations highlight that even small amounts of SAP effectively modify soil texture. However, excessive application beyond 40g SAP per 500g soil may not result in proportional improvements. These results emphasize the need for optimal SAP dosing in sustainable agricultural practices to ensure improved soil quality and irrigation efficiency without unnecessary overuse of resources.
3.16. Clay
The sensitivity analysis shows the impact of Superabsorbent Polymer (SAP) and water application on the clay content in the soil. The sensitivity analysis examines how increasing SAP levels influence clay percentage, which is a critical factor in soil water retention. Clay particles have the highest capacity to retain moisture due to their fine texture and ability to bind water molecules.
Table 32.
Sensitivity Analysis Table for Soil Texture in Clay.
| Sample No. | SAP Amount (grams) | Water Amount (mL) | Base % Clay | % Clay Change | Overall Sensitivity Level | Sensitivity % Clay |
| 1 | 0 | 0 | 37.00 | 0.00% | Baseline (Low Sensitivity) | 37.00 |
| 2 | 5 | 100 | 83.90 | 126.76% | High Sensitivity | 85.17 |
| 3 | 10 | 200 | 81.60 | 120.54% | High Sensitivity | 82.81 |
| 4 | 20 | 300 | 82.70 | 123.51% | High Sensitivity | 83.94 |
| 5 | 40 | 400 | 66.00 | 78.38% | High Sensitivity | 66.78 |
| 6 | 80 | 500 | 66.00 | 78.38% | High Sensitivity | 66.78 |
Figure 16.
Sensitivity Analysis for Soil Texture in Clay.
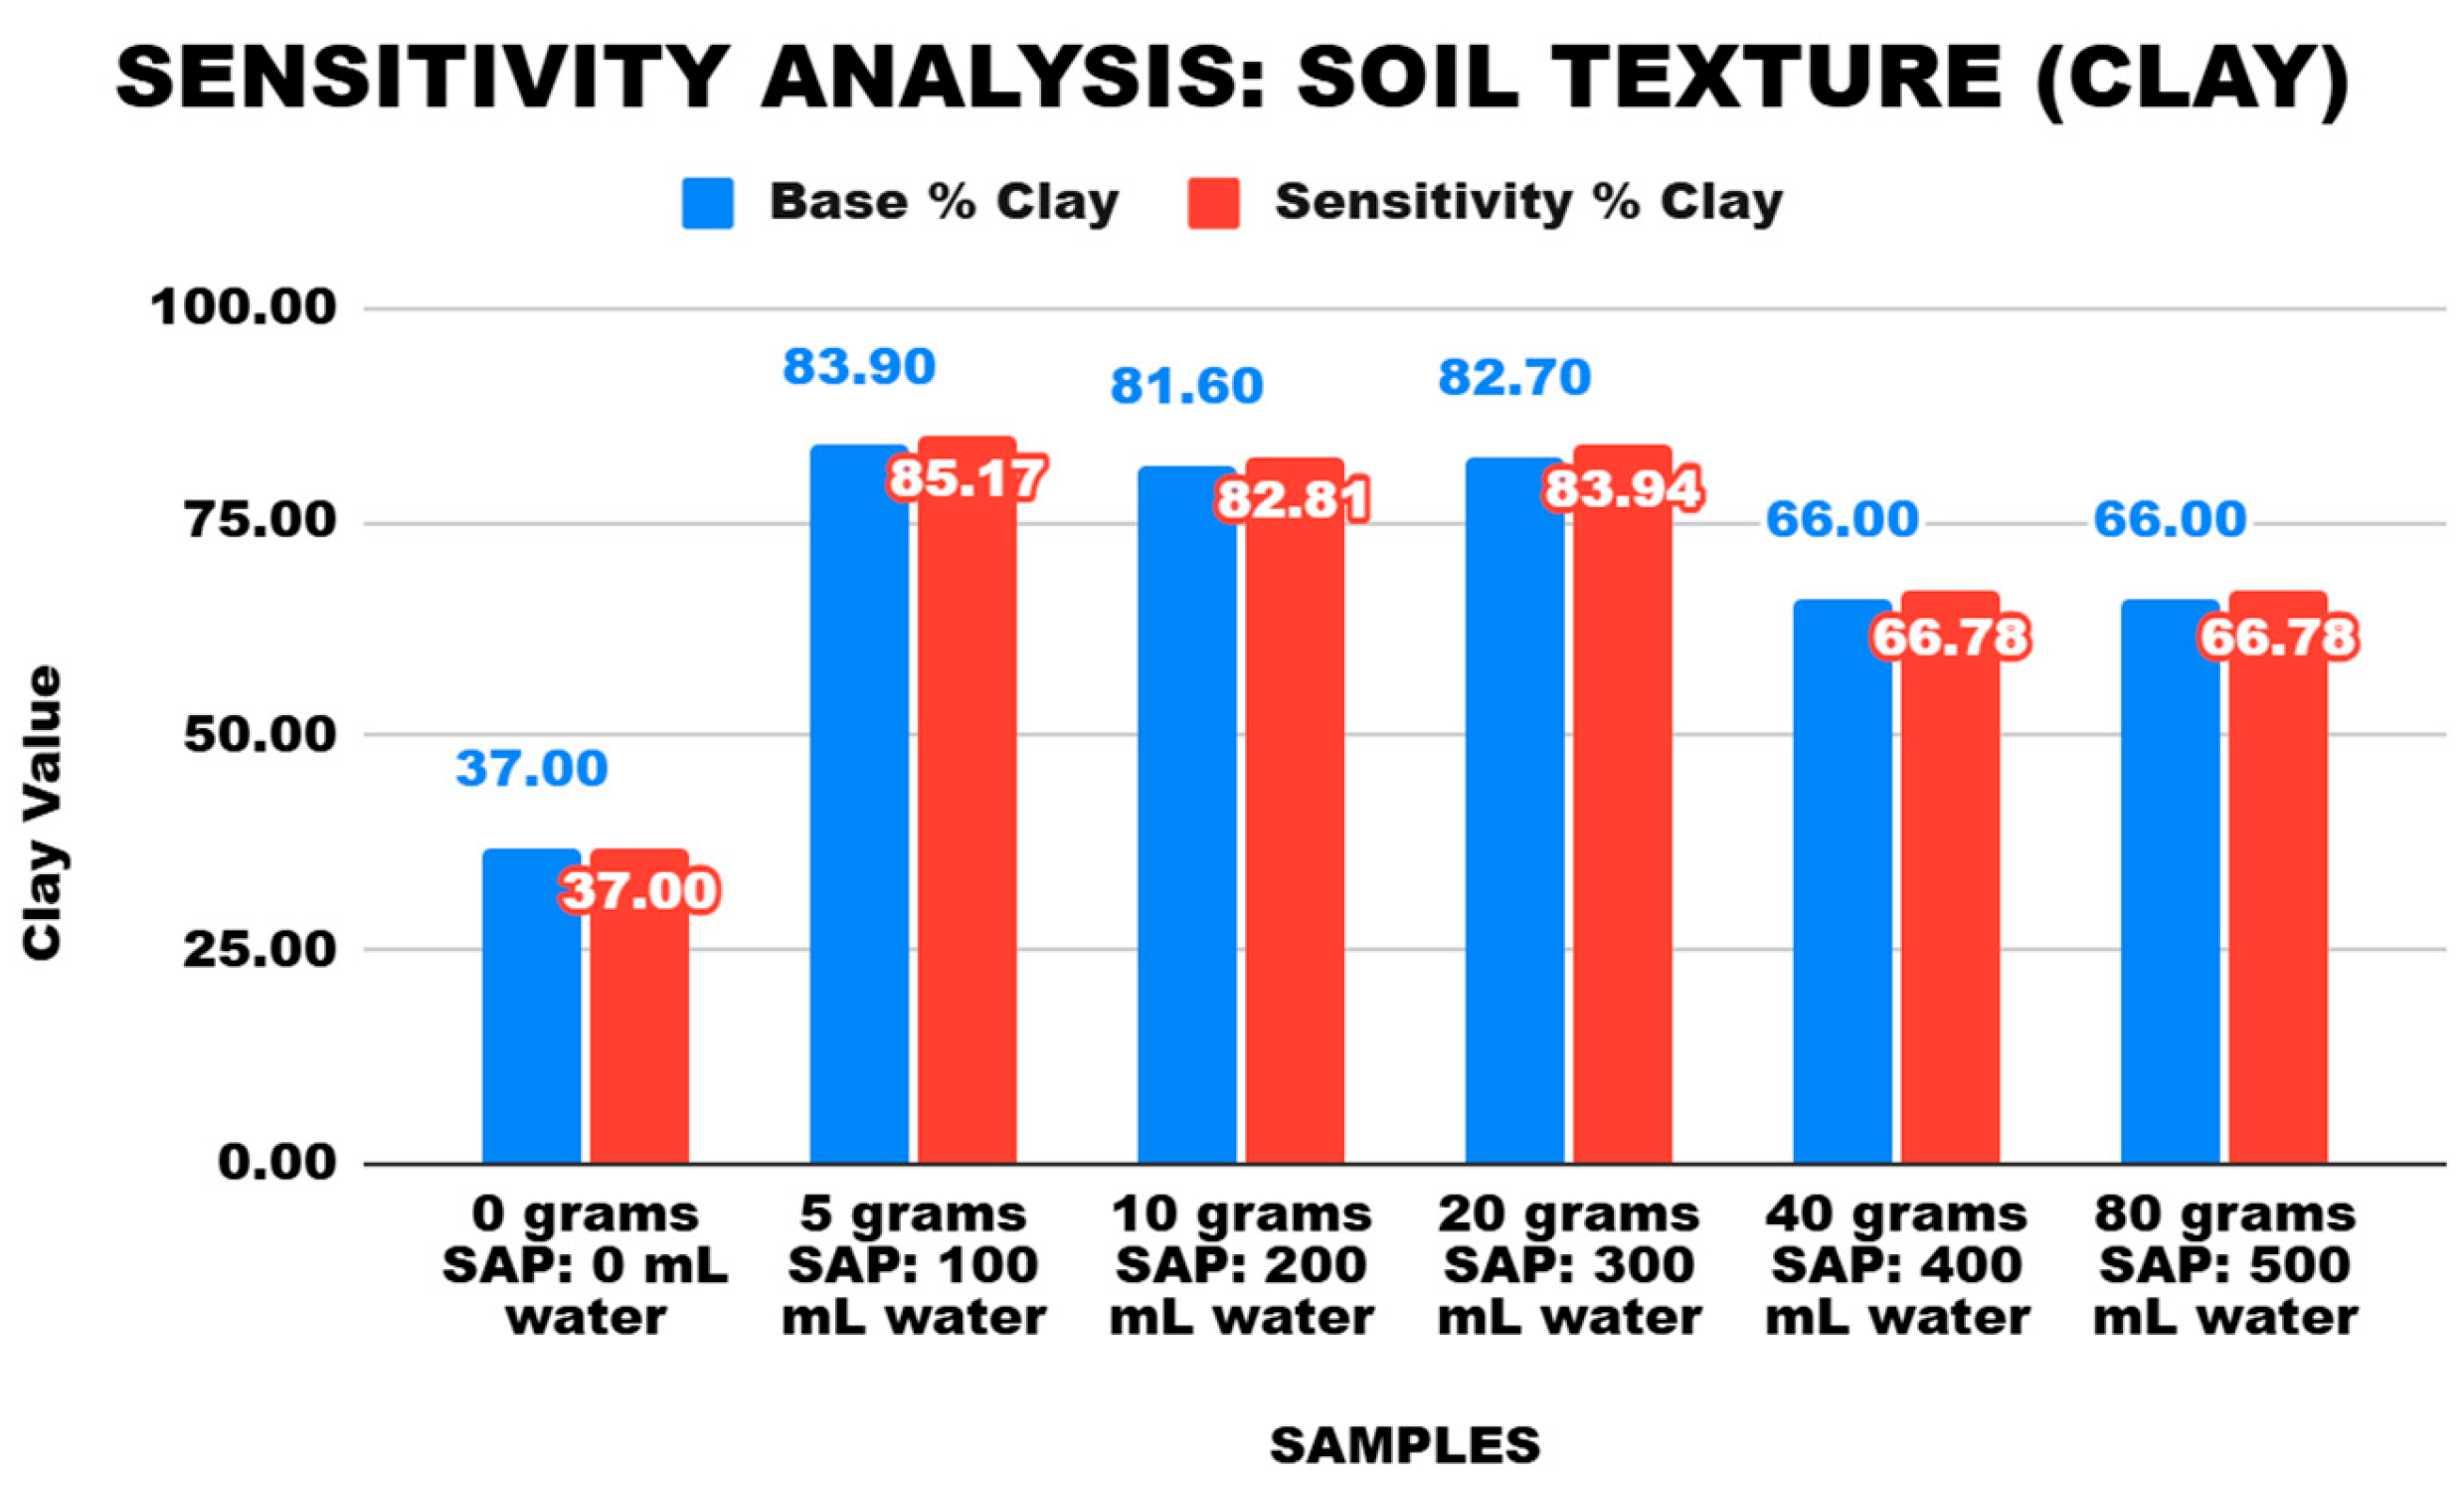
The baseline sample (0g SAP and 0mL water) had a clay content of 37%, serving as the reference point. As SAP and water were introduced, a significant increase in clay percentage was observed. The 5g SAP with 100mL water treatment resulted in a 126.76% increase in clay content, reaching 83.17% clay, marking the highest sensitivity level in the analysis. Similarly, the 10g SAP with 200mL water treatment led to a 120.54% increase, reaching 81.60% clay. The trend continued, with a 123.51% increase at 20g SAP with 300mL water (82.70% clay), showing that moderate SAP levels significantly enhanced clay retention in the soil.
Beyond this point, the sensitivity levels stabilized. The 40g SAP with 400mL water treatment resulted in a 78.38% increase, bringing clay content to 66%, while the 80g SAP with 500mL water treatment showed a similar trend, maintaining 66.78% clay. This suggests that excessive SAP application does not proportionally enhance clay content beyond a certain threshold.
The findings highlight that SAP application substantially increases clay content, thereby improving soil water-holding capacity. The high sensitivity levels at different SAP concentrations indicate that SAP plays a crucial role in modifying soil texture by increasing fine clay particles, which enhances soil moisture retention and reduces water loss. However, excessive SAP application beyond 20g per 500g soil does not provide additional benefits in clay retention. The clay percentage stabilizes at 66%, suggesting an optimal SAP level where further application becomes redundant. This reinforces the importance of determining the right amount of SAP for sustainable soil amendment, ensuring improved irrigation efficiency without unnecessary resource usage.
3.17. Water Holding Capacity
Water holding capacity (WHC) is another key factor analyzed, as it determines the soil’s ability to retain moisture for plant growth. The presence of SAP enhances WHC by absorbing and slowly releasing water, reducing irrigation demands while maintaining adequate hydration levels for crops. The study assesses how different SAP and water volumes affect WHC and identifies the levels at which SAP application maximizes moisture retention.
Table 33.
Sensitivity Analysis Table for Water Holding Capacity.
| Sample No. | SAP Amount (grams) | Water Amount (mL) | Base Water Holding Capacity (%) | Percentage Change (%) | Sensitivity Level | Sensitivity Water Holding Capacity (%) |
| 1 | 0 | 0 | 61.35 | 0.00% | Low | 61.35 |
| 2 | 5 | 100 | 70.22 | 14.46% | Low | 70.36 |
| 3 | 10 | 200 | 82.74 | 34.87% | High | 83.09 |
| 4 | 20 | 300 | 70.35 | 14.67% | Low | 70.50 |
| 5 | 40 | 400 | 81.04 | 32.09% | Moderate | 81.36 |
| 6 | 80 | 500 | 73.25 | 19.40% | Moderate | 73.44 |
Figure 17.
Sensitivity Analysis for Water Holding Capacity.
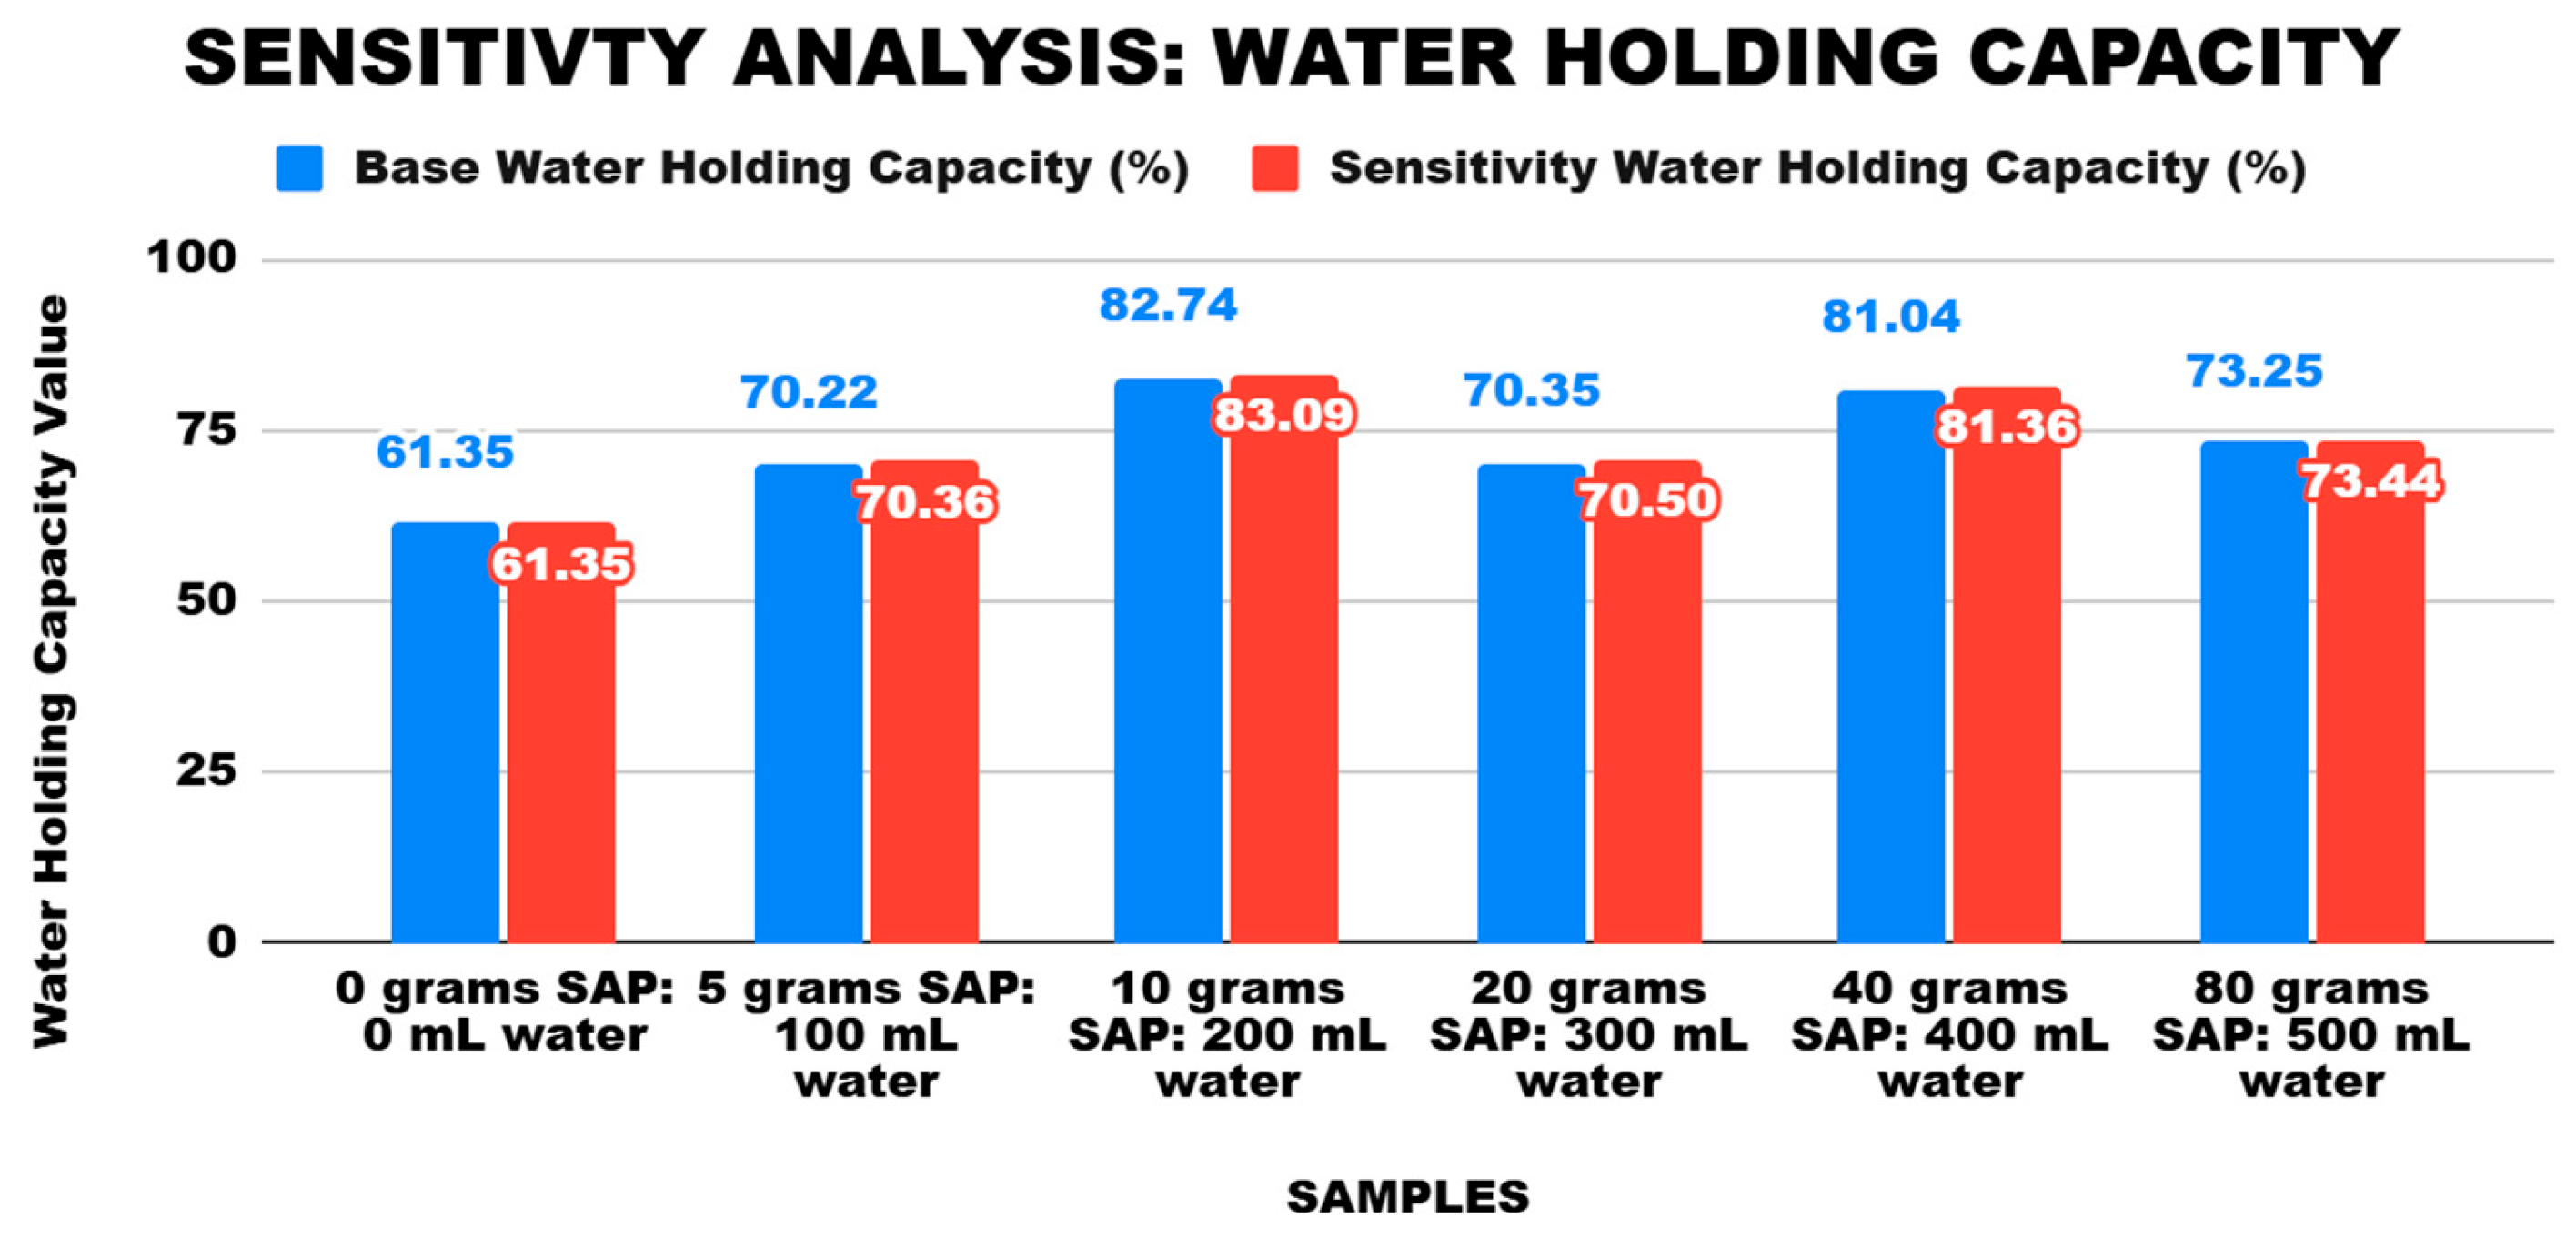
The sensitivity analysis of water holding capacity (WHC) evaluates how different levels of Superabsorbent Polymer (SAP) and water application influence the soil's ability to retain moisture. Water holding capacity is a crucial factor in soil management, as it determines how efficiently water is retained and made available to plants.
The baseline sample (0g SAP and 0mL water) had a water holding capacity of 61.35%, which served as the reference for comparison. As Superabsorbent Polymers and water were introduced, a progressive increase in WHC was observed. The 5g SAP with 100mL water treatment led to a 14.46% increase, reaching 70.22% WHC, indicating a low sensitivity level. When 10g SAP was applied with 200mL water, the WHC rose significantly by 32.74%, reaching 82.74%, marking a high sensitivity level.
Beyond this point, the increase in WHC was still positive but began to stabilize. The 20g SAP with 300mL water treatment resulted in a 14.76% increase, bringing WHC to 70.35%. Similarly, the 40g SAP with 400mL water increased WHC by 32.09%, reaching 73.26%, and the 80g SAP with 500mL water showed a 19.40% increase, with WHC reaching 73.44%. These values were categorized under moderate sensitivity levels, suggesting that while SAP application enhances WHC, excessive amounts beyond 10g do not provide a proportionally greater benefit.
The analysis highlights that Superabsorbent Polymers significantly improves water retention in soil, making it an effective soil amendment for reducing water loss and optimizing irrigation. The highest improvement was observed at 10g SAP with 200mL water (82.74% WHC, high sensitivity), indicating that this level maximizes moisture retention. However, further increasing SAP to 20g, 40g, and 80g did not result in a substantial improvement beyond the 70%–73% range, implying that there is an optimal Superabsorbent Polymers level beyond which additional application does not provide significant gains.
3.18. pH Content
pH content is evaluated to determine how SAP influences soil acidity or alkalinity. Soil pH affects microbial activity, nutrient availability, and overall plant health. Since SAP can alter pH levels, understanding its impact is crucial for maintaining an optimal soil environment for crop growth. Through this sensitivity analysis, the study aims to provide insights into the best SAP application strategies that improve soil structure, enhance water retention, and maintain a balanced pH for sustainable agricultural productivity.
Table 34.
Sensitivity Analysis Table for pH Content.
| Sample No. | Amount of SAP (grams) | Amount of Water (mL) | Base pH Content | Percentage Change in pH (%) | Sensitivity Level | Sensitivity pH Content |
| 1 | 0 grams | 0 mL | 6.27 | 0.00% | Baseline (No SAP) | 6.27 |
| 2 | 5 grams | 100 mL | 7.17 | 14.35% | Low Sensitivity | 7.31 |
| 3 | 10 grams | 200 mL | 7.38 | 17.70% | Moderate Sensitivity | 7.56 |
| 4 | 20 grams | 300 mL | 7.24 | 15.47% | Low Sensitivity | 7.39 |
| 5 | 40 grams | 400 mL | 7.20 | 14.83% | Low Sensitivity | 7.35 |
| 6 | 80 grams | 500 mL | 7.83 | 24.88% | High Sensitivity | 8.08 |
Figure 18.
Sensitivity Analysis for pH Content.
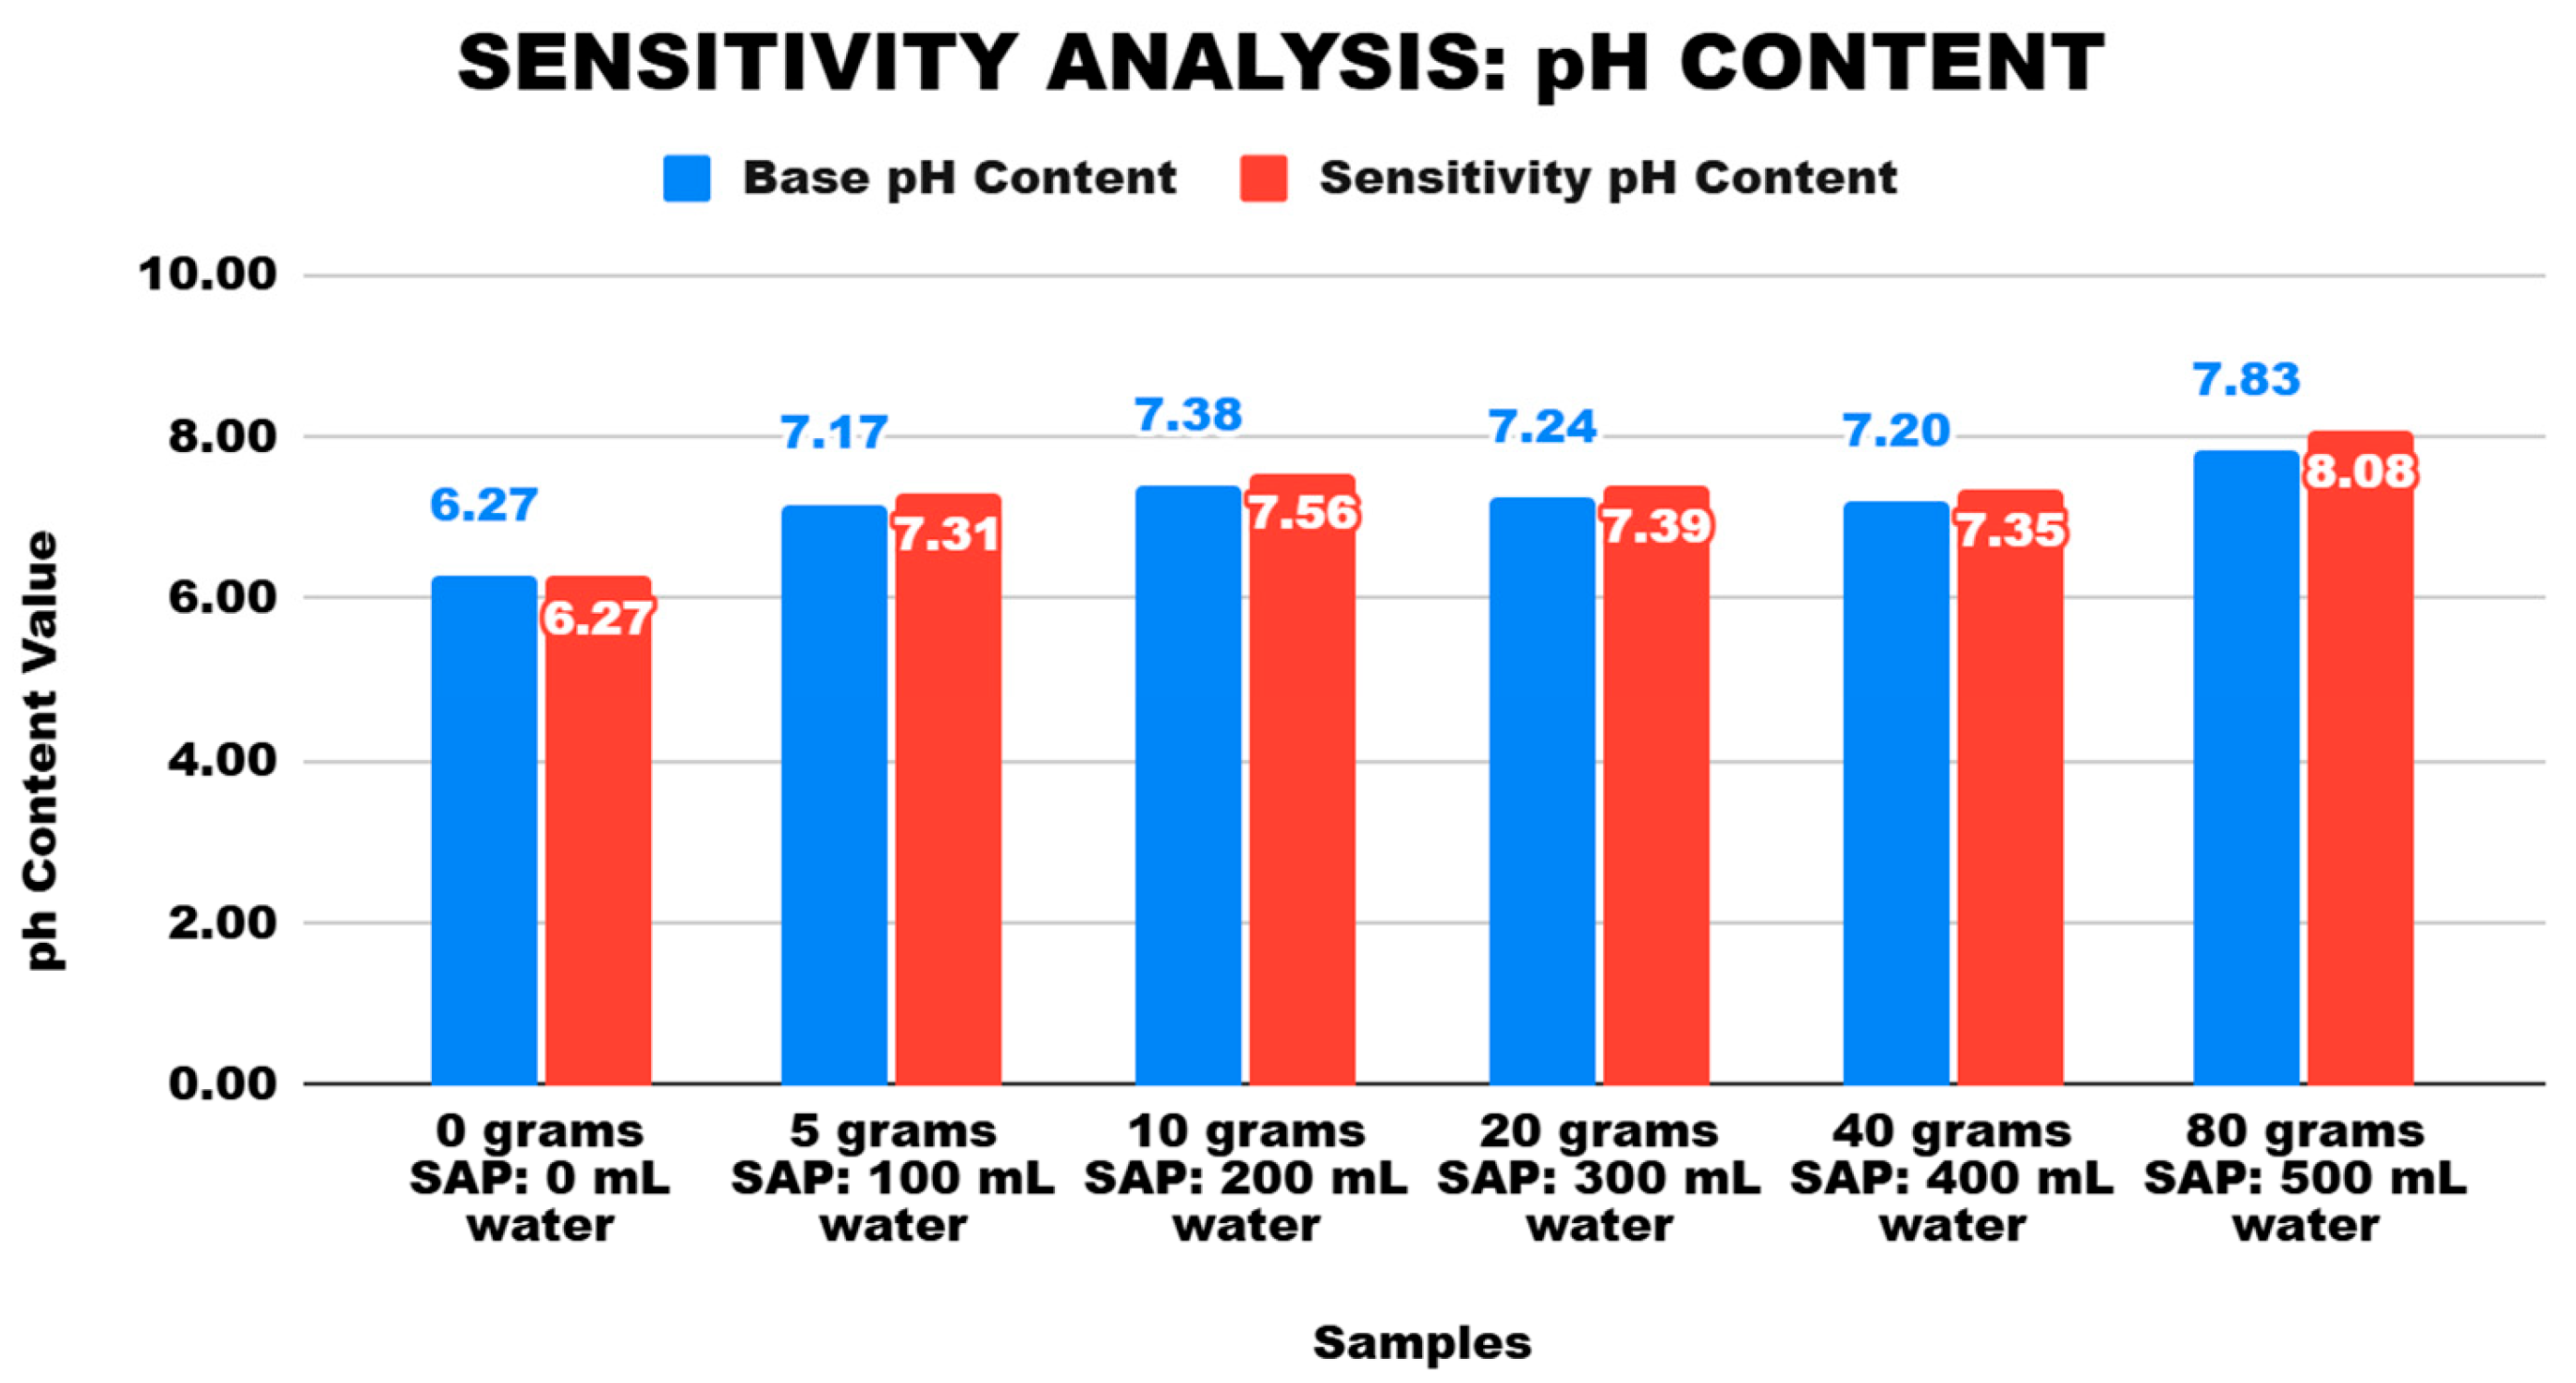
The sensitivity analysis of pH content examines the impact of varying amounts of Superabsorbent Polymer (SAP) and water application on soil pH. Soil pH is a critical factor affecting nutrient availability, microbial activity, and overall soil health. Changes in pH can influence plant growth and soil fertility, making it essential to understand how SAP affects this parameter.
The baseline soil sample (0g SAP and 0mL water) had a pH of 6.27, serving as the reference point. As SAP and water were introduced, an incremental rise in pH was observed. The addition of 5g SAP with 100mL water resulted in a 14.35% increase, raising the pH to 7.17, classified under low sensitivity. When 10g SAP with 200mL water was applied, the pH increased further to 7.38, showing a 17.70% increase and marking a moderate sensitivity level.
At 20g SAP with 300mL water, the pH content reached 7.20 with a 15.47% increase, still categorized under low sensitivity. Similarly, 40g SAP with 400mL water increased pH to 7.35, a 14.83% rise, remaining within the low sensitivity range. However, the highest SAP application (80g SAP with 500mL water) resulted in a 24.88% increase, bringing the pH to 8.08, marking a high sensitivity level.
The analysis indicates that SAP application tends to increase soil pH, which can shift the soil from slightly acidic to neutral or even alkaline conditions. The highest increase was observed at 80g SAP with 500mL water, reaching pH 8.08, which may have significant implications for soil chemistry. While a slight increase in pH can be beneficial for some crops, excessive alkalinity may reduce the availability of essential nutrients like phosphorus and iron, potentially affecting plant growth negatively. The results suggest that moderate SAP application (10g–40g) keeps the soil within a suitable pH range (7.2–7.4), while excessive SAP (80g) may lead to undesirable alkalinity. These findings emphasize the importance of optimizing SAP dosage to balance water retention benefits while maintaining ideal soil pH.
4. Summary
This study investigated the effectiveness of Superabsorbent Polymers in enhancing water retention and minimizing water irrigation in the soils of Purok Kabelen. By examining the physical characteristics of soil namely soil texture, water holding capacity, and pH content under varying treatments of Superabsorbent Polymer and water, the study aimed to determine the optimal amount of Superabsorbent Polymer for maximizing water retention while reducing irrigation needs. Data analysis was conducted through ANOVA and regression analysis to assess the significance of the differences observed in soil physical characteristics when different amounts of Superabsorbent Polymer and water were applied. Additionally, regression analysis was employed to evaluate the relationship between Superabsorbent Polymers, water volume, and soil physical characteristics to provide a deeper understanding of their interactions. The results showed that Superabsorbent Polymers significantly modified soil texture, increased water retention, and impacted soil pH. However, the efficiency of Superabsorbent Polymers in improving water retention did not consistently increase with higher quantities of the polymer.
5. Findings
5.1. ANOVA Findings
5.1.1. Soil Texture
The analysis of soil texture demonstrates significant changes in the distribution of sand, silt, and clay percentages across the various Superabsorbent Polymers treatments. These findings illustrate the effects of Superabsorbent Polymers (SAP) and water application on soil composition and provide insights into how different concentrations of Superabsorbent Polymers affect soil texture and water retention.
Overall Findings. The ANOVA results demonstrated a significant difference in the physical characteristics of soil texture when varying amounts of Superabsorbent Polymers and water were applied. With an overall F-value of 8.28, which is greater than the critical F-value of 2.75871, the results confirmed that the variation among groups was significantly higher than within groups. The p-value of 0.000213751, being far below the standard significance level of 0.05, led to the rejection of the null hypothesis. This indicates that Superabsorbent Polymers and water application notably influenced soil texture, altering its physical characteristics in a statistically significant manner.
5 grams SAP: 100mL water. ANOVA results showed a significant variation in soil texture, with an F-value of 24.0423, much higher than the critical F-value of 3.05557. The p-value of 2.23956E-06 confirmed a statistically significant change, suggesting that even a small amount of SAP and water altered the soil structure, leading to increased water retention.
10 grams SAP: 200mL water. The ANOVA findings revealed a substantial shift in soil texture, with an F-value of 55.3387, indicating a strong difference across groups. The extremely low p-value of 8.38187E-09 further supported the rejection of the null hypothesis, proving that increasing Superabsorbent Polymers concentration and water volume significantly influenced the physical characteristics of the soil.
20 grams SAP: 300mL water. The F-value of 113.038, which is considerably higher than the critical F-value, demonstrated a pronounced impact on soil texture. With a p-value of 5.2083E-11, the results confirmed that the application of 20 grams of SAP and 300mL of water led to a significant improvement in soil water-holding capacity and structural changes.
40 grams SAP: 400mL water. The ANOVA findings indicated a substantial transformation in soil texture, as reflected in the F-value of 197.127. The p-value of 9.02544E-13 confirmed a statistically significant change, suggesting that a higher Superabsorbent Polymers concentration continued to enhance water retention but may have started altering soil structure excessively.
80 grams SAP: 500mL water. The highest F-value recorded, 309.254, demonstrated the most significant difference in soil texture among the treatments. With a p-value of 3.26144E-14, the results provided strong evidence that increasing Superabsorbent Polymers to this level led to a marked alteration in soil composition, further improving water retention but potentially affecting soil structure beyond optimal conditions.
5.1.2. Water Holding Capacity
The results of the water holding capacity analysis indicate that the third sample (10 grams SAP: 200mL water) exhibited the highest water holding capacity, with the capacity decreasing in subsequent treatments. This optimal result can be attributed to the balance between Superabsorbent Polymers hydration and soil absorption properties. At 10g Superabsorbent Polymers, the material efficiently absorbs water and distributes it uniformly throughout the soil. However, as Superabsorbent Polymers concentrations increase (e.g., 20g, 40g, and 80g SAP), the water holding capacity shows diminishing returns.
Overall Findings. The ANOVA analysis revealed a significant difference in Water Holding Capacity across all tested samples with varying amounts of Superabsorbent Polymers and water. The results demonstrated that as SAP and water volumes increased, Water Holding Capacity values also changed significantly, indicating that Superabsorbent Polymers play a crucial role in enhancing the soil’s ability to retain moisture. The F-values in each treatment exceeded their respective critical values, and the P-values were consistently below 0.05, confirming the statistical significance of these variations.
Untreated Soil (0 grams SAP: 0mL water). For the untreated soil (0 grams SAP: 0mL water), the Water Holding Capacity showed noticeable variations even without Superabsorbent Polymers application. The F-value of 64.7657 and the very low P-value (0.000266297) indicated that Water Holding Capacity naturally fluctuated within the soil, suggesting that inherent soil properties contribute to its moisture retention capacity.
5 grams SAP: 100mL water. When 5 grams of SAP and 100mL of water were applied, the ANOVA results displayed a significant difference in Water Holding Capacity across the groups, with an F-value of 41.5678 and a P-value of 0.000766563. These findings suggest that even a small amount of Superabsorbent Polymers can alter Water Holding Capacity, likely by improving the soil’s ability to retain moisture through polymer expansion.
10 grams SAP: 200mL water. With 10 grams of SAP and 200mL of water, the ANOVA findings showed an even greater F-value of 157.883 and a P-value of 3.03357E-05. This increase in F-value suggests a stronger impact on Water Holding Capacity, reinforcing that a higher Superabsorbent Polymers application effectively enhances soil water retention.
20 grams SAP: 300mL water. At 20 grams of SAP and 300mL of water, the statistical analysis yielded an F-value of 407.495 and an extremely low P-value (2.90338E-06). This drastic increase in F-value highlights the pronounced effect of Superabsorbent Polymers in improving Water Holding Capacity, suggesting that the soil’s capacity to hold water is maximized at this level before reaching saturation.
40 grams SAP: 400mL water. When 40 grams of SAP and 400mL of water were applied, the F-value soared to 783.683, and the P-value dropped to 5.70217E-07. These results confirm that a substantial amount of Superabsorbent Polymers further enhances Water Holding Capacity but may begin to alter soil structure due to excessive polymer expansion.
80 grams SAP: 500mL water. With 80 grams of SAP and 500mL of water, the F-value reached an exceptional 1309.8, with a P-value of 1.58404E-07. This indicates the most significant variation in Water Holding Capacity, implying that while Superabsorbent Polymers effectively retains water, excessive application may lead to diminishing returns due to potential oversaturation and altered soil physical characteristics.
5.2. pH Content
This analysis illustrates the statistical significance of Superabsorbent Polymer (SAP) and water volume on soil pH content using Analysis of Variance (ANOVA). The results show that the variations in SAP and water treatments have a substantial impact on soil pH, as evidenced by the computed F-values exceeding the critical F-values and the P-values being significantly below 0.05 across all treatments.
The findings highlight a progressive increase in pH levels as SAP and water amounts rise, confirming that SAP influences soil acidity or alkalinity. Higher SAP and water combinations led to the most significant changes in pH, suggesting a strong buffering capacity at higher doses. These statistical results validate that SAP applications can effectively modify soil pH, which is essential for improving soil conditions, nutrient retention, and plant health in agricultural applications.
Overall Findings. For the overall pH analysis, the between-group variance had a sum of squares (SS) of 219,119 with 2 degrees of freedom (df), while the within-group variance, reflecting experimental error, had an SS of 179,522 with 15 df. The mean square (MS) for the between-group variation was 109,559, and for within-group variation, it was 11,968.1. The F-value of 9.15425 exceeded the critical F-value of 3.68232, and the P-value (0.00252) was well below 0.05, confirming that the different SAP and water treatments caused significant changes in pH.
Untreated Soil (0 grams SAP: 0mL water). At 0 grams of SAP and 0mL water, the F-value of 149.389 was far higher than the critical F-value (5.78614), with a P-value of 3.47564E-05, indicating a strong effect of Superabsorbent Polymers absence on pH variation.
5 grams SAP: 100mL water. Similarly, at 5 grams of SAP with 100mL of water, an F-value of 14,662.1 and an extremely low P-value of 3.79465E-10 reinforced the significant impact of even minimal Superabsorbent Polymers application.
10 grams SAP: 200mL water. As Superabsorbent Polymers and water levels increased, the differences in pH content became even more pronounced. At 10 grams of SAP and 200mL of water, the F-value reached 62,568.7, with a P-value of 1.00905E-11, showing a substantial shift in pH levels.
20 grams SAP: 300mL water. The trend continued with 20 grams of SAP and 300mL of water, where the F-value surged to 143,337, with an exceptionally low P-value of 1.2704E-12.
40 grams SAP: 400mL water. For higher Superabsorbent Polymers applications, such as 40 grams with 400mL of water, the F-value rose dramatically to 256,313, and the P-value (2.97108E-13) confirmed the statistical significance of the changes in pH content.
80 grams SAP: 500mL water. Finally, at 80 grams of SAP and 500mL of water, the F-value peaked at 401,989, with a P-value of 9.64513E-14, demonstrating the most extreme pH differences among treatments.
5.2.1. Linear Regression Findings
Soil Texture
Sand Content. The raw data shows irregular changes in the amount of sand. Sand concentration drops dramatically to 5.30 percent with 5g SAP and 100mL water, then slightly increases at 10g SAP before declining once more at 20g SAP. The sand content, however, increases significantly to 25.80% and 23.00% at 40g and 80g SAP, respectively. This irregular pattern implies that water and Superabsorbent Polymers by themselves do not consistently affect the amount of sand, reinforcing the idea that other soil characteristics may be more important.
Silt Content. Silt content, Superabsorbent Polymers, and water had a slight correlation according to the regression analysis (R2 = 0.6801); however, the model was not statistically significant (Significance F = 0.1809). Water had a negative effect (coefficient = -0.0819) and SAP had a minor positive effect (coefficient = 0.3408) on silt content, but neither effect was statistically significant. With Superabsorbent Polymers and water, the silt content initially decreased dramatically from 31.70% to about 10.80%–11.00%, but after 40g SAP, the development became inconsistent. This implies that while water and Superabsorbent Polymers have an impact on silt, they are not the only factors, demanding more research on characteristics of soil.
Clay Content: Superabsorbent Polymers and water account for 43.24% of the change in clay content, according to the regression analysis; however, the model is not statistically significant (Significance F = 0.4276). Water has a tiny beneficial impact (0.1567) and SAP has a negative effect (-0.8853), but neither is statistically significant. At lower SAP levels (5g, 10g), clay content rises; at higher levels (40g, 80g), it decreases, indicating that too much Superabsorbent Polymers may disturb the structure of the soil. Clay content is probably more affected by other factors, such as the composition of the soil.
5.2.2. Water Holding Capacity
Based on the findings of the study, the highest Water Holding Capacity of 82.74% was attained using 10g of SAP and 200mL of water. Beyond this point, however, increasing Superabsorbent Polymers caused a decrease; 20g SAP decreased Water Holding Capacity to 70.35 percent, while 80g SAP decreased WHC to 73.25 percent. This is supported by regression analysis, which reveals a negative SAP coefficient (-0.3250), suggesting that high Superabsorbent Polymers does not always result in higher Water Holding Capacity. On the other hand, the positive water coefficient (0.0706) indicates that water somewhat raises Water Holding Capacity. The decrease could be brought on by Superabsorbent Polymers aggregation and expanding, which lowers absorption efficiency. Therefore, it is more efficient to optimize Superabsorbent Polymers and water application rather than just adding more.
pH Content
The findings show that water and Superabsorbent Polymers have little effect on soil pH. Although the adjusted R² value of 0.4410 indicates decreased explanatory power, the R² value of 0.6646 indicates a moderate association. The regression model's lack of statistical significance (p = 0.1942) suggests that pH variations are caused by other causes.
Instead of showing a distinct trend, pH values fluctuate, indicating complex connections with soil absorbing systems. Weak individual effects are indicated by the statistical insignificance of the water coefficient (0.0025) and the Superabsorbent Polymers coefficient (-0.0018). Superabsorbent Polymers can increase water retention without causing significant disturbances because it does not significantly change the pH of the soil.
5.2.3. Maximizing Water Holding Capacity
The third treatment, applying 10 grams of SAP with 200mL water, resulted in the highest water holding capacity among all treatments. This suggests that this combination provides the optimal balance between the amount of Superabsorbent Polymers and water for soil moisture retention. At this ratio, the Superabsorbent Polymers particles are fully hydrated and distributed evenly in the soil which allows them to retain the maximum amount of water effectively. Beyond this treatment, the water holding capacity decreases slightly despite increasing Superabsorbent Polymers concentrations (e.g., 20g, 40g, 80g). This decrease is likely due to diminishing returns, where excess Superabsorbent Polymers exceeds the amount of available water for hydration, leaving some SAP particles underutilized. Additionally, higher Superabsorbent Polymers concentrations may lead to particle aggregation, which can block soil pores and reduce the overall capacity for water absorption. Thus, the 10-gram Superabsorbent Polymers treatment is identified as the most efficient and effective for maximizing water holding capacity.
Although the 80g Superabsorbent Polymers treatment includes more Superabsorbent Polymers and water, it does not outperform the 10g Superabsorbent Polymers treatment in terms of water holding capacity. This is due to oversaturation of the soil, where excessive Superabsorbent Polymers form gel-like clumps that interfere with the soil structure and water distribution. These clumps may block water movement within the soil, reducing the system’s efficiency for holding water. Furthermore, applying such high amounts of Superabsorbent Polymers could be economically impractical and environmentally inefficient, as it requires more materials without providing significant improvements in performance. These findings highlight the importance of using an optimal amount of Superabsorbent Polymers to achieve the desired results without unnecessary costs or resources.
5.2.4. Minimizing Water Irrigation
The results show that the 10g Superabsorbent Polymers treatment can significantly reduce the need for frequent irrigation by improving the soil's ability to retain water. With the highest water holding capacity, this treatment ensures that the soil remains hydrated for longer periods, thereby reducing water loss due to evaporation or drainage. By maintaining optimal moisture levels in the soil, farmers can extend the time between irrigation cycles, leading to lower water usage and improved irrigation efficiency. On the other hand, treatments with excessive Superabsorbent Polymers (e.g., 80g) may require more water to achieve similar levels of hydration, which defeats the goal of minimizing irrigation. Therefore, the 10g Superabsorbent Polymers with 200mL water is not only the optimal solution for maximizing water holding capacity but also the best treatment for achieving sustainable water management practices in agriculture.
5.2.5. Sensitivity Analysis Findings
Soil Texture
The sensitivity analysis for soil texture reveals that the application of Super Absorbent Polymer (SAP) significantly affects the composition of sand, silt, and clay.
Sand Content. In terms of sand content, the baseline measurement without SAP showed a sand percentage of 31.30%. As SAP and water were introduced, the sand content steadily decreased, reaching its lowest at 7.89% with the highest SAP application (80g SAP, 500mL water). This indicates that SAP contributes to soil compaction, reducing the presence of sand particles and increasing soil density. The reduction in sand content across all SAP-treated samples resulted in a high sensitivity level, suggesting that even small amounts of SAP can alter soil texture significantly.
Silt Content. For silt content, a similar trend was observed. The baseline silt percentage was 31.70%, which gradually declined as SAP amounts increased. The highest SAP application led to a 65.30% reduction, lowering silt content to 10.35%. This decrease signifies that SAP modifies soil composition by reducing its ability to hold fine particles, which could impact soil fertility and aeration. Given the magnitude of change, the overall sensitivity level for silt content was categorized as high sensitivity, reinforcing SAP’s strong influence on soil structure.
Clay Content. Clay content, on the other hand, increased with SAP application. The baseline clay percentage was 37.00%, but with SAP addition, the values steadily rose, peaking at 66.78% for the highest SAP application. This 78.38% increase indicates that SAP enhances soil cohesion, making it more water-retentive and less porous. The overall sensitivity level for clay content was marked as high sensitivity, emphasizing the strong impact SAP has on increasing the presence of finer soil particles. The observed changes in soil texture suggest that while SAP improves water retention, it may also reduce soil permeability and drainage, requiring careful management in agricultural applications.
5.2.6. Water Holding Capacity
The sensitivity analysis for water holding capacity (WHC) demonstrates that SAP effectively increases soil moisture retention. The baseline WHC, without any SAP, was 61.35%. With the introduction of SAP, WHC steadily improved, reaching a peak of 73.44% at 80g SAP and 500mL water, reflecting a 19.40% increase. The results confirm that SAP enhances the soil’s ability to retain water, which can be beneficial in reducing irrigation frequency and improving water availability for crops.
While SAP application consistently increased WHC, the sensitivity level varied. At lower SAP doses, the sensitivity level remained low, indicating that small amounts of SAP did not drastically change soil moisture retention. However, at higher SAP levels (10g–80g SAP), the sensitivity level ranged from moderate to high, confirming that larger quantities of SAP significantly improve WHC. The findings suggest that moderate SAP application (around 20g to 40g SAP) is optimal for enhancing soil moisture retention without causing excessive water retention, which could lead to over-saturation and poor drainage.
pH Content
The pH sensitivity analysis reveals that SAP alters soil pH, shifting it from an acidic to a more neutral or alkaline state. The baseline pH value was 6.27, which falls in the slightly acidic range. With SAP application, pH levels gradually increased, reaching a peak of 8.08 at the highest SAP dosage (80g SAP, 500mL water). This marks a 24.88% increase, showing that SAP can significantly impact soil pH balance.
The sensitivity level for pH varied depending on SAP application. At lower SAP levels (5g–40g), the sensitivity remained low to moderate, indicating a gradual increase in pH. However, at 80g SAP, the sensitivity was categorized as high, suggesting that excessive SAP application could make the soil too alkaline. This shift in pH could have implications for nutrient availability, particularly for phosphorus and iron, which may become less accessible to plants in alkaline conditions.
The findings indicate that while SAP can help neutralize acidic soils, excessive use could lead to overly alkaline conditions, which may not be suitable for all crops. To maintain soil health, SAP application should be carefully managed, with moderate levels (10g–40g SAP) recommended to improve pH without excessively altering the soil’s chemical balance.
6. Conclusions
The study investigates the effectiveness of Superabsorbent Polymers (SAPs) in maximizing water-holding capacity and minimizing water irrigation in agricultural systems, aligning with Sustainable Development Goal (SDG) 12 on responsible consumption and production, as well as SDG 15 on life on land. It examines the influence of varying amounts of SAP and water on soil physical characteristics, such as soil texture, water-holding capacity, and pH content. The results indicate that SAPs can significantly enhance water-holding capacity in soil, but careful consideration of application rates is crucial. Moreover, the study suggests that SAPs can substantially reduce irrigation frequency and volume, contributing to more sustainable water management and promoting efficient use of water resources, a key target of SDG 12. By optimizing SAP application rates and monitoring soil physical characteristics, the study advocates for the integration of SAP use with sustainable agricultural practices, thereby supporting the conservation of land resources as emphasized in SDG 15. The findings emphasize the potential for SAPs to improve soil health and reduce the environmental footprint of agricultural water use. However, further research is needed to fully understand the long-term impacts of SAP application on soil properties, crop productivity, and overall ecosystem health. The results offer valuable insights into the potential of SAPs in enhancing water-holding capacity and minimizing irrigation, contributing to more sustainable agricultural practices.
Acknowledgments
The researchers extend their gratitude to those who contributed to the fulfillment of this research. First of all, the researchers are thankful to the Cebu Technological University - Main Campus for giving us this wonderful opportunity to learn and for teaching us the value of persistence, patience, teamwork, resilience, cooperation, and the unwavering desire of knowledge. Secondly, our sincere gratitude is extended to Engr. Ike A. Baguio, and Dr. Jeremy Mondejar for their remarks, recommendations, and guidance, all of which greatly aided in the accomplishment and success of this research. Working and learning under their direction was a great honor and privilege. The researchers express sincere gratitude to Tatay Rody Bacaling for generously allowing us to visit his agricultural field at Purok Kabelen, Sta. Cruz, Liloan, Cebu. We appreciate his kindness in permitting us to conduct our study and gather soil samples in his field. This collaborative support significantly contributed to the success of our research, and we are truly thankful for his hospitality and cooperation. We also want to thank our parents so much for their constant love, prayers, support, and sacrifices; it was made possible by their selfless dedication. We are especially grateful to Almighty God for giving us the courage, wisdom, skills, and opportunity to conduct this research study. Our achievements, including this research, would not be possible without His direction and mercy. Finally, we would like to express our gratitude to everyone who helped us to finish this research study.
References
- Abdel-Aal, S. E., Cao, Y. M., Francis, S., Gawande, N., Islam, M. S., Kangwansupamonkon, Kiatkamjornwong, S., Lanthong, P., Lee, J. S., Lin, O. H., Liu, J. H., Narayanan, A., Sojka, R. E., Xu, K., Yadav, M., Yoshimura, T., Zhang, J. P., Zheng, Y., Divakaran, A. V., … Ghazali, S. (2020, October 17). Research into the super-absorbent polymers on Agricultural Water. Agricultural Water Management. https://www.sciencedirect.com/science/article/abs/pii/S0378377420314827.
- Ai, F., Yin, X., Hu, R., Ma, H., & Liu, W. (2021, February 1). Research into the super-absorbent polymers on agricultural water. Agricultural Water Management. [CrossRef]
- Akinci, I., Canbolat, M., & Yılmaz, D. (2019). Evaluation of superabsorbent polymer applications in agriculture: Water-saving potential and crop performance. Journal of Soil Science and Plant Nutrition, 19(3), 589-602.
- Bai, W., Zhang, H., Liu, B., Wu, Y., & Song, J. (2020). Effects of super-absorbent polymers on the physical and chemical properties of soil following different wetting and drying cycles. Soil Use and Management, 26(3), 253-260. [CrossRef]
- Chang, L., Xu, L., Liu, Y., Qiu, D. (2020, December 15). Superabsorbent polymers used for agricultural water retention. Polymer Testing. https://www.sciencedirect.com/science/article/pii/S0142941820322509#bib1.
- Climate change, agricultural production and civil conflict: Evidence from the Philippines. Journal of Environmental Economics and Management. https://www.sciencedirect.com/science/article/abs/pii/S0095069617301584.
- DOST-PAGASA S & T Media Service. (2023, March 23). EL NIŇO WATCH. PAGASA.https://www.pagasa.dost.gov.ph/press-release/129?q=EL+NINO+2023+PHENOMENON.
- Ebora, R. V. (2022, May 3). Supporting the sustainability of Agricultural Innovation Systems. FFTC Agricultural Policy Platform (FFTC-AP). https://ap.fftc.org.tw/article/3042.
- Elshafie, H. S., & Camele, I. (2021, March 16). Applications of absorbent polymers for sustainable plant protection and crop yield. MDPI. [CrossRef]
- Guo, J., Shi, W., Wen, L., Shi, X., & Li, J. (2019). Effects of a super-absorbent polymer derived from poly-γ-glutamic acid on water infiltration, field water capacity, soil evaporation, and soil water-stable aggregates. Archives of Agronomy and Soil Science, 66(11), 1627-1638.
- Inocencio , A., & Barker, R. (2018). Current challenges in agricultural water resources ... Current Challenges in Agricultural Water Resource Development and Management in the Philippines . https://www.dlsu.edu.ph/wp-content/uploads/2019/03/1-inocencio-072418.pdf.
- Khaleel, A., Dutter, C., Blauwet, M., Flores, A., Miller, B., Burras, C. L., Fidel, R., & Anderson, A. (2023, August 25). Soil ph. Introduction to Soil Science. https://iastate.pressbooks.pub/introsoilscience/chapter/ph-base-saturation/.
- Lansigan, F. P., Lobell, D. B., Sarsons, H., Zaidi, P. H., Ahmed, M., Bank, A. D., Aufhammer, M., Bento, A., Berman, E., Bhattacharya, T., Bohlken, A. T., Bollfrass, A., Mesquita, E. B. de, Buhaug, H., Burke, M. B., Burke, M., Analyses, C. for N., Chou, C., Christensen, J. H., … Hsiang, S. M. (2018, January 31). Climate change, agricultural production and civil conflict: Evidence from the Philippines. Journal of Environmental Economics and Management. https://www.sciencedirect.com/science/article/abs/pii/S0095069617301584.
- Mishan, E. J., & Quah, E. (2022). Cost-Benefit Analysis (8th ed.). Routledge.
- Ndunge Benard, D., Obiero, J. P. O., & Mbuge, D. O. (2022, August 25). Contribution of Superabsorbent polymers to growth and yield of African leafy vegetables. Advances in Agriculture. https://www.hindawi.com/journals/aag/2022/8020938/.
- Oladosu, Y., Rafii, M. Y., Arolu, F., Chukwu, S. C., Salisu, M. A., Fagbohun, I. K., Muftaudeen, T. K., Swaray, S., & Haliru, B. S. (2022, July 5). Superabsorbent polymer hydrogels for Sustainable Agriculture: A Review. MDPI. https://www.mdpi.com/2311-7524/8/7/605.
- Ostrand, Megan & DeSutter, Thomas & Daigh, Aaron & Limb, Ryan & Steele, Dean. (2020). Superabsorbent polymer characteristics, properties and applications. Agrosystems, Geosciences & Environment. 3. [CrossRef]
- Palanivelu, S. D., Armir, N. a. Z., Zulkifli, A., Hair, A. H. A., Salleh, K. M., Lindsey, K., Che-Othman, M. H., & Zakaria, S. (2022). Hydrogel Application in Urban Farming: Potentials and Limitations—A Review. Polymers, 14(13), 2590. [CrossRef]
- Prathap, M. U., Gurumurthy, H., & Suma, K. (2020). Role of superabsorbent polymers in improving soil water retention and crop yield in semi-arid regions. Agriculture and Water Management Studies, 14(2), 198-206.
- Ramirez, R. M. A. (2022). Production of cellulose-based superabsorbent polymers for soil water retention. Scholarship@Western. https://ir.lib.uwo.ca/etd/9093.
- Saha, A., Rattan, B., Sekharan, S., & Manna, U. (2020). Quantifying the interactive effect of water absorbing polymer (WAP)-soil texture on plant available water content and irrigation frequency. Geoderma, 368, 114310. [CrossRef]
- Satriani, A., Catalano, M., & Scalcione, E. (2018). The role of superabsorbent hydrogel in bean crop cultivation under deficit irrigation conditions: A case-study in Southern Italy. Agricultural Water Management, 195, 114–119. [CrossRef]
- Shirazi, M. A., & Boersma, L. (2019). A Unifying Quantitative Analysis of Soil Texture. Soil Science Society of America Journal, 48(1), 142–147. [CrossRef]
- Singhal, S., Singh, A., & Borah, N. (2023). Exploring the potential of biodegradable superabsorbent hydrogel as a sustainable solution for water management in agriculture. International Journal of Chemical and Biochemical Sciences, 23(2), 271–279. https://www.iscientific.org/wp-content/uploads/2023/08/35-IJCBS-23-23-2-35.pdf.
- Soil Texture Analysis |. (2024). Norganics.com. https://norganics.com/index-2/technical-articles/soil-texture-analysis/.
- Stuecker, M. F., Tigchelaar, M., & Kantar, M. B. (2018, August 9). Climate variability impacts on rice production in the Philippines. PLOS ONE. https://journals.plos.org/plosone/article?id=10.1371%2Fjournal.pone.0201426.
- Takahashi, M., Kosaka, I., & Ohta, S. (2023). Water Retention Characteristics of Superabsorbent Polymers (SAPs) Used as Soil Amendments. Soil Systems, 7(2), 58. [CrossRef]
- Vos, C., Don, A., Prietz, R., Heidkamp, A., & Freibauer, A. (2016). Field-based soil-texture estimates could replace laboratory analysis. Geoderma, 267, 215–219. [CrossRef]
- Williams, F. (2020, August 27). Irrigation theory. https://www.landfx.com/docs/irrigation/irrigation-theory-terminology/irrigation-theory/96-irrigation-theory-and-terminology.html.
- Wu, J., Wang, J., Hui, W., Zhao, F., Wang, P., Su, C., & Gong, W. (2022, February 16). Physiology of plant responses to water stress and related genes: A Review. MDPI. https://www.mdpi.com/1999-4907/13/2/324.
- Yang, F., Cen, R., Feng, W., Liu, J., Qu, Z., & Miao, Q. (2020a, September 22). Effects of super-absorbent polymer on soil remediation and crop growth in arid and semi-arid areas. MDPI. https://www.mdpi.com/2071-1050/12/18/7825#B15-sustainability-12-07825.
- Yang, F., Cen, R., Feng, W., Liu, J., Qu, Z., & Miao, Q. (2020b, September 22). Effects of super-absorbent polymer on soil remediation and crop growth in arid and semi-arid areas. MDPI. https://www.mdpi.com/2071-1050/12/18/7825.
- Yang, Y., Wu, J., Zhao, S., Gao, C., Pan, X., Tang, D. W., & van der Ploeg, M. (2021). Effects of long-term super absorbent polymer and organic manure on soil structure and organic carbon distribution in different soil layers. Soil and Tillage Research, 206, 104781. [CrossRef]
- Zheng, H., Mei, P., Wang, W., Yin, Y., Li, H., Zheng, M., Ou, X., & Cui, Z. (2023). Effects of super absorbent polymer on crop yield, water productivity and soil properties: A global meta-analysis. Agricultural Water Management, 282, 108290. [CrossRef]
Figure 1.
Soil Texture Data.
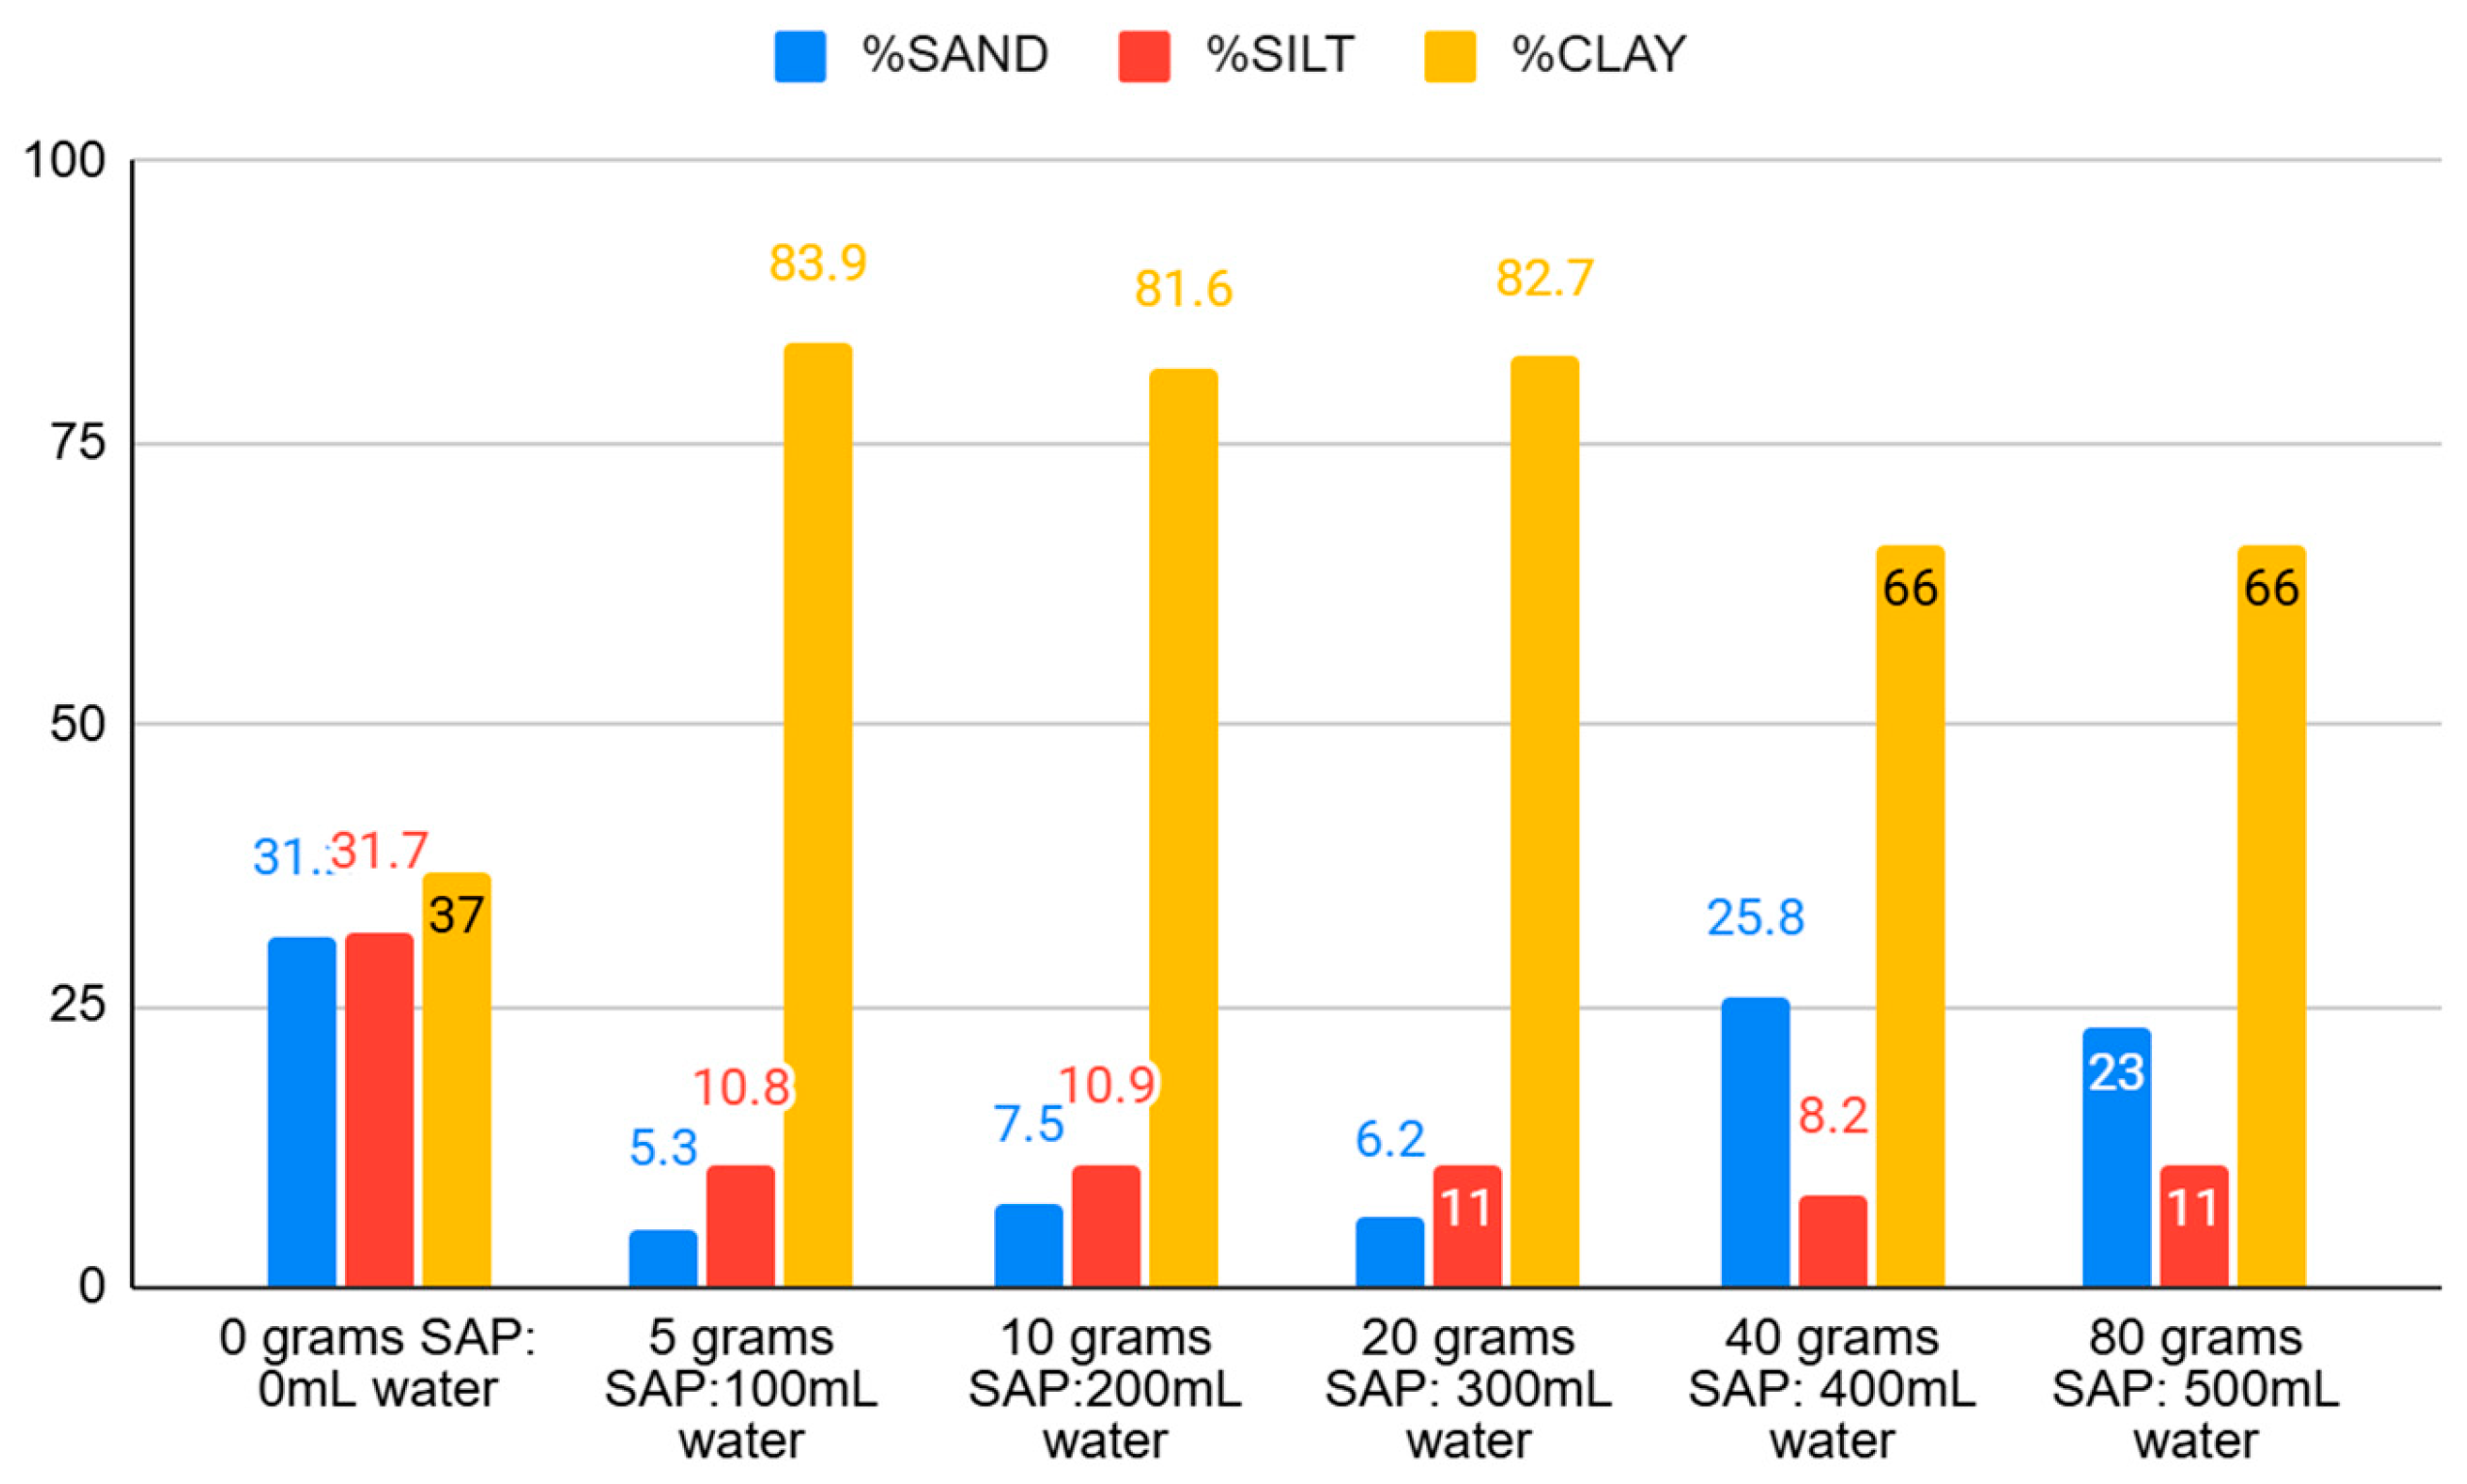
Figure 2.
Water Holding Capacity Data.
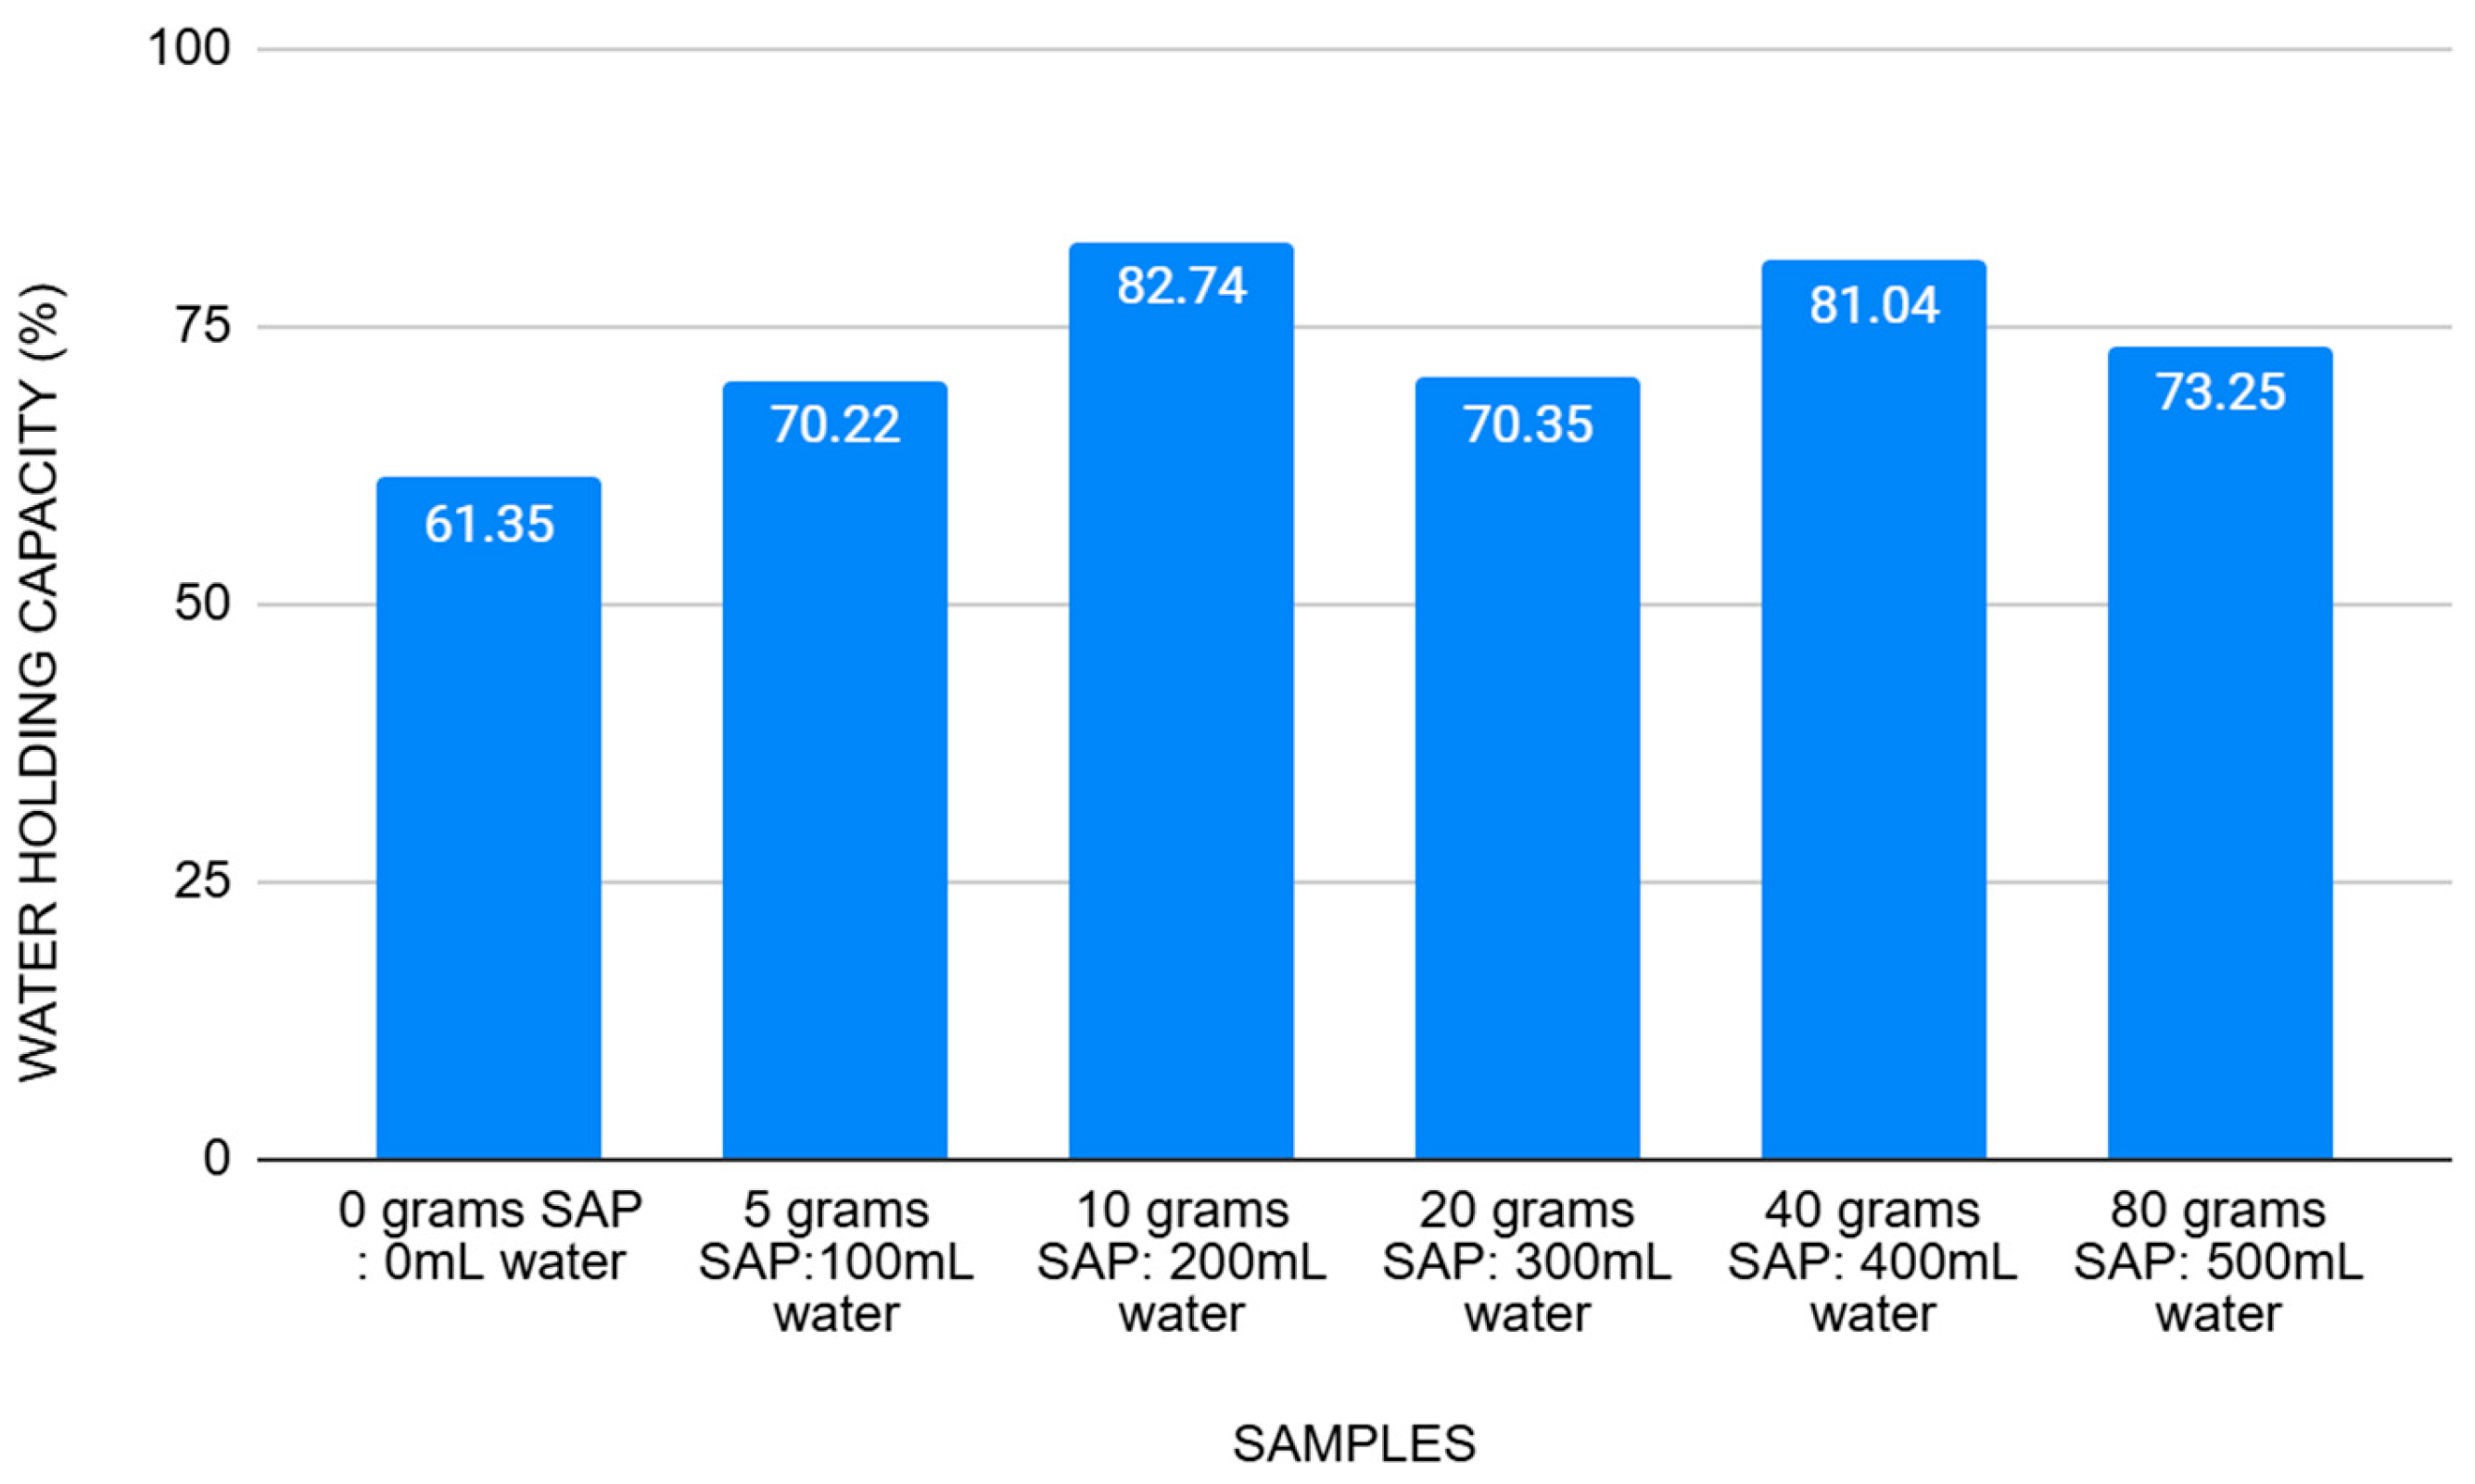
Figure 3.
pH Content Data.
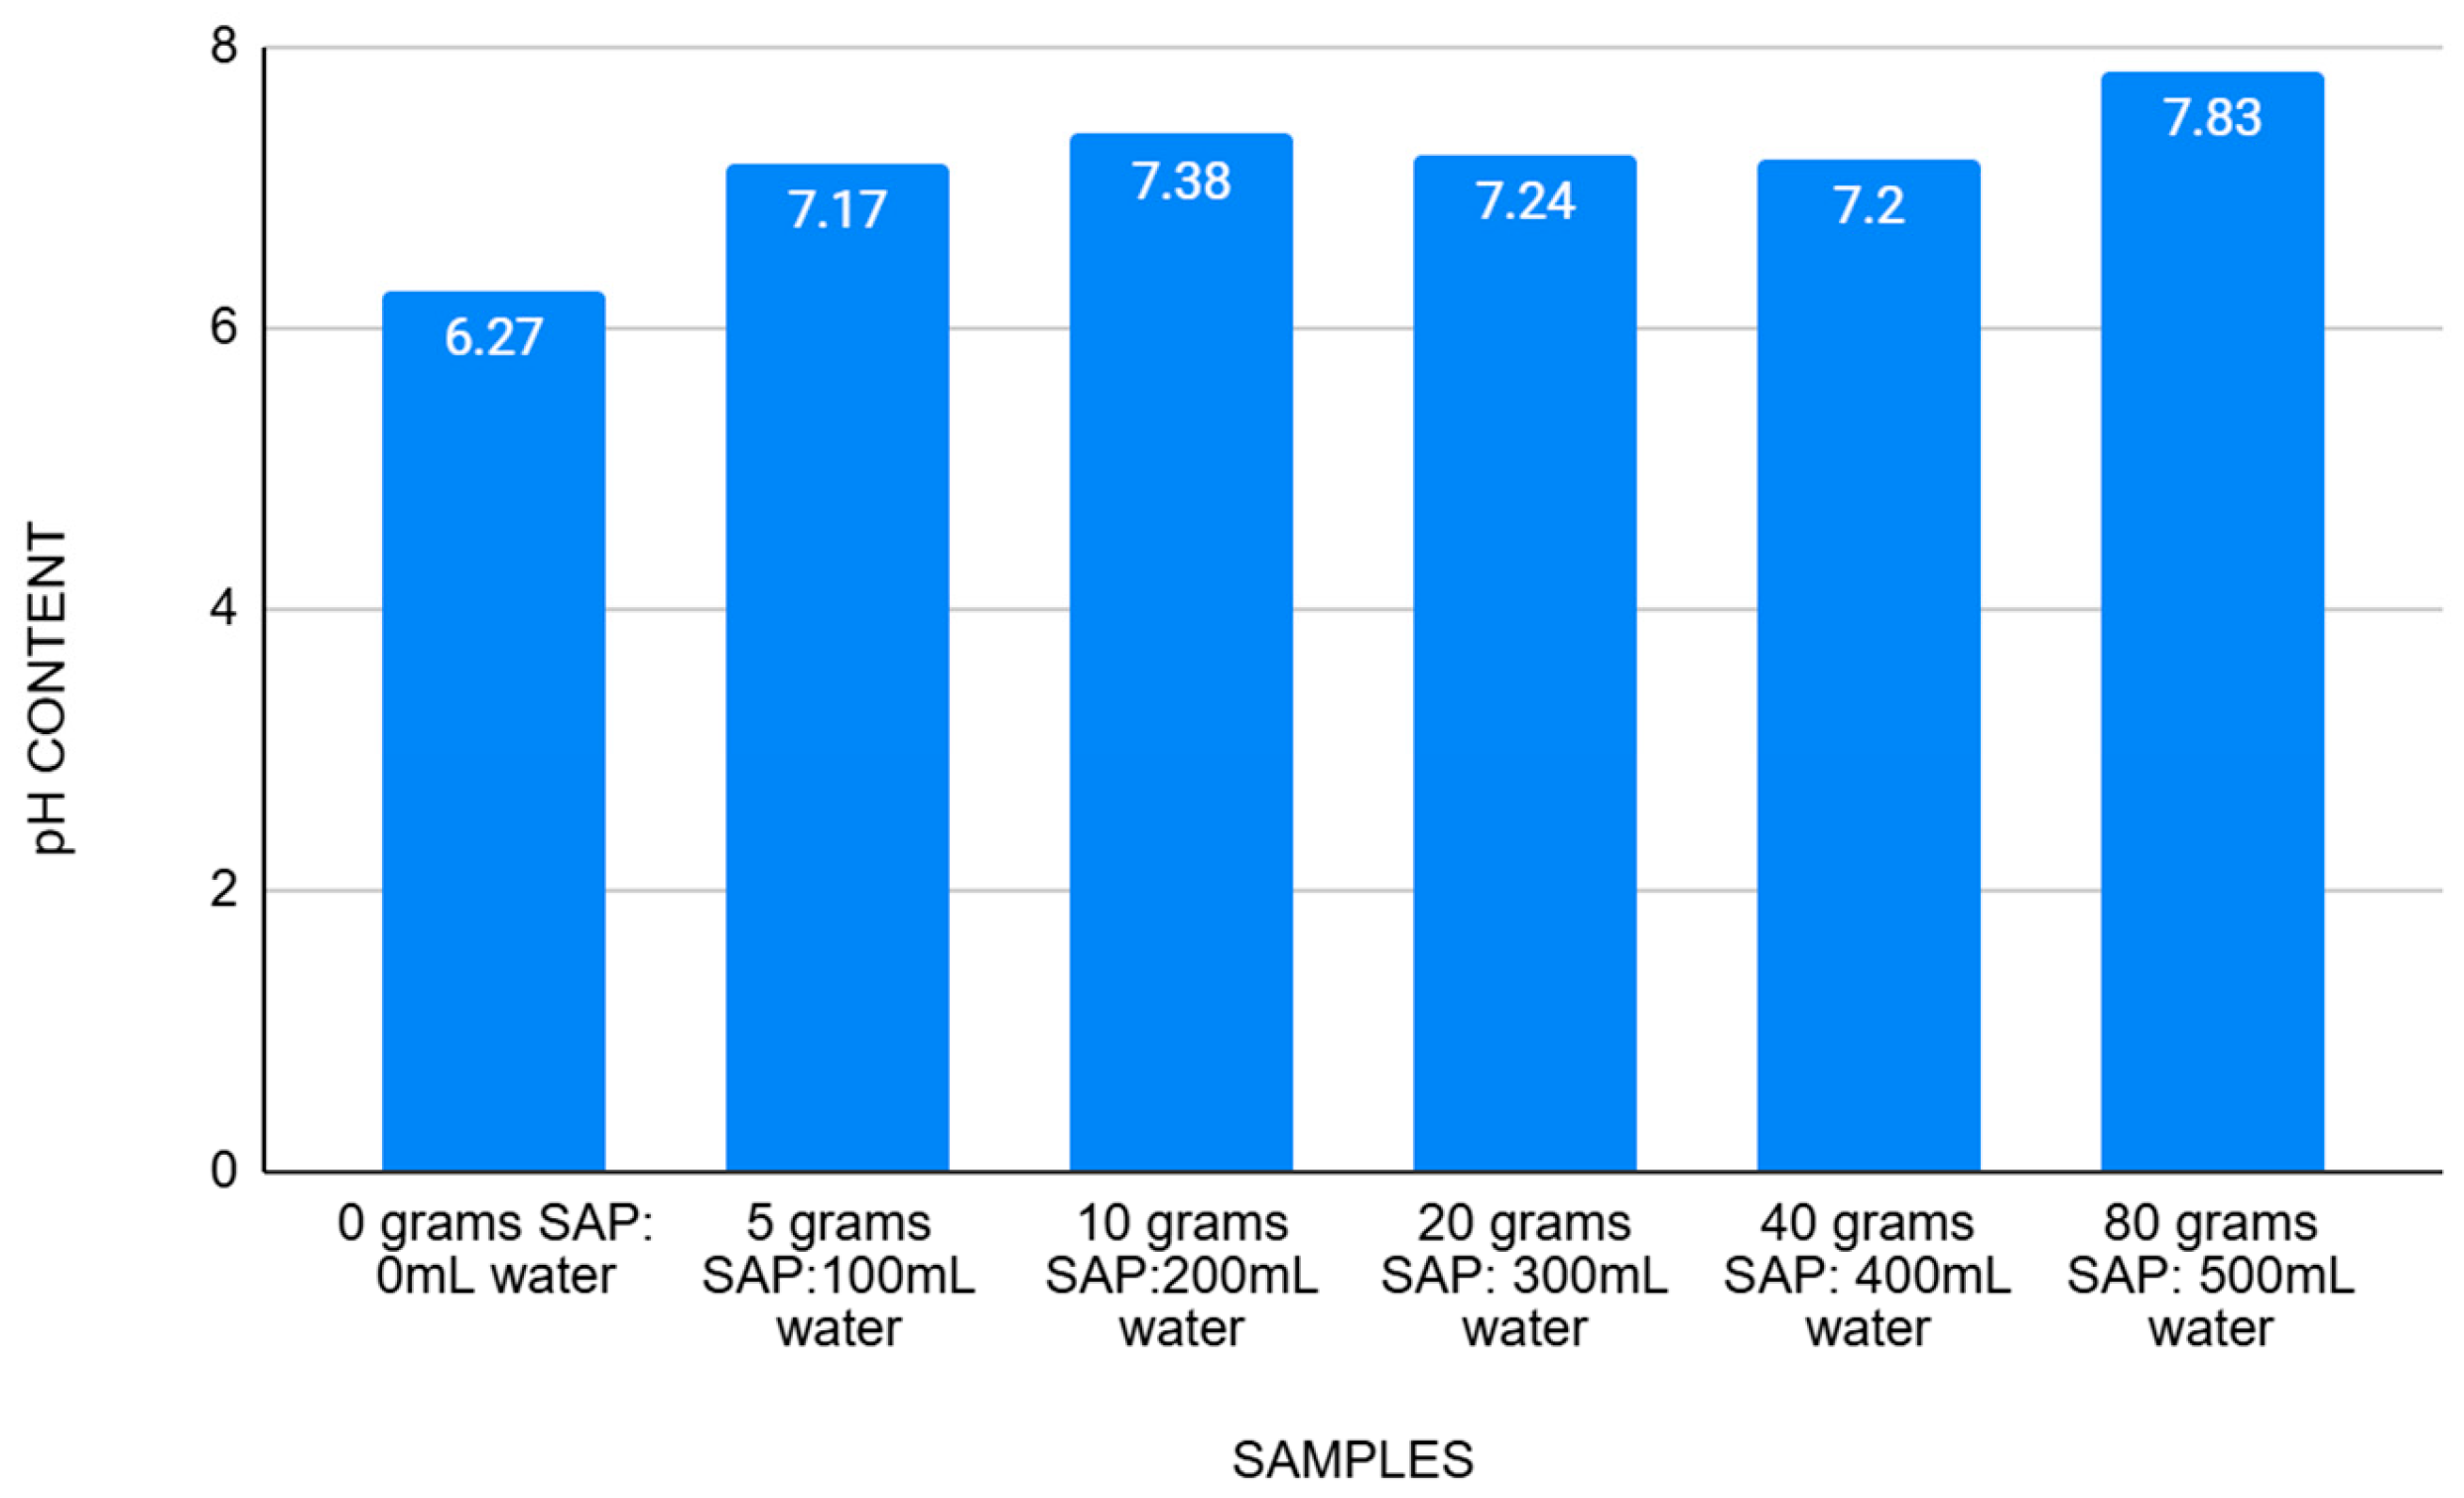
Table 1.
Research Samples.
| VARIABLES | INDEPENDENT VARIABLE | DEPENDENT VARIABLE |
| CONTROL | grams of SAP: mL of water | Soil texture, water holding capacity, pH content |
| 1 | 0 grams of SAP: 0 mL of water | Actual result of the soil texture, water holding capacity and its pH content |
| 2 | 5 grams of SAP: 100 mL of water | Actual result of the soil texture, water holding capacity and its pH content |
| 3 | 10 grams of SAP: 200 mL of water | Actual result of the soil texture, water holding capacity and its pH content |
| 4 | 20 grams of SAP: 300 mL of water | Actual result of the soil texture, water holding capacity and its pH content |
| 5 | 40 grams of SAP: 400 mL of water | Actual result of the soil texture, water holding capacity and its pH content |
| 6 | 80 grams of SAP: 500 mL of water | Actual result of the soil texture, water holding capacity and its pH content |
Table 2.
Soil Texture Data.
| NO. | SAMPLES (500 grams soil) |
%SAND | %SILT | %CLAY | TEXTURE GRADE |
|---|---|---|---|---|---|
| 1 | 0 grams SAP: 0mL water | 31.20 | 31.70 | 37.00 | CLAY LOAM |
| 2 | 5 grams SAP:100mL water | 5.30 | 10.80 | 83.90 | CLAY |
| 3 | 10 grams SAP:200mL water | 7.50 | 10.90 | 81.60 | CLAY |
| 4 | 20 grams SAP: 300mL water | 6.20 | 11.00 | 82.70 | CLAY |
| 5 | 40 grams SAP: 400mL water | 25.80 | 8.20 | 66.00 | CLAY |
| 6 | 80 grams SAP: 500mL water | 23.00 | 11.00 | 66.00 | CLAY |
Table 5.
Significant difference in the physical characteristics of soil texture when varying grams of Superabsorbent Polymer (SAP) and varying volumes in ml of water are applied.
Table 5.
Significant difference in the physical characteristics of soil texture when varying grams of Superabsorbent Polymer (SAP) and varying volumes in ml of water are applied.
| ANOVA | ||||||
| Source of Variation | SS | df | MS | F | P-value | F crit |
| Between Groups | 241341 | 4 | 60335.3 | 8.28 | 0.000213751 | 2.75871 |
| Within Groups | 182171.7 | 25 | 7286.87 | |||
| Total | 423512.7 | 29 |
Table 6.
Significant difference in the physical characteristics of soil texture when 5 grams of Superabsorbent Polymer (SAP) and 100 ml of water in 500 grams of soil are applied.
Table 6.
Significant difference in the physical characteristics of soil texture when 5 grams of Superabsorbent Polymer (SAP) and 100 ml of water in 500 grams of soil are applied.
| ANOVA | ||||||
| Source of Variation | SS | df | MS | F | P-value | F crit |
| Between Groups | 16995.5 | 4 | 4248.87 | 24.0423 | 2.23956E-06 | 3.05557 |
| Within Groups | 2650.87 | 15 | 176.724 | |||
| Total | 19646.3 | 19 |
Table 8.
Significant difference in the physical characteristics of soil texture when 20 grams of Superabsorbent Polymer (SAP) and 300ml of water in 500 grams of soil are applied.
Table 8.
Significant difference in the physical characteristics of soil texture when 20 grams of Superabsorbent Polymer (SAP) and 300ml of water in 500 grams of soil are applied.
| ANOVA | ||||||
| Source of Variation | SS | df | MS | F | P-value | F crit |
| Between Groups | 79906 | 4 | 19976.5 | 113.038 | 5.2083E-11 | 3.05557 |
| Within Groups | 2650.87 | 15 | 176.724 | |||
| Total | 82556.9 | 19 |
Table 9.
Significant difference in the physical characteristics of soil texture when 40 grams of Superabsorbent Polymer (SAP) and 400 ml of water in 500 grams of soil are applied.
Table 9.
Significant difference in the physical characteristics of soil texture when 40 grams of Superabsorbent Polymer (SAP) and 400 ml of water in 500 grams of soil are applied.
| ANOVA | ||||||
| Source of Variation | SS | df | MS | F | P-value | F crit |
| Between Groups | 139348.43 | 4 | 34837.1 | 197.127 | 9.02544E-13 | 3.05557 |
| Within Groups | 2650.8667 | 15 | 176.724 | |||
| Total | 141999.3 | 19 |
Table 10.
Significant difference in the physical characteristics of soil texture when 80 grams of Superabsorbent Polymer (SAP) and 500 ml of water in 500 grams of soil are applied.
Table 10.
Significant difference in the physical characteristics of soil texture when 80 grams of Superabsorbent Polymer (SAP) and 500 ml of water in 500 grams of soil are applied.
| ANOVA | ||||||
| Source of Variation | SS | df | MS | F | P-value | F crit |
| Between Groups | 218611 | 4 | 54652.8 | 309.254 | 3.26144E-14 | 3.05557 |
| Within Groups | 2650.87 | 15 | 176.724 | |||
| Total | 221262 | 19 |
Table 11.
Significant difference in the Water Holding Capacity when varying grams of Superabsorbent Polymer (SAP) and varying volumes in ml of water are applied.
Table 11.
Significant difference in the Water Holding Capacity when varying grams of Superabsorbent Polymer (SAP) and varying volumes in ml of water are applied.
| ANOVA | ||||||
| Source of Variation | SS | df | MS | F | P-value | F crit |
| Between Groups | 167527 | 2 | 83763.3 | 6.98685 | 0.00717 | 3.68232 |
| Within Groups | 179831 | 15 | 11988.7 | |||
| Total | 347357 | 17 |
Disclaimer/Publisher’s Note: The statements, opinions and data contained in all publications are solely those of the individual author(s) and contributor(s) and not of MDPI and/or the editor(s). MDPI and/or the editor(s) disclaim responsibility for any injury to people or property resulting from any ideas, methods, instructions or products referred to in the content. |
© 2025 by the authors. Licensee MDPI, Basel, Switzerland. This article is an open access article distributed under the terms and conditions of the Creative Commons Attribution (CC BY) license (http://creativecommons.org/licenses/by/4.0/).
Copyright: This open access article is published under a Creative Commons CC BY 4.0 license, which permit the free download, distribution, and reuse, provided that the author and preprint are cited in any reuse.


