
Submitted:
09 April 2025
Posted:
10 April 2025
You are already at the latest version
Abstract
This study evaluated the quality of pediatric-related mobile health (mHealth) applications available in Indonesia, focusing on their ability to support child growth monitoring and provide educational resources for parents and caregivers. A cross-sectional design was employed, with five healthcare professionals assessing selected apps using the Mobile App Rating Scale (MARS). The apps were identified from the Indonesian Google Play Store and Apple App Store using specific search terms related to pediatric care. Inclusion criteria required apps to be available in Bahasa Indonesia, focus on child health, and in-clude growth tracking or stunting prevention features. MARS was used to assess apps across domains such as engagement, functionality, aesthetics, and information quality. Inter-rater reliability was ensured using the Intraclass Correlation Coefficient (ICC). De-scriptive statistics, Pearson’s correlation, and T-tests were used for data analysis. The study found significant variability in the quality of the apps, highlighting strengths in some but also gaps in interactive features like feedback mechanisms and social support. This research underscores the need for higher-quality, evidence-based mHealth apps for pediatric care in Indonesia, particularly in improving user engagement and accessibility.
Keywords:
pediatric care
; stunting prevention
; assessment
; e-health
; digital health
; child health
; technology
1. Introduction
The rapid advancement of mobile health (mHealth) technologies has significantly transformed healthcare delivery worldwide, particularly in pediatric care[1]. MHealth applications offer innovative solutions for monitoring child growth, tracking developmental milestones, and providing health education to parents and caregivers[2]. These digital tools have been shown to enhance parental knowledge, improve care seeking behavior, and support early childhood development interventions[3] .
Smartphone penetration is projected to grow steadily between 2024 and 2029, with estimates suggesting it will reach 97 percent by 2029, an increase of over 15 percentage points [4]. This consistent rise in smartphone adoption highlights the expanding potential of mobile platforms to support public health interventions. In this context, digital health solutions, particularly mobile applications, are increasingly recognized as valuable tools to facilitate early detection and intervention efforts, especially in areas such as child growth monitoring and early childhood development[5].
Studies suggest that mHealth apps can improve parental awareness, increase adherence to immunization schedules, and enhance nutritional monitoring[6,7]. Several pediatric-focused mHealth apps are available in Indonesia, including PrimaKu, Asianparent, and Tentang Anak, which offer features such as child growth monitoring, vaccination tracking, and parental education. However, the effectiveness of these applications depends on their usability, engagement, and the quality of the information they provide[8].
Assessing their quality using a standardized framework, such as the Mobile App Rating Scale (MARS), is essential to ensure they meet the needs of Indonesian parents and healthcare professionals[9]. Despite the increasing adoption of mHealth applications, challenges remain in ensuring accessibility, credibility, and sustained user engagement[10]. Many existing apps focus on tracking and information dissemination but lack interactive features such as feedback mechanisms, goal-setting, and social support, which are crucial for long-term user engagement[11]. Additionally, most mHealth apps in Indonesia are developed by commercial entities, with limited contributions from government or academic institutions, raising concerns about data privacy, evidence-based content, and equitable access[12].
This study evaluates pediatric-related mHealth applications available in Indonesia, analyzing their quality using the MARS framework. By assessing key attributes such as engagement, functionality, aesthetics, and information quality, this research aims to identify strengths and gaps in the current landscape of pediatric mHealth applications by Mobile App Rating Scale (MARS).
2. Materials and Methods
2.1. Study Design
This study was designed as a cross-sectional analysis of mobile applications related to baby growth tracking, available in Indonesian app stores. No regulatory approval was required for this study. The research was conducted in accordance with The Strengthening the Reporting of Observational studies in Epidemiology (STROBE) guidelines.
2.2. Raters Selection
Five healthcare professionals were selected as raters (The data are shown in Supplementary Table S1) based on the following criteria:
Inclusion criteria:
(i) Healthcare professionals or lecturers in the health sector, and/or
(ii) Actively engaged in clinical practice in Indonesia.
Exclusion criteria:
(i) Not owning a mobile phone,
(ii) Unable to download apps from the Apple App Store or Google Play Store, and
(iii) Having hearing, visual, or motor impairments that could hinder participation.
2.3. Selection of the Pediatric-Related mHealth Apps
Researchers selected mobile applications related to pediatric care and baby growth tracking between December 1, 2024, and January 31, 2025. The search was conducted in both the Indonesian App Store (iOS) and the Indonesian Google Play Store (Android). The keywords used for the search included “pediatrik” (pediatric), “kesehatan bayi” (baby health), “stunting” (stunted growth), “pertumbuhan bayi” (baby growth), and “mengasuh anak” (parenting). Since the App Store and Google Play Store do not support the use of truncation or logical operators (AND, OR, NOT), each search term was entered separately.
To refine the selection, each researcher independently removed duplicate applications from the same app store (iOS or Android). They then compiled a unified list of apps available on both platforms to ensure accessibility for all users. After comparing their lists to verify completeness, the researchers downloaded the remaining apps to their devices and applied the inclusion criteria:
- The application must be available in Bahasa Indonesia,
- It must focus on pediatric care, and
- It must include at least one feature of baby growth tracking or stunting prevention features.
2.4. Evaluation of the Pediatric-Related Mobile Apps
2.4.1. Use of the Standardized Rating Scale for Mobile Applications
This study utilized the original English version of the Mobile App Rating Scale (MARS) for evaluation. The first component of MARS, known as “App Classification,” was assessed by two academic researchers. MARS is specifically designed to evaluate health-related mobile applications and consists of a primary section with 23 items divided into five categories (A, B, C, D, and E), along with an additional section (F) containing six items (The data are shown in supplementary Table S2). Each item on the MARS scale is rated on a 5-point Likert scale, A score of 1 indicates poor quality, while a score of 5 signifies high quality[9].
2.4.2. Evaluation of the Apps by Raters
The app evaluation was conducted by five academic health researchers. Before assessing pediatric care-related applications, the raters underwent training to familiarize themselves with the Mobile App Rating Scale (MARS). To ensure a consistent understanding of the MARS criteria, all raters participated in discussions to standardize their evaluation approach.
As part of the training, a test assessment was conducted using an app that was not included in the study sample. Each rater independently evaluated Halodoc, an app focused on general healthcare services rather than exclusively on pediatric care. The raters downloaded the app, tested its features for at least 15 minutes, and then completed the MARS assessment. Following this, they compared their scores. If any individual rating differed by 2 points or more, further discussion was held until a consensus was reached, ensuring uniformity in the evaluation process.
The formal assessment of pediatric care-related apps took place in February 2025. Each of the five raters downloaded and used each selected app for 15 minutes before completing the standardized online MARS questionnaire. During this evaluation, one application, Miki Anthropometri, was found to be unavailable and was subsequently excluded from the study.
2.5. Statistical Methods
2.5.1. Intraclass Correlation Coefficient (ICC)-Raters
Ensuring the consistency of Mobile Application Rating Scale (MARS) scores across different raters, studies have employed the Intraclass Correlation Coefficient (ICC) as the primary method for assessing inter-rater reliability. The ICC is widely used for evaluating the reliability of measurements involving multiple assessors, particularly when working with ordinal or continuous data[13,14].
A two-way random effects model with absolute agreement was chosen because it is specifically designed for situations where multiple independent raters provide evaluations, and the focus is on achieving absolute agreement rather than just relative consistency. This model effectively accounts for systematic differences among raters as well as measurement error, ensuring a more accurate assessment of reliability[15].
Since MARS scores are measured using a five-point Likert scale, the ICC serves as a robust indicator of variability across different evaluators while maintaining statistical precision. The reliability values were interpreted based on Cicchetti’s classification[16]. Guidelines, criteria, and rules of thumb for evaluating normed and standardized assessment instruments in psychology. In this study, ICC values ranged from 0.80 to 0.95, indicating a high level of agreement among the raters. These results confirm strong inter-rater reliability, ensuring that the app evaluations were consistent and reproducible[16].
2.5.2. Descriptive Analysis
Descriptive analysis was used to describe the frequency distribution of the characteristics of apps and research variables. The characteristics of the apps presented include Apps characteristics based on theoretical background and strategies, affiliation, and technical aspects of the apps. Descriptive analysis in this study presents data on the variables MARS mean scores on each mobile health apps, boxplots to display the spread and distribution of scores.
2.5.3. Statistics Methods Analysis
Pearson’s correlation was used to analyze correlation between apps and MARS variable (engagement, functionality, aesthetics, and information) with a p value of <0.05. An unpaired t-test was conducted to determine whether there was a statistically significant difference between the means of two independent groups with a p value of <0.05. In this case, the total MARS mean scores of commercial and non-commercial apps were compared to assessing whether commercial apps significantly outperformed non-commercial ones. The t-test helped determine whether the observed differences in mean scores were due to a genuine underlying effect or merely random variation.
2.5.4. Heatmap Visualization: Method and Justification
The patterns and variations in Mobile Application Rating Scale (MARS) identify by scores across different applications and rating categories, a heatmap visualization was implemented[17]. This method was selected for its ability to intuitively compare the relative performance of various applications across multiple dimensions, including engagement, functionality, aesthetics, information quality, and subjective quality.
The heatmap’s color scheme follows a gradient from cool to warm tones, reflecting the magnitude of MARS scores. Cooler colors, such as blue and green, indicate lower scores, while warmer hues, like yellow, orange, and red, represent higher scores. Through this approach, key trends such as consistently high-performing apps, areas requiring improvement, and variations across different rating sections can be effectively identified.
Additionally, the heatmap aids in recognizing consistency patterns across different evaluation criteria. For example, an application that scores consistently high across all categories will display predominantly warm tones, whereas one with mixed performance will exhibit a more varied color distribution.
3. Results
3.1. Selection of the Pediatric Care-Related Mobile Apps
A total of 13 apps in the App Store and 32 apps in the Google Play Store were identified (The data are shown in Figure 1). The duplicates were eliminated in each list. The two lists were checked, analyzing the name of the app and the developer. 10 apps were available and selected on both systems. After downloading, one app was excluded because it was unable during the assessment. Finally, nine apps were included after screening.
3.2. General characteristics of the Pediatric-Related Mobile Apps
Figure 2.
Apps characteristics based on theoretical background and strategies.
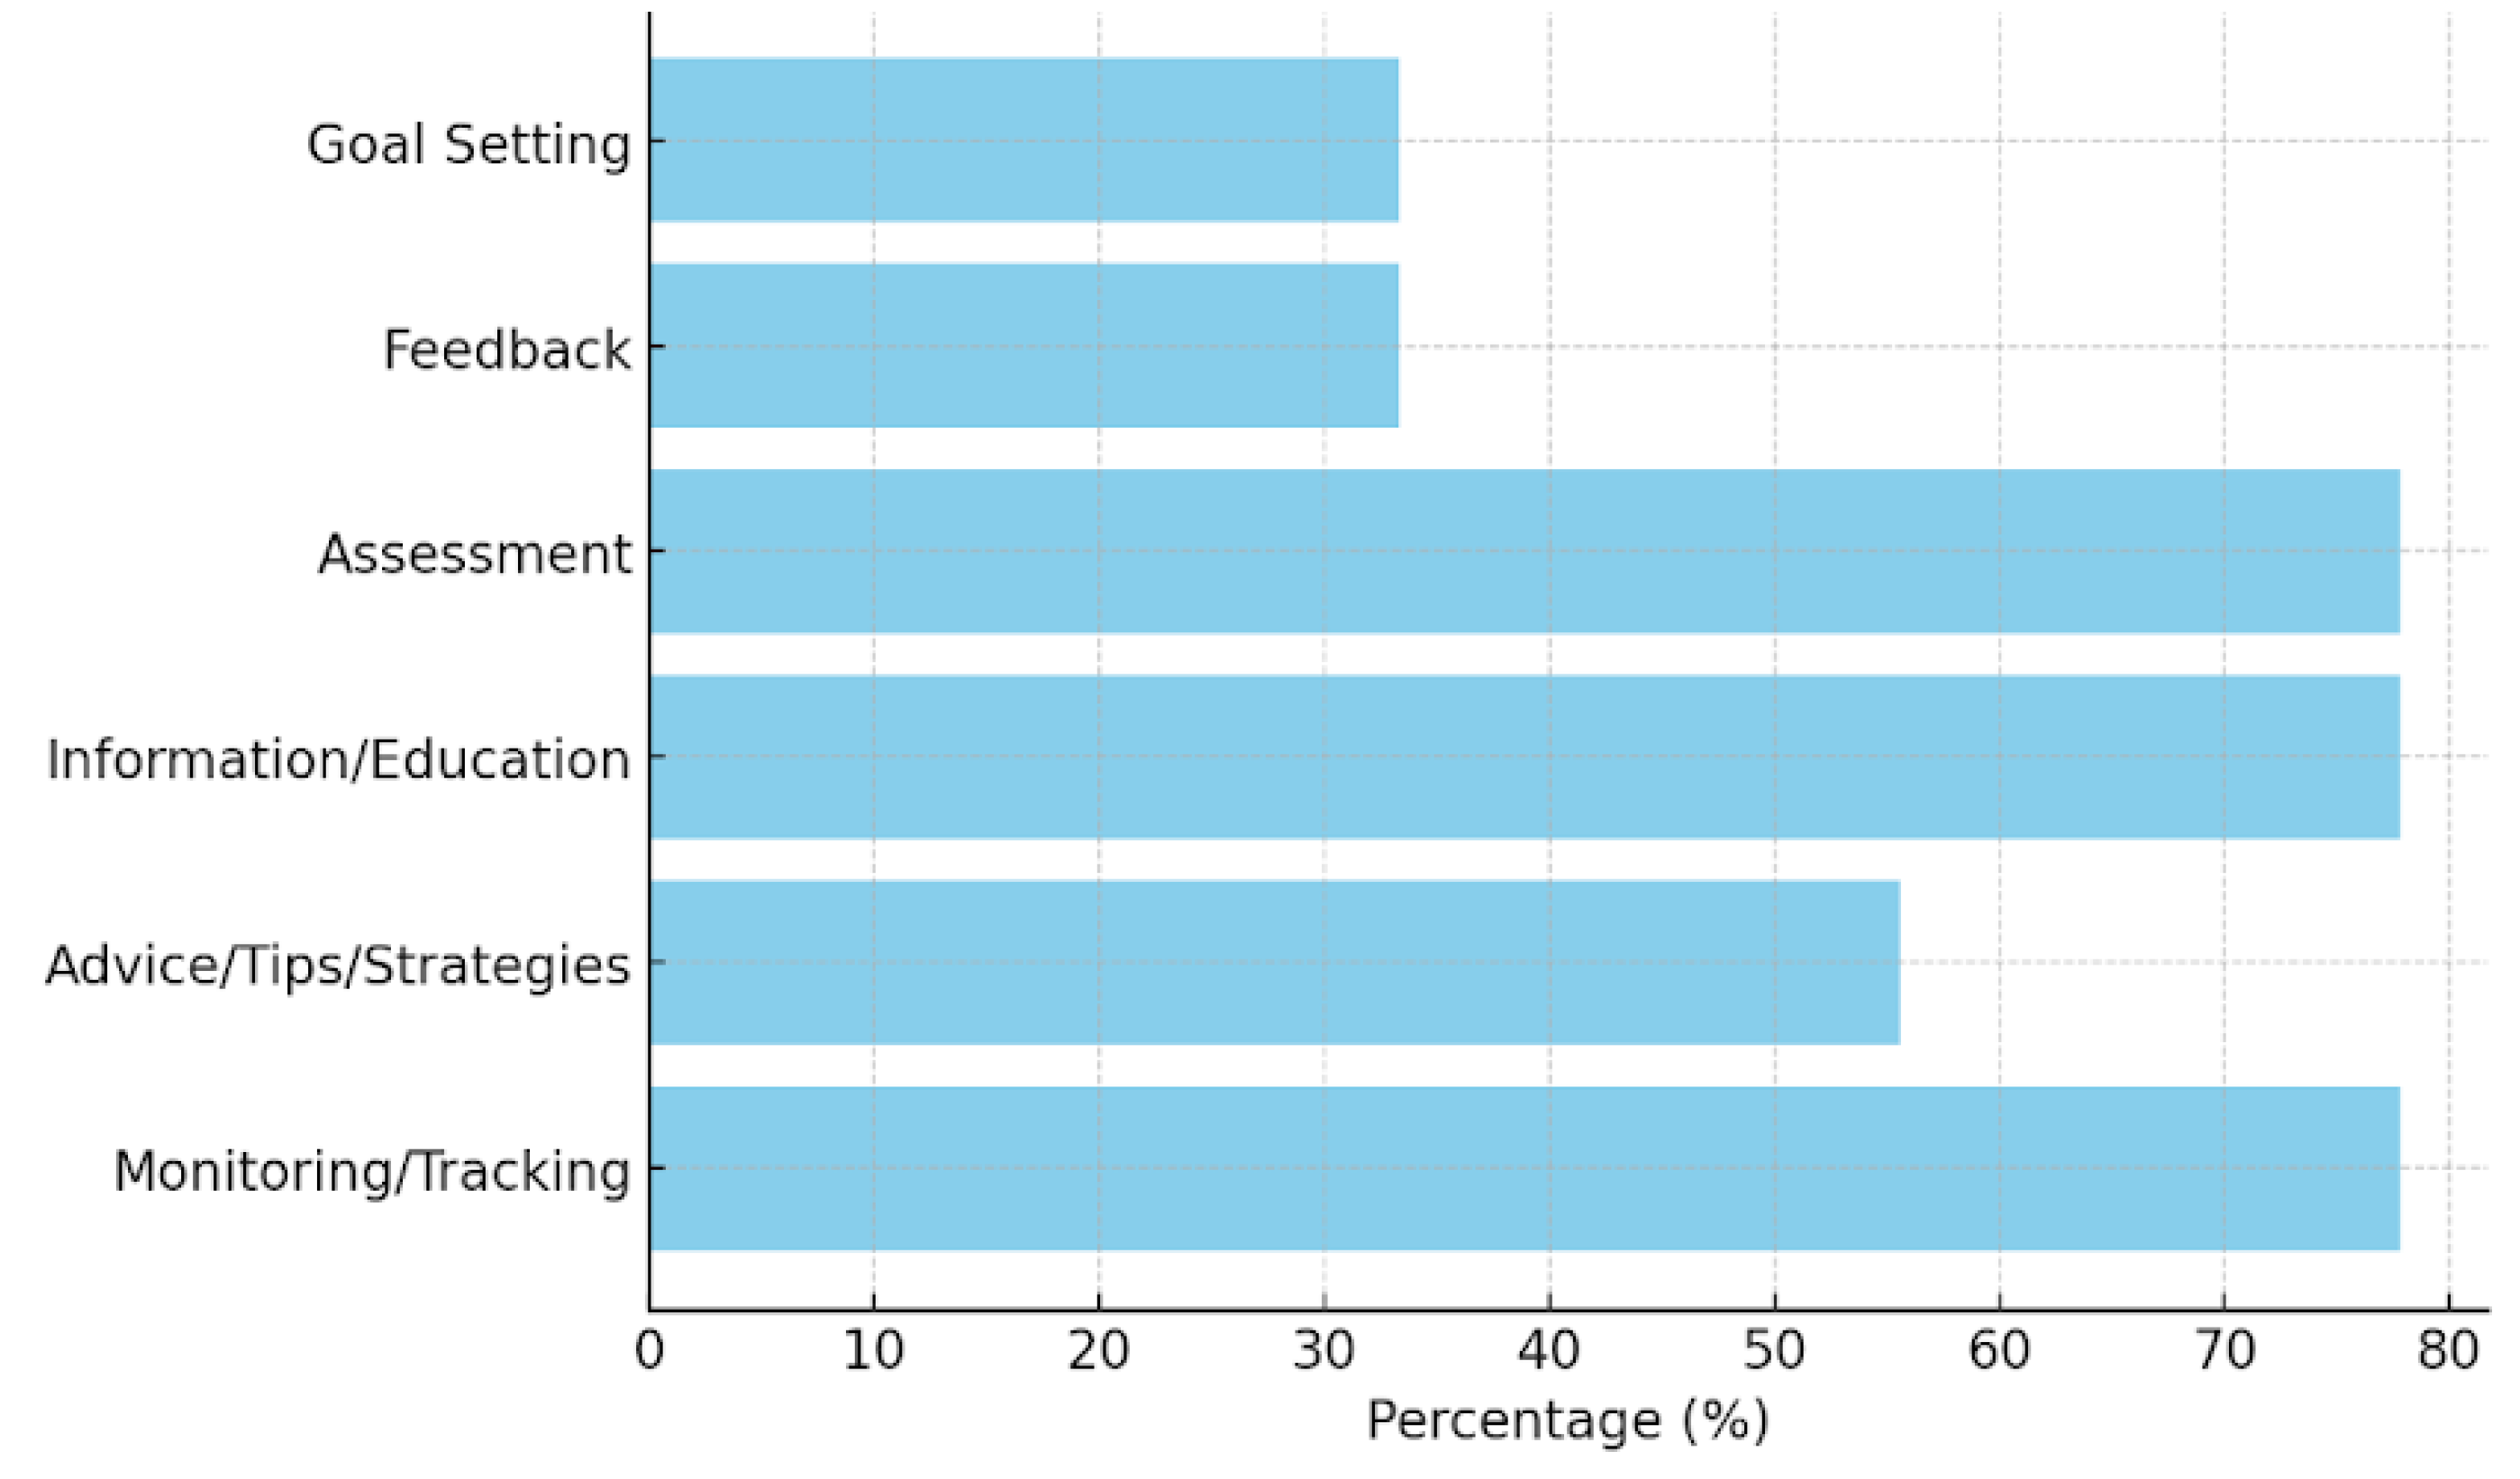
Among the nine analyzed mobile health applications (The data are shown in Figure 1) for pediatric care, a majority (77.78%) incorporate monitoring and tracking features, highlighting their primary function as tools for continuous health data collection (The data are shown in supplementary Table S3). Similarly, information and education components are present in 77.78% of the apps, indicating a strong emphasis on knowledge dissemination to caregivers and healthcare providers. Assessment capabilities are also observed in 77.78% of the applications, allowing for evaluations of child development and health status. Advice, tips, strategies, and skill training are included in 55.56% of the applications, providing users with guidance on best practices for child health and nutrition. However, fewer apps include feedback mechanisms (33.33%) or goal-setting features (33.33%), suggesting limited interactive elements for user engagement and motivation.
Based on the affiliation (The data are shown in Figure 3), most of the applications (77.78%) are commercially affiliated, while only one (11.11%) is developed by a government entity, and another (11.11%) is linked to academia. The dominance of commercial applications suggests that the market for pediatric mobile health tools is largely driven by private sector initiatives rather than public health or academic research.
Regarding technical functionalities (The data are shown in Figure 4), 66.67% of the applications provide reminder notifications, aiding users in maintaining consistent monitoring and engagement. However, only 22.22% allow for content sharing on social media platforms such as Facebook, which may limit peer support and community engagement. The majority (88.89%) require users to log in, possibly for data security and personalization purposes. Additionally, 44.44% feature an app-based community, which can enhance user engagement through peer interaction and support.
3.3. Comparison of MARS Score
Four raters evaluated and rated the 9 apps analyzed (The data are shown in supplementary Table S4). The interrater agreement between the two raters was considered good, with Kendall’s coefficient of concordance value of 0.93 and a p-value of 0.03.
The heatmap visualization highlights several key insights (The data are shown in Figure 5). Among the high performers, Asianparent and Tentang Anak stand out with consistently high scores across all sections. Their Engagement, Functionality, and Aesthetics scores are perfect 5.0, making them the most well-rounded apps. On the other hand, PSG Balita has a significantly low Engagement score of 1.40, despite achieving a high Functionality score of 5.00. Additionally, Astuti has the lowest Subjective Quality score at 1.50, indicating notable shortcomings in user perception. Examining overall trends, Functionality appears to be the most consistent category, with several apps scoring close to 5.0. Engagement, however, varies widely, with some apps excelling while others struggle. Furthermore, Information scores are generally lower than other sections, suggesting a need for more credible and high-quality content.
The descriptive statistics of the MARS scores reveal notable trends across different evaluation sections. The Engagement section has a mean score of 3.80, but with a high standard deviation of 1.17, indicating significant variability among apps. Some applications, such as Asianparent and Tentang Anak, achieve perfect scores of 5.0, whereas PSG Balita scores the lowest at 1.40, reflecting a lack of interactive and engaging features. In contrast, the Functionality section demonstrates the highest consistency, with an average score of 4.61 and a low standard deviation of 0.33. This suggests that most apps provide a well-structured user interface with reliable performance and ease of navigation.
The Aesthetics scores exhibit moderate variability, with a mean of 4.07 and a standard deviation of 0.62. While apps like Asianparent and Tentang Anak score 5.0, others, such as PSG Balita, score notably lower at 3.33, indicating some inconsistency in visual design and stylistic appeal. The Information section has an average score of 3.99, slightly lower than the other categories, with a standard deviation of 0.78. This suggests that while some apps provide high-quality, evidence-based information, others may require improvements in content credibility and comprehensiveness.
The Total MARS Mean Score across all applications is 4.12, reflecting generally positive performance; however, individual app scores range from 3.18 to 4.89, indicating some variability in overall quality. Lastly, Subjective Quality, which represents users’ perceived value of the apps, has the lowest mean score of 3.33, with the highest standard deviation of 0.98. This suggests a wide range of user experiences, with some apps being highly rated while others, such as Astuti with 1.50, facing significant user-perceived shortcomings.
The boxplot (The data are shown in Figure 6) visualization illustrates these variations, highlighting how Functionality remains consistently high across applications, while Engagement and Subjective Quality show substantial fluctuations. The histogram distributions reinforce these findings, showing that while Functionality and Aesthetics tend to cluster around higher values, Engagement and Subjective Quality display more diverse patterns, suggesting areas where improvement is needed.
3.4. Correlation Matrix MARS categories
The statistical analysis reveals key insights into the variability and relationships among different MARS categories (The data are shown in Figure 7). Engagement shows the highest variability, with a standard deviation of 1.17, indicating that user experience differs significantly across apps in terms of interactivity and appeal. In contrast, Functionality has the lowest variability (0.33), suggesting that most apps perform consistently well in usability and navigation. Aesthetics scores exhibit moderate variation (0.62), reflecting differences in visual design quality, while Information Quality also shows moderate variability (0.77), indicating that credibility and the depth of health information vary across apps.
The correlation analysis highlights a strong positive correlation (0.89) between Engagement and Information Quality, suggesting that apps that successfully engage users also tend to provide high-quality and credible health information. However, the weakest correlation (-0.33) is observed between Functionality and Information Quality, indicating that a well-functioning app does not necessarily offer reliable medical content. This finding underscores the importance of balancing technical usability with medical accuracy, as strong functionality alone does not guarantee trustworthy health information. Developers should focus on enhancing both user experience and content credibility to ensure effective and reliable mobile health applications.
3.6. Behavioral Outcomes Result
The data (The data are shown in Figure 8) showing the average score per behavioral category across all apps. Highest scoring categories: Awareness and Help Seeking (both averaging ~3.78). Lowest scoring: Behavior Change (~2.89), suggesting this is the area most apps have a lowest score (The data are shown in supplementary Table S5).
The analysis of behavioral outcomes among mobile health applications highlights significant variations in their effectiveness. Asianparent and Tentang Anak consistently achieve the highest scores across all categories (The data are shown in Figure 9), demonstrating strong performance in raising awareness, enhancing knowledge, shaping positive attitudes, encouraging intention to change, promoting help-seeking behavior, and driving actual behavior change. Imuni, Primaku, KMS Bunda dan Balita, and Teman Bumil show relatively strong results, particularly in help-seeking and behavior change, but do not reach the top-tier performance of Asianparent and Tentang Anak. On the other hand, PSG Balita and Astuti exhibit the weakest influence, with lower scores in key areas such as attitudes, intention to change, and behavior change, suggesting limited effectiveness in fostering health-related improvements. These findings indicate that while certain apps successfully drive user engagement and behavioral change, others may require enhancements in content, usability, and intervention strategies to maximize their impact.
3.7. Comercial vs non commercial app
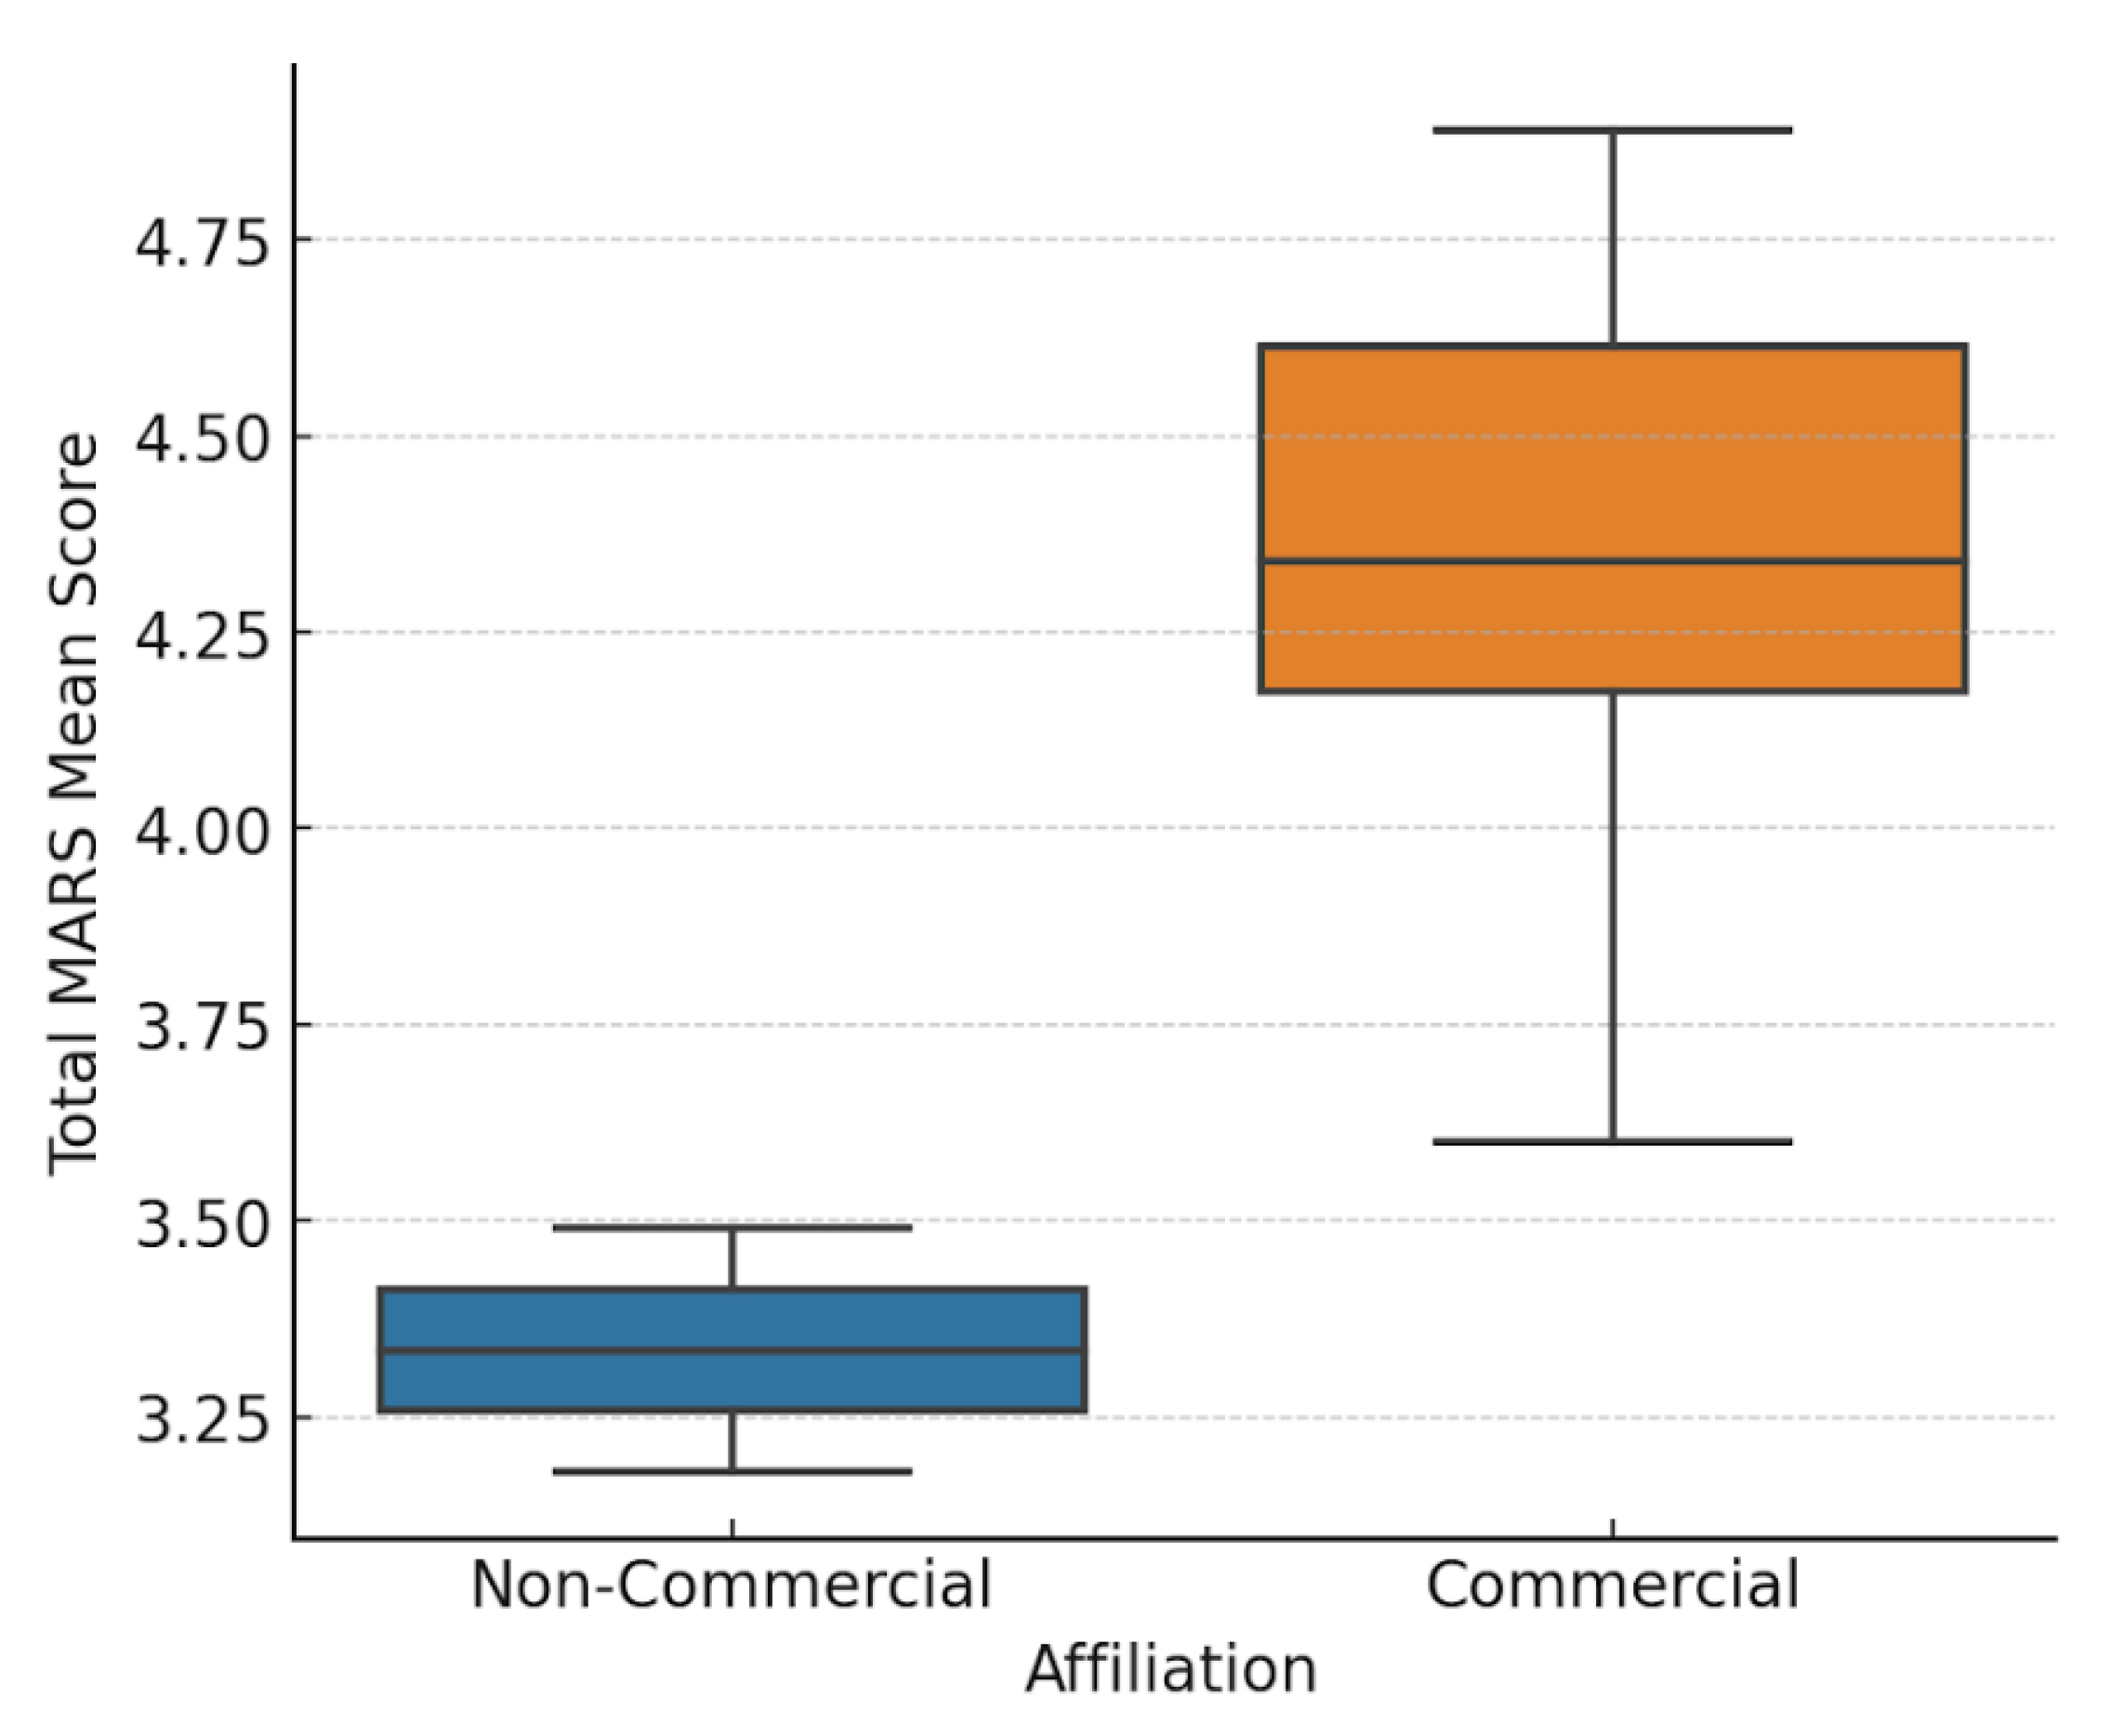
An independent t-test was conducted to compare the total MARS Mean scores between Commercial and Non-Commercial apps (The data are shown in Figure 10). The results show a statistically significant difference between the two groups, with a t-statistic of 4.36 and a p-value of 0.012 (p < 0.05), indicating that commercial apps tend to perform significantly better than non-commercial apps. Commercial apps have a significantly higher mean MARS score (4.34) compared to Non-Commercial apps (3.34). The p-value (< 0.05) suggests that this difference is statistically significant, meaning the likelihood that this result occurred by chance is low. This finding suggests that commercial apps may have better resources, design, and engagement strategies, leading to higher overall quality.
4. Discussion
The comprehensive analysis provided insights into their functionality, design quality, engagement features, behavioral outcomes, and credibility of information. The findings demonstrate a wide variation in app quality, with clear patterns emerging between commercial and non-commercial apps. The analysis revealed that functionality remains a strong aspect across most apps, with a high mean score (4.61) and low variability. This indicates developers, particularly in commercial sectors, prioritize user-friendly interfaces, efficient navigation, and minimal technical glitches. This aligns with previous research that highlights usability as a critical factor in app adoption and sustained usage[18].
However, usability alone does not equate to effectiveness in health communication or behavior change. One of the most striking findings was the high variability in engagement scores (mean = 3.80, SD = 1.17), which underscores disparities in how different apps maintain user interest. Apps such as Asianparent and Tentang Anak demonstrated strong engagement through features such as gamified content, push notifications, and community forums. This correlates with findings by Stoyanov study, which emphasized the significance of interactivity and tailored content in promoting continued use of health apps. On the opposite end, PSG Balita scored poorly, showing that technical performance without engaging elements is insufficient to keep users actively involved[9].
A closer look at information quality reveals another critical gap. Despite the high aesthetic and functional scores, several apps lacked well-sourced or expert-reviewed content. This confirmed concerns raised by earlier studies that many commercially popular apps do not adhere to clinical guidelines or transparency regarding content origin[19,20]. The weak correlation (-0.33) between functionality and information quality in our data further underscores that a well-functioning app may still be inadequate in delivering trustworthy health information. This concerns pediatric health, where misinformation can have serious consequences for child development and public health outcomes[21].
Another important finding was the correlation between engagement and information quality (r = 0.89), suggesting that apps that are engaging also tend to present more credible information. This might be due to better resourcing or more holistic development strategies in commercially successful apps. It also supports theories from behavior change models, such as the COM-B framework (Capability, Opportunity, Motivation, and Behavior), which emphasized that both cognitive engagement and access to credible information are necessary to initiate and sustain behavioral change[22].
In terms of behavioral outcomes, apps performed moderately well in raising awareness and promoting help-seeking behavior but struggled with initiating long-term behavioral change. The average score for behavior change was the lowest among categories (mean = 2.89). This echoes similar findings by Zhao[23], who observed that many health apps fail to include evidence-based behavior change techniques (BCTs), such as goal setting, feedback loops, and rewards, that are critical for sustained impact. Given the burden of child malnutrition and stunting in Indonesia, the lack of BCTs significantly limits the apps’ utility in public health interventions.
The comparative analysis between commercial and non-commercial apps revealed statistically significant differences in quality (p = 0.012), with commercial apps outperforming their counterparts in nearly all MARS categories. While this may be attributed to higher budgets, access to better design tools, and more aggressive user-testing, it raises ethical and equity concerns. Users from lower socioeconomic backgrounds may have limited access to premium features or may be exposed to advertisements and data privacy risks. This supports arguments by Meyer that commercial models in child-focused mHealth may undermine public trust and dilute educational value [24].
Despite providing valuable insights, this study has some limitations. First, the MARS evaluation, while comprehensive, remains a subjective assessment that may not fully capture long-term behavioral outcomes. Future research should incorporate longitudinal studies to evaluate the sustained impact of these apps on child health behaviors. Additionally, user demographics, incorporate with digital health literacy, should be explored further to determine how they influence engagement and app effectiveness, as suggested in prior research.
5. Conclusions
This study applied the MARS framework to assess the quality and behavioral potential of nine pediatric mHealth applications in Indonesia. While many apps demonstrate strengths in functionality and aesthetics, significant gaps remain in engagement, information credibility, and behavioral impact. Commercial apps outperformed non-commercial ones, yet their dominance also raises concerns about equity and public interest.
To optimize the role of mHealth in reducing child stunting and improving pediatric care in Indonesia, future interventions must strike a balance between user-centered design and evidence-based health content. Multi-sectoral collaboration between developers, public health authorities, and academic institutions will be essential to develop inclusive, high-impact apps that not only inform but transform caregiver behavior and health outcomes.
Supplementary Materials
The following supporting information can be downloaded at the website of this paper posted on Preprints.org, Table S1, Table S2, Table S3, Table S4, Table S5.
Author Contributions
“Conceptualization: A.S.I. and A.D.A. Data curation: A.S.I. and N.A. Formal analysis: A.S.I., R.D.L., and A.P.M. Funding acquisition: A.S.I. Investigation: A.S.I., R.D.L., A.D.A., N.A., and A.P.M. Methodology: A.S.I., R.D.L., and N.A. Resources: A.S.I. Software: A.S.I. Supervision: B.D. and E.G. Validation: N.A. and A.V.M. Visualization: A.S.I. and N.A. Writing – original draft: A.S.I., A.D.A., N.A., and A.P.M. Writing – review & editing: A.V.M., B.D., and E.G.”.
Funding
Tempus Foundation, Stipendium Hungaricum, Hungary.
Data Availability Statement
All data and source code can be made available after the manuscript publication on reasonable request, which must include an appropriate protocol, analysis plan, and data exchange with institutional approvals in place before data transfer of any information.
Acknowledgments
We would like to express our heartfelt gratitude to the Institute of Behavioral Sciences at Semmelweis University for their invaluable academic support, insightful discussions, and continuous encouragement throughout the course of this study. Their contributions significantly enriched the depth and quality of our research.
Conflicts of Interest
No conflict of interest.
Abbreviations
The following abbreviations are used in this manuscript:
| mHealth | Mobile Health |
| MARS | Mobile App Rating Scale |
| ICC | Intraclass Correlation Coefficient |
| STROBE COM-B |
The Strengthening the Reporting of Observational studies in Epidemiology guidelines. Capability, Opportunity, Motivation, and Behavior |
| BCTs | based behavior change techniques |
References
- Wang, J.-W.; Zhu, Z.; Shuling, Z.; Fan, J.; Jin, Y.; Gao, Z.-L.; Chen, W.-D.; Li, X. Effectiveness of mHealth App–Based Interventions for Increasing Physical Activity and Improving Physical Fitness in Children and Adolescents: Systematic Review and Meta-Analysis. JMIR Mhealth Uhealth 2024, 12, e51478. [CrossRef]
- Lee, J.; Su, Z.; Chen, Y. Mobile Apps for Children’s Health and Wellbeing: Design Features and Future Opportunities. (1942-597X (Electronic)). From 2023.
- Lee, S. H.; Nurmatov, U. B.; Nwaru, B. I.; Mukherjee, M.; Grant, L.; Pagliari, C. Effectiveness of mHealth interventions for maternal, newborn and child health in low- and middle-income countries: Systematic review and meta-analysis. (2047-2978 (Print)). From 2016 Jun.
- UNESCO. Global Education Monitoring Report 2023: Technology in education – A tool on whose terms?; Unesco, 2023. [CrossRef]
- Rinawan, F. R.; Susanti, A. I.; Amelia, I.; Ardisasmita, M. N.; Widarti; Dewi, R. K.; Ferdian, D.; Purnama, W. G.; Purbasari, A. Understanding mobile application development and implementation for monitoring Posyandu data in Indonesia: a 3-year hybrid action study to build “a bridge” from the community to the national scale. BMC Public Health 2021, 21 (1), 1024. [CrossRef]
- Kabongo, E. M.; Mukumbang, F. C.; Delobelle, P.; Nicol, E. Explaining the impact of mHealth on maternal and child health care in low- and middle-income countries: a realist synthesis. BMC Pregnancy and Childbirth 2021, 21 (1), 196. [CrossRef]
- Liu, C.; Zhu, Q.; Holroyd, K.; Seng, E. Status and trends of mobile-health applications for iOS devices: A developer’s perspective. Journal of Systems and Software 2011, 84, 2022-2033. [CrossRef]
- Nurhaeni, N.; Chodidjah, S.; Adawiyah, R.; Astuti. Using a mobile application (“PrimaKu”) to promote childhood immunization in Indonesia: A cross-sectional study. Belitung Nurs J 2021, 7 (4), 329-335. [CrossRef]
- Stoyanov, S. A.-O.; Hides L Auid- Orcid: --- Fau - Kavanagh, D. J.; Kavanagh Dj Auid- Orcid: --- Fau - Zelenko, O.; Zelenko O Auid- Orcid: --- Fau - Tjondronegoro, D.; Tjondronegoro D Auid- Orcid: --- Fau - Mani, M.; Mani, M. A.-O. Mobile app rating scale: a new tool for assessing the quality of health mobile apps. (2291-5222 (Print)). From 2015 Mar 11.
- Bakker, D.; Kazantzis, N.; Rickwood, D.; Rickard, N. Mental Health Smartphone Apps: Review and Evidence-Based Recommendations for Future Developments. JMIR Mental Health 2016, 3 (1), e7. [CrossRef]
- Moungui, H. C.; Nana-Djeunga, H. C.; Anyiang, C. F.; Cano, M.; Ruiz Postigo, J. A.; Carrion, C. Dissemination Strategies for mHealth Apps: Systematic Review. JMIR Mhealth Uhealth 2024, 12, e50293. [CrossRef]
- Morse, S. S.; Murugiah, M. K.; Soh, Y. C.; Wong, T. W.; Ming, L. C. Mobile Health Applications for Pediatric Care: Review and Comparison. (2168-4804 (Electronic)). From 2018 May.
- Bartoš, F.; Martinková, P.; Brabec, M. Testing Heterogeneity in Inter-Rater Reliability. In Quantitative Psychology, Cham, 2020//, 2020; Wiberg, M., Molenaar, D., González, J., Böckenholt, U., Kim, J.-S., Eds.; Springer International Publishing: pp 347-364.
- Domhardt, M.; Messner, E.-M.; Eder, A.-S.; Engler, S.; Sander, L. B.; Baumeister, H.; Terhorst, Y. Mobile-based interventions for common mental disorders in youth: a systematic evaluation of pediatric health apps. Child and Adolescent Psychiatry and Mental Health 2021, 15 (1), 49. [CrossRef]
- Kimel, M.; Revicki, D. Inter-rater Reliability. In Encyclopedia of Quality of Life and Well-Being Research, Maggino, F. Ed.; Springer International Publishing, 2023; pp 3626-3628.
- Cicchetti, D. V. Guidelines, Criteria, and Rules of Thumb for Evaluating Normed and Standardized Assessment Instruments in Psychology. Psychological Assessment 1994, (6), 284-290. [CrossRef]
- Terhorst, Y.; Philippi, P.; Sander, L. B.; Schultchen, D.; Paganini, S.; Bardus, M.; Santo, K.; Knitza, J.; Machado, G. C.; Schoeppe, S.; et al. Validation of the Mobile Application Rating Scale (MARS). PLOS ONE 2020, 15 (11), e0241480. [CrossRef]
- Palos-Sanchez, P. A.-O.; Saura, J. A.-O.; Rios Martin MÁ, A.-O.; Aguayo-Camacho, M. A.-O. Toward a Better Understanding of the Intention to Use mHealth Apps: Exploratory Study. (2291-5222 (Electronic)). From 2021 Sep 9.
- Huckvale, K.; Prieto, J. T.; Tilney, M.; Benghozi, P.-J.; Car, J. Unaddressed privacy risks in accredited health and wellness apps: a cross-sectional systematic assessment. BMC Medicine 2015, 13 (1), 214. [CrossRef]
- Martínez-Pérez, B.; de la Torre-Díez, I.; López-Coronado, M. Mobile Health Applications for the Most Prevalent Conditions by the World Health Organization: Review and Analysis. J Med Internet Res 2013, 15 (6), e120. [CrossRef]
- Buijink, A. W. G.; Visser, B. J.; Marshall, L. Medical apps for smartphones: lack of evidence undermines quality and safety. Evidence Based Medicine 2013, 18 (3), 90. [CrossRef]
- Michie, S.; van Stralen, M. M.; West, R. The behaviour change wheel: A new method for characterising and designing behaviour change interventions. Implementation Science 2011, 6 (1), 42. [CrossRef]
- Zhao, J. A.-O.; Freeman, B. A.-O.; Li, M. A.-O. Can Mobile Phone Apps Influence People’s Health Behavior Change? An Evidence Review. (1438-8871 (Electronic)). From 2016 Oct 31.
- Meyer, C. L.; Surmeli, A.; Hoeflin Hana, C.; Narla, N. P. Perceptions on a mobile health intervention to improve maternal child health for Syrian refugees in Turkey: Opportunities and challenges for end-user acceptability. Frontiers in Public Health 2022, 10, Original Research.
Figure 1.
Flowchart of the pediatric care mobile apps selection.
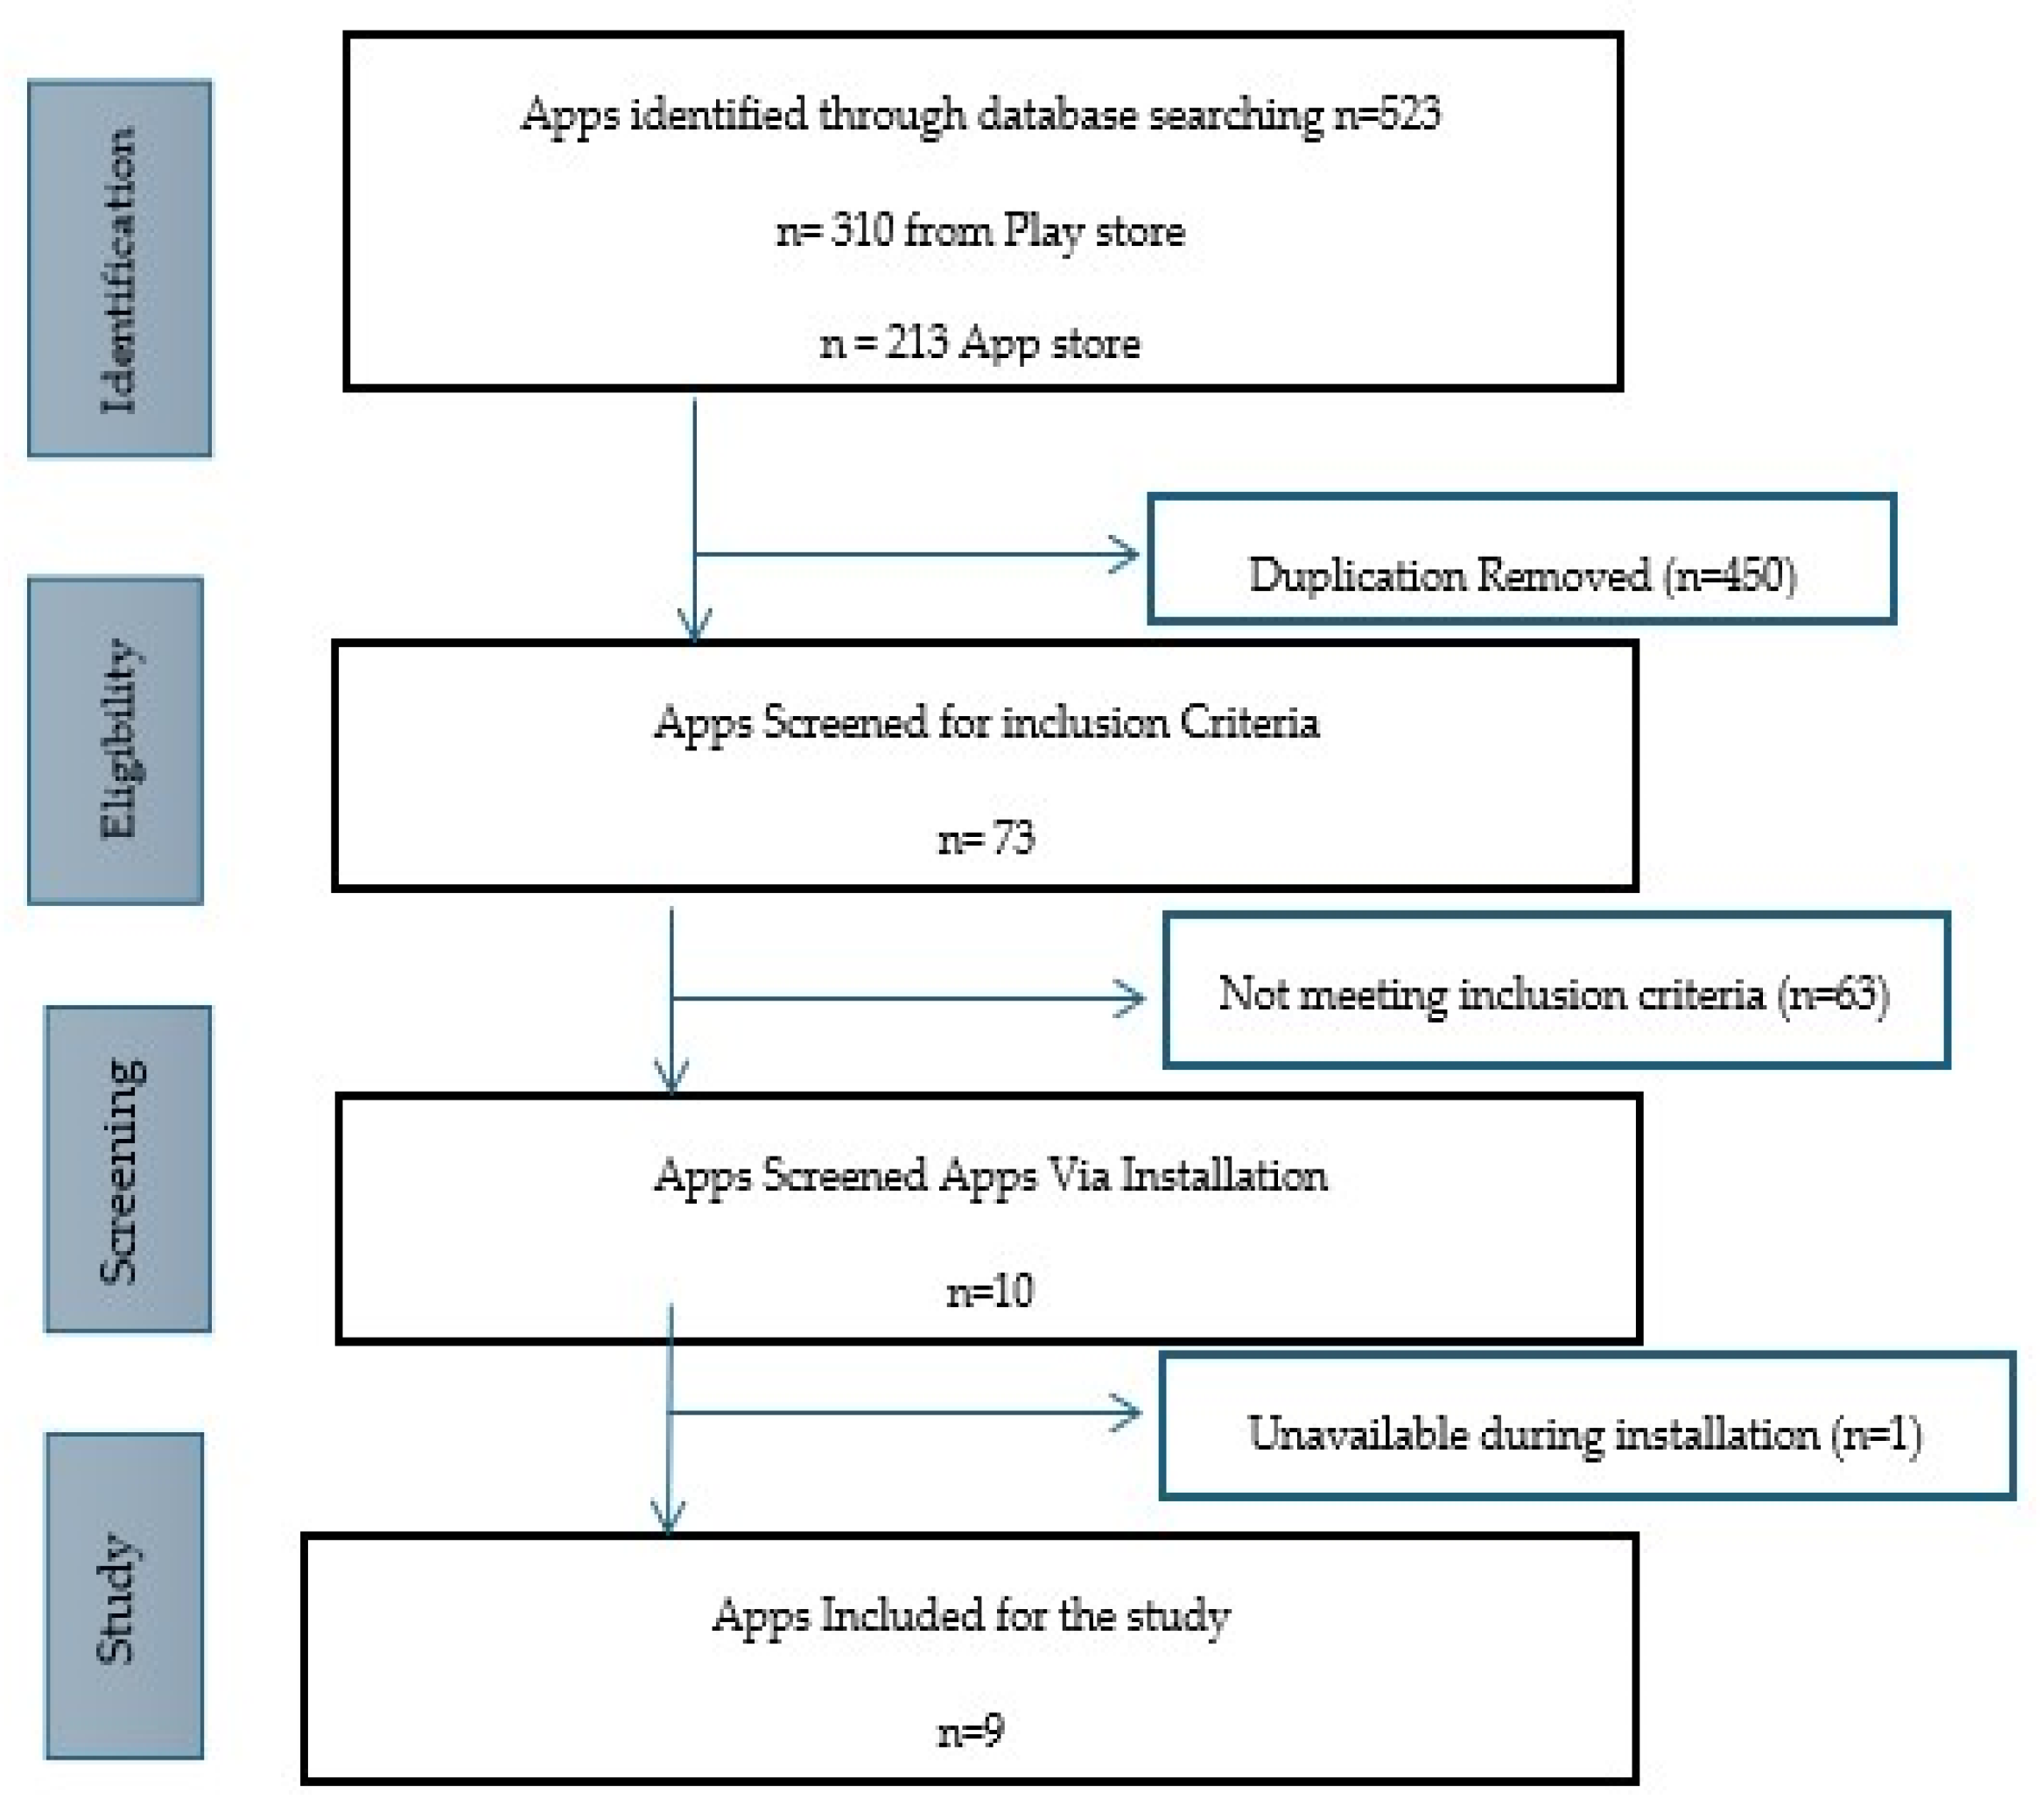
Figure 3.
Apps Characteristics based on affiliation.
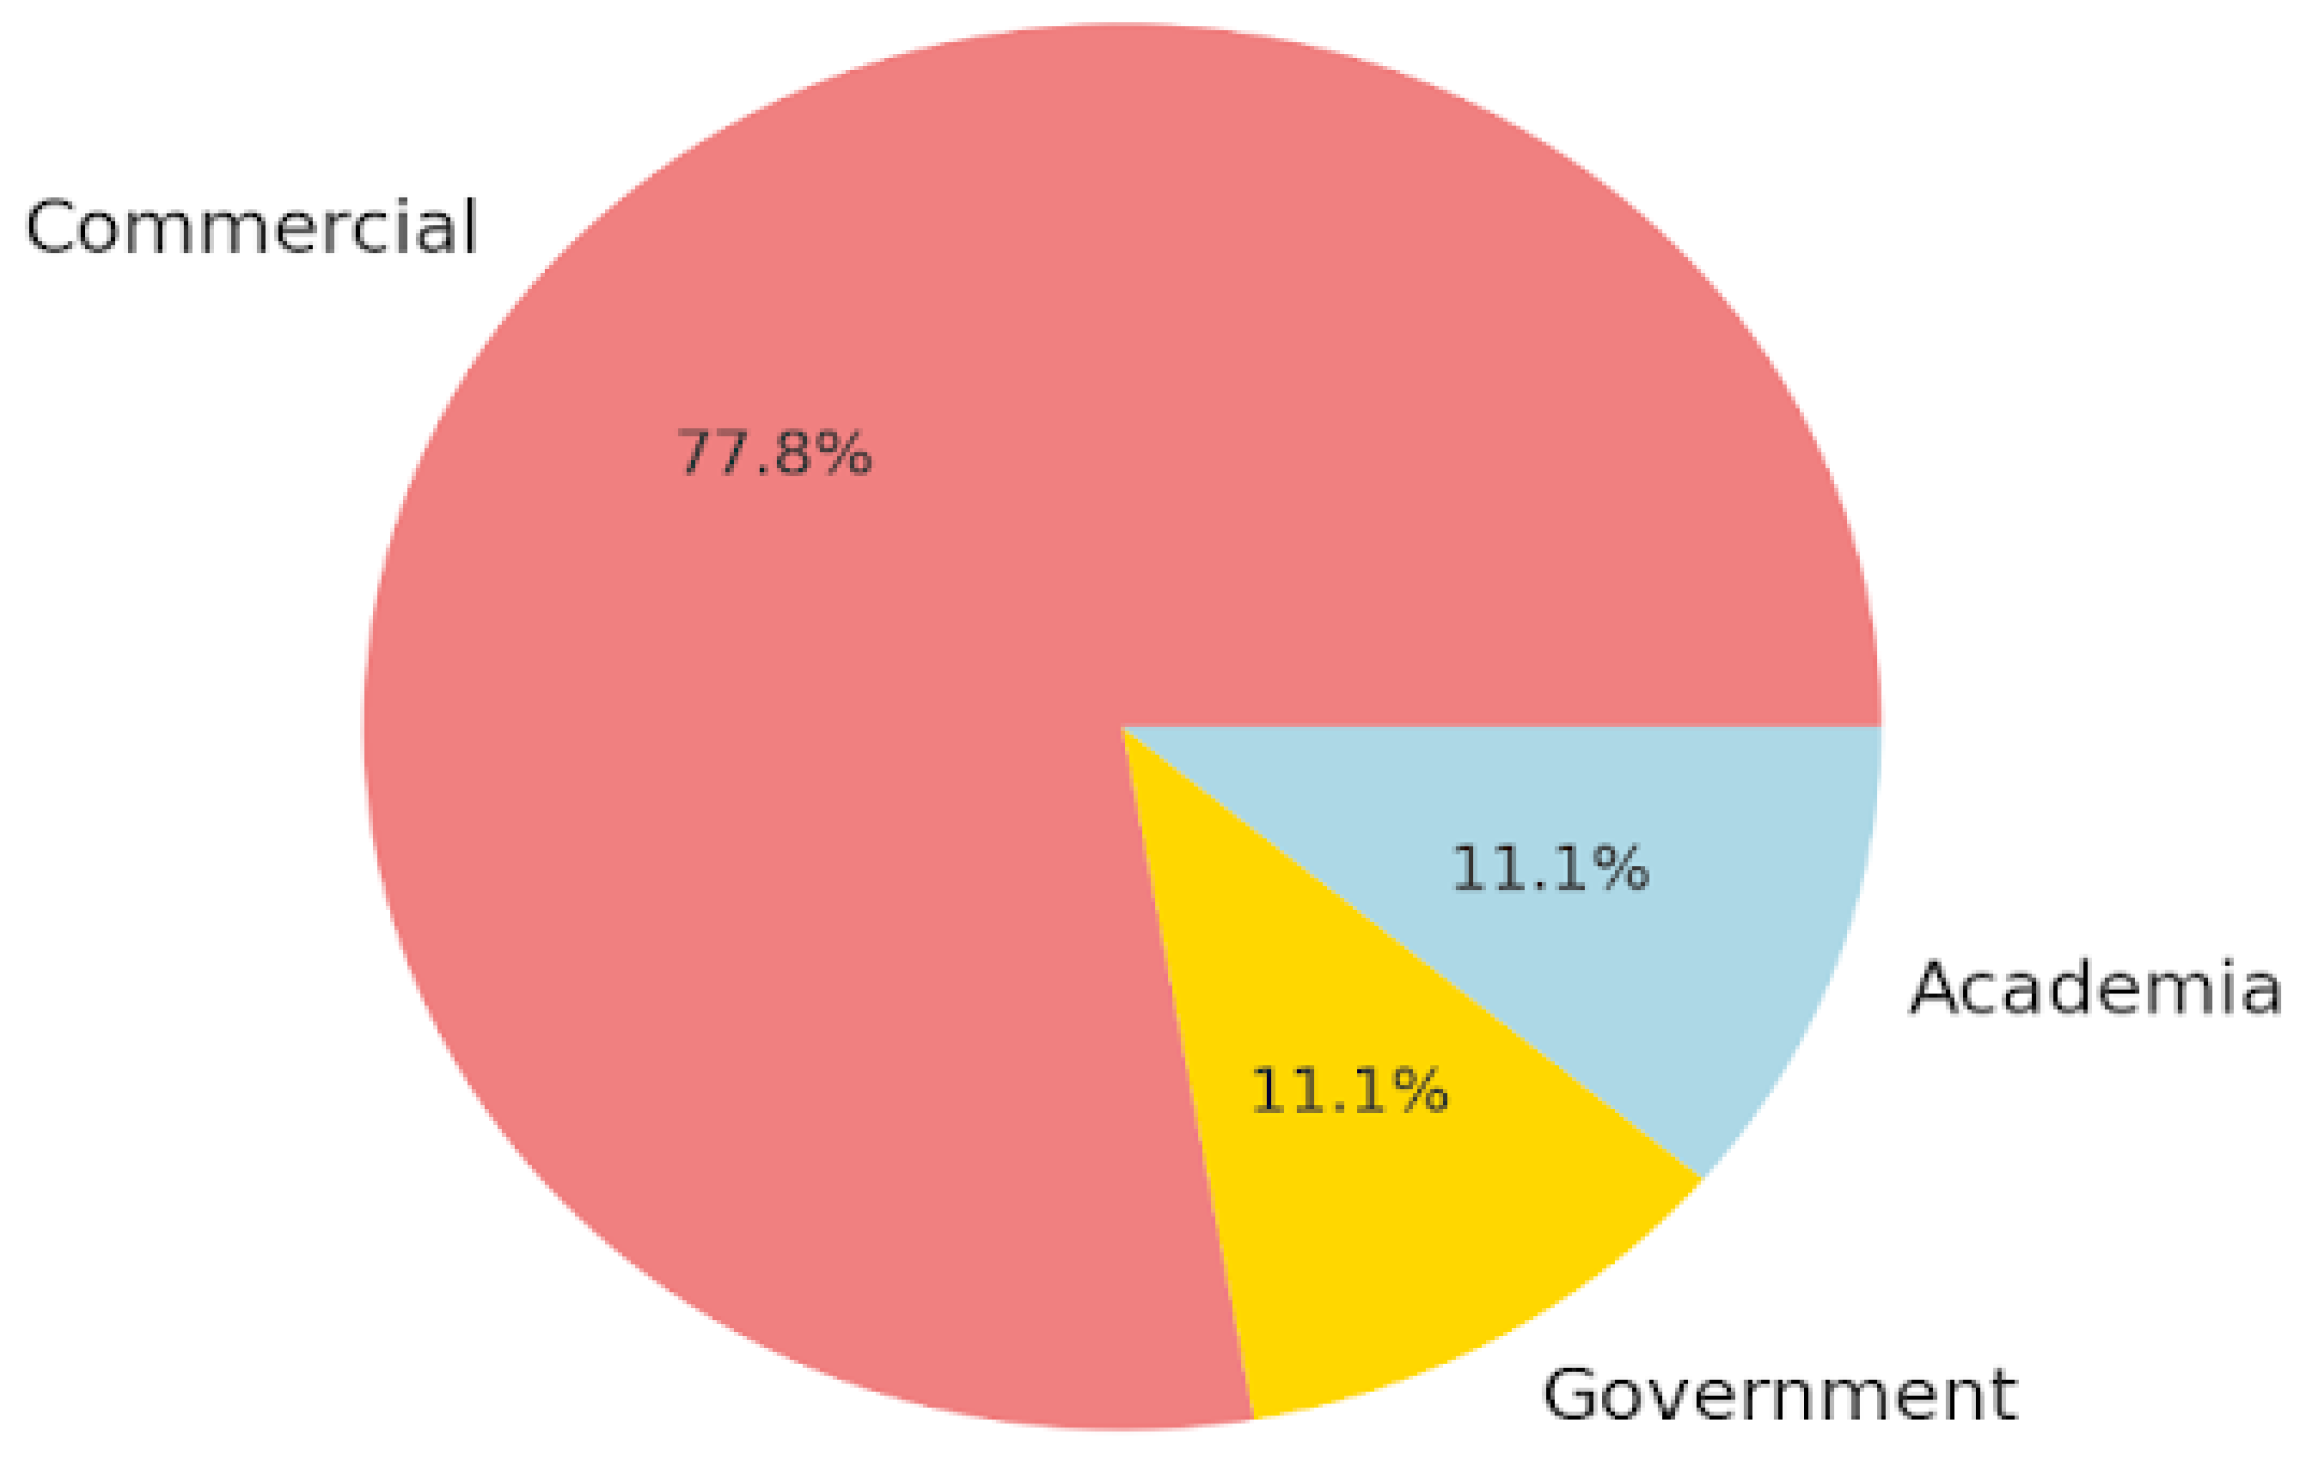
Figure 4.
Apps Characteristics based on technical aspects of the Apps.
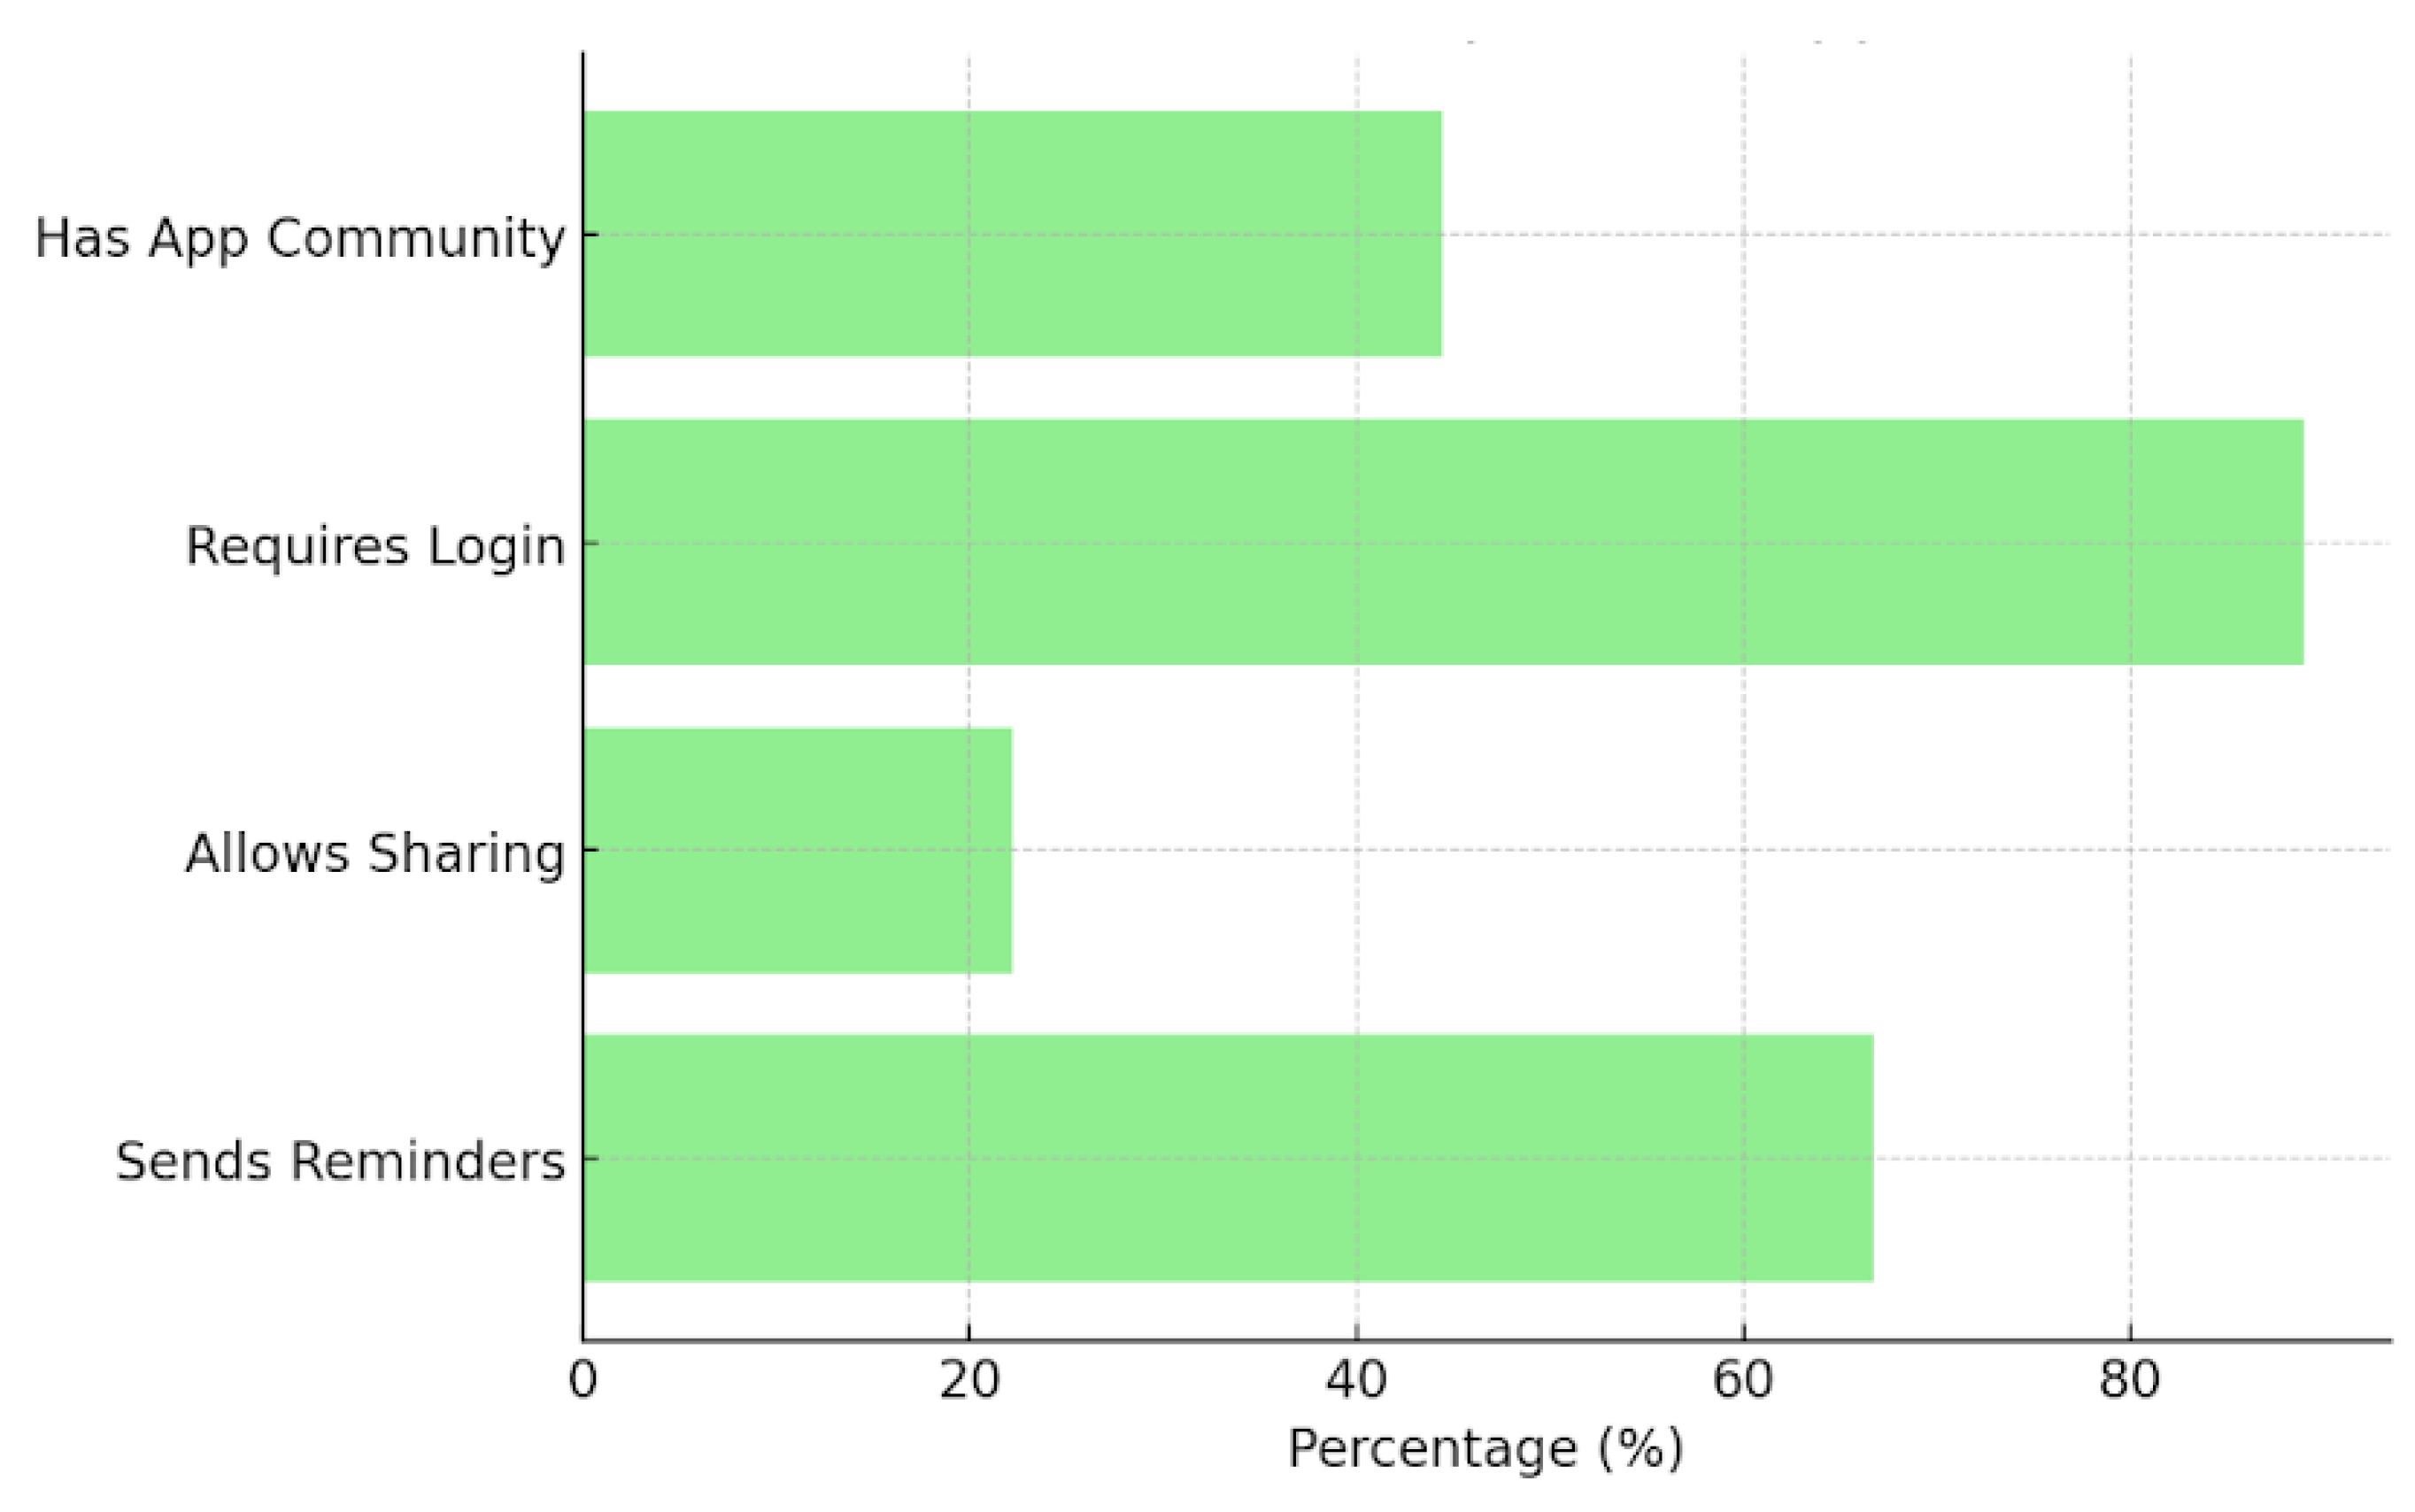
Figure 5.
Heatmap Visualization of comparison MARS mean score.
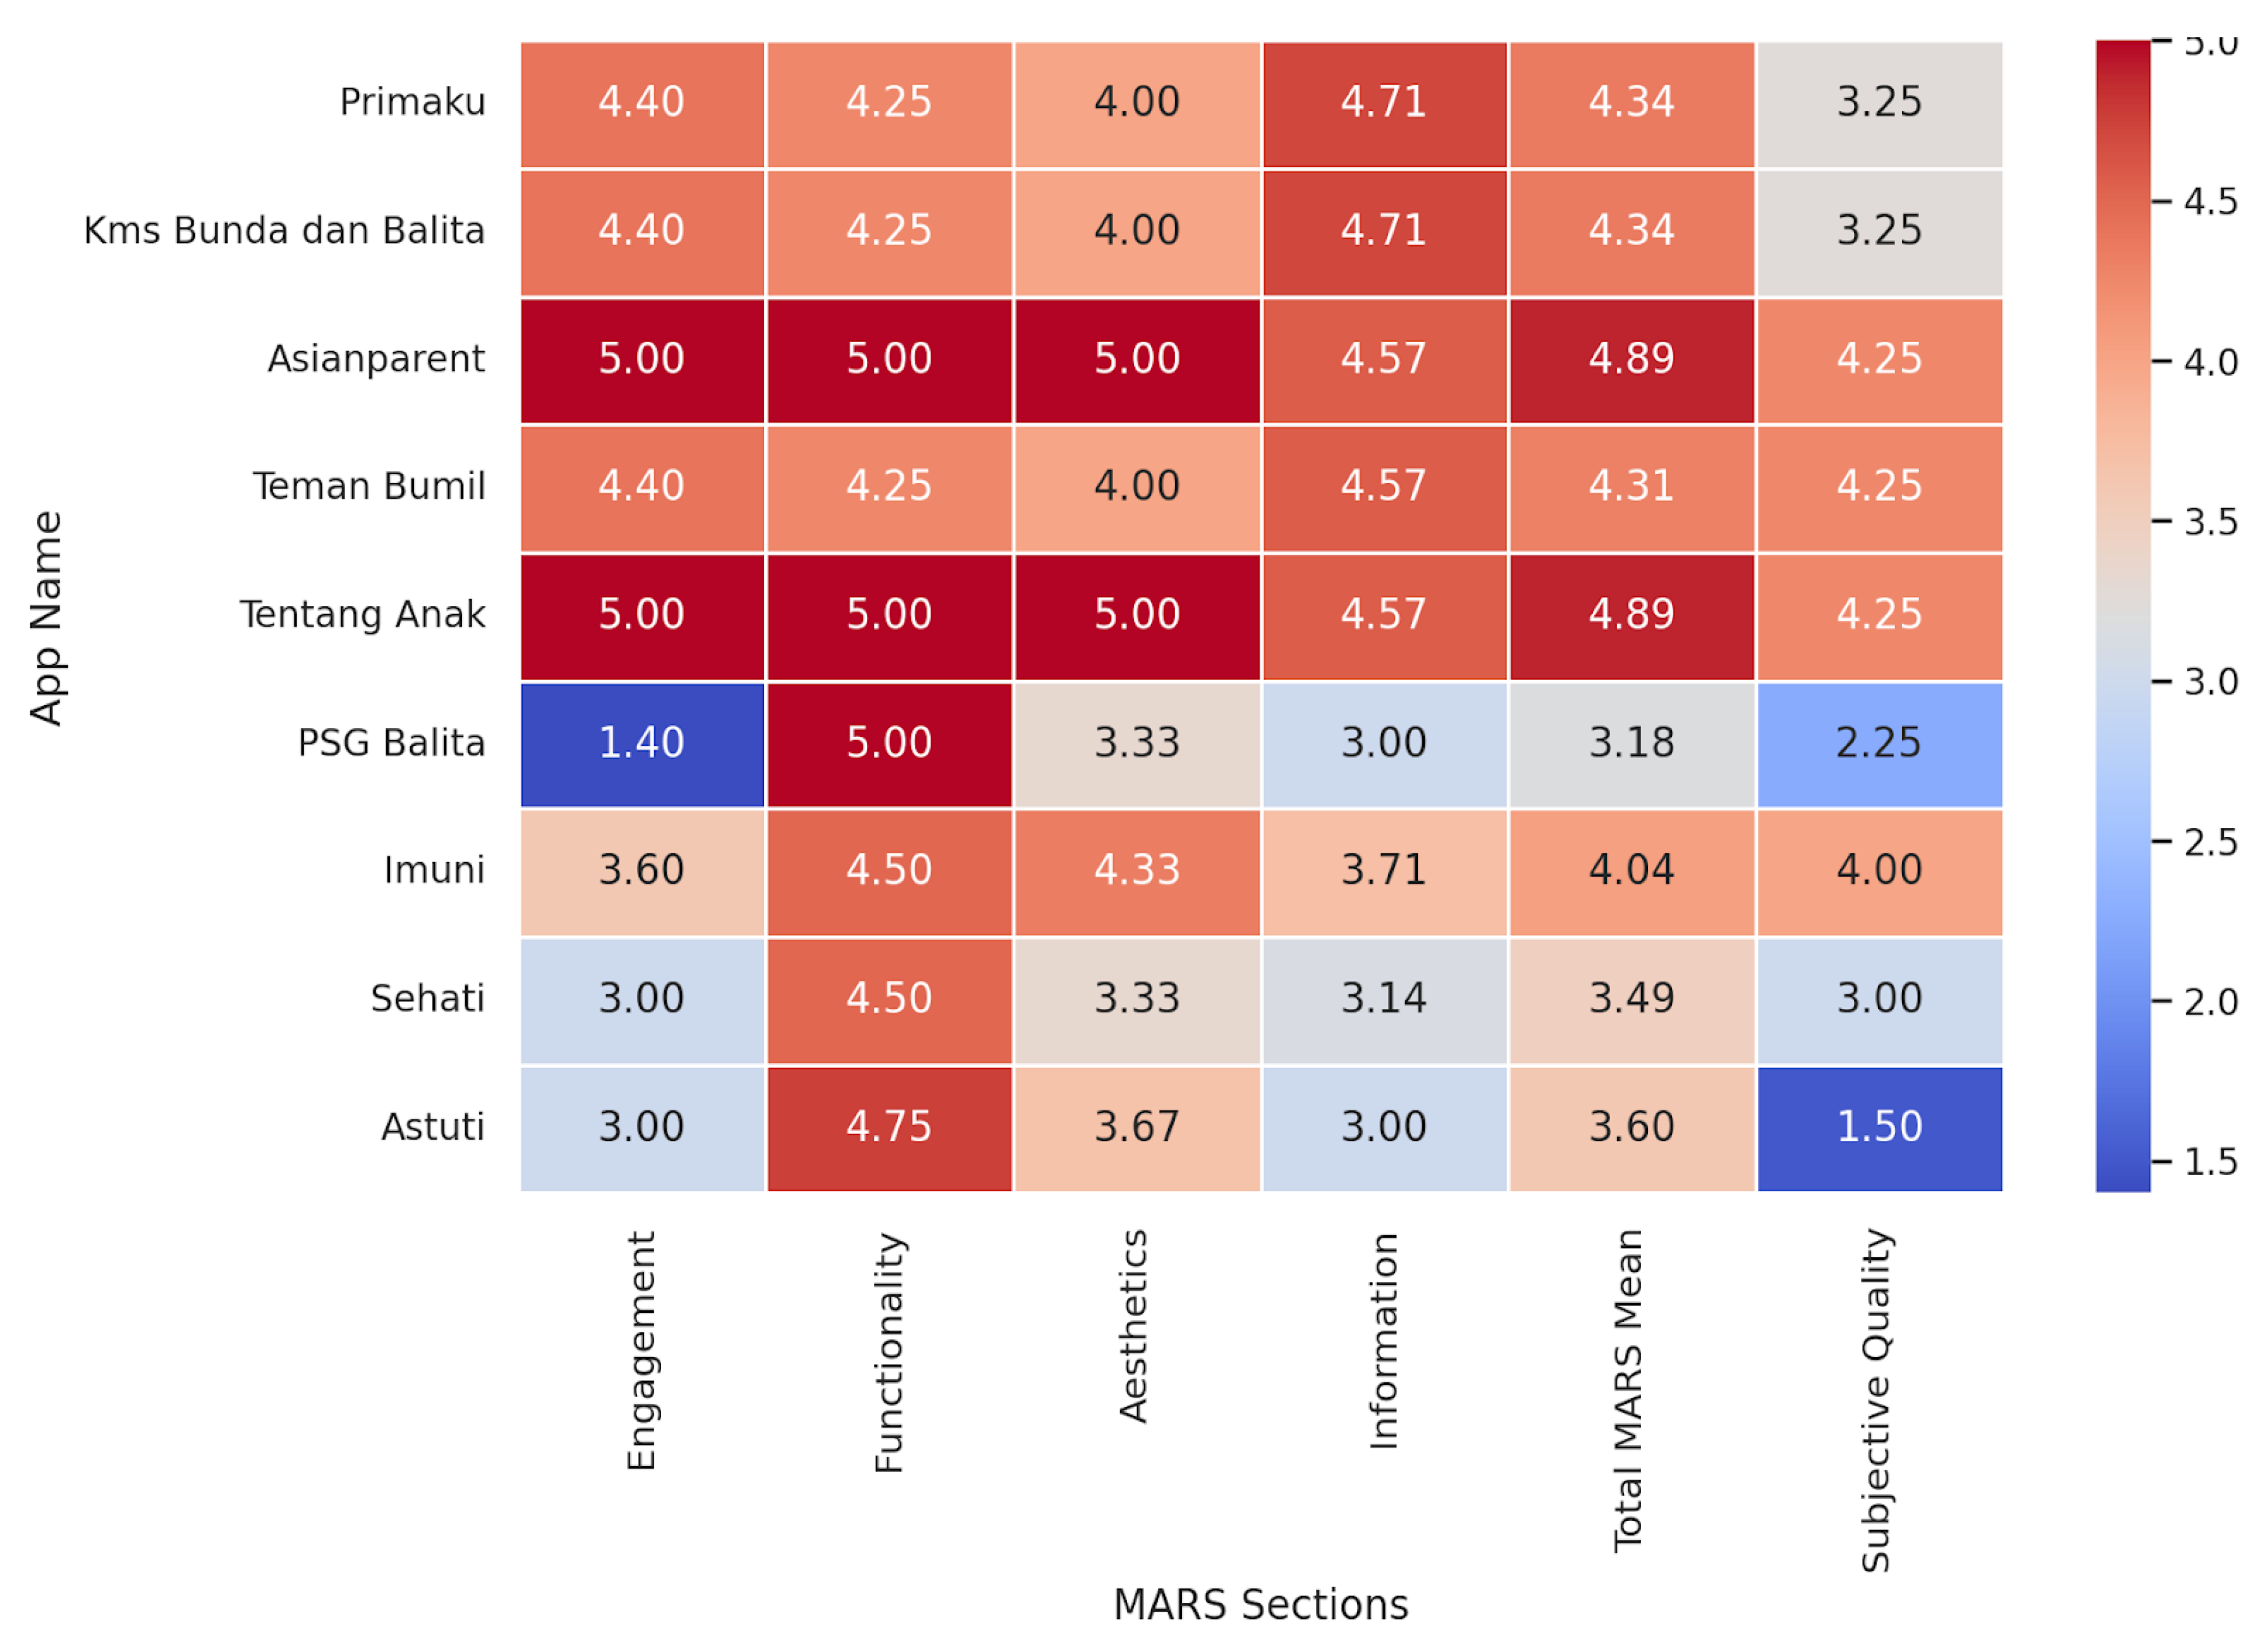
Figure 6.
Boxplot of MARS Sores Across Sections.
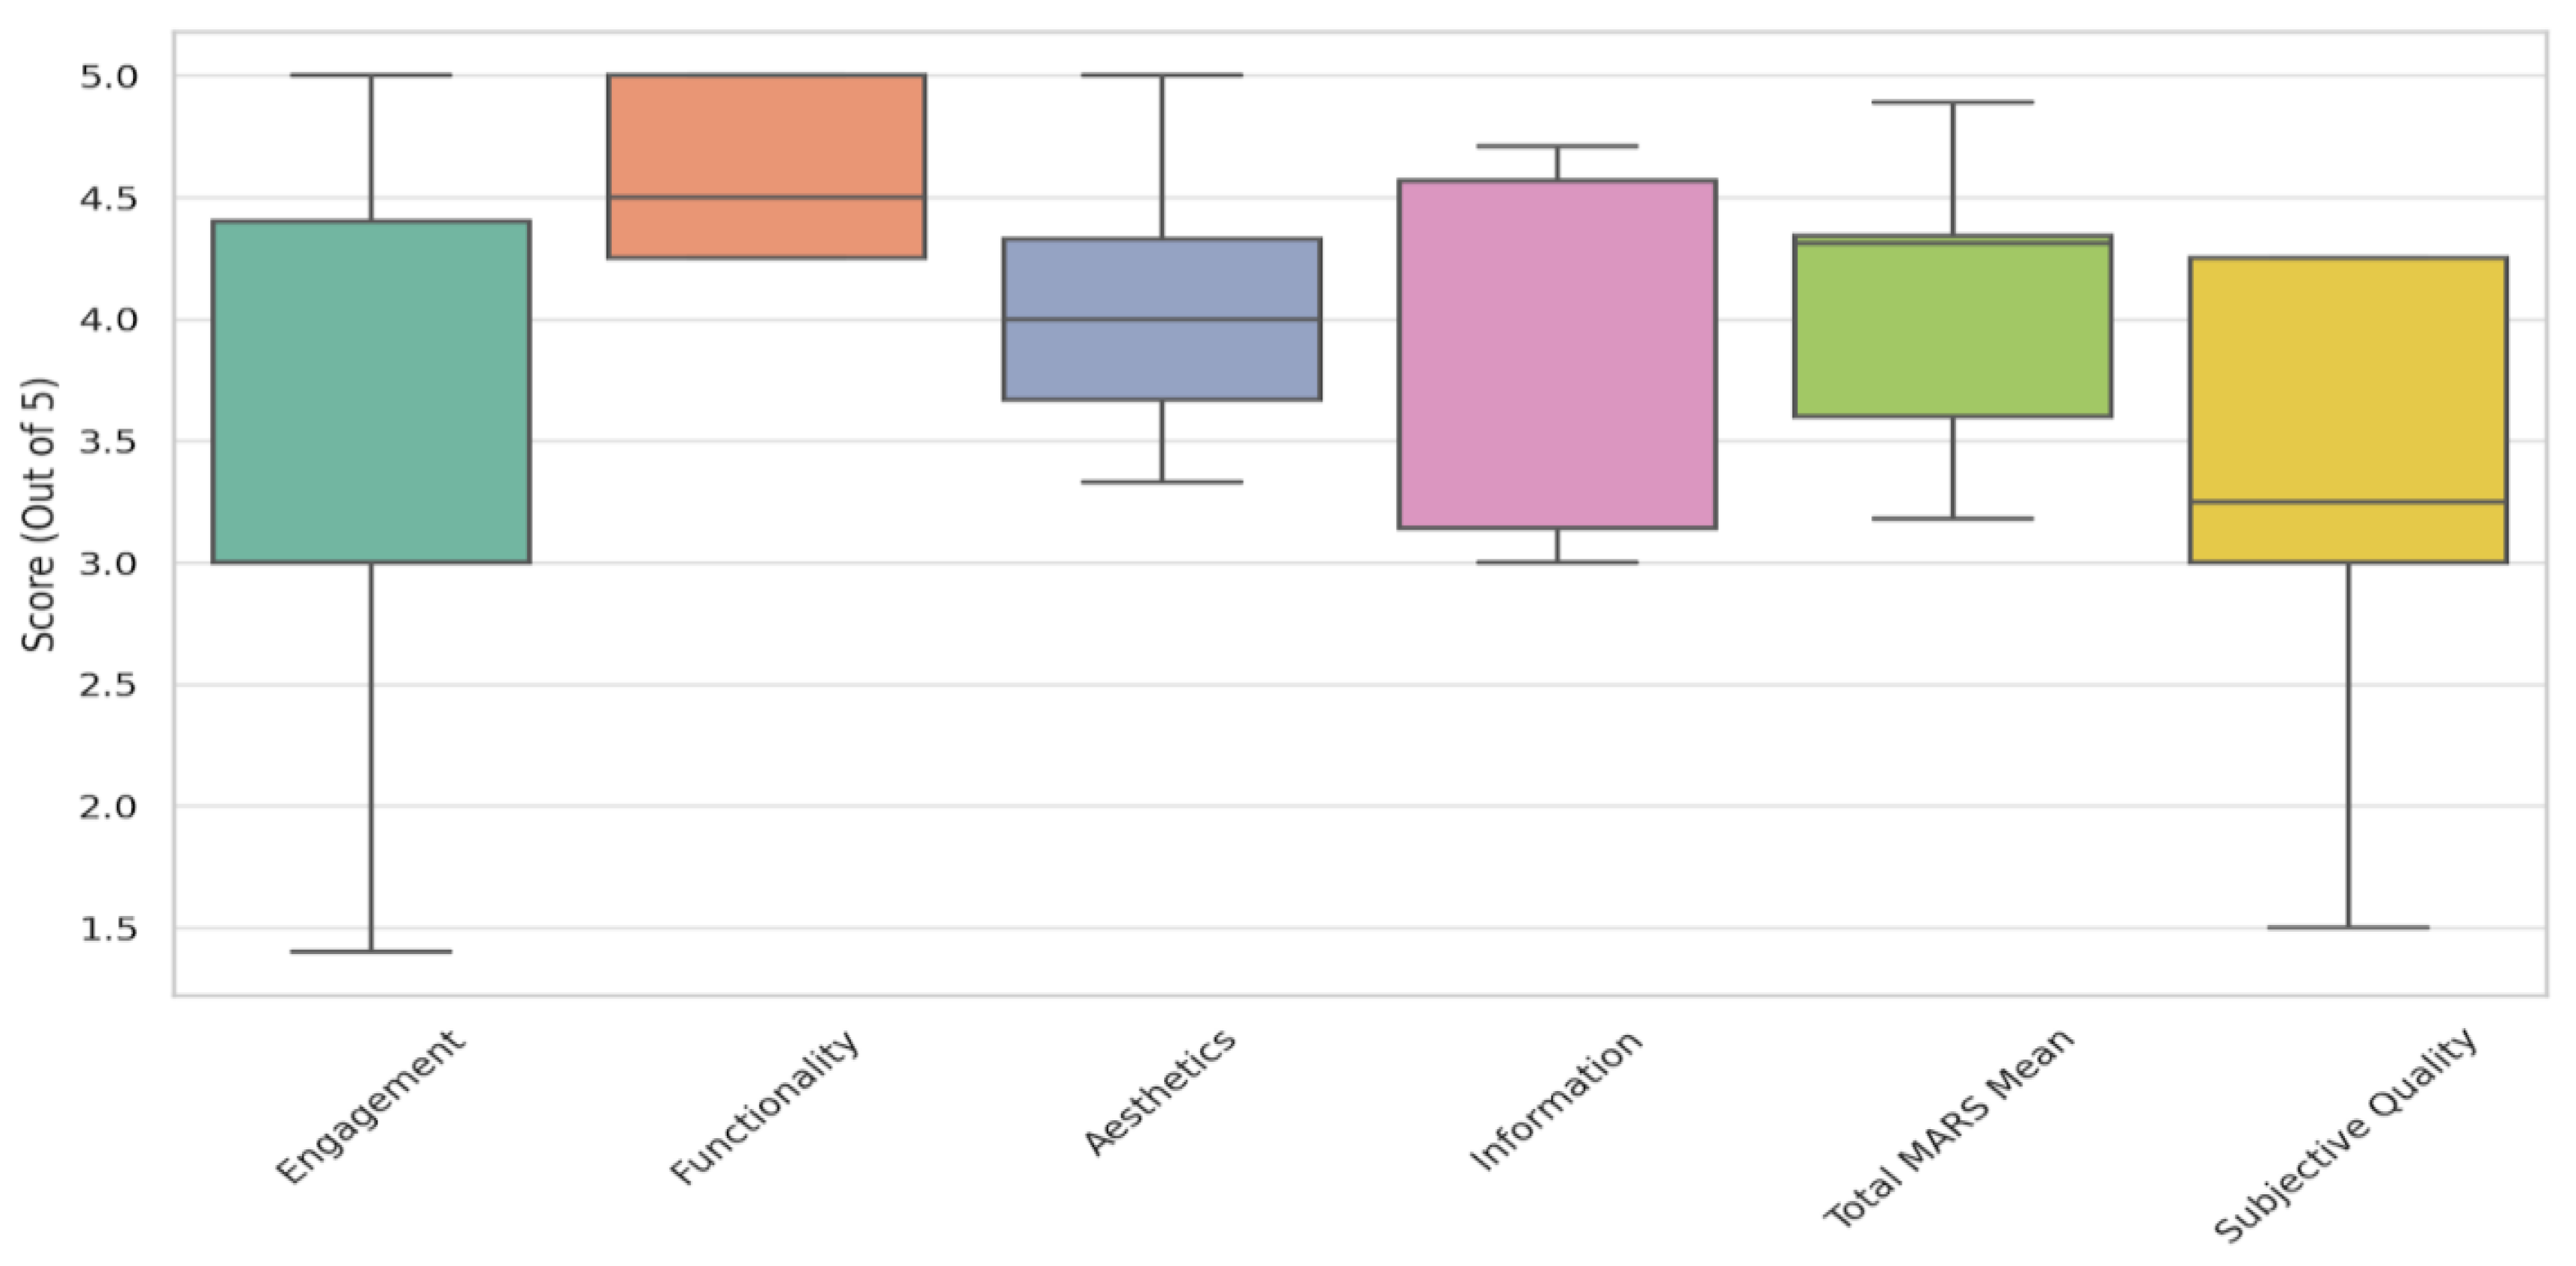
Figure 7.
Correlation Matrix MARS categories.
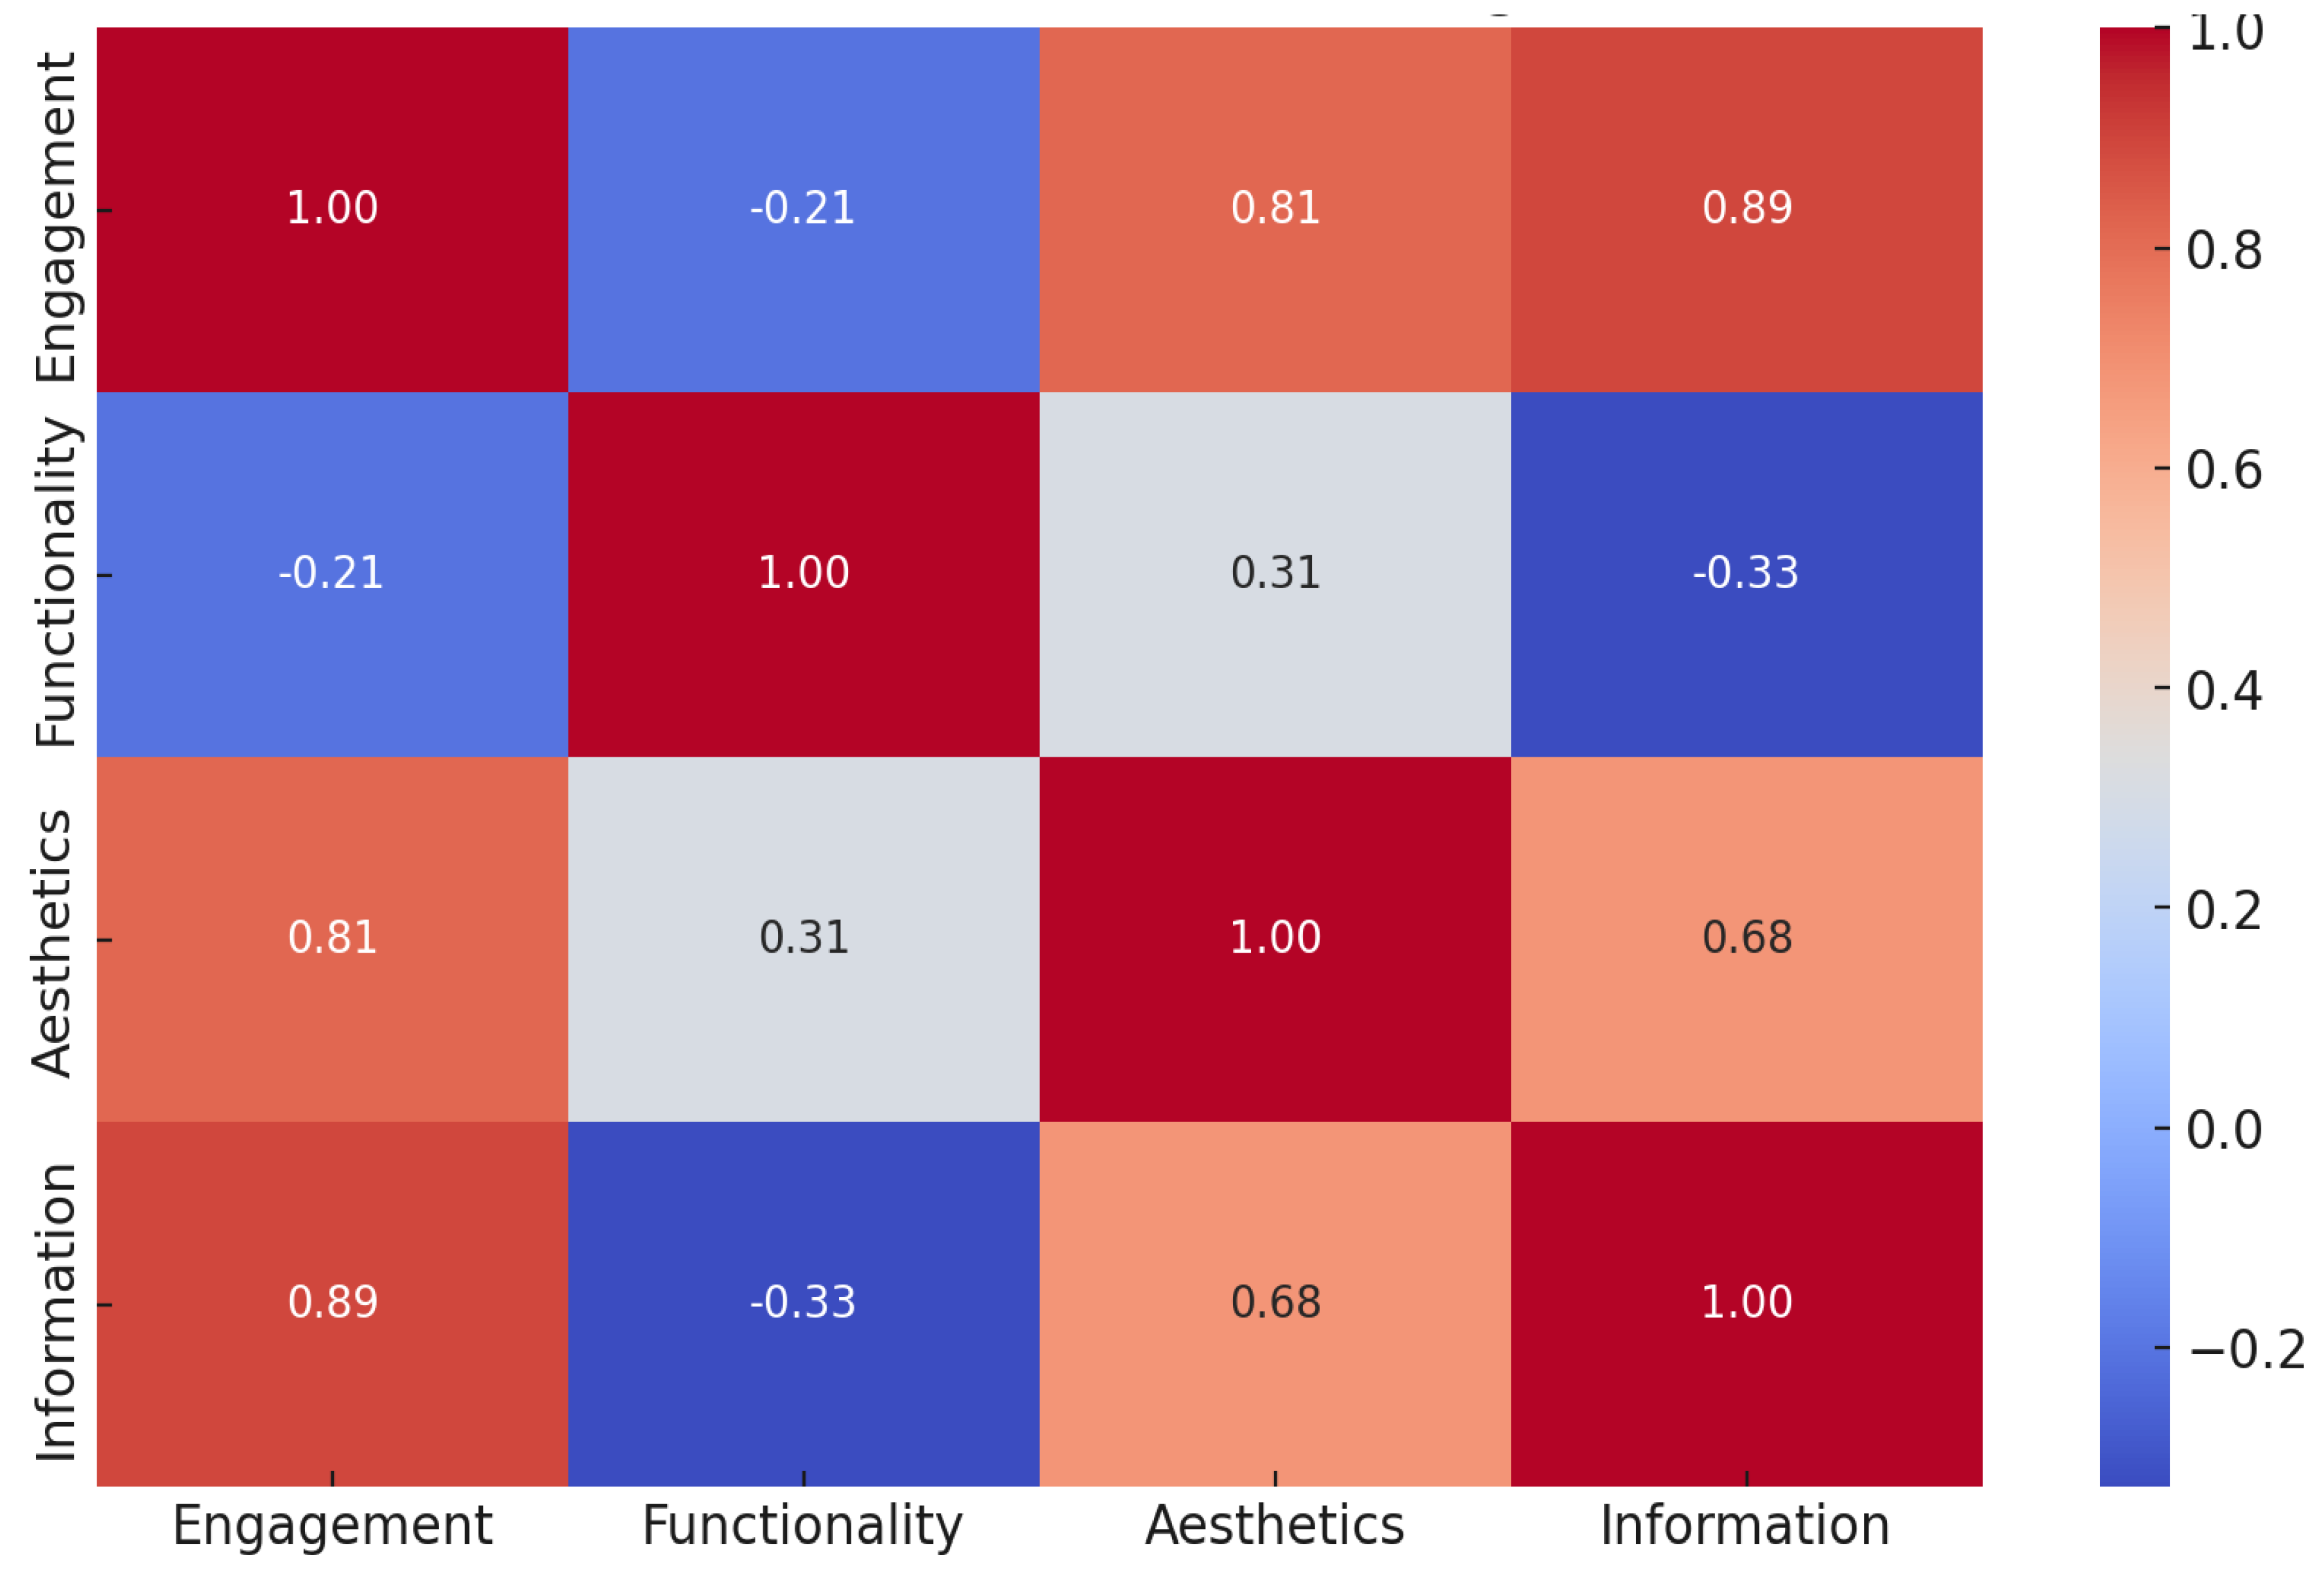
Figure 8.
Average MARS Behavioral Outcomes by Category.
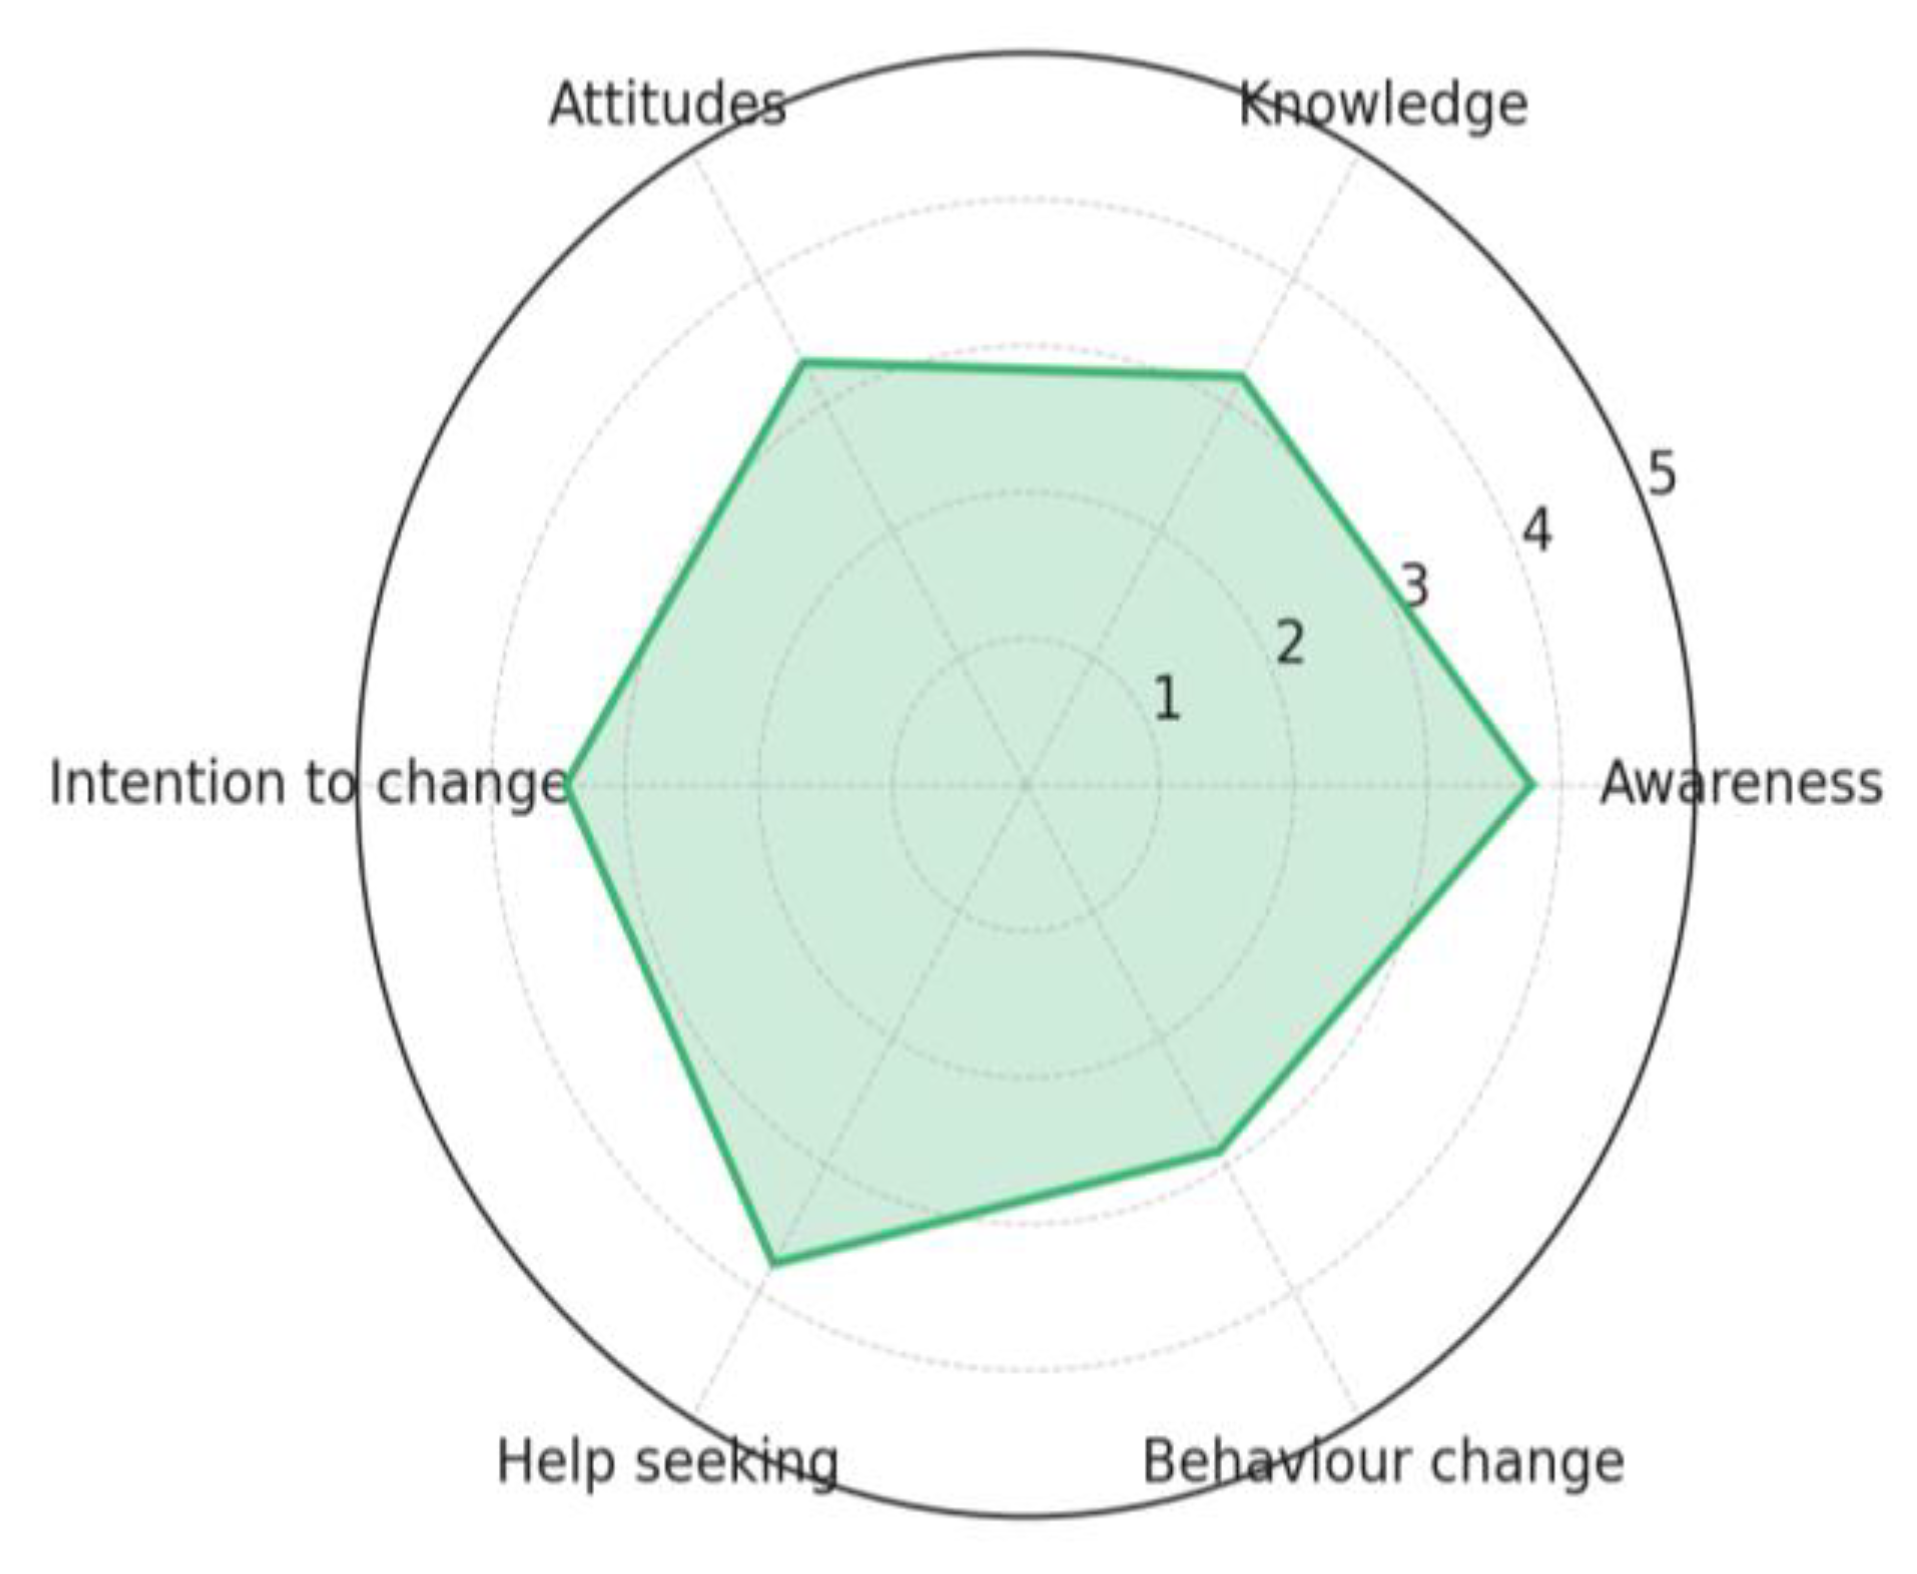
Figure 9.
Average Mars Behavioral scores By App.
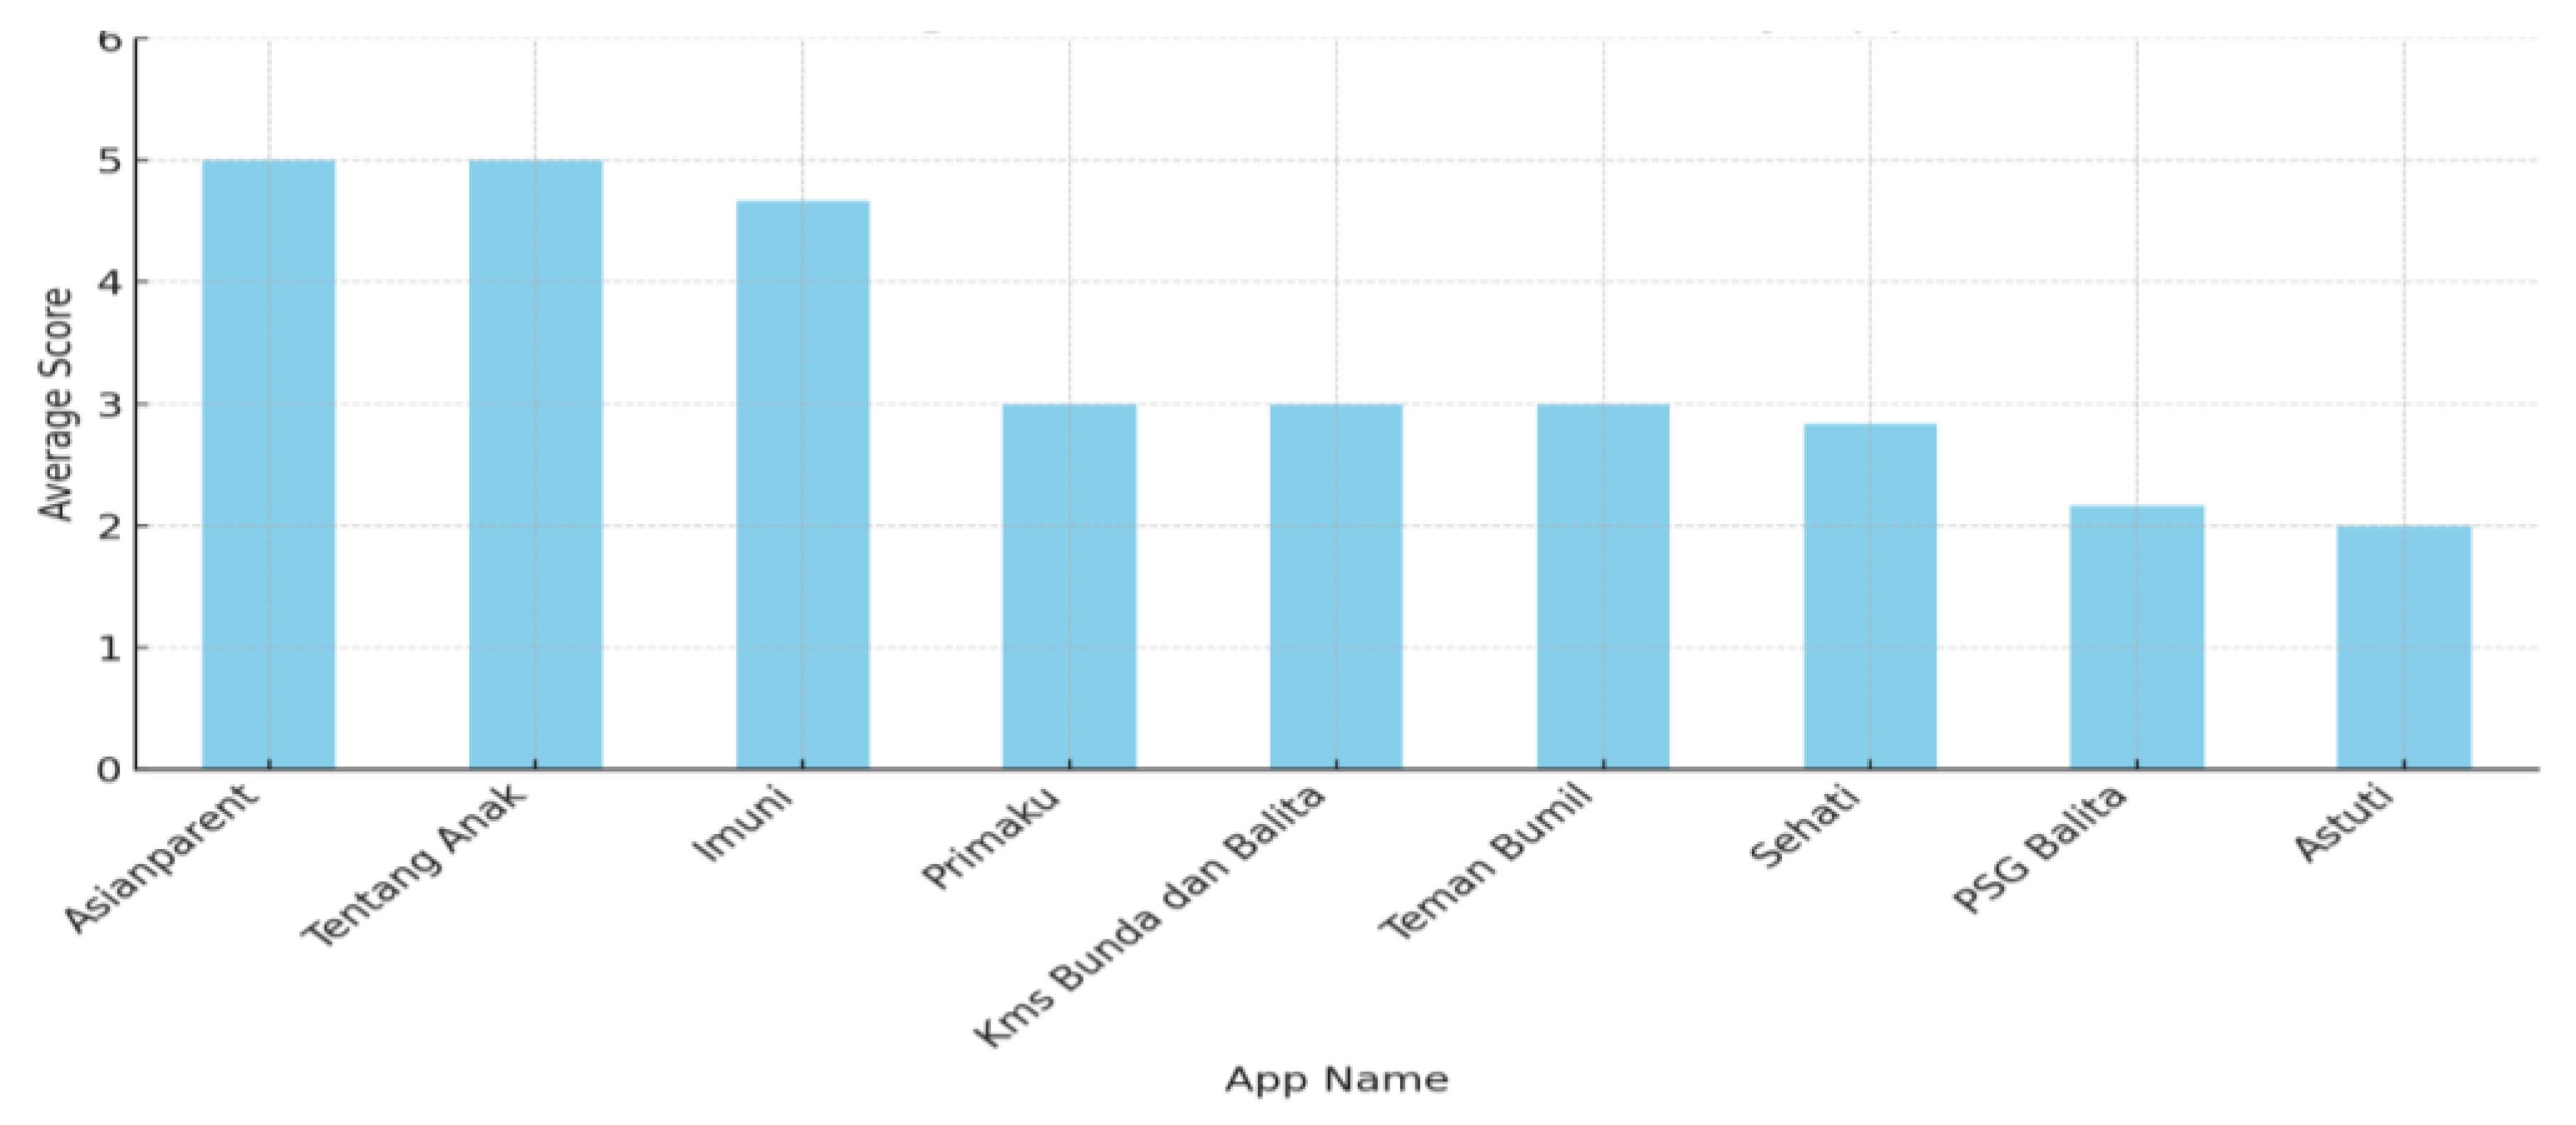
Figure 10.
Comparison of MARS scores between commercial and non-comercial Apps.
Disclaimer/Publisher’s Note: The statements, opinions and data contained in all publications are solely those of the individual author(s) and contributor(s) and not of MDPI and/or the editor(s). MDPI and/or the editor(s) disclaim responsibility for any injury to people or property resulting from any ideas, methods, instructions or products referred to in the content. |
© 2025 by the authors. Licensee MDPI, Basel, Switzerland. This article is an open access article distributed under the terms and conditions of the Creative Commons Attribution (CC BY) license (http://creativecommons.org/licenses/by/4.0/).
Copyright: This open access article is published under a Creative Commons CC BY 4.0 license, which permit the free download, distribution, and reuse, provided that the author and preprint are cited in any reuse.


