Submitted:
08 April 2025
Posted:
09 April 2025
You are already at the latest version
Abstract
The rapid development of digital technology has provided new opportunities for rural labor non-farm employment and income growth, thereby offering a viable pathway to narrow the income gap. This paper focuses on the impact mechanisms of digital technology infrastructure on rural labor employment and income gap in China since 2012. A dual analytical framework combining macro- and micro-level perspectives is adopted. Provincial panel data (2012-2023) are used to assess the aggregate impact of digital technology on income gap, and individual-level data from the China Family Panel Studies (CFPS) are employed to investigate how digital technology adoption facilitates the transition of rural labor to non-farm employment. The results indicate that digital technology significantly narrows the urban-rural income gap, with each unit increase in digital technology advancement corresponding to an approximately 11.9% reduction in the income disparity. Furthermore, digital technology substantially promotes non-farm employment--the adoption of digital tools increases the probability of non-farm employment by 20.13 percentage points. Specifically, the contributions of information acquisition channels and skill enhancement channels to non-farm employment are 2.26% and 6.91%, respectively. This study provides theoretical and empirical foundations for future policy research on digital technology popularization and rural labor employment.
Keywords:
digital technology
; non-farm employment
; urban-rural income gap
; sustainable development
1. Introduction
Narrowing the urban-rural income gap serves as a critical pathway to driving sustainable development and realizing common prosperity [1,2]. Since reform and opening-up, China’s economy has grown rapidly, with its GDP expansion consistently outperforming global averages. Through sustained government efforts, China's urban-rural income ratio has narrowed from 2.88 in 2012 to 2.34 in 2024, demonstrating continuous convergence in income distribution patterns [3]. However, the issue of urban-rural income gap remains fundamentally unresolved [4,5,6,7]. During the same period, the Gini coefficient has consistently exceeded 0.45, indicating that inequality remains pronounced. In particular, the low-income population is predominantly concentrated in rural areas. Therefore, enhancing rural low-income groups' earnings and thereby narrowing the urban-rural income gap are the key priorities for promoting balanced development in the future.
The rapid development of digital technology offers a highly promising solution. Its application is transforming socioeconomic operations, particularly creating new opportunities for labor employment and income growth in rural areas. Through continuously deepening the integration of digital technology with the real economy and advancing digital industrialization, China has achieved sustained expansion of its digital economy. In 2023, the digital economy accounted for 42.8% of GDP [8], providing a strong impetus for the sustained and healthy development of the society. As the foundational support for the digital economy, digital technology infrastructure has achieved leapfrog development. As of 2024, China's mobile phone penetration rate reached 127.1%, with internet penetration at 78.6% [9]. The Internet penetration rate in rural areas has also reached 67.7%, indicating that the gap between rural and urban digital technology infrastructure has significantly narrowed. The proliferation of digital technology infrastructure has provided rural laborers with increased non-farm employment opportunities. By offering low-cost and low-barrier access to capital accumulation channels, it has enabled their shift to secondary and tertiary industries, thereby enhancing labor market participation. In this context, examining digital technology's impacts on the urban-rural income gap and rural non-farm employment holds significant theoretical and practical importance.
The digital economy constitutes a more advanced economic stage following agricultural and industrial economies. The impact of the digital economy on the urban-rural income gap has attracted significant scholarly attention [10,11,12,13,14,15,16,17,18,19,20]. Related research can be mainly divided into three categories: The first perspective argues that the digital economy alleviates the urban-rural income gap by enhancing agricultural productivity and migrant workers' wages [12,13]. The narrowing effect is particularly pronounced in regions with more advanced digital infrastructure and greater human capital endowment. Deichmann et al. demonstrated in developing countries that information and communication technology promotes farmers' entrepreneurship by reducing transaction costs [14]. Yin et al. pointed out that the prosperity of e-commerce has played a positive role in narrowing the urban-rural income gap [15]. The second perspective posits that digital economic development stimulates urban economic growth, thereby indirectly widening the disparity [16]. The authors in [17] and [18] also indicate that the application of digital technology is often accompanied by technological barriers, disproportionately preventing rural areas from fully benefiting from the digital economy and thereby widening the income gap. The third perspective posits an inverted U-shaped relationship between the digital economy and the urban-rural income gap [19,20]. Simon et al. pointed out that in the early stages of economic development, income distribution tends to deteriorate initially, then gradually improves with sustained growth, ultimately achieving relative equity [21]. This is termed the Kuznets Curve. In summary, the widening income gap primarily stems from inadequate penetration of digital technology in rural areas. Over the long run, as rural digital adoption progresses, the widespread application of new-generation digital technologies (e.g., AI and big data) will further enhance production efficiency and optimize resource allocation, thereby contributing to narrowing the urban-rural income gap.
Non-farm employment is recognized as a pivotal pathway for narrowing the urban-rural income gap. The literature [22] has found that such employment not only directly increases farmers' income but also generates positive redistributive effects on neighboring regions through spatial spillover mechanisms. Research [23] has demonstrated that digital finance development enhances financing accessibility for rural entrepreneurs, stimulating entrepreneurial activities that thereby drive non-farm employment expansion. Digital infrastructure development is the cornerstone of the digital economy. Tian et al. demonstrated that broadband network penetration significantly boosts county-level employment rates [24]. Atasoy et al. analyzed the U.S. data, revealing that broadband internet access increased employment by 1.8 percentage points, with amplified effects in rural and remote areas [25]. Wang et al. constructed a theoretical model elucidating the underlying mechanisms through which internet adoption promotes rural labor transition to non-farm employment, showing a 7.9 percentage points increase in non-farm employment probability among internet-using rural workers [26]. The digital technology facilitates rural non-farm employment through multiple channels. Firstly, the information acquisition channel enables rural laborers to access real-time urban labor market dynamics via internet penetration, thereby enhancing their job search capabilities and employment success rates [26,27]. Secondly, the skill enhancement channel provides skills training and educational opportunities, which strengthen rural workers' competitiveness and enable them to secure higher-paying positions [23]. Jiang et al. analyzed the impact of the digital economy on urban-rural income disparities, identifying human capital as a moderating variable that positively regulates this relationship [28]. Additionally, digital technology alleviates employment pressures in traditional sectors while driving industrial upgrading and occupational diversification [24].
Overall, existing studies on the impact of digital technology on income gap mostly focus on changes since the reform and opening up, covering a longer period of time. At the same time, their characterization of digital technology development remains incomplete, often relying solely on internet penetration rates. Additionally, empirical studies rigorously assessing digital technology's impact on non-farm employment are relatively scarce. In contrast, this study focuses on data from 2012 to 2024 (the new period), during which China's rural digital technology infrastructure has undergone rapid development. This study establishes macro-level digital technology evaluation criteria, deriving more objective indicators through principal component analysis (PCA). Moreover, empirical validation employs micro-level China Family Panel Studies (CFPS) data, while incorporating a comprehensive assessment of digital technology across both mobile and desktop platforms. The main contributions can be summarized as follows:
(1) A more comprehensive digital technology development indicator system is established. Macro-level data are analyzed via PCA to assess digital advancement, while micro-level technology accessibility is systematically evaluated across both mobile and desktop platforms.
(2) A regression model between digital technology and income gap is constructed, along with mediating effect model linking digital technology to non-farm employment. A dual-channel mediation mechanism (information acquisition and skill enhancement) is proposed, revealing digital technology's role as an enabling tool in transforming rural employment patterns, thereby establishing transmission mechanisms that narrow income gaps.
(3) An integrated macro-micro analysis is conducted by combining provincial panel data (macro) with individual CFPS data (micro), revealing digital technology’s multi-level impacts on income gap and non-farm employment.
The remainder of this paper is structured as follows. Section 2 presents an in-depth analysis of digital technology development, based on which two research questions are formulated. Section 3 offers the research assumptions based on the analysis of the current situation of urban-rural income gap and non-farm employment. In Section 4, analytical models are established to examine the impacts of digital technology on income gap and non-farm employment. Section 5 details the empirical data processing and analysis. Finally, Section 6 concludes the paper, offers theoretical and managerial implications and suggests directions for future research.
Following is the research framework of this study, as shown in Figure 1.
2. Problem Formulation
Digital technology and digital economy represent the forefront of current global technological and industrial revolutions. Digital economy is a more advanced economic stage following agricultural and industrial economies [29]. Figure 2 illustrates the composition of the digital economy. Digital economy can be categorized into digital industrialization and industrial digitization. For a long time, China has persistently facilitated the deep integration of digital technology with the real economy. The continuous development of both digital industrialization and the digital economy has provided strong impetus for the sustained and healthy development of the society.
According to continuous tracking research by the China Academy of Information and Communications Technology (CAICT), China's digital economy has entered an accelerated development stage since 2012. Its scale has expanded from 11.2 trillion yuan in 2012 to 53.9 trillion yuan in 2023, with its proportion of GDP exceeding 42.8%. The contribution rate of digital technology to economic growth has consistently risen to over 66%. It serves as both a critical pillar and an essential driving force for the national economy [8].
Serving as the foundational support for the digital economy, digital infrastructure has also achieved leapfrog development across domains. During the 13th Five-Year Plan period (2016-2020), China has further promoted the development of the digital economy. The digital infrastructure has been continuously improved. Moreover, the cultivation of emerging formats and innovative models has been accelerated. These developments have achieved positive results in promoting digital industrialization and industrial digitization.
In 2020, China constructed the world's largest fiber-optic and fourth-generation (4G) mobile communication network. The construction and application of fifth-generation (5G) mobile communication networks have also been accelerated. This has significantly increased the penetration rate of broadband users, with fiber-optic subscribers exceeding 94% of total users, mobile broadband penetration reaching 108%, and active Internet Protocol version 6 (IPv6) users attaining 460 million. The 14th Five-Year Plan for the Development of the Digital Economy also points out that it is necessary to accelerate the construction of information network infrastructure and build intelligent, comprehensive digital infrastructure.
Figure 3(a) shows the penetration rate of mobile phones in China since 2012. It demonstrates a significant upward trend that has become particularly pronounced with year-by-year increases after 2020. Figure 3(b) presents the internet penetration rates in China's urban and rural areas. As shown in Figure 3(b), the rural internet penetration rate has been continuously increasing with a rapid growth rate, while the gap between rural and urban internet penetration rates is gradually narrowing. Between 2018 to 2019, there was a notable increase in the rural internet penetration rate, with the growth rate reaching as high as 37%. It is evident that China's digital infrastructure is currently developing rapidly. With a strong emphasis on balanced development across regions, the disparity between rural and urban areas continues to diminish. The rapid advancement of digital technology has enabled residents in impoverished regions to gain access to shared digital dividends, thereby laying the foundation for comprehensively advancing digital rural development.
Behind this technology-driven growth, two critical research questions are emerging:
Question 1 (Q1):
Does the expansion of digital infrastructure genuinely achieve inclusive development and stimulate rural economic growth?
Question 2 (Q2):
How does digital technology facilitate income improvement for rural laborers?
For Q1, this paper adopts the urban-rural income gap as the dependent variable and uses digital technology infrastructure development as the independent variable to analyze its impact on the urban-rural income disparity. For Q2, this paper investigates the micro-individual level by targeting the rural labor force as research subjects. It analyzes how digital technology development facilitates rural laborers' non-farm employment through two channels - information acquisition and skill enhancement - thereby increasing personal income.
3. Research Hypothesis
3.1. The Impact Mechanism of Digital Technology on Income Gap
Figure 4 presents the per capita disposable income (PCDI) for urban and rural residents and their ratio from 2012 to 2024 in China. From Figure 4(a), both urban and rural PCDI have demonstrated consistent annual growth, reflecting a long-term improvement in living standards. Figure 4(b) reveals a decline in the urban-rural income ratio from 2.88 in 2012 to 2.34 in 2024. It signifies a progressive reduction in regional income inequality and underscores the substantive achievements in balanced interregional development.
Further, Table 1 presents the PCDI of urban and rural households by income quintile in 2024. The income ratio of PCDI of highest 20% households between urban and rural approximates 2.11. The PCDI of lowest 20% households between urban and rural reaches 3.33. Regionally, the income disparity of rural highest 20% households and the rural lowest 20% households reveal a 9.95-fold gap. The income disparity of urban highest 20% households and the urban lowest 20% households reveal a 6.32-fold gap. Particularly, the ratio of PCDI between the urban highest 20% households and the rural lowest 20% households reaches about 21.03 times. This demonstrates that significant income disparities persist both within urban areas and rural communities, with rural income inequality being particularly pronounced.
In summary, while the urban-rural income gap has been narrowing annually, disparities between high- and low-income groups remain substantial within both urban and rural areas. The chronic low-income levels among the rural low-income population play a critical factor in urban-rural inequality. Improving the income of rural low-income groups constitutes both the key challenge and priority for promoting balanced development in the future.
It is worth studying whether digital technology is able to serve as a pivotal instrument to resolve this structural stagnation, increase rural residents' income and narrow the urban-rural income gap. With the continuous development of digital technology, digital dividends may gradually shift toward rural areas, thereby narrowing the urban-rural income gap. Theoretically, digital technology development can reduce costs in the real economy and improve efficiency, while simultaneously promoting precise supply-demand matching. Firstly, digital technology decreases information acquisition costs. Digital technology changes the traditional information acquisition methods and substantially reduces expenses for obtaining relevant information. Secondly, it significantly reduces resource matching costs. By bridging online and offline spaces, digital technology can address information asymmetry among urban-rural workers. It greatly reduces the costs of resource discovery, contract signing, and supervision and implementation.
As summarized in Section 1, existing research indicates that digital technology expansion may exacerbate such gaps during initial phases, yet technological maturation and institutional refinement progressively narrow these disparities over time. The primary cause of widening income disparities lies in accessibility differences of workers to digital technology. Given that the gradual increase in rural internet penetration rates in China is approaching urban internet penetration levels, the widening effect is expected to diminish progressively. Based on this, the following hypothesis is proposed:
Hypothesis 1 (H1):
Digital technology development can narrow the urban-rural income gap.
3.2. The Impact Mechanism of Digital Technology on Rural Labor Non-Farm Employment
China's economic structure is characterized by a distinct urban-rural dual system [30]. In this structure, non-farm employment demonstrates significantly higher economic returns compared to agricultural employment. This structural divide is widely regarded as the root cause of the persistent urban-rural income gap. Rural household incomes, for instance, are predominantly composed of two sources: income from off-farm labor and agricultural production. With the advancement of agricultural modernization, a substantial rural labor force has been released from agricultural production. In pursuit of higher wages, these workers progressively transition from agriculture to secondary and tertiary industries, entering non-farm employment sectors. Massive research demonstrates that non-farm employment has made significant contributions to China's economic development [22,23,24,25,26,27,28,29]. Rural laborers' participation in non-farm employment is a crucial pathway to narrowing income disparities.
Rural Labor Force refers to individuals with household registration in rural areas, aged 16 and above (excluding students currently enrolled in formal education), who are physically capable of working [32]. They are counted in the statistics whether currently working (farm/non-farm) or temporarily unemployed but still able to work. Rural Migrant Workers denote laborers who retain rural household registration and engage in non-farm industries locally or work outside their hometown for six months or longer in a year. As defined, Rural Migrant Workers are those engaged in agricultural activities locally or participated in non-farm employment outside their hometown. As a product of the urban-rural dual system, Rural Migrant Workers represent a special group transitioning from rural areas to urban sectors or non-farm industries. They play a pivotal role in rural revitalization, economic stability, and narrowing the urban-rural income gap [31].
Based on annual data from China's National Bureau of Statistics and the Migrant Worker Monitoring and Survey Report [32], as shown in Figure 5(a), the proportion of rural migrant workers in China's total employed population from 2012 to 2024 are calculated. Clearly, this proportion has demonstrated a persistent upward trend, indicating that rural migrant workers are playing an increasingly vital role in China's economic development.
Furthermore, Figure 5(b) shows the number of rural migrant workers and their annual growth rates. Additionally, the paper counted the proportion of rural migrant workers in secondary and tertiary industries from 2012 to 2023 (data for 2024 remains unpublished), with results displayed in Figure 6.
From Figure 5 and 6, the following conclusions can be drawn:
(1) The total number of migrant workers has been increasing and has a rising share of total employment. Under agricultural modernization, a sea of rural laborers has been liberated from agricultural production. In 2024, the migrant worker population reached 299.73 million in China. Accounting for 40.8% of total employment, their contribution to economic growth becomes increasingly significant. Except for a notable decline in 2020 (primarily due to the COVID-19 pandemic leading to widespread production halts and the return of migrant workers to agricultural activities), the total number of migrant workers has maintained a continuous upward trend.
(2) The proportion of migrant workers in the tertiary industry continues to rise. From an industrial perspective, massive rural surplus laborers engage in non-farm employment and transition to the secondary and tertiary industries. In 2023, 45.5% of migrant workers were employed in the secondary industry, and 53.8% worked in the tertiary industry. From 2012 to 2023, employment in the secondary industry consistently declined. In contrast, employment in the tertiary industry steadily increased and surpassed the former as early as 2018.
For individuals, digital technology promotes non-farm employment through two primary ways, as illustrated in Figure 7. On the one hand, digital technology can enhance non-farm employment via improved information access. When digital technology is underdeveloped, many migrant workers have to seek employment through informal channels. It makes them vulnerable to deception and difficult to secure appropriate employment opportunities. However, the development of digital technology facilitates information dissemination and communication. It significantly removes the information barrier and information asymmetry in the labor market. This beneficial influence not only helps rural laborers to find abundant employment opportunities and understand labor market demands, but also motivates rural laborers to engage in non-farm employment and expands their access to information sources. On the other hand, digital technology enhances non-farm employment opportunities through increasing skill acquisition channels. Rural workers can acquire employment skills via digital technology, consequently improving their employability. Furthermore, they can engage in emerging employment models such as e-commerce entrepreneurship, online live-streaming, and short video production. Enhancing rural residents' digital skills and comprehensive competencies not only strengthens their adaptability to technological innovations but also elevates their employability in the digital economy era.
As evidenced above, it can be inferred that the development of inclusive digital infrastructure has provided rural workers with enhanced non-farm employment opportunities. Information access channels and skill acquisition channels constitute the key mechanisms through which digital technology application facilitates employment among migrant workers. By promoting non-farm employment through information acquisition and skill enhancement channels, digital technologies contribute to narrowing income gaps indirectly. Based on this, this study proposes the following hypotheses.
Hypothesis 2 (H2):
Digital technologies can promote non-farm employment among rural migrant workers.
Hypothesis 2a (H2a):
Digital technologies promote non-farm employment of migrant workers through information acquisition channels.
Hypothesis 2b (H2b):
Digital technologies promote non-farm employment of migrant workers through skill enhancement channels.
4. Model Construction
4.1. Impact model of digital technology on urban-rural income gap
According to the analysis in the Section 4, it is assumed that the use of digital technology can narrow the urban-rural income gap. Based on macro-level provincial data in China, the following regression model is established:
where i and t denote the province and year variables respectively; represents the urban-rural income gap for province i in year t; denotes the digital technology level; refers to the set of control variables; and indicate province fixed effects and time fixed effects respectively; is the random error term. If the estimated coefficient is significantly negative, it demonstrates that digital technology significantly narrows the urban-rural income gap, thus confirming Hypothesis 1.
The explained variable is the urban-rural income gap. Current methods for measuring income disparities mainly include the income ratio, Theil index [33], and Gini coefficient [34,35]. This paper adopts the ratio of urban PCDI to rural PCDI as the measurement standard, as follows:
where and represent the urban PCDI and the rural PCDI respectively.
The core explanatory variable is the development level of digital technology. The scientific and reasonable measurement of digital technology is crucial. Literature [18] measures the regional digital technology development by analyzing the term frequency of digital-related keywords in provincial government work reports. Literature [36] uses internet usage to indicate the development level of digital technology. In contrast, this paper selects four indicators associated with digital technology infrastructure as shown in Table 2. The internet infrastructure level and equipment penetration rate are comprehensively measured. The variables include popularization rate of mobile telephone, broad band subscribers of internet, mobile internet subscribers, and the computers used per 100 persons. In order to avoid the error caused by the subjectivity of the index, the PCA is introduced to determine the weight of the index. The principle of PCA can be explained as follows:
Suppose the original data matrix is , where n is the number of samples. Firstly, we standardize each variable:
where is the original value of the i-th sample on the j-th variable, and represent the mean and the standard deviation of the j-th variable, respectively. is the standardized value. The covariance matrix of the standardized data matrix is as follows:
Then, perform eigenvalue decomposition on the covariance matrix, which can be eigenvalue decomposited as follows:
where is the eigenvalue matrix and is the eigenvector matrix.. Without loss of generality, the eigenvalues are in the descending order (), and each corresponding eigenvector is denoted by .
The variance contribution rate can be expressed as
And the cumulative variance contribution rate can be written as
The contribution rate of the cumulative equation determines the number of principal components to be retained. The standard threshold of cumulative contribution rate typically set at 70%.
Finally, selecting the first k principal components, the score of the i-th sample on the j-th principal component is:
In terms of control variable selection, with reference to research literature [26], this paper selects income gap-related variables including GDP per capita, industrialization level, and education level. In those related variables, industrialization level is defined as the ratio of industrial added value to GDP, and education level is defined as the ratio of the number of higher education students to the permanent population.
4.2. Mechanism model of digital technology promoting non-farm employment
This subsection examines how digital technology facilitate non-farm employment of rural labor forces at the micro level. The CFPS data are utilized. This nationwide social tracking survey project collects longitudinal data across three levels (individual, household, and community), reflecting transformations in Chinese society, economy, population, education, and health.
Firstly, the mediating effect model of information acquisition and skill improvement channels is established:
where and represent information acquisition capability and skill enhancement capability of individual i, respectively. denotes the accessibility of digital technologies for individual i. stands for control variables. and are the stochastic error term, respectively. and are coefficients for information acquisition channels and skill enhancement channels correspondingly. If condition is met, Hypothesis H2a is validated; if condition is satisfied, Hypothesis H2b is substantiated. Then, one can obtain
The dependent variable non-farm employment is a binary variable. Under the assumption of normally distributed error terms, the following Probit model is established:
where is the cumulative distribution function (CDF) of the standard normal distribution. represents the observed value of non-farm employment for individual i. captures the total effect of internet use, reflecting its marginal effect on the probability of non-farm employment. is the stochastic error term following a normal distribution.
This paper takes rural residents with household registration as the analytical sample. The dependent variable is defined based on the respondent's primary occupation, where engagement in non-farm employment is assigned a value of 1. For the core explanatory variable digital, we adopt "whether access internet" as the measurement criterion. Both mobile devices and computers are considered simultaneously. If one of the two methods answers' yes', then digital=1, i.e.,
where and represent the network availability on mobile and computer devices, respectively.
For mediating variables, we employ the CFPS item "importance of the internet as an information channel" to measure information acquisition channels, and use "perceived importance of the internet for learning" to gauge skill enhancement channels. The selection of control variables mainly considers the individual level factors that affect the ability to use technology and employment opportunities, such as age, gender, health status, etc. The age limit is between 16-65 years old in rural labor force.
5. Empirical Analysis
5.1. Macro-data Analysis
5.1.1. Data Source and Preprocessing
This paper selects panel data from 31 provinces in China spanning 2012 to 2023. The data were sourced from the China Statistical Yearbook, Statistical Bulletin on National Economic and Social Development, and Migrant Workers Monitoring Survey Report published by the National Bureau of Statistics of China. Given the presence of missing values in the original dataset, this paper calculate these values using interpolation as succedaneum. The variable descriptions are shown in the Table 3.
The results of PCA are shown in Table 4. The variance contribution rates of and are 53.93% and 40.45%, respectively. The cumulative contribution rate is 94.38%, indicating that retaining the first and two principal components can fully capture information. As shown in Table 4, the first principal component (Comp1) is positive in all variables, reflecting the level of comprehensive digital technology. The second principal component (Comp2) has the highest load on the number of computers used per hundred people, which represents the difference in the popularity of infrastructure hardware. Then the digital technology can be obtained by the following formula:
where and denote the first principal component and the second principal component, respectively.
The average digital technology index of each province is shown in the Figure 8(a). The top five provinces are Beijing, Shanghai, Guangdong, Zhejiang and Jiangsu. Jiangxi Province ranks last. Take the three provinces with digital technology ranking 1, 16 and 31 respectively, this study draw the change trend of digital technology index over time. The results are shown in Figure 8(b). It is obvious that the digital technology index of each province has increased steadily.
5.1.2. Regression Effect Analysis
The descriptive statistics corresponding to the variables in Table 3 are given in Table 5. The mean value of digital technology is 0, and the variance is close to 1.
Through the Hausman test, the fixed effects (FE) model is selected to examine the impact of digital technology on income gap. The results are presented in Table 6, with the pooled ordinary least squares (OLS) model serving as a reference [38]. In Table 6, it is referred to as Model (1).
Model (2) excludes control variables. The statistically significant coefficient on digital (= -0.207, p<0.01) demonstrates that digital technology adoption exerts a significant narrowing effect on the income gap. Control variables are added to the models (3)-(5) in turn. The results show that the digital coefficient is negative in all models, indicating that the higher the level of digital technology development, the smaller the income gap. This verifies that the digital technology plays a positive role in narrowing the income gap. Thus, Hypothesis H1 is supported.
The control variables such as per capita GDP, industrialization level and education level also play positive roles in narrowing the income gap. Model (4) shows that the regression coefficient of digital technology is -0.119, which implies the income gap will be reduced by about 11.9% for each unit of digital technology. In (5), education level plays the most significant role in narrowing the income gap, and the regression coefficient of digital technology is -0.055. It shows that education mediates the role of digital technology (digital technology can indirectly narrow the gap by improving the level of education).
In the next section, this paper will continue to analyze how digital technology can promote the non-farm employment of rural labor force and narrow the income gap from the micro individual level.
5.1.3. Model robustness test
After regression analysis, the robustness test was performed. First, endogenetic treatment is carried out. The benchmark regression may be biased due to the two-way causal relationship between digital technology and income gap, endogenous problems such as variable measurement errors or missing variables. Model (2) in Table 7 shows the results of instrumental variable regression. Using the lagged one-year digital technology index as the instrumental variable, after controlling for endogeneity of the digital technology index, its effect on narrowing the income gap is still significant (coefficient = -0.102, p<0.05). The F-statistic in the first stage is greater than the critical value of 10, meeting the requirements for instrumental variable correlation. It shows that the estimated coefficient of digital technology is still significant, and the previous conclusion is reliable. After 1% tail reduction treatment, the coefficient of education expenditure decreased from -17.2 to -17.1, as shown in model (3), and its negative impact was still highly significant (p<0.01). The coefficient of digital technology increased to 0.06, indicating that the conclusion of the benchmark model is robust to extreme values. To sum up, the two robustness tests did not change the significance direction and economic significance of the core explanatory variables, which confirmed the reliability of the research conclusion.
5.2. Micro-data Analysis
5.2.1. Data Source and Preprocessing
This study empirically examines the impact of information acquisition and skill improvement channels on non-farm employment using the 2020 CFPS dataset [37]. The sample of CFPS covers the population of 25 provinces regions in China (except Hong Kong, Macao, Taiwan, Xinjiang, Tibet, Qinghai, Inner Mongolia, Ningxia and Hainan). The selection and definition of variables are shown in Table 8. The statistical description of the variables is shown in the Table 9.
5.2.2. Benchmark result analysis
Firstly, the test is conducted by gradually adding control variables. Model (1) does not include control variables. The coefficient of Digital is 0.927. Models (2)-(4) gradually incorporate control variables. The results indicate that whether control variables are included, the estimated coefficients of digital technology use are significantly positive at the 1% level. This indicates that digital technology has a significant promoting effect on non-farm employment, which is in line with expectations. Thus, Hypothesis H2 is supported.
The coefficient of Age is negative, indicating that as age increases, opportunities to participate in non-farm employment will decrease, which may be related to decreased physical strength and delayed skill updates. The coefficient of Gender is significantly positive, indicating that men participate more in non-farm employment, possibly due to differences in household division of labor. The coefficient of Health is significantly positive, indicating that the probability of non-farm employment can be increased by increasing the health level of individuals. In addition, the pseudo R2 increased from 8.29% to 10.73%, indicating that it belongs to medium fitting (in social science research, pseudo R2 of 0.1-0.3 is more common).

Table 10.
The impact of digital technology on non-farm employment of rural labor force.
| Variable | Model (1) | Model (2) | Model (3) | Model (4) | Model (5) Logit |
|---|---|---|---|---|---|
| Digital | 0.927*** | 0.693*** | 0.691*** | 0.692*** | 1.145*** |
| (0.063) | (0.072) | (0.072) | (0.072) | (0.121) | |
| Age | / | -0.022*** | -0.022*** | -0.022*** | -0.036*** |
| / | (0.003) | (0.003) | (0.003) | (0.005) | |
| Gender | / | / | 0.158*** | 0.160*** | 0.281*** |
| / | / | (0.060) | (0.060) | (0.103) | |
| Health | / | / | / | -0.011* | -0.013* |
| / | / | / | (0.027) | (0.046) | |
| Constant | -0.029 | 0.995*** | 0.916*** | 0.957*** | 1.537*** |
| (0.052) | (0.144) | (0.147) | (0.177) | (0.298) | |
| Observations | 2246 | 2246 | 2246 | 2246 | 2246 |
| Pseudo R2 | 0.0829 | 0.1046 | 0.1073 | 0.1073 | 0.1058 |
Note: Standard errors in parentheses* p < 0.1, ** p < 0.05, *** p < 0.01.
Secondly, the marginal effect value is calculated. Marginal effect quantifies the magnitude of the impact of changes in the independent variable on the dependent variable. When using non-linear regression models such as Logit and Probit, it is difficult to provide detailed explanations for the estimated coefficients after fitting. In this case, it is necessary to explore the impact of changes in the independent variable on the dependent variable by calculating the marginal effect values of each significant variable. There are three commonly used marginal effects: average marginal effect, marginal effect at the sample value, and marginal effect at a representative value. The results of calculating the average marginal effect are shown in Table 11. We can observe that the marginal effect of digital technology is 0.2013. That is to say, for individuals with average characteristics, the use of digital technology can increase the probability of non-farm employment by 20.13 percentage points.
Finally, stability tests are conducted. The Probit model is replaced with the Logit model to examine model specification sensitivity, with the results presented in Model (5) of Table 10 showing a digital technology coefficient of 1.15. The significant promotion of non-farm employment among rural labor by digital technology is validated.
5.2.3. Mediating effect analysis
The test results of the mediating effect of information acquisition channels and skill improvement channels are shown in Table 12. The Bootstrap mediation effect test method is employed to rigorously validate the transmission paths of information acquisition and skill enhancement, thereby mitigating biases inherent in traditional stepwise regression approaches.
The mediating effect of the information acquisition channel is 0.119 (p < 0.01), which is statistically significant at the 1% level. Its marginal effect is 0.0226, indicating that the use of digital technologies indirectly contributes to non-farm employment by approximately 2.26% through the information acquisition channel. Thus, Hypothesis H2a is supported.
The mediating effect coefficient of the skill enhancement pathway is 0.213 (p < 0.05), significant at the 5% level. Its marginal effect is 0.0691, suggesting that digital technology usage indirectly contributes to non-farm employment by approximately 6.91% through the skill enhancement pathway. Thus, Hypothesis H2b is supported.
The total mediating effect value of the two channels is 0.332, accounting for approximately 48% of the total effect. The results demonstrate that skills enhancement channels exert 1.7 times stronger effects on promoting non-farm employment compared to information acquisition channels. Consequently, prioritizing investments in digital skills training can significantly boost non-farm employment outcomes.
6. Conclusions
6.1. Findings
The persistent urban-rural income gap continues to hinder China's sustainable development and common prosperity goals. Promoting non-farm employment among rural laborers is pivotal to narrowing the urban-rural income gap. Digital technology provides relatively convenient channels for information acquisition and skill enhancement, enabling rural laborers to better participate in the labor market. First, from a macro-level perspective, the effects of digital technology advancement are empirically examined in relation to the urban-rural income gap. Second, from a micro-level perspective, the intrinsic mechanisms are explored by which rural laborers' participation in non-farm employment is facilitated through digital technology. The regression model between digital technology and income gap is constructed, along with a mediating effect model linking digital technology to non-farm employment. Panel data from 31 provinces and the CFPS data are utilized. Based on the analysis carried out in this article, we can get the following conclusions.
Digital technology plays a positive role in narrowing the income gap. The income gap will be reduced by about 11.9% for each unit of digital technology.
Digital technology significantly promotes non-agricultural employment. For individuals with average characteristics, the use of digital technology can increase the probability of non-farm employment by 20.13%.
Digital technologies promote non-farm employment through information acquisition channels. The use of digital technologies indirectly contributes to non-farm employment by approximately 2.26% through the information acquisition channel.
Digital technologies promote non-farm employment through skill enhancement channels. Digital technology usage indirectly contributes to non-farm employment by approximately 6.91% through the skill enhancement channel. Skill enhancement channels exert effects 1.7 times stronger than information acquisition channels in promoting non-farm employment.
6.2. Policy Recommendations
Based on the above findings, it is imperative to vigorously promote the adoption of digital technologies in rural areas. This study proposes the following policy optimization pathways:
Digital infrastructure enhancement. Priority should be given to deploying gigabit optical networks and 5G base stations in rural regions, with a focus on establishing county-level digital hubs. A dynamic monitoring mechanism should be implemented to ensure infrastructure coverage meets predefined benchmarks. Integrating digital infrastructure development into the rural revitalization evaluation system will align construction priorities with local employment demands.
Skill-oriented digital training systems. A nationwide digital skills certification and training network targeting rural laborers should be established. Through township government-university-enterprise tripartite partnerships, diversified vocational skills training programs should be offered for rural workers. Upon completion of training and certification, corresponding employment recruitment information should be systematically disseminated to workers. These digital training systems must integrate skill certification levels with wage scales to amplify the employment-promotion effects of skill enhancement channels.
Inclusive information infrastructure development. Standardized village-level digital information service centers must be constructed, integrating job posting dissemination and remote interview functionalities. Algorithmic regulation should be enforced to mitigate information bias in platform recommendations, thereby strengthening the foundational role of information acquisition channels.
Employment service optimization. An intelligent township level job matching system should be developed by aggregating data from leading recruitment platforms, using machine learning to improve recommendation accuracy. Algorithmic regulation should be enforced to mitigate platform recommendation bias, strengthening information acquisition channels. Targeted support should be provided to digital agriculture and rural e-commerce, coupled with a cross-regional coordination mechanism to balance labor demand across eastern, central, and western China.
Non-farm employment of the rural labor force is a key driver for rural development. In the context of advancing digital technology, it is essential to systematically integrate digital solutions with rural construction at multiple levels, building a digital countryside in the new era of socialism. Thereby, common prosperity can be effectively advanced. We believe that non-farm employment is a promising direction of further research in this area. Therefore, future work will aim to investigate the impact of the aforementioned policies on non-farm employment.
Author Contributions
All the authors made significant contributions to the work. Conceptualization, R.L. and X.C.; methodology, R.L.; software, R.L.; validation, R.L., J.Z. and X.C.; formal analysis, R.L.; investigation, R.L.; resources, X.C.; writing—original draft preparation, R.L.; writing—review and editing, R.L.; visualization, R.L.; supervision, J.Z.; project administration, R.L.; funding acquisition, R.L. All authors have read and agreed to the published version of the manuscript.
Funding
This work was funded by the Postgraduate Scientific Research Innovation Project of Hunan Province under Grant CX20231025.
Data Availability Statement
The data presented in this study are available on request from the corresponding author.
Acknowledgments
The authors would like to express their gratitude to the anonymous reviewers for their valuable comments and suggestions, which greatly enhanced the quality of this article. Appreciation is also extended to Southwestern University of Finance and Economics for providing access to the CHFS data.
Conflicts of Interest
The authors declare no conflicts of interest.
References
- Nanak, K.; Wang, X.; Ning, X. Growth and Common Prosperity in China. China World Econ. 2022, 30, 28–57. [Google Scholar]
- Sun, T.; Han, S. Research on Jiangsu’s Common Prosperity Based on Per Capita Disposable Income. Sustain. Dev. 2022, 12, 1730–1740. [Google Scholar] [CrossRef]
- Lang, R. ; Zhou, J. Analysis of the Impact of Labor Mobility Among the Three Industries on the Urban-Rural Income Gap[C]. Proceedings of the 2024 4th International Conference on Enterprise Management and Economic Development (ICEMED 2024), Jinan, China, 24-26, 05, 2024.
- Liu, T.; Lin, Y. Is the High-Speed Railway Network Narrowing the Urban-Rural Income Gap? Appl. Spat. Anal. Policy. 2025, 18, 1–27. [Google Scholar] [CrossRef]
- Wang, Y.; Zhou, L.; Li, T. The Impact Mechanism of Industrial Transformation and Upgrading on the Urban-rural Income Gap: An Analysis Based on the Threshold Effect of Digital Inclusive Finance Development. Financ. Res. Lett. 2025, 77, 106959. [Google Scholar] [CrossRef]
- Wan, H.; Li, S. The Effects of Household Registration System Discrimination on Urban-rural Income Inequality in China. Economic Research Journal 2013, 48, 43–55. [Google Scholar]
- Li, X.; Zhu, S. How digital transformation can affect corporate technology innovation: The role of income gap. Financ. Res. Lett. 2025, 75, 106826. [Google Scholar] [CrossRef]
- China Academy of Information and Communications Technology (CAICT). Research Report on the Development of China's Digital Economy (2024). Beijing, China, 2024.
- National Bureau of Statistics of China. 2024 China Statistical Yearbook. China Statistics Press, China, 2024; pp.2013-2023.
- Le, Y., Gao,et al. The impact of digital economy on urban-rural income gap under government intervention. J. Shenzhen Univ. Sci. Eng. 2023, 40, 296-307.
- Tu, Z.; Kong, J.; Sun, L. Can the Digital Economy Reduce the Rural-Urban Income Gap? Sustainability 2024, 16, 938. [Google Scholar] [CrossRef]
- Xia, H.; Yu, H.; Wang, S. Digital economy and the urban–rural income gap: Impact, mechanisms, and spatial heterogeneity. J. Innov. Knowl. 2024, 9, 100505. [Google Scholar] [CrossRef]
- Zhang, B.; Dong, W.; Yao, J. Digital Economy, Factor Allocation Efficiency of Dual-Economy and Urban-Rural Income Gap. Sustainability 2023, 15, 13514. [Google Scholar] [CrossRef]
- Deichmann, U.; Goyal, A. Will digital technologies transform agriculture in developing countries? Agric. Econ. 2016, 47, 21–33. [Google Scholar] [CrossRef]
- Zi, H.; Chang, H. Does e-commerce narrow the urban–rural income gap? Evidence from Chinese provinces. Internet Res. 2022, 32, 1427–1452. [Google Scholar]
- Zheng, L.; Liu, Y. Digital Economy, Agricultural Loans, and Urban–Rural Income Gap. Financ. Res. Lett. 2025, 77, 107034. [Google Scholar] [CrossRef]
- Deng, X.; Guo, M.; Liu, Y. Digital economy development and the urban-rural income gap: Evidence from Chinese cities. PLoS ONE 2023, 18, e0280225. [Google Scholar] [CrossRef] [PubMed]
- Dong, K.; Sun, K.; Li, P. Will Digital Technology Narrow the Income Gap: Evidence from Text Analysis of Government Work Report. J. Technol. Econ. 2023, 42, 90–103. [Google Scholar]
- Sun, X.; Kuang, X. Will advances in digital technology reduce the rural-urban income gap? Econ. Res.-Ekon. Istra 2023, 36, 2194954. [Google Scholar] [CrossRef]
- Shen, C.; Wu, X.; Shi, L. How does the digital economy affect the urban–rural income gap? Evidence from Chinese cities. Habitat Int. 2025, 157, 103327. [Google Scholar] [CrossRef]
- Kuznets S. Economic growth and income inequality.The gap between rich and poor. Routledge, 2019; pp. 25-37.
- Liang, Y.; Li, S.; Sun, Z. Non-farm employment, agricultural mechanization and urban-rural income gap. Stat. Decis. 2024, 40, 90–94. [Google Scholar]
- Han, L.; Lv, Q.; Zhang, Q. Digital financial inclusion, credit access and non-farm employment. Financ. Res. Lett. 2025, 72, 106510. [Google Scholar] [CrossRef]
- Tian, G.; Zhang, X. Digital Economy, Non-agricultural Employment, and Division of Labor. J. Manag. World, 2022, 38, 72–84. [Google Scholar]
- Atasoy, H. The effects of broadband internet expansion on labor market outcomes. ILR Revi. 2013, 66, 315–345. [Google Scholar] [CrossRef]
- Wang, J.; Han, Y. The Impact of Internet Use on Non-farm Employment of Rural Labor Force—Theoretical Mechanism and Micro Evidence. Econ. Probl. 2023, 88–97. [Google Scholar]
- Chen, F.; Shi, S. Internet Usage and Non-Farm Employment of Rural Labor: Micro-Survey Data from Rural China. Soc. Indic. Res. 2024, 1–22. [Google Scholar] [CrossRef]
- Jiang, X.; Niu, J. Research on the Relationship Between Digital Economy, Rural Human Capital and Urban-rural Income Gap. Hum. Resour. Dev. China, 2024, 41, 80–92. [Google Scholar]
- China Academy of Information and Communications Technology (CAICT). White Paper on the Practice of Digital Rural Development (2024). Beijing, China, 2024, China.
- Lewis,W. A. Economic development with unlimited supplies of labour. Manch. Sch. 1954, 22, 22,139–191. [Google Scholar]
- Fang, J. Research on the impact of Internet use on non-agricultural employment of rural labor force in China. Yunnan University. 2022. [Google Scholar]
- National Bureau of Statistics(NBS). Migrant Worker Monitoring and Survey Report. Beijing,China, 2024.
- Cao, P.; Tao, H. Sustainable Development in Gansu Province: Theil Index and Cluster Analysis. Sustainability 2024, 16, 4518. [Google Scholar] [CrossRef]
- Banu, B.; Victor, H.; Zou, H. Unbiased estimation of the Gini coefficient. Stat. Probab. Lett. 2025, 222, 110376. [Google Scholar]
- Lian, M.; Chen, L.; Hui, C. On the Relationship Between the Gini Coefficient and Skewness. Ecol. Evol. 2024, 14, 70637. [Google Scholar] [CrossRef]
- Liu, R.; Sui, X.; Wang, W. A research on the impact of Internet use on income inequality in rural China: Empirical analysis based on CGSS data. J. Chongqing Univ. 2022, 28, 79–95. [Google Scholar]
- Li, G.; Yin, Z.; Jia, N. Data you need to know about China--Research Report of China Household Finance Survey•2012. Springer-Verlag Berlin Heidelberg. 2014. p.172.
- Baltagi, B. Econometric Analysis of Panel Data. Econom. Theory 2001, 5, 747–754. [Google Scholar]
Figure 1.
The framework of this study.
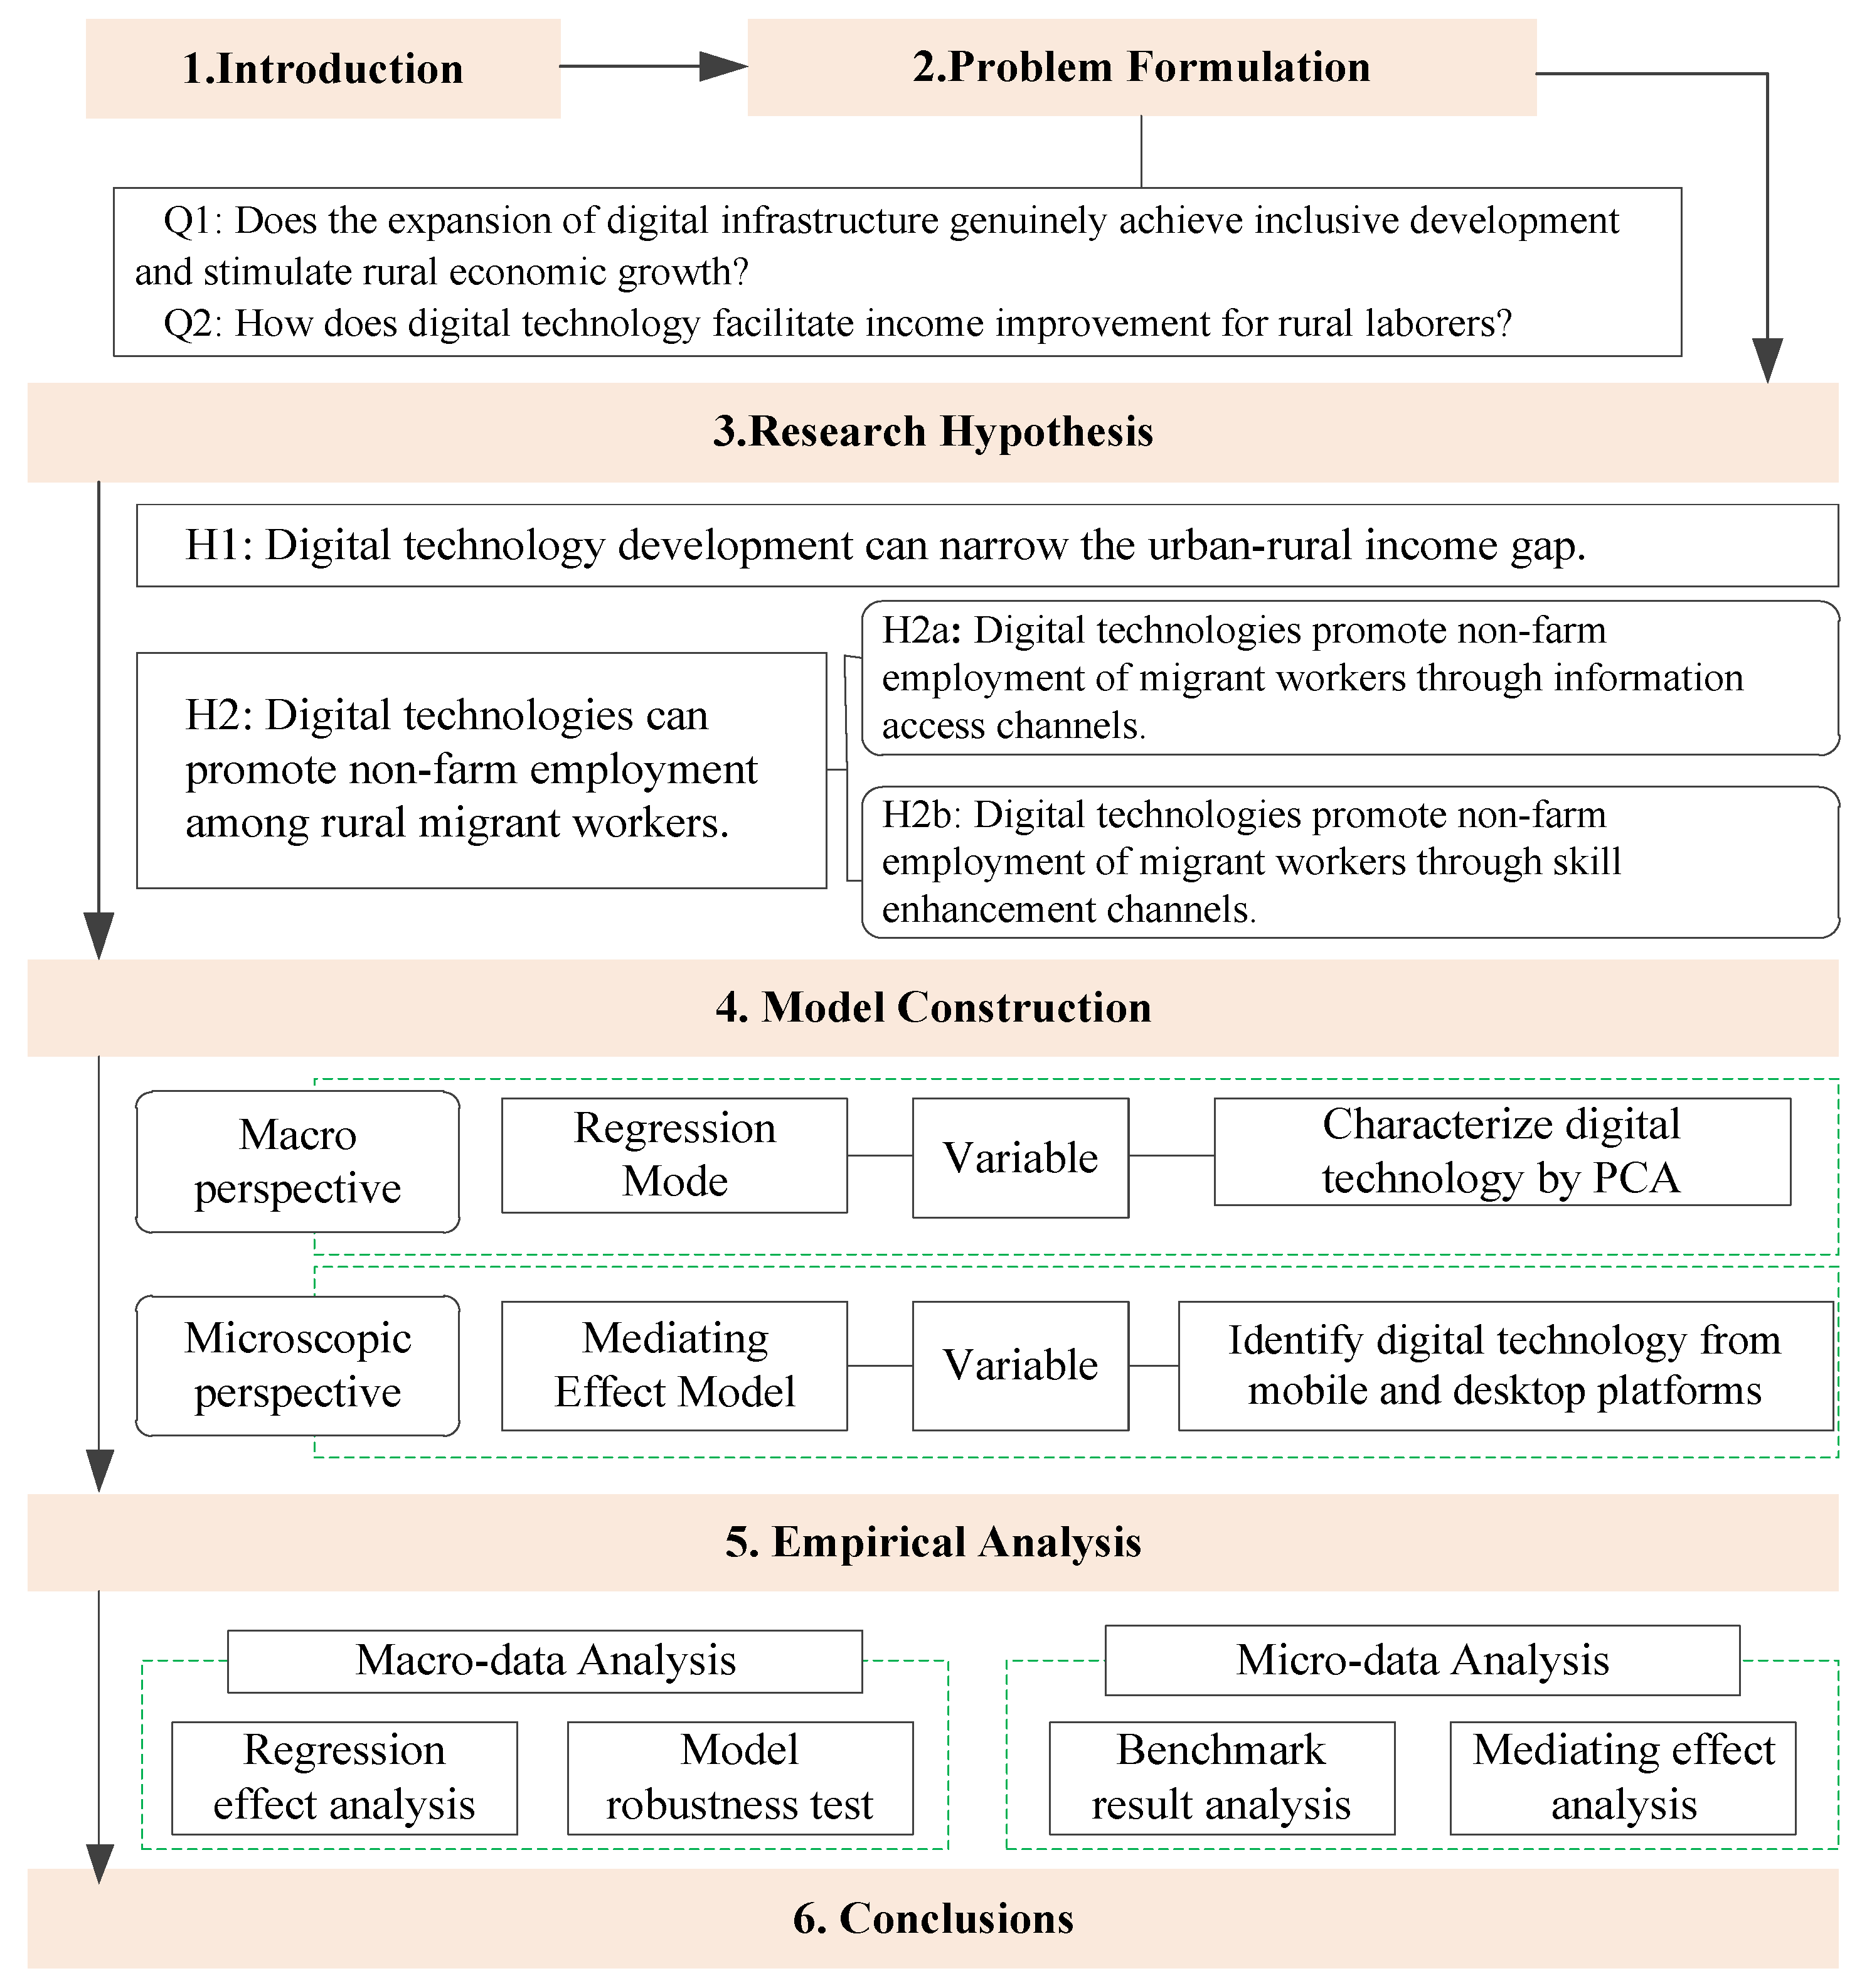
Figure 2.
Schematic Diagram of the Composition of the Digital Economy.
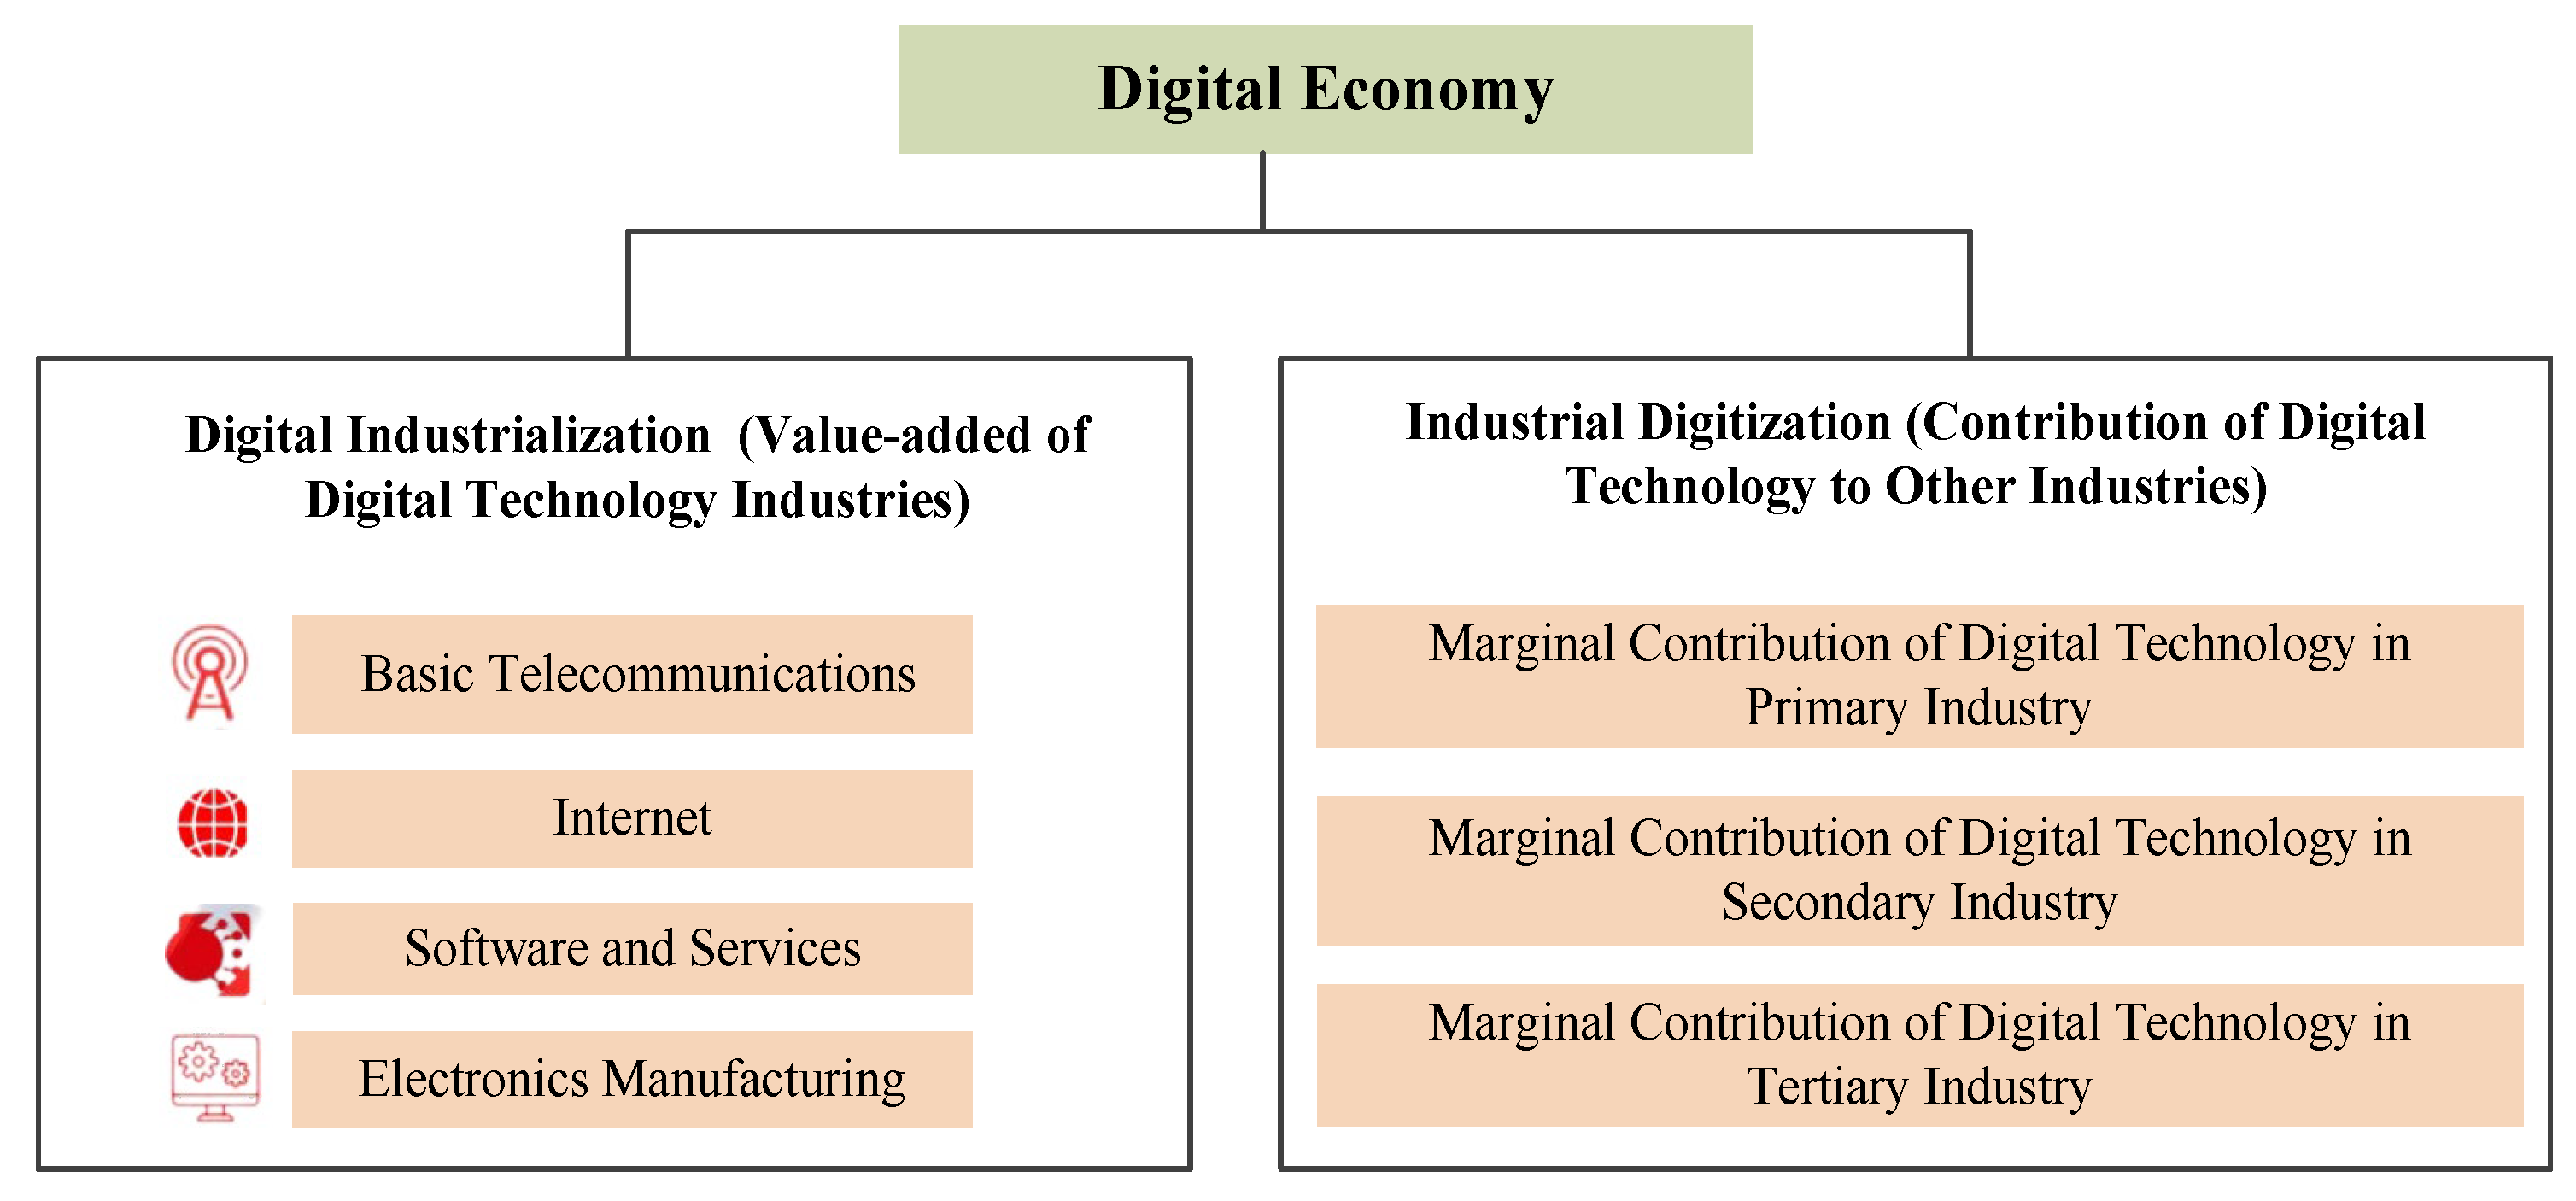
Figure 3.
Popularization Rate of Internet and Mobile Telephone from 2012 to 2024 in China. (a) Popularization Rate of Mobile Telephone (set/100 persons). (b) Popularization Rate of Internet.
Figure 3.
Popularization Rate of Internet and Mobile Telephone from 2012 to 2024 in China. (a) Popularization Rate of Mobile Telephone (set/100 persons). (b) Popularization Rate of Internet.
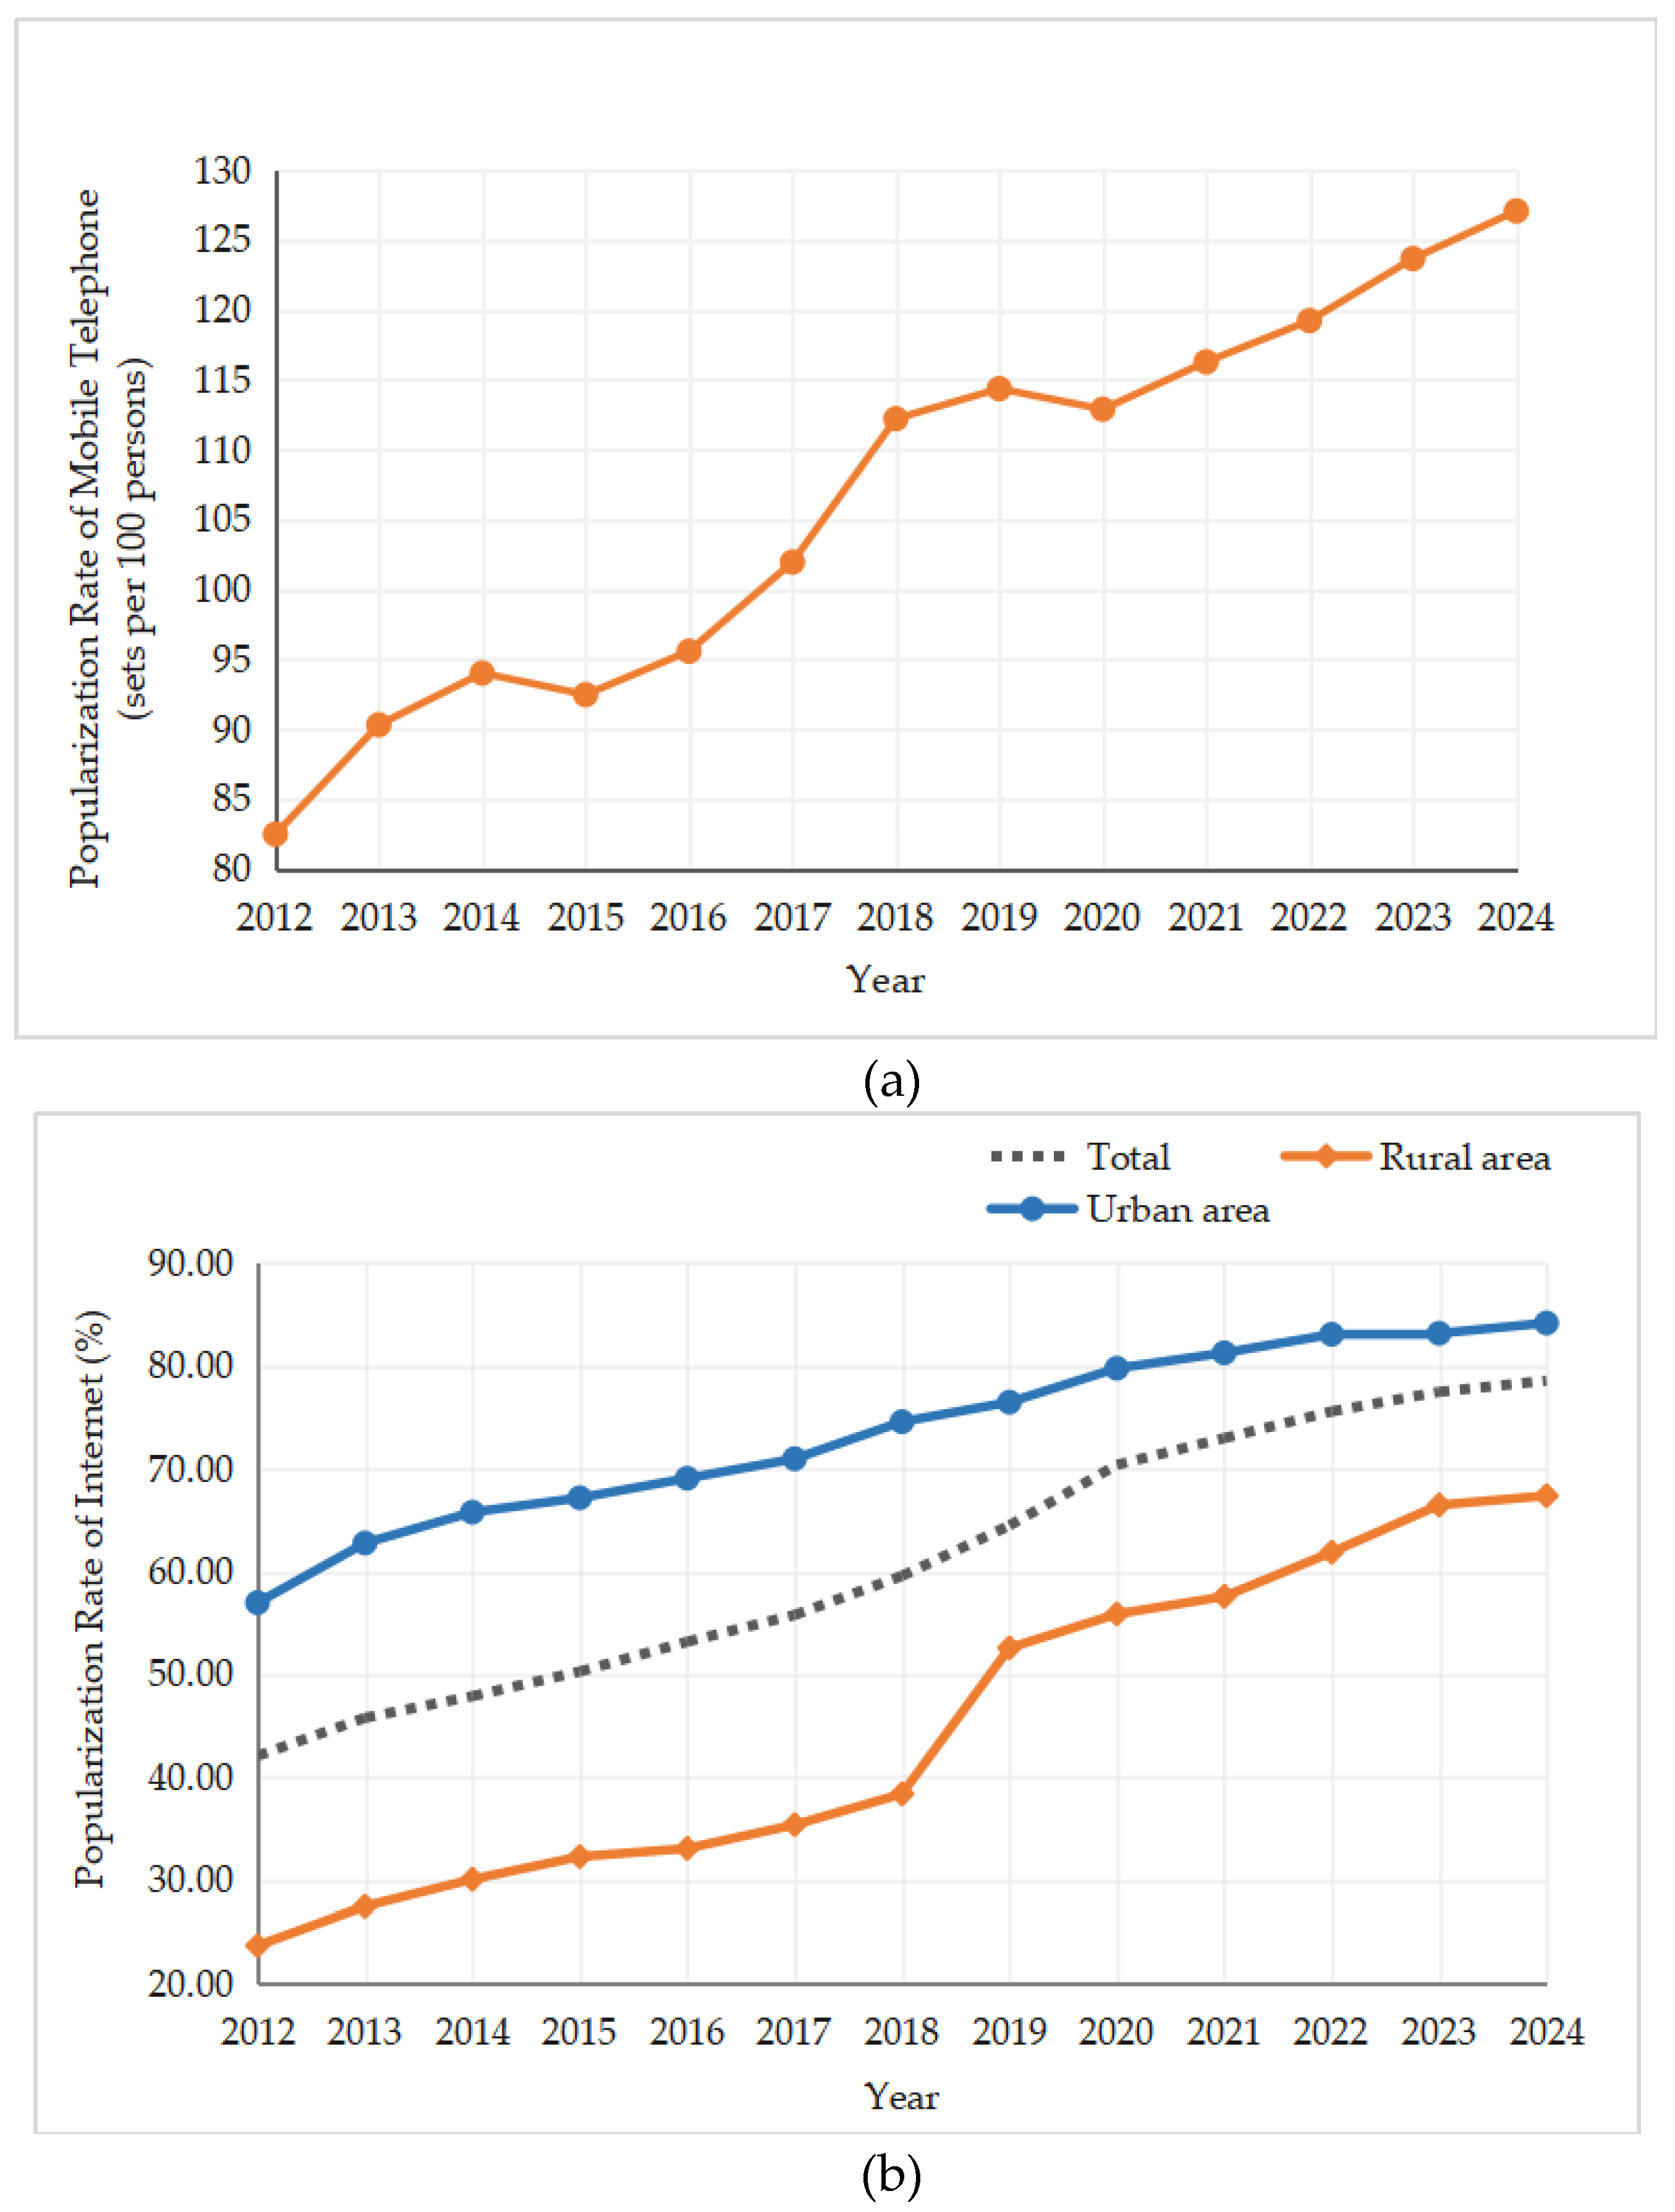
Figure 4.
PCDI and ratio between urban and rural areas. (a) Urban and rural PCDI. (b) Ratio of urban and rural PCDI.
Figure 4.
PCDI and ratio between urban and rural areas. (a) Urban and rural PCDI. (b) Ratio of urban and rural PCDI.
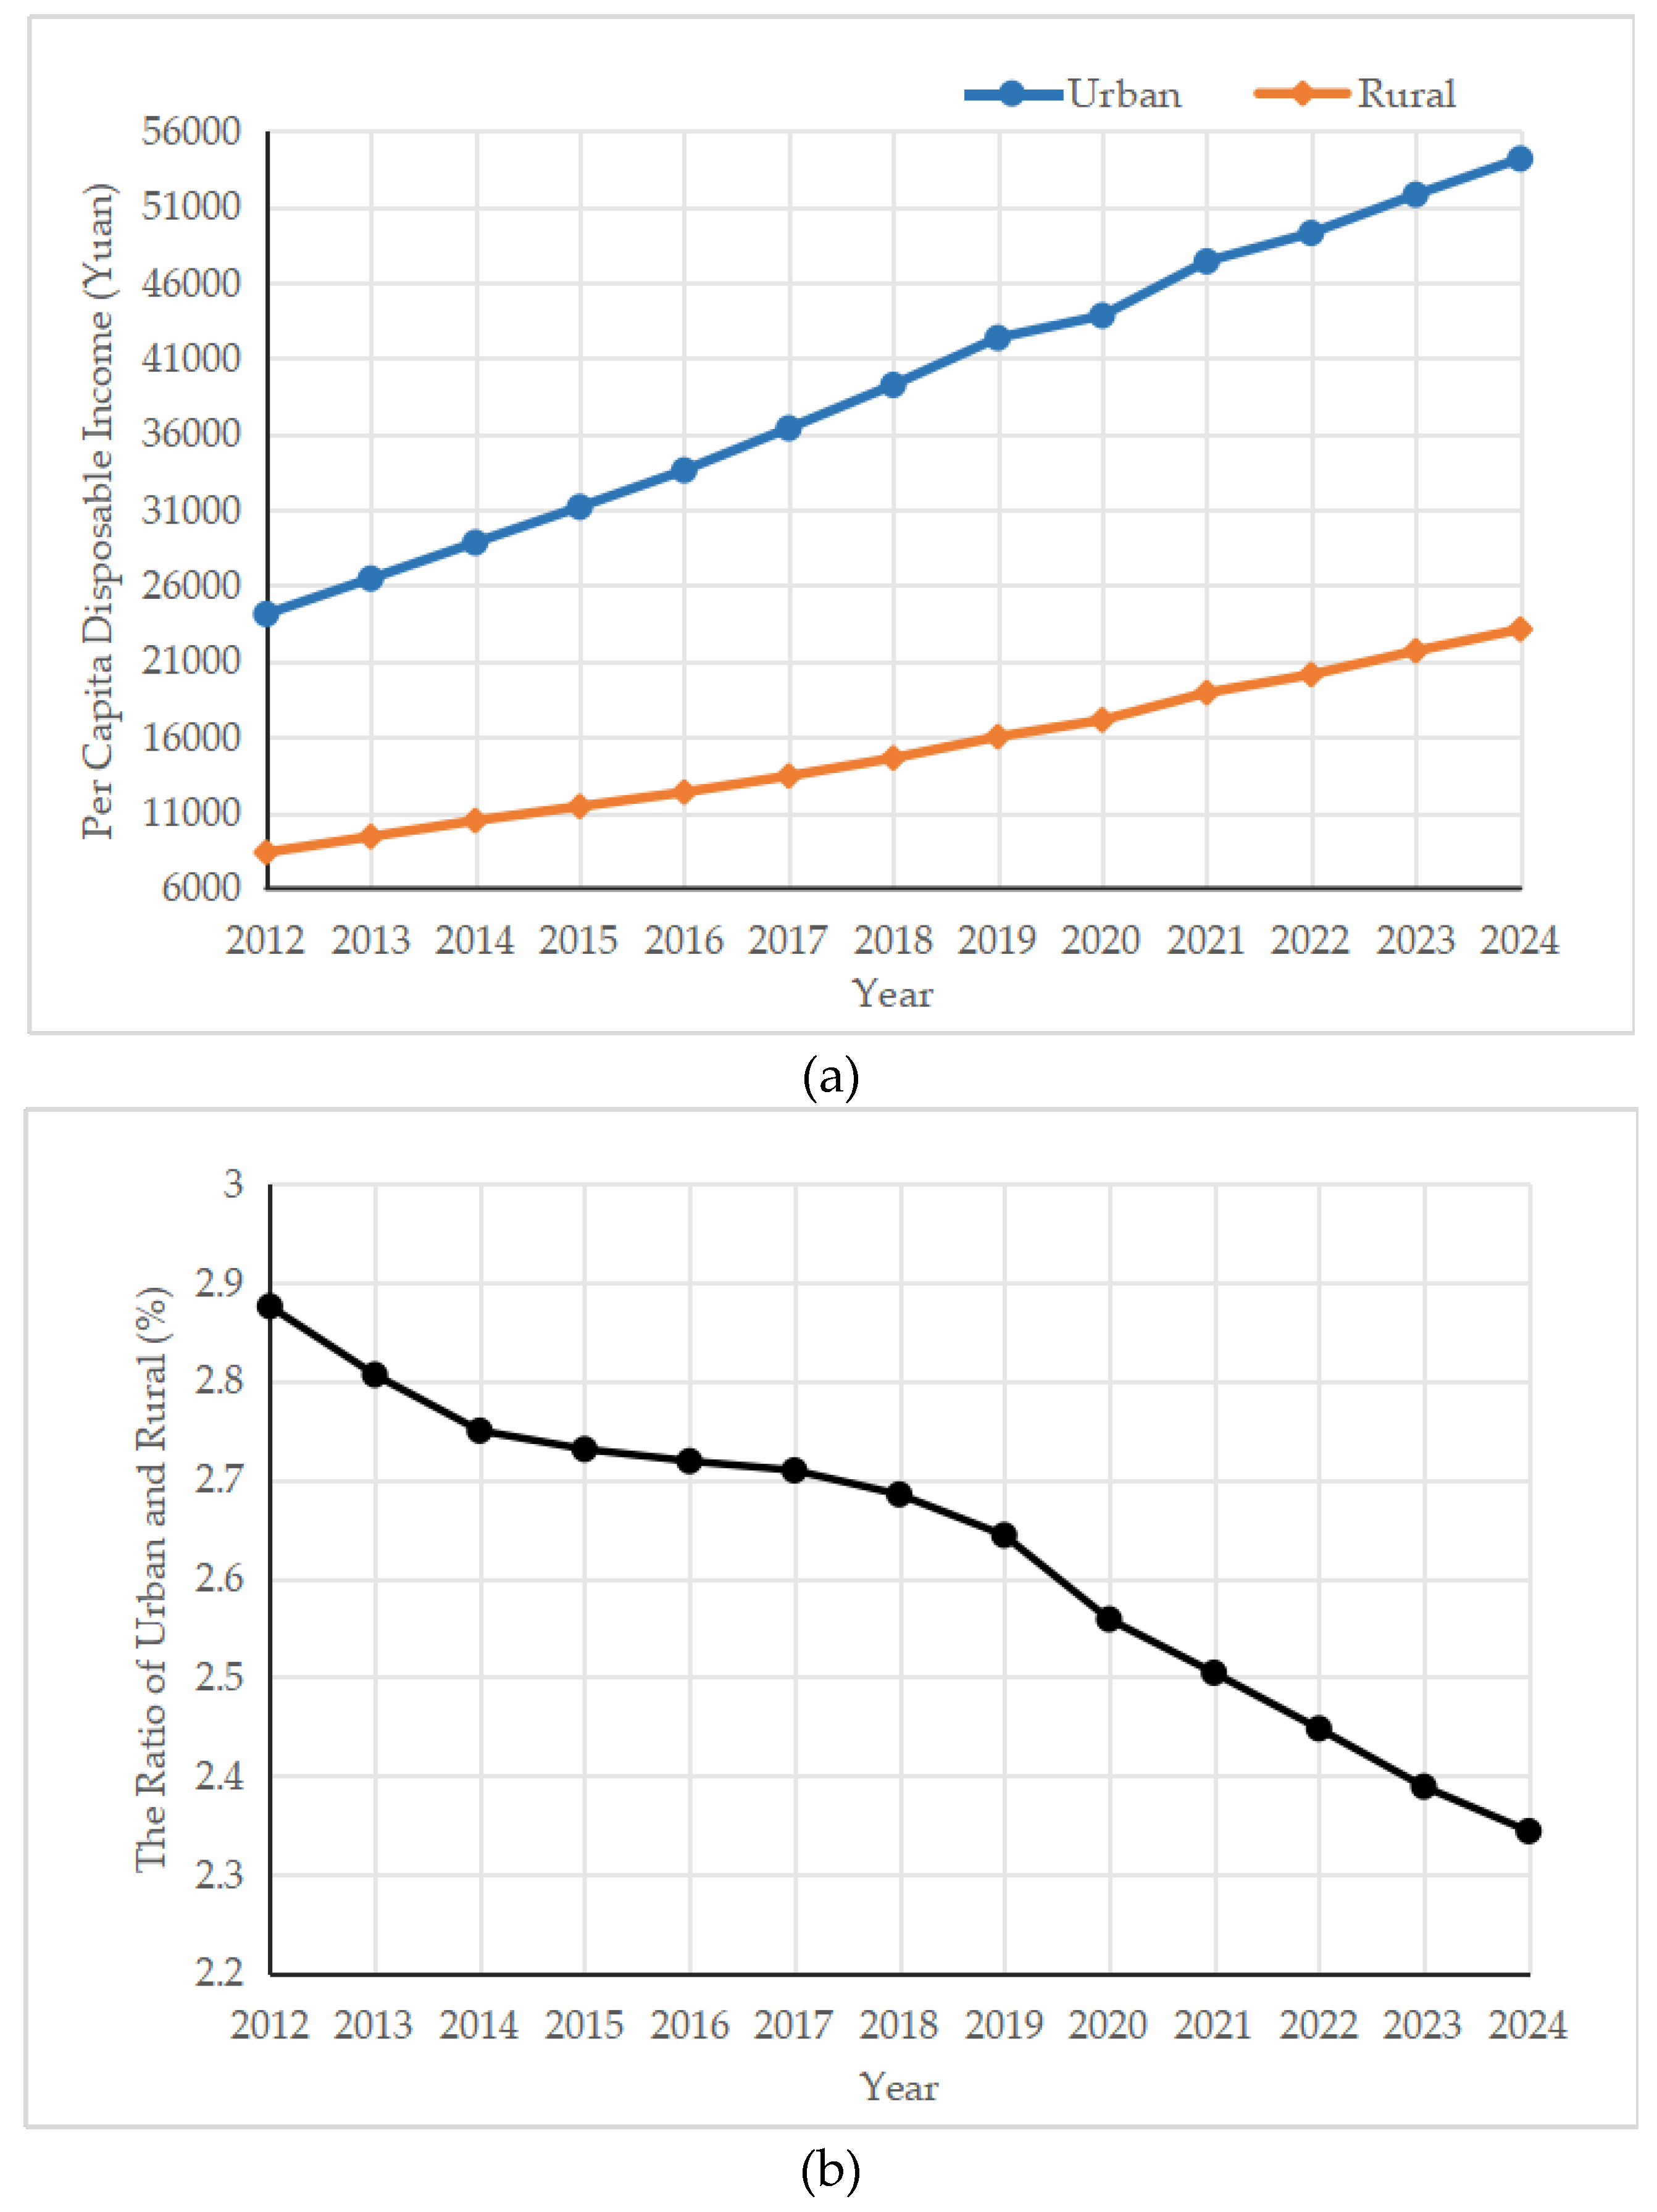
Figure 5.
The number of migrant workers in China from 2012 to 2024. (a) Proportion of migrant workers in total employment. (b)The number and growth rate of migrant workers.
Figure 5.
The number of migrant workers in China from 2012 to 2024. (a) Proportion of migrant workers in total employment. (b)The number and growth rate of migrant workers.
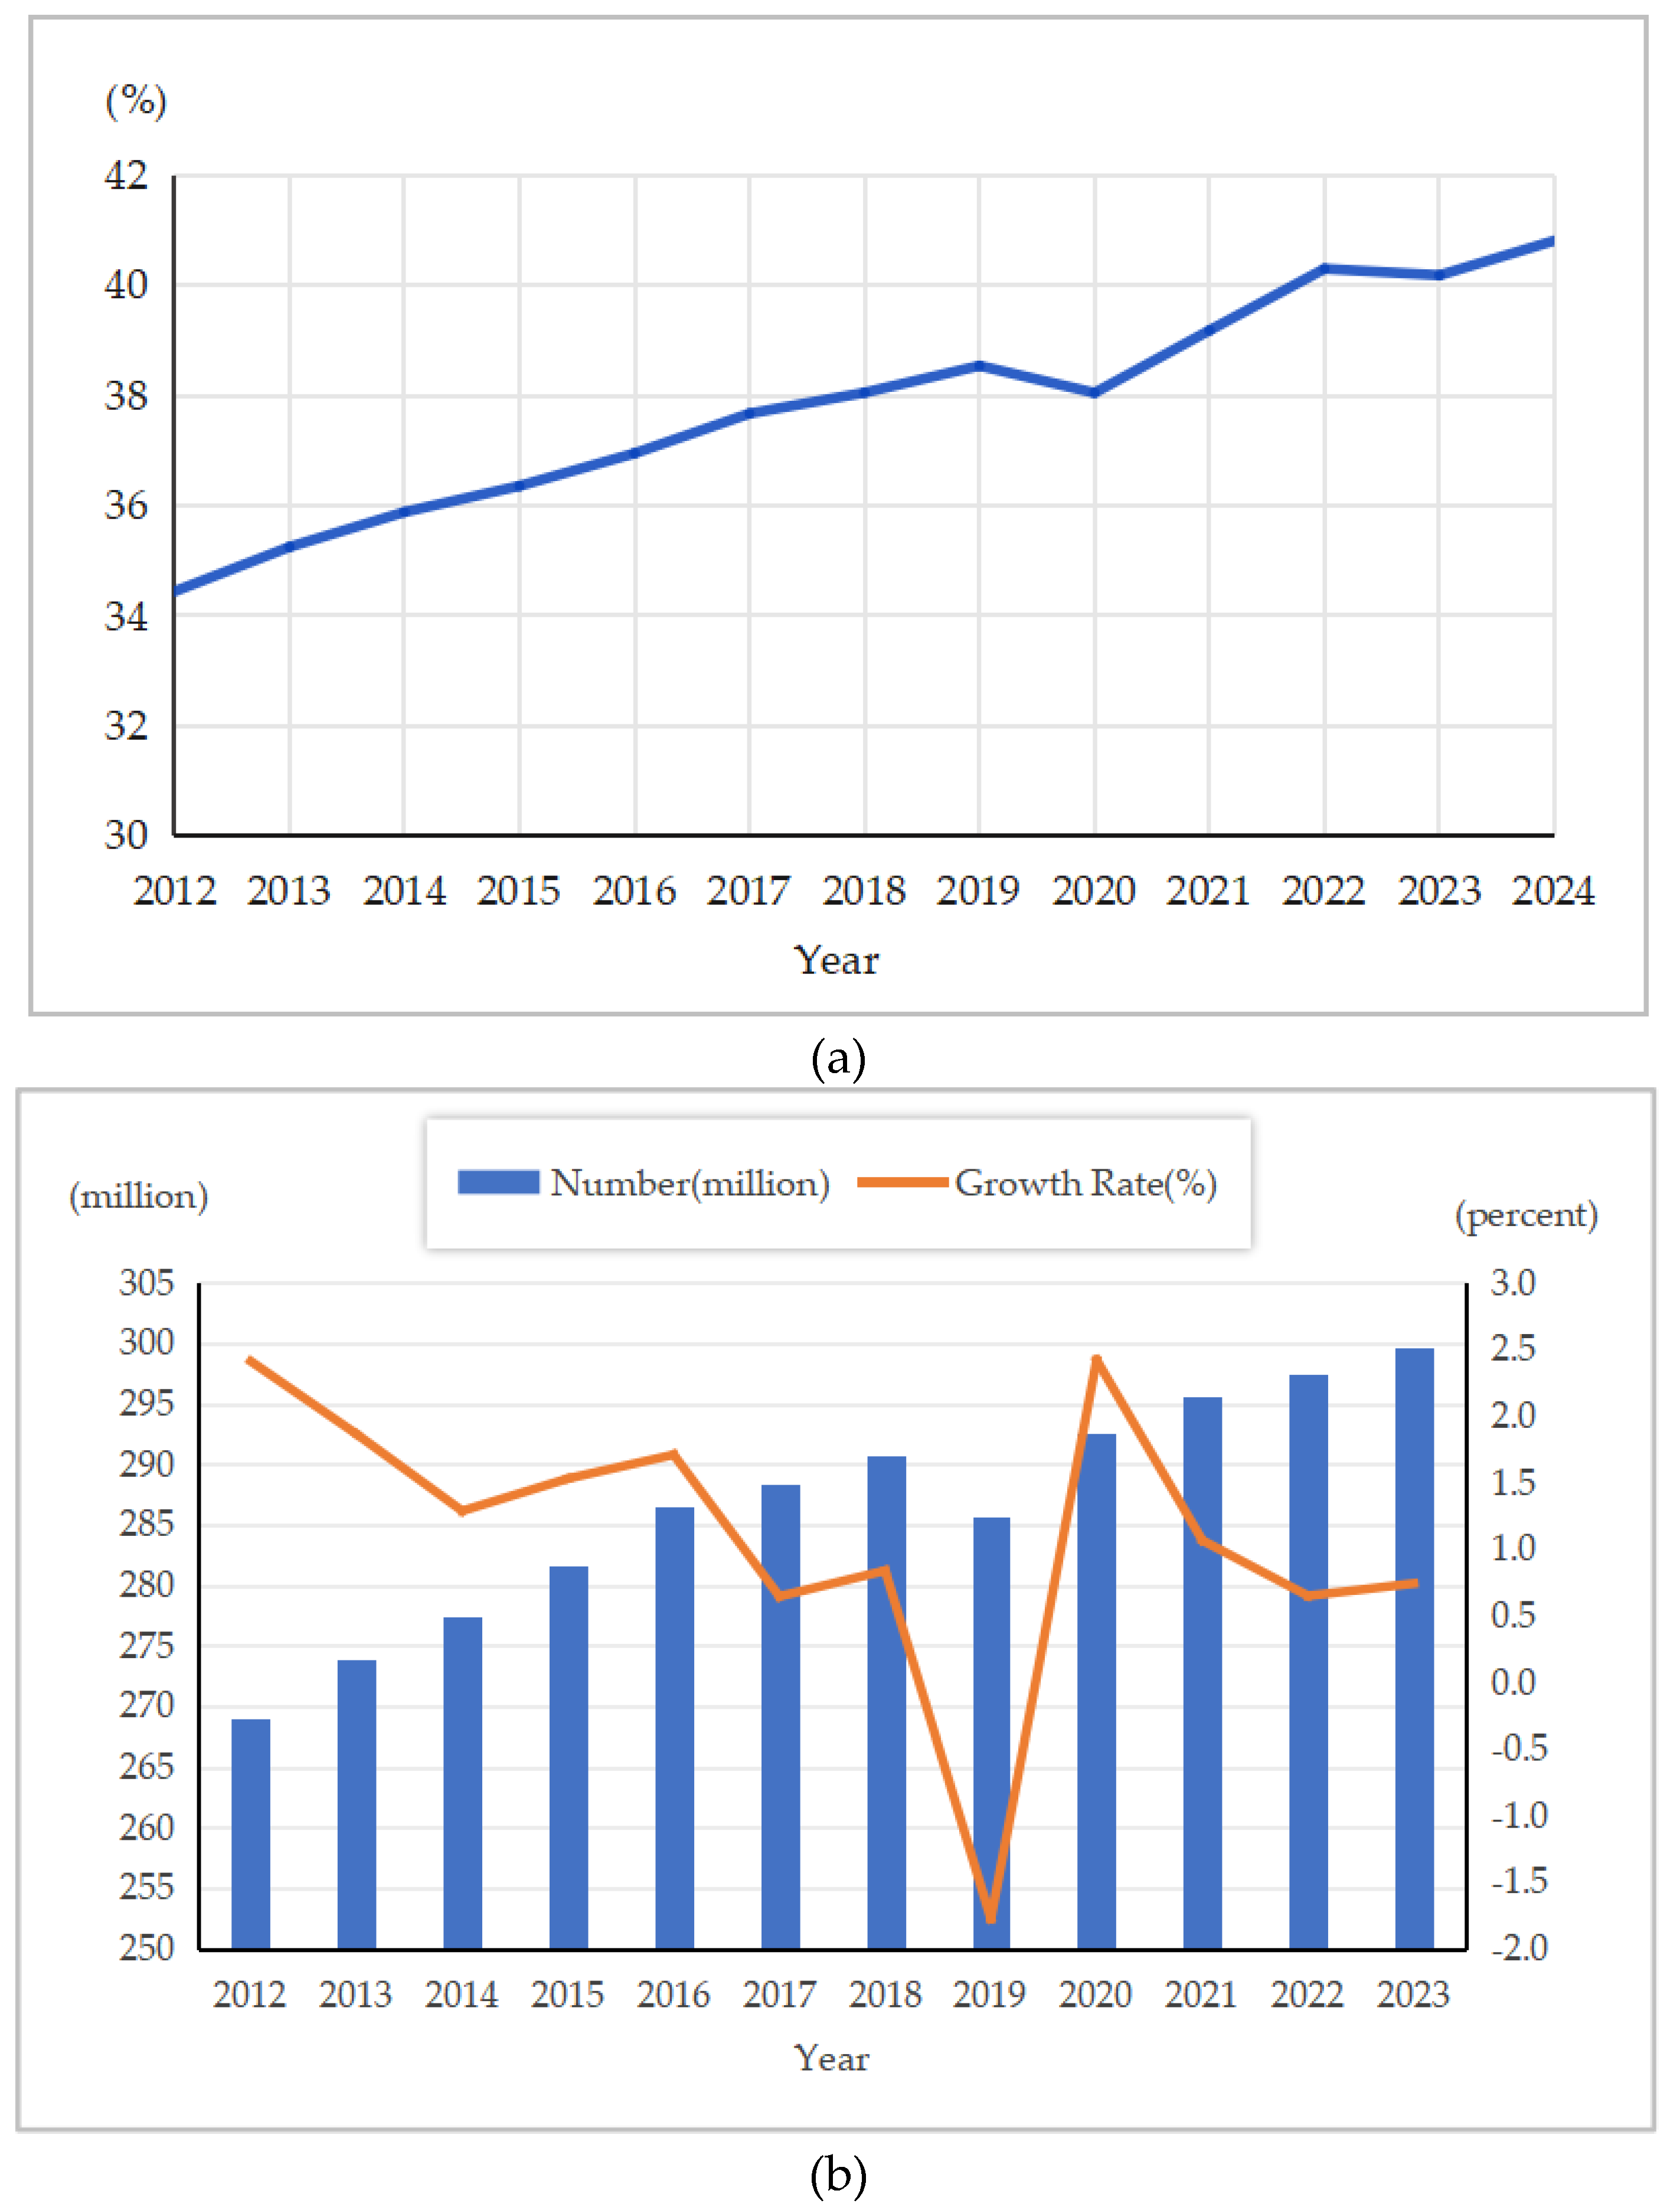
Figure 6.
Proportion of migrant workers employed in the secondary and tertiary industries from 2012 to 2023.
Figure 6.
Proportion of migrant workers employed in the secondary and tertiary industries from 2012 to 2023.
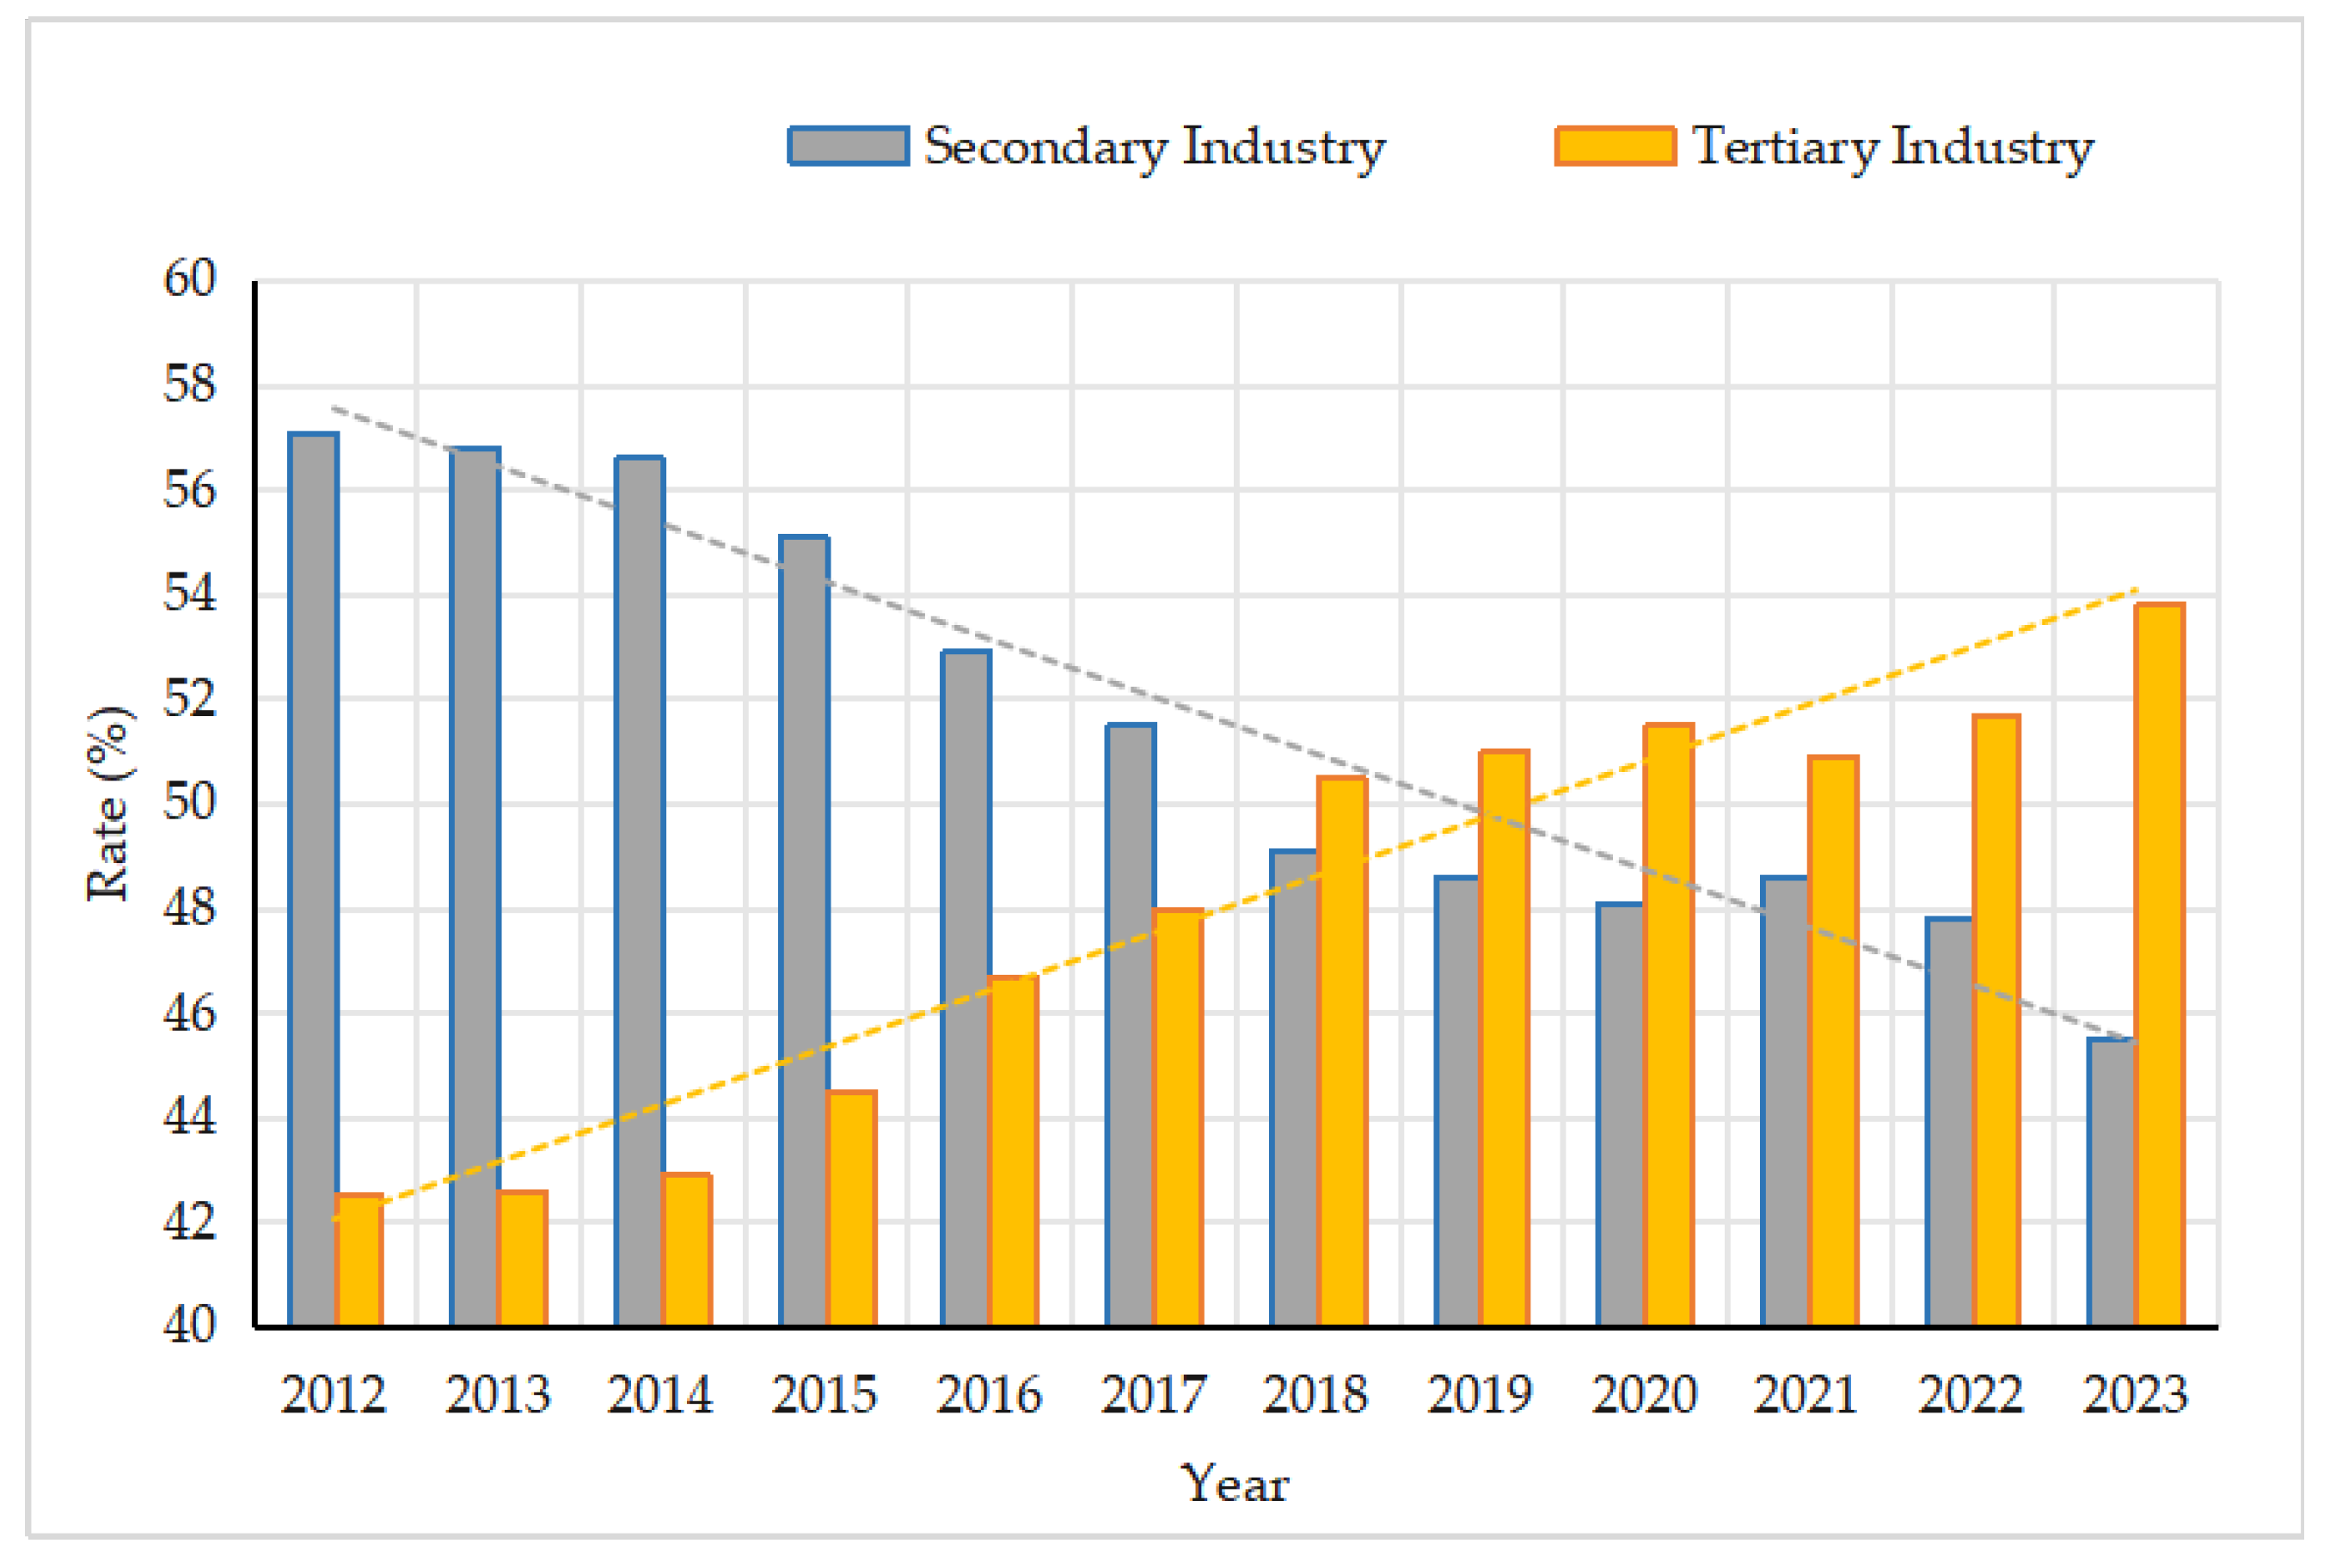
Figure 7.
The impact mechanism of digital technology on non-farm employment.
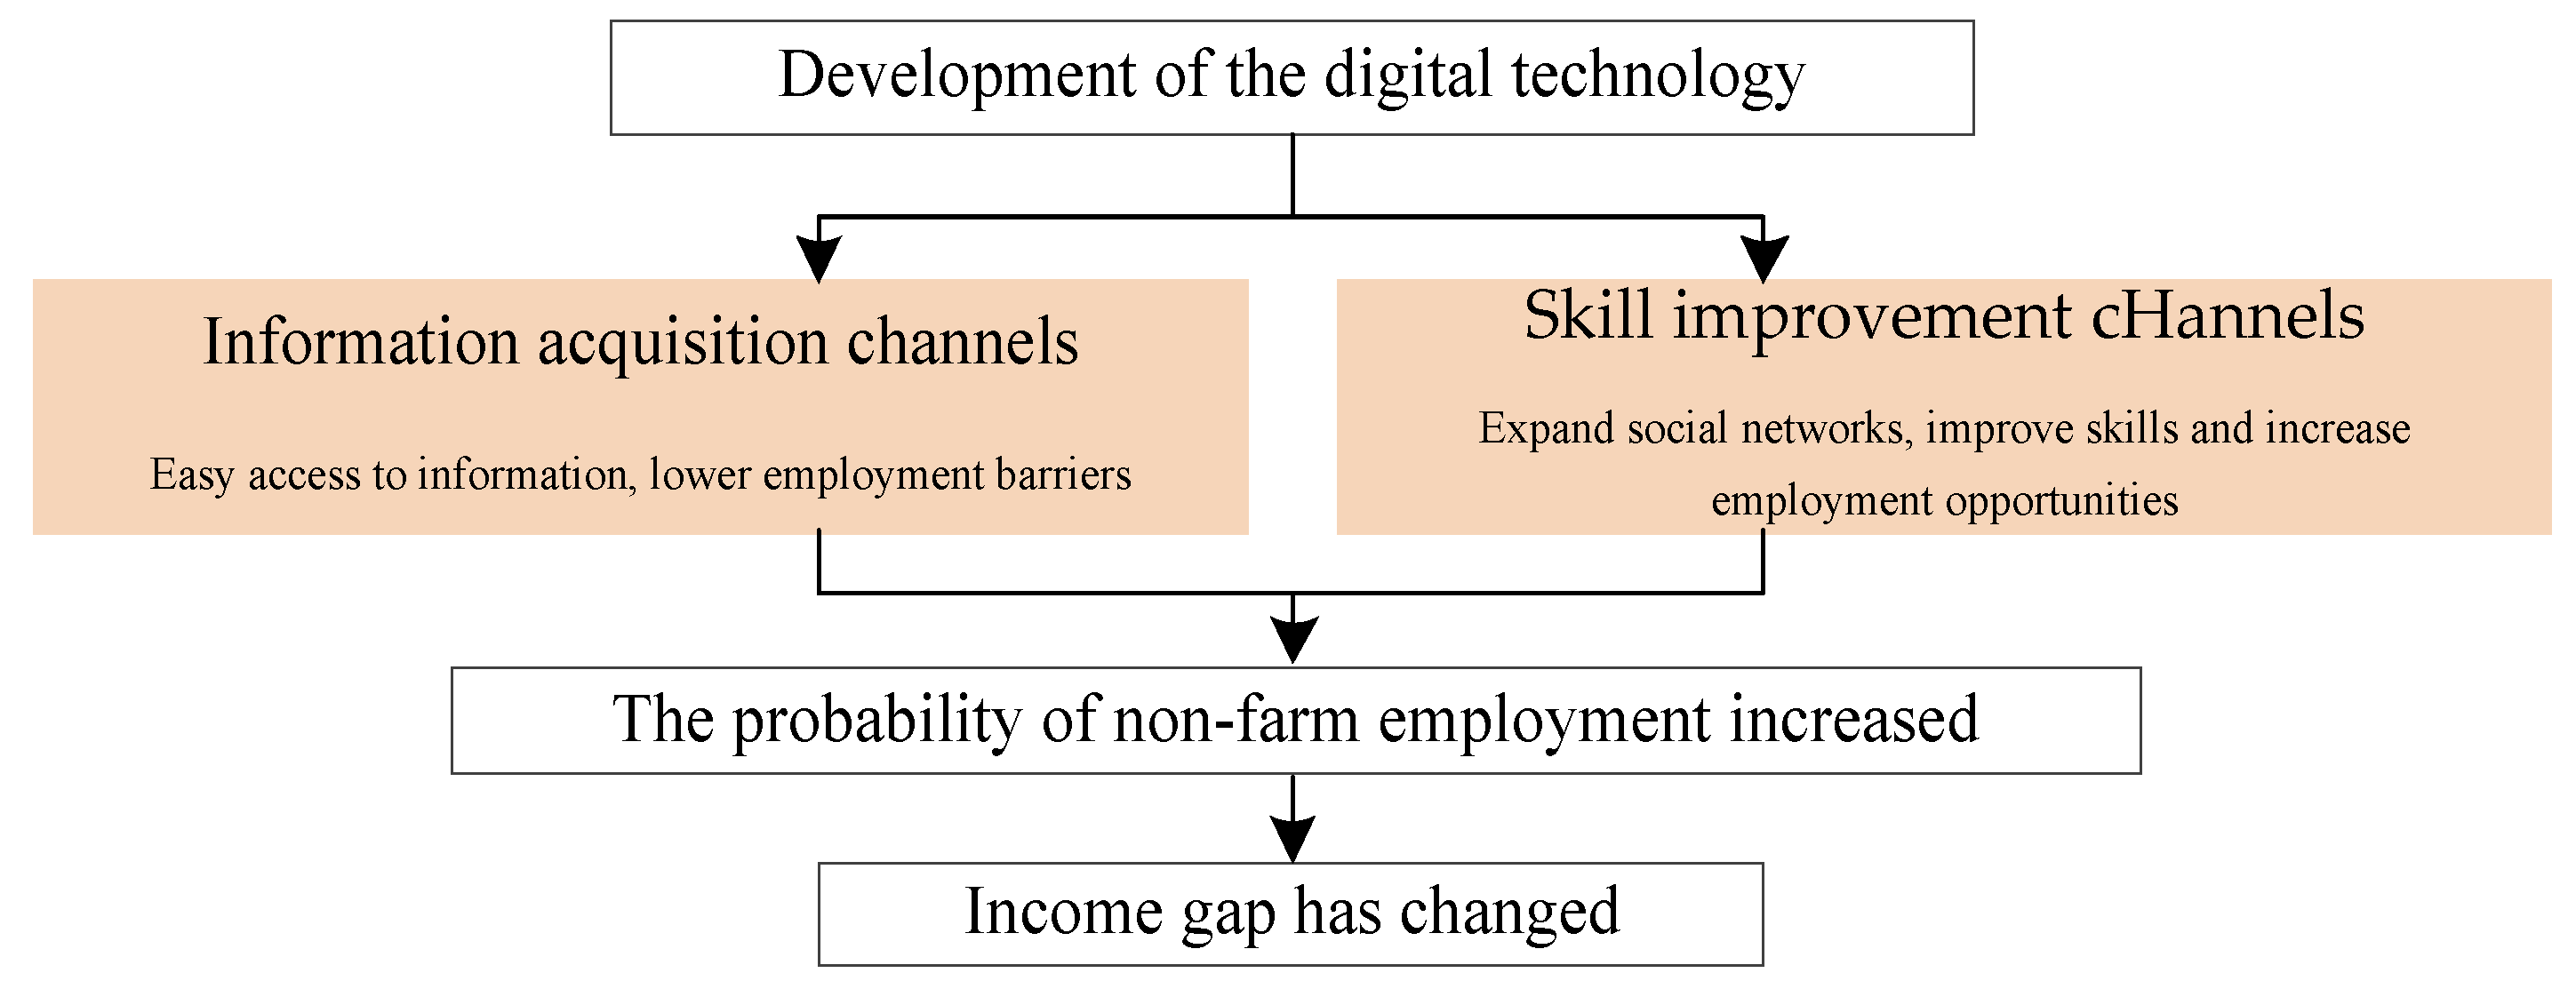
Figure 8.
Statistics on the development of digital technology. (a) Average digital technology index of each province. (b) Digital technology trends from 2012 to 2023.
Figure 8.
Statistics on the development of digital technology. (a) Average digital technology index of each province. (b) Digital technology trends from 2012 to 2023.
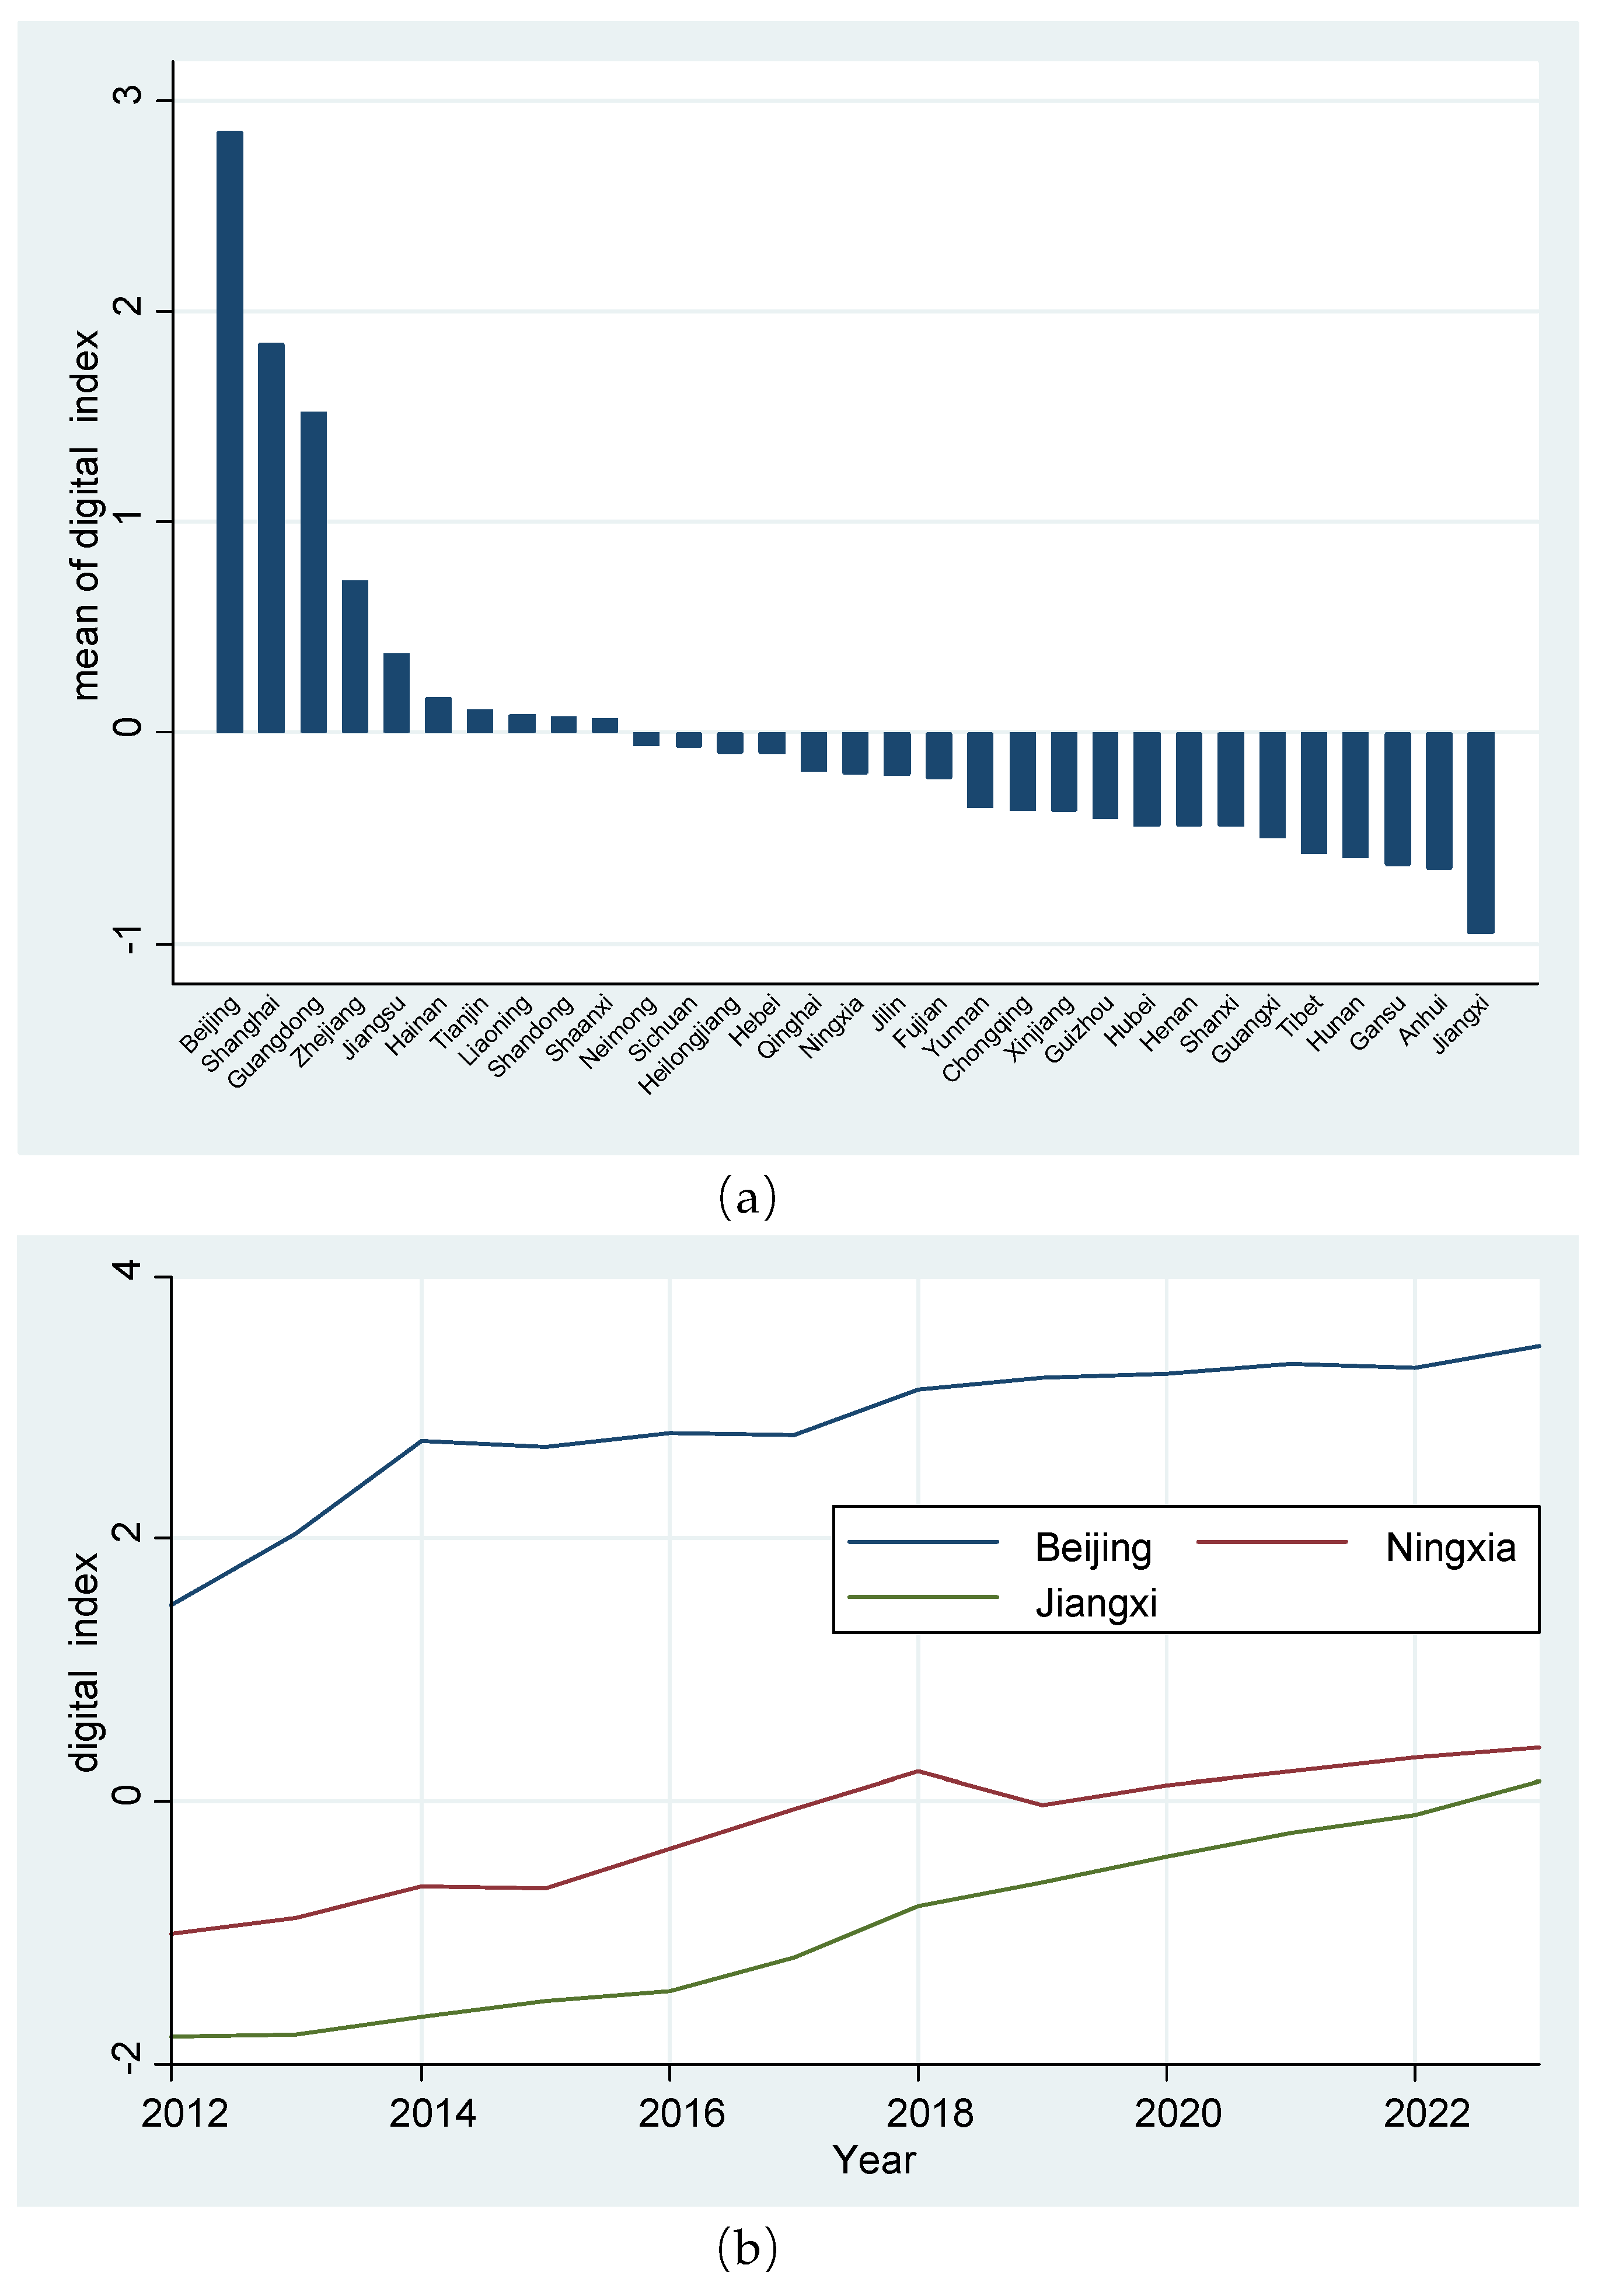
Table 1.
PCDI by Income Quintile in 2024.
| PCDI of households by income quintile | Urban households (yuan) |
Rural households (yuan) |
Ratio |
|---|---|---|---|
| Lowest 20% Income Households | 18003 | 5410 | 3.3277 |
| Second 20% Income Households | 33351 | 13298 | 2.5080 |
| Third 20% Income Households | 48508 | 19337 | 2.5086 |
| Fourth 20% Income Households | 68151 | 27060 | 2.5185 |
| Highest 20% Income Households | 113763 | 53805 | 2.1144 |
Table 2.
Index Variable Selection.
| Index layer | Unit |
|---|---|
| Popularization rate of mobile telephone | set/100 persons |
| Broad band subscribers of internet | 10000 subscribers |
| Mobile internet subscribers | 10000 subscribers |
| Computers used per 100 persons | unit |
Table 3.
Variable Descriptions.
| Variable type | Symbol | Variable name | Metric method |
|---|---|---|---|
| Explained variable | Gap | Urban-rural income gap | Equation (2) |
| Explanatory variable | Digital | Digital technology | Calculation by PCA |
| Control Variable | GDP | Per capita GDP | Take logarithm of provincial GDP |
| Industrialization | Industrialization Level | Industrial added value / GDP | |
| Education | Educational Level | Number of students in colleges and universities / Permanent resident population |
Table 4.
Statistical results of PCA on digital technology indicators.
| Statistical indicators | Principal components | |||||
|---|---|---|---|---|---|---|
| Component | Eigenvalue | Proportion(%) | Popularization rate of mobile telephone | Broad band subscribers of internet | Mobile internet subscribers | Computers used per 100 persons |
| Comp1 | 2.15737 | 53.93 | 0.499 | 0.562 | 0.555 | 0.357 |
| Comp2 | 1.61783 | 40.45 | 0.489 | -0.415 | -0.428 | 0.636 |
Table 5.
Statistical description of variables corresponding to Table 3.
Table 5.
Statistical description of variables corresponding to Table 3.
| Variable | Obs | Mean | Std | Min | Max |
|---|---|---|---|---|---|
| Digital | 372 | 1.04e-09 | 1.0008 | -1.7873 | 3.4585 |
| Gap | 372 | 2.5130 | 0.38139 | 1.7048 | 3.6461 |
| GDP | 372 | 9.8543 | 1.0010 | 6.5655 | 11.8180 |
| Industrialization | 372 | 0.3179 | 0.0873 | 0.0705 | 0.5418 |
| Education | 372 | 0.0214 | 0.0062 | 0.0085 | 0.0437 |
Table 6.
Benchmark regression results.
| Variable | Model (1) OLS | Model (2) | Model (3) | Model (4) | Model (5) |
|---|---|---|---|---|---|
| Digital | -0.050*** | -0.207*** | -0.076*** | -0.119*** | -0.055* |
| (0.017) | (0.016) | (0.027) | (0.032) | (0.031) | |
| GDP | -0.094*** | -0.329*** | -0.299*** | -0.252*** | |
| (0.015) | (0.052) | (0.057) | (0.060) | ||
| Industrialization | -0.146 | -0.800*** | -0.663** | ||
| (0.221) | (0.279) | (0.303) | |||
| Education | -26.091*** | -17.228*** | |||
| (2.862) | (3.138) | ||||
| Constant | 4.048*** | 2.513*** | 5.757*** | 5.718*** | 5.573*** |
| (0.109) | (0.000) | (0.515) | (0.575) | (0.581) | |
| Time fixed | control | control | control | control | control |
| Provincial fixed | control | control | control | control | control |
| N | 372 | 372 | 372 | 372 | 372 |
| R-squared | 0.405 | 0.711 | 0.770 | 0.787 | 0.819 |
Note: Standard errors in parentheses * p < 0.1, ** p < 0.05, *** p < 0.01.
Table 7.
Regression results of instrumental variables.
| Variable | (1) Benchmark model (FE) | (2) Instrumental variable method | (3) Tailing treatment (FE) |
|---|---|---|---|
| Digital-index | -0.055* | -0.102** | -0.064** |
| (0.031) | (0.041) | (0.030) | |
| Provincial GDP (100 million yuan) | -0.252*** | -0.171** | -0.244*** |
| (0.060) | (0.073) | (0.063) | |
| Degree of industrialization(%) | -0.663** | -1.013*** | -0.825*** |
| (0.303) | (0.325) | (0.278) | |
| Educational level | -17.228*** | -15.771*** | -17.096*** |
| (3.138) | (3.234) | (3.314) | |
| Constant | 5.573*** | 4.851*** | 5.542*** |
| (0.581) | (0.687) | (0.620) | |
| N | 372 | 341 | 372 |
| R-squared | 0.819 | / | 0.823 |
Note: Standard errors in parentheses * p < 0.1, ** p < 0.05, *** p < 0.01.
Table 8.
Selection and definition of indicator variables.
| Variable type | Symbol | Variable name | Variable definition | Explanation |
|---|---|---|---|---|
| Explained variable | Nonfarm | Non-farm employment | 1=Non-farm employment, 0=be engaged in agriculture | Defined according to the respondents' main work |
| Explanatory variable | Digital | Use of digital technology | 1=yes, 0=no | Consider both mobile and PC access to avoid single channel misjudgment |
| Mediating variable | Info | Channels of access to information | 1=very unimportant, 2=unimportant, 3=average, 4=important 5=very important |
The importance of the Internet as an information channel |
| skill | Skill enhancement channels | 1=yes, 0=no | Online learning or not | |
| Gender | Gender | 1=male, 0=female | / | |
| Control variable | Age | Age | Continuous variable | Respondents' age (unit: years) |
| Health | Health status | 1=unhealthy, 2=average, 3=moderately healthy, 4=very healthy, 5=extremely healthy | / |
Table 9.
Corresponding to the statistical description of variables in Table 5.
Table 9.
Corresponding to the statistical description of variables in Table 5.
| Variable | Obs | Mean | Std | Min | Max |
|---|---|---|---|---|---|
| Nonfarm | 2,246 | 0.7324 | 0.4428 | 0 | 1 |
| Digital | 2,246 | 0.7458 | 0.4355 | 0 | 1 |
| Info | 2,246 | 3.7529 | 1.4012 | 1 | 5 |
| Skill | 2,246 | 0.1621 | 0.3686 | 0 | 1 |
| Age | 2,246 | 38.3749 | 11.5205 | 16 | 65 |
| Gender | 2,246 | 0.5681 | 0.4954 | 0 | 1 |
| Health | 2,246 | 3.2516 | 1.1336 | 1 | 5 |
Table 11.
Average marginal effects.
| Variable | Average marginal effect |
|---|---|
| Digital | 0.2013 |
| Age | -0.0064 |
| Gender | 0.0464 |
| Health | -0.0031 |
Table 12.
Test results of mediating effect.
| Information acquisition channels | Skill enhancement channels |
|
|---|---|---|
| Mediating effect coefficient | 0.119*** (0.038) |
0.213** (0.108) |
| Marginal effect | 0.0226 | 0.0691 |
| N | 2246 | 2246 |
Note: Standard errors in parentheses * p < 0.1, ** p < 0.05, *** p < 0.01.
Disclaimer/Publisher’s Note: The statements, opinions and data contained in all publications are solely those of the individual author(s) and contributor(s) and not of MDPI and/or the editor(s). MDPI and/or the editor(s) disclaim responsibility for any injury to people or property resulting from any ideas, methods, instructions or products referred to in the content. |
© 2025 by the authors. Licensee MDPI, Basel, Switzerland. This article is an open access article distributed under the terms and conditions of the Creative Commons Attribution (CC BY) license (http://creativecommons.org/licenses/by/4.0/).
Copyright: This open access article is published under a Creative Commons CC BY 4.0 license, which permit the free download, distribution, and reuse, provided that the author and preprint are cited in any reuse.


