
Submitted:
05 April 2025
Posted:
08 April 2025
You are already at the latest version
Abstract
X-ray container imaging systems generate monochromatic images that are primarily used for the detection of prohibited items associated with smuggling activities. Within the scope of this study, two image enhancement algorithms were developed to reveal concealed or subtle details within scan images. For the purpose of noise reduction, median filtering and sharpening filters were utilized in the respective algorithms. In the contrast enhancement stage, one algorithm employed Histogram Equalization, while the other utilized Contrast Limited Adaptive Histogram Equalization (CLAHE). In the CLAHE-based method, optimal parameters were determined based on the entropy of the image, particularly by tuning the block size and clipping limit to achieve ideal enhancement results. To mitigate the naturally occurring airborne noise frequently observed in X-ray scans, contrast adjustment was further refined based on the median brightness of the image, which contributed to preserving a more natural visual appearance. The effectiveness of the developed algorithms was evaluated using objective image quality metrics, including Signal-to-Noise Ratio (SNR) and entropy. Results indicate that contrast-enhanced images improve the distinguishability of objects with similar intensity levels, thereby assisting X-ray operators in anomaly detection and interpretation during inspection processes.
Keywords:
X-ray
; container
; mono – chromatic
; contrast
; noise filtering
; unsharp mask
; histogram equalization
; median filter
; contrast limited histogram equalization
; brightness
; entropy
1. Introduction
In the analysis of X-ray scan images, image clarity plays a critical role in facilitating accurate interpretation. The presence of inherent noise in scan images negatively impacts the distribution of intensity levels, leading to reduced visual quality and compromising the reliability of diagnostic assessments. In container scanning systems, such noise is typically concentrated in the background regions dominated by air pixels. Therefore, the elimination or suppression of background noise constitutes a fundamental step in the preprocessing phase of image analysis.
Selecting an appropriate noise filtering technique is crucial for enhancing image quality without sacrificing essential structural details, particularly those embedded in low-contrast regions. Preserving such details can significantly aid operators in anomaly detection and object recognition during the inspection process.
Previous studies have emphasized the importance of noise reduction in enhancing diagnostic accuracy. For instance, Showkat Malik et al. [1] demonstrated that noise filtering techniques significantly improve the quality of contrast-enhanced medical images, thereby facilitating more accurate diagnoses. In line with this, the present study employs median filtering during the preprocessing stage to suppress noise while maintaining image details. Similarly, Xin Wang et al. [2] incorporated noise filtering as a key step in the non-destructive testing of radiographic aircraft images.
In addition to noise reduction, histogram-based contrast enhancement methods have been widely adopted in the preprocessing of X-ray images to recover meaningful information from low-contrast areas. These methods influence the dynamic range of image pixels [3,4], enabling better visualization of subtle intensity variations. One advanced technique involves computing a high dynamic range (HDR) image using logarithmic transformation, which enhances low-brightness pixels by leveraging information from their higher-intensity neighbors. This transformation expands the range of dark pixels while compressing brighter regions, thereby increasing the perceptual contrast.
Furthermore, a contrast adjustment method based on median brightness was implemented to suppress background noise and enhance the natural appearance of the image. As a result, a more analyzable and visually balanced output was achieved. As illustrated in Figure 1 and Figure 2, two different noise filtering strategies were evaluated to determine their effectiveness in revealing critical image details during preprocessing.
Among the noise filtering techniques evaluated, the median filter demonstrated superior performance when combined with Contrast Limited Adaptive Histogram Equalization (CLAHE), while the sharpening filter yielded better results when paired with standard Histogram Equalization (HE). These combinations were intentionally selected to mitigate the potential artifacts and distortions that may arise from histogram equalization, particularly when applied to images with subtle contrast variations.
In CLAHE, the block size and clip (crop) limit are critical parameters that significantly influence the quality of the enhanced image. For 16-bit depth X-ray scan images, a block size of 128 and a low clip limit were selected to preserve fine details and avoid excessive contrast amplification. This parameter configuration effectively minimizes the noise commonly introduced by the CLAHE process.
To further enhance object visibility, logarithmic transformation was employed using a scaling factor in the range of 10 to 50. This transformation expanded low-intensity pixels to higher intensity values while compressing high-intensity pixels, thereby emphasizing relevant image features and structures.
To achieve a more natural visual output and suppress residual noise associated with histogram-based enhancement methods, a histogram-based contrast adjustment technique was developed. This method utilizes the median brightness value as a reference for contrast correction, ensuring the retention of meaningful details while producing a visually coherent and analyzable image. The integration of this step significantly improves the interpretability of the enhanced images, offering substantial benefits for anomaly detection and operator-based analysis.
2. Material and Method
In this section, the noise filter, histogram-based contrast enhancement method, enhancement of low intensity details, entropy and image quality metrics to be selected for image enhancement are given.
2.1. Image Quality Metrics
In order to evaluate and compare the quality of images, entropy and signal to noise ratio are used as quantitative methods to measure the improvement in image perception.
2.1.1. Entropy
Entropy expresses the amount of information contained in the image. The higher the entropy, the more information it contains [1]. The entropy equation is shown in Equations (1) and (2).
2.1.2. Signal to Noise Ratio (PSNR)
Signal to noise ratio is used to measure the quality of the processed image of the original image. High signal to noise ratio indicates high image quality [1]. The signal to noise ratio equation is shown in Equation 2.3.
2.2. Filtering Techniques
Entropy expresses the amount of information contained in the image. The higher the entropy, the more information it contains [1]. The entropy equation is shown in Equations (1) and (2).
2.2.1. Mean Filter
The mean filter is used for noise filtering. It reduces the variation between one pixel and the others. The concept tries to average the neighbours of any element of the image. The mean filter calculates the sum of all pixels in the filter window and divides it by the total number of pixels. The mean filter is the simplest method used to reduce noise in an image. However, while the noise is made less prominent, it has a softened expression in the image. If the size of the filter window used is increased, the smoothing will increase even more. The mean filter divides the sum of all pixels in the filter window by the total number of pixels and replaces it with the value of the pixel in the centre of the window [5]. The formula for the Mean Filter is given in Equation (4).
R(i,j)=[I(i-1,j-1)+I(i-1,j)+I(i-1,j+1)+I(i,j-1)+I(i,j)+I(i,j+1)+I(i+1,j-1)+I(i+1,j)+I(i+1,j+1)]/9
2.2.2. Median Filter
The median filter is used to filter out noise. Like the mean filter, the median filter looks at each pixel's immediate neighbours to calculate its value [6]. As stated in Equation 2.5, instead of replacing the pixel value with the average of the neighbouring pixel values (mean filter), the median filter ranks the neighbouring pixels and takes the value in the middle of the row. If the region under investigation (inside the template) contains an even number of pixels, it uses the average of the two pixels in the middle as the median value. For a pixel with index value (i, j) in the image, the pixels (i-1, j-1), (i-1, j), (i-1, j), (i-1, j+1), (i, j-1), (i, j), (i, j), (i, j+1, j+1), (i+1, j-1), (i+1, j) and (i+1, j+1) are sorted and the midpoint is calculated.
2.2.3. Unsharp Masking
Sharpens the specified image by combining a blurred negative version of the image with the original image. The sharpening filter enhances high-frequency details in the image. Adds sharpness to the image [6].
2.3. Contrast Enhancement Techniques
Contrast enhancement techniques are used to effectively enhance the contrast of low contrast images. The purpose of contrast enhancement is to discriminate between various objects in an image and to increase the perception of information in the image. In this section of the paper, histogram equalisation and contrast-limited adaptive histogram will be discussed. The useful parameters preferred when applying contrast-limited histogram equalisation method will be discussed.
2.3.1. Histogram Equalisation
Histogram equalisation is a method for adjusting image contrast and intensity. Histogram equalisation often increases the overall contrast of many images, especially when the image is represented by a narrow range of intensity values. With this adjustment, the intensities can be better distributed on the histogram, using the entire range of intensities evenly. This allows areas of lower local contrast to gain a higher contrast. Histogram equalisation achieves this by effectively spreading out the high intensity values used to reduce the contrast of the image. It improves the dynamic range of intensities and increases contrast [1,7].
2.3.2. Contrast Limited Adaptive Histogram Equalisation
Histogram equalisation may not result in a better image than the original image because the histogram of the resulting image becomes approximately flat. Therefore, histogram equalisation may result in increased visibility of unwanted noise. Large peaks in the histogram may result from uninteresting area. Therefore, histogram equalisation may result in increased visibility of unwanted noise. This means that it does not comply with the local contrast requirement. When the number of pixels falling within a given grey range is relatively small, small contrast differences can be completely overlooked. An adaptive method to avoid this disadvantage is block-based processing of histogram equalisation. In this method, the image is divided into sub-images or blocks and histogram equalisation is applied to each sub-image or block. Then, blocking artifacts between neighbouring blocks are minimised by filtering or bilinear interpolation. Ordinary adaptive histogram equalisation (AHE) tends to overestimate the contrast in regions of the image close to constant, because the histogram in such regions is highly dense. As a result, adaptive histogram equalisation can lead to increased noise in regions close to the constant. Contrast-limited adaptive histogram equalisation is a variant of adaptive histogram equalisation in which contrast amplification is limited to reduce this noise amplification problem [3,8].
2.3.3. Logarithmic Transformation
It is used to expand the spectrum of dark pixels and compress the spectrum of high value pixels. Expands the values of dark pixels in the image while compressing higher values. Compresses the dynamic image range with large variations in pixel value. Logarithmic transformation makes the pixel values of the small details on the image visible and observable by expanding the pixel values to a higher range [9].
2.3.4. Histogram Contrast
A histogram-based method has been developed to determine the median brightness of a grey level scan image to increase or decrease the contrast. In this method, the median brightness of the image is found and the intensity values above the median are brightened and the intensity values below the median are reduced. With the histogram-based contrast adjustment method, air noise and distortions that occur in the histogram equalisation phase are eliminated.
2.4. Implemented Application
As a first step to reveal the details in the anomaly detected x-ray scan images, the original monochromatic scan image with 16 bit depth in Figure 3 is considered.
In Figure 4, noise is reduced by applying a median filter, while preserving the detail pixels.
In another contrast enhancement attempt, the image in Figure 5 also uses the original image with 16-bit depth.
In Figure 6, the aim is to reduce noise using a median filter.
Atmospheric noise was mitigated using a median filter, which effectively reduces noise while preserving edge details. In an alternative enhancement algorithm, a sharpening filter was employed for noise suppression. This filter contributed both to the preservation of fine details and the attenuation of noise artifacts. Furthermore, in Figure 7, the application of histogram equalization led to a more uniform distribution of intensity values, enhancing the visibility of subtle structures within the image. The resulting improvement is demonstrated to significantly aid operator-based image analysis tasks.
The histogram equalization method, employed for contrast enhancement, was also applied to the image presented in Figure 8, in which noise had previously been reduced using a sharpening filter within an alternative algorithm.
The application of histogram equalization introduced noise in regions containing atmospheric pixels. To achieve a more natural image representation, further enhancement methods were developed in subsequent stages. As observed in Figure 3 and Figure 5, the detail intensities in the original images are not distinct, making it difficult to identify any variations. To address this, a variation of histogram equalization—Contrast Limited Adaptive Histogram Equalization (CLAHE)—was employed, particularly in the method where a median filter was applied. For 16-bit depth images, the block size and clip limit parameters were determined based on the points of maximum entropy curvature. In CLAHE, the efficiency of contrast enhancement is highly dependent on the selected block size and clip limit. It was observed that setting the block size to 128 and using a low clip limit value such as 0.1 yielded both effective contrast enhancement and minimal noise generation. As demonstrated in Figure 9, this method successfully revealed useful details and objects compared to the original image.
In images with pixel intensity values that are closely clustered, histogram equalization proves effective in enhancing contrast, thereby preserving and highlighting informative structures. As illustrated in Figure 9, contrast enhancement led to increased visibility by elevating the contrast values along the edge pixels. In contrast, for the scenario depicted in Figure 10—where pixel intensities are very similar—applying standard histogram equalization instead of Contrast Limited Adaptive Histogram Equalization (CLAHE) may yield better results, as it helps maintain the relative contrast among pixels with similar intensity values.
Following histogram equalization, a logarithmic transformation was applied to expand the spectrum of dark pixels while compressing those with higher gray-level values. Through this histogram-based contrast adjustment technique, atmospheric noise and artifacts introduced during the histogram equalization phase were effectively mitigated. As shown in Figure 11, the resulting image exhibits reduced noise and a more natural appearance, demonstrating the efficacy of the enhancement process.
In the alternative enhancement algorithm, histogram equalization and sharpening filter were applied in a sequence different from the initial approach. The resulting enhanced image obtained through this modified processing pipeline is presented in Figure 12.
In contrast to the previous algorithm, the approach utilizing Contrast Limited Adaptive Histogram Equalization (CLAHE) in combination with median filtering also yielded effective enhancement by revealing finer image details. The resulting output image is visualized in Figure 13.
Similarly, in Figure 14, valuable information has been successfully revealed. It has been observed that anomaly detection is facilitated during operator-based analyses.
In Table 1, the Signal-to-Noise Ratio (SNR) and Mean Squared Error (MSE) values of the images enhanced using median and mean filters were computed to evaluate the improvement in image quality. The results demonstrate that the median filter provides a more effective enhancement of the scanned image compared to the mean filter. Specifically, the SNR increased positively, while the MSE showed a corresponding decrease, indicating improved image fidelity.
In Table 2, the entropy of the filtered image is shown to have increased compared to the original image, indicating an improvement in the amount of information retained. Additionally, the Signal-to-Noise Ratio (SNR) demonstrates that the applied filtering method provides a level of enhancement comparable to the other filtering approaches evaluated in Table 1.
In Table 3, the images enhanced using two different algorithms exhibit positive improvements in both Signal-to-Noise Ratio (SNR) and entropy values. These enhancements reveal distinguishable intensity variations that contribute to improved interpretability and provide a clear advantage in anomaly detection tasks.
In Figure 13 and Figure 14, the scanning images exhibit intensity distributions with closely clustered gray-level values. In the algorithm combining median filtering and histogram equalization, which was preferred for these images, positive improvements were achieved in both Signal-to-Noise Ratio (SNR) and entropy values, as also reflected in Table 4. Moreover, the resulting images are more analyzable and exhibit a more natural appearance.
3. Conclusions
In the enhancement of details within X-ray scan images, various contrast enhancement techniques have been employed. Prior to the application of contrast enhancement, noise reduction was prioritized using appropriate filtering methods. It is critical that the chosen noise filtering approach preserves structural details while smoothing the image. Among the available filters, the median filter was selected due to its ability to effectively reduce noise without compromising image details. Additionally, the sharpening filter (Unsharp Masking) can be utilized to further enhance edge clarity and visual sharpness.
Following the filtering stage, histogram-based contrast enhancement techniques were applied. Standard histogram equalization was found to be effective in highlighting fine details in high-contrast regions with closely spaced gray-level values, whereas the Contrast Limited Adaptive Histogram Equalization (CLAHE) method yielded better results in low-contrast regions. Specifically, for 16-bit depth images, using a block size of 128 and a low clip limit in CLAHE significantly reduced histogram-induced noise while enhancing relevant features—facilitating anomaly detection during operator analysis.
To further suppress interpretational artifacts revealed after histogram equalization and to enhance visibility of important structures, logarithmic transformation was applied, resulting in improved image interpretability. Finally, the algorithm was complemented with a contrast adjustment step based on histogram median brightness, which effectively suppressed residual background noise.
The image quality metrics applied to the enhanced images—namely, Signal-to-Noise Ratio (SNR) and entropy—demonstrated positive improvements. Based on these findings, the proposed algorithm contributes to improved anomaly detection and visualization of critical details in X-ray container scan images, thereby supporting operators during the analysis phase of inspection systems.
References
- Showkat M., Tariq Ahmad L., Syed Mohammed Khursaid Q., Contrast enhancement and smoothing of CT images for diagnosis, Conference: Computing for Sustainable Global Development (INDIACom). International Conference, 2015.
- Xin W., Brian Stephen W., Chen Gaun Tui Kai Peng K., Frederic F., Image enhancement for radiographic non-destructive inspection of the aircraft, Asia-Pasific Conference on NDT, 12th A-PCNDT, 2006.
- Byong Seok M., Dong Kyun L., Seung Jong K., Joo Heung L., A novel method of determining parameters of CLAHE based on image processing, International Journalof Software Engineering and Its applications, vol. 7, no. 5, pp. 113–120, 2013. [CrossRef]
- S. P. Windyga, Fast impulsive noise removal, IEEE transacations on image processing, vol. 10, no. 1, pp. 173–178, 2001.
- Xuming Z., Youlun X., Impulsive noise removal using directional difference based noise dedector and adaptive weighted mean filter, IEEE Signal Processing Letters, vol. 16, no. 4, pp. 295–298, 2009.
- Panetta K., Zhou Y., Agaian S., Jia H., Nonlinear ınsharp masking for mammogram enhancement, IEEE Transactions on Information Technology in Biomedicine, vol. 15, no. 6, pp. 918–928, 2011.
- R.Hummel, Histogram modification techniques, Computer Graphics and Image Processing, vol. 4, pp. 209–224, 1975.
- Pizer M., Johnston E., Ericksen P., Yankaskas B., Muller, Contast limited adaptivve histogram equalization: speed and effectiveness, Visualization in Biomedical Computing,, vol., no., pp. 337–345, 1990.
- Urvashi M., Yojana Y., Image enhancement through logarithmic transformation, International Journal of Innovative Research in Advanced Engineering(IJRAE), vol. 1, no. 8, pp., 2014.
Figure 1.
Preferred algorithm for histogram equalisation with median filter and contrast limit.

Figure 2.
Sharpening filter and histogram equalisation preferred algorithm.

Figure 3.
Scanned image with 16-bit depth.
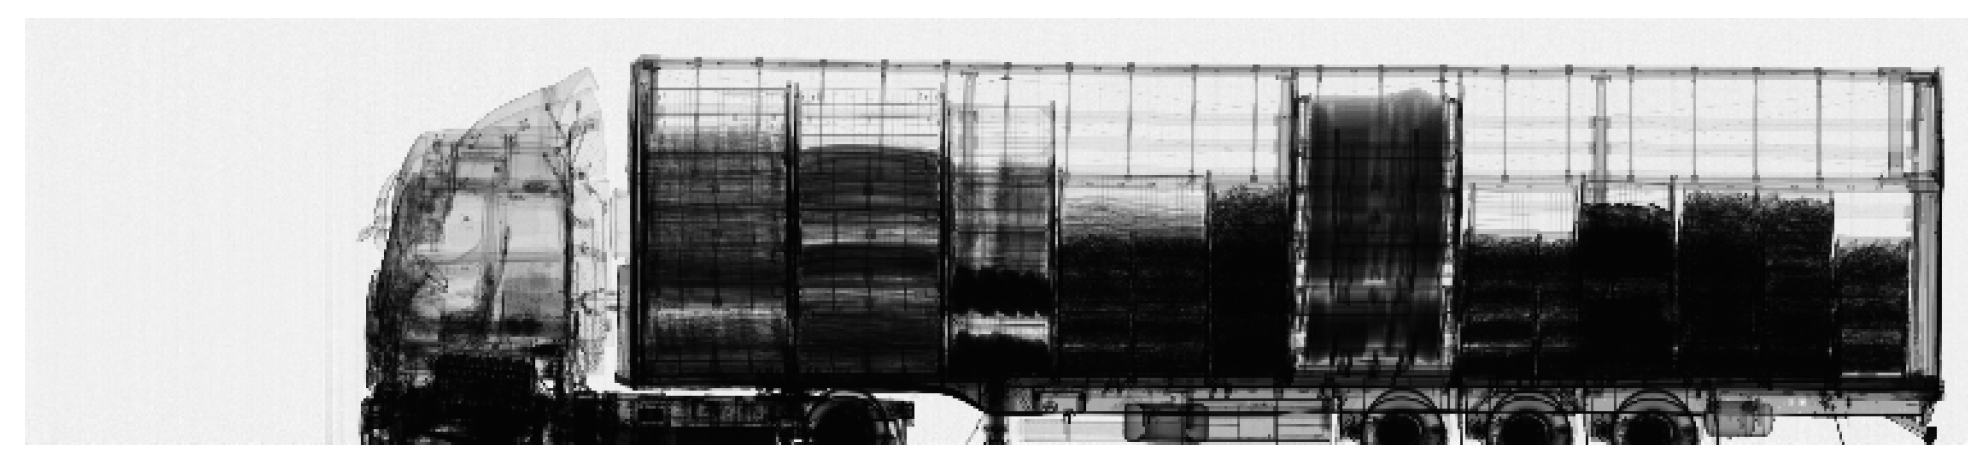
Figure 4.
Scanned image with applied median filter.
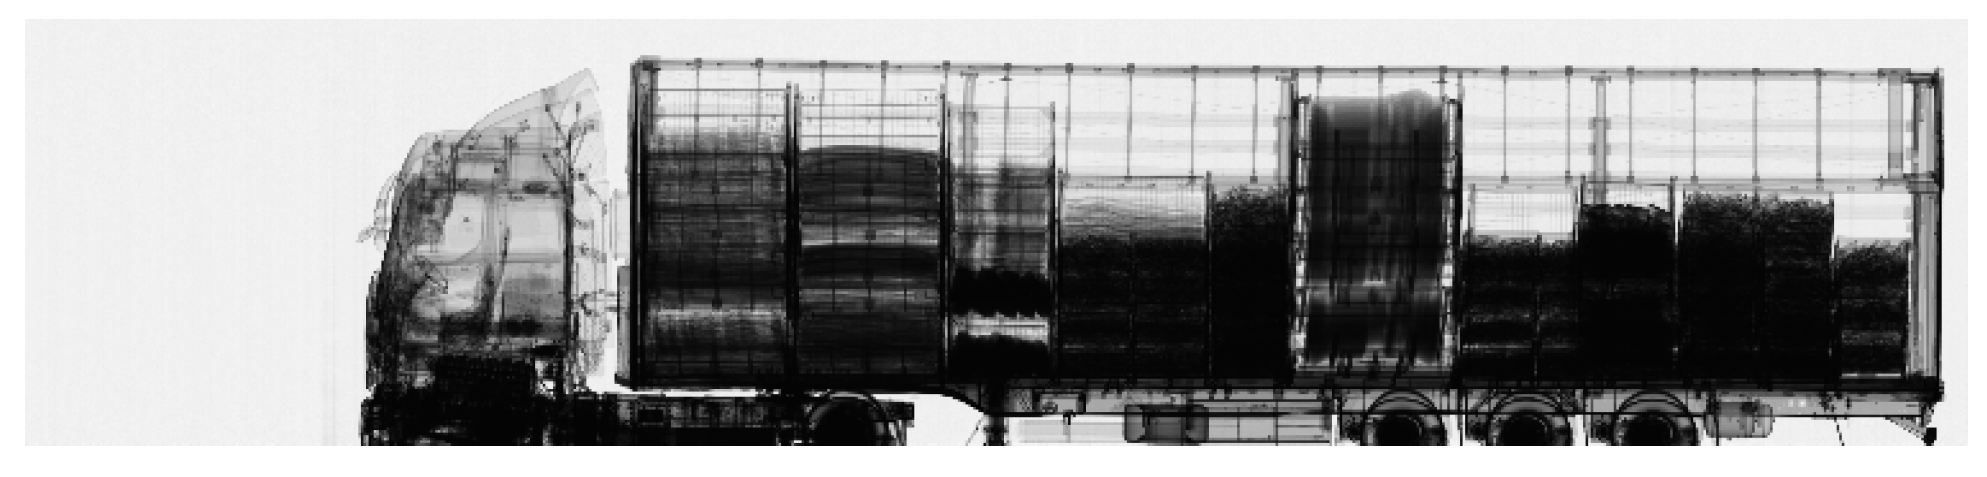
Figure 5.
Scanned image with 16-bit depth.
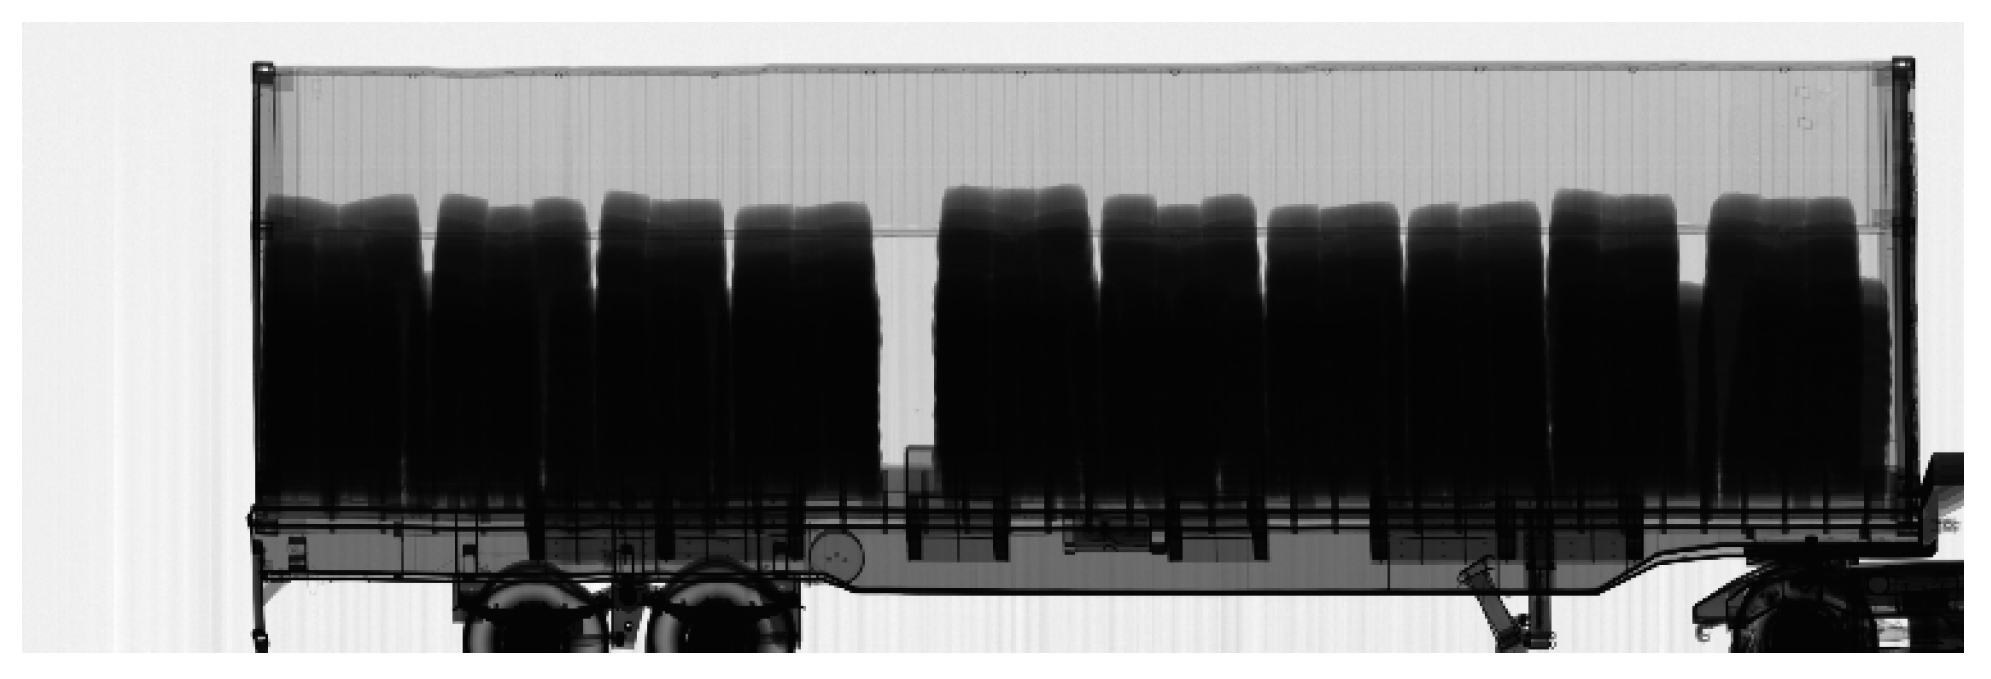
Figure 6.
Scanned image with applied median filter.
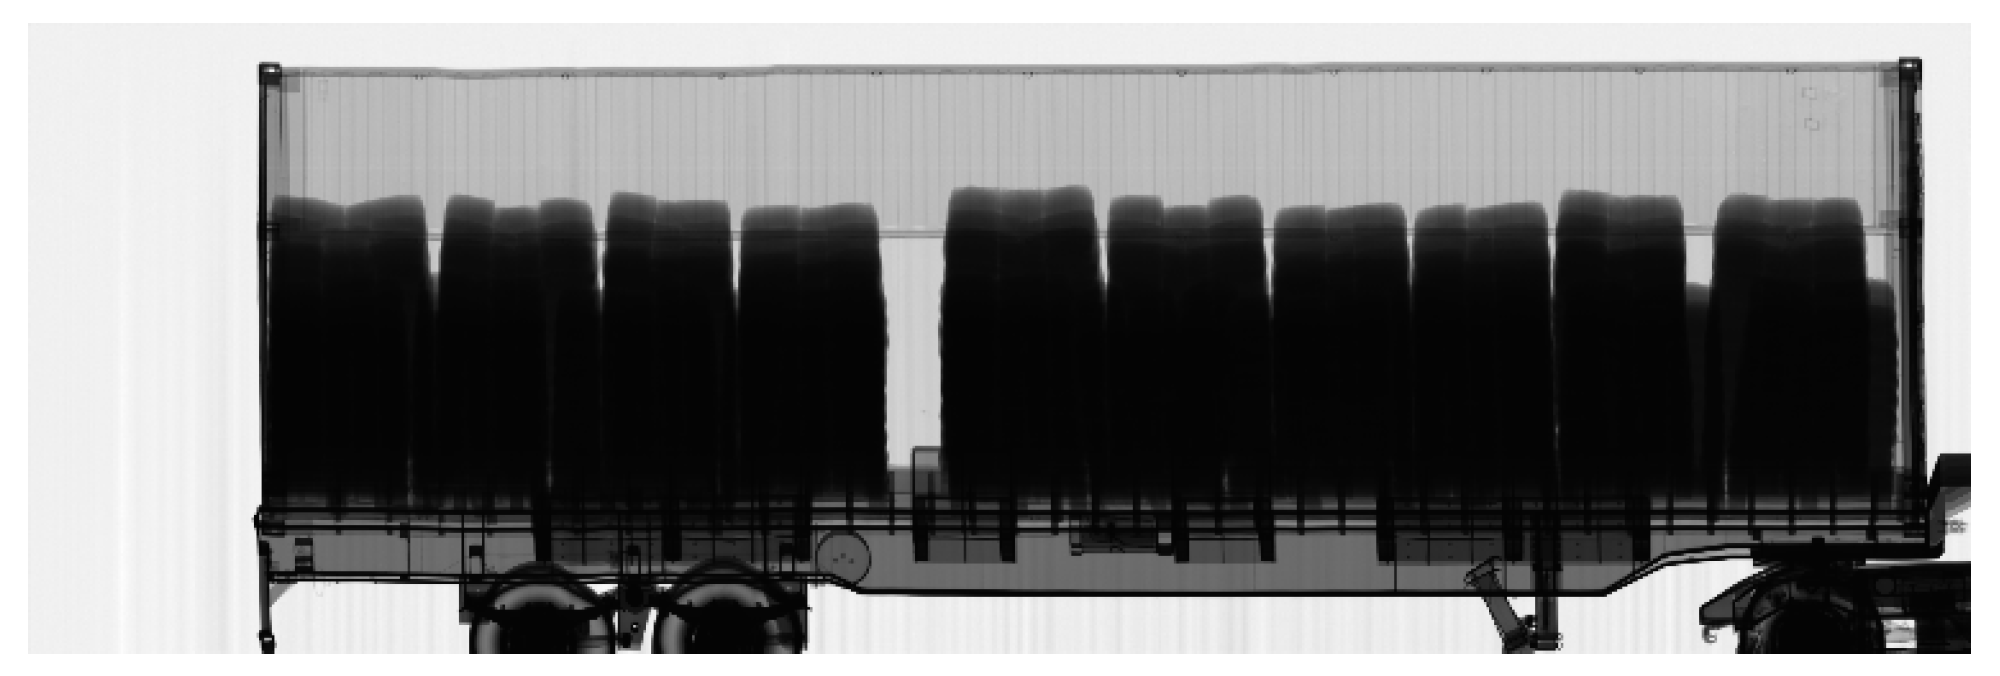
Figure 7.
Scan image enhanced using the histogram equalization method.
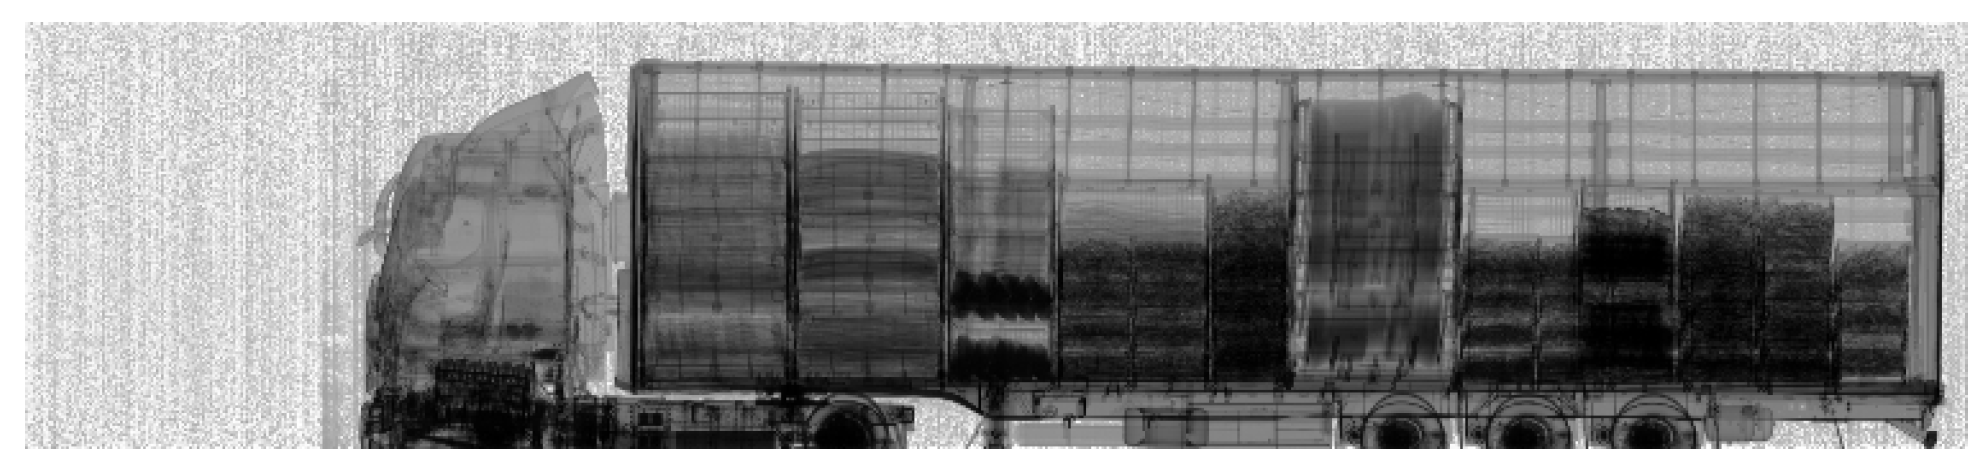
Figure 8.
Scan image enhanced using the histogram equalization method.
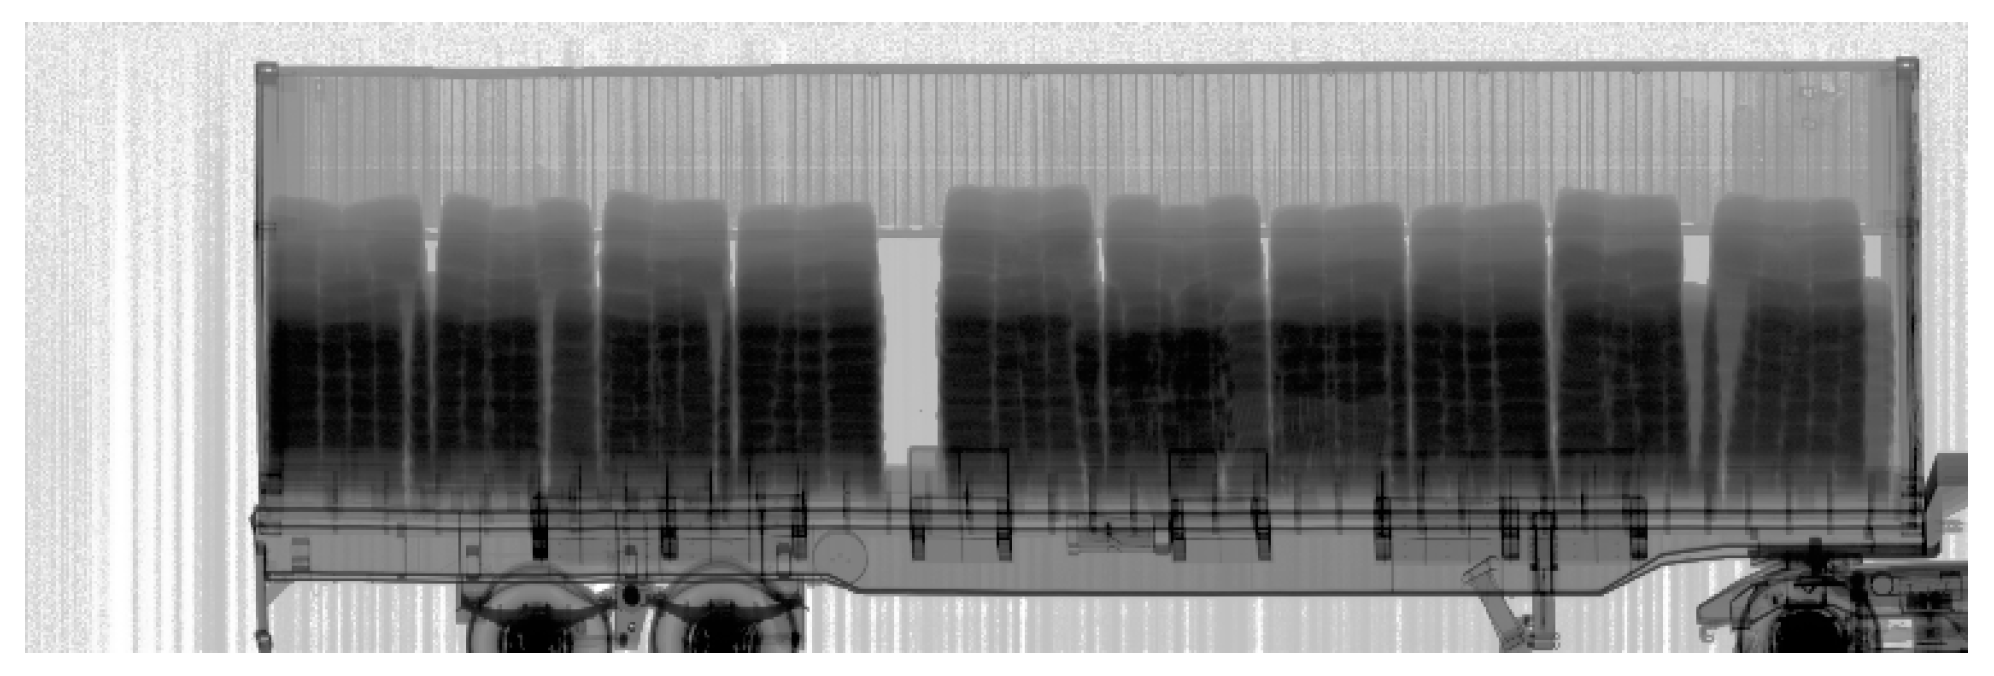
Figure 9.
Scan image enhanced using the contrast-limited adaptive histogram equalization (CLAHE) method.
Figure 9.
Scan image enhanced using the contrast-limited adaptive histogram equalization (CLAHE) method.
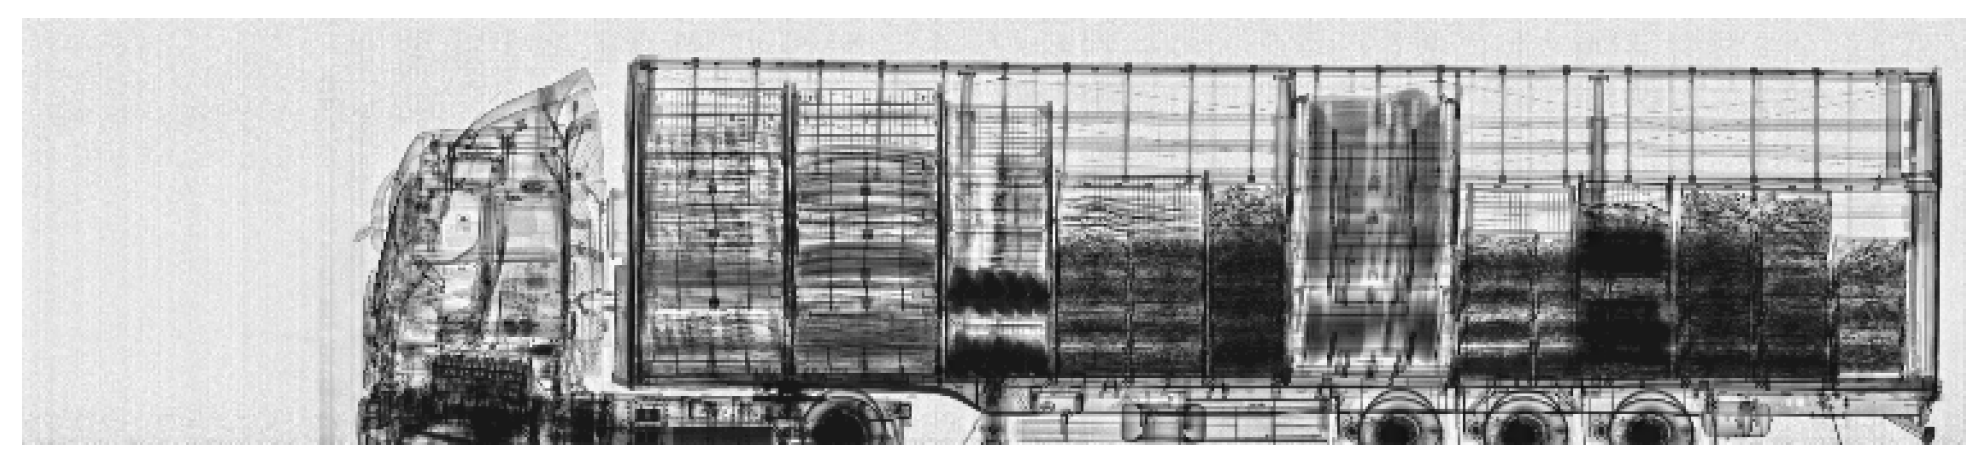
Figure 10.
Scan image enhanced using the contrast-limited adaptive histogram equalization (CLAHE) method.
Figure 10.
Scan image enhanced using the contrast-limited adaptive histogram equalization (CLAHE) method.
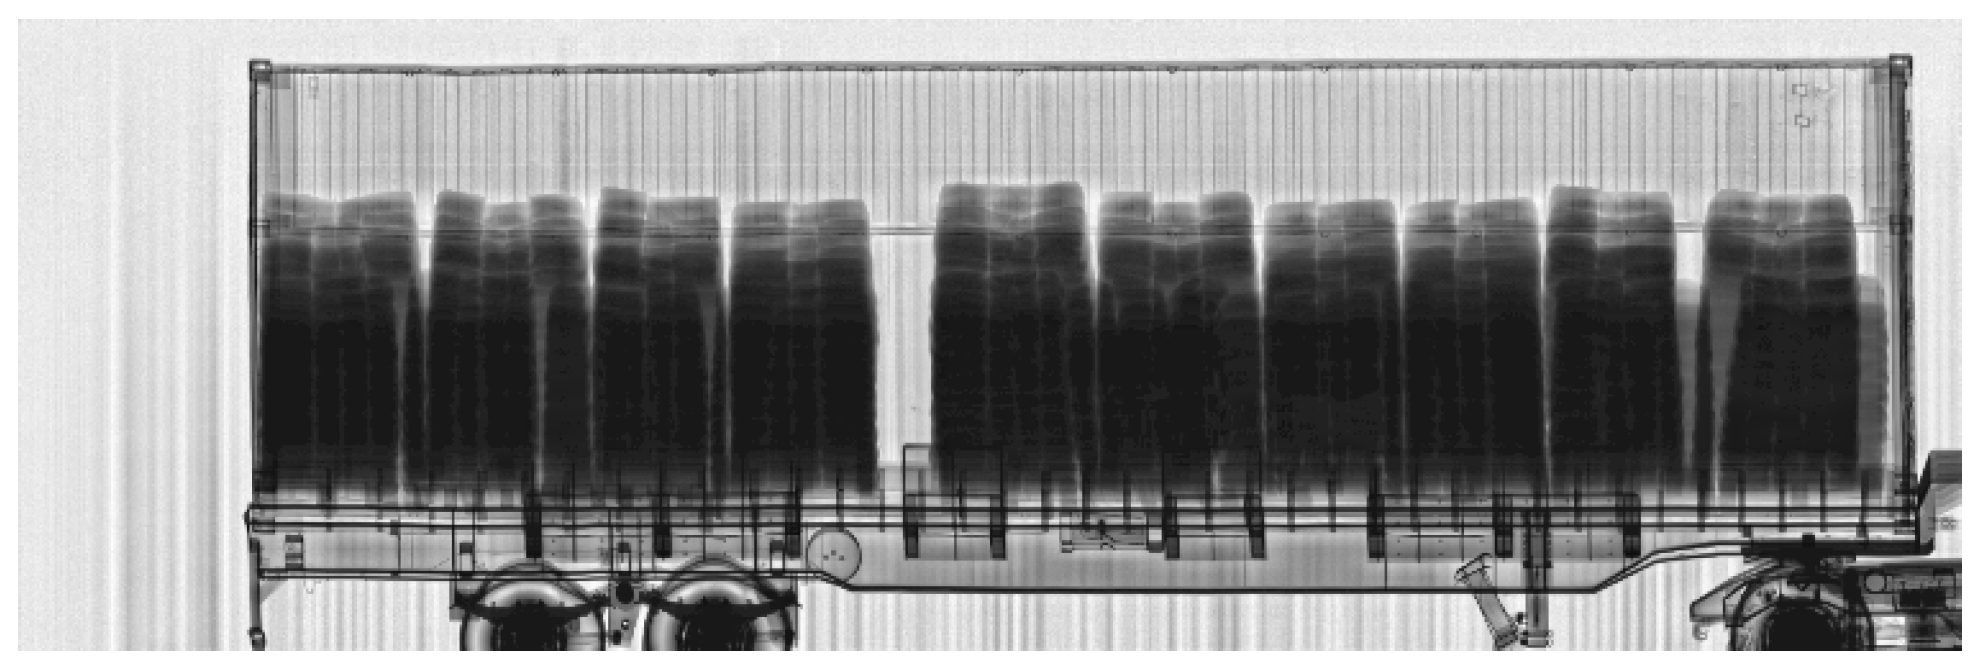
Figure 11.
Scan image enhanced using median filtering, contrast-limited adaptive histogram equalization (CLAHE), logarithmic transformation, and histogram contrast method.
Figure 11.
Scan image enhanced using median filtering, contrast-limited adaptive histogram equalization (CLAHE), logarithmic transformation, and histogram contrast method.
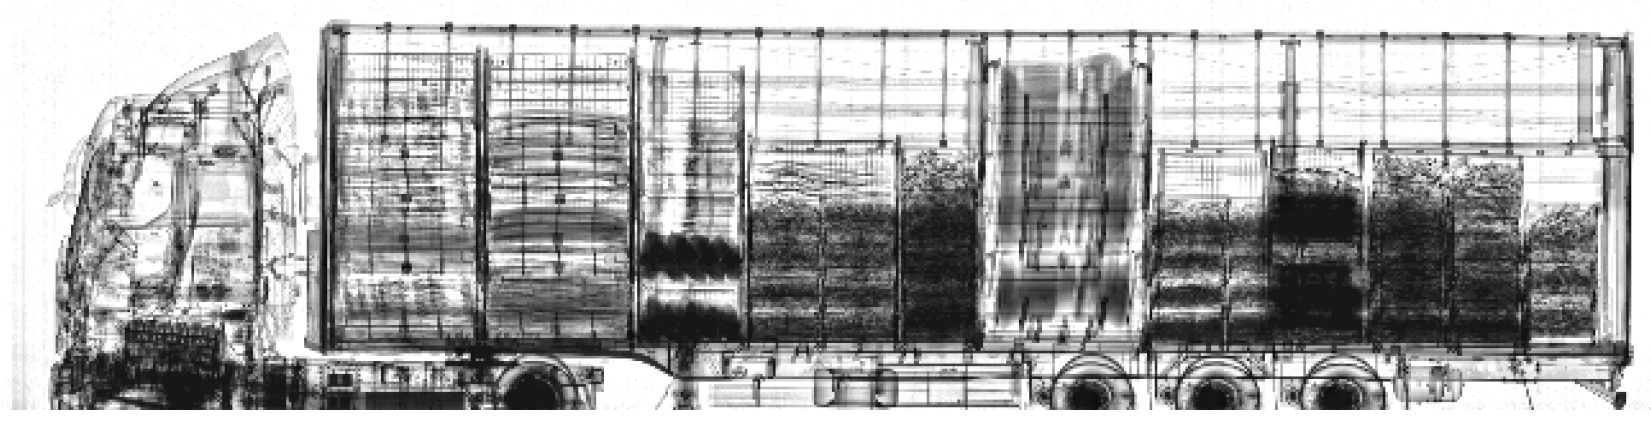
Figure 12.
Scan image enhanced using sharpening, histogram equalization, logarithmic transformation, and histogram contrast method.
Figure 12.
Scan image enhanced using sharpening, histogram equalization, logarithmic transformation, and histogram contrast method.

Figure 13.
Scan image enhanced using median filtering, contrast-limited histogram equalization, logarithmic transformation, and histogram contrast method.
Figure 13.
Scan image enhanced using median filtering, contrast-limited histogram equalization, logarithmic transformation, and histogram contrast method.
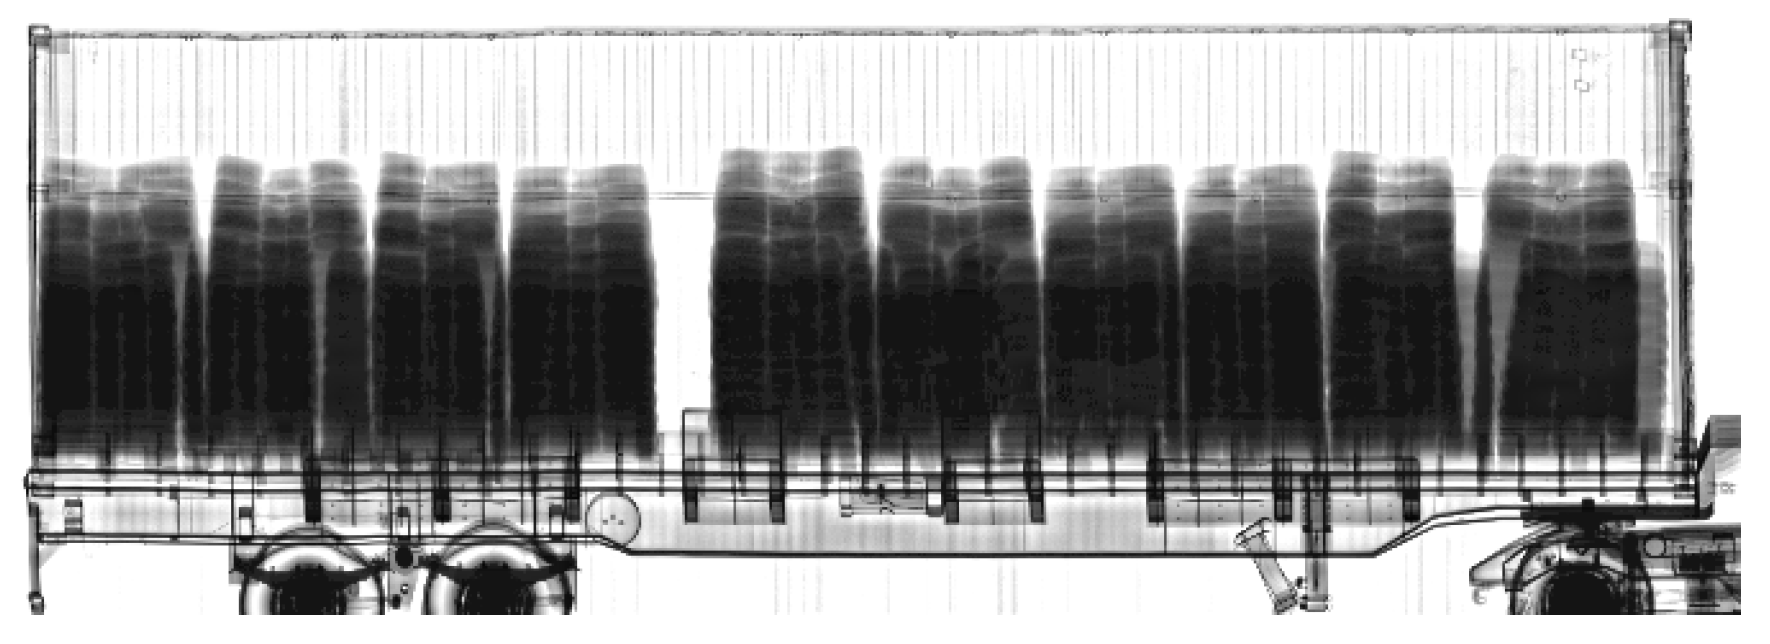
Figure 14.
Scan image enhanced using sharpening, histogram equalization, logarithmic transformation, and histogram contrast method.
Figure 14.
Scan image enhanced using sharpening, histogram equalization, logarithmic transformation, and histogram contrast method.
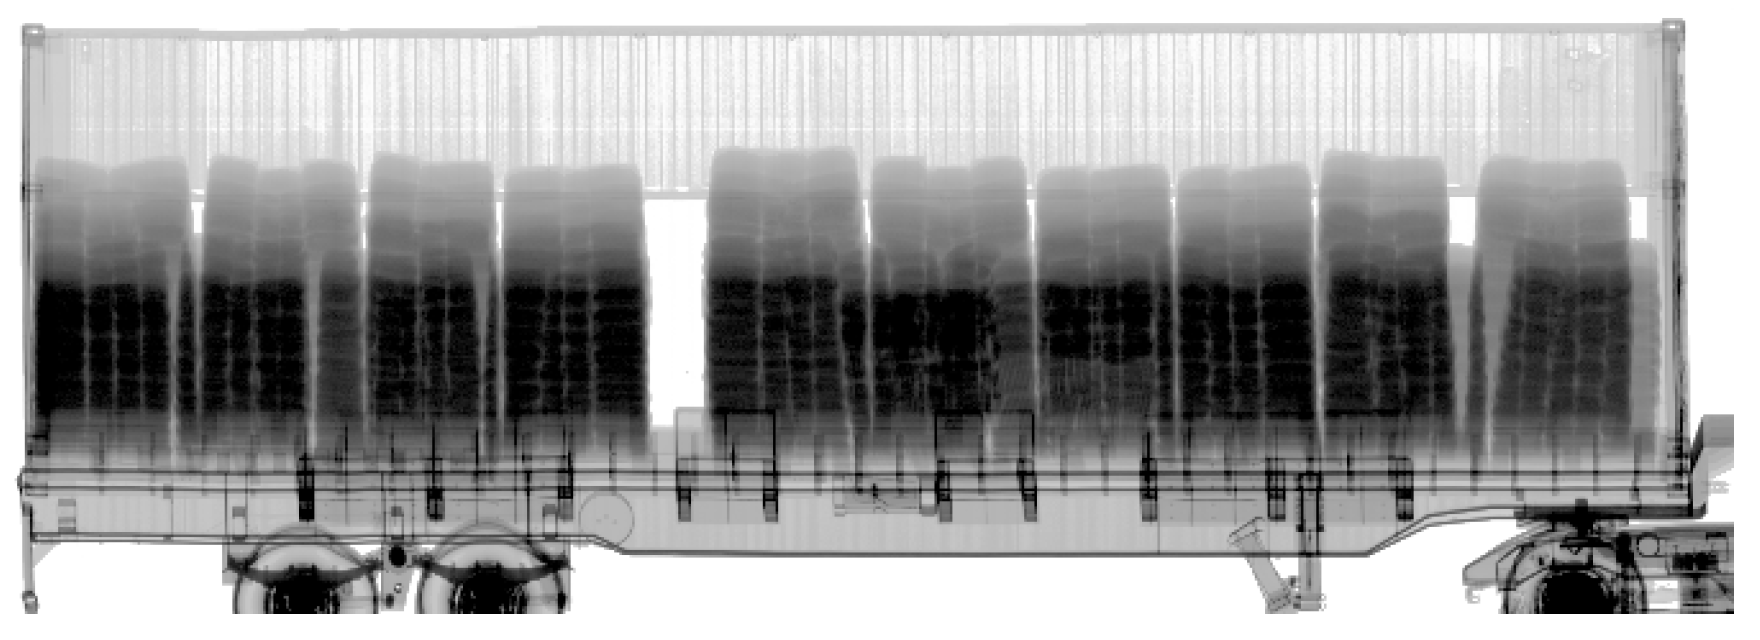

Table 1.
Signal-to-Noise Ratio of Filtered Images.
| Type of Experiment | Mean Filter | Median Filter |
| PSNR | 31.9059 | 44.2546 |
| MSE | 2.7692 | 1.6125 |
Table 2.
Signal-to-Noise Ratio of Images Processed with Sharpening Filter.
| Type of Experiment | Sharpening Filter | Original Image |
| PSNR | 42.7507 | - |
| Entropy | 6.8485 | 6.7965 |
Table 3.
Image Quality Metrics of Two Different Contrast Enhancement Algorithms.
| Type of Experiment | Algorithm Using Contrast-Limited Adaptive Histogram Equalization (CLAHE) | Algorithm Using Histogram Equalization | Original Scanned Image |
| PSNR | 12.2882 | 15.5103 | - |
| Entropy | 7.3711 | 7.9979 | 6.7965 |
Table 4.
Image Quality Metrics of Two Different Contrast Enhancement Algorithms.
| Type of Experiment | Algorithm Using Contrast-Limited Adaptive Histogram Equalization (CLAHE) | Algorithm Using Histogram Equalization | Original Scanned Image |
| PSNR | 11.8290 | 11.2958 | - |
| Entropy | 7.1485 | 7.9964 | 6.0495 |
Disclaimer/Publisher’s Note: The statements, opinions and data contained in all publications are solely those of the individual author(s) and contributor(s) and not of MDPI and/or the editor(s). MDPI and/or the editor(s) disclaim responsibility for any injury to people or property resulting from any ideas, methods, instructions or products referred to in the content. |
© 2025 by the authors. Licensee MDPI, Basel, Switzerland. This article is an open access article distributed under the terms and conditions of the Creative Commons Attribution (CC BY) license (http://creativecommons.org/licenses/by/4.0/).
Copyright: This open access article is published under a Creative Commons CC BY 4.0 license, which permit the free download, distribution, and reuse, provided that the author and preprint are cited in any reuse.


