Submitted:
07 April 2025
Posted:
07 April 2025
You are already at the latest version
Abstract
Chronic diseases place a significant burden on healthcare systems due to the need for long-term treatment. Early diagnosis is critical for effective management and minimizing risk. The current traditional diagnostic approaches face various challenges in terms of efficiency and cost. Digitized healthcare demonstrates several opportunities for reducing human errors, increasing clinical outcomes, tracing data, etc. Artificial Intelligence (AI) has emerged as a transformative tool in healthcare. Subsequently, the evolution of Generative AI represents a new wave. Large Language Models (LLMs), such as ChatGPT, are promising tools for enhancing diagnostic processes, but their potential in this domain remains underexplored. This study represents the first systematic evaluation of ChatGPT's performance in chronic disease prediction, specifically targeting heart disease and diabetes. This study aims to compare the effectiveness of zero-shot, few-shot, and CoT reasoning with feature selection techniques and prompt formulations in disease prediction tasks. Two latest versions of GPT4 (GPT-4o and GPT-4o-mini) are tested. Then, the results are evaluated against the best models from literature. The results indicate that GPT-4o significantly beat GPT-4o-mini in all scenarios in terms of accuracy, precision and F1-score. Besides, using a 5-shot learning strategy demonstrates superior performance compared to zero-shot, few-shot (3-shot, 5-shot, 10-shot), zero-shot CoT reasoning, 3-shot CoT reasoning, and the proposed Knowledge-enhanced CoT. It achieved an accuracy of 77.07% in diabetes prediction using Pima Indian Diabetes Dataset and 75.85% using Frankfurt Hospital Diabetes Dataset as well as 83.65% in heart disease prediction. Subsequently, refining prompt formulations resulted in notable improvements, particularly for the heart dataset, emphasizing the importance of prompt engineering. The clarification of column names and categorical values contributed to a 5% performance increase when using GPT-4o. Besides, the proposed Knowledge-enhanced 3-shot CoT demonstrated notable improvements in diabetes prediction over CoT, while its effectiveness in heart disease prediction was limited. The reason could be that heart disease is influenced by a more complex combination of features, which indicates the importance of carefully designing reasoning strategies based on the specific characteristics of the disease. Even though ChatGPT does not outperform traditional machine learning and deep learning models, these findings highlight its potential as a complementary tool in disease prediction. Additionally, it demonstrates promising results, particularly with refined prompt designs and feature selection, providing insights for future research to improve the model’s performance.
Keywords:
Chronic Diseases
; Early Diagnosis
; Large Language Models
; Generative AI
; ChatGPT
; Heart Disease
; Diabetes
; Disease Prediction
; Prompt Engineering
1. Introduction
Recent advancements in Artificial Intelligence (AI) have significantly transformed the healthcare sector. The advanced approaches provide novel solutions for various problems, including disease diagnosis [1,2], treatment planning [3], drug discovery [4,5], and patient management [6,7]. Digitized healthcare demonstrates several opportunities for reducing human errors, increasing clinical outcomes, tracing data, etc. [2]. AI technologies, particularly machine learning (ML) and deep learning (DL) have demonstrated remarkable accuracy in multiple disease predictions such as cancer [8], liver [9], and kidney [10] within complex medical data.
Chronic diseases as defined by the National Cancer Institute (NCI) [11] are conditions that last for three months or more and require controlling by long-term medical attention to prevent them from getting worse. These diseases usually develop slowly and cannot be cured, so they cause significant effects on patient health and daily living. Common examples include heart disease, diabetes, cancer, and kidney disease. Several factors influence these diseases including genetic and lifestyle factors, such as physical inactivity and unhealthy diets, as indicated by American Heart Association [12]. According to the World Health Organization (WHO) reports [13], cardiovascular diseases are the leading cause of death globally, accounting for 17.9 million deaths annually. Subsequently, diabetes is among the most widespread diseases, as the number of people living with diabetes has significantly increased, rising from 200 million in 1990 to 830 million in 2022 [14].
Furthermore, the increasing number of daily patients raises challenges to healthcare systems globally and highlights the need for effective prevention, early detection, and novel management strategies. Utilizing revelational and cutting-edge technologies enables early diagnosis and efficient management of diseases. Subsequently, among all smart healthcare applications, building prediction models for early diagnosis of chronic conditions disease has obtained considerable attention. Automating diagnostic tasks increases the speed of clinical decision-making, reduces human error, and thus reduces mortality rates and healthcare costs due to timely involvement.
Moreover, Machine Learning (ML) and Deep Learning (DL) have revolutionized healthcare by empowering the development of predictive models using complex medical data for predicting brain tumors [15], [16], sepsis infection [17], pediatric length of stay in Intensive Care Unit (ICU) [18], etc . Furthermore, several medical devices that utilized ML/DL models have received approval from the FDA health regulatory bodies. Beta Bionics [19] is designed to automate insulin delivery system. IDx-DR [20] is developed to detect diabetic retinopathy (DR) in patients with diabetes. Despite the success of ML and DL models, they face limitations affecting trust and adoption in healthcare. For instance, their black-box nature makes it hard to interpret how the model adjusts internal parameters poses limitations [21]. Furthermore, supervised learning requires extensive labeled datasets for training, which limits their applicability in clinical scenarios where annotated data is limited. These challenges underscore the need for alternative approaches that balance predictive accuracy, interpretability, and scalability.
Furthermore, Large Language Models (LLMs) represent a significant evolution in AI within their innovative ability to process and generate human-like text. ChatGPT, produced by OpenAI is one of the most notable LLM. It has expanded the scope of AI applications with various data structures involving unstructured data analysis, reasoning, and interactive communication. ChatGPT has significant potential to enhance various NLP tasks. Its adaptability in information extraction tasks, sentiment analysis, and text classification showcases its ability to comprehend diverse contexts and extract meaningful details [22]. Besides, its advanced natural language processing (NLP) capabilities position it as a promising tool for addressing medical data and supporting diagnostic decision-making [23]. In contrast to ML/ DL models, ChatGPT is pre-trained on vast, diverse datasets, allowing it to develop a generalized understanding of concepts and learn from patterns without the need for labeled data for each individual task. Likewise, ChatGPT uses the transformer architecture with a Self-attention mechanism, allowing models to process data in parallel, rather than sequentially such as RNNs. Besides, transformers enhance scalability and enable handling large data and parameters efficiently. Subsequently, most ML and DL models consider each input as independent and often do not maintain a memory of previous inputs. In contrast, ChatGPT supports tracking of the conversation and adapts responses based on previous dialogue. Traditional ML/DL is limited by data and task-specific design while ChatGPT is better in generalization and understanding due to its ability to capture more complicated patterns in data. Additionally, it does not require task-specific training as in zero-shot learning. It also performs reasonably well by giving a few examples, known as few-shot learning. However, the use of LLMs such as ChatGPT in disease prediction remains an emerging area of exploration.
In this paper, we investigate the potential of ChatGPT, particularly GPT4 as a tool for disease prediction. We focus on two chronic diseases heart disease and diabetes by leveraging its ability to process prompts and provide output. We explore its performance across various learning strategies, including zero-shot, few-shot (3-shot, 5-shot, 10-shot), zero-shot CoT reasoning, few-shot CoT reasoning, and the proposed Knowledge-enhanced CoT. This comparison provides insight into which approach yields the best accuracy for disease prediction tasks. Besides, this study examines the effect of prompt formulation and engineering on the prediction results. Additionally, we tested two feature selection methods, which are correlation-based and mutual information. Subsequently, we compare the outcomes against established models from literature.
The main contributions of this work include:
- Utilize ChatGPT for chronic disease diagnosis, particularly heart disease and diabetes prediction.
- Explore the impact of feature selection methods and prompt engineering on predictive performance.
- Investigate the influence of different learning strategies, including zero-shot, few-shot, and chain-of-thought reasoning on model outcomes.
- Evaluate ChatGPT’s results against models from the literature.
- Suggest a workflow for ChatGPT as an assistant for ML/ DL models to enhance clinical decision-making.
This paper addresses a critical research gap by exploring the applicability of LLMs, particularly ChatGPT in disease prediction. This area is traditionally directed by ML and DL models. While the evolution of ChatGPT has shown promise in various NLP tasks, their capabilities in prediction tasks, particularly in the medical domain, remain underexplored. To the best of our knowledge, this work is the first to systematically evaluate ChatGPT’s capabilities in chronic disease prediction, with a particular focus on heart disease and diabetes.
The remainder of this paper is organized as follows: Section 2 discusses related work. Section 3 details the methodology, including dataset, pre-processing, feature selection, and experimental design. Section 4 presents the results of the experiments. Section 5 provides the discussion. Finally, Section 6 concludes the study, highlighting its implications for healthcare and future work.
2. Related Works
2.1. Diabetes Disease Prediction
Several types of datasets have been used in the literature, and we have grouped the studies based on the dataset utilized. Some studies in literature have relied on local datasets for their experiments. These datasets are often collected from a specific hospital in their region. Gollapalli et al. [24] categorized diabetes patients into Type 1 Diabetes (T1DM), Type 2 Diabetes (T2DM), and Pre-diabetes. They utilized four ML algorithms, support vector machine (SVM), random forest (RF), K-nearest neighbors (K-NN), and decision tree (DT) along with Bagging and Stacking ensemble-based approaches. The dataset was collected from King Fahad University Hospital (KFUH) in Saudi Arabia. The results indicated that the stacking approach surpasses the other method. Other researchers worked on collected data (3000 records) of patients from five different Saudi hospitals for classification into diabetics and non-diabetic patients using logistic regression (LR), DT, RF, and SVM algorithms and studied the effect of the diabetes-specific tests (FPG and HbA1c) [25]. They found that including HbA1c as a feature increases the performance compared to FPG. Qteat and Awad [26] used a local dataset named “DataPal” to predict diabetes types. After preprocessing the data and filling in the missing values using the KNN algorithm, the SVM algorithm was applied. The model achieved accuracy 98.73%.
Moreover, Fitriyani et al.[27] focused on detecting type 2 diabetes and hypertension. They developed a disease prediction model (DPM) based on an ensemble approach. To remove outliers, an isolation forest (iForest) based outlier detection method has been used, whereas a synthetic minority oversampling technique implemented to balance data distribution. They tested four different datasets and the accuracy was varied (96.74%, 85.73%, 75.78%, and 100% ). Ali et al. [28] tested different KNN types (Fine, Weighted, Medium, and Cubic) for diabetes classification using a generated dataset. The results indicated that Fine KNN gives high accuracy over the other methods.
Furthermore, some of the studies primarily used surveys as a data source. Almutairi and Abbod [29] classified the diabetes prevalence rates using two types of KNN algorithms (fine KNN, and weighted KNN) and four kernel functions of SVM (linear SVM, Gaussian SVM, quadratic SVM, and cubic SVM). The dataset consists of published national surveys in KSA. The results indicated that weighted KNN outperforms the other algorithms, with the highest average accuracy of 94.5%. Alsulami et al. [30] utilized a Deep Neural Network (DNN), an Autoencoder (AE), and a Convolutional Neural Network (CNN) to predict type 2 diabetes. They used the dataset collected by Syed and Khan in [31]. Further, they developed several experiments to test feature selection effects and compared the results with ML algorithms. The results demonstrate that AE outperformed other models with an accuracy of 81.12% for imbalanced data and 79.16%, for balanced data.
The rest of the studies discussed in this subsection used the PIMA Indian Diabetes Dataset (PIDD). This dataset is a well-known benchmark and frequently used for diabetes prediction tasks and is frequently used in machine learning research. Mahesh et al. [32] proposed a blended ensemble learning (EL) system EL based on Bayesian networks (BN) and radial basis functions (RBF) for predicting diabetes. The EL based on Bayesian networks and radial basis functions has been proposed in this article. The performances of five machine learning (ML) techniques, namely, LR, DT classifier, SVM, KNN, and RF, are compared with the proposed EL technique. Experiments reveal that the proposed method outperforms five ML approaches (LR, DT, SVM, KNN, and RF), with an accuracy of 97.11%. Krishnamoorthi et al. [33] investigated the prediction of diabetes using PIDD. They tested three ML methods SVM, DT, and LR. The results indicated that LR achieved a higher accuracy (86%) after implementing the hyperparameter tuning.
Moreover, Patil and Tamane [34] implemented eight machine learning models, LR, KNN, SVM, gradient boost, DT, MLP, RF, and Gaussian naïve Bayes. The results showed that the highest accuracy was achieved by the LR model, with 79.54%. WANG et al. [35] utilized an RF algorithm for Diabetes Mellitus classification from the PIDD dataset. Then, they addressed the imbalance problem in the dataset by implementing a synthetic sampling method (ADASYN). Their approach was called DMP_MI. They achieved an accuracy of 87.1%. Other researchers used the same dataset and utilized a clustering algorithm and Sequential Minimal Optimization (SMO) classifier algorithm [36]. Naïve Bayes algorithm is an optimal algorithm [37].
Furthermore, Joshi and Dhakal [38] focused on specific features in PIDD glucose, which are pregnancy, body mass index (BMI), diabetes pedigree function, and age. Their model achieved a prediction accuracy of 78.26% using LR and DT algorithms. Sivaranjani et al. [39] implemented step-forward and backward feature selection on the PIDD dataset and achieved an accuracy of 83% using the RF algorithm. Similarly, other researchers achieved an accuracy of 82% based on the RF classifier mode on the same dataset [40].
Kumari et al. [41] combined RF, LR, and NB and tested the effect of implanting an ensemble soft voting classifier. They found that their proposed approach outperforms the base classifiers including Adaptive Boosting (AdaBoost), GradientBoost, eXtreme Gradient Boosting (XGBoost), and CatBoost (CAT) with accuracy, precision, recall, and F-score of 79.04%, 73.48%, 71.45%, and 80.6% respectively. Kalagotla et al. [42] implemented a correlation technique for feature selection from the Pima India dataset. The selected features are age, body mass index (BMI), and glucose. The finding indicated that the staking technique of (multi-layer perceptron, SVM, and LR) outperformed the AdaBoost with 78.2% accuracy, 72.2% precision, 54.4% recall and 59.4% F-score. Bukhari et al. [43] trained a model using an artificial backpropagation scaled conjugate gradient neural network (ABP-SCGNN) algorithm to predict diabetes effectively. Then, they tested different numbers of neurons in the hidden layer, ranging from 5 to 50. The results showed that the ABP-SCGNN model, containing 20 neurons, achieved an accuracy of 93%.
Alreshan et al. [44] achieved 98.81% using stack-ANN on the PIDD dataset. They have also tested the same algorithm on diabetes dataset of the Frankfurt Hospital, Germany [45], and achieved 99.51% prediction accuracy. Other researchers [46] used diabetes dataset of the Frankfurt Hospital, as well and found that RF method outperformed XGBoost and DT yielding accuracy of 98%.
2.2. Heart Disease Prediction
All the discussed works in this subsection utilized the UCI Heart Disease dataset. This dataset has been widely used for evaluating various machine-learning models in predicting heart disease outcomes. Shrestha [47] applied multiple ML algorithms including LR, RF, Gradient Boosting, XGBoost, and LSTM networks on the Cleveland UCI Heart Disease dataset. The results indicated that XGBoost achieved higher performance with an accuracy of 90%. Alfadli et al. [48] tested feature selection on the UCI Heart Disease dataset using the Importance Permutation approach. To address the missing values, they replaced the missing numerical values with the mean while the missing values in categorical features were replaced with the new label “Unknown”. They found that the Gaussian Process (GP) outperforms the other algorithms with an accuracy of 84.24%, Recall of 89.22%, and Precision of 83.49%. Other researchers used the UCI Cleveland dataset, Anderie et al. [49] found that the SVM algorithm outperformed DT, NB, KNN, and precision with an accuracy of 85%. Bharti et al. [50] achieved 94.2% accuracy using a deep learning approach.
Furthermore, Asif et al. [51] implemented different hyperparameter optimization approaches, including grid search cross-validation (CV) and randomized search CV. The finding indicated that the extra tree classifier algorithm performed better than RF, XGBoost, and CatBoost with an accuracy of 98.15%. Noroozi et al. [52] utilized various feature selection techniques including filter, wrapper, and evolutionary approaches. They found that implementing filter feature selection using Correlation-based feature selection, information gain, and Symmetrical uncertainty improved the performance of SVM and achieved 85.5 %. Chandrasekhar and Peddakrishna [53] explored various ML algorithms on the Cleveland and IEEE Dataport heart disease datasets, which are RF, NB, KNN, LR, gradient boosting (GB), and AdaBoost (AB). The grid search CV approach was used for hyperparameter tuning while standardization and normalization techniques were implemented for feature scaling. Subsequently, to improve performance, they combined all the models using a soft voting ensemble method which led to an accuracy of 93.44% for the Cleveland dataset and 95% for the IEEE Dataport dataset. Korial et al. [54] applied chi-squared feature selection method, then tested multiple ML classifiers, including NB, RF, LR and KNN. They found that their voting ensemble model achieved an accuracy of 92.11%.
3. Methodology
In this work, we follow a structured pipeline designed to evaluate the performance of ChatGPT in chronic disease prediction. The workflow is summarized in Figure 1. The methodology is divided into several phases starting from selecting the datasets, preprocessing the data, selecting significant features, selecting learning strategies (involves choosing between strategies like zero-shot, few-shot, and chain-of-thought (CoT) reasoning, prompt engineering, API configuration, and finally, the results were evaluated and compared against the best models from the literature. All the experiments are done under Python using multiple supporting libraries for analysis and visualization including Pandas [55], NumPy [56], Scikit-Learn [57], and Matplotlib [58].
3.1. Dataset
3.1.1. Diabetes Disease Dataset
The first dataset utilized in this study is the Pima Indian Diabetes Dataset (PIDD) [59] provided by the National Institute of Diabetes and Digestive and Kidney Diseases (NIDDK). The dataset consisted of 9 features, as illustrated in Table 1.
The second dataset is the collected diabetes dataset from Frankfurt Hospital, Germany. It consists of 2,000 records, with 684 diabetic patients and 1,316 non-diabetic patients. The features are similar to those in the PIDD dataset.
3.1.2. Heart Disease Dataset
3.2. Data Pre-Processing
Data pre-processing ensures that the data is clean and standardized for subsequent analysis. In this work, we perform cleaning and data transformation. In cleaning, we handle missing values by removing any row including the null value. In data transformation, we transformed numeric data into non-numeric (categorical) data for all categorical features.
The Pima India diabetes dataset was examined for pre-processing. Upon inspection, the dataset was found to have no missing values (null data) and no categorical features. Thus, no modifications were applied to the data before passing to the next phase.
For the UCI heart dataset, we removed 6 rows that included missing data, leaving 297 rows in the dataset for analysis. The ‘num’ column contains the labels 0-4 representing the severity levels ranging from 0, which represents healthy to 4, which represents Severe. Moreover, Figure 2 illustrates the proportion of patients in each category based on the 'num' variable, highlighting the relative frequency of each group in the dataset after cleaning null values. The chart highlights a noticeable imbalance in the distribution of patients across the five categories. Category 0 holds the majority where 160 patients do not have heart disease. In contrast, only 13 patients have severe heart disease, representing the smallest group. The other categories are relatively smaller but still show some variation. Leaving the dataset with imbalanced classes will lead to bias toward predicting the majority class (no heart disease), such imbalances can affect the performance. Thus, we converted them into binary classification to avoid the model’s performance being skewed. Furthermore, the performance of this model will be evaluated against the best models from the literature where they all follow the same transformation and thus converting the problem into binary classification will ensure a fair comparison.
Subsequently, we replace the abbreviation of the feature names with the full name to enhance the understanding of the features by the model. Likewise, to improve clarity, we perform data transformation and replace the numbers in the categorical features with text, such as replacing 0-1 in sex with male, female.
3.3. Experiments
In this paper, several approaches and experiments were implemented using the latest GPT versions, GPT-4o and GPT-4o-mini. GPT-4o is the high-intelligence model while GPT-4o-mini is the most cost-efficient model surpassing GPT-3.5 Turbo and other small models. Feature selection has been evaluated to study its effect on performance. Subsequently, different learning strategies have been tested including zero-shot, few-shot learning, and CoT reasoning. Prompt engineering is considered to enhance the prediction results. Thus, multiple prompt formats have been tested. Running multiple experiments allows us to discover the best approach to develop a disease prediction model. The following subsection provides a breakdown of the experiments and their results.
3.3.1. Feature Selection
We have various feature selection methods including filter-based methods and wrapper-based methods. Wrapper methods evaluate subsets of features by iteratively training models and optimizing feature selection. In contrast, filter methods assess the relevance of features using statistical measures. In this work, two filter-based methods will be tested, which are Mutual Information Feature Selection (MIFS) and Correlation-based Feature selection (CBFS) methods. MIFS is an entropy-based method used for feature selection, measuring any arbitrary dependency between random variables. The mutual information between two variables is a measure of the amount of knowledge one of them supplied by the other. If features (F) and target (T) are independent, and both contain no information about each other; then their mutual information is zero [61].
Moreover, Correlation-based feature selection method is one of the filter methods. It is faster and less computationally expensive than other methods such as recursive feature elimination. In the correlation method, significant features are selected based on their relevance to the target (the predicted attribute). If we have two strongly correlated features, we can predict one from the other, which means the model only needs one feature, as the second does not add additional information. Thus, in this work, we selected a correlation-based method for feature selection.
Pima Indian Diabetes Dataset (PIDD)
Developing effective prediction models, especially in medical domains requires understanding feature correlation, which helps in understanding how they interact with each other and influence the outcome. The heatmap in Figure 3 shows the correlation between all features in the dataset. The correlation values range from -1 to 1, where 1 indicates a strong positive correlation, -1 indicates a strong negative correlation, and near 0 means no significant correlation between the features. The positive correlation means as one feature increases, the other also increases whereas the negative correlation means as one feature increases, the other decreases. Correlation helps identify relationships between features to select the influential features in the predictive model.
The heatmap in Figure 3 shows that Glucose, BMI, Age, and Pregnancy are most strongly positively related to diabetes outcomes. The correlation between Glucose and Outcomes is 0.47 demonstrating that higher glucose levels are a primary indicator of diabetes. Besides, the correlation between BMI and Outcomes is 0.29 implying that higher body fat increases the risk of diabetes. Additionally, Age and pregnancy are moderately positively correlated with diabetes, with values of 0.24 and 0.22 respectively reflecting the increased risk with increasing the age and number of pregnancies. On the other side, Blood Pressure and Skin Thickness show very low (week) correlations with the outcome, which means that they have a smaller impact. Figure 4 illustrates the correlation between features of diabetes and outcome. Both BloodPressure and Skinthickness will be dropped when using CBFS since they have a lower correlation value.
Moreover, Figure 5 shows the mutual information scores for feature selection. Features with higher scores, such as Glucose. BMI, pregnancy, and age indicate strong relevance to the target variable (Outcome). However, BloodPressure shows a value of zero so it will be discarded since it is not relevant to the target.
Frankfurt Hospital Diabetes Dataset (FHDD)
Figure 6 illustrates the correlation between all features in the Frankfurt Hospital Diabetes Dataset. The results, as depicted in Figure 7 as well, are closely aligned with those of the PIDD dataset, differing by no more than ±1.
Figure 8 depicts the mutual information scores. None of the features have a score of zero. This indicates that all features contribute to the prediction, so none of them will be dropped from the analysis.
UCI Cleveland Heart Disease Dataset
Moreover, the heatmap in Figure 9 shows the correlation between features in the UCI Cleveland dataset. ca, thal, and oldpead are most strongly related to the num (outcome) column, with values 0.52, 0.51 and 0.50, respectively. Furthermore, cp, exang and slope have moderate positive relationships with the presence of heart disease while sex, age, trestbps, chol and restecg show low positive correlations. The feature chol shows a very weak correlation of 0.07. Likewise, fbs has the lowest correlation of 0.05, indicating a very weak relationship with num. On the other hand, thalach has a negative correlation of -0.42 with num, suggesting that higher heart rates during exercise tend to be related to the absence of heart disease. Figure 10 illustrates the correlation between features and num.
Additionally, Figure 11 illustrates the mutual information scores. Age, trestbps and fbs show values zero, which means that they are irrelevant to the target (num). Thus, they will not be fed to the prediction model when using MIFS.
3.3.2. Learning Strategy Selection
Figure 12 illustrates the different experimental scenarios based on the learning strategies employed in this study. The scenarios include zero-shot, few-shot learning and CoT reasoning. Each of these scenarios was tested to evaluate their impact on the performance of GPT-4o and GPT-4o-mini.
In Zero-shot learning, the model performs a task without any provided examples or prior training for that task. Instead, the model recognizes new concepts from just the provided description [62]. The model relies on its pre-trained knowledge and general understanding of language to make predictions and generate outputs. This strategy eliminates the need for task-specific labeled examples which make it useful for quickly formulating the prompt and testing the performance of models.
Moreover, Few-shot learning is a sub-area in machine learning [63]. It involves feeding the model with a few examples of the prediction, supporting it to generalize from those examples to new cases. The goal is to enable the model to generate accurate predictions by learning from a small number of examples. Firstly, we consider that providing diverse examples is important to help the model learn from these patterns. We tested various numbers of examples (three-shot, five-shot, and ten-shot). We excluded the outliers during the processes of example selection, and we considered picking different patient characteristics to cover diverse scenarios. Further, to prevent bias, we try to select a balanced number of examples for each outcome. For instance, for 5-shot, we selected 3 cases representing diabetes/heart disease and 2 cases representing non-diabetes/no heart disease. Additionally, since consistency in prompt formatting is very important, we followed a structured format and ensured that all provided examples followed the same structure to represent the patient data. This supports a prompt understanding by the model.
Furthermore, Chain of thought (CoT) learning encourages the model to follow a step-by-step reasoning before concluding. In CoT, the following sentence “Let’s think step by step” is included in the prompt to encourage the model to think step-by-step before answering each question as induced in [64]. In the few-shot CoT experiment, the model is fed with step-by-step reasoning examples instead of just providing question and answer examples [65]. In a few-shot CoT, examples are provided to show the expected input-output format and explain how to perform reasoning for similar cases.
Moreover, we proposed Knowledge-Enhanced zero-shot/few-shot CoT reasoning. Figure 13 shows the proposed structure for the prompt message. The first part of the message defines the role of the model and provides context for its prediction task. The second part explicitly encourages the model to reason sequentially, instead of jumping directly to a prediction. Then, in Knowledge-Enhanced few-shot CoT, examples are provided to illustrate the expected input-output format. Thus, we constructed a prompt containing three randomly selected patient examples and manually composed their corresponding reasoning, finalized with the predicted outcomes (0 or 1) of each example. Hence, the model learns not only how to predict disease but also the reasoning progression behind those predictions, which improves the reliability and interpretability of the prediction. The final section outlines specific steps and domain knowledge to guide the reasoning process. This section could be applied in both zero-shot and few-shot CoT. The goal is to improve the reasoning process by adding contextual guidance and domain-specific knowledge to the prompt.
3.3.3. Prompt Engineering
Prompt engineering is a crucial aspect when creating prompts. It can significantly improve the accuracy and relevance of the model's prediction. Additionally, integrating the prompts with diverse examples of patient data along with their outcomes enhances the model learning from these patterns. This encourages us to run experiments using the few-shot prompting. Subsequently, regarding the features, we considered testing the scenario of including all the features in the dataset and the scenario of concentrating only on the features that are most indicative of diabetes/ heart disease (e.g., glucose).
Prompts Formulation and Optimization
We considered writing clear instructions to the model including clearly specifying the expected output format as well as organizing the information clearly to enable the model parsing the message more easily. Additionally, prompts are formulated based on the selected learning strategy and include concise instructions such as step-by-step reasoning prompts for CoT scenarios. Figure 14 shows an example of a zero-shot prompt for diabetes disease prediction.
Figure 15 shows the tested zero-shot prompts for heart disease prediction. We highlighted the differences in blue color. Figure 15a shows the features and values as in the dataset while in Figure 15b we provided the full feature name. In Figure 15c, we transformed numeric data into text representing the actual value in all categorical features. Figure 15d combines the data transformation as in (c) and column explanation as in (b).
3.3.4. API Configuration and Parameter Optimization
In this phase, the ChatGPT API is configured to interact with the model in order to obtain predictions. Multiple configurations are tested to evaluate performance under different scenarios. We use Python to send the constructed prompt to OpenAI's API. Along with the prompt, we specify parameters of the API, such as model, message, max_tokens, and temperature. The model parameter specifies which version of the language model to use, such as gpt-4o-mini and gpt-4o. These models are distinct in terms of efficiency and performance. Besides, the messages parameter includes the conversation. It consists of a list of message objects, each message object includes a role such as "system," "user," or "assistant" and content (the text input). Additionally, the message of the user role represents the query and inputs such as patient data. Subsequently, the message of the system role plays the primary role for the model in order to guide its behavior. In the experiments, we used this message "You are a medical expert who provides …. disease predictions based on patient data.".
Moreover, the temperature parameter controls the randomness of the output; low-temperature values (e.g., 0 to 0.3) are used for more deterministic outputs, specifically for binary classification tasks such as in our case. Accordingly, we set the value to 0 in all our experiments. We also tested slight increases in this value, such as 0.3, but it does not make an improvement in the performance. Finally, the max_tokens parameter was configured based on the chosen learning strategy. For zero-shot and few-shot strategies, only a single token was needed to capture the output since the prediction was limited to a binary classification (0 or 1). Hence, max_tokens was set to 1. However, in CoT, the output typically includes reasoning steps followed by the final prediction. Consequently, max_tokens was adjusted dynamically to fit the size of the expected output to ensure that the model had sufficient token capacity to provide a detailed step-by-step clarification. Accordingly, this tuning process ensures adjusting parameters through experimentation to improve performance and outcome.
3.3.5. Evaluation
We evaluate the performance using the accuracy as well as the other common evaluation metrics including precision, recall, and f1-score to evaluate how well the model handles all categories, particularly the minority ones. Accuracy is the most common performance measure. It is simply a ratio of correctly predicted instances to the total predictions. It is calculated as:
Precision (also known as Positive Predictive Value). It is the ratio of correctly predicted positive instances to the total predicted positives. It is calculated as:
where TP represents the total number of True Positives means the correctly classified and FP represents the total number of False Positives means the wrongly predicted as positive class.
Recall is also known as a True Positive Rate. It is calculated as:
where FN is the total of the false negative means the wrongly predicted as negative class.
F1-score represents the mean of precision and recall. It is calculated as:
4. Results
4.1. Diabetes Prediction
After running the prediction experiments across a dataset, we compared the model's predictions to the actual outcomes to assess the performance, using the common evaluation metrics including accuracy, precision, recall, and F1-score.
4.1.1. Prediction Results for the Pima Indian Diabetes Dataset (PIDD)
Table 3 presents the evaluation results for zero-shot and few-shot learning over two GPT4 versions (GPT-4o, GPT-4o-mini). The results demonstrate that GPT-4o significantly outperforms GPT-4o-mini. Subsequently, the implementation of correlation-based feature selection using GPT-4o makes a slight enhancement (0.39%) in the accuracy for zero-shot and 5-shot. The highest accuracy achieved by ChatGPT was 77.08 % using the GPT-4o version and 5-shot with feature selection based on the correlation coefficient.
Furthermore, Table 4 shows the evaluation results using CoT reasoning. As GPT-4o-mini did not provide promising results in the previous scenarios, we implemented CoT using only GPT-4o. In addition, we applied a CBFS approach since it helps in achieving the highest results with the previously implemented learning strategies. The results indicate that the Domain-Specific Knowledge message improves the results gained by both zero-shot and few-shot learning. Subsequently, the highest results are yielded by Knowledge-Enhanced 3-shot. It achieved 73.69% accuracy, 60.31% precision, 72.01% recall, and 65.65% F1-score. However, the results are still lower than those achieved by other learning strategies in previous experiments. Thus, Knowledge-Enhanced CoT with 3-shot does not contribute to improving the overall performance. Specifically, the high cost associated with running this experiment, due to the large number of tokens required, limited our ability to test multiple scenarios such as 5-shot and 10-shot learning. Additionally, this constraint prevented us from including all the available features in the analysis. As a result, we did not do further experimentation with these configurations, particularly after the unpromising results that we got from CoT.
4.1.2. Prediction Results for the Frankfurt Hospital Diabetes Dataset (FHDD)
Table 5 shows the results for FHDD. The MIFS is not included in this experiment since the mutual scores indicate that all the features are important. The results yielded by including all the features are slightly higher than when using CBFS. The best prediction accuracy was obtained by GPT-4o using 5-shot (75.85%)
Moreover, Table 6 illustrates the evaluation results using CoT reasoning, including all the features, which helped as shown in
Table 3 to obtain the highest results. Like PIDD, the Domain-Specific Knowledge message improves the results for FHDD as well. The highest accuracy and F1-score are yielded by Knowledge-Enhanced 3-shot. It achieved 72.35% accuracy and 65.72% F1-score. However, the results are still lower than those achieved by other learning strategies in previous experiments.
4.2. Heart Disease Prediction
For heart disease prediction, we tested different prompts to evaluate the effect of prompt engineering on the results. The dataset initially consisted of categorical features, converted into numerical values to fit the analysis using traditional ML. However, to provide clear input for the ChatGPT model, we converted them into text. Furthermore, we clarified the names of the columns (features) to ensure that the model could interpret the data effectively and generate accurate predictions. Then, we test the effect of this step on enhancing its performance in disease prediction tasks.
Table 7 shows the results of the four prompts present in the above Figure 15. All the experiments in the table were accomplished using zero-shot and without any feature selection. The goal is to study the effect of prompt formulation. It can be seen that prompt engineering can significantly enhance the results of the prediction. The highest result was achieved by the fourth prompt where we clarified the feature and replaced numerical data with full text reflecting the value. This approach resulted in an accuracy of 80.47%, a precision of 76.51%, and an F1-score of 79.72%, demonstrating the effectiveness of clear and detailed prompt formulation in improving the model's performance. Therefore, we used this format in further experiments for few-shot learning.
Table 8 illustrates the results using zero-shot and few-show learning with and without feature selection methods. In all cases, the CBFS approach helps in increasing the accuracy in addition to that GPT-4o beats GPT-4-mini in terms of accuracy, precision, and f1-score. The 5-shot learning using GPT-4o with the CBFS method achieved the highest results with 85.52% accuracy, 87.30% precision, and 83.65% f1-score. Furthermore, like diabetes prediction, CoT failed to improve the prediction. Table 9 shows the results where 3-shot CoT outperformed zero-shot, CoT but the results are far from what was accomplished by GPT-4o with few-shot learning, as shown in Table 8. Additionally, the performance with the Domain-Specific Knowledge message was worse than simpler prompts. The expected reason behind that is the complex combination of interacting features for heart disease.
5. Discussion
5.1. Comparative analysis with Existing ML/DL Models
We evaluate the results against the best models from the literature that utilize the same dataset. The selected models are illustrated in Table 10. Considering that the models are tested on different data size so direct comparison will not be fair, particularly for ChatGPT since we include the whole dataset in testing. Therefore, we used the confidence interval (CI), which helps in comparing model performances. Instead of simply stating the model accuracy, the 95% CI gives a range of values, indicating that the true accuracy is within that range. By looking at the CIs, we can see if the difference between models is statistically significant. As can be noted from Figure 16 and Figure 17, our results using GPT-4o do not outperform the other approaches, particularly deep learning using stack-ANN where it achieved 98.81% using PIDD and 99.51% using FHDD. Additionaly, The CIs in both charts indicate that the performance difference between the ChatGPT and the others is statistically significant. Likewise, Figure 18 demonstrates that the best results were achieved by the extra tree classifier [51], which obtained an accuracy of 98.15%, outperforming ChatGPT's performance in heart disease prediction. However, by looking at CIs, we can see that the accuracy for heart disease prediction yield by ChatGPT is almost near to the lower boundaries of [50,53].
The findings indicate that ChatGPT in its various configurations for diabetes prediction, did not outperform the best machine learning and deep learning models from the literature. The results demonstrate that 5-shot learning with correlation-based feature selection using GPT-4o configuration achieved 77.08% accuracy surpassing other approaches including zero-shot, 3-shot, 10-shot, zero-shot CoT, few-shot CoT and Knowledge-enhanced CoT reasoning methods. The reason behind that could be that providing too few examples may not give the model enough information to support accurate prediction while providing too many examples could overwhelm it. Likewise, for heart disease prediction, ChatGPT falls behind the traditional machine learning models in terms of accuracy. It achieved an accuracy of 85.52%, precision of 87.30%, recall of 80.29%, and f1-score of 83.65% using 5-shot learning and applying correlation-based feature selection. However, it can be noticed that recall is high when other metrics are low and, in some cases, it shows 100% indicating that there are zero false negative cases. This usually occurs when dealing with an imbalance dataset such as in our case where in the PIDD dataset we have 268 positive cases out of 768 cases and in FHDD we have 684 positive cases out of 2000 cases. Moreover, the findings highlight the importance of prompt formulation since it leads to significant improvement. Besides, GPT-4o beat GPT-4o-mini in all experiments and improved the performance significantly. Additionally, feature selection, with correlation coefficients proves a positive impact in identifying the most predictive features for both heart disease and diabetes using PIDD compared with mutual information feature selection method. However, in FHDD, the mutual information method indicated that all features are important. Later, the results demonstrated that the model achieved higher accuracy when including all features compared to using the correlation-based method.
Furthermore, both Zero-shot and various CoT reasoning methods showed lower performance compared to few-shot learning. Although CoT reasoning encourages the model to break down the problem step-by-step, it is notably less effective than zero-shot. We assumed that guiding the model through intermediate reasoning steps would improve the prediction. Unlike our expectations, simplicity, and directness by zero-shot yield better results than attempting to guide the model through intermediate reasoning steps. Additionally, the use of a Domain-Specific Knowledge message (Knowledge-Enhanced 3-shot CoT) helps in improving the prediction accuracy for diabetes compared with zero-shot CoT and few-shot CoT. However, it yielded worse results for heart disease, raising the need for designed prompt strategies based on disease complexity. Subsequently, involving specialists from the medical domain could provide valuable insights to improve the format of Knowledge-Enhanced CoT, particularly for complex diseases.
Moreover, the type of datasets used in this study should be considered when interpreting the results. These datasets were selected due to their reputation in the research community and their availability for public use. Including new and diverse real-world datasets from various hospitals would be highly valuable for testing the generalizability and performance of the model. However, this was not feasible in this study due to the challenges and lengthy process associated with collecting medical data, including the regulations and the required access approvals. Therefore, we highlighted this as an important direction for future work.
5.2. Challenges in Using ChatGPT for Disease Prediction and Potential Enhancements
ChatGPT is a generative language model that processes input text using pattern recognition instead of arbitrary numerical computation. Additionally, ChatGPT’s predictions are probabilistic, indicating that its output can vary based on small changes in the input message. Subsequently, the use of few-shot learning and the proposed task-specific training(knowledge-advanced CoT reasoning) did not affectively address this gap due to the complexity of the medical data as well as the sensitivity towards prompt formulation.
Moreover, one of the reasons that ML/DL models surpass ChatGPT is that they are trained with carefully labeled data and optimized for specific disease prediction tasks. In contrast, ChatGPT generates responses based on what is learned from a massive amount of training data. These data are primarily extracted from web content, including websites, articles, online books, etc. Due to the limitation in filtering techniques, the training data consists of undesirable or biased content that affects the model's ability to provide accurate output. In healthcare, biased models will lead to misdiagnoses causing unfair treatment for patients. The training data may not reflect the health of everyone, particularly people of specific races, genders, or even patients with low incomes. Therefore, the model will fail to deal with these underrepresented groups. For instance, if the model is solely trained on female patients, it will show poor results when diagnosing male patients. Similarly, models trained in adult data may not work well with infant patients.
Additionally, the other ethical issue is that ChatGPT is still not FDA/CE-approved for direct diagnosis. Besides, processing sensitive patient information emphasizes significant privacy concerns.
To sum up, ChatGPT struggles with disease prediction tasks compared to ML/DL due to the following reasons:
- High sensitivity to prompt engineering: High sensitivity to prompt formulation
- Complexity of medical data: The varying complexity of medical data and disease types such as heart disease.
- Bise: ChatGPT relies on general training data, which introduces bias.
- Regulation issues: ChatGPT is not FDA/CE-approved.
- Privacy concerns: ChatGPT can get access to highly sensitive medical data leading to discrimination or misuse.
Moreover, the training on labeled medical data could minimize the dependency on prompt engineering, leading to prediction stability. Therefore, fine-tuning the ChatGPT model on domain-specific (structured medical) datasets could address this issue. Bias can be handled with human-in-the-loop (HITL) approaches [66], by involving experts (specialists in the medical domain) to annotate training data, guide the model fine-tuning process, and assess the model’s outputs. Besides, the ethical issue aligned with the privacy of patient information during the training process can be addressed by following an approach such as generating synthetic data that mimics real patient data without actually copying the actual data [67]. Therefore, further investigation is required to study the effect of fine-tuning on disease prediction. Furthermore, a hybrid approach that combines ChatGPT with traditional ML models, such as using ML-based feature selection could help overcome specific limitations and merge the strengths of both ChatGPT and traditional models.
5.3. The Role of ChatGPT in Enhancing Clinical Decision-Making
ChatGPT can act as a clinical assistant to enhance decision-making rather than just replacing ML/DL models. Figure 19 illustrates the suggested workflow for ChatGPT as a complementary tool for clinicians. The process begins with patient data, which could be structured (e.g., laboratory results, vital signs, etc.) or unstructured (e.g., doctor’s notes and radiology reports). Followed by ChatGPT as an assistant for pre-screening, and data summarization to provide initial insights. Initially, it can extract relevant information from patient records and medical reports. Previous studies demonstrate its abilities in information extraction from clinical notes [68], [69] and radiology reports [70]. Then, the extracted information will be filtered to eliminate unnecessary information and then the data from different sources such as radiology reports and laboratory results can be interpreted, grouped, and summarized. After that, an initial assessment of the patient’s risk can be made to minimize clinician time and effort by providing a quick overview of potential concerns. Subsequently, the important information can be converted into structured data to facilitate further analysis. Then, these data will be analyzed by ML/DL models to make predictions. Next, ChatGPT will assist the clinician and generate an easy-to-understand report from the ML/DL model’s output. These reports can improve patient engagement as well. Finally, the final diagnosis and decision will be made. The clinicians will translate the outcomes into meaningful discussions with patients.
6. Conclusions
This paper investigates the effectiveness of ChatGPT in chronic disease diagnoses, particularly heart disease and diabetes prediction from a structured dataset. The dataset includes medical test results, such as glucose levels, BMI, blood pressure, and cholesterol levels. Various experimental setups using GPT-4o and GPT-4o-mini were designed to evaluate the impact of different learning strategies, such as zero-shot, few-shot (3-shot, 5-shot, 10-shot), zero-shot CoT reasoning, 3-shot CoT reasoning, and the proposed Knowledge-enhanced CoT. Furthermore, we tested two feature selection methods, which are correlation-based and mutual information. In addition, various prompt formulations are created to examine the effect on the prediction. After that, the results are compared with the best models from literature that employ traditional machine learning and deep learning.
Moreover, findings indicate that 5-shot learning with the GPT-4o model was the most effective configuration for both diabetes and heart prediction, surpassing other strategies (zero-shot, 3-shot, 10-shot, CoT reasoning, and Knowledge-enhanced CoT). Subsequently, the use of Knowledge-Enhanced CoT improves the prediction accuracy for diabetes compared to zero-shot CoT and few-shot CoT, but it fails to provide improvements for heart disease, which is a more complex disease. The variability in ChatGPT’s performance depending on the prompting strategy highlights the need for tailored prompt designs to maximize their effectiveness in structured prediction tasks as well as considering the disease complexity. Besides, the use of prompt formulation significantly improves performance, particularly for the heart dataset where it contributed to a 5% performance increase, emphasizing the importance of prompt engineering.
Furthermore, the findings show that ChatGPT does not outperform the best-achieved models from literature. However, the results demonstrate that it offers a promising possibility for disease prediction since it yielded an accuracy of 85.52 % for heart disease and 77.08% for diabetes using PIDD and 75.85% using FHDD, raising the need for advanced techniques to address its limitations. Furthermore, we proposed a workflow for ChatGPT, in which it serves as a complementary tool for clinicians to enhance decision-making and provide support alongside ML/DL models.
Future work in this area could include further evaluations of the recent release of GPT4 (o1), which offers advanced reasoning, as well as further enhancements in prompt engineering and feature selection techniques to improve the model's accuracy. Future validation on external, multi-institutional datasets representing different diseases is required to confirm the model’s generalizability. Additionally, involving specialists in the medical domain to assist the obtained results could provide valuable insights. Subsequently, further research is needed to investigate how ChatGPT performs in multi-class classification tasks, as well as to address issues related to dataset imbalance. There is a need for further investigation of the implementation of hybrid systems to integrate the strength of Chat GPT with ML/DL models. The applicability of the suggested AI-assisted workflow has to be explored to test its feasibility on various diseases.
Funding
This research received no external funding.
Institutional Review Board Statement
Not applicable.
Informed Consent Statement
Not applicable.
Conflicts of Interest
The authors declare no conflict of interest.
References
- D. Fernández-edreira, J. Liñares-blanco, and C. Fernandez-lozano, “Machine Learning analysis of the human infant gut microbiome identifies influential species in type 1 diabetes,” Expert Syst. Appl., vol. 185, no. November 2020, p. 115648, 2021. [CrossRef]
- Y. Kumar, A. Koul, R. Singla, and M. F. Ijaz, “Artificial intelligence in disease diagnosis: a systematic literature review, synthesizing framework and future research agenda,” J. Ambient Intell. Humaniz. Comput., vol. 14, no. 7, pp. 8459–8486, 2023. [CrossRef]
- J. Tom, M. Zsoldos, and A. Thurzo, “AI and Face-Driven Orthodontics : A Scoping Review of Digital Advances in Diagnosis and Treatment Planning,” pp. 158–176, 2024.
- S. Dara, S. Dhamercherla, S. Singh, J. Ch, and M. Babu, Machine Learning in Drug Discovery : A Review, vol. 55, no. 3. Springer Netherlands, 2022.
- Blanco-gonz et al., “The Role of AI in Drug Discovery : Challenges , Opportunities , and Strategies,” pp. 1–11, 2023.
- E. Garreffa et al., “Regional lymphadenopathy following COVID-19 vaccination : Literature review and considerations for patient management in breast cancer care,” Eur. J. Cancer, vol. 159, pp. 38–51, 2021. [CrossRef]
- T. W. Smith, “Intimate Relationships and Coronary Heart Disease : Implications for Risk , Prevention , and Patient Management,” Curr. Cardiol. Rep., pp. 761–774, 2022. [CrossRef]
- Y. Kumar, S. Gupta, R. Singla, and Y. Chen, “A Systematic Review of Artificial Intelligence Techniques in Cancer Prediction and Diagnosis,” Arch. Comput. Methods Eng., vol. 29, no. 4, pp. 2043–2070, 2022. [CrossRef]
- D. Nam, J. Chapiro, V. Paradis, T. P. Seraphin, and J. N. Kather, “Artificial intelligence in liver diseases : Improving diagnostics , prognostics and response prediction,” J. Hepatol., vol. 4, no. 4, p. 100443. [CrossRef]
- R. Sawhney, A. Malik, S. Sharma, and V. Narayan, “A comparative assessment of artificial intelligence models used for early prediction and evaluation of chronic kidney disease,” Decis. Anal. J., vol. 6, no. January, p. 100169, 2023. [CrossRef]
- “National Cancer Institute.”. Available online: https://www.cancer.gov/ (accessed on 2 December 2024).
- “American Heart Association, Classes of Heart Failure, American Heart Association.”. Available online: https://www.heart.org/en/health-topics/heart-failure/what-is-heart-failure/classes-of-heart-failure.
- “World Health Organization, Cardiovascular Diseases, WHO.”. Available online: https://www.who.int/health-topics/cardiovascular-diseases/#tab=tab_1.
- “World Health Organization, Diabetes, WHO,” 2024. Available online: https://www.who.int/news-room/fact-sheets/detail/diabetes.
- E. P. Onakpojeruo, M. T. Mustapha, D. U. Ozsahin, and I. Ozsahin, “A Comparative Analysis of the Novel Conditional Deep Convolutional Neural Network Model, Using Conditional Deep Convolutional Generative Adversarial Network-Generated Synthetic and Augmented Brain Tumor Datasets for Image Classification,” Brain Sci., vol. 14, no. 6, 2024. [CrossRef]
- E. P. Onakpojeruo, M. T. Mustapha, D. U. Ozsahin, and I. Ozsahin, “Enhanced MRI-based brain tumour classification with a novel Pix2pix generative adversarial network augmentation framework,” Brain Commun., vol. 6, no. 6, pp. 1–22, 2024. [CrossRef]
- Alanazi, L. Aldakhil, M. Aldhoayan, and B. Aldosari, “Machine Learning for Early Prediction of Sepsis in Intensive Care Unit (ICU) Patients,” Med., vol. 59, no. 7, pp. 1–9, 2023. [CrossRef]
- H. A. Ganatra, S. Q. Latifi, and O. Baloglu, “Pediatric Intensive Care Unit Length of Stay Prediction by Machine Learning,” Bioengineering, vol. 11, no. 10, pp. 1–11, 2024. [CrossRef]
- “Multicenter, Randomized Trial of a Bionic Pancreas in Type 1 Diabetes,” N. Engl. J. Med., vol. 387, no. 13, pp. 1161–1172, Sep. 2022. [CrossRef]
- M. D. Abràmoff, P. T. Lavin, M. Birch, N. Shah, and J. C. Folk, “Pivotal trial of an autonomous AI-based diagnostic system for detection of diabetic retinopathy in primary care offices,” npj Digit. Med. 2018 11, vol. 1, no. 1, pp. 1–8, Aug. 2018. [CrossRef]
- M. M. Ahsan, S. A. Luna, and Z. Siddique, “Machine-Learning-Based Disease Diagnosis : A Comprehensive Review,” Healthcare, pp. 1–30, 2022.
- E. A. Alomari, “Unlocking the Potential: A Comprehensive Systematic Review of ChatGPT in Natural Language Processing Tasks,” C. - Comput. Model. Eng. Sci., vol. 141, no. 1, pp. 43–85, 2024. [CrossRef]
- L. Caruccio, S. Cirillo, G. Polese, G. Solimando, S. Sundaramurthy, and G. Tortora, “Can ChatGPT provide intelligent diagnoses? A comparative study between predictive models and ChatGPT to define a new medical diagnostic bot,” Expert Syst. Appl., vol. 235, no. July 2023, p. 121186, 2024. [CrossRef]
- M. Gollapalli et al., “A novel stacking ensemble for detecting three types of diabetes mellitus using a Saudi Arabian dataset : Pre-diabetes , T1DM , and T2DM,” Comput. Biol. Med., vol. 147, no. April, p. 105757, 2022. [CrossRef]
- H. F. Ahmad, H. Mukhtar, H. Alaqail, M. Seliaman, and A. Alhumam, “Investigating Health-Related Features and Their Impact on the Prediction of Diabetes Using Machine Learning,” Appl. Sci., 2021.
- H. Qteat and M. Awad, “Using Hybrid Model of Particle Swarm Optimization and Multi-Layer Perceptron Neural Networks for Classification of Diabetes Using Hybrid Model of Particle Swarm Optimization and Multi-Layer Perceptron Neural Networks for Classification of Diabetes,” no. June, pp. 10–22, 2021. [CrossRef]
- N. L. Fitriyani and M. Syafrudin, “Development of Disease Prediction Model Based on Ensemble Learning Approach for Diabetes and Hypertension,” Spec. Sect. DATA-ENABLED Intell. Digit. Heal. Receiv., vol. 7, 2019.
- saif abdulwahed Ameer Ali, mohammed alrubei, “DIABETES CLASSIFICATION BASED ON KNN,” IIUM Eng. Journal, vol. 21, no. 1, pp. 175–181, 2020.
- E. S. Almutairi and M. F. Abbod, “Machine Learning Methods for Diabetes Prevalence Classification in Saudi Arabia,” modelling, pp. 37–55, 2023.
- N. Alsulami, M. Almasre, S. Sarhan, and W. Alsaggaf, “Deep Learning Models for Type 2 Diabetes Detection in Saudi Arabia,” J. Pioneer. Med. Sci., vol. 13, no. 2, pp. 60–73, 2024.
- H. S. T. Khan, “Machine learning-based application for predicting risk of type 2 diabetes mellitus (t2dm) in saudi arabia: A retrospective cross-sectional study,” IEEE Access, vol. 8, 2020.
- T. R. Mahesh et al., “Blended Ensemble Learning Prediction Model for Strengthening Diagnosis and Treatment of Chronic Diabetes Disease,” Comput. Intell. Neurosci., vol. 2022, 2022. [CrossRef]
- R. Krishnamoorthi et al., “A Novel Diabetes Healthcare Disease Prediction Framework Using Machine Learning Techniques,” J. Healthc. Eng., vol. 2022, 2022. [CrossRef]
- R. Patil and S. Tamane, “A Comparative Analysis on the Evaluation of Classification Algorithms in the Prediction of Diabetes,” IJECE, vol. 8, no. 5, pp. 3966–3975, 2018. [CrossRef]
- Q. Wang, W. Cao, J. Guo, J. Ren, Y. Cheng, and D. N. Davis, “DMP _ MI : An Effective Diabetes Mellitus Classification Algorithm on Imbalanced Data With Missing Values,” vol. 7, 2019.
- N. N. R. Delshi Howsalya Devi, Anita Bai, “A novel hybrid approach for diagnosing diabetes mellitus using farthest first and support vector machine algorithms,” Obes. Med., vol. 17, 2020.
- Paramjot Kaur & Ramanpreet Kaur, “Comparative Analysis of Classification Techniques for Diagnosis of Diabetes,” 2020.
- R. D. Joshi and C. K. Dhakal, “Predicting Type 2 Diabetes Using Logistic Regression and Machine Learning Approaches,” Int. J. Environ. Res. Public Heal. Artic., 2021.
- S Sivaranjani; S Ananya; J Aravinth; R Karthika, “Diabetes Prediction using Machine Learning Algorithms with Feature Selection and Dimensionality Reduction,” 2021.
- Nour Abdulhadi; Amjed Al-Mousa, “Diabetes Detection Using Machine Learning Classification Methods,” 2021.
- S. Kumari, D. Kumar, and M. Mittal, “International Journal of Cognitive Computing in Engineering An ensemble approach for classification and prediction of diabetes mellitus using soft voting classifier,” Int. J. Cogn. Comput. Eng., vol. 2, no. November 2020, pp. 40–46, 2021. [CrossRef]
- S. K. Kalagotla, S. V Gangashetty, and K. Giridhar, “A novel stacking technique for prediction of diabetes,” Comput. Biol. Med., vol. 135, no. February, p. 104554, 2021. [CrossRef]
- M. M. Bukhari, B. F. Alkhamees, S. Hussain, A. Gumaei, A. Assiri, and S. S. Ullah, “An Improved Artificial Neural Network Model for Effective Diabetes Prediction,” Complexity, vol. 2021, 2021. [CrossRef]
- M. S. Al Reshan et al., “An Innovative Ensemble Deep Learning Clinical Decision Support System for Diabetes Prediction,” IEEE Access, vol. 12, no. May, pp. 106193–106210, 2024. [CrossRef]
- “Type 2 Diabetes Dataset | IEEE DataPort.”. Available online: https://ieee-dataport.org/documents/type-2-diabetes-dataset (accessed on 14 February 2025).
- V. Dambra, M. Roccotelli, and M. P. Fanti, “Diabetic Disease Detection using Machine Learning Techniques,” 10th 2024 Int. Conf. Control. Decis. Inf. Technol. CoDIT 2024, pp. 1436–1441, 2024. [CrossRef]
- D. Shrestha, “Comparative Analysis of Machine Learning Algorithms for Heart Disease Prediction,” Adv. Transdiscipl. Eng., vol. 27, pp. 64–69, 2022. [CrossRef]
- K. M. Alfadli and A. O. Almagrabi, “Feature-Limited Prediction on the UCI Heart Disease Dataset,” Comput. Mater. Contin., vol. 74, no. 3, pp. 5871–5883, 2023. [CrossRef]
- Anderies, J. A. R. W. Tchin, P. H. Putro, Y. P. Darmawan, and A. A. S. Gunawan, “Prediction of Heart Disease UCI Dataset Using Machine Learning Algorithms,” Eng. Math. Comput. Sci. J., vol. 4, no. 3, pp. 87–93, 2022. [CrossRef]
- R. Bharti, A. Khamparia, M. Shabaz, G. Dhiman, S. Pande, and P. Singh, “Prediction of Heart Disease Using a Combination of Machine Learning and Deep Learning,” Comput. Intell. Neurosci., vol. 2021, 2021. [CrossRef]
- D. Asif, M. Bibi, and M. S. Arif, “Enhancing Heart Disease Prediction through Ensemble Learning Techniques with Hyperparameter Optimization,” Algorithms, pp. 1–17, 2023.
- Z. Noroozi, A. Orooji, and L. Erfannia, “Analyzing the impact of feature selection methods on machine learning algorithms for heart disease prediction,” Nature Publishing Group UK, 2023. [CrossRef]
- N. C. and S. Peddakrishna, “Enhancing Heart Disease Prediction Accuracy through Machine Learning Techniques and Optimization,” processes, vol. 11, no. 1210, 2023.
- E. Korial, I. I. Gorial, and A. J. Humaidi, “An Improved Ensemble-Based Cardiovascular Disease Detection System with Chi-Square Feature Selection,” Computers, vol. 13, no. 6, pp. 1–17, 2024. [CrossRef]
- “pandas 2.2.3,” NumFOCUS. Available online: https://pandas.pydata.org/.
- R. Harris et al., “Array programming with NumPy,” Nature, vol. 585, no. 7825, pp. 357–362, 2020. [CrossRef]
- T. F. Pedregosa, G. Varoquaux, A. Gramfort, V. Michel, “Scikit-learn: Machine learning in python,” J. ofMachine Learn. Res., vol. 12, no. 9, pp. 2825–2830, 2011. [CrossRef]
- J. D. Hunter, “Matplotlib: A 2D graphics environment,” Comput. Sci. Eng., vol. 9, no. 3, pp. 90–95, 2007.
- “Pima Indians Diabetes Database,” National Institute of Diabetes and Digestive and Kidney Diseases, 2024. Available online: https://www.kaggle.com/datasets/uciml/pima-indians-diabetes-database.
- “UCI Heart Disease Dataset.”. Available online: https://archive.ics.uci.edu/dataset/45/heart+disease.
- F. Amiri, M. Rezaei Yousefi, C. Lucas, A. Shakery, and N. Yazdani, “Mutual information-based feature selection for intrusion detection systems,” J. Netw. Comput. Appl., vol. 34, no. 4, pp. 1184–1199, 2011. [CrossRef]
- Y. Cai, Z. Ding, B. Yang, Z. Peng, and W. Wang, “Zero-Shot Learning Through Cross-Modal Transfer Richard,” Phys. A Stat. Mech. its Appl., vol. 514, pp. 729–740, 2015.
- Y. Wang, Q. Yao, J. T. Kwok, and L. M. Ni, “Generalizing from a Few Examples: A Survey on Few-shot Learning,” ACM Comput. Surv., vol. 53, no. 3, pp. 1–34, 2020. [CrossRef]
- T. Kojima, S. S. Gu, M. Reid, Y. Matsuo, and Y. Iwasawa, “Large Language Models are Zero-Shot Reasoners,” Adv. Neural Inf. Process. Syst., vol. 35, no. NeurIPS, 2022.
- J. Wei et al., “Chain-of-Thought Prompting Elicits Reasoning in Large Language Models,” Adv. Neural Inf. Process. Syst., vol. 35, no. NeurIPS, pp. 1–43, 2022.
- Ferrara, “Should ChatGPT be biased? Challenges and risks of bias in large language models,” First Monday, vol. 28, no. 11, 2023. [CrossRef]
- N. Micheletti, R. Marchesi, N. I.-H. Kuo, S. Barbieri, G. Jurman, and V. Osmani, “Generative AI Mitigates Representation Bias Using Synthetic Health Data,” medRxiv, p. 2023.09.26.23296163, 2024, [Online]. Available online: http://medrxiv.org/content/early/2024/02/01/2023.09.26.23296163.abstract.
- G. Peikos, S. Symeonidis, P. Kasela, and G. Pasi, “Utilizing ChatGPT to Enhance Clinical Trial Enrollment,” 2023, [Online]. Available online: http://arxiv.org/abs/2306.02077.
- Kartchner, I. Al-Hussaini, O. Kronick, S. Ramalingam, and C. Mitchell, “Zero-Shot Information Extraction for Clinical Meta-Analysis using Large Language Models,” in The 22nd Workshop on Biomedical Natural Language Processing and BioNLP Shared Tasks , 2023, pp. 396–405.
- M. Nishio et al., “Zero-shot classification of TNM staging for Japanese radiology report using ChatGPT at RR-TNM subtask of NTCIR-17 MedNLP-SC,” 2023. [CrossRef]
Figure 1.
Proposed Workflow for utilizing ChatGPT in Disease Prediction.
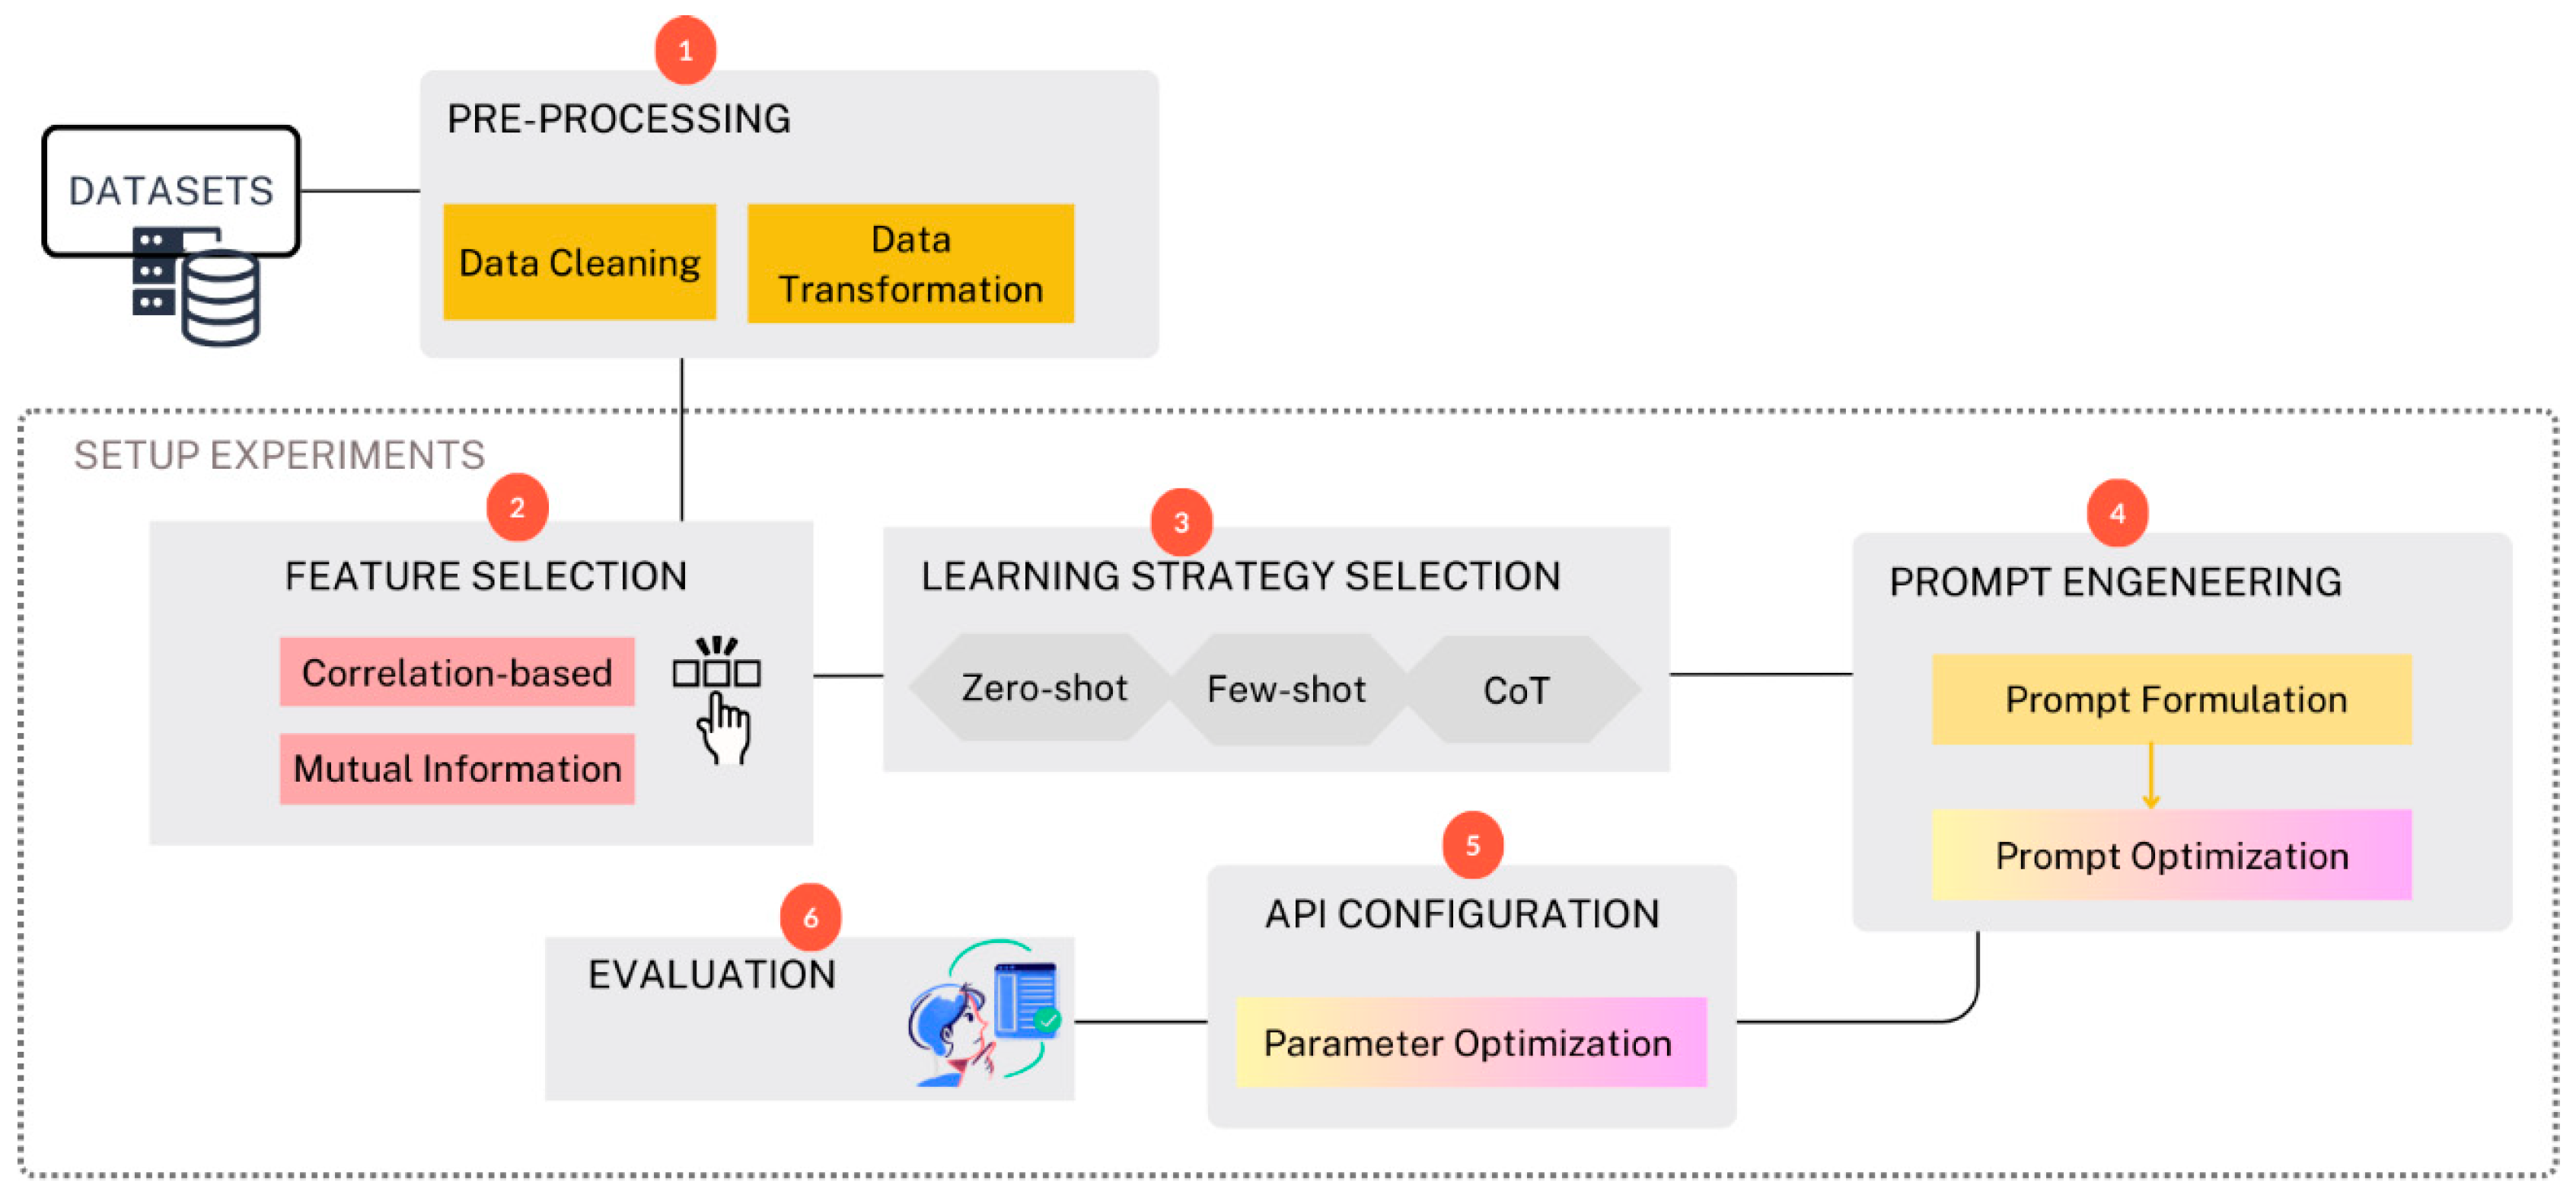
Figure 2.
Distribution of patients across categories in the UCI Cleveland dataset.
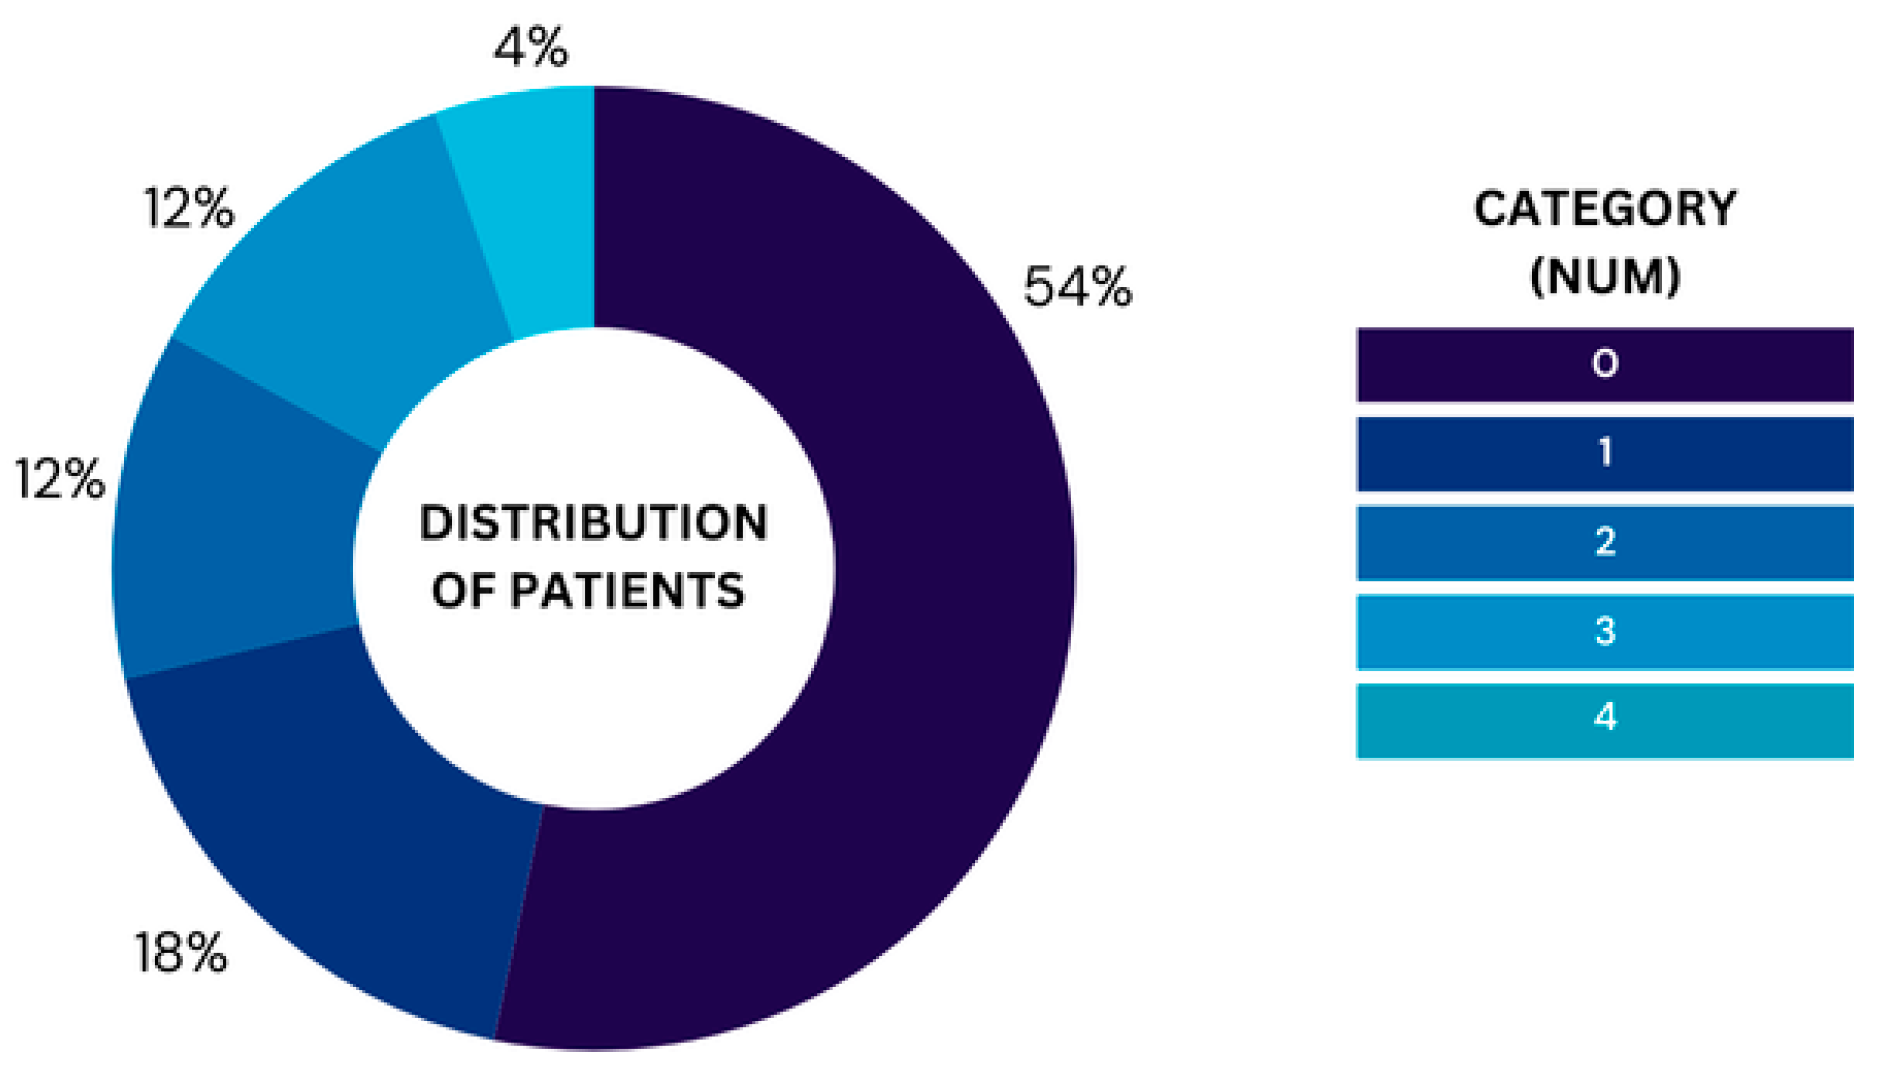
Figure 3.
Correlation between features in the PIDD dataset.
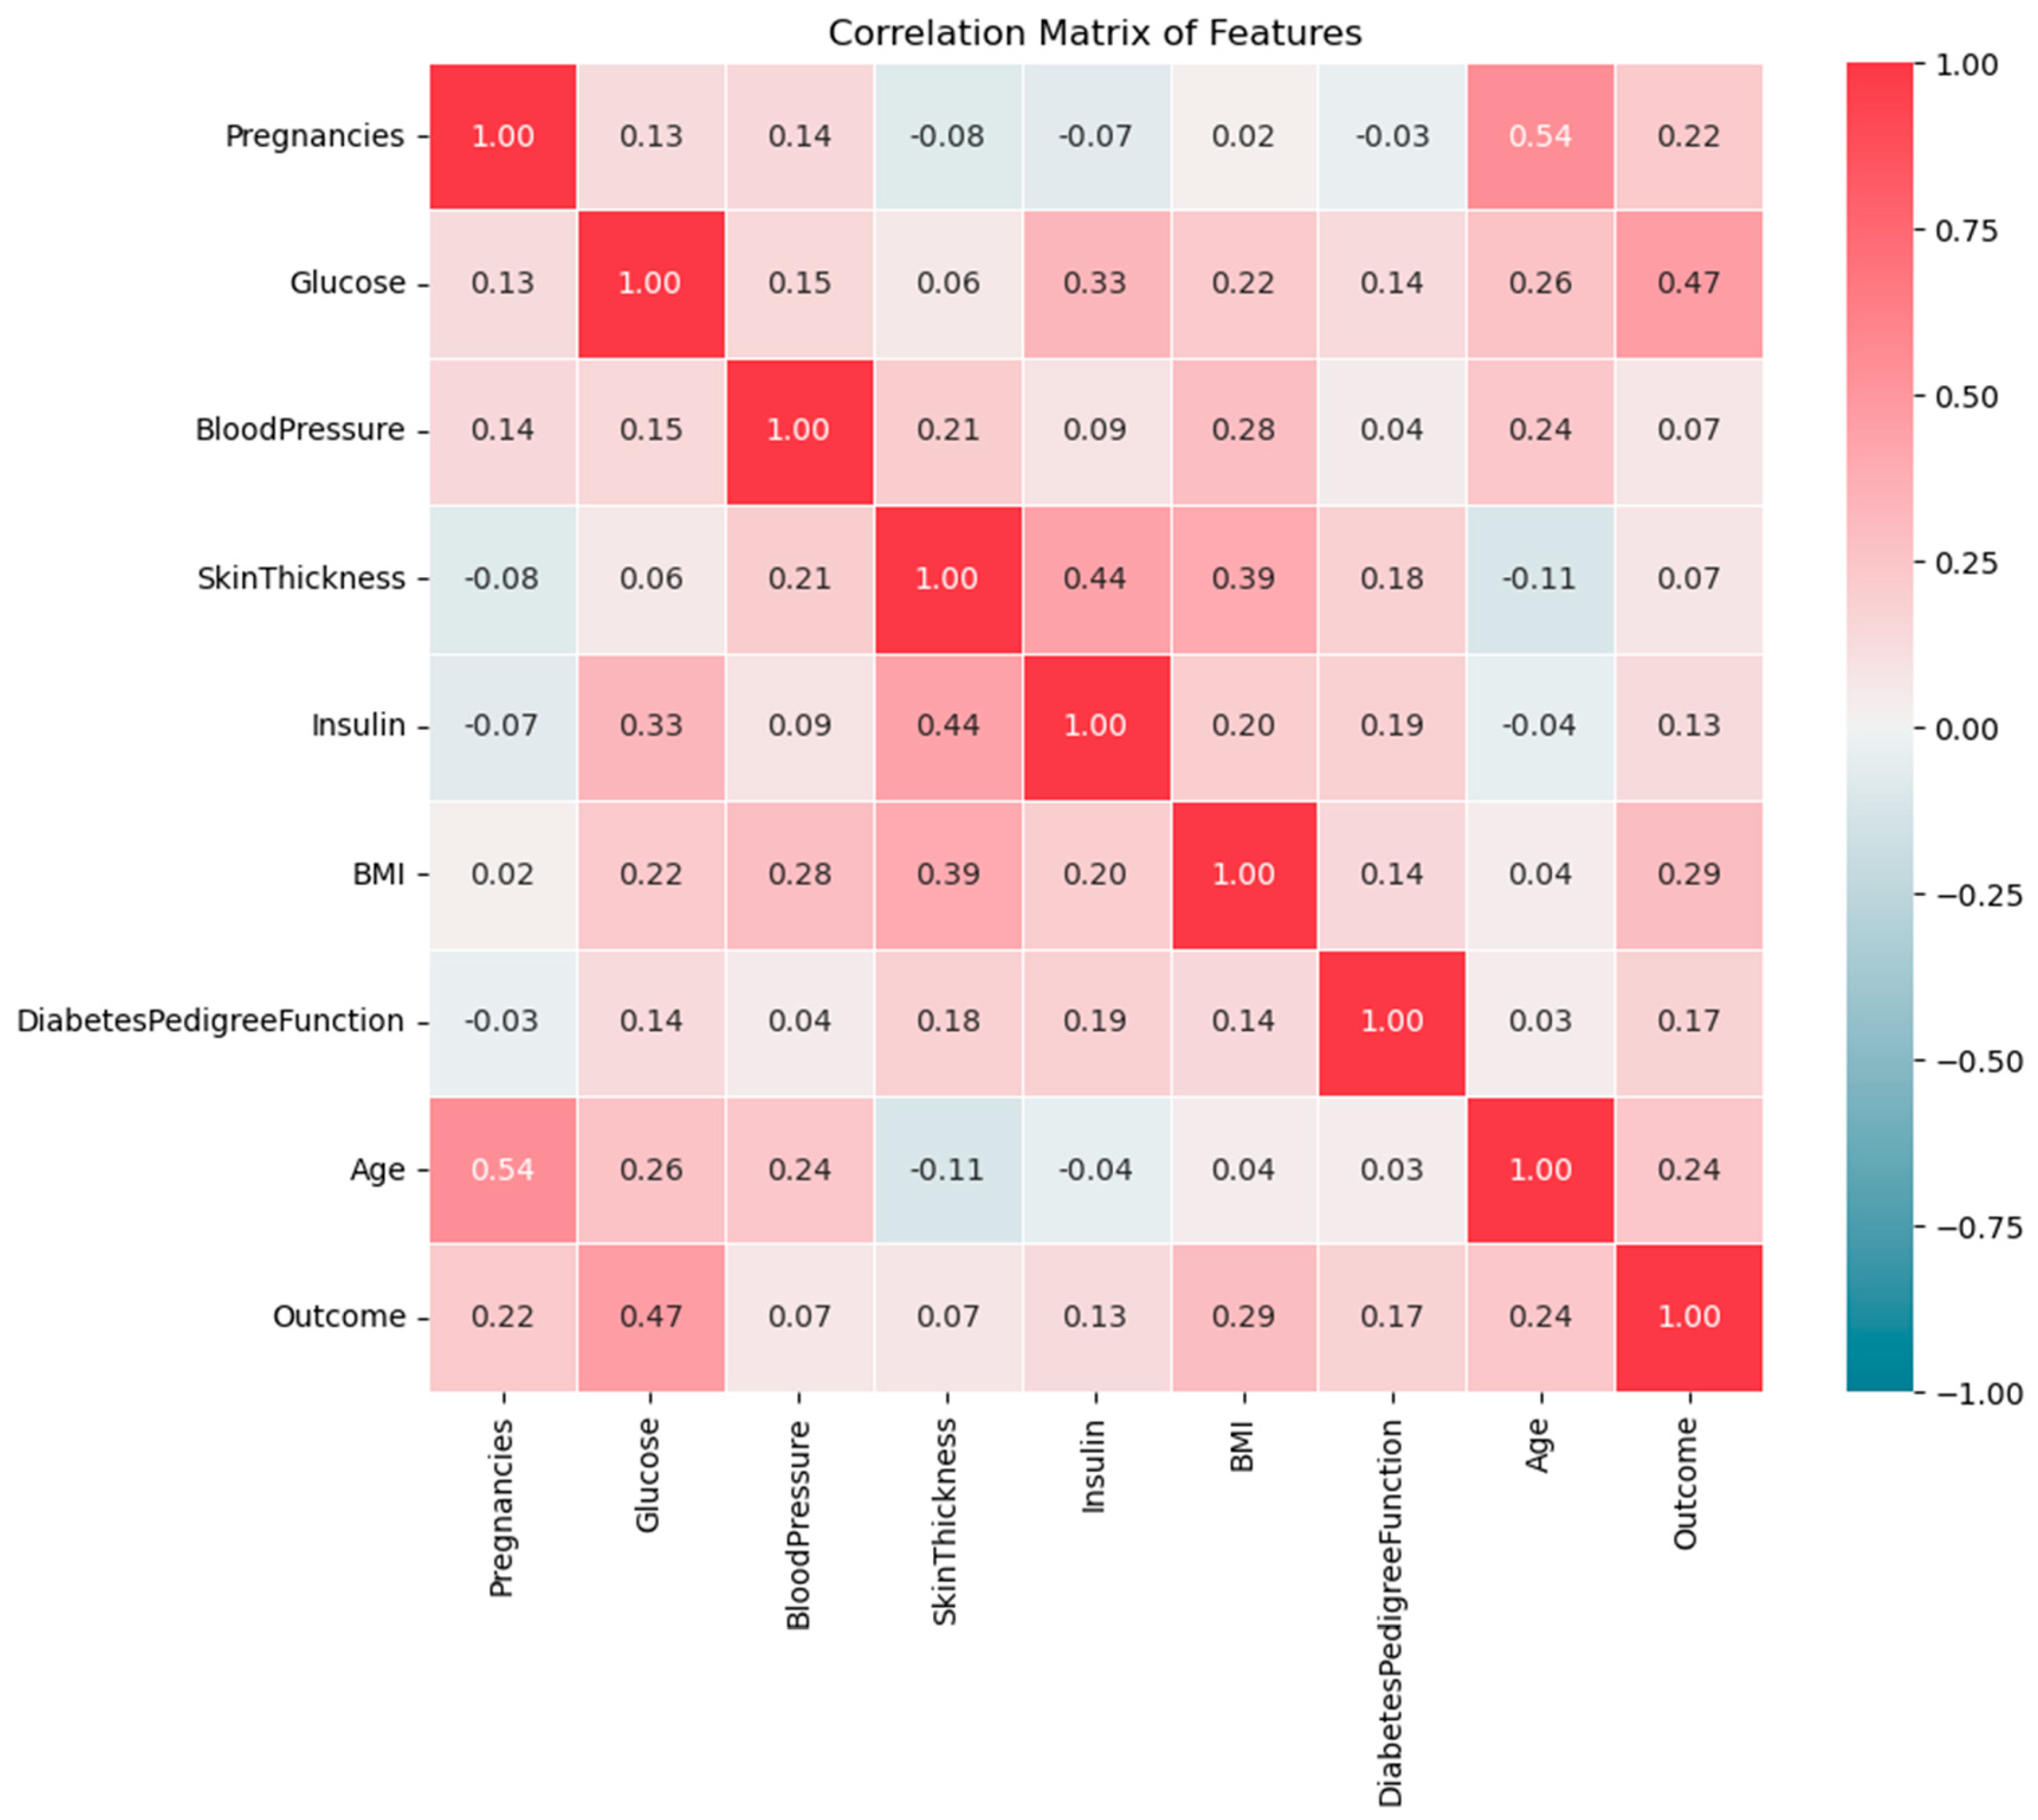
Figure 4.
Relationship between ‘outcome’ and other features in the PIDD dataset.
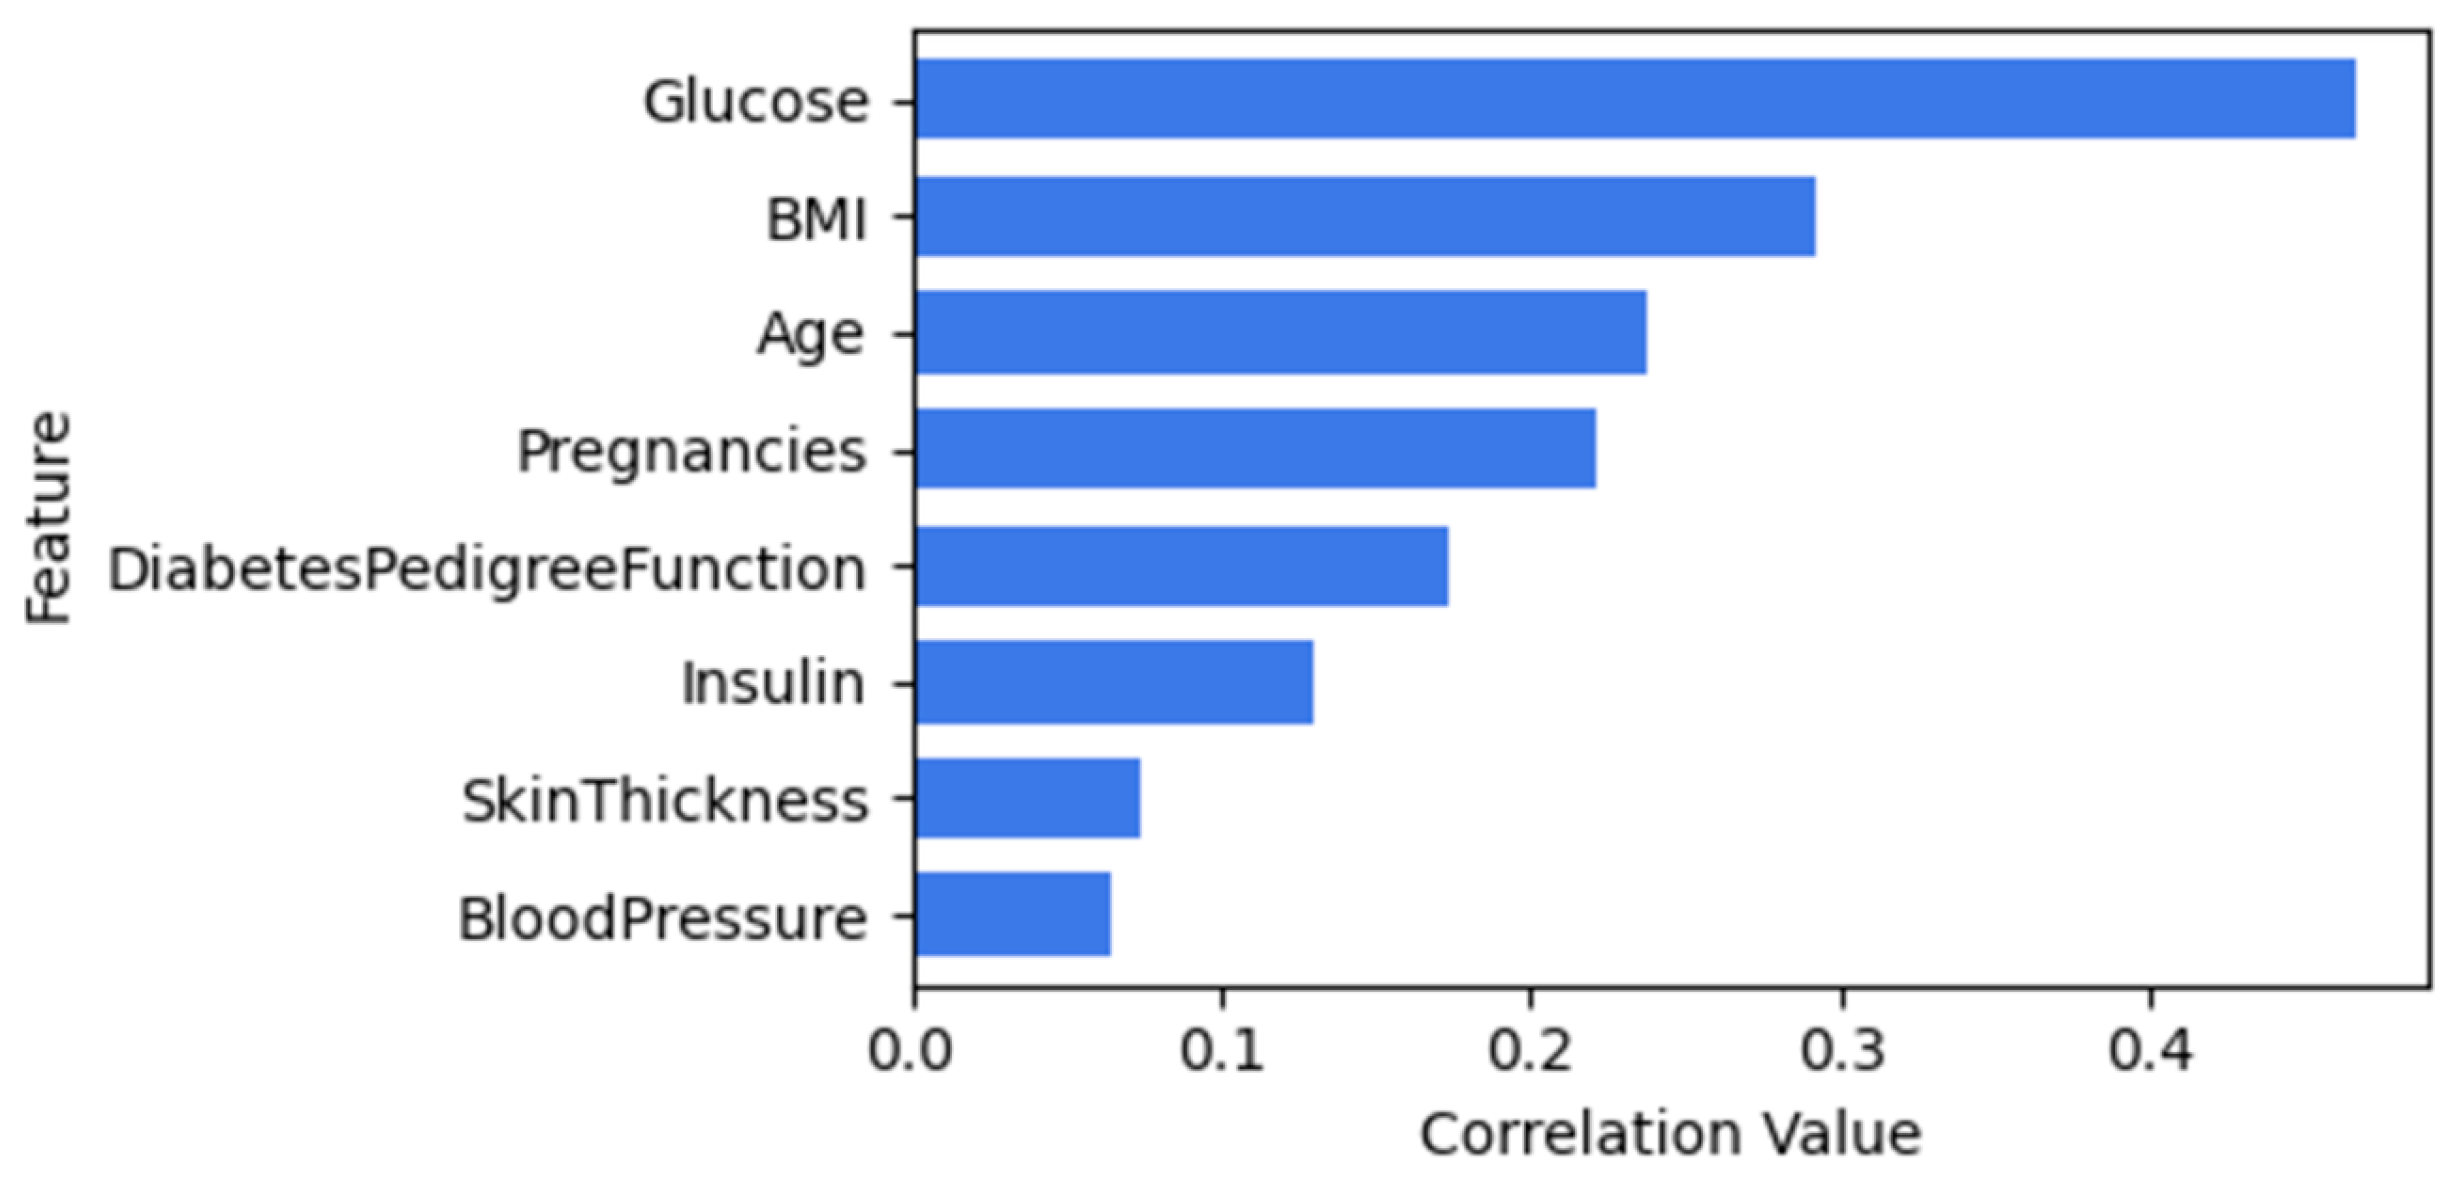
Figure 5.
Mutual information scores for PIDD disease.
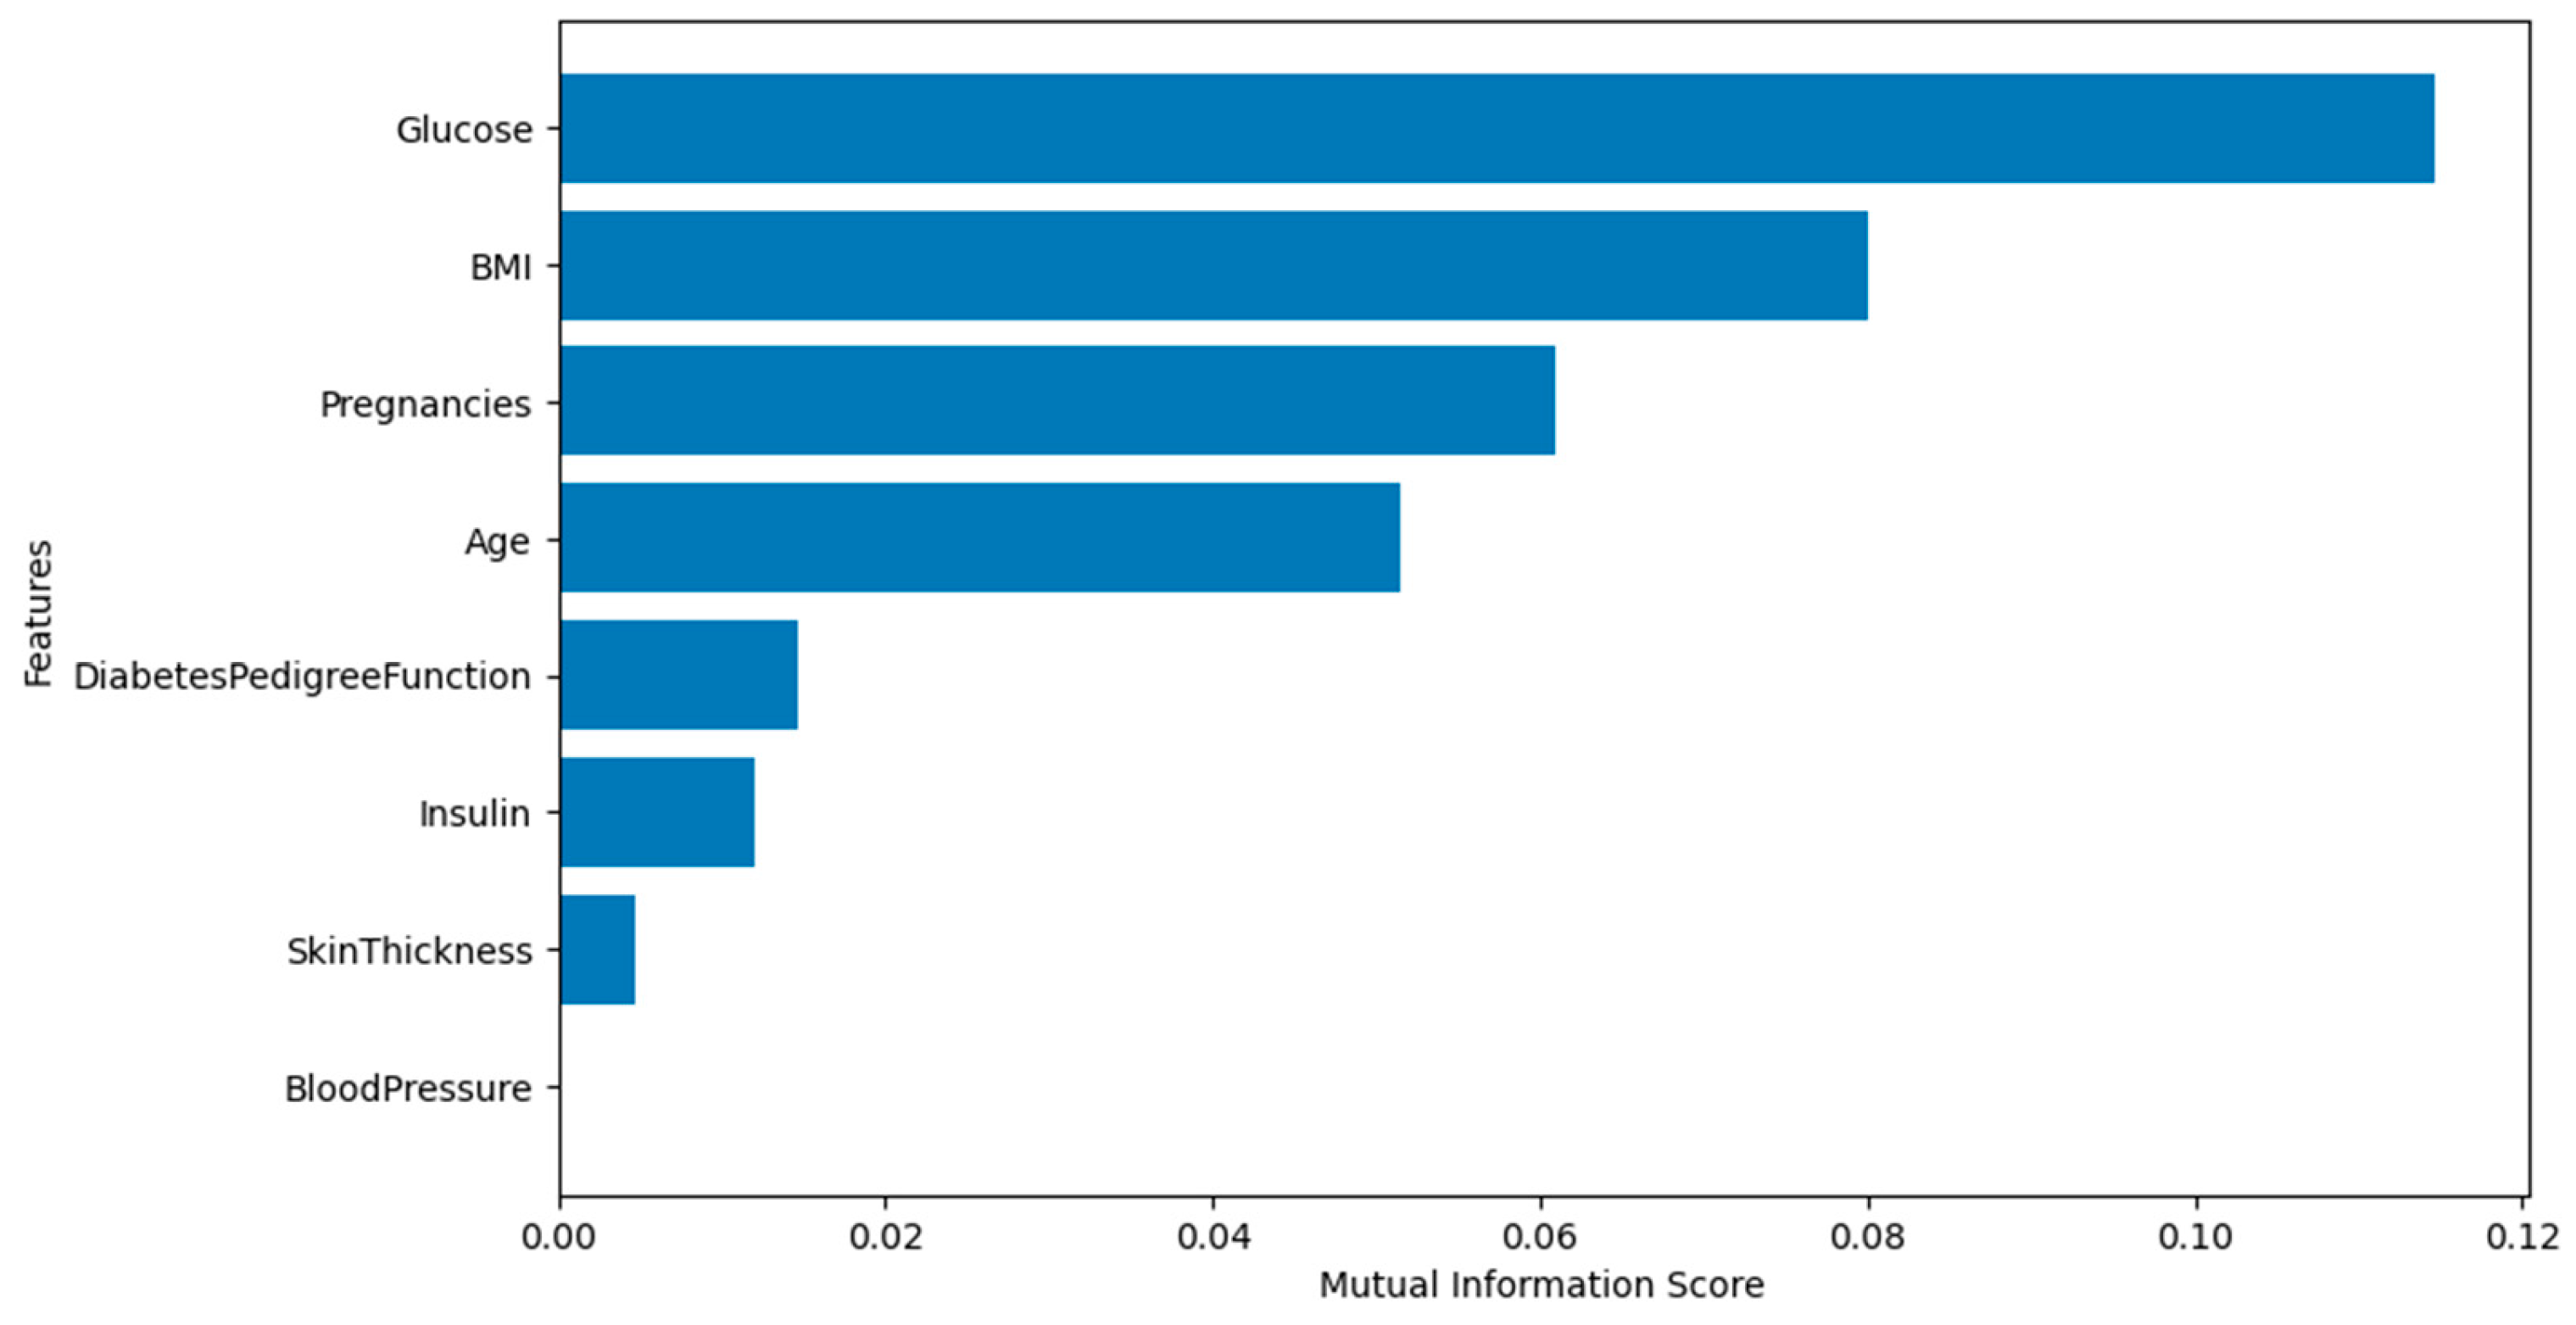
Figure 6.
Correlation between features in the FHDD.
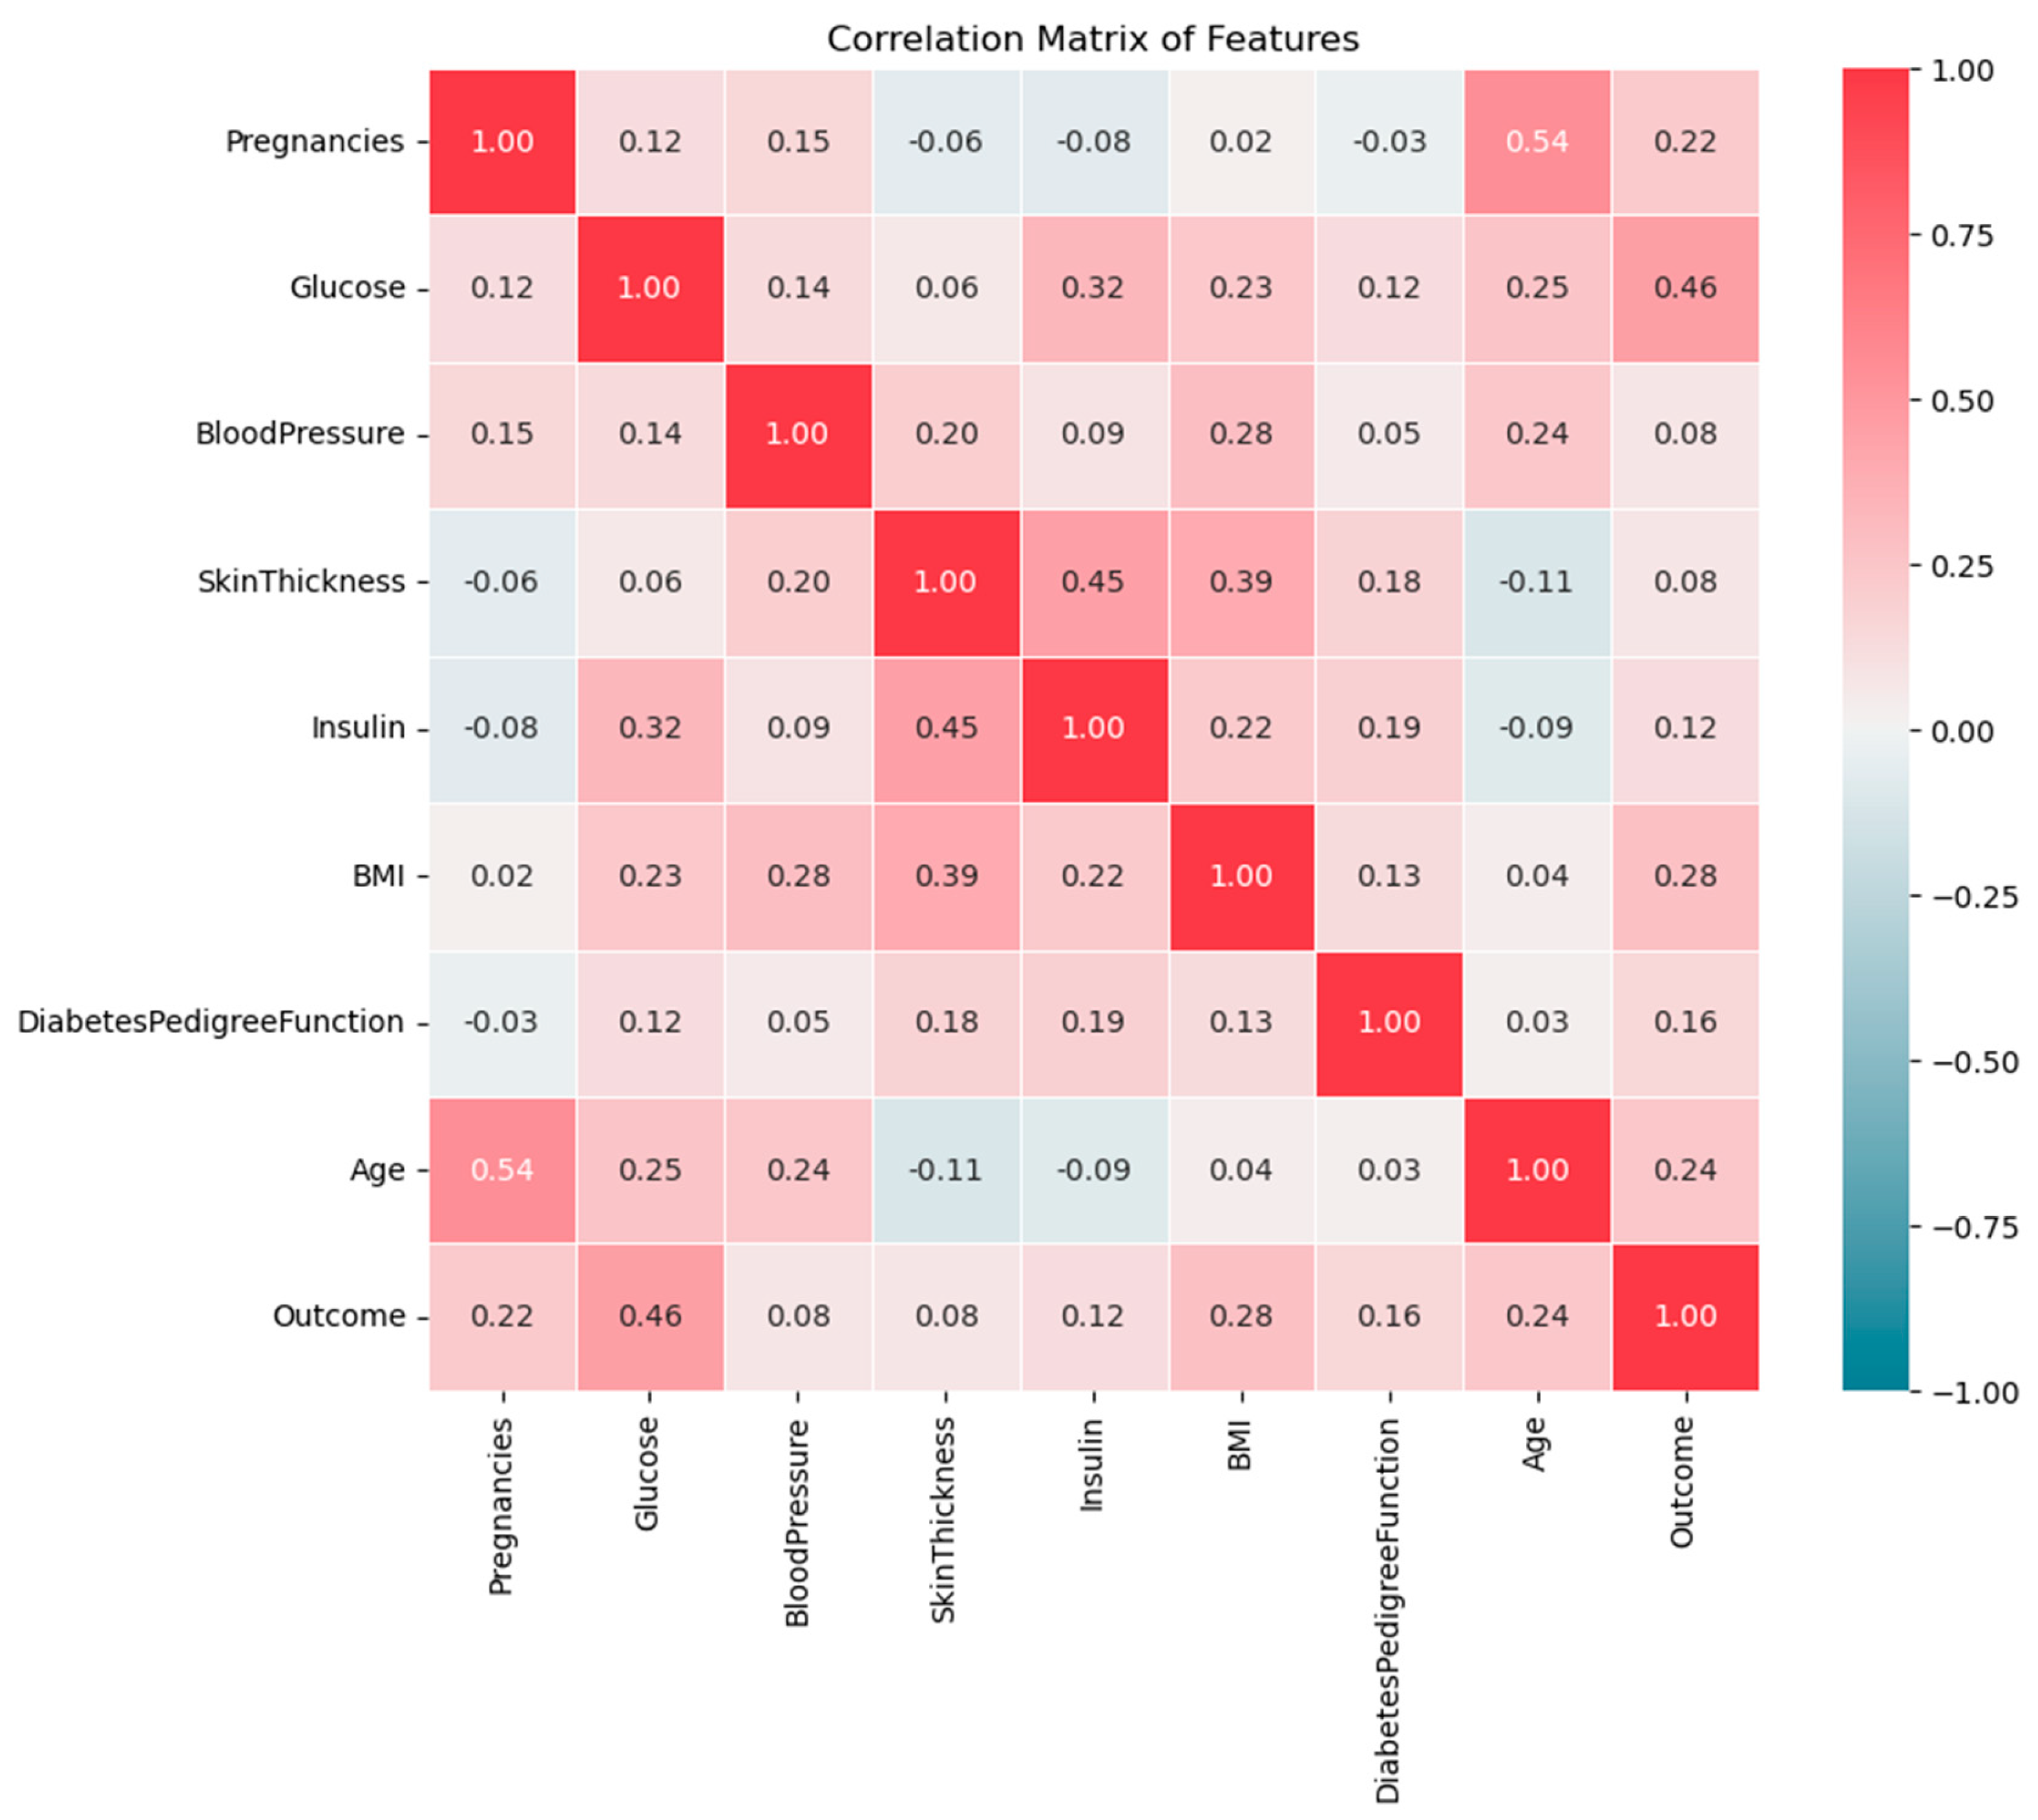
Figure 7.
Relationship between ‘outcome’ and other features in the FHDD.
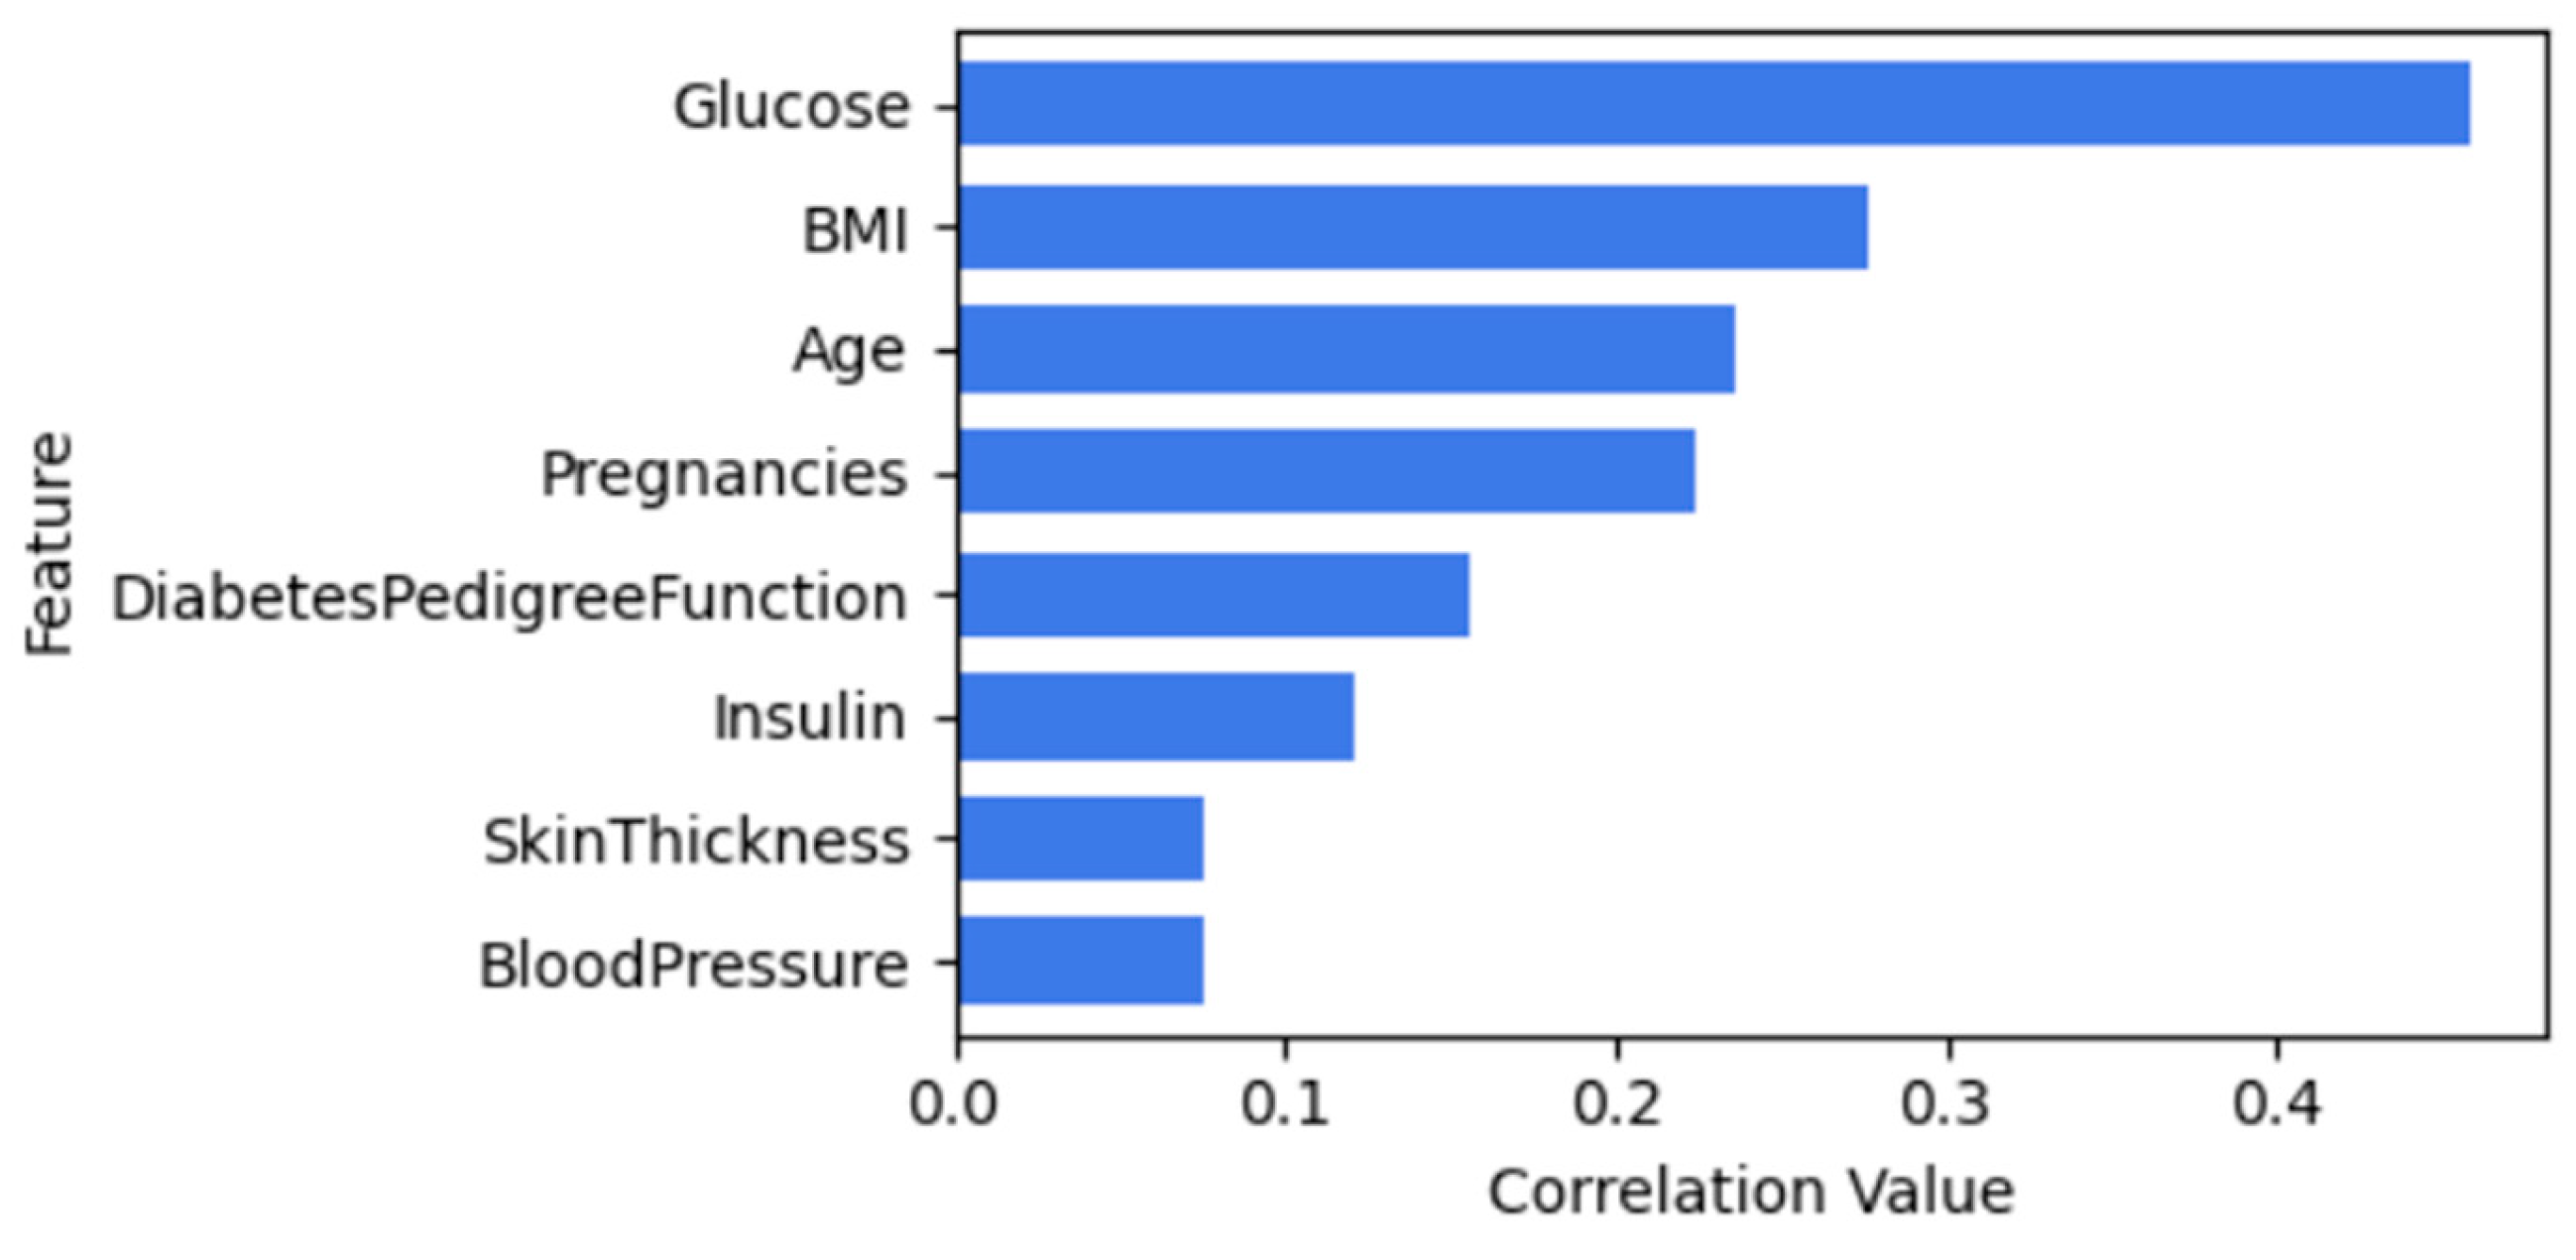
Figure 8.
Mutual information scores for FHDD.
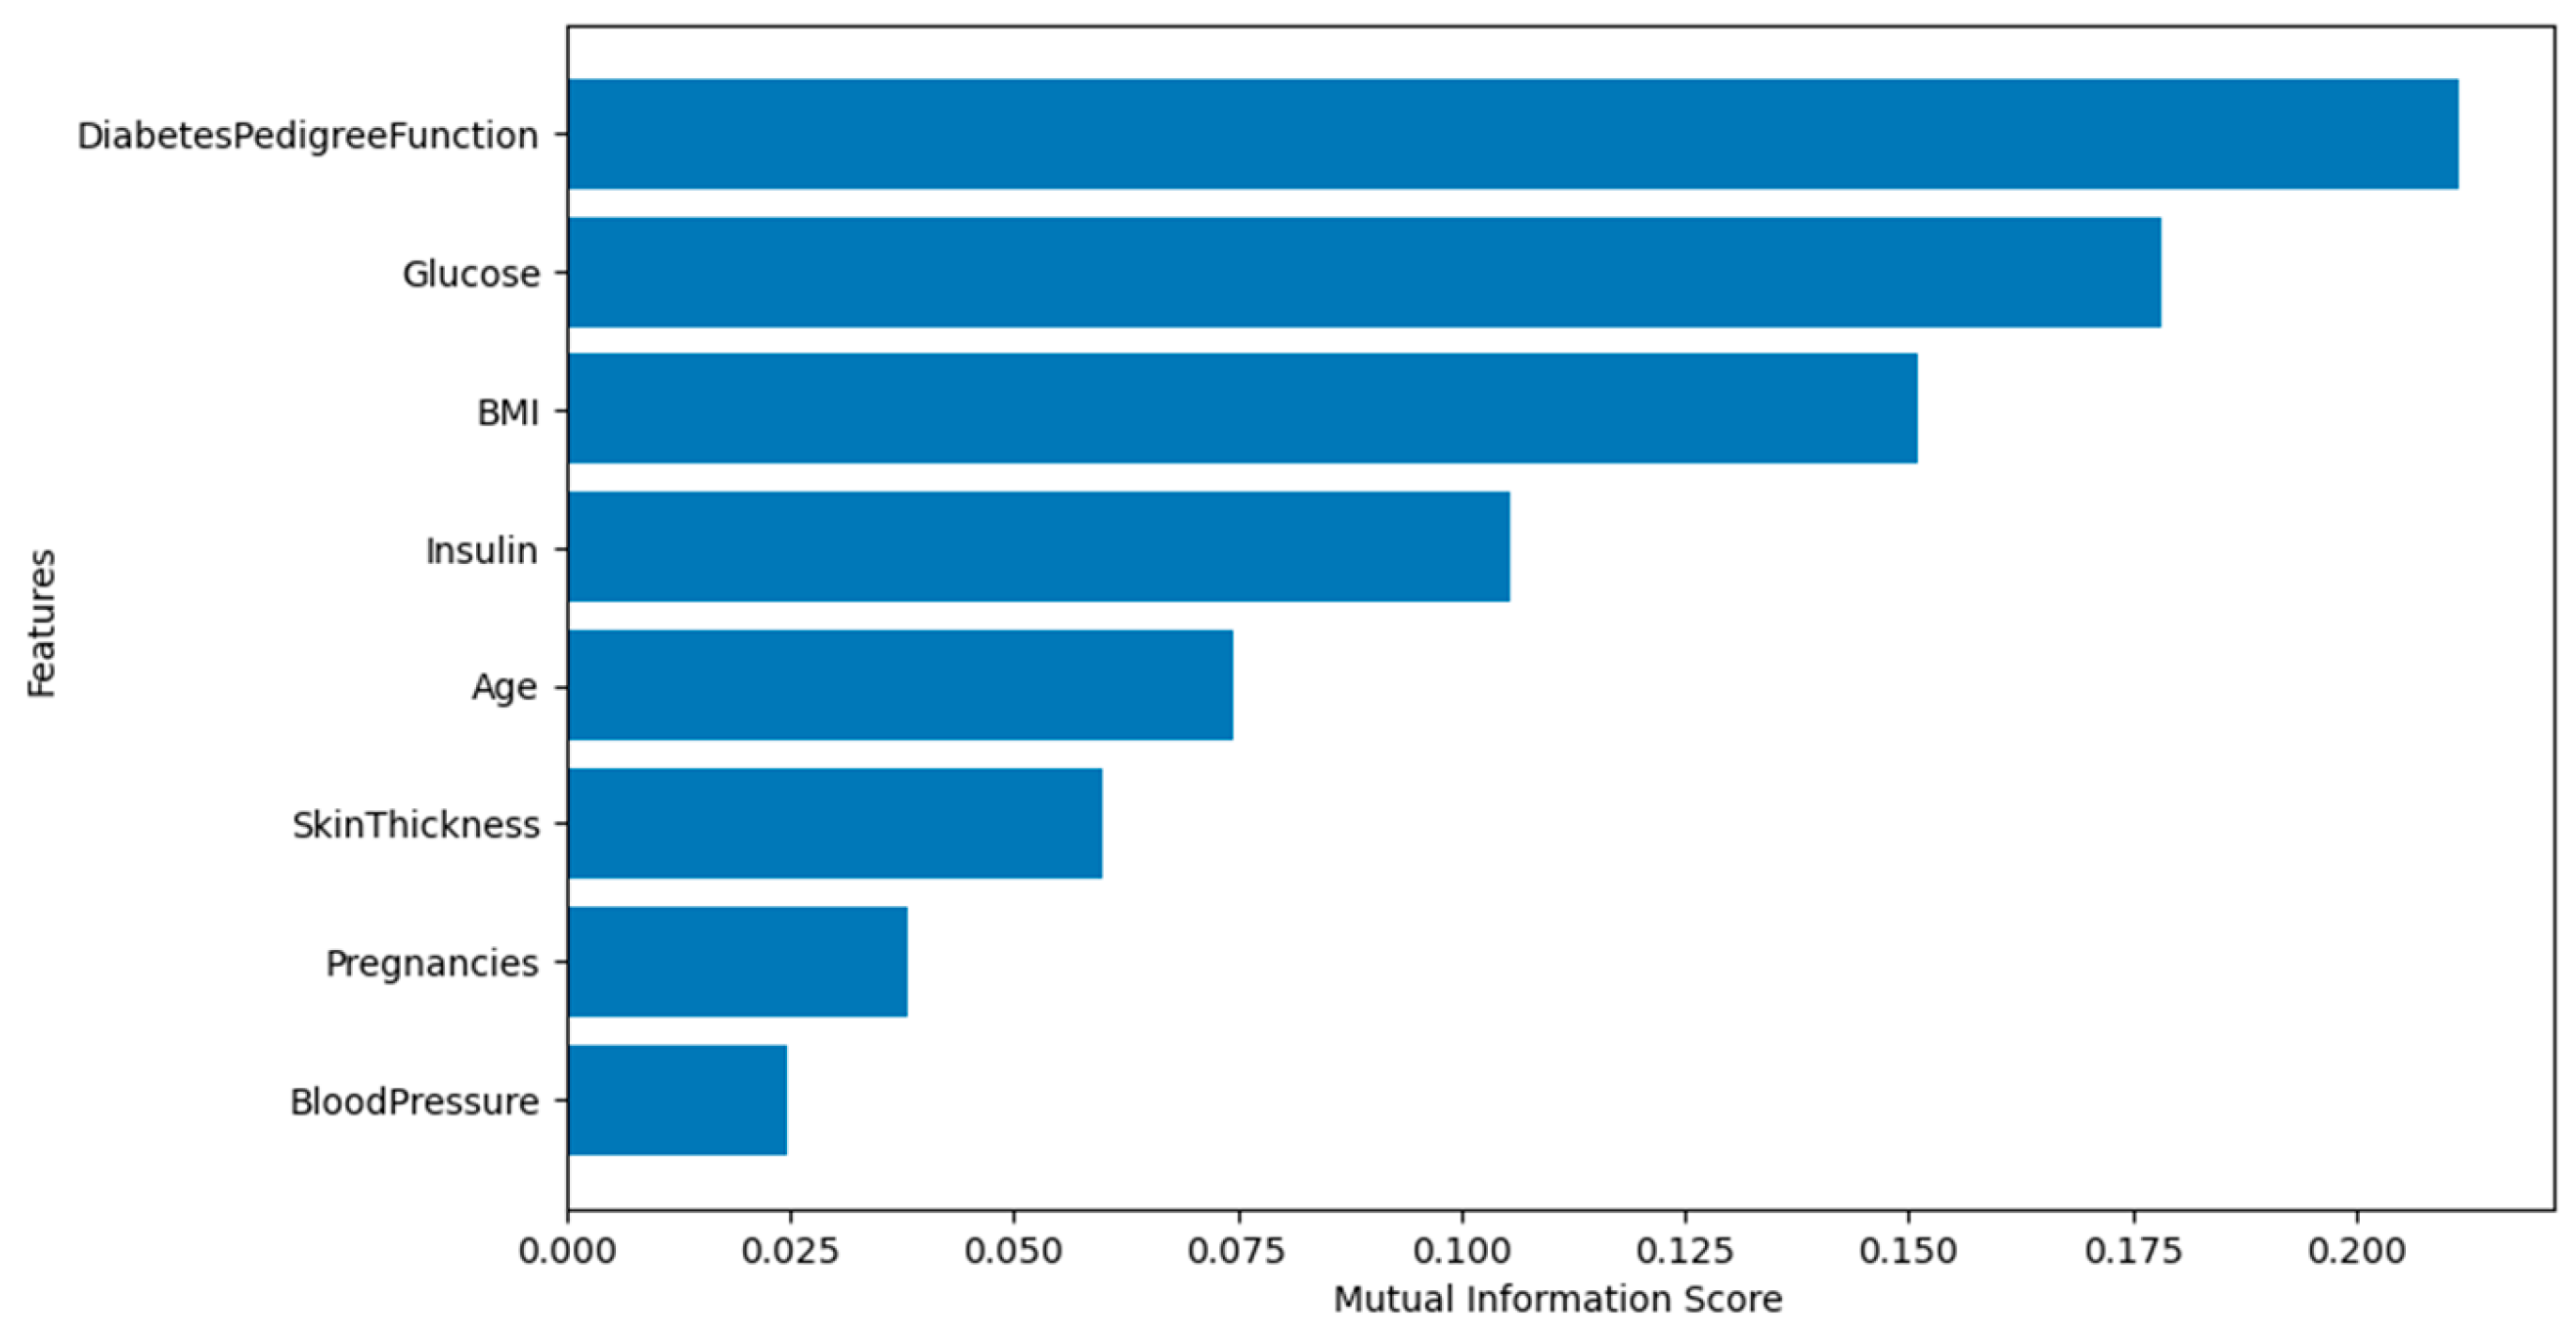
Figure 9.
Correlation between features in the UCI Cleveland dataset.
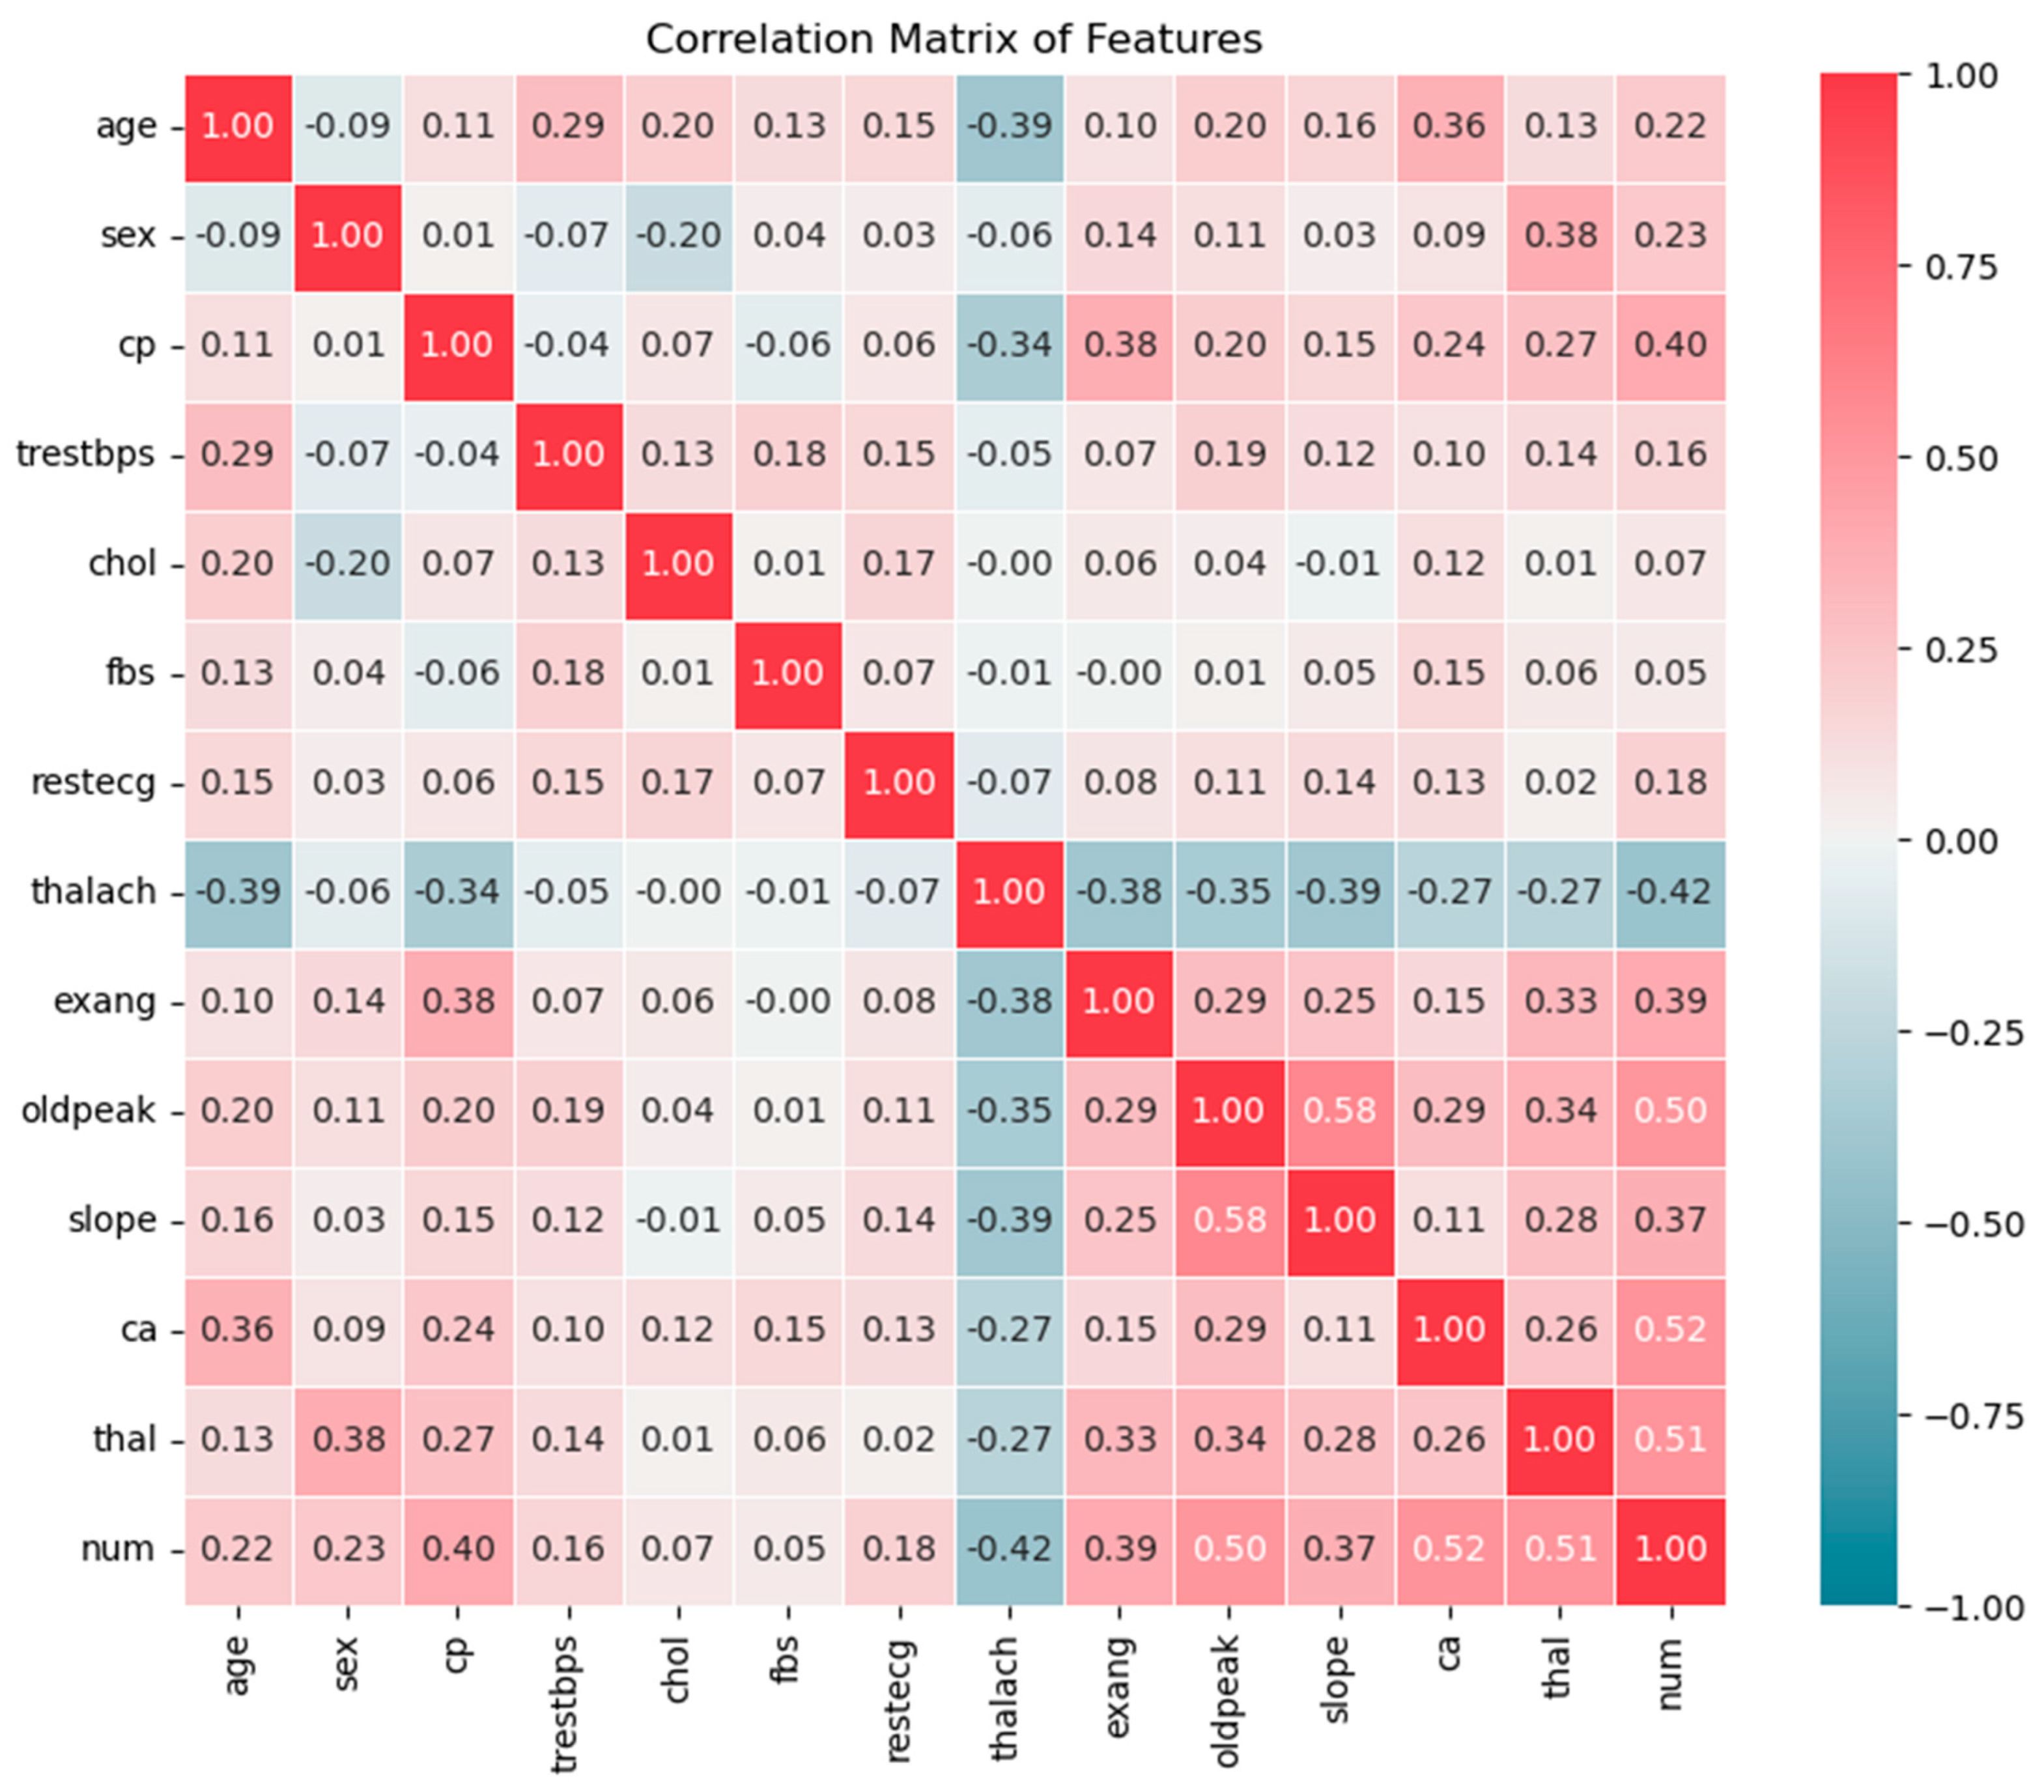
Figure 10.
Correlation-based feature selection- Relationship between ‘num and other features in UCI heart disease.
Figure 10.
Correlation-based feature selection- Relationship between ‘num and other features in UCI heart disease.
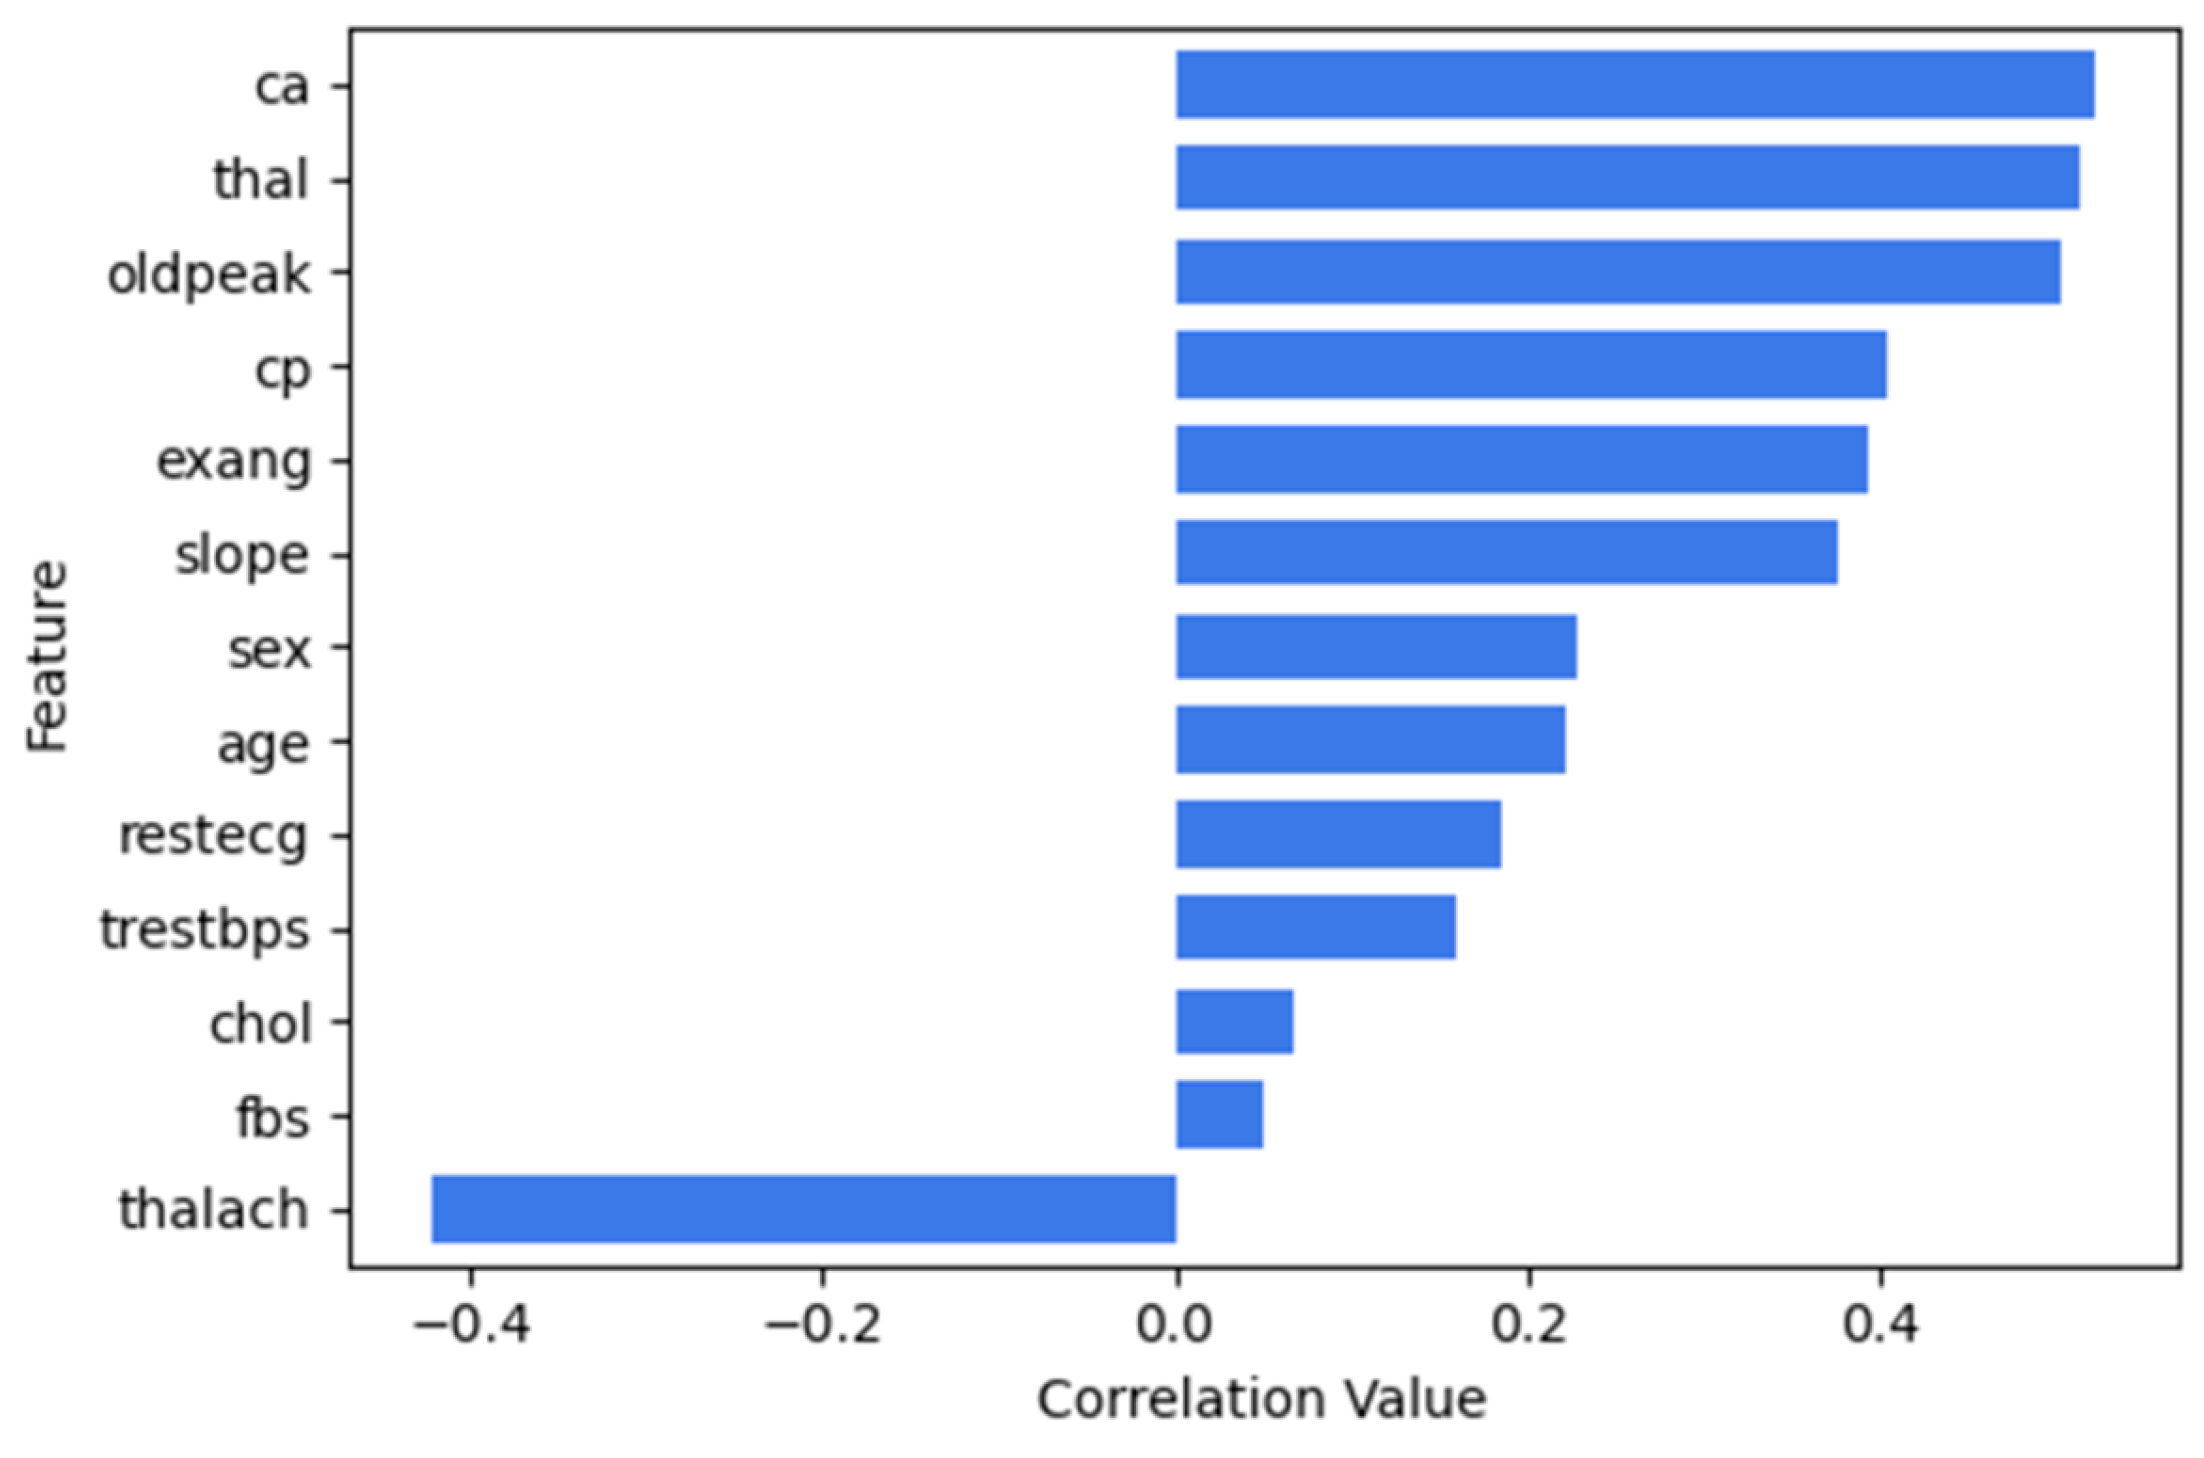
Figure 11.
Mutual information scores for UCI heart disease.
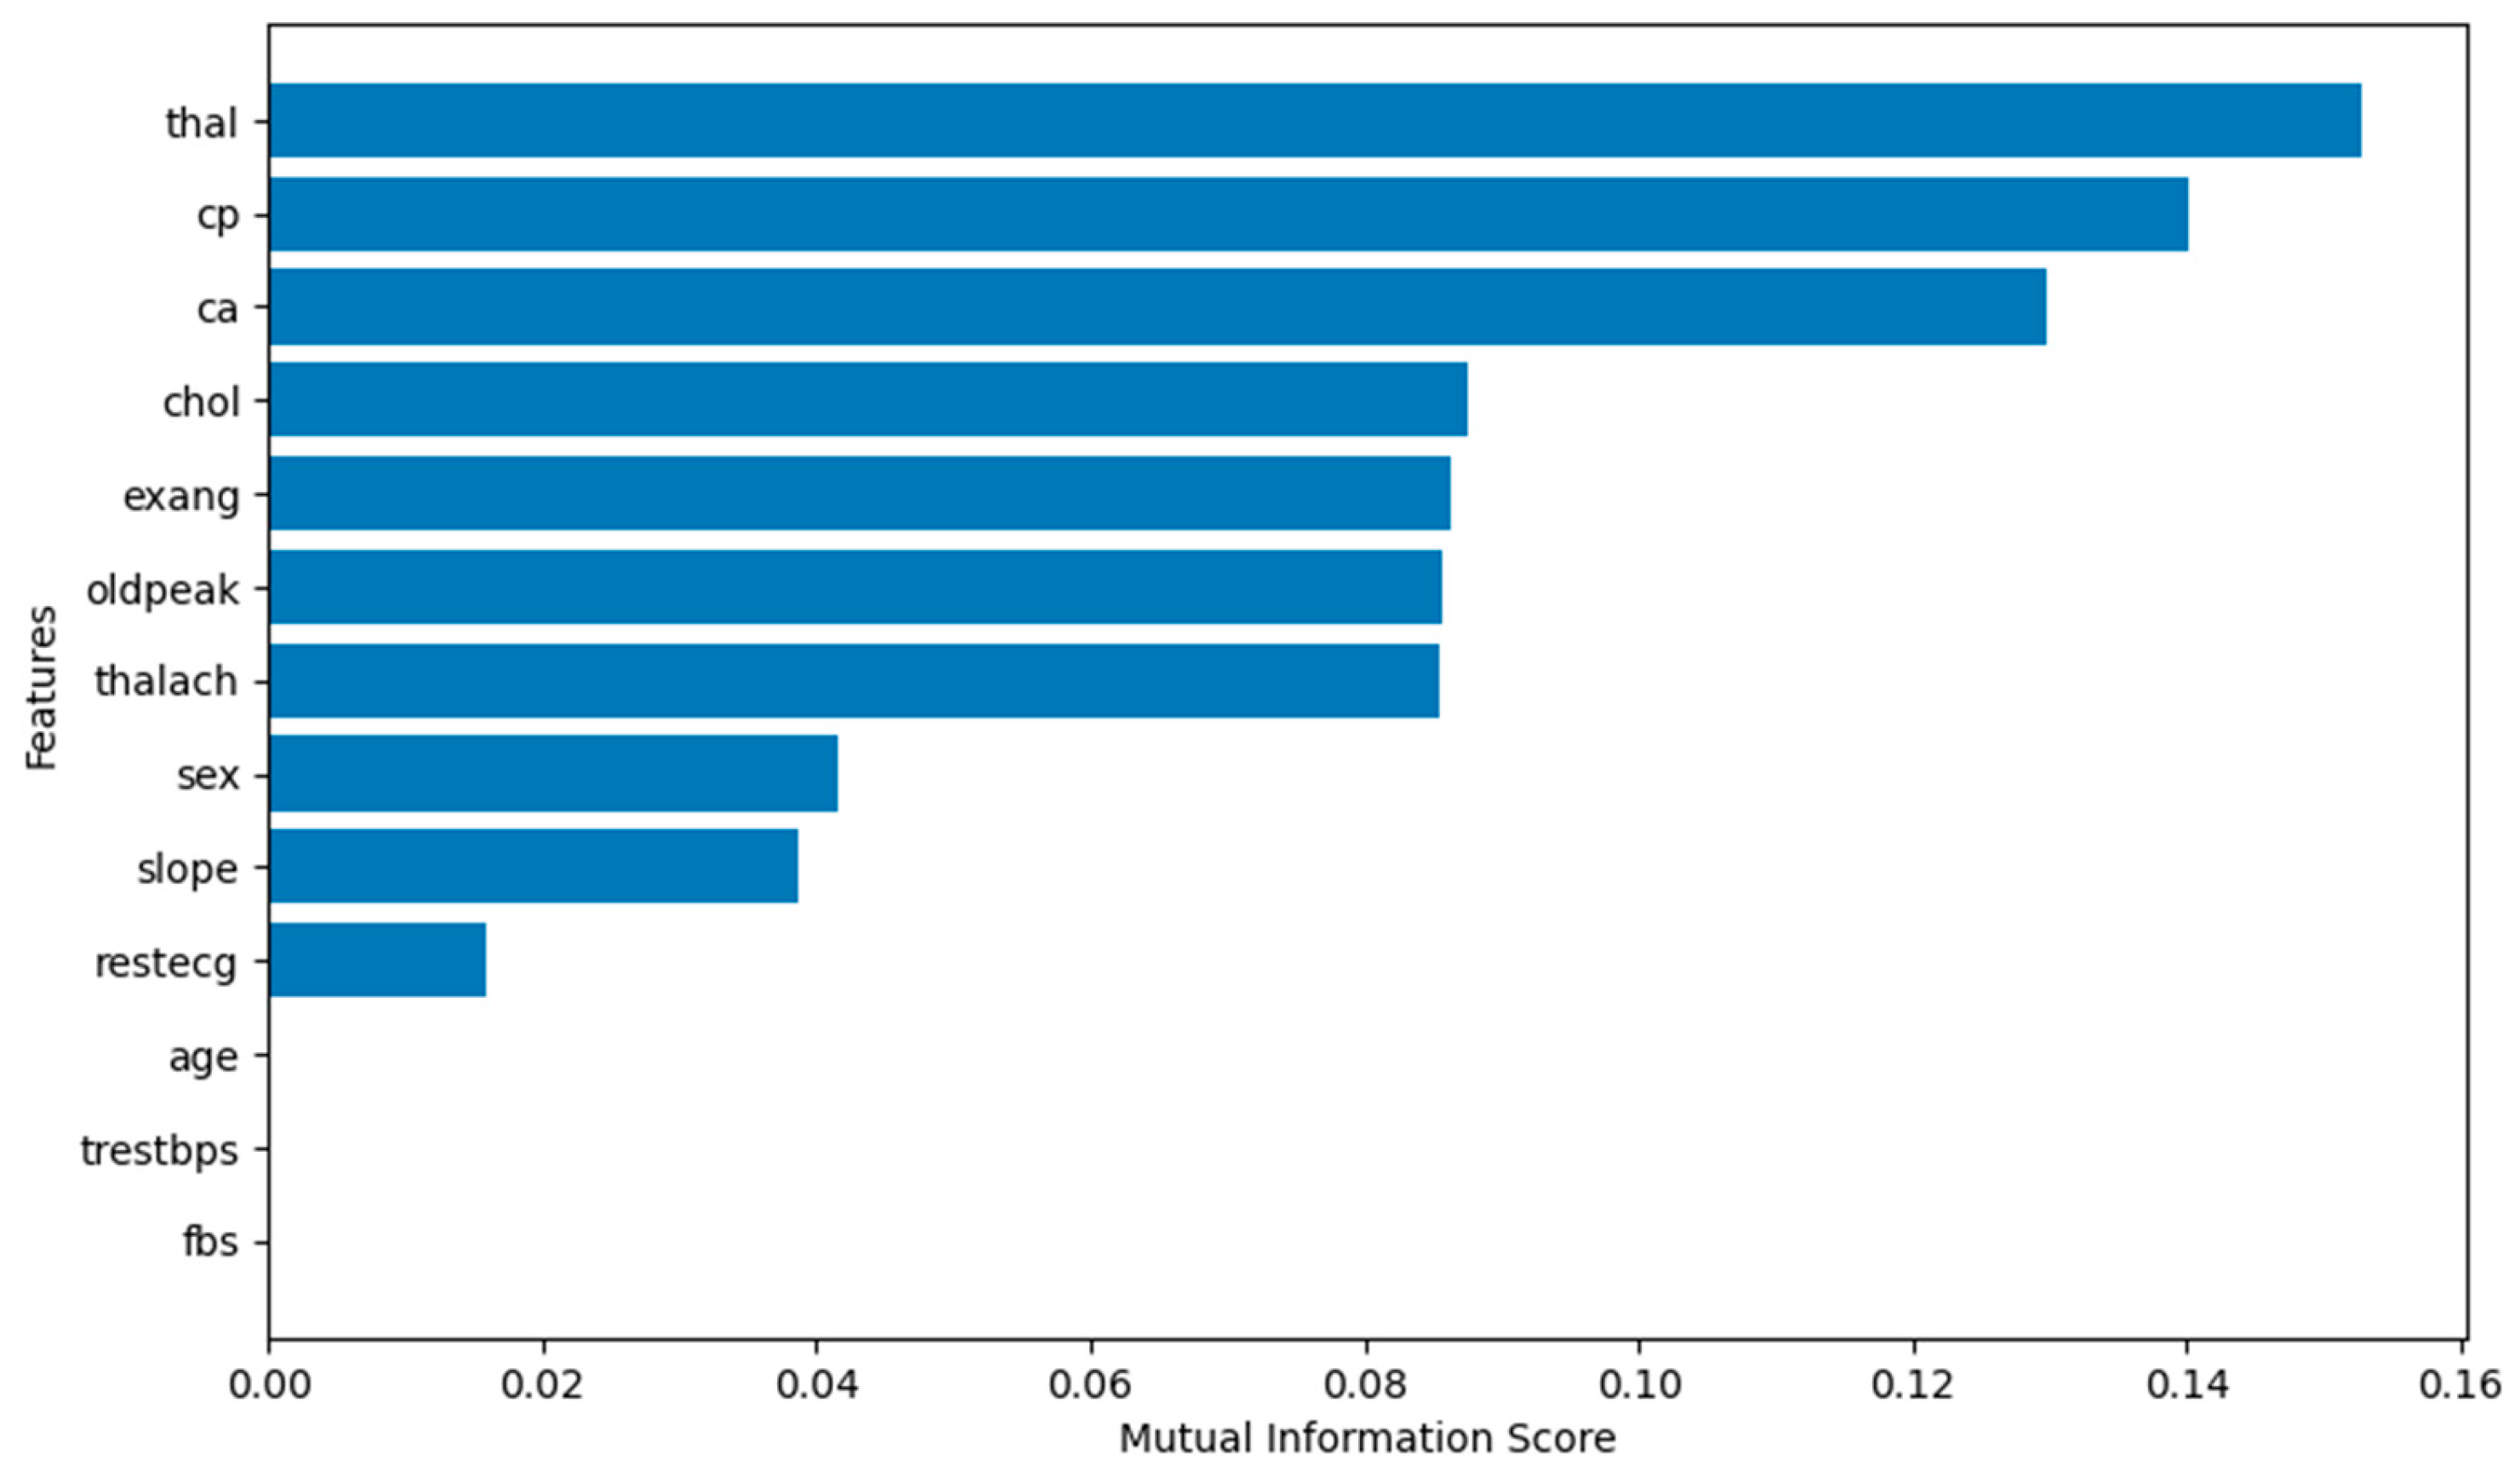
Figure 12.
Experiments design based on multiple learning strategies.
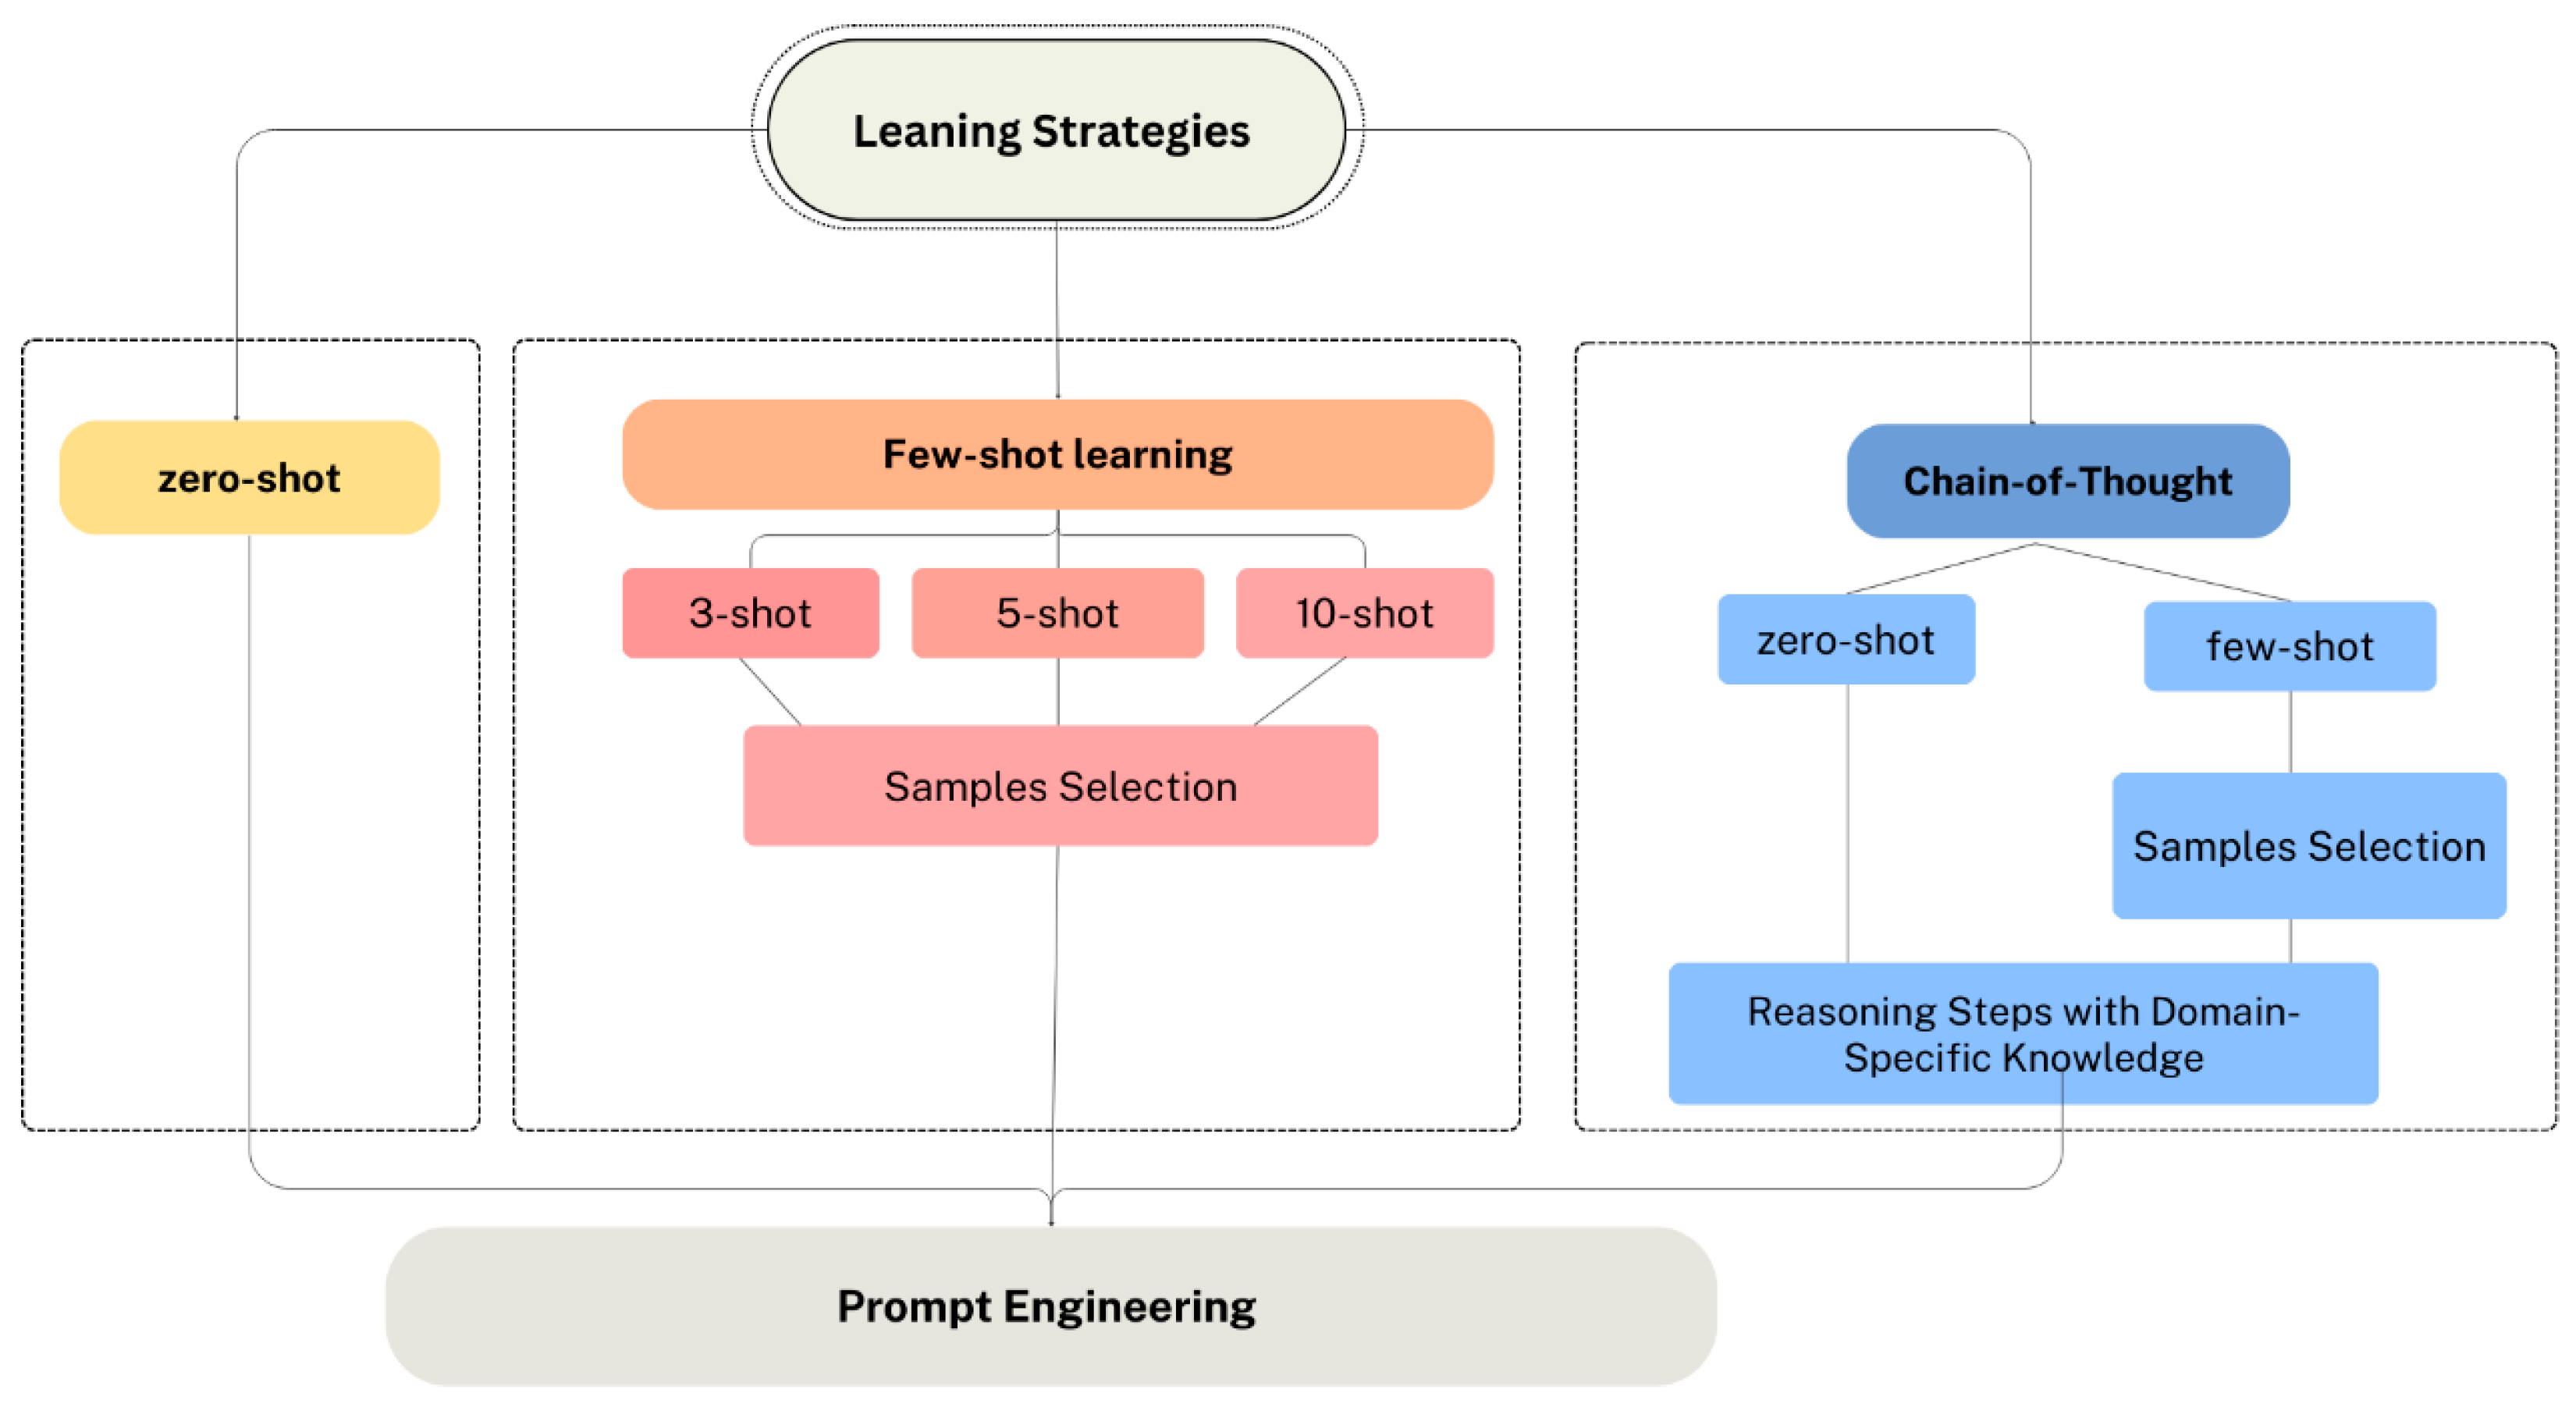
Figure 13.
Proposed structure for Knowledge-Enhanced few-shot CoT prompt message.
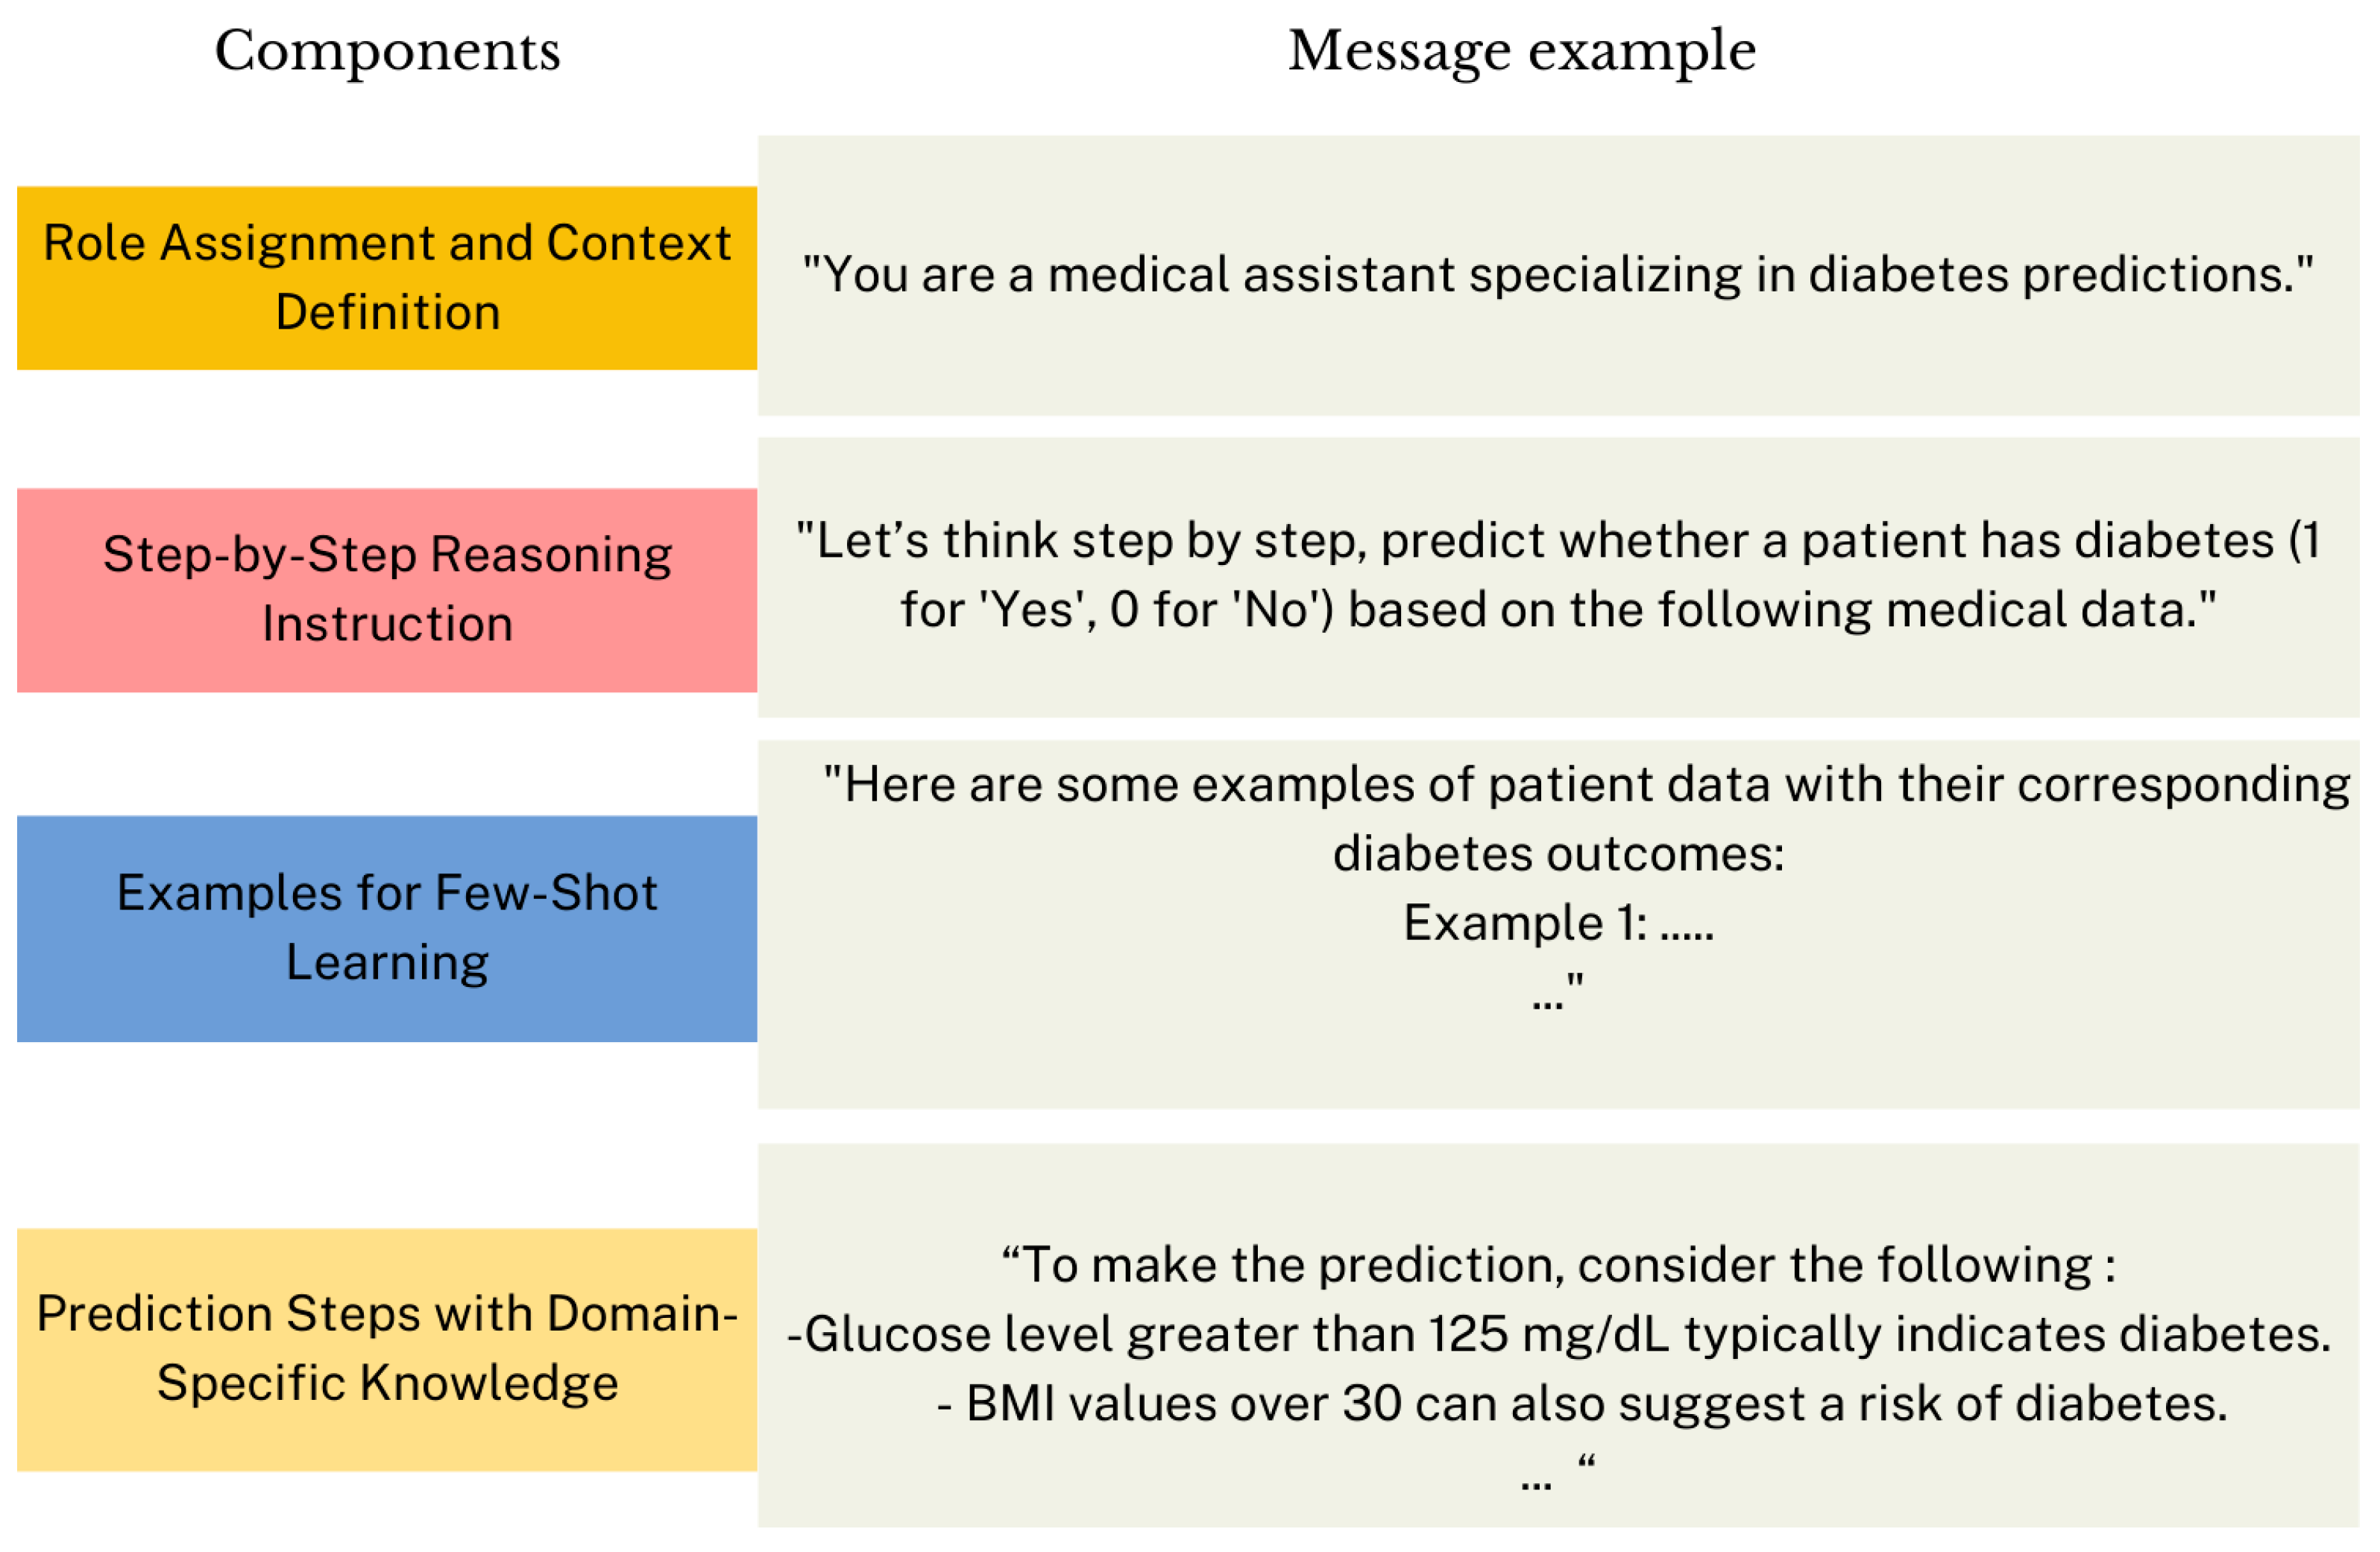
Figure 14.
Zero-shot prompt for diabetes disease prediction.
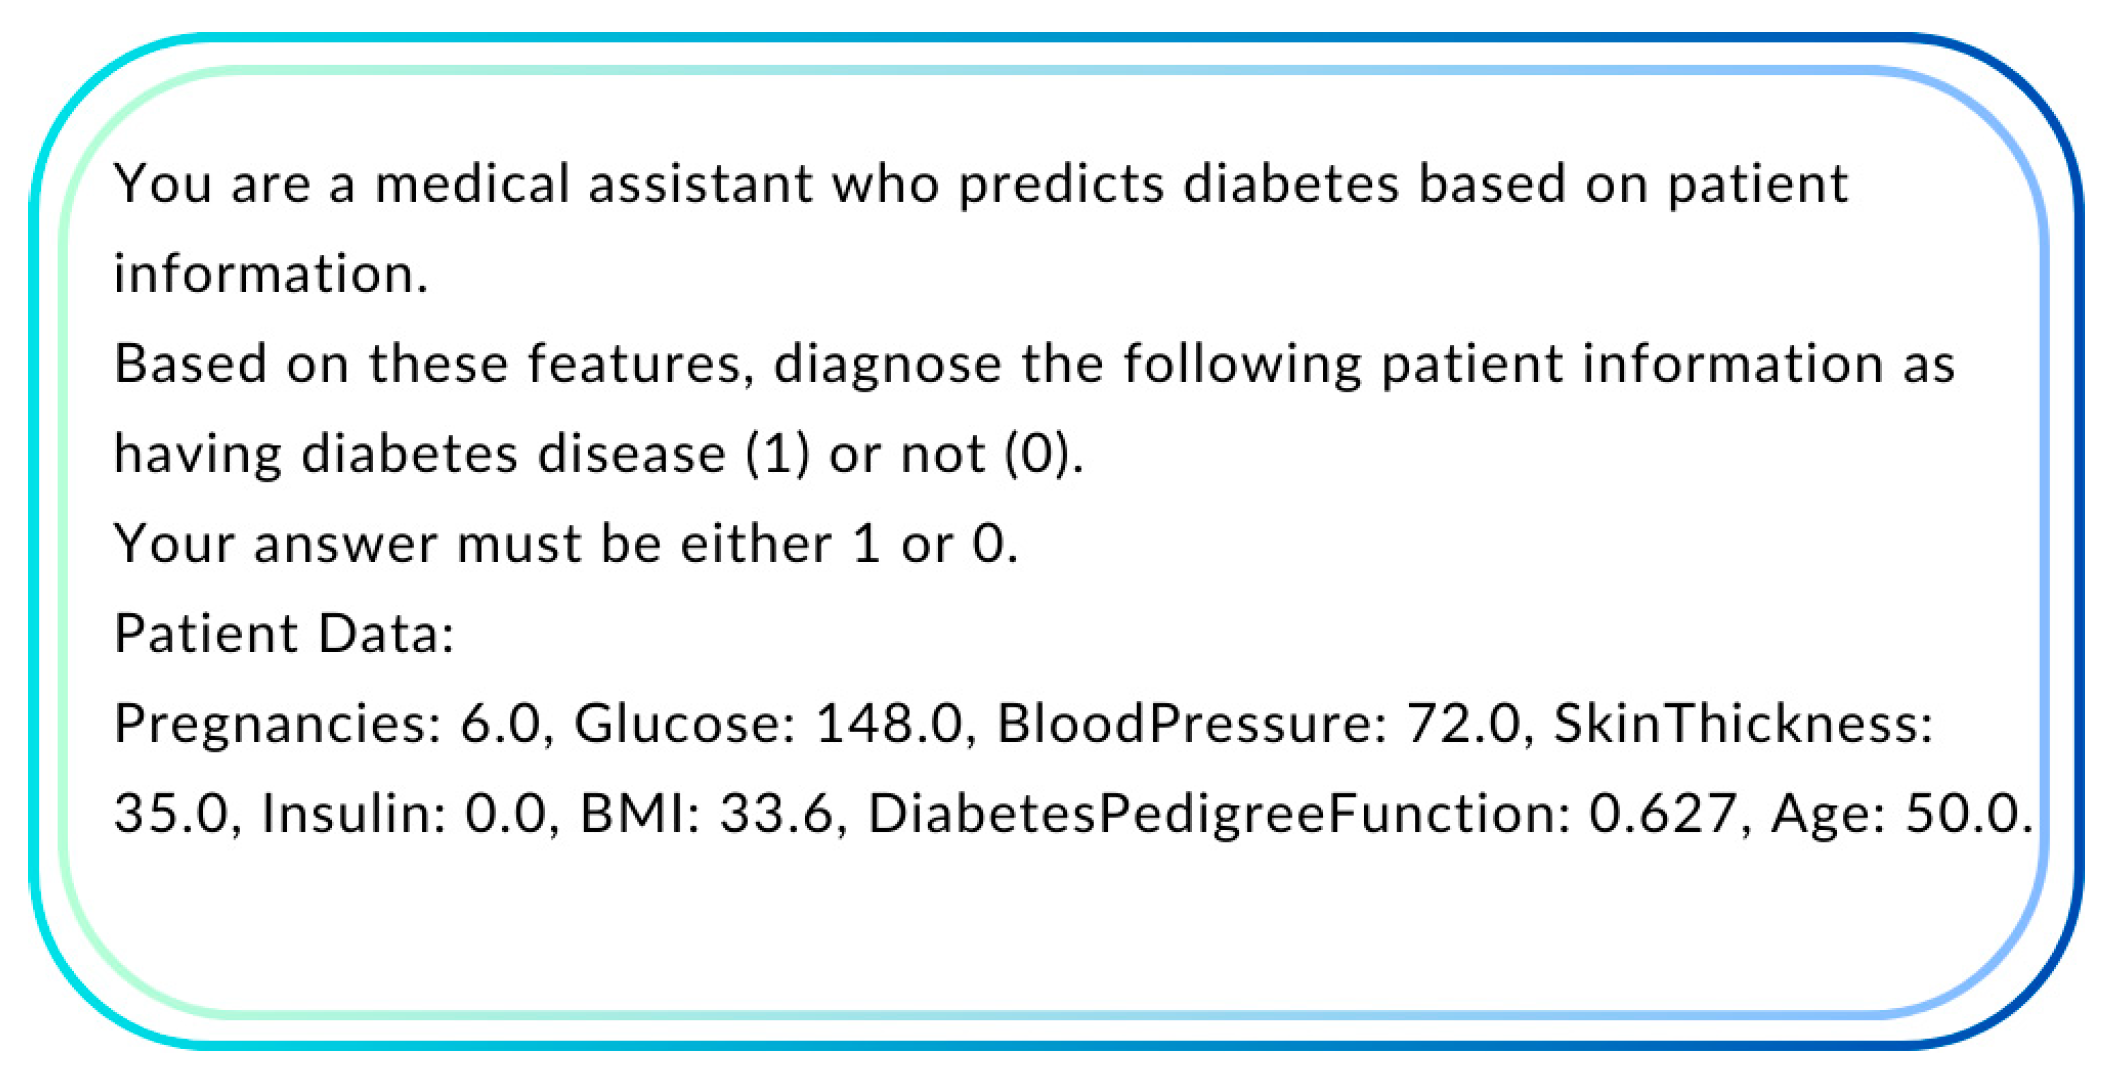
Figure 15.
Zero-shot prompts for heart disease prediction.
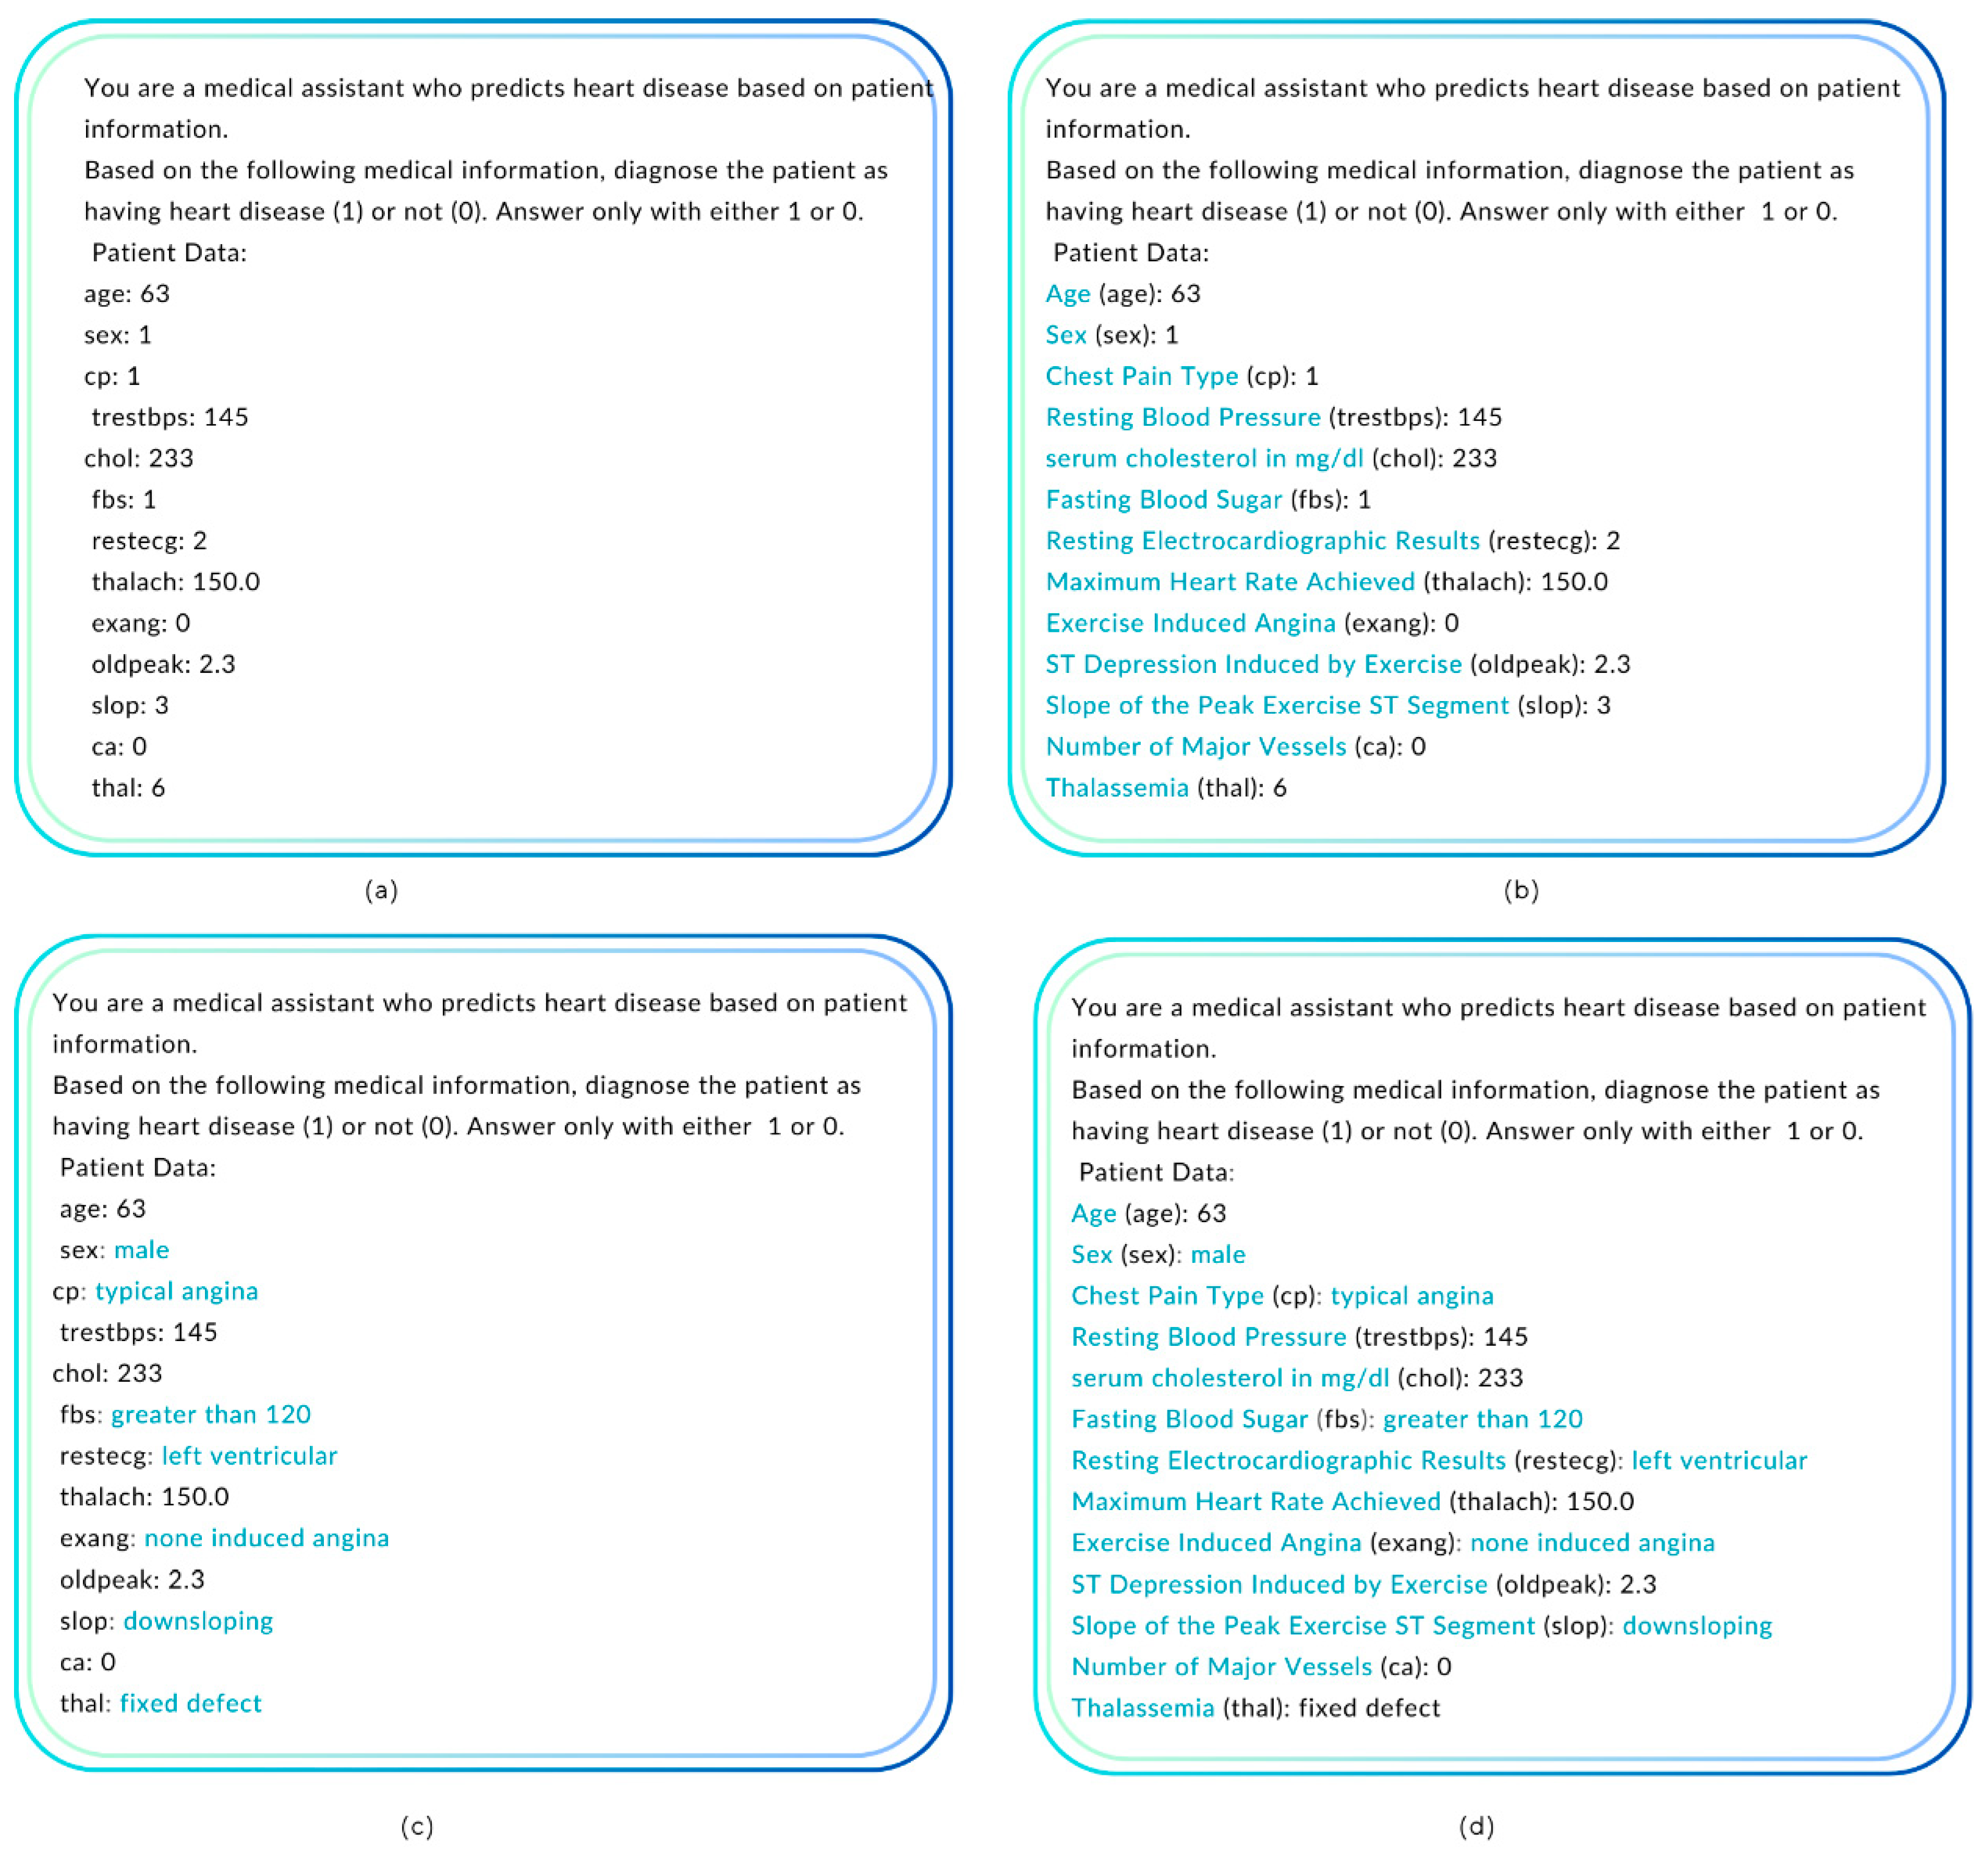
Figure 16.
Performance comparison on the proposed method (GPT-4o using 5-shot with CBFS) for diabetes prediction, alongside the best models from literature, on the PIDD dataset. The black bars above each bar represent error bars, indicating the 95% confidence interval.
Figure 16.
Performance comparison on the proposed method (GPT-4o using 5-shot with CBFS) for diabetes prediction, alongside the best models from literature, on the PIDD dataset. The black bars above each bar represent error bars, indicating the 95% confidence interval.
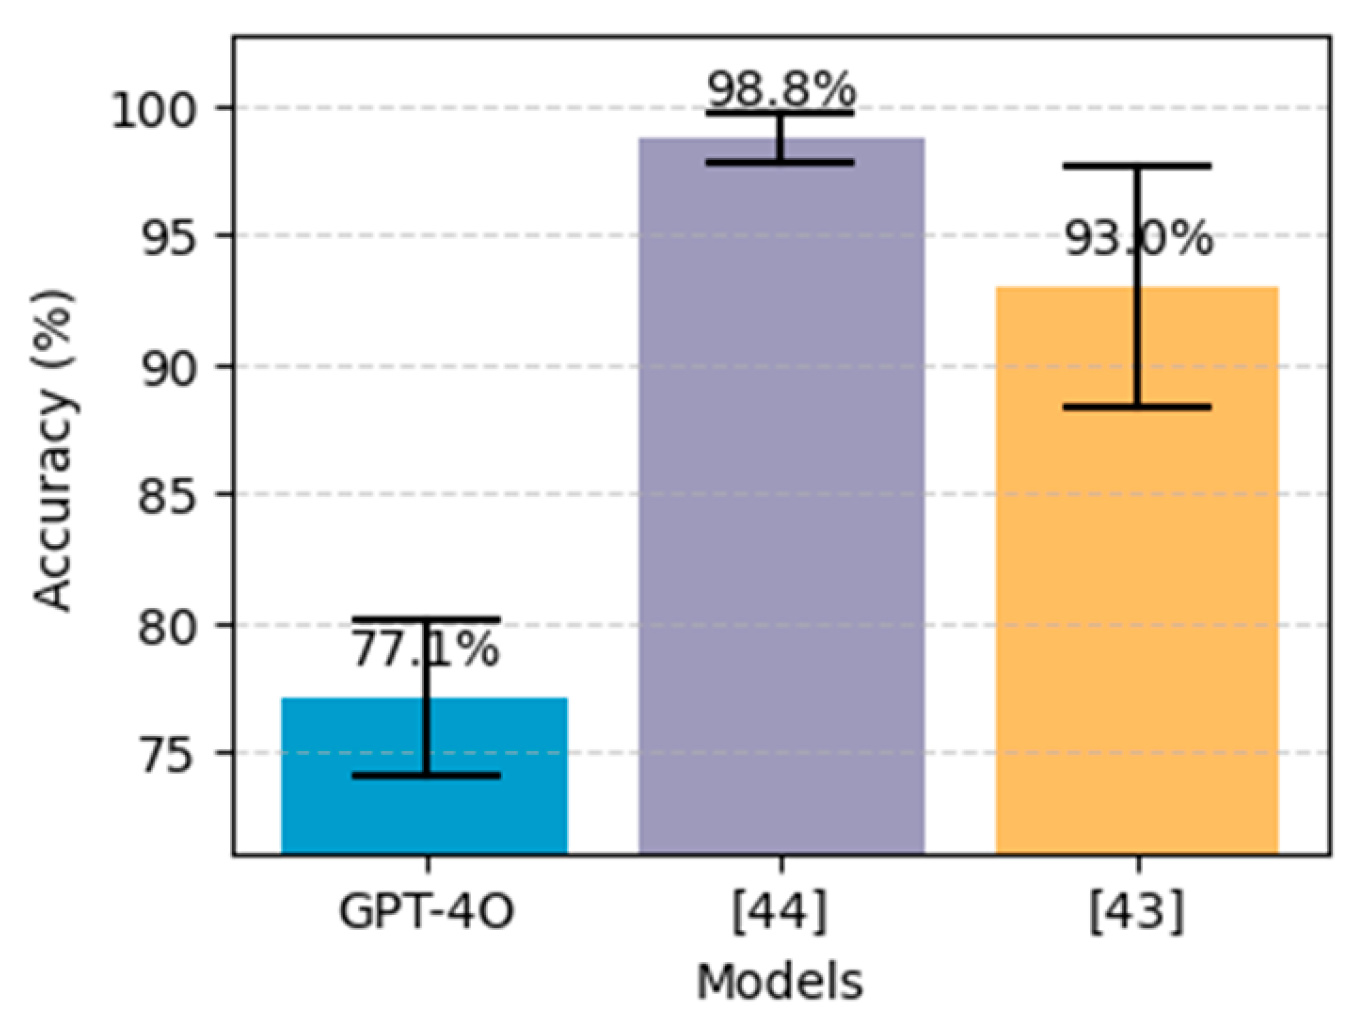
Figure 17.
Performance comparison on the proposed method (GPT-4o using 5-shot) for diabetes prediction, alongside the best models from literature, on the FHDD dataset. The black bars above each bar represent error bars, indicating the 95% confidence interval.
Figure 17.
Performance comparison on the proposed method (GPT-4o using 5-shot) for diabetes prediction, alongside the best models from literature, on the FHDD dataset. The black bars above each bar represent error bars, indicating the 95% confidence interval.
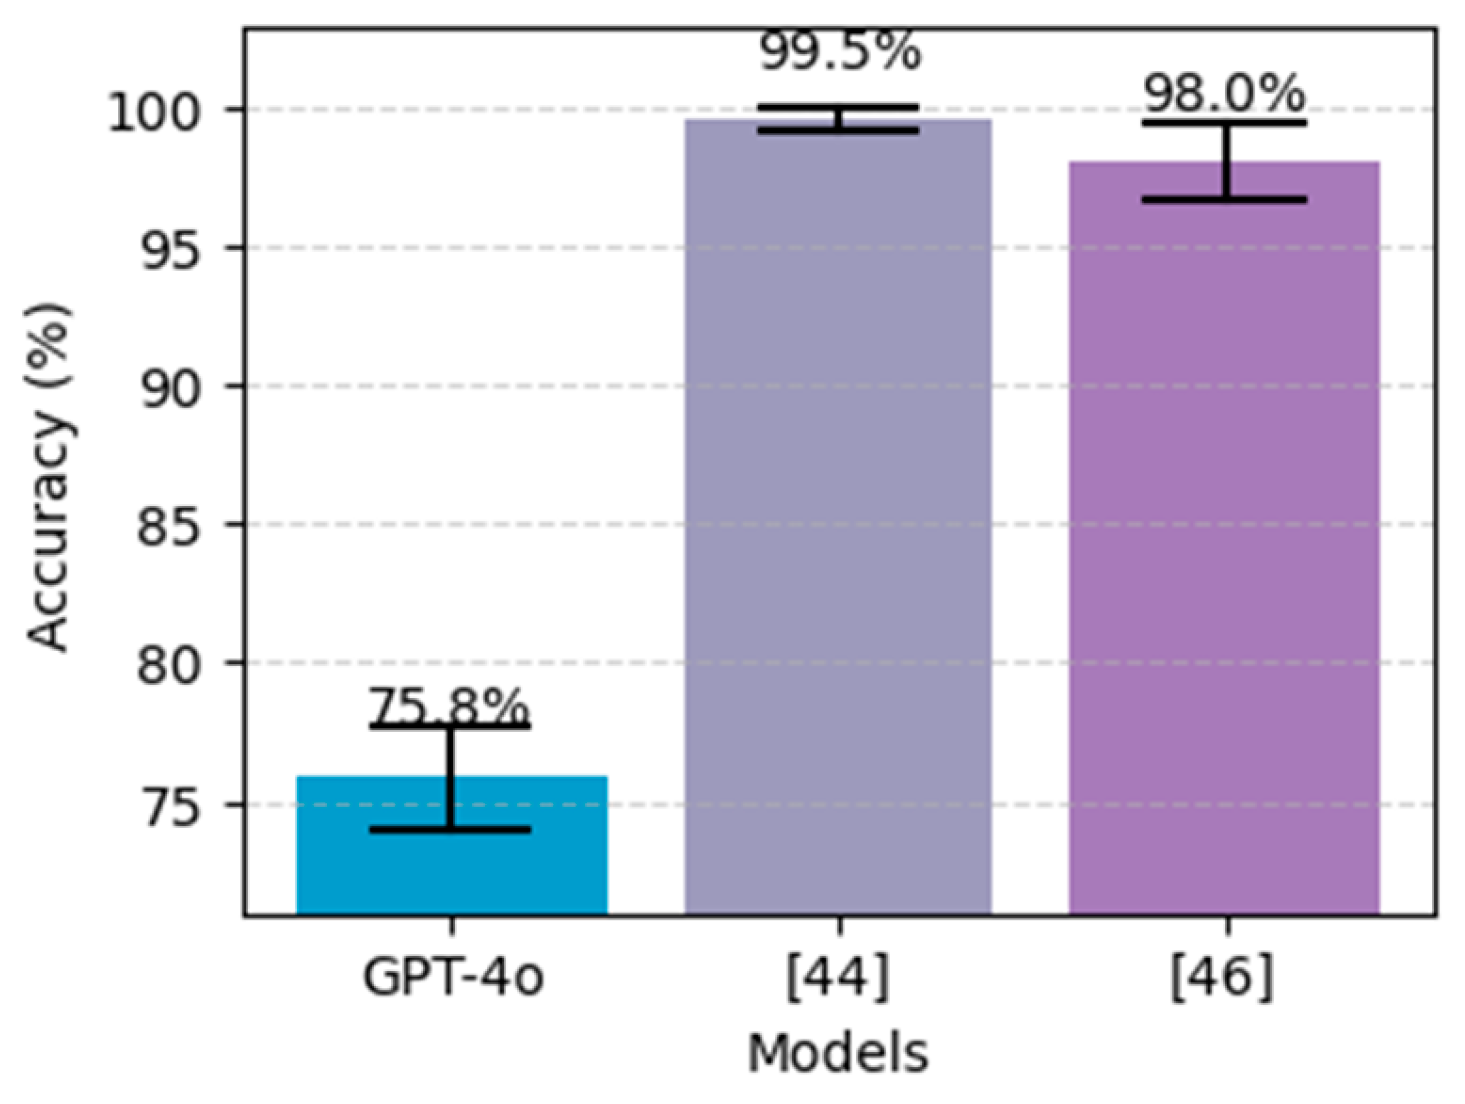
Figure 18.
Performance comparison on the proposed method (GPT-4o using 5-shot with CBFS and prompt engineering) for heart disease prediction alongside the best models from literature, on the Heart Cleveland UCI dataset. The black bars above each bar represent error bars, indicating the 95% confidence interval.
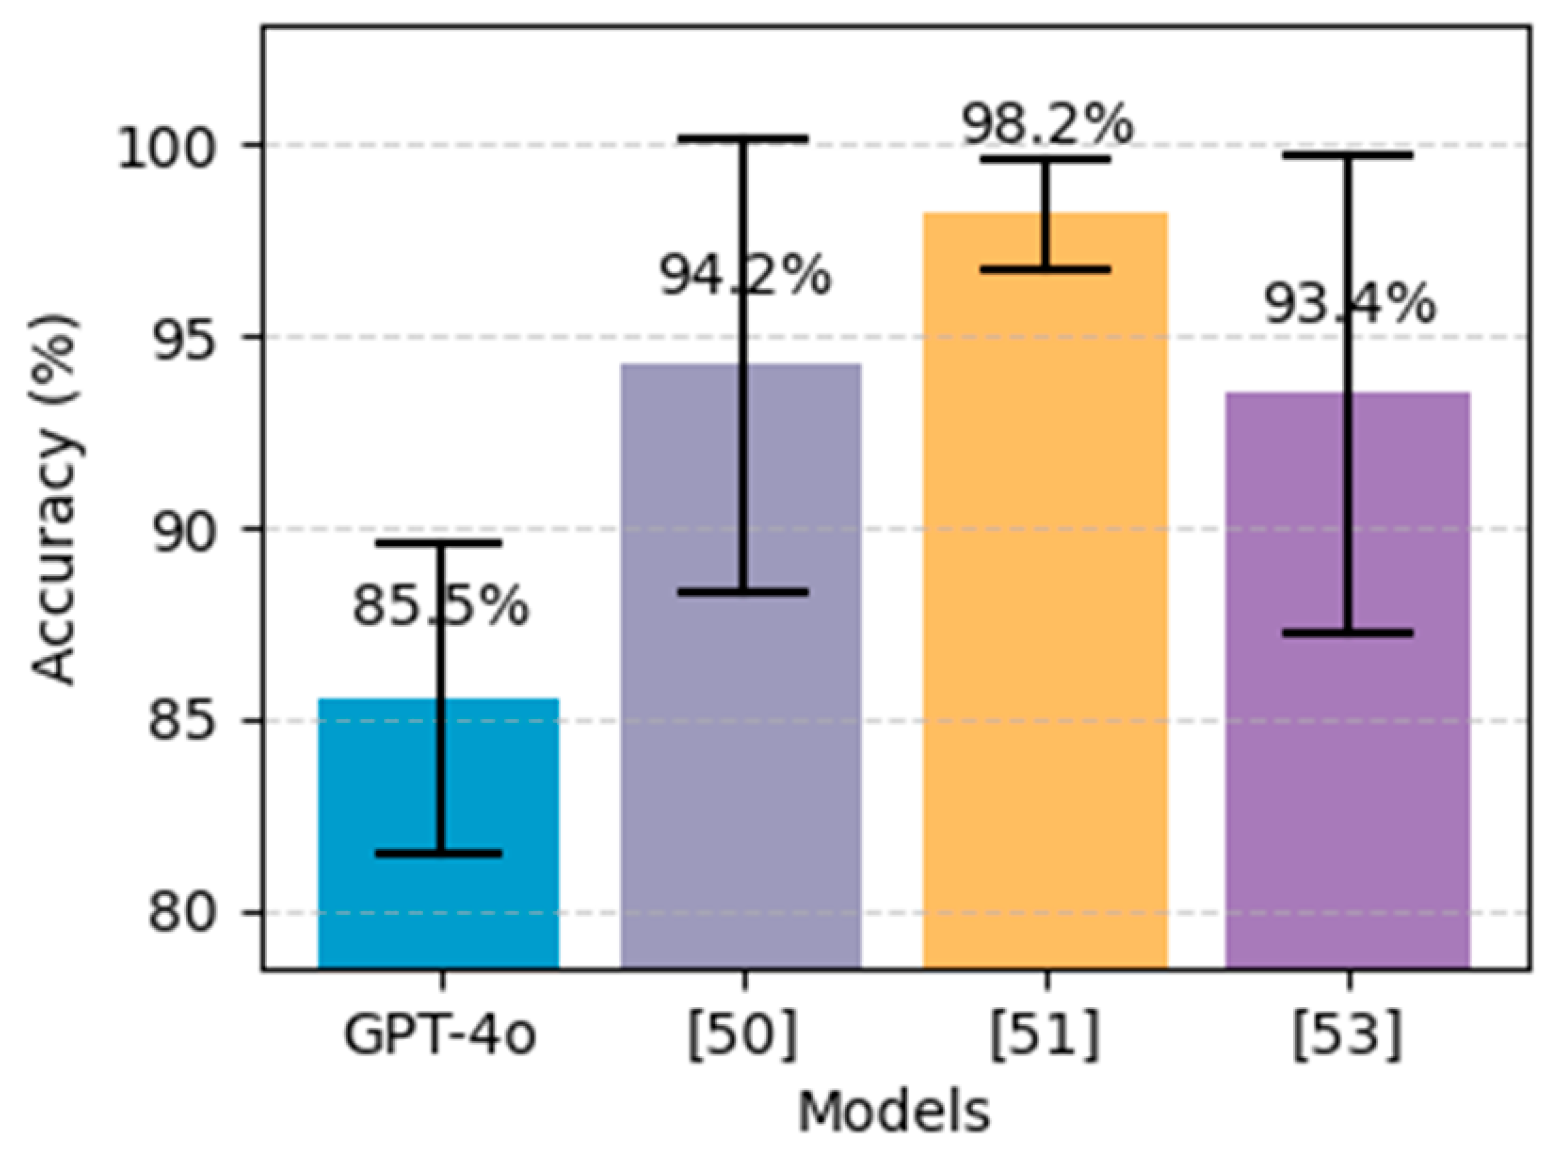
Figure 19.
Suggested AI-assisted workflow.
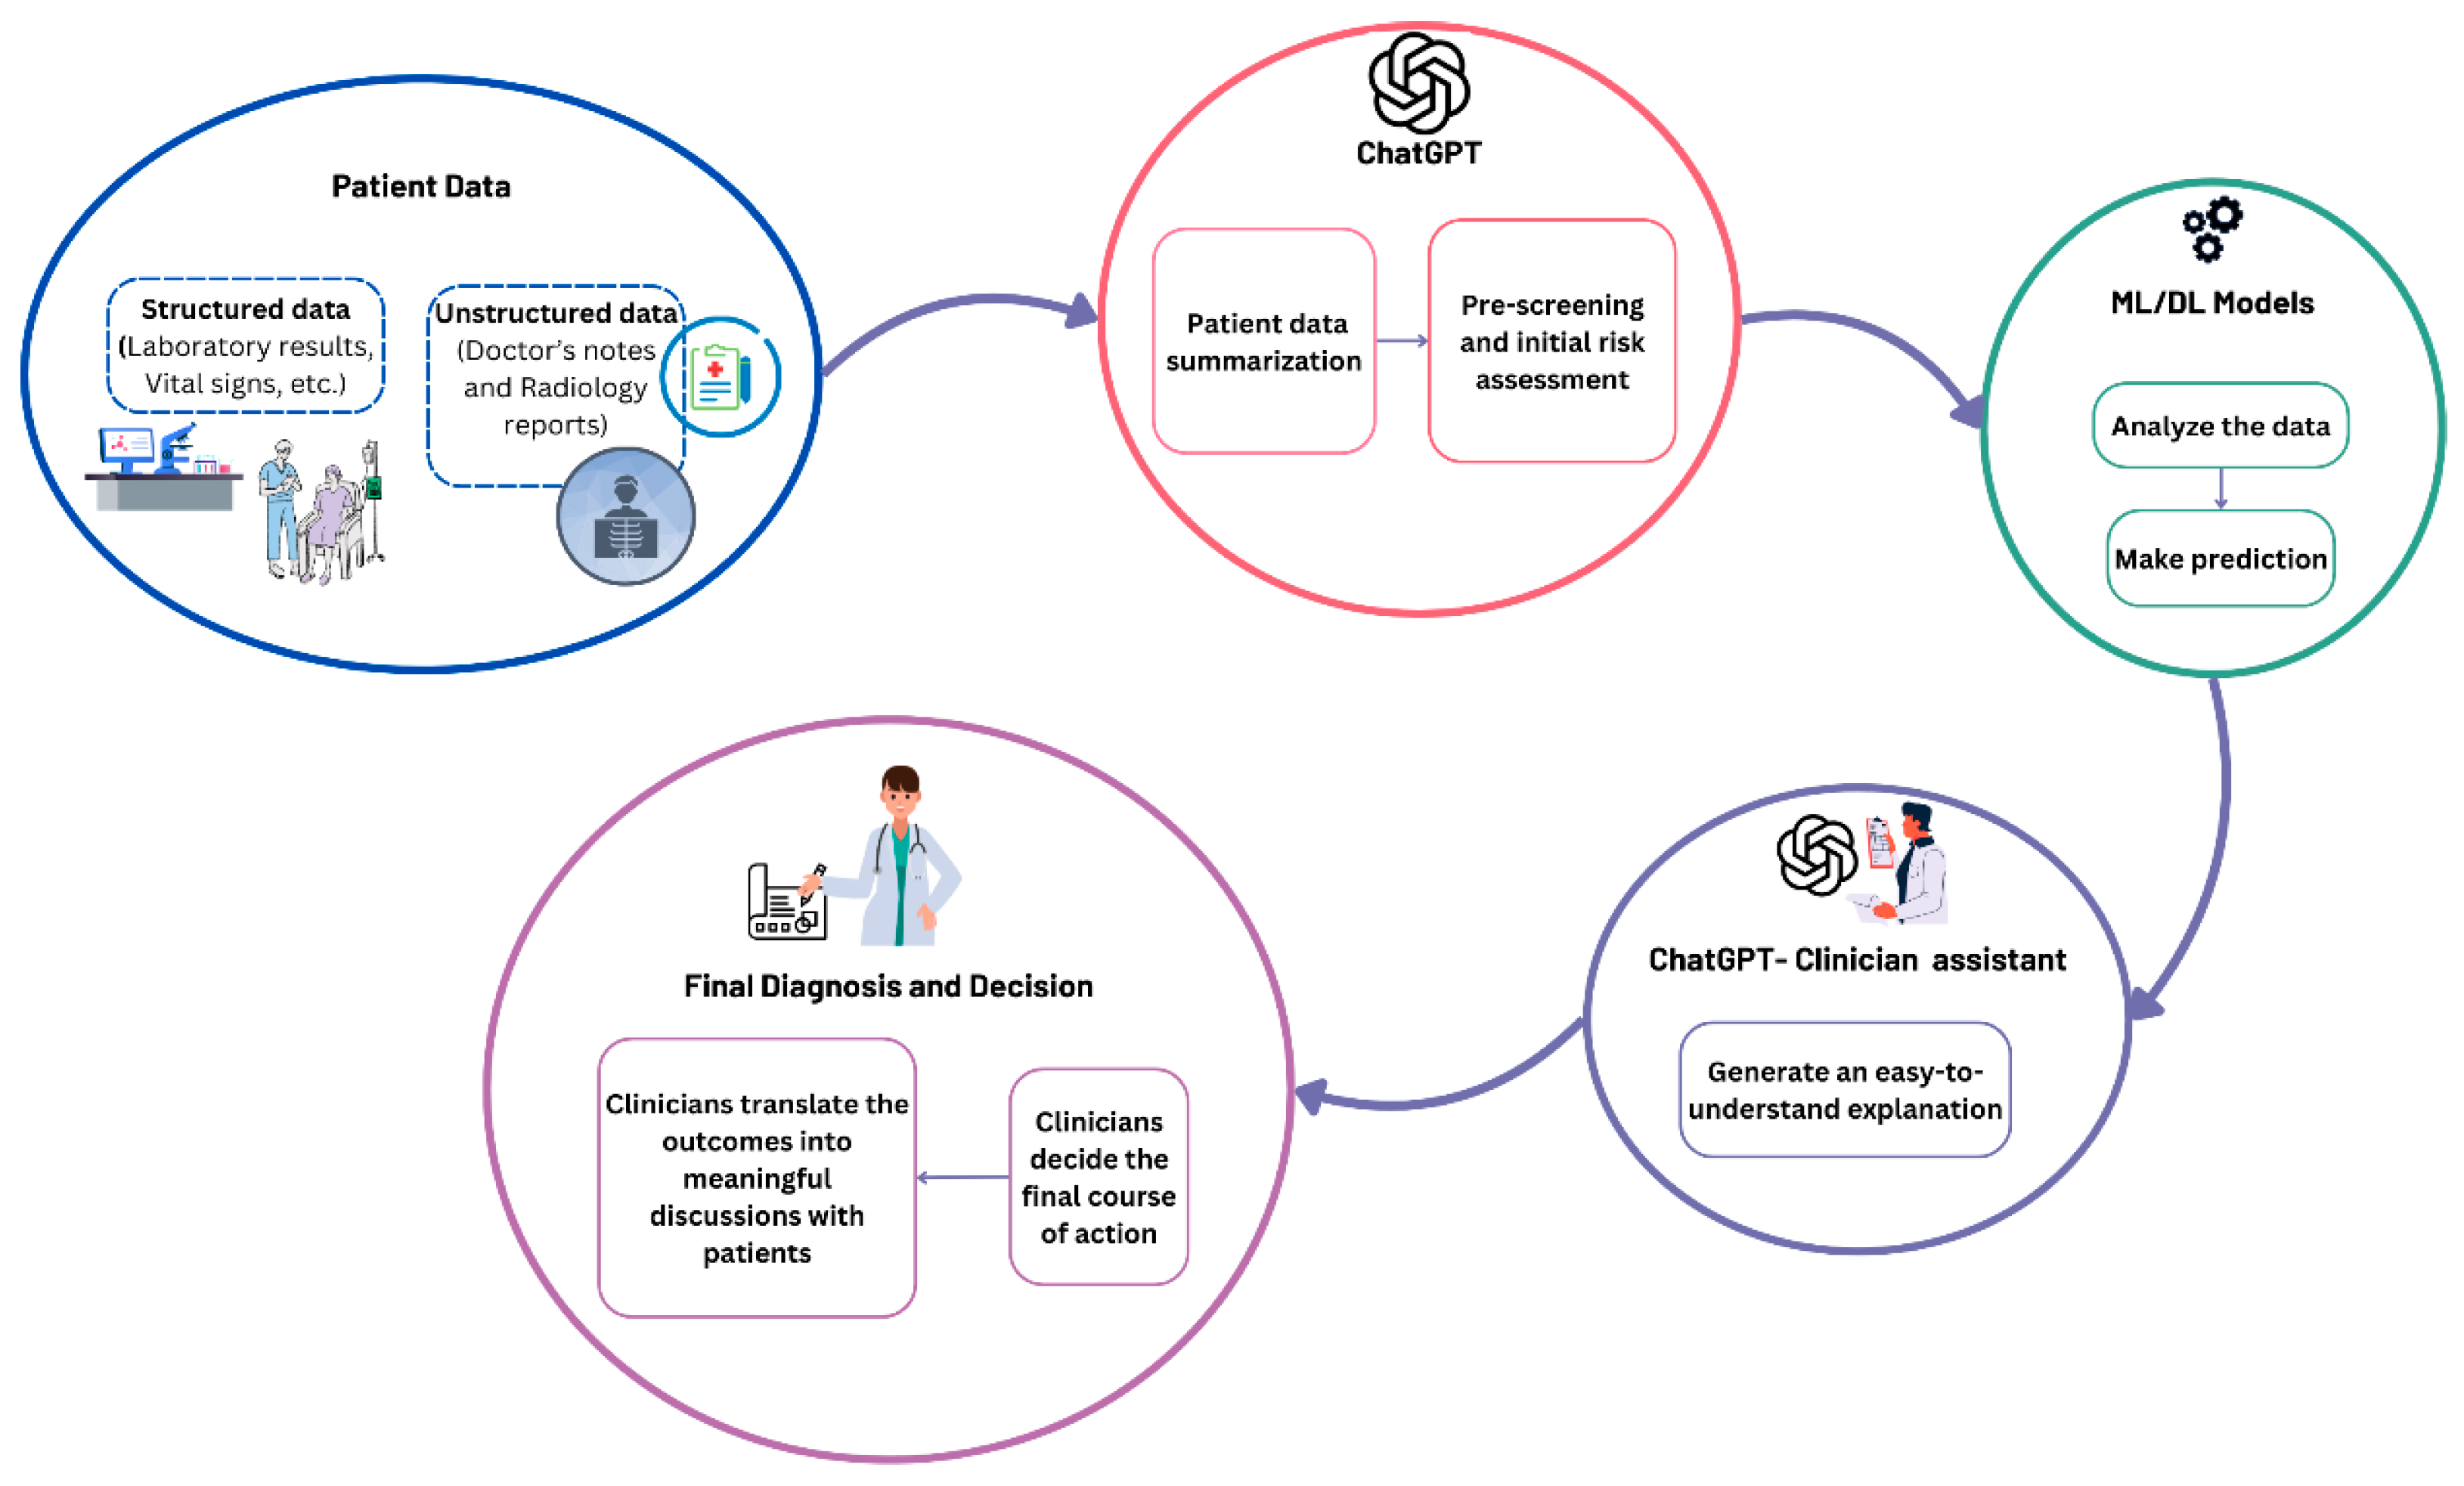

Table 1.
PIDD features description.
| Feature name | Description | Data type |
|---|---|---|
| Pregnancies | Number of pregnancies | Integer |
| Glucose | Plasma glucose concentration | Integer |
| BloodPressure | Diastolic blood pressure | Integer |
| SkinThickness | Triceps skin fold thickness | Integer |
| Insulin | 2-Hour serum insulin | Integer |
| BMI | Body mass index | Float |
| DiabetesPedigreeFunction | A function that scores the likelihood of diabetes based on family history | Float |
| Age | Age of the patient | Integer |
| Outcome | Diabetes outcome (0 = No- T2DM , 1 = T2DM). | Integer |
Table 2.
Description of UIC heart dataset features.
| Feature name | Full Name | Description | Data Type |
|---|---|---|---|
| age | Age | The age of the patient in years. | Integer |
| sex | Sex | The sex of the patient, where 1 = male and 0 = female. | categorical |
| cp | Chest Pain Type | The type of chest pain, where 1 = typical angina, 2 = atypical angina, 3 = non-anginal pain, 4 = asymptomatic. | categorical |
| trestbps | Resting Blood Pressure | The resting blood pressure of the patient in mm Hg. | Integer |
| chol | Serum Cholesterol Level | The serum cholesterol level of the patient in mg/dl. | Integer |
| fbs | Fasting Blood Sugar | A binary feature (1 or 0), where 1 indicates the patient’s fasting blood sugar is greater than 120 mg/dl. | categorical |
| restecg | Resting Electrocardiographic Result | The electrocardiographic result at rest, where 0 = normal, 1= ST-T wave abnormality, 2= left ventricular. | categorical |
| thalach | Maximum Heart Rate Achieved | The maximum heart rate achieved by the patient during exercise. | Float |
| exang | Exercise Induced Angina | A binary feature (1 or 0), where 1 indicating the patient experienced exercise-induced angina. | categorical |
| oldpeak | ST Depression Induced by Exercise | The depression induced by exercise relative to rest. | Float |
| slope | Slope of the Peak Exercise ST Segment | The slope of the peak exercise ST segment, where 1 = upsloping, 2 = flat, 3 = downsloping. | categorical |
| ca | Number of Major Vessels | The number of major vessels (0-3) colored by fluoroscopy. Higher values indicate more significant coronary artery disease. | Integer |
| thal | Thalassemia | The type of thalassemia, where 3 = normal, 6 = fixed defect, 7 = reversible defect. | categorical |
| num | Diagnosis of Heart Disease | The outcome variable, where 0 = no heart disease, 1-4= presence of heart disease. | Integer |
Table 3.
Evaluation results for diabetes disease prediction using zero-shot and few-shot learning with ChatGPT (GPT-4O, GPT-4O-mini) incorporating two feature selection methods: correlation-based selection (CBFS) and mutual information (MIFS).
Table 3.
Evaluation results for diabetes disease prediction using zero-shot and few-shot learning with ChatGPT (GPT-4O, GPT-4O-mini) incorporating two feature selection methods: correlation-based selection (CBFS) and mutual information (MIFS).
| Learning method | Features selection method | Accuracy (%) | Precision (%) | Recall (%) | F1-score (%) | ||||
|---|---|---|---|---|---|---|---|---|---|
| GPT-4o-mini | GPT-4o | GPT-4o-mini | GPT-4o | GPT-4o-mini | GPT-4o | GPT-4o-mini | GPT-4o | ||
| Zero-shot | None | 45.83 | 75.0 | 39.18 | 62.75 | 100.00 | 69.78 | 56.30 | 66.08 |
| MIFS | 39.97 | 75.52 | 36.76 | 62.99 | 100.00 | 72.39 | 53.76 | 67.36 | |
| CBFS | 45.96 | 75.39 | 39.24 | 63.12 | 100.00 | 70.90 | 56.36 | 66.78 | |
| 3-shot | None | 66.53 | 76.69 | 51.22 | 67.45 | 85.82 | 64.18 | 64.16 | 65.77 |
| MIFS | 66.92 | 76.30 | 51.55 | 67.48 | 86.94 | 61.94 | 64.72 | 61.94 | |
| CBFS | 67.84 | 76.56 | 52.42 | 67.46 | 84.70 | 63.43 | 64.76 | 65.38 | |
| 5-shot | None | 67.83 | 76.69 | 52.44 | 68.94 | 84.33 | 60.45 | 64.66 | 64.41 |
| MIFS | 69.01 | 76.43 | 53.61 | 69.51 | 83.21 | 57.84 | 65.20 | 63.14 | |
| CBFS | 67.70 | 77.08 | 52.29 | 70.00 | 85.07 | 60.07 | 64.77 | 64.66 | |
| 10-shot | None | 69.53 | 75.78 | 54.29 | 64.64 | 80.22 | 67.54 | 64.76 | 66.06 |
| MIFS | 69.14 | 74.87 | 53.90 | 62.46 | 79.85 | 70.15 | 64.36 | 66.08 | |
| CBFS | 68.75 | 73.44 | 53.57 | 60.46 | 78.36 | 69.03 | 63.64 | 64.46 | |
Table 4.
Evaluation results for diabetes disease prediction using CoT learning with ChatGPT (GPT-4O) employing correlation-based feature selection.
Table 4.
Evaluation results for diabetes disease prediction using CoT learning with ChatGPT (GPT-4O) employing correlation-based feature selection.
| Learning method | Accuracy (%) | Precision (%) | Recall (%) | F1-score (%) |
|---|---|---|---|---|
| Zero-shot CoT | 70.96 | 55.67 | 82.46 | 66.47 |
| Knowledge-Enhanced Zero-shot CoT | 73.04 | 59.16 | 73.51 | 65.56 |
| 3-shot CoT | 72.53 | 58.82 | 70.90 | 64.30 |
| Knowledge-Enhanced 3-shot CoT | 73.69 | 60.31 | 72.01 | 65.65 |
Table 5.
Evaluation results for diabetes disease prediction (from FHDD) using zero-shot and few-shot learning with ChatGPT (GPT-4O, GPT-4O-mini) incorporating correlation-based selection (CBFS).
Table 5.
Evaluation results for diabetes disease prediction (from FHDD) using zero-shot and few-shot learning with ChatGPT (GPT-4O, GPT-4O-mini) incorporating correlation-based selection (CBFS).
| Learning method | Features selection method | Accuracy (%) | Precision (%) | Recall (%) | F1-score (%) | ||||
|---|---|---|---|---|---|---|---|---|---|
| GPT-4o-mini | GPT-4o | GPT-4o-mini | GPT-4o | GPT-4o-mini | GPT-4o | GPT-4o-mini | GPT-4o | ||
| Zero-shot | None | 41.55 | 74.7 | 36.91 | 60.85 | 100.00 | 72.95 | 53.92 | 66.36 |
| CBFS | 44.75 | 75.2 | 38.11 | 61.90 | 98.68 | 71.49 | 54.99 | 66.35 | |
| 3-shot | None | 61.55 | 74.85 | 46.90 | 60.58 | 94.15 | 75.73 | 62.62 | 67.32 |
| CBFS | 59.59 | 74.7 | 45.63 | 60.55 | 94.74 | 74.71 | 61.60 | 66.88 | |
| 5-shot | None | 66.64 | 75.85 | 50.71 | 63.00 | 88.89 | 71.20 | 64.58 | 66.85 |
| CBFS | 66.14 | 75.65 | 50.29 | 62.33 | 87.28 | 72.81 | 63.82 | 67.16 | |
| 10-shot | None | 66.7 | 75.14 | 50.77 | 61.67 | 86.55 | 72.22 | 64.00 | 66.53 |
| CBFS | 69.19 | 75.5 | 53.15 | 62.28 | 83.77 | 71.93 | 65.04 | 66.76 | |
Table 6.
Evaluation results for diabetes disease prediction (from FHDD) with ChatGPT (GPT-4O) employing correlation-based feature selection.
Table 6.
Evaluation results for diabetes disease prediction (from FHDD) with ChatGPT (GPT-4O) employing correlation-based feature selection.
| Learning method | Accuracy (%) | Precision (%) | Recall (%) | F1-score (%) |
|---|---|---|---|---|
| Zero-shot CoT | 68.85 | 52.79 | 84.36 | 64.94 |
| Knowledge-Enhanced Zero-shot CoT | 72.3 | 57.34 | 74.27 | 64.71 |
| 3-shot CoT | 68.75 | 52.59 | 87.43 | 65.68 |
| Knowledge-Enhanced 3-shot CoT | 72.35 | 57.05 | 77.49 | 65.72 |
Table 7.
Evaluation results for heart disease prediction testing different prompt formats using ChatGPT with zero-shot strategy and without applying any feature selection method.
Table 7.
Evaluation results for heart disease prediction testing different prompt formats using ChatGPT with zero-shot strategy and without applying any feature selection method.
| Prompts | Accuracy (%) | Precision (%) | Recall (%) | F1-score (%) | ||||
|---|---|---|---|---|---|---|---|---|
| GPT-4o-mini | GPT-4o | GPT-4o-mini | GPT-4o | GPT-4o-mini | GPT-4o | GPT-4o-mini | GPT-4o | |
| 1 | 52.19 | 75.08 | 49.09 | 69.09 | 98.54 | 83.21 | 65.53 | 75.50 |
| 2 | 55.22 | 73.74 | 50.76 | 66.12 | 97.81 | 88.32 | 66.83 | 75.62 |
| 3 | 58.92 | 78.11 | 53.09 | 72.22 | 94.16 | 85.40 | 67.89 | 78.26 |
| 4 | 55.22 | 80.47 | 50.77 | 76.51 | 96.35 | 83.21 | 66.50 | 79.72 |
Table 8.
Evaluation results for heart disease prediction using zero-shot and few-shot learning with ChatGPT, incorporating two feature selection methods: correlation-based selection (CBFS) and mutual information (MIFS).
Table 8.
Evaluation results for heart disease prediction using zero-shot and few-shot learning with ChatGPT, incorporating two feature selection methods: correlation-based selection (CBFS) and mutual information (MIFS).
| Learning method | Features selection method | Accuracy (%) | Precision (%) | Recall (%) | F1-score (%) | ||||
|---|---|---|---|---|---|---|---|---|---|
| GPT-4o--mini | GPT-4o | GPT-4omini | GPT-4o | GPT-4o-mini | GPT-4o | GPT-4o-mini | GPT-4o | ||
| Zero-shot | None | 55.22 | 80.47 | 50.77 | 76.51 | 96.35 | 83.21 | 66.50 | 79.72 |
| MIFS | 64.65 | 81.14 | 57.69 | 77.18 | 87.59 | 83.94 | 69.57 | 80.42 | |
| CBFS | 71.04 | 83.84 | 64.57 | 80.69 | 82.48 | 85.40 | 72.44 | 82.98 | |
| 3-shot | None | 69.36 | 83.50 | 64.38 | 81.88 | 75.18 | 82.48 | 69.36 | 82.18 |
| MIFS | 73.74 | 83.84 | 66.86 | 82.96 | 85.40 | 81.75 | 75.00 | 82.35 | |
| CBFS | 75.76 | 85.19 | 76.42 | 85.50 | 68.61 | 81.75 | 72.31 | 83.58 | |
| 5-shot | None | 74.07 | 82.49 | 69.48 | 81.02 | 78.10 | 81.02 | 73.54 | 81.02 |
| MIFS | 74.41 | 82.83 | 69.43 | 86.44 | 69.43 | 74.45 | 74.15 | 80.00 | |
| CBFS | 78.45 | 85.52 | 79.67 | 87.30 | 71.53 | 80.29 | 75.38 | 83.65 | |
| 10-shot | None | 74.07 | 82.83 | 69.23 | 84.68 | 78.83 | 76.64 | 73.72 | 80.46 |
| MIFS | 72.73 | 82.15 | 66.28 | 85.59 | 83.21 | 73.72 | 73.79 | 79.22 | |
| CBFS | 77.44 | 84.18 | 76.12 | 85.71 | 74.45 | 78.83 | 75.28 | 82.13 | |
Table 9.
Evaluation results of heart disease prediction using ChatGPT (GPT-4O) with CoT learning and correlation-based feature selection.
Table 9.
Evaluation results of heart disease prediction using ChatGPT (GPT-4O) with CoT learning and correlation-based feature selection.
| Learning method | Accuracy (%) | Precision (%) | Recall (%) | F1-score (%) |
|---|---|---|---|---|
| Zero-shot CoT | 75.76 | 67.57 | 91.24 | 77.64 |
| Knowledge-Enhanced zero-shot CoT | 65.66 | 57.58 | 97.08 | 72.28 |
| 3-shot CoT | 76.77 | 70.73 | 84.67 | 77.08 |
| Knowledge-Enhanced 3-shot CoT | 72.05% | 64.21 | 89.05 | 74.62 |
Table 10.
The selected ML/DL-based studies for performance comparison.
| Dataset | Ref. | Approach | |
|---|---|---|---|
| Pima Indian Diabetes Dataset | Bukhari et al. [43] | Deep learning (ABP-SCGNN) | |
| Alreshan et al. [44] | Deep learning (stack-ANN) | ||
| Frankfurt Hospital Diabetes Dataset | Alreshan et al. [44] | Deep learning (stack-ANN) | |
| Dambra et al. [46] | Random forest | ||
| Heart Disease | Cleveland UCI Heart Disease Dataset | Asif et al. [51] | Extra tree classifier |
| Bharti et al. [50] | Deep learning (ANN) | ||
| Chandrasekhar and Peddakrishna [53] | Soft voting ensemble method with feature scaling to address outliers |
Disclaimer/Publisher’s Note: The statements, opinions and data contained in all publications are solely those of the individual author(s) and contributor(s) and not of MDPI and/or the editor(s). MDPI and/or the editor(s) disclaim responsibility for any injury to people or property resulting from any ideas, methods, instructions or products referred to in the content. |
© 2025 by the authors. Licensee MDPI, Basel, Switzerland. This article is an open access article distributed under the terms and conditions of the Creative Commons Attribution (CC BY) license (http://creativecommons.org/licenses/by/4.0/).
Copyright: This open access article is published under a Creative Commons CC BY 4.0 license, which permit the free download, distribution, and reuse, provided that the author and preprint are cited in any reuse.


