
Submitted:
07 April 2025
Posted:
07 April 2025
You are already at the latest version
Abstract
Analysis of noise production from wind turbines with relation to their ever increasing rotor diameter, hub height and the application of noise reducing measures, shows that noise reduction is not the goal, but a consequence of mechanical and operational limitations. In this paper a detailed analysis is made of a series of papers by a group of authors, who claim that the average increase of tip-related noise has lost its stable relationship with hub height and rotor diameter due to sound reducing measures, such as serrations. It will be shown that these claims are pure window dressing. Tip speed is limited by Leading Edge Erosion (LEE), after lightning the most devastating cause of wear on windturbines. And tip related noise constitutes the bulk of wind turbine noise, but is much less responsible for the excessive annoyance of wind turbine noise, compared to traffic noise. LF, Infrasound, amplitude modulation and tonal aspects of wind turbine noise are much more important in the determination of annoyance of the sound. Due to lacking regulations, proper instructions how to determine these aspects of wind turbine noise, there seems to be a vacuum with regard to enforcement of legal limits in most countries. This vacuum is mostly due to the abundance of early 1920s types of technology, legislation based on this technology. Nowadays, every smartphone is capable of doing a power Power Spectral Distribution (PSD) analysis. Inclusion of these low threshold, high prevalence measurements into determining annoyance and help enforcement seems far overdue.
Keywords:
wind technology
; noise reduction
; enforcement
Harrie Verhoeven

[1]
About the author: Dr.ir. HA Verhoeven works as a peer reviewer, is a retired biologist and has previously worked on big-data analyses for -omics applications.
Introduction
A recent article in this journal [1] claims that research into reducing wind turbine noise has led to a reduction in the increase in noise production as a function of turbine power: the historical value of 3dB(A) per doubling of power has now been reduced to 1dB(A) per doubling. The use of owl feathers is investigated and presented as one of the factors responsible for this reduction. However, there are a number of serious shortcomings in this study, which do not support or even undermine the conclusions drawn. The research is based on data from a commercial database, in which noise curves and power curves of individual wind turbines are registered, all according to the brochure specifications of the manufacturer. The research throws all the different construction variants, such as direct drive, gearbox, into one pile and uses the properties in an analysis of the noise production of wind turbines. The study is limited exclusively to the noise caused by the tip of the blade cutting through turbulent or non-turbulent air. Other types of noise, which are responsible for the annoying effect of wind turbine noise, for example when compared to traffic noise of the same intensity, are not included in the analysis. The objections to the present study are summarized in a scientific article, in which relevant scientific literature is discussed extensively [2] . Examples of other types of noise are:
(1) rhythmic (droning) and tonal aspect (buzzing, humming);
(2) amplitude modulation (“ whoesh ” sound);
(3) low frequency sound (20 to 200Hz)
(4) infrasound (<20Hz), together with amplitude modulation the most annoying factor of wind turbine noise
This article explains and further analyses these shortcomings, summarises them in a conclusion and compares them with the conclusions of the study discussed.
Maximum Sound Production
In order to analyse the maximum noise production as a function of electrical power, all available data are plotted in a graph (Figure 1), without distinguishing between differences in mechanical construction. We see a large spread in the data that varies from 3 to 8 dB(A) depending on the power category. And that is the conclusion that the authors draw, the type of wind turbine is more decisive for the noise production than the size.
To assess this claim , it is necessary to delve a little deeper into the way in which the energy production of wind turbines is controlled by their Software Control and Data Acquisition , SCADA systems. [2]Some wind turbines also have their Thrust Coefficient ( C t ) and Power Coefficient ( C p ) curves are available, which provide insight into the control of turbine speed at different wind speeds. This database also contains data on the maximum tip speed at maximum electrical power. In the C t graph of a single wind turbine model we know that the maximum is determined by the SCADA system. But why does a general limitation appear around 3MW that causes the maximum tip speed to be in the same order of magnitude? From the same database comes the information that there seems to be a maximum tip speed of the larger turbines, between 80 and 90 m/s. This also applies to offshore wind turbines, for which no noise restrictions apply: here the tip speeds are also between 80 and 104 m/s (Table 1).
This suggests that there is a more compelling reason to limit tip speed, other than noise pollution. There is a reason, and it is one that is responsible for more than 20% of wind turbine failures. This is Leading Edge Erosion (LEE). LEE becomes problematic between 250 and 300 km/h (70-83 m/s) for the tip speed and results in progressive wear if this speed is exceeded. This phenomenon was the subject of an extensive article in the Volkskrant [3]. Research by the Delft University of Technology has shown that an increase in tip speed from 75 to 90 m/s results in a halving of the lifespan of the blade coating (3 vs 6.3 years) with 7 and 3 repairs in the meantime due to the increase in LEE wear [3] . A generally accepted speed for the average blade assembly is between 75 and 90 m/s. At this speed, most wind turbines generate a source power ( L wa ) of around 106 dB(A). And this has nothing to do with noise production requirements. It is a coincidence, dictated by the physical properties of the materials from which blades are made.
Which also automatically means that higher tip speeds can be achieved with better materials, and therefore more noise will be made. This can be clearly seen in Figure 1, in which the data from a previous preprint by the authors [4] has been converted to tip speed as a function of the maximum speed and the rotor diameter. This graph suggests that two different classes of turbines can be distinguished with a difference in maximum tip speed: older (smaller) models have approximately 15 m/s lower maximum speed (up to 75 m/s). However, without access to the data used, this cannot be verified.
All in all, this leads to the conclusion that it is not the case that larger turbines make less noise because they are designed that way, but that they cannot make more noise because they would otherwise break down too quickly.
But strongly and rapidly changing sound intensities, LF, infrasound, tonal sound and amplitude modulation remain out of sight and play a negligible role in dB(A) based L den regulation. While it is precisely these aspects of wind turbine noise that make it so much more annoying than comparable traffic or aircraft noise.
Annual Average Noise Production
This paragraph explains how the noise production can be spread out over a period of one year by the grace of the regulations based on L den . That every abrupt change, for example as a result of a change in wind speed or direction, is smoothed out by the method of registration. And because it is not possible to measure the sound intensity 24/7/52, it is only checked afterwards, via a model-based approach, as we also see here in Figure 2 of the article. There are no measurements of the wind speed at 100 or 150 m, not in Den Helder, just as little as in Maastricht. These are calculated values, afterwards, based on measurements at a height of 10 m and converted to these values via a model (Harmony, via KNMI, available on the RVO website). Figure 2 shows the height profile of the average wind speed for Den Helder and Maastricht between 21 and 260 m.
And then, from the wind speed via L wa curves of the individual wind turbines, the noise production over a whole year is calculated. Fig. 2 shows that the average wind speeds at 100 and 150 m for Maastricht and Den Helder are 6; 6.8; 9 and 9.5 m/s respectively. Since the maximum yield is reached around 10 m/s for many wind turbines, it will be clear that the profit that can be achieved by raising a turbine in Den Helder will be small. In Maastricht, on the other hand, this does make sense and increases the yield considerably, because the range from 6 to 6.8 m/s lies in the steep (linear) part of the C t curve. The result of this observation leads to the conclusion that raising most wind turbine models in Den Helder will lead to a small increase in yield, but will also produce more noise. In Maastricht, the picture is very different: raising leads to a significant increase in the annual L den by 2.5 dB(A). However, this picture is distorted due to the lack of data segmentation. The calculations include wind turbines that are not suitable for being raised, and the specifications of which do not assume hub heights of 100 m or more. The use of these turbines leads to a reduction in the noise load in the calculations of the normalised noise load. This is reflected in the small difference in L den and L night in Figure 3 of the situation in Den Helder. If only suitable turbines (with a C t curve that is suitable for wind speeds above 10 m/s) had been used, the difference would have been greater, and approximately half as large as that of Maastricht, as can be seen from Figure 1.
Effect of Sound-Dampening Measures
Here the effects on the sound production of serrations (“owl feathers”) are discussed. The use of owl feathers should reduce the production of tip related sound by limiting the degree of turbulence. The share of higher frequencies (400-1600 Hz) could be reduced by 2.3 dB(A), without affecting the share of lower frequencies. However, from the scientific literature it can be concluded that various effects can occur, depending on the type of serrations , ranging from an increase in the share of LF (<200Hz) sound on the one hand, an increase in the share of high frequency (>2000Hz) sound on the other hand, and in general, changing the loading of wind turbine components, which reduces their lifespan.[4] [5] . And because of the L den metric, the residents will not benefit from this, because the noise reduction will be absorbed by an increased energy production with more noise production. Estimates indicate that each dB(A) noise reduction can increase the production of energy by 5% within the space of 47dB(A) L den , as can be seen in the paragraph on “ noise mode”. It is very simple to limit the noise of a wind turbine by setting a lower maximum power in the SCADA system. No adjustments to the turbine are required for this, it can simply be set via the software. But as the authors indicate, this results in 5% less yield per dB(A) and is therefore not desirable.
Noise Level Among Residents
The noise level for residents as described by the authors is based on ideal conditions. These rarely occur in practice, usually there are varying wind speeds, directions and gusts. Because LF sound measured according to the A-curve yields a much smaller (audible) contribution than the higher frequencies, this sound plays a minor role in the nuisance determination according to the standard. In practice this is often different, especially in the indoor situation. A report for the Maastricht city council [6] includes a number of simulations that indicate how strong interference can occur between reflected LF sound waves in a house. These show that strong local (on a metre scale) differences in intensity can occur, which ensure that the inaudible sound can still exceed the hearing threshold [5]. According to measurements and the Dutch standard there is no exceedance, but the resident thinks differently about this . A recent study in Germany, in which spectral measurements were taken and not via octave or third bands, shows very different patterns for the noise of wind turbines. [7] . In Figure 3 their figure 9a is shown with different color settings to clarify the observed phenomena, provided with an annotation.
Conclusions
The referenced article uses a database with unknown content, so the claims made cannot be verified. The analytical and statistical methods used have not been performed correctly (no data segmentation, everything thrown together), which gives a distorted picture of what is actually happening in the field of wind turbine noise. Because only the tip-related noise has been considered, wind turbine noise is reduced to traffic noise. The specific sounds, which are the reason why wind turbine noise scores so extremely high on the "annoyance" factor, are completely ignored. The analysis of L wa as a function of electrical power is completely off the mark, because there is no reference to the physical limitations of the maximum tip speed. The turbines cannot rotate faster because otherwise the blades will wear out too quickly. This is not because noise must be limited. The same applies to owl feathers. They are only used to increase the yield at the same sound level. And for these applications the L (A) , dB (A) measurement scheme is essential. Everything revolves around optimizing the yield, the well-being of the residents is secondary. This is evident from the remark that the application of the “night mode” leads to a 5% yield loss per dB (A).
The height exercise for Den Helder and Maastricht was not performed correctly. By including turbines in the calculation that are not suitable for mast heights higher than 80m, a very distorted picture of the effect of higher turbines on noise produced is created, it is heavily compressed to lower values. In general, it can be determined that an increase in hub height from 100 to 150 m produces at least 2.5 dB(A) more noise for the same turbine, purely due to the higher wind speed at 150m. On top of that, there is the increase in noise as a result of the larger rotor, as can be seen from the slope of the regression line in Figure 1.
In the current and proposed new guidelines for the Netherlands, LF, infrasound, tonal sound and amplitude modulation are not even mentioned, so they cannot be enforced. No matter how annoying these aspects are experienced by local residents. Spectral measurements provide very easy access to the annoying effects of wind turbines. After a short training ChatGPT is very capable of identifying all problematic sounds in a spectral analysis [6]. In combination with audialization [7], this approach could prevent a lot of misery. It is sad to have to conclude that in the field of audiology there seems to be a 120 year lag behind the current technical possibilities contrasted to the cumbersome, electron tube based equipment of the interbellum and its related data handling by wizards who know how to handle calculations with magical dB values. I have now an App for this
As regards the nuisance experienced by local residents, it can be said that none of the developments discussed by the authors reduce noise pollution, but ultimately only increase it by ensuring that the 47 dB(A ) L will indeed be completely emptied in order to achieve the highest possible return.
References
- Frits van den Berg; Koppen, Erik; Ekelschot-Smink, Madelon, “Noise production of wind turbines on land,” Geluid, vol. 2003, no. 3, pp. 31–34, 2024.
- H. Verhoeven, “Rebuttal to : Sound Power of Onshore Wind Turbines and Its Spectral Distribution” pp. 0–15, 2025. [CrossRef]
- Shankar, Verma; et al. , “A probabilistic long-term framework for site-specific erosion analysis of wind turbine blades: A case study of 31 Dutch sites,” Wind Energy, vol. 24, no. 11, pp. 1315–1336, 2021. [CrossRef]
- FGP Van Den Berg, E. Koppen, J. Boon, and M. Ekelschot-smink, “Development of Sound Power of Onshore Wind Turbines including Its Spectral Distribution” 2024. [CrossRef]
- E. Llorente and D. Ragni, “Trailing-edge serrations effect on the performance of a wind turbine,” Renew. Energy, vol. 147, p. 437–446, 2020. [CrossRef]
- BH Møller, S. Pedersen, and JK Staunstrup, “Assessment of low frequency noise from wind turbines in Maastricht” no. April, p. 26, 2012.
- L. Gaßner et al. , “Joint analysis of resident complaints, meteorological, acoustic, and ground motion data to establish a robust annoyance evaluation of wind turbine emissions,” Renew. Energy , vol. 188, pp. 1072–1093. [CrossRef]
[1] Freely interpreted by the author after “Don Quixote ”, by Miguel de Cervantes (1605). Illustration via ChatGPT . |
[2]A good source for graphs of wind speed, C t and C p versus electrical power can be found at https://en.wind-turbine-models.com/ . |
[4]Described in more detail in reference 2 |
[5]Figure 1, page 6 shows a simulation of sound pressure of a 122 Hz pure tone at 9 heights in a room, entering through a 90 by 90 cm window. The distribution is completely counterintuitive to expectations and much higher than would be expected based on simple calculations. |
[6]Unpublished pilot experiment by the author. Details available upon request. |
[7]Making computer generated sound profiles audible. |
Figure 1.
Maximum tip speed as a function of rotor diameter calculated from the diameter and speed data from Figure 4 [3].
Figure 1.
Maximum tip speed as a function of rotor diameter calculated from the diameter and speed data from Figure 4 [3].
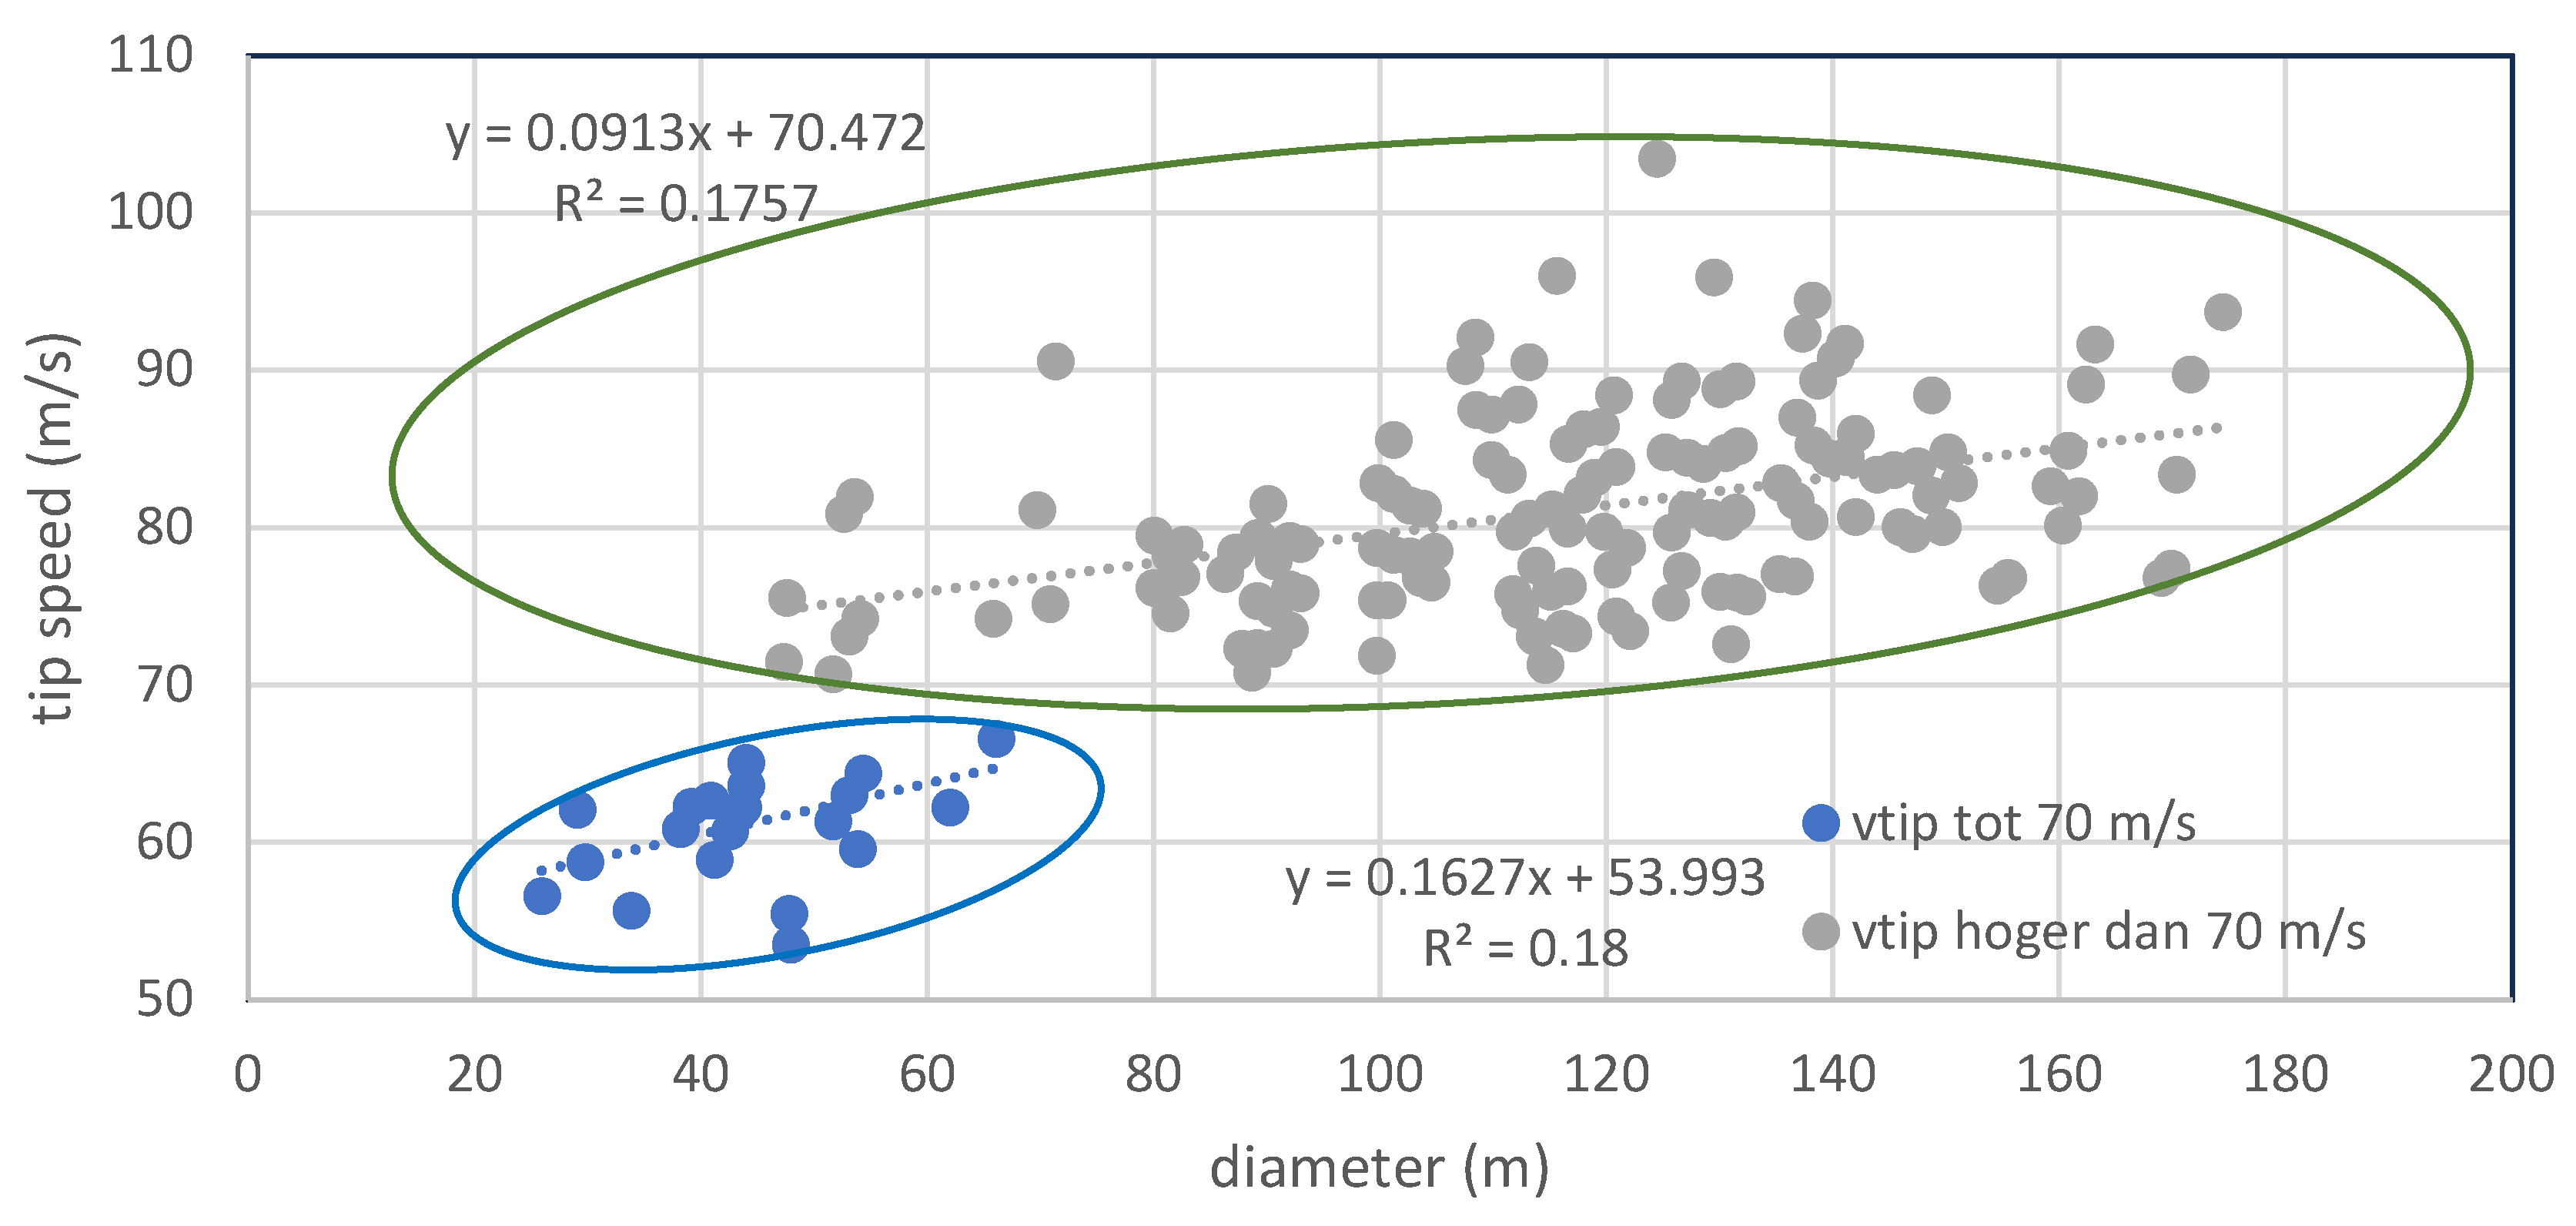
Figure 2.
Wind speed at different heights for Den Helder and Maastricht. (Data from: https://geocontent.rvo.nl/windviewer/#).
Figure 2.
Wind speed at different heights for Den Helder and Maastricht. (Data from: https://geocontent.rvo.nl/windviewer/#).
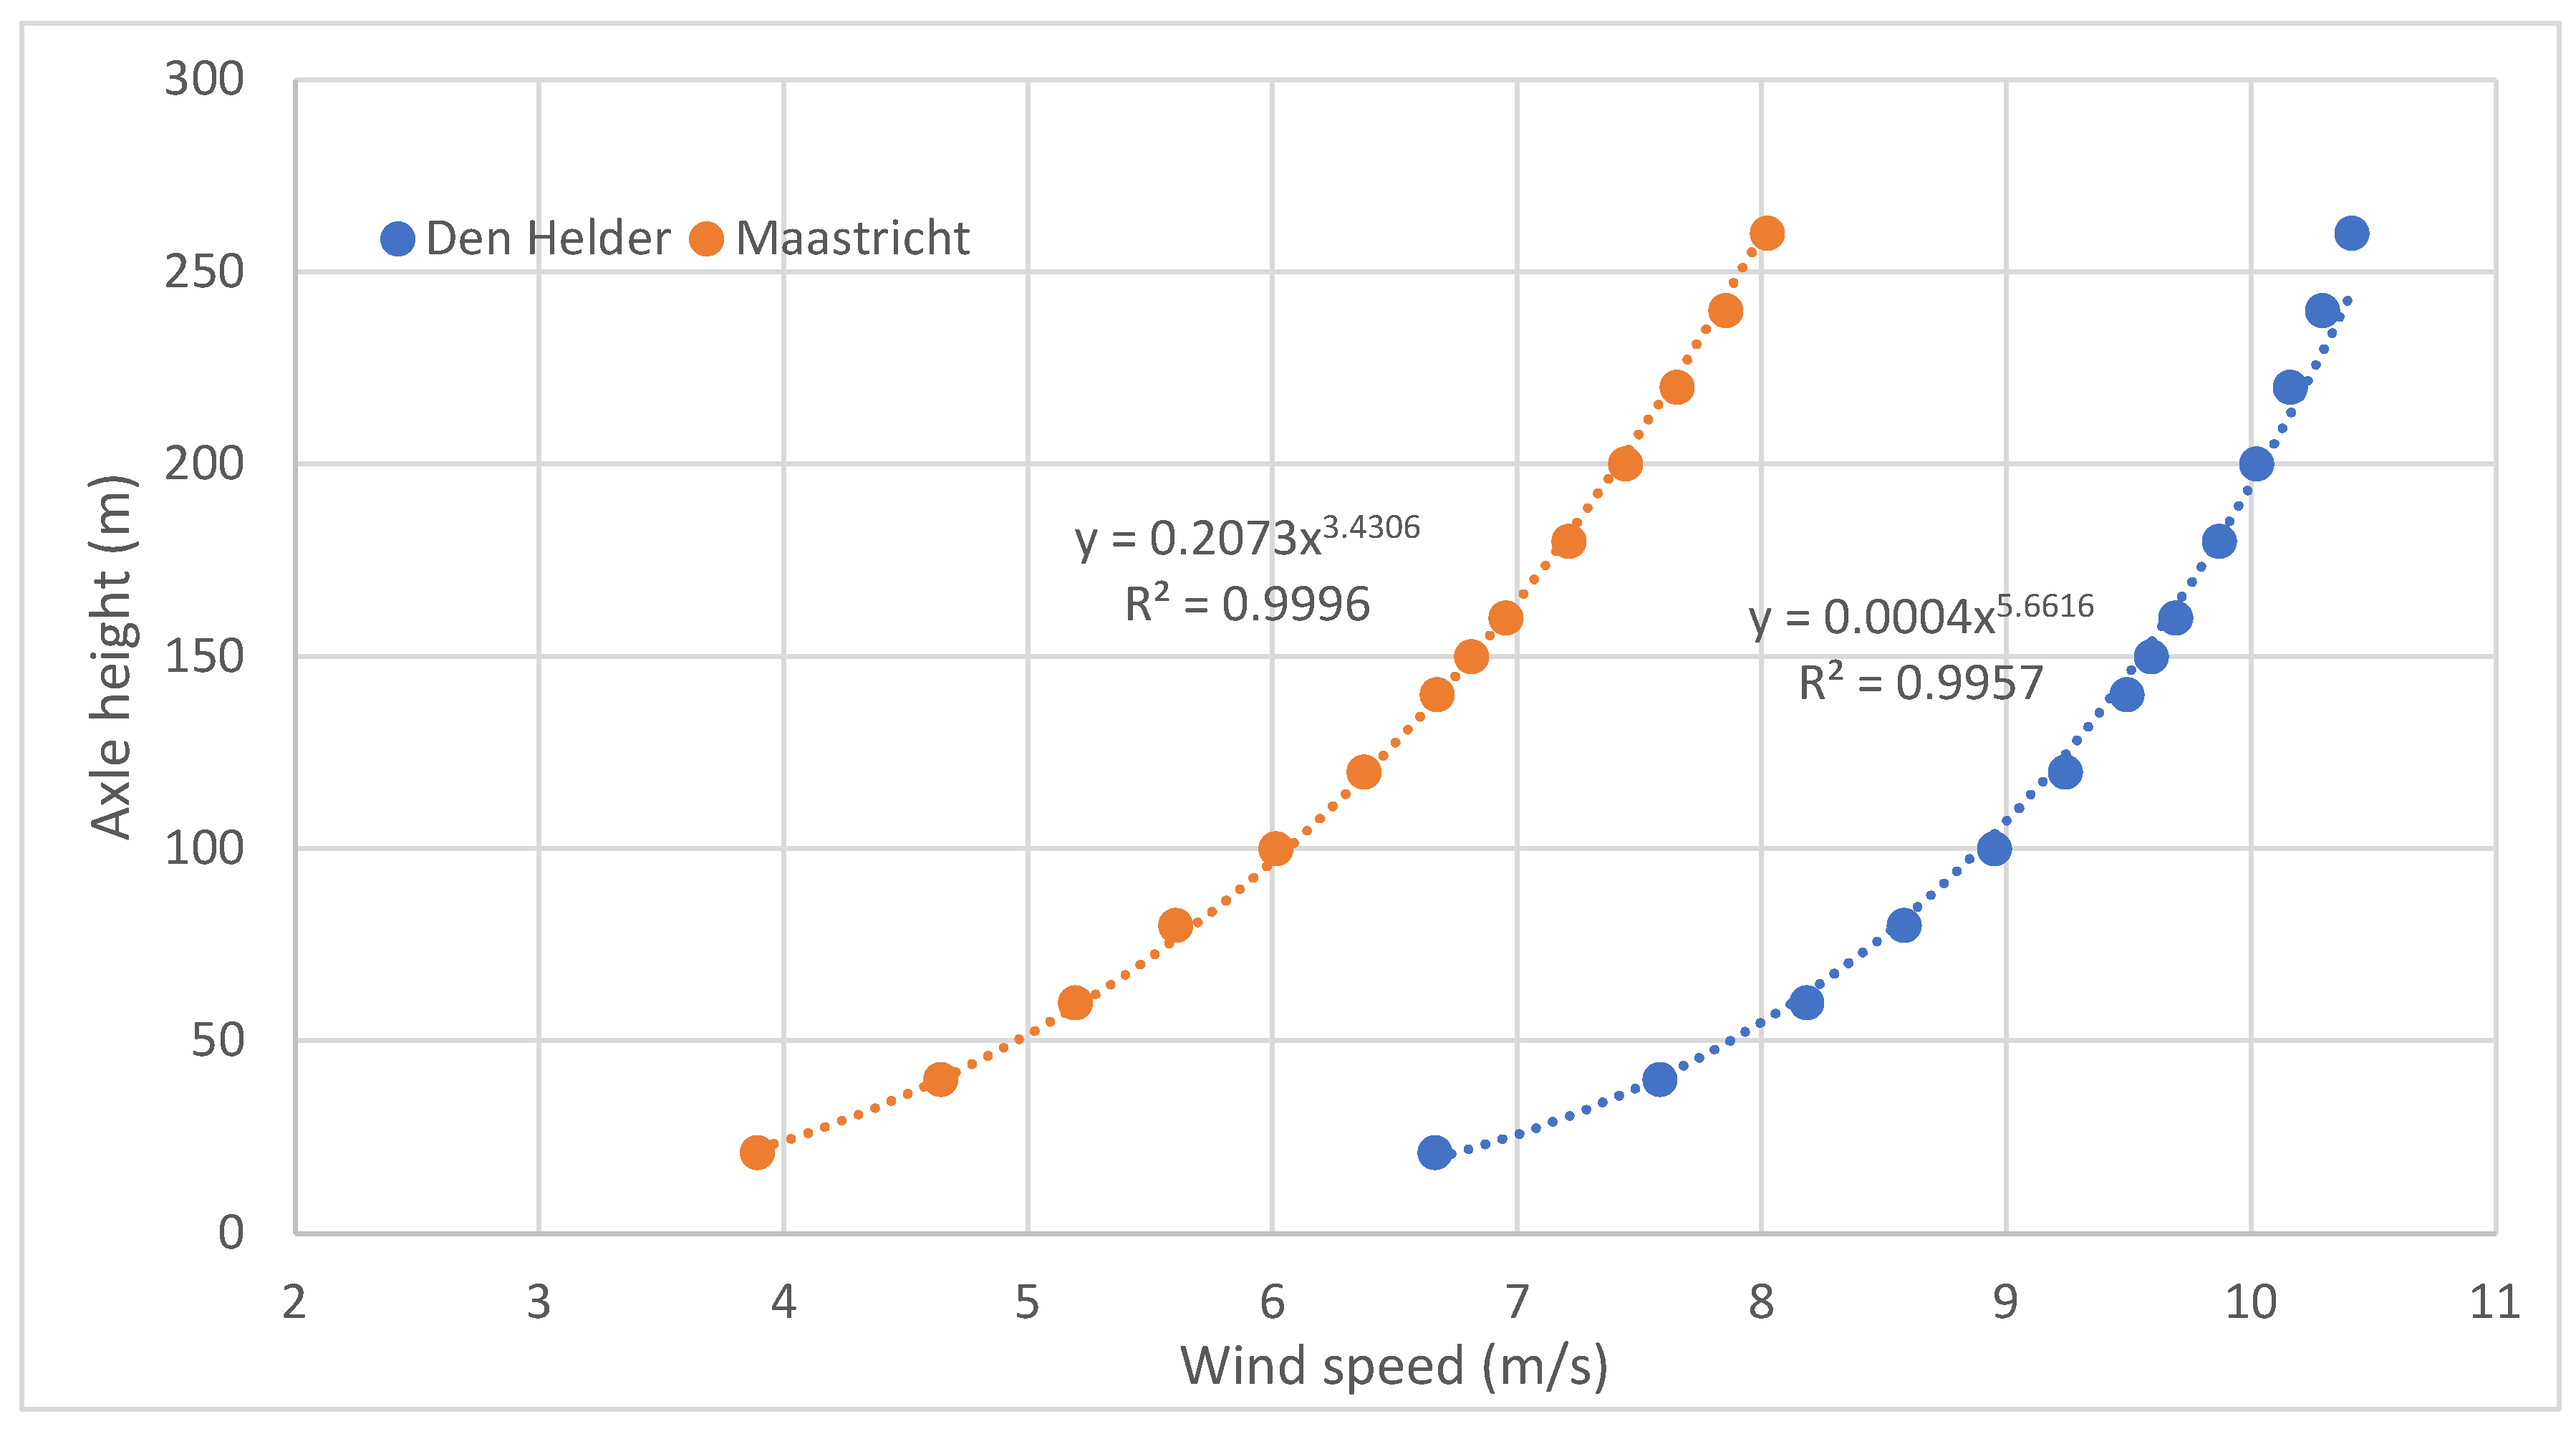
Figure 3.
Annotated spectral analysis with explanation of the sources of the various signals. Clearly visible are the tonal aspects (compressor, fan), the amplitude modulation and the harmonic mixing products. Basic data from [7].
Figure 3.
Annotated spectral analysis with explanation of the sources of the various signals. Clearly visible are the tonal aspects (compressor, fan), the amplitude modulation and the harmonic mixing products. Basic data from [7].
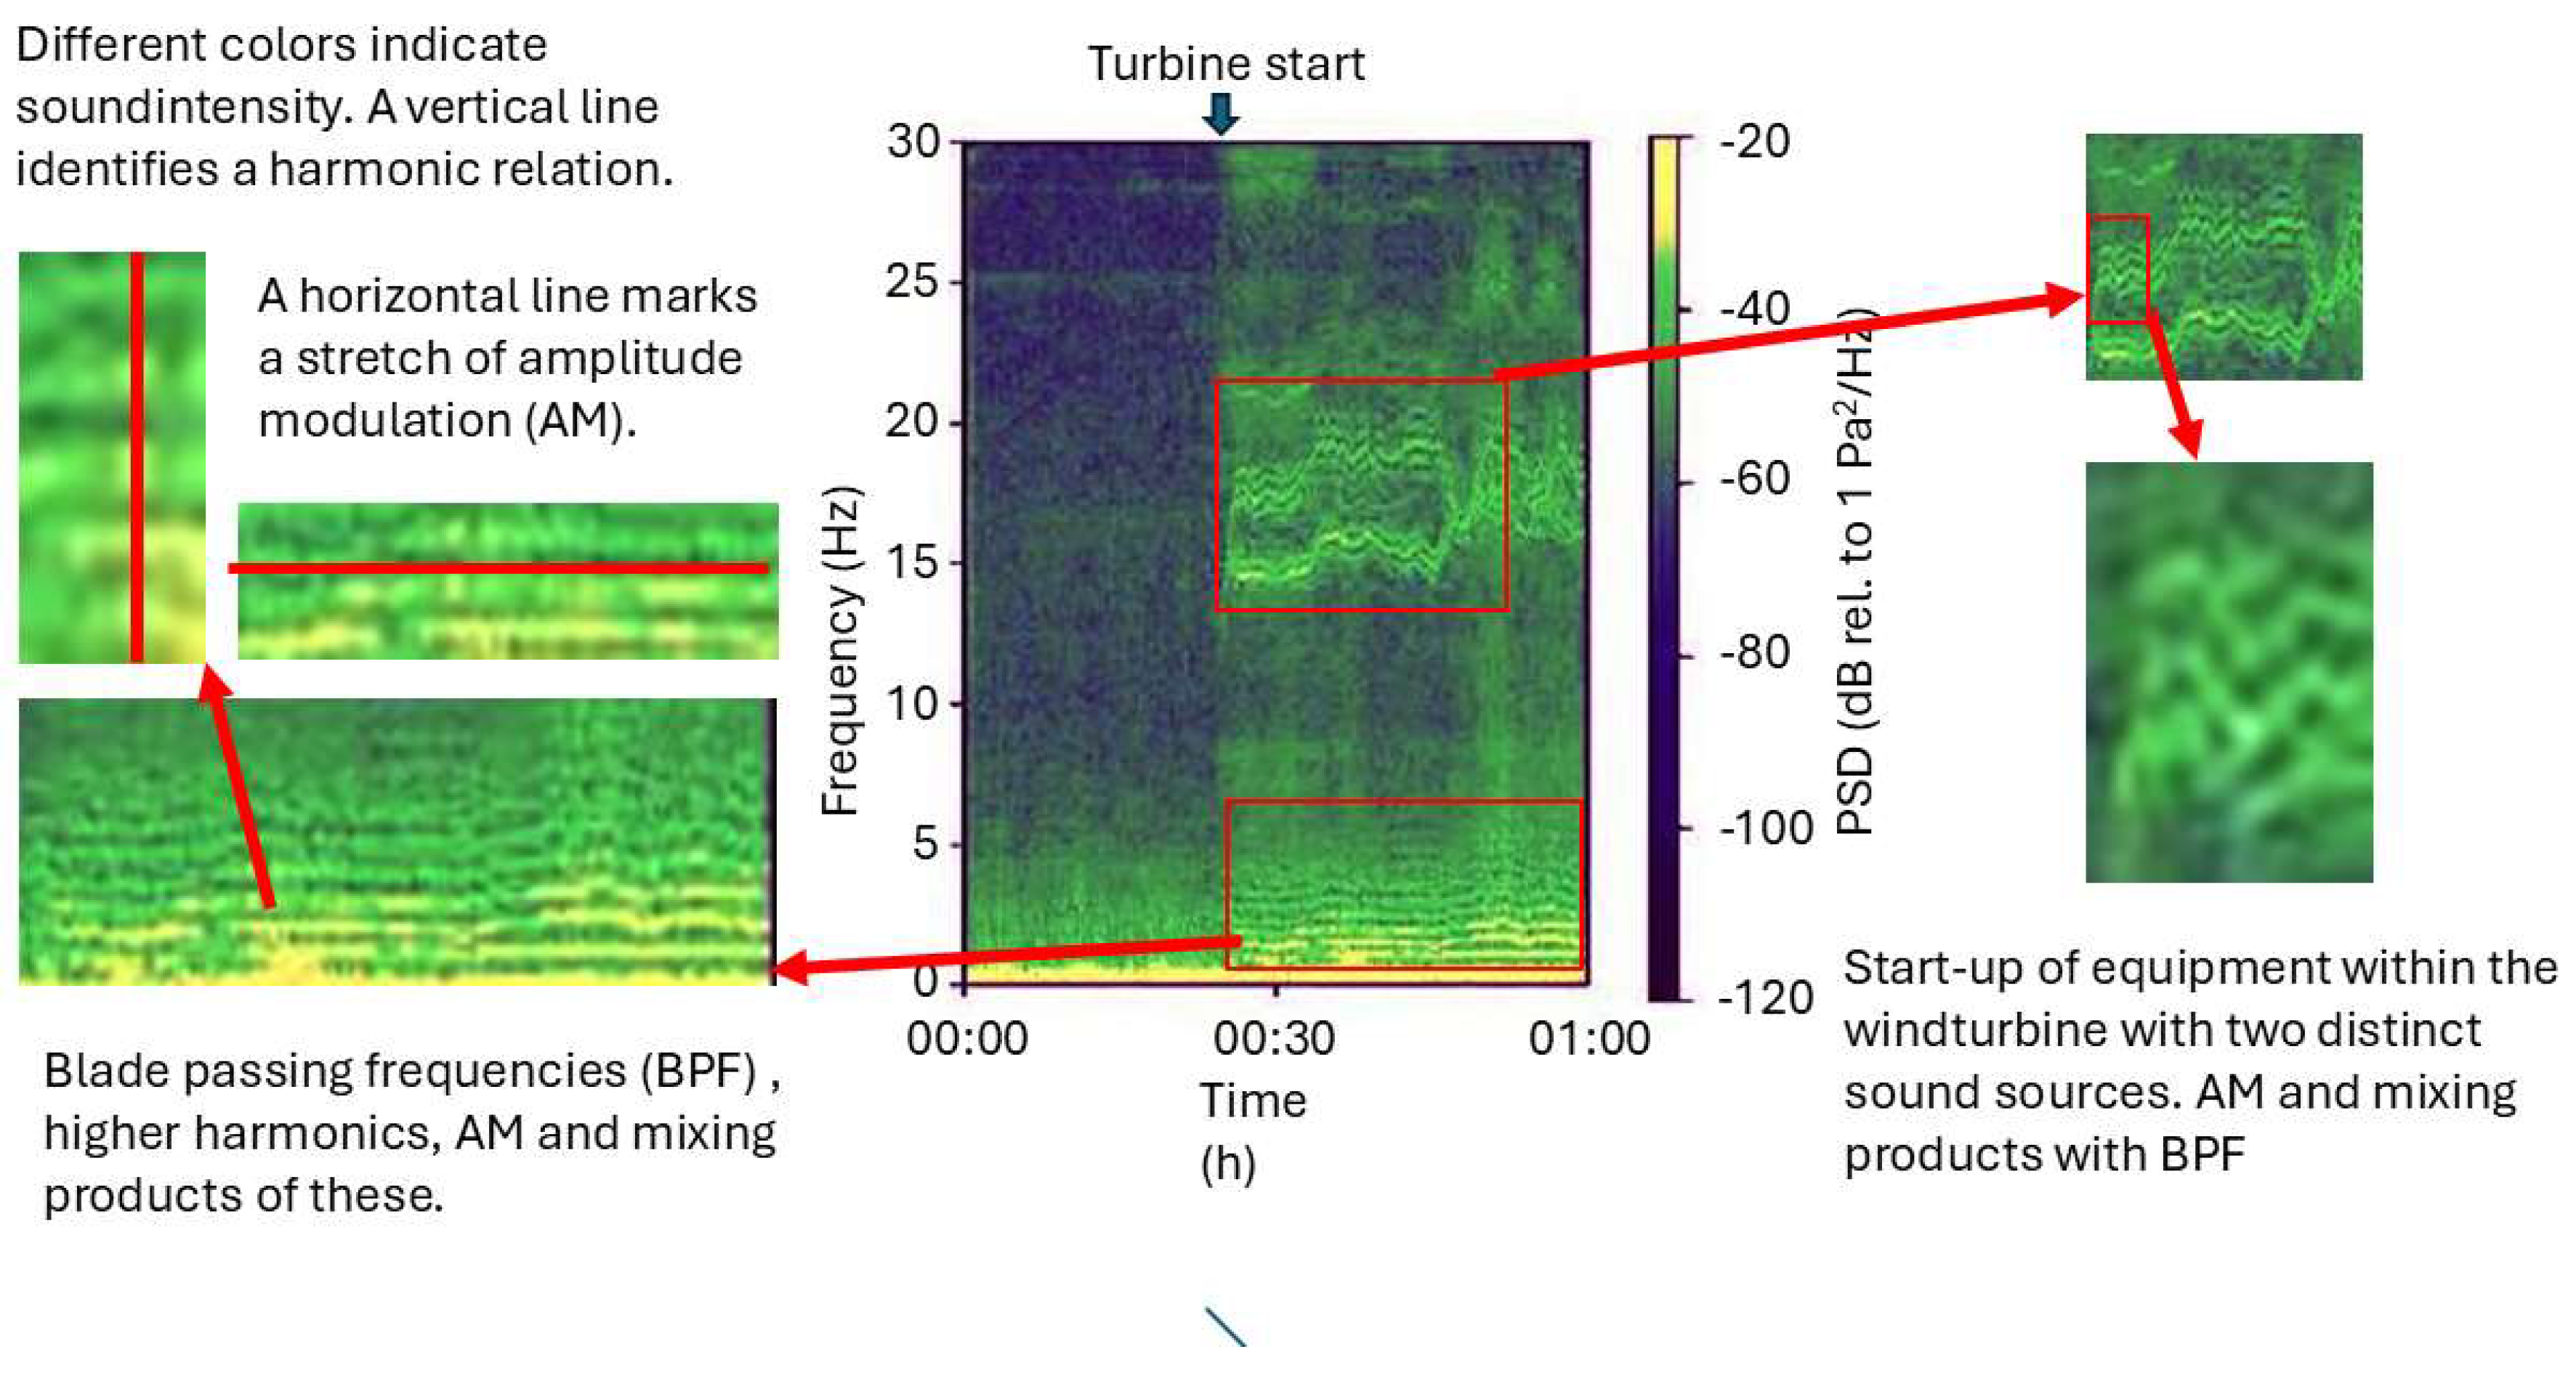

Table 1.
Properties of some offshore wind turbines. The tip speeds are almost identical to those of on-shore models, except for the higher wind speeds at which maximum power is achieved. For off-shore there is no need to limit the noise production. Data from https://en.wind-turbine-models.com/search?q=off+shore .
| wind turbine | power (MW) | diameter (m) | rpm | Vtip (m/s) | cut -in wind speed ( m /s) |
nominal wind speed (m/s) |
| Gamesa G128-5 | 5 | 128 | 12 | 80 | 2 | 14 |
| Vestas V164-8 | 8 | 164 | 12,1 | 104 | 4 | 13 |
| Mingyang 5.5 | 5.5 | 155 | 12 | 97 | 3 | 10 |
| Nordex N90 2.3 | 2,3 | 90 | 17 | 80 | 3 | 12 |
| Senvion 6.2M | 6.2 | 126 | 12,1 | 80 | 3.5 | 14 |
| Siemens 3.6M | 3.6 | 120 | 13 | 82 | 3.5 | 12 |
Disclaimer/Publisher’s Note: The statements, opinions and data contained in all publications are solely those of the individual author(s) and contributor(s) and not of MDPI and/or the editor(s). MDPI and/or the editor(s) disclaim responsibility for any injury to people or property resulting from any ideas, methods, instructions or products referred to in the content. |
© 2025 by the author. Licensee MDPI, Basel, Switzerland. This article is an open access article distributed under the terms and conditions of the Creative Commons Attribution (CC BY) license (https://creativecommons.org/licenses/by/4.0/).
Copyright: This open access article is published under a Creative Commons CC BY 4.0 license, which permit the free download, distribution, and reuse, provided that the author and preprint are cited in any reuse.


