Submitted:
06 April 2025
Posted:
08 April 2025
You are already at the latest version
Abstract
The global energy crisis necessitates sustainable and efficient energy alternatives. Dye-sensitized solar cells (DSSCs) represent a promising solution due to their low cost, flexibility, and environmental friendliness. This study focuses on the fabrication and characterization of nanostructured titanium dioxide (TiO₂) thin films using the sol-gel method, employing titanium (IV) isopropoxide and isopropyl alcohol as precursors. A natural dye derived from hen feathers was used as a renewable and eco-friendly sensitizer. The HFD + TiO₂ thin film was analyzed for their surface morphology, optical, structural and photoelectrical properties. Scanning Electron Microscopy (SEM) revealed a uniform distribution of spherical nanoparticles with average particle size 113.93 nm, while X-ray Diffraction (XRD) confirmed the anatase phase of TiO₂ with a crystallite size of 40.12 nm. Optical studies indicated a reduction in the band gap after dye loading, enhancing light absorption and improving DSSC efficiency. Elemental composition and molecular structure were investigated using X-ray Photoelectron Spectroscopy (XPS), Energy Dispersive X-ray Analysis (EDAX), Fourier Transform Infrared (FTIR) spectroscopy and Nuclear Magnetic Resonance (NMR) spectroscopy. The hen feather dye-sensitized TiO₂ thin films achieved a photovoltaic conversion efficiency of 2.91%, demonstrating effective light harvesting and favorable electron dynamics. This research underscores the potential of bio-derived materials, such as hen feather dye, in advancing sustainable and cost-effective photovoltaic technologies. These findings promote circular economy principles by utilizing waste-derived resources for green energy solutions.
Keywords:
photovoltaic
; sustainable
; hen feathers
; renewable
; eco-friendly sensitizer
1. Introduction:
The production of chicken meat results in the generation of various types of waste, with feathers being one of the most notable examples, according to several authors [1,2,3]. Billions of tons of feathers are produced globally, posing a significant issue as they are waste materials that impact both public health and the environment [4]. Feathers are primarily generated in chicken processing plants and poultry farms, accounting for a substantial source of pollution, as they make up about 5% to 10% of the total weight of the chicken [5]. In Mexico, it was estimated that the total chicken consumption would reach 3,274 million tons in 2018 [6]. This implies that approximately 163.7 to 327.4 million tons of feathers will be produced. Some research into solutions to reduce or eliminate the contamination issue suggests incorporating feathers as a feed supplement, as 95% of their dry weight consists of protein, with 90% being keratin [7]. Over the past two decades, advancements in photovoltaic technologies have led to the emergence of innovative devices known as "emerging photovoltaics." These technologies aim to reduce module costs and expand the applicability of photovoltaics to compete with other energy production systems. Among these new technologies, those utilizing alternative materials that mimic photosynthesis by leveraging the ability of organic dyes to generate electron–hole pairs have attracted significant interest for their potential as viable alternatives to traditional inorganic semiconductor-based devices. A prominent example in this category is dye-sensitized solar cells (DSSCs), with the first official reference appearing in a U.S. patent filed in 1977 [8]. However, it was the work of Professor Michael Gratzel on metal oxide sensitization during the 1980s that laid the foundation for the first efficiently assembled DSSC. This breakthrough, achieved in 1991, involved the innovative use of a nanoscopic titanium dioxide (TiO₂) particle layer combined with a polypyridyl complex of ruthenium as the light-absorbing material [9]. In a DSSC, light is captured by a photosensitizer on a thin layer of nanocrystalline semiconductor (usually TiO₂) at the anode. The photosensitizer transfers an electron to the semiconductor, which moves to the back contact, while the oxidized dye is regenerated by a redox couple at the cathode. The connection between electrodes generates electric current. DSSCs are appealing for their low-cost materials, compatibility with various substrates and printing techniques, and ability to perform well in diffuse light and high temperatures. Unlike conventional photovoltaics, they separate functions like light absorption, charge generation, and transport across different components, allowing for greater optimization based on the Shockley–Queisser limit [10]. Light harvesting is the initial step in the processes that generate power in DSSCs. The wide-bandgap semiconductor TiO₂ is photochemically stable, making it suitable for cathode fabrication; however, its spectral sensitivity is confined to the UV range. Therefore, a light-absorbing sensitizer must be adsorbed onto the semiconductor's surface [11]. DSSC sensitizers must have a broad absorption spectrum, high stability (20-year lifespan), strong semiconductor anchoring, and low toxicity and cost. Recent advances have improved their efficiency and durability [12,13,14].
2. Materials and Method:
The preparation of dye-sensitized solar cells (DSSCs) involved several steps. First, a TiO₂ thin film was prepared on FTO-coated glass using a sol-gel method and sintered in Muffle furnace to form a mesoporous layer (180-210 nm). Next, natural dye was extracted from ground Hen feathers by immersing them in a 1N NaOH solution, followed by filtration and centrifugation to obtain a clear dye solution. The TiO₂ film was soaked in the dye solution overnight and dried to create the dye-sensitized TiO₂ film. Finally, a 0.1 M Na₂SO₄ electrolyte solution was prepared for photovoltaic analysis [15,16,17,18].
3. Result and Discussion:
Characterization Techniques:
3.1 Xrd Analysis:
X-ray diffraction (XRD) in Figure 1 revealed that TiO₂ nanoparticles, after calcination at 500°C, exhibited distinct anatase phase peaks, confirming good crystallinity. The peaks at 2ϴ values of 25.41°, 37.80°, 48.19°, 54.14°, 55.18°, 62.87°, 69.03°, 70.45°, and 75.27° correspond to the anatase TiO₂ phase. The HFD + TiO₂ film showed prominent peaks at (101), (200) and (211), suggesting strong interaction with the HFD matrix while retaining the anatase phase, which enhances its structural and functional properties [19,20].

Table 1.
XRD analysis for HFD + TiO2 films.
| Sample | FWHM Value | Crystallite size (nm) |
Dislocation density (Ꟙ) ( 1014) |
Microstrain ( 10−4) |
|---|---|---|---|---|
| HFD + TiO2 | 0.21424 | 40.12 | 6.24 | 9.03 |
3.2. UV Visible Analysis:
UV-visible spectroscopy analyzed the optical properties of TiO₂ and HFD + TiO₂ thin films in Figure 2. HFD + TiO₂ absorbed in the 200-450 nm range, with a reduced band gap of 2.27 eV compared to 3.21 eV for bare TiO₂. The band gap reduction, confirmed by the Tauc plot, suggests enhanced light absorption due to electronic interactions, making the material more effective for photocatalysis and optoelectronic applications [21].
3.3. Ftir Analys:
FTIR analysisin in Figure 3 confirms Pheomelanin's structure in hen feather dye, with peaks at 546.38 cm⁻¹ (S=O stretching), 1000–1157 cm⁻¹ (C-O stretching), 1157 & 1237–1384 cm⁻¹ (C-N stretching), 1447–1643 cm⁻¹ (aromatic C-H & C=C stretching) and 2855–3419 cm⁻¹ (O-H & aliphatic C-H stretching), indicating sulfur, aromatic, hydroxyl, and polymeric groups. These findings indicate that the hen feather dye contains sulfur, aromatic, hydroxyl, and polymeric groups, supporting its classification as a pheomelanin-based pigment with potential applications in sustainable and natural dye formulations [22,23].
3.4. NMR Analysis:
3.5. SEM Analysis:
The morphology of HFD + TiO₂ thin film synthesized via the sol-gel method was analyzed using SEM. Figure 5 low and high magnified images reveal that calcined HFD + TiO₂ thin film (500°C, 1 hour) exhibits predominantly spherical, non-uniform particles that form aggregates. The estimated average particle size of HFD + TiO₂ thin film is approximately 113.93 nm. The nanostructured morphology may enhance photocatalysis, adhesion, and applications in coatings, sensors, or dye adsorption [25].
3.6. EDAX Analysis:
The EDAX analysis in Figure 6 identifies elements in HFD + TiO₂ thin film by measuring the kinetic energy of emitted electrons from specified SEM points.The respective kinetic energy for oxygen O and titanium atoms are 0.525 keV and 4.508 keV. Thus, the EDAX spectrum of titanium oxide nanoparticles indicates the presence of oxygen and titanium atoms and it also confirms that the produced nanoparticles in the photoanode films are TiO2. From the data in Table of HFD+TiO2, it is seen that, the mass percentage of HFD+TiO2 obtained from EDAX analysis are 4% C, 0.28% N, 52.68% O, 0.94% S and 42.11% Ti. The atom percentages are 7.31% C, 0.44% N, 72.3% O, 0.64% S and 19.3% Ti. Thus, it is clear that the produced nano sized particles are TiO2. EDAX analysis confirms the presence of TiO₂ nanoparticles in the HFD + TiO₂ thin film, with oxygen (52.68%) and titanium (42.11%) as major elements. The detected carbon, nitrogen, and sulfur suggest HFD incorporation, potentially modifying surface properties. This functionalization may enhance photocatalysis, dye adsorption, or charge transfer in applications like DSSCs [26].
3.7. AFM Analysis:
Bare TiO₂ has low RMS roughness, smaller grain size, and lower dye-loading efficiency, limiting DSSC performance. In contrast, HFD + TiO₂ in Figure 7 has higher RMS roughness, larger grain size, and a rougher surface, enhancing dye loading, light absorption, photocurrent, efficiency, and stability [27].
3.8. XPS Analysis:
XPS analysis was conducted to validate the electronic states of elements and their binding energies. Figure 8 shows the survey scan of HFD + TiO₂, highlighting key elemental peaks. The C1s peak appears at 288.86 eV (Figure 8a), while the N1s peak is observed at 403.63 eV (Figure 8b). The O1s peak, located at 534.0 eV (Figure 8c), contributes to enhancing the photocatalytic activity of the semiconductor oxide. The S 2p spectrum (Figure 8d) displays two peaks at 157.99 eV and 159.02 eV, corresponding to S 2p₁/₂ and S 2p₃/₂, with an energy separation of 1.03 eV, aligning with standard S 2p binding energies. Similarly, the Ti 2p spectrum (Figure 8e) features peaks at 462.47 eV and 468.44 eV, attributed to Ti 2p₃/₂ and Ti 2p₁/₂, confirming the presence of Ti⁴⁺ in TiO₂, with a separation of 5.97 eV, consistent with standard Ti 2p binding energies [28].
3.9. PEC Analysis:
The study assessed the efficiency of dye-sensitized solar cells (DSSCs) using natural dye Pheomelanin's extracted from Hen Feathers as a sensitizer from Figure 10 shown in Table 2. TiO₂ nanocrystalline thin film was prepared using the sol-gel method. HFD + TiO₂ achieved an efficiency of 2.91% with a short-circuit current density (JSC) of 1.7 mA/cm² and an open-circuit voltage (VOC) of 421.78 mV. The improved efficiency of the HFD + TiO₂ DSSCs is attributed to the unique composition of the extracted dye, containing the pigment Pheomelanin's, which enhances light absorption and energy conversion [30].
4. Conclusion:
Pheomelanin, a dye derived from hen feathers, exhibits strong potential as a natural sensitizer for environmentally friendly and cost-effective dye-sensitized solar cells (DSSCs). A flexible and low-cost DSSC incorporating TiO₂, natural dyes, and a Na₂SO₄ electrolyte achieved an efficiency of 2.91%. The excellent photocatalytic properties of TiO₂ enhance its suitability for large-scale, sustainable DSSC manufacturing, making it promising for future industrial applications.
Acknowledgement
We express our sincere gratitude to Smt. K. R. P. Kanya Mahavidyalaya, Islampur, for providing access to the research center. We also appreciate Shivaji University, Kolhapur, for facilitating our research through the CFC. Furthermore, we are grateful to BARTI, Pune, for supporting our work with the BANRF research fellowship.
Conflict of Interest
The authors declare that they have no known competing financial interests or personal relationships that could have appeared to influence the work reported in this paper.
References
- Fakhfakh, N.; Ktari, N.; Haddar, A.; et al. Process Biochem. 2011, 46, 1731–1737. [CrossRef]
- Kumar, E.V.; Srijana, M.; Chaitanya, K.; et al. Biodegradation of poultry feathers by a novel bacterial isolate Bacillus altitudinis GVC11. Indian J Biotechnol. 2011, 10, 502–507. [Google Scholar]
- Zaghloul, T.I.; Embaby, A.M.; Elmahdy, A.R. Biodegradation of chicken feathers waste directed by Bacillus subtilis recombinant cells: Scaling up in a laboratory scale fermentor. Bioresour Technol. 2011, 102, 2387–2393. [Google Scholar] [CrossRef]
- Mazotto, A.M.; Ascheri, J.L.R.; de Oliveira Godoy, R.L.; et al. Production of feather protein hydrolyzed by B. subtilis AMR and its application in a blend with cornmeal by extrusion. LWT-Food Sci Technol. 2017, 84, 701–709. [Google Scholar] [CrossRef]
- Agrahari, S.; Wadhwa, N. Int J Poult Sci. 2010, 9, 482–489. [CrossRef]
- SAGARPA. Secretaria de Agricultura, ganaderia, desarrollo rural, pescay aliment ac ión. Escenario base: Proyecciones para el sector Agropecuario de México. Mexico DF 2009, 51–53.
- Kowalska, T.; Bohacz, J. Dynamics of growth and succession of bacterial and fungal communities during composting of feather waste. Bioresour Technol. 2010, 101, 1268–1276. [Google Scholar] [CrossRef] [PubMed]
- Skotheim, T. Dye sensitized solar-cells US patent 4190950, 1980.
- Regan, B.; Gratzel, M. Nature 1991, 353, 737–740. [CrossRef]
- Shockley, W.; Queisser, H.J. Detailed balance limit of efficiency of p–n junction solar cells. J Appl Phys. 1961, 32, 510–519. [Google Scholar] [CrossRef]
- Kelly, C.A.; Meyer, G.J. Excited state processes at sensitized nanocrystalline thin film semiconductor interfaces. Coord Chem Rev. 2001, 211, 295–315. [Google Scholar] [CrossRef]
- Hagfeldt, A.; Boschloo, G.; Sun, L.; Kloo, L.; Pettersson, H. Dye-sensitized solar cells. Chem Rev. 2010, 110, 6595–6663. [Google Scholar] [CrossRef] [PubMed]
- Mishra, A.; Fischer, M.K.R.; Bauerle, P. Metal-free organic dyes for dye-sensitized solar cells: from structure: property relationships to design rules. Angew Chem Int Ed. 2009, 48, 2474–2499. [Google Scholar] [CrossRef]
- Narayan, M.R. Review: dye sensitized solar cells based on natural photo- sensitizers. Renew Sustain Energy Rev. 2012, 16, 208–215. [Google Scholar]
- Kumar, A.; Saha, A.; Kumar, S. Journal of Polymer Research 2021, 16, 441. [CrossRef]
- Oladele, I.O.; Okoro, A.M.; Omotoyinbo, J.A.; Khoathane, M.C. Journal of Taibah University for Science 2018, 12, 56–63. [CrossRef]
- Soni, K.; Sheikh, A.; Jain, V.; Lakshmi, N. Materials Science and Engineering 2021, 1187, 012005.
- Cano-Casanova, L.; Anson-Casaos, A.; Hernandez-Ferrer, J.; Benito, A.M.; Maser, W.K.; Garro, N.; Lillo-Rodenas, M.A.; et al. ACS Appl. Nano Material 2022, 5, 12527–12539. [CrossRef]
- Metwally, R.A.; El, Nady; Ebrahim, S.; et al. Microb Cell Fact. 2023, 22, 78. [CrossRef]
- Gokilamani, N.; et al. Materials in electronics 2013, 24, 3394. [CrossRef]
- Al-Taweel, S.S.; Saud, H.R. Journal of Chemical and Pharmaceutical Research; 2016; 8, pp. 620–626.
- Sun, P.; Liu, Z.-T.; Liu, Z.-W. Journal of Hazardous Materials 2009, 170, 786–790. [CrossRef]
- Bayram, S. Production, purification, and characterization of Streptomyces sp. strain MPPS2 extracellular pyomelanin pigment. Archives of Microbiology 2021, 203, 4419–4426. [Google Scholar] [CrossRef] [PubMed]
- Castrejon-Sanchez, V.H.; Lopez, R.; Ramon-Gonzalez, M.; Enriquez-Perez, A.; Camacho-Lopez, M.; Villa-Sánchez, G. Crystals 2019, 9, 22. [CrossRef]
- Sahdan, M. Advances in Materials Physics and Chemistry 2012, 2, 16–20. [CrossRef]
- Sarathi, R.; Meenakshi Sundar, S.J. Water Environ. Nanotechnol. 2022, 7, 252–266.
- Pawar, R.A.; Dubal, D.P.; Kite, S.V.; Garadkar, K.M.; Bhuse, V.M. J. Mater Sci: Mater Electron 2021, 32, 19676–19687.
- Gaur, B.; Mittal, J.; Shah, S.A.A.; Mittal, A.; Baker, R.T. Sequestration of an Azo Dye by a Potential Biosorbent: Characterization of Biosorbent, Adsorption Isotherm and Adsorption Kinetic Studies. Molecules 2024, 29, 2387. [Google Scholar] [CrossRef]
- Solano, F. Melanins: Skin Pigments and Much More-Types, Structural Models, Biological Functions, and Formation Routes. New Journal of Science 2014, 498276. [Google Scholar] [CrossRef]
- Tripathi, M.; Upadhya, R.; Pandey, A. Novel Dye Based Photoelectrode for Improvement of Solar Cell Conversion Efficiency. Applied Solar Energy 2013, 49, 54–57. [Google Scholar] [CrossRef]
Figure 1.
XRD analysis of HFD + TiO2 thin film.
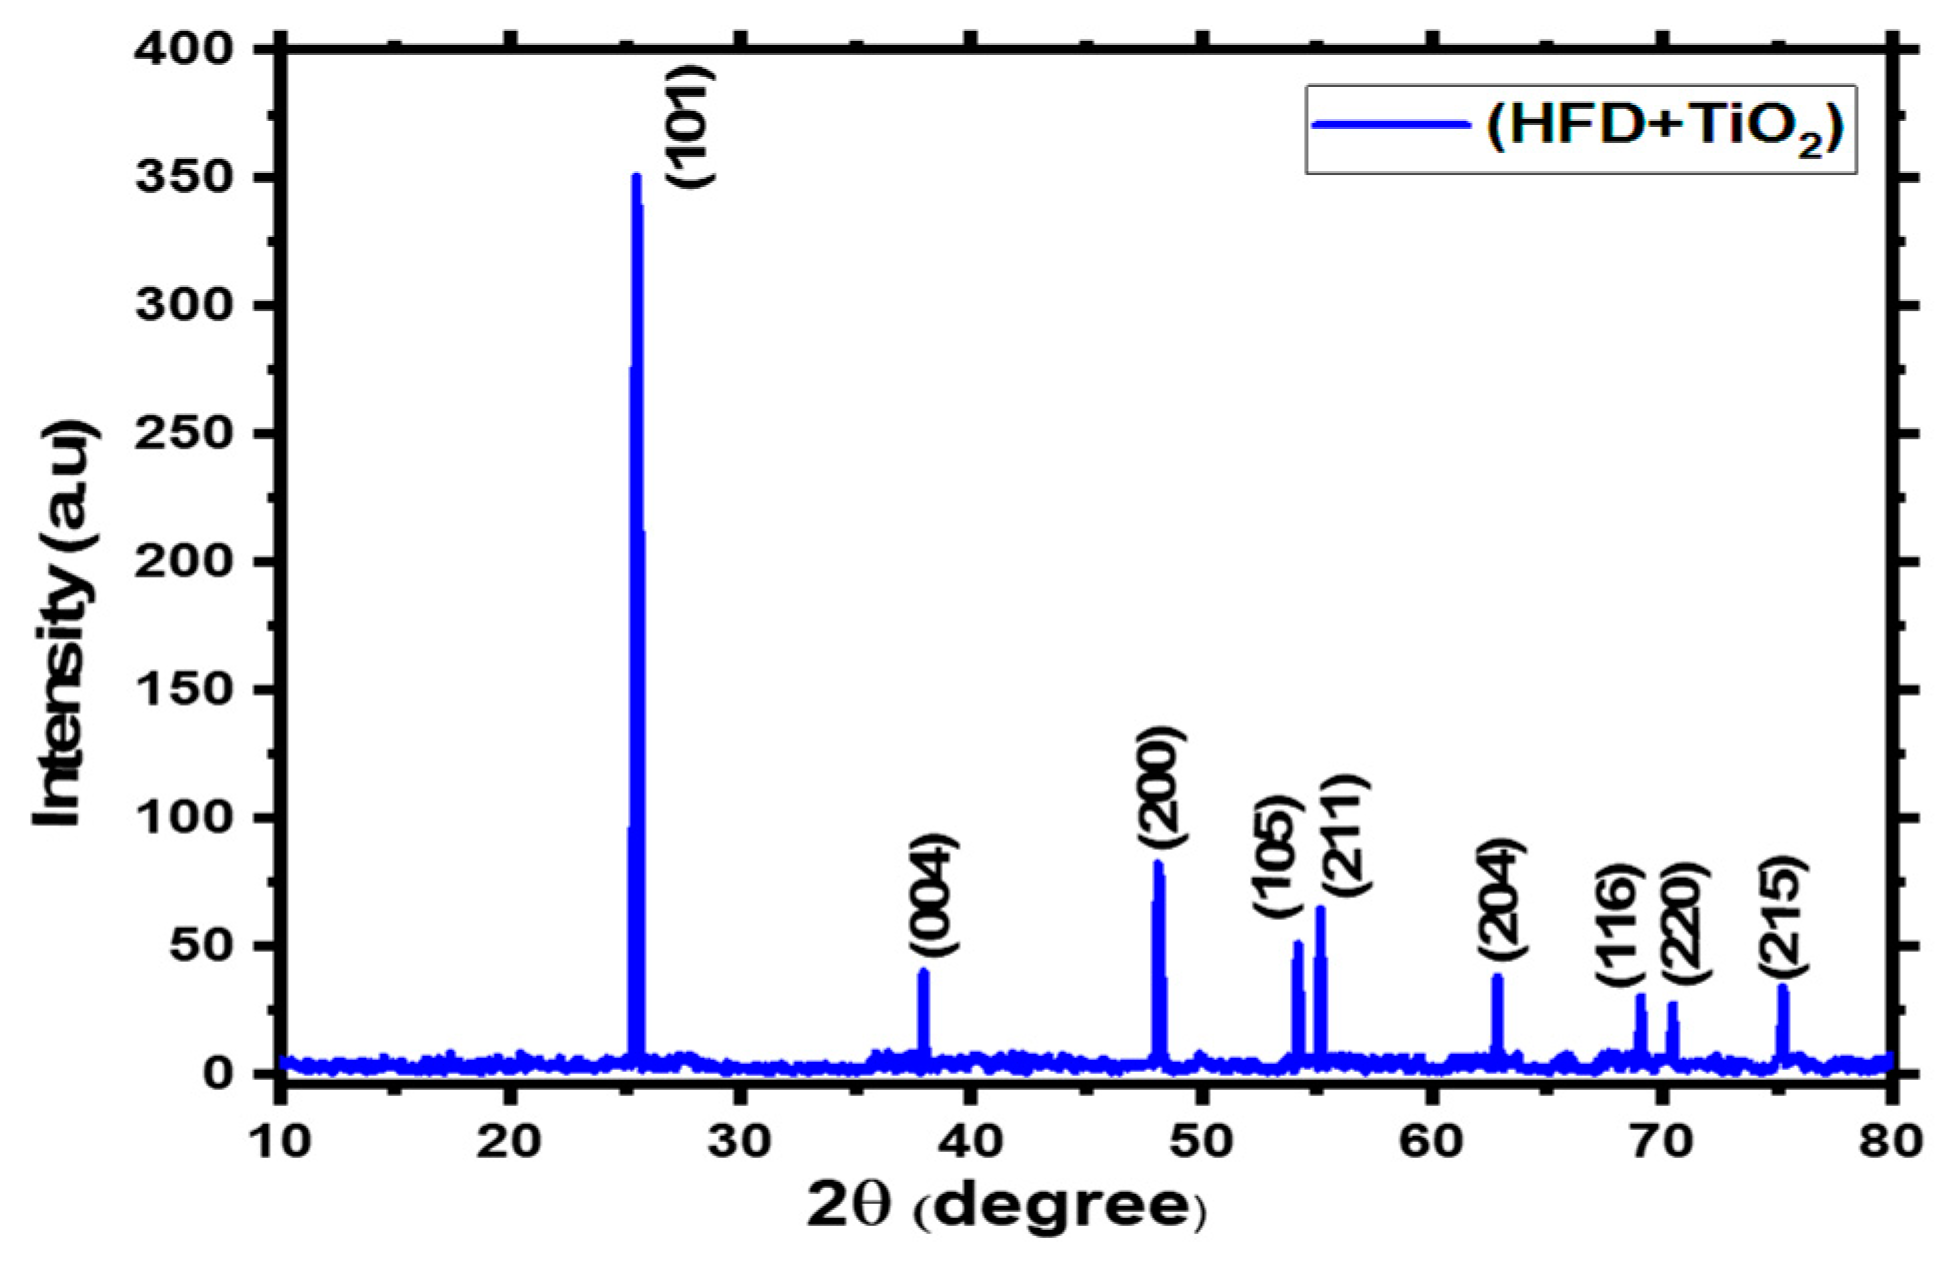
Figure 2.
UV spectrophotometric analysis (a) Absorbance and (b) Tauc plot of HFD + TiO2 thin film.
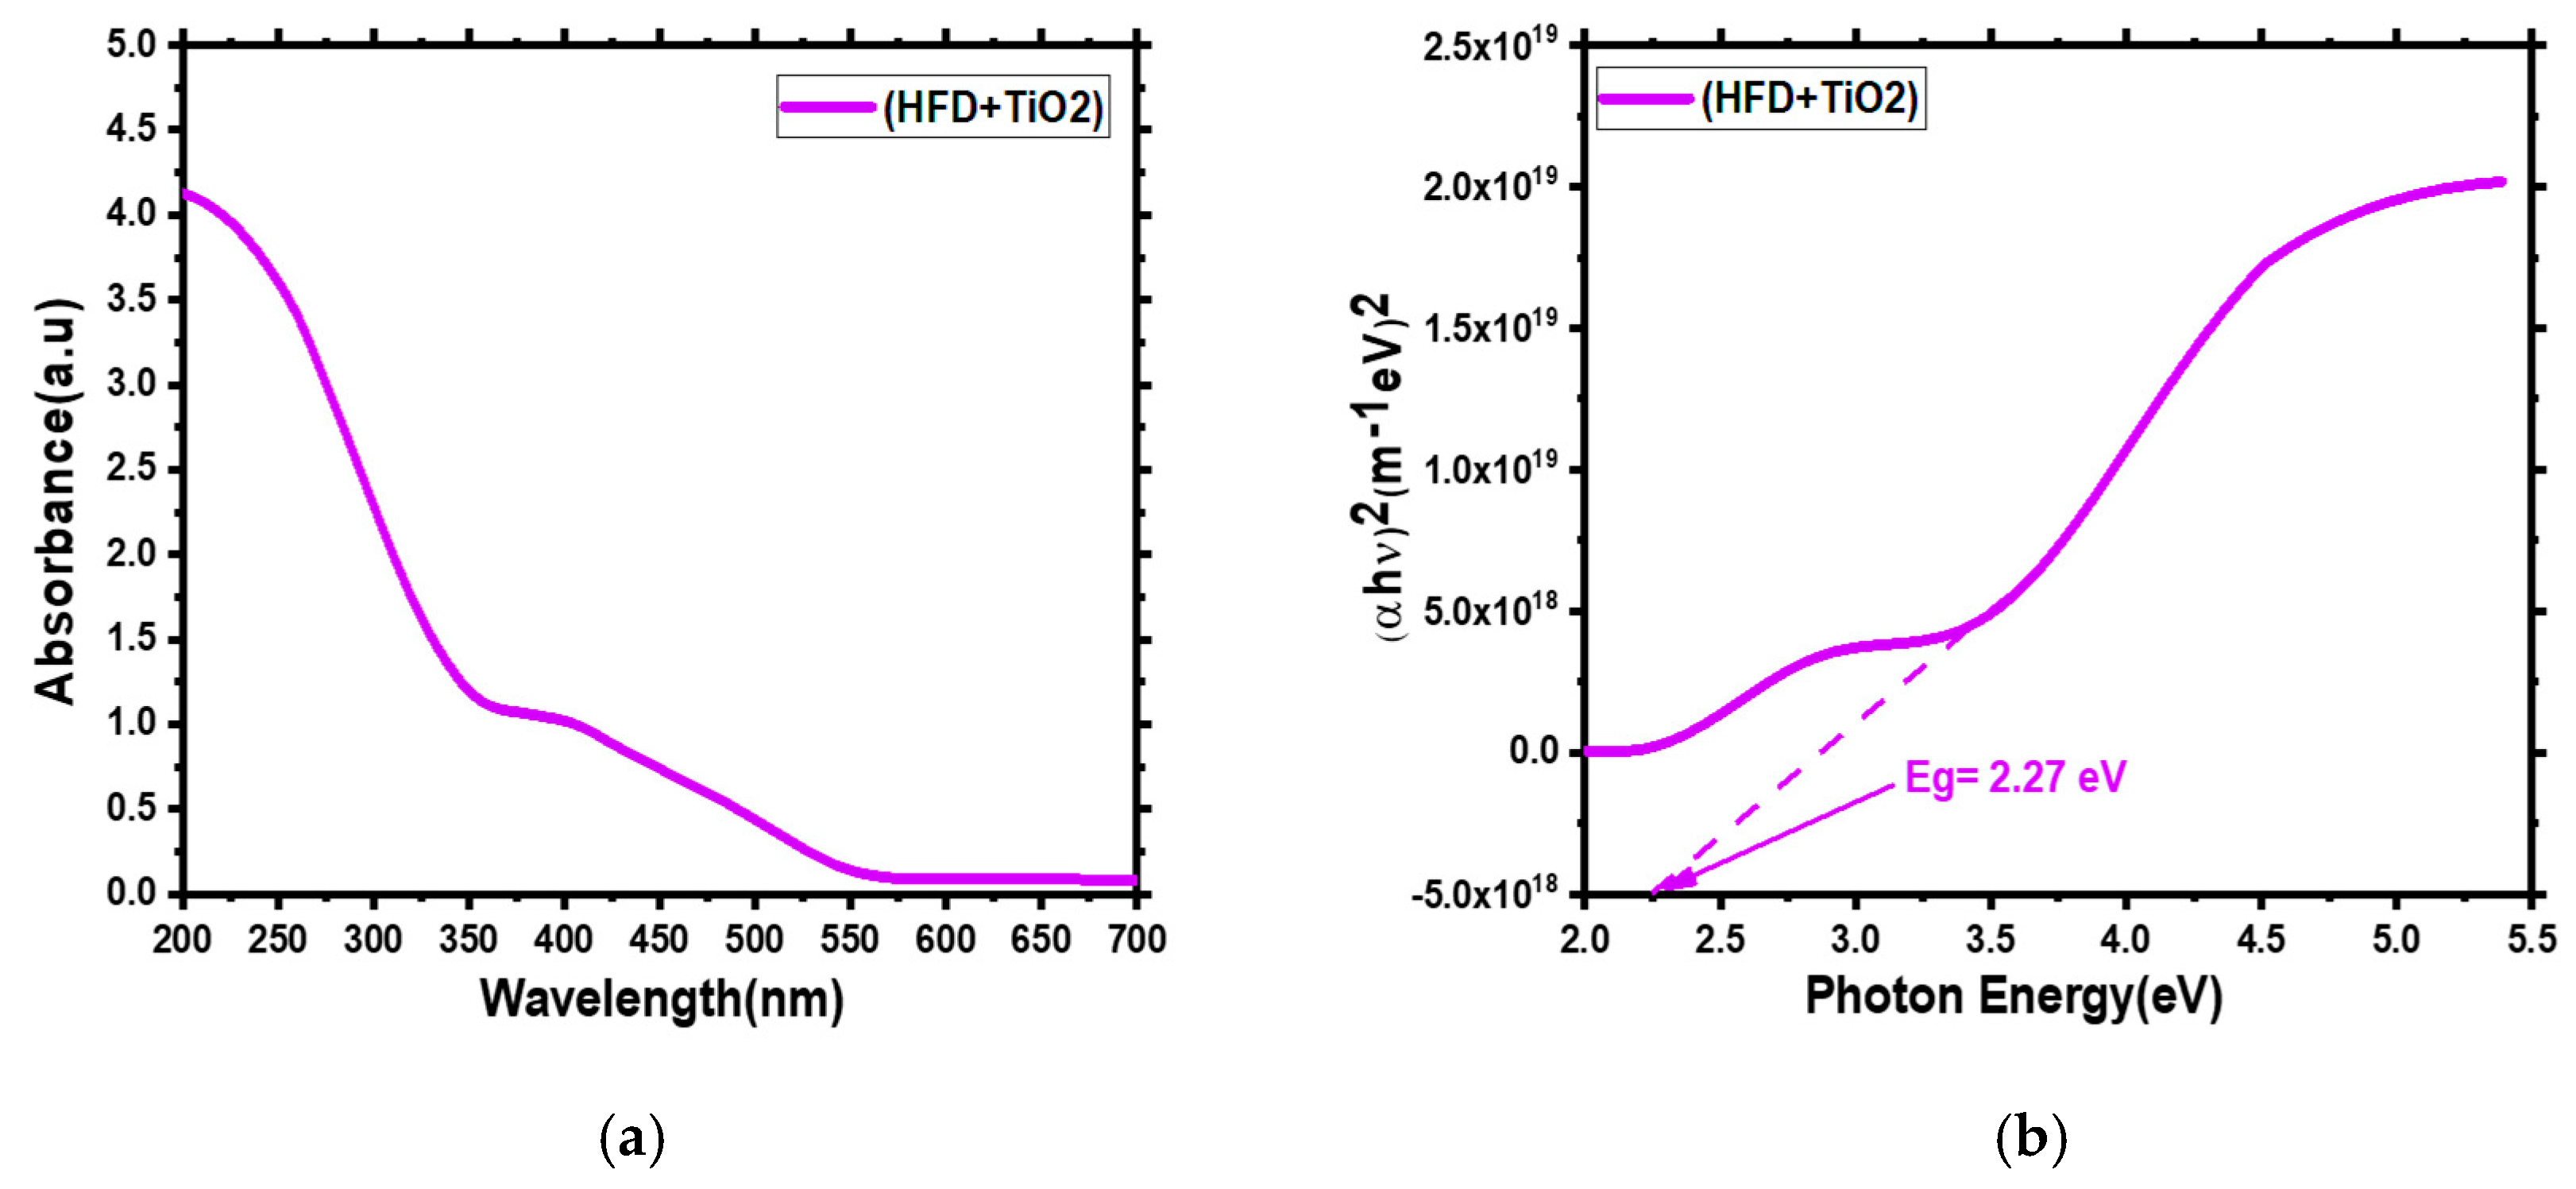
Figure 3.
FTIR spectrophotometric analysis of HFD + TiO2 thin film.
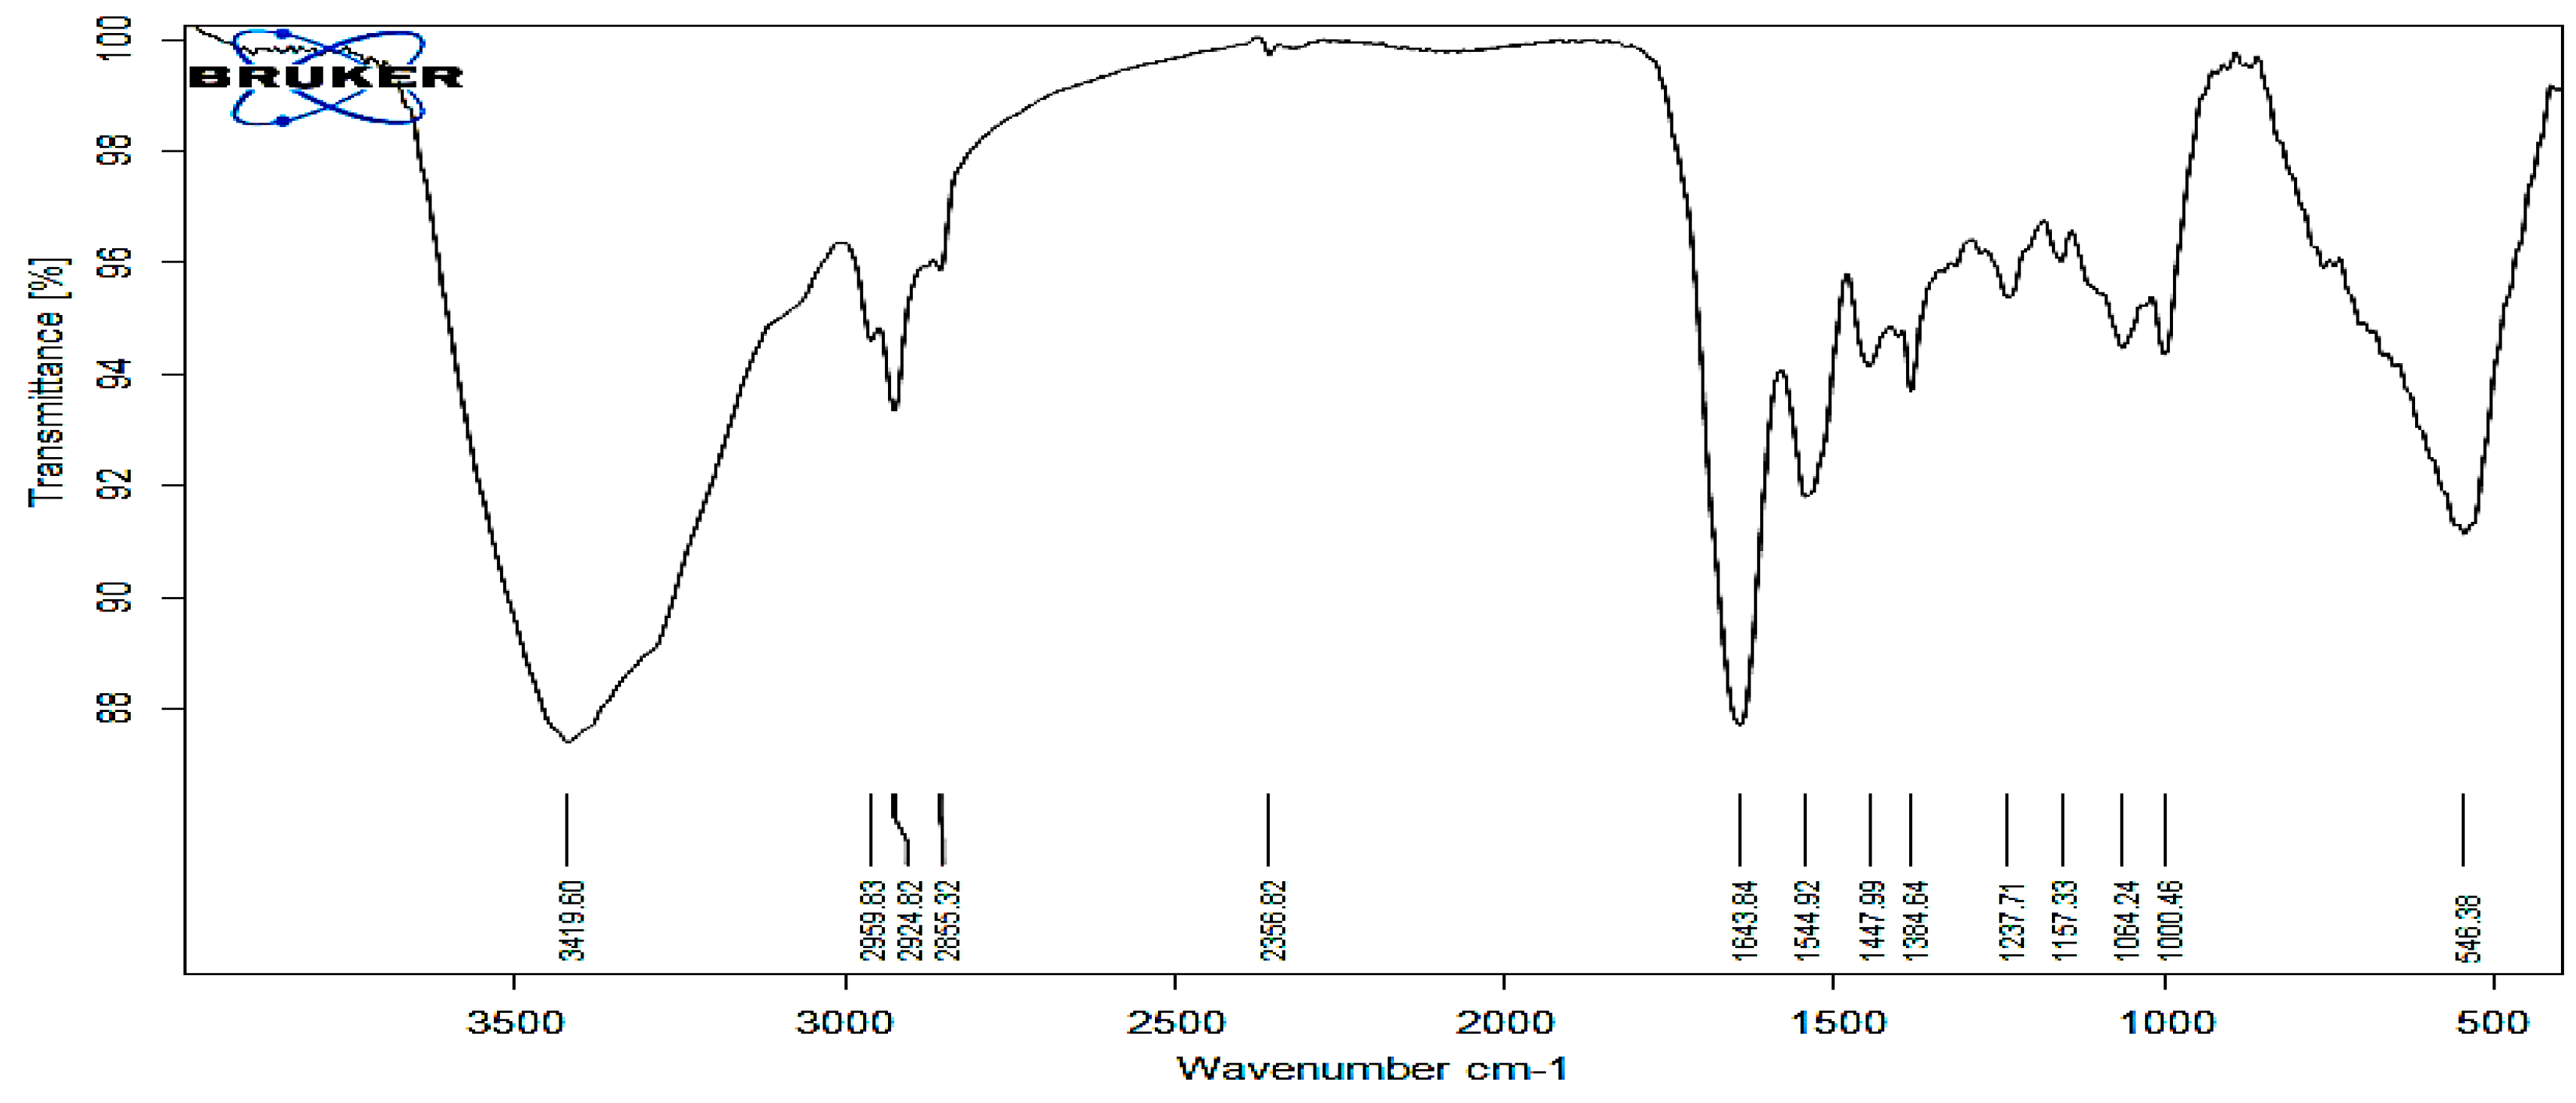
Figure 4.
NMR spectrophotometric analysis of HFD + TiO2 thin film.
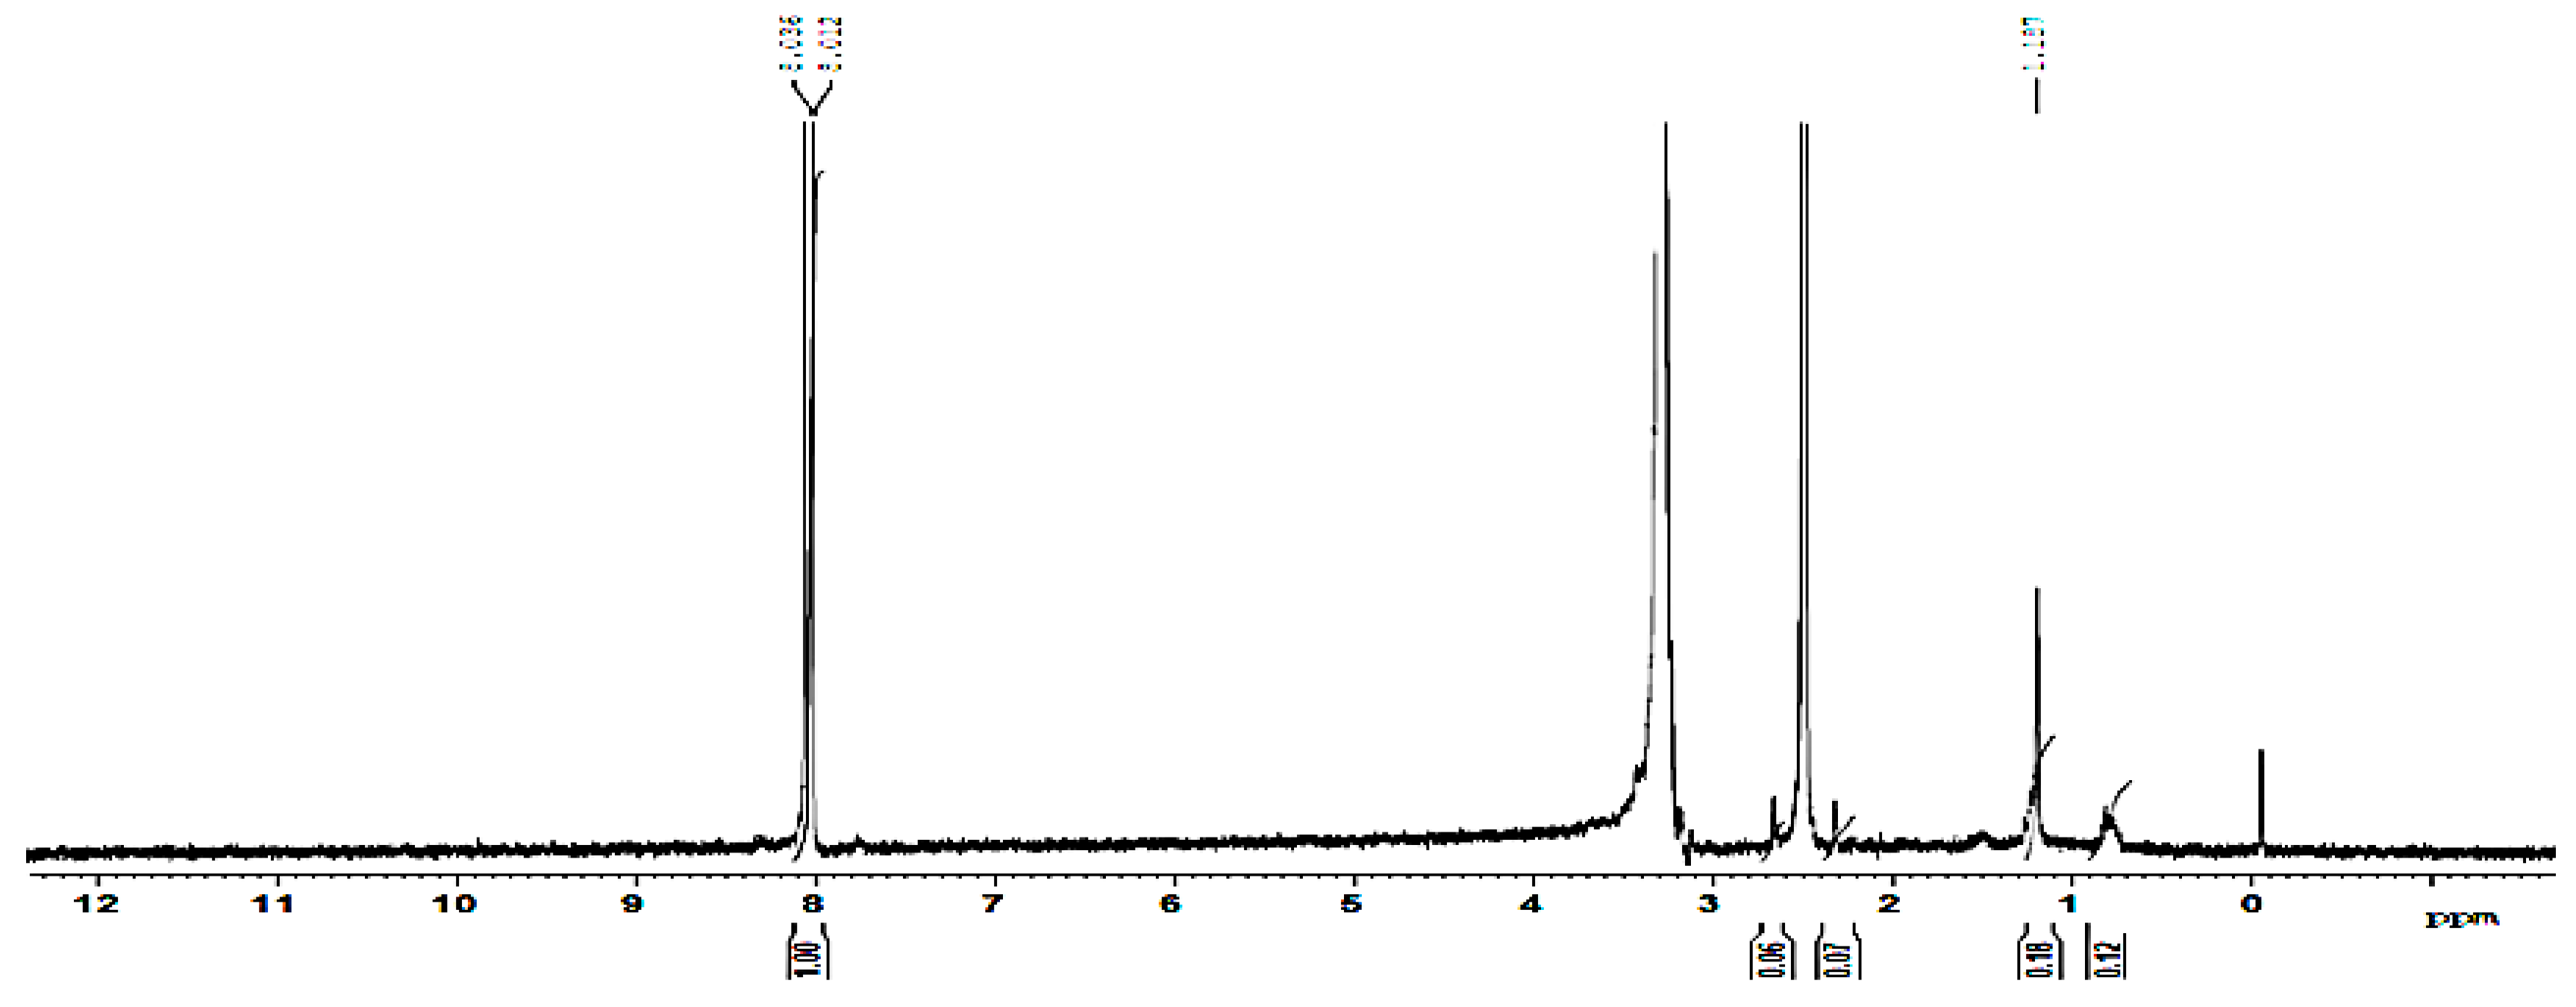
Figure 5.
SEM analysis of HFD+TiO2 thin film at low and high magnification.
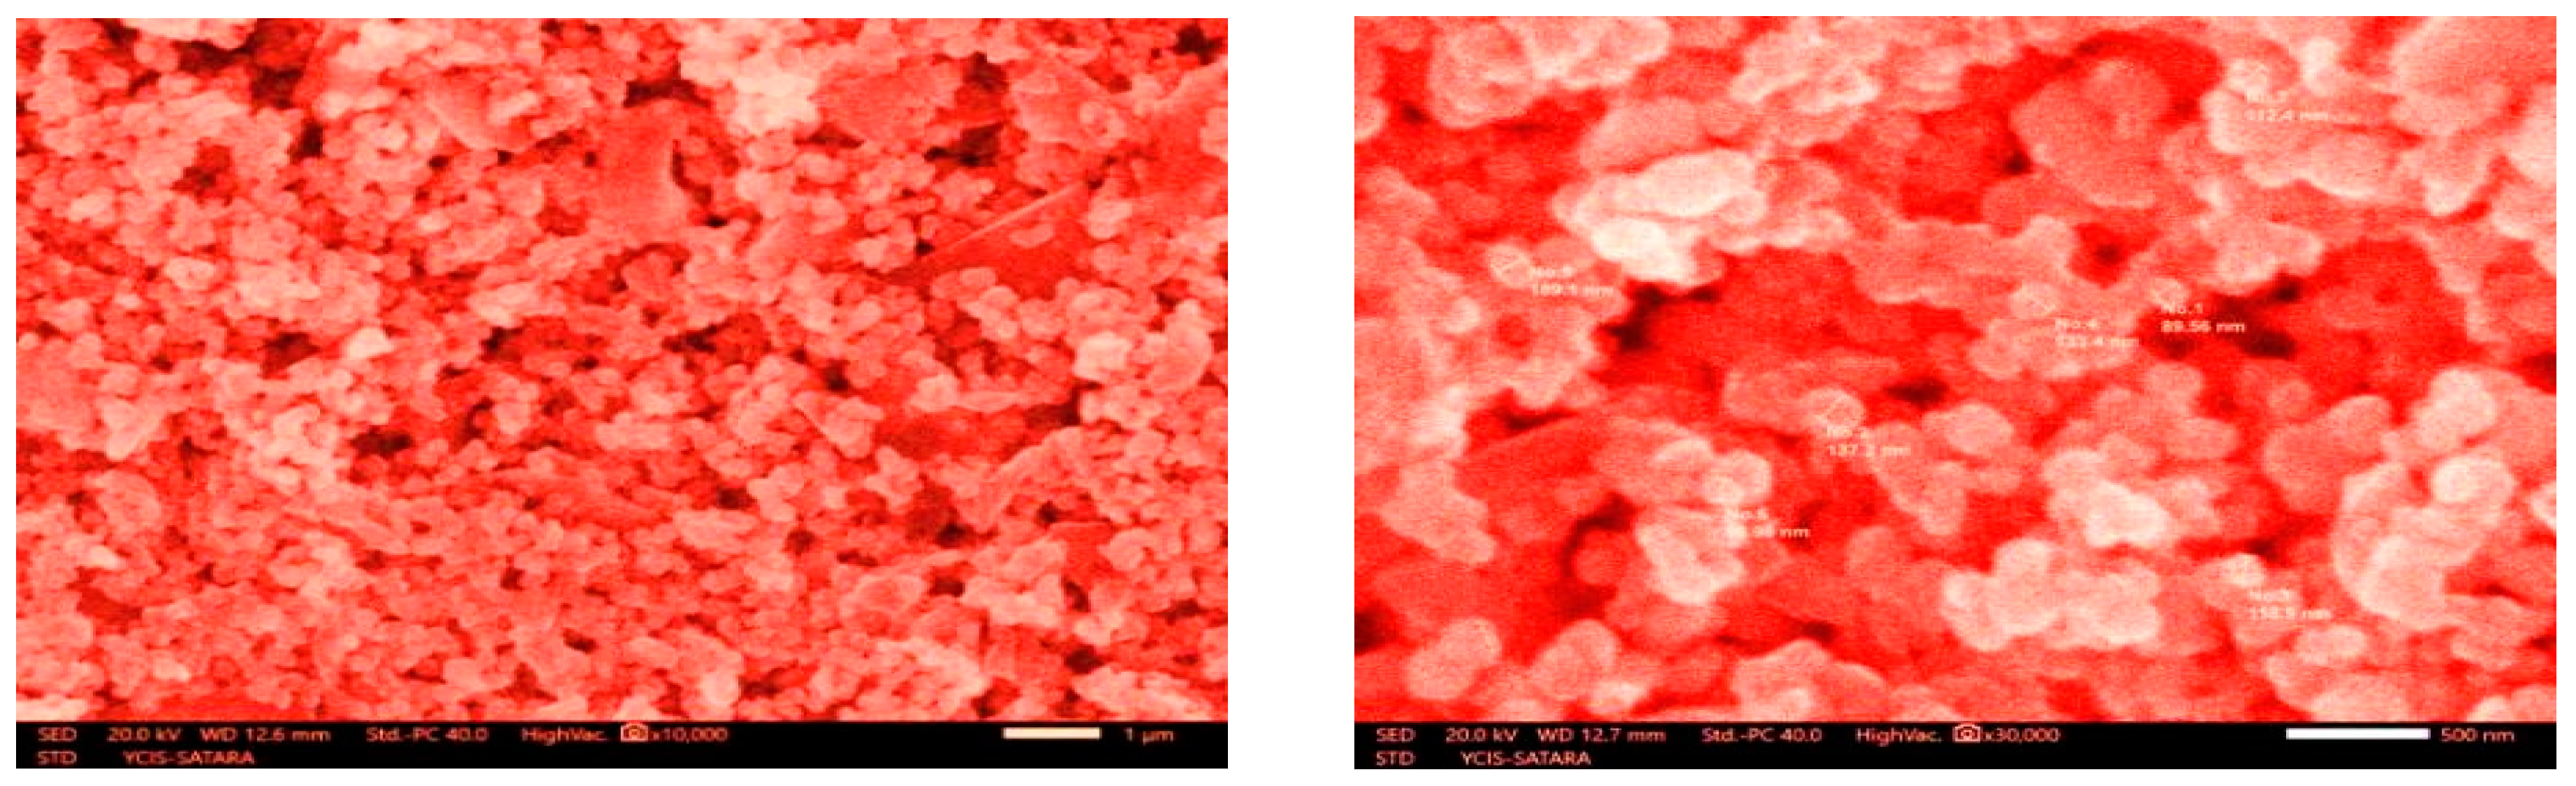
Figure 6.
EDAX analysis of HFD+TiO2 thin film.
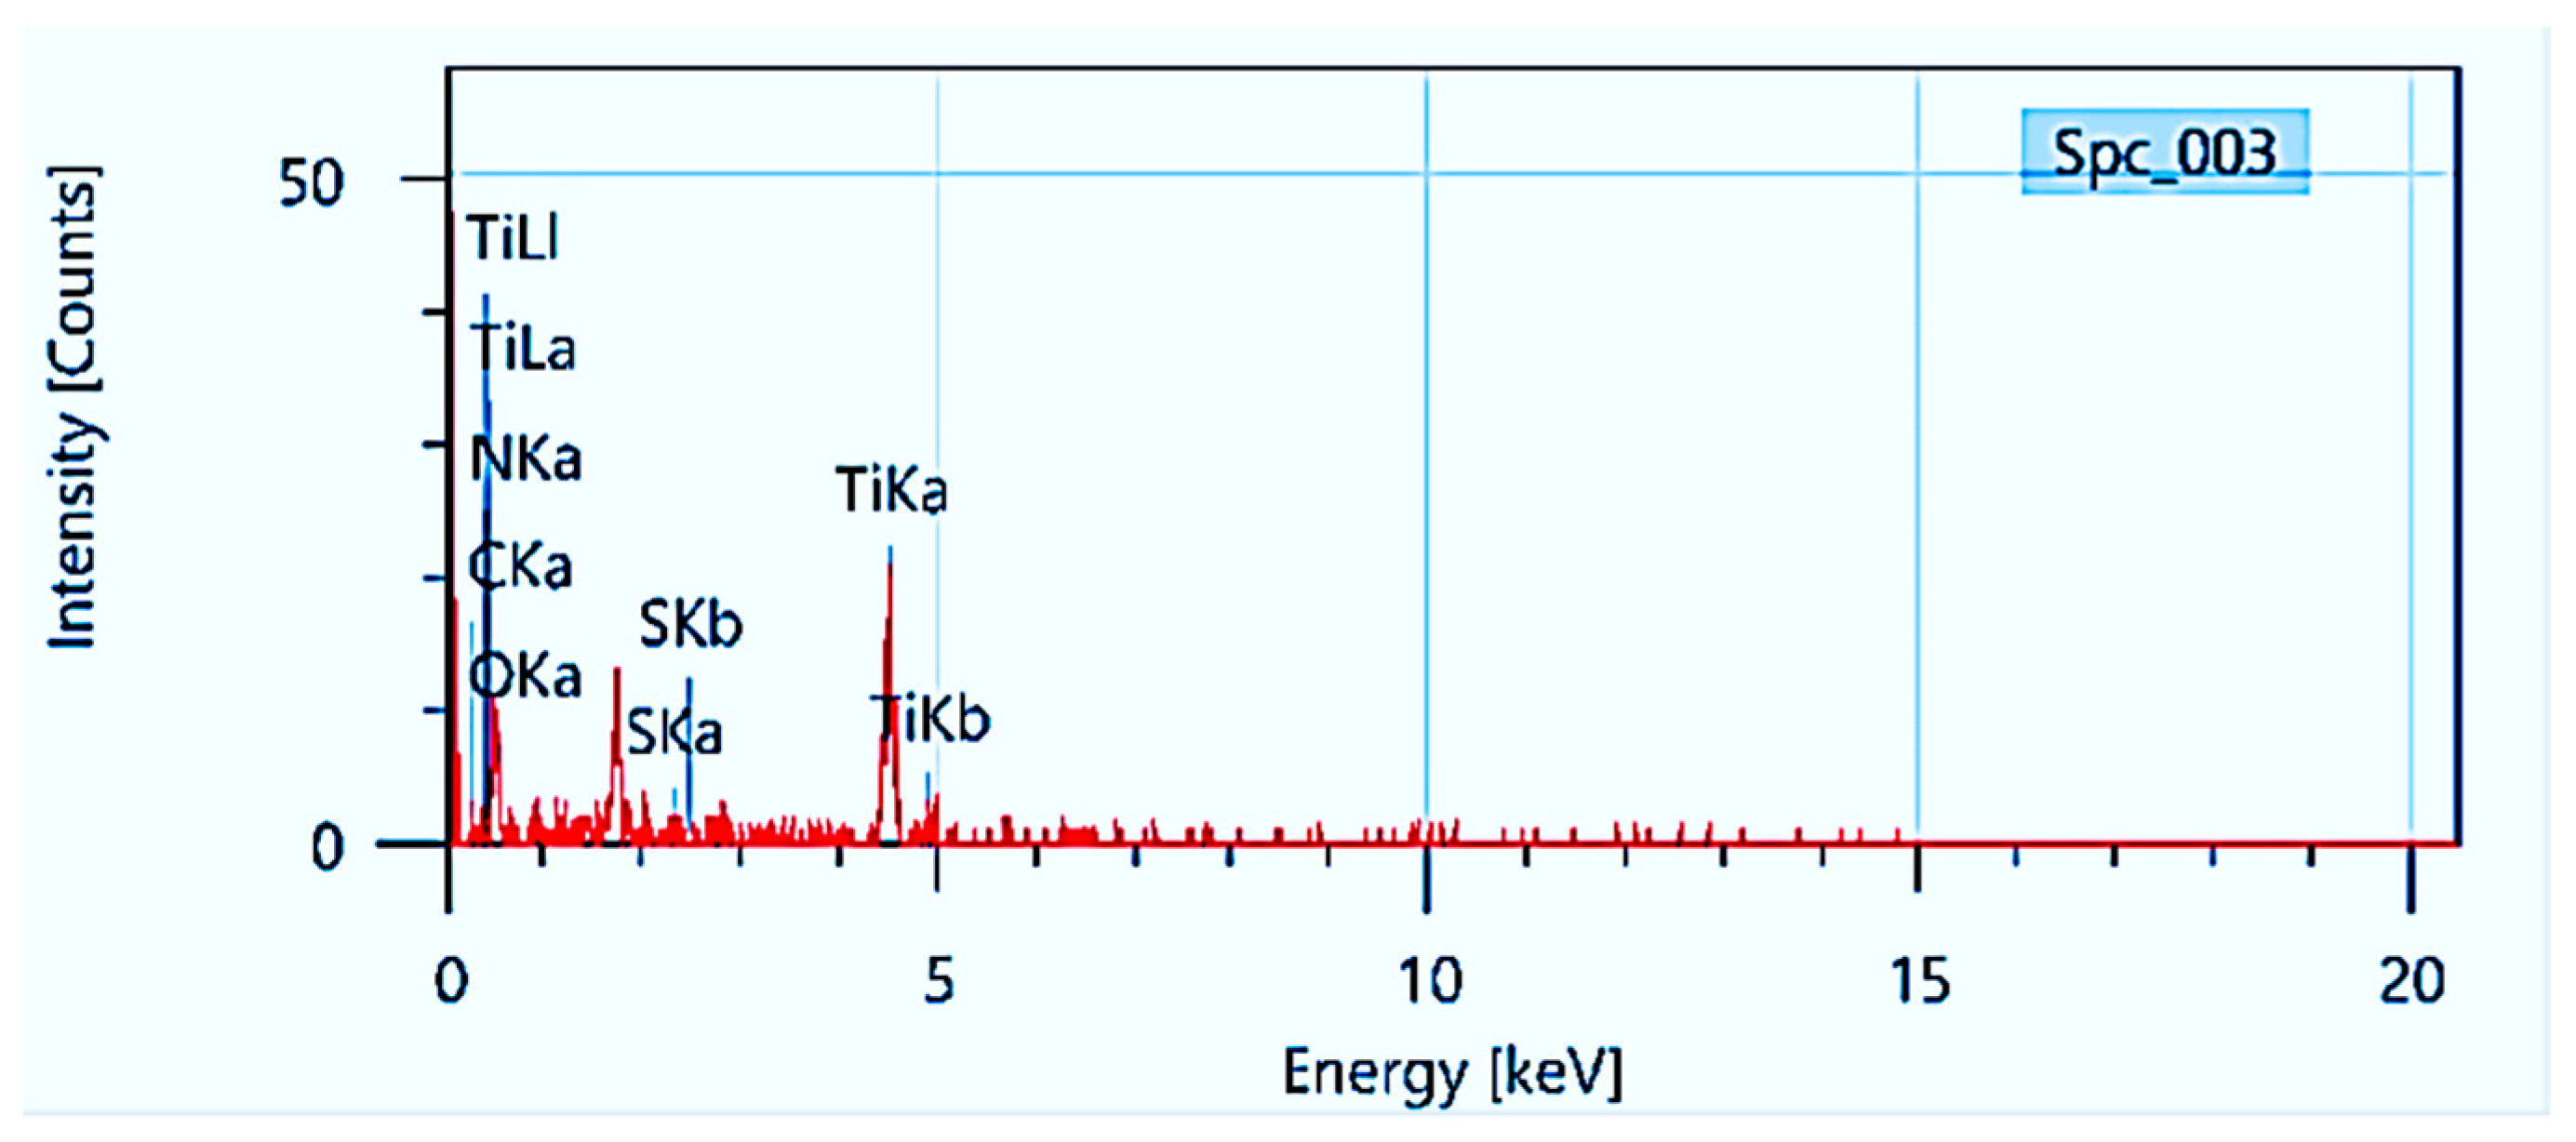
Figure 7.
AFM analysis of HFD+TiO2 thin film.
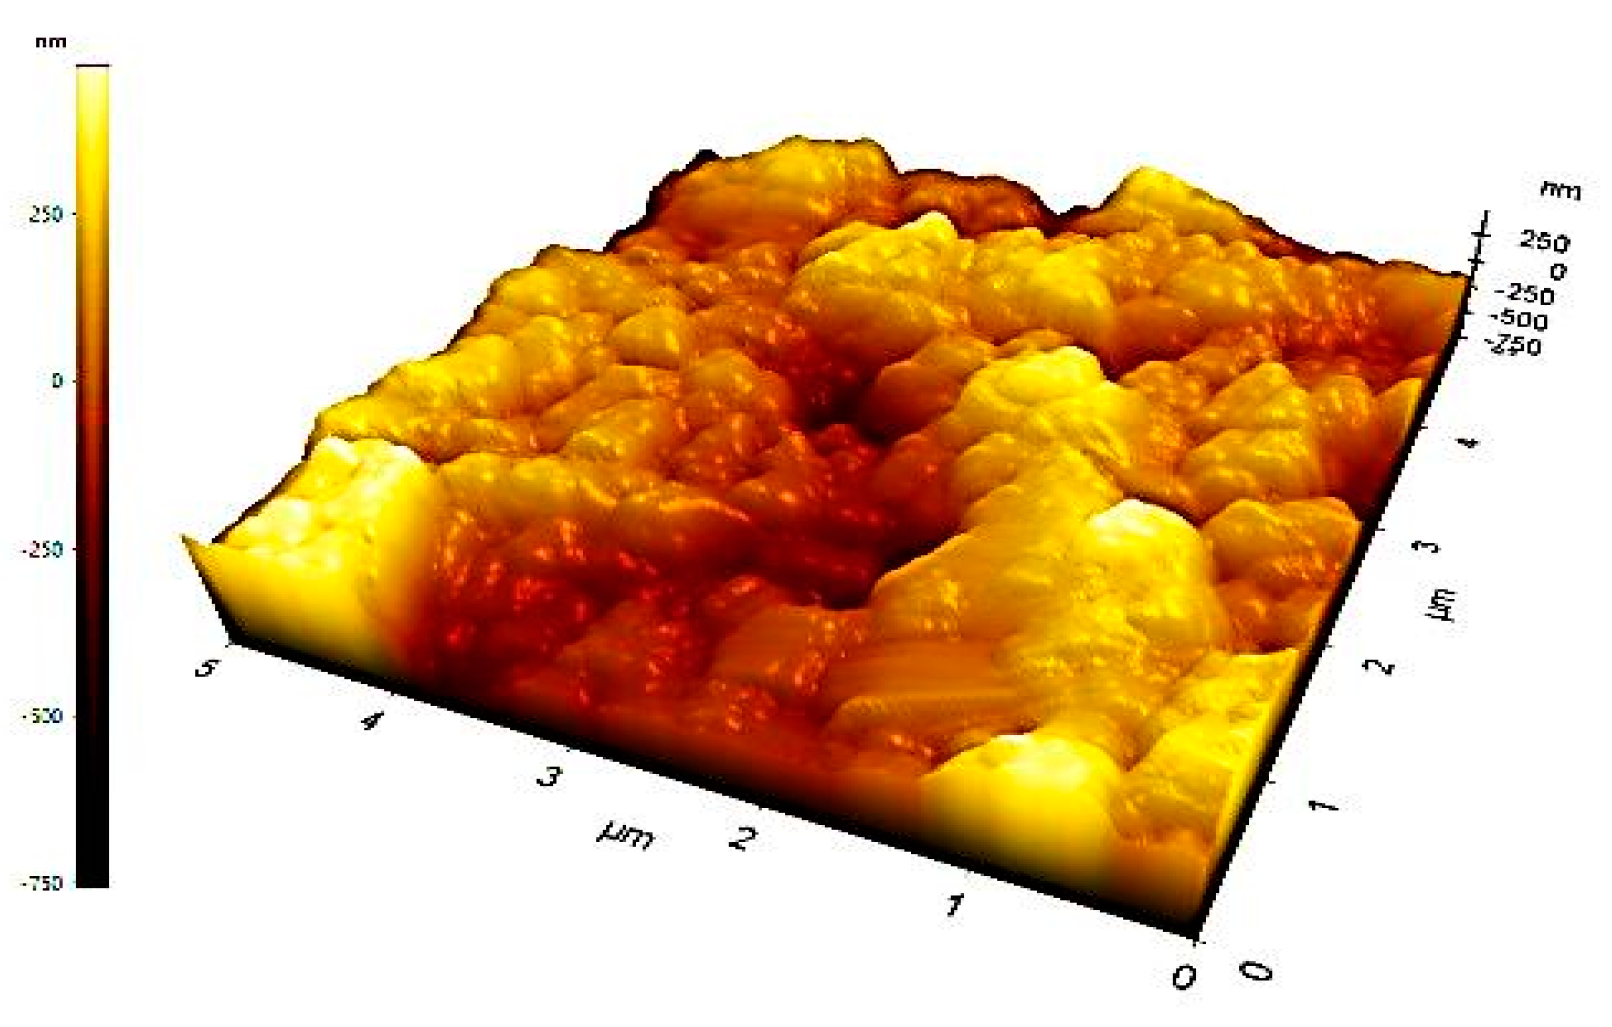
Figure 8.
XPS analysis of HFD+TiO2 thin film.
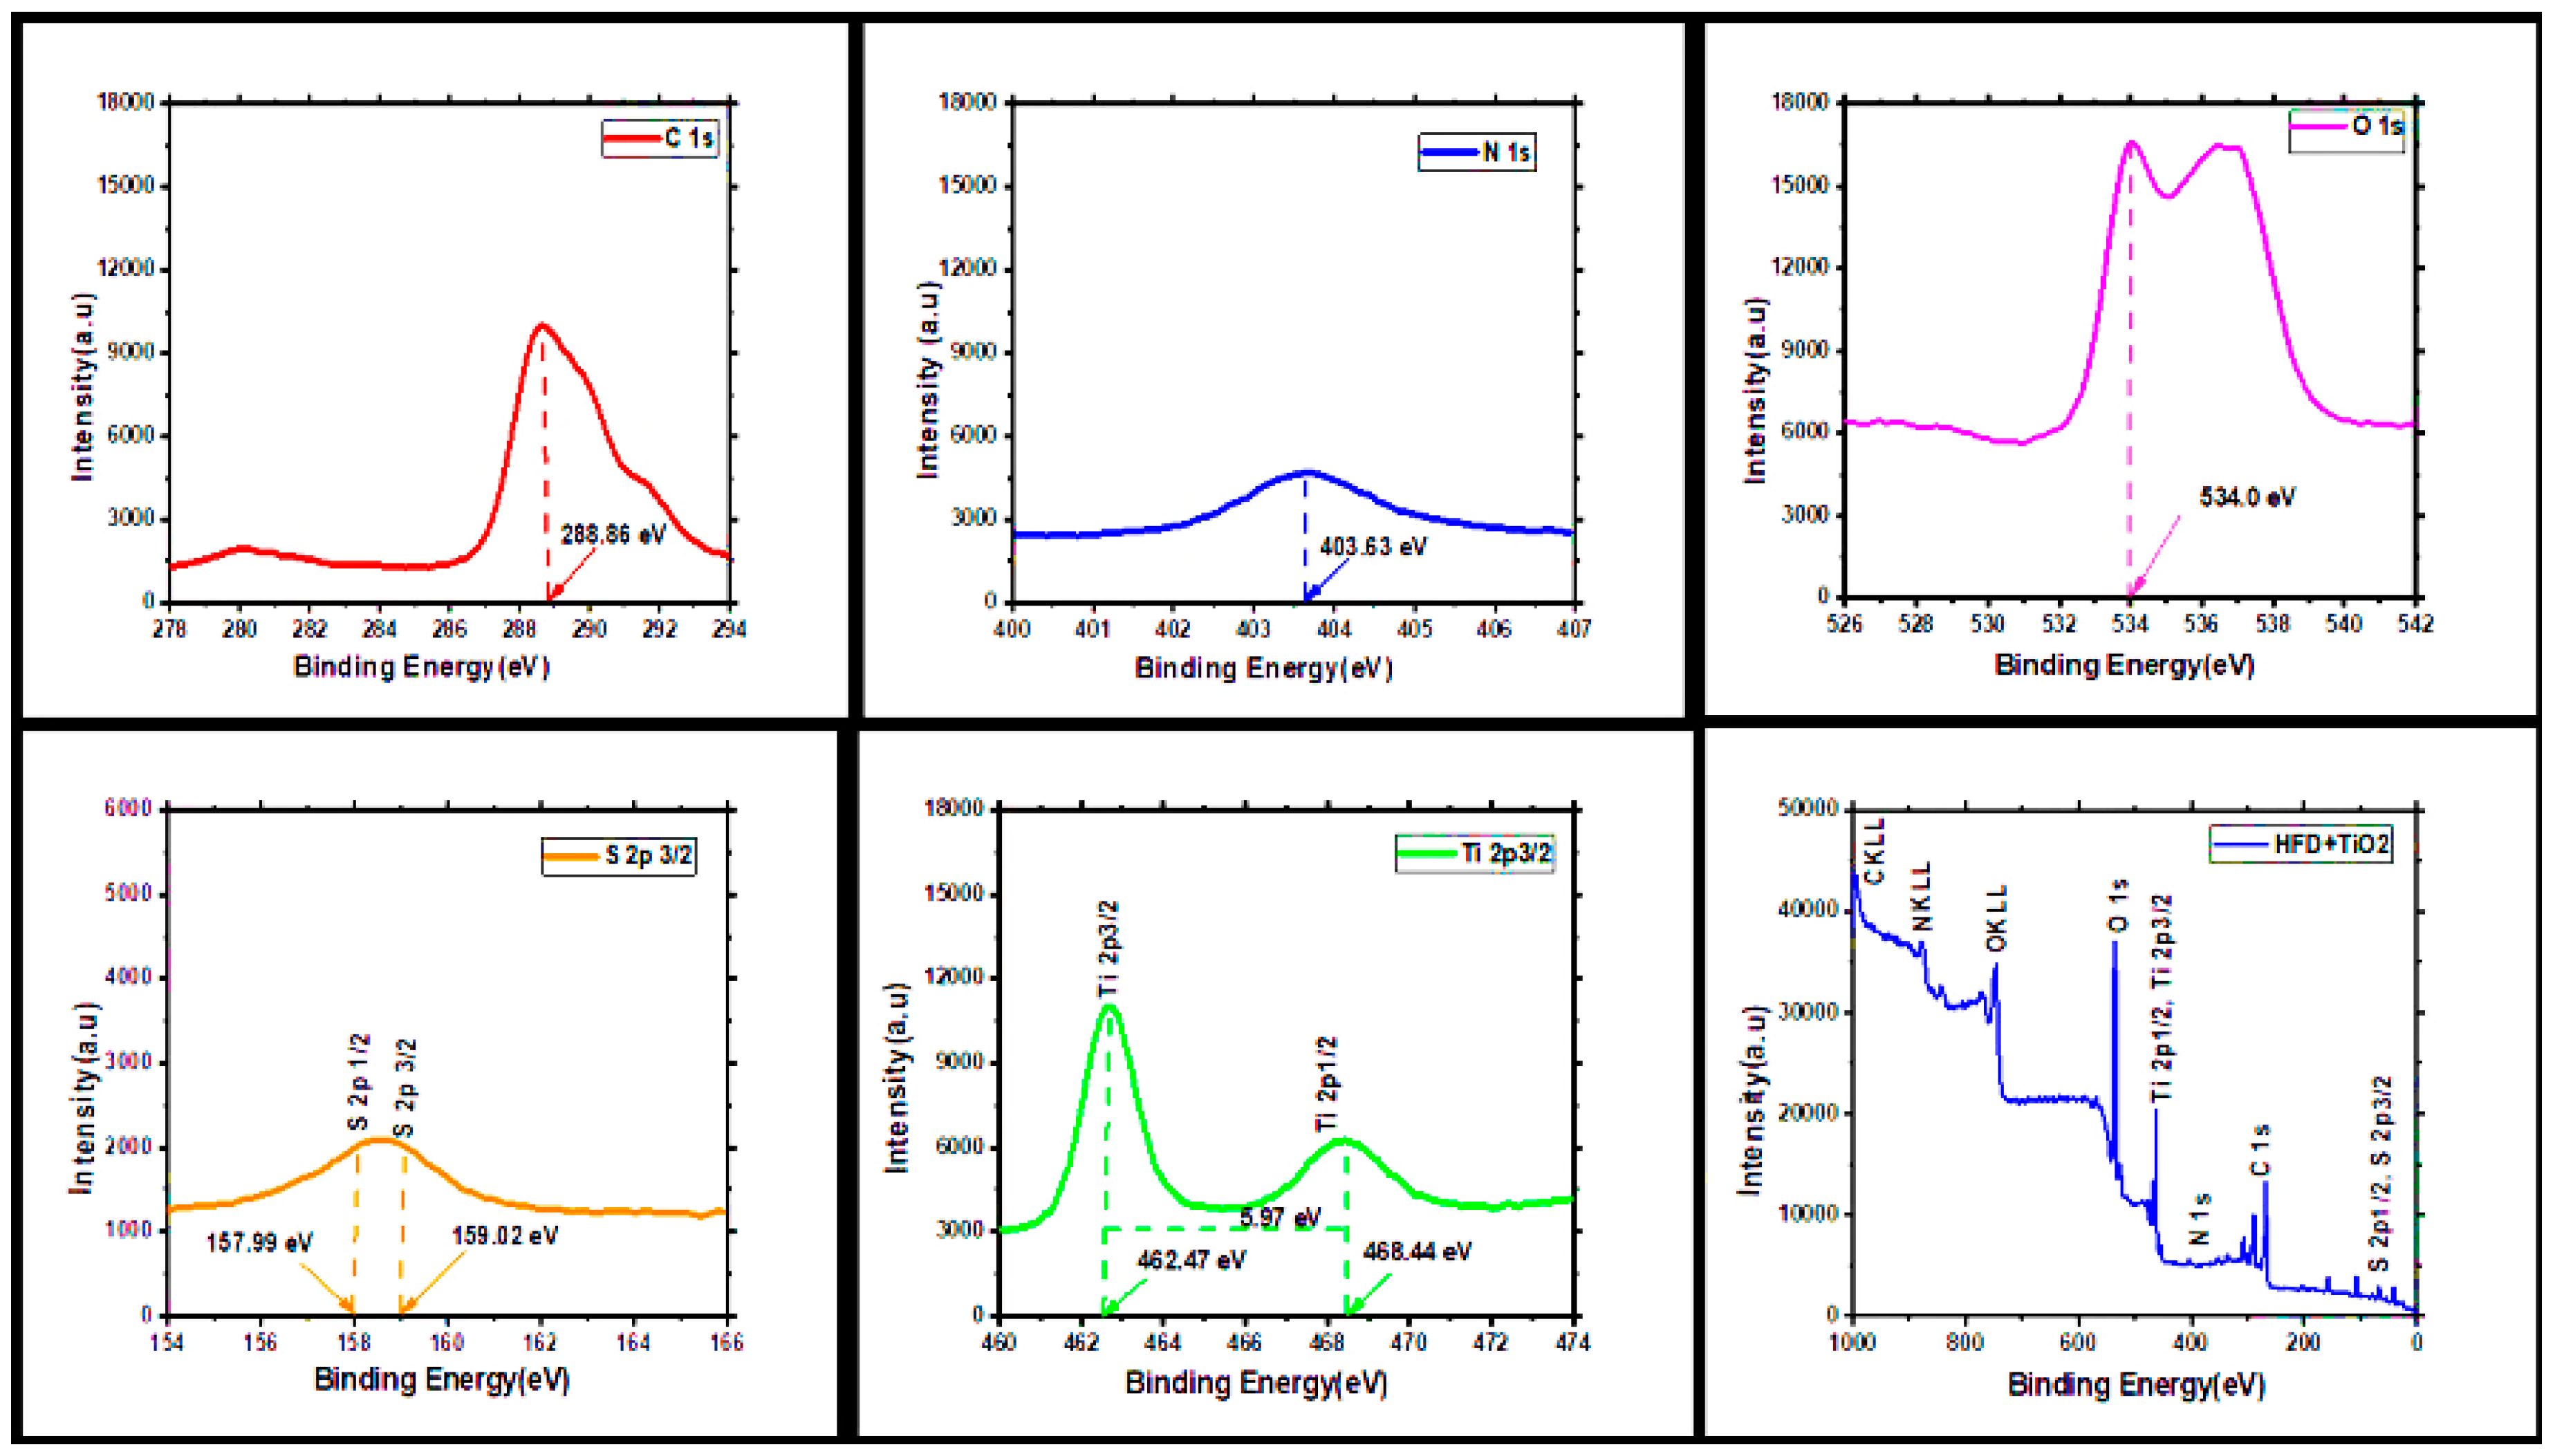
Figure 9.
Structural Representation Of Pheomelanin Dye.
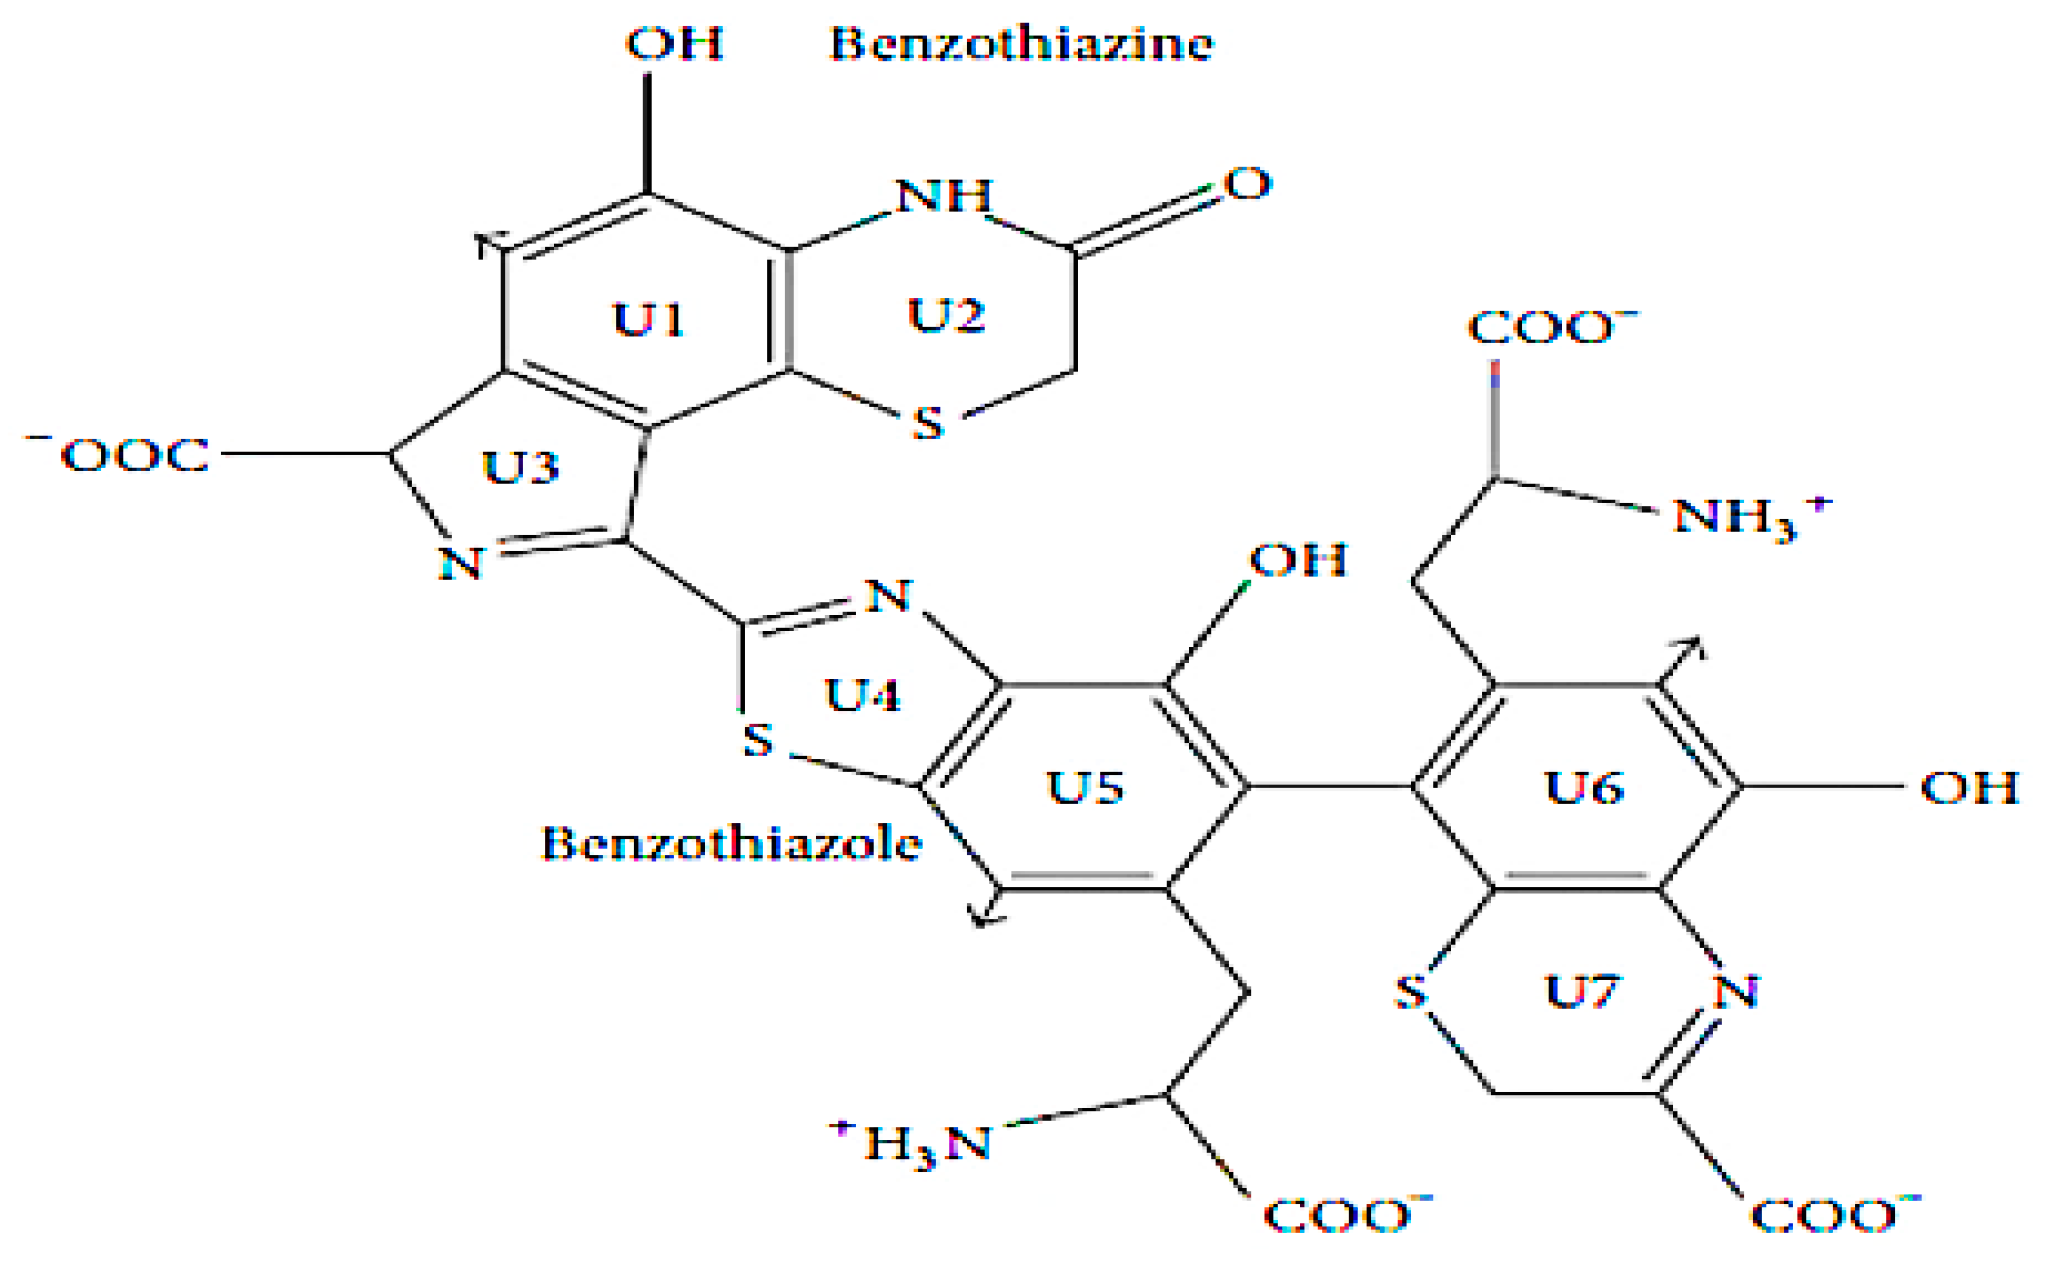
Figure 10.
Current density-voltage curves of HFD + TiO₂ thin film.
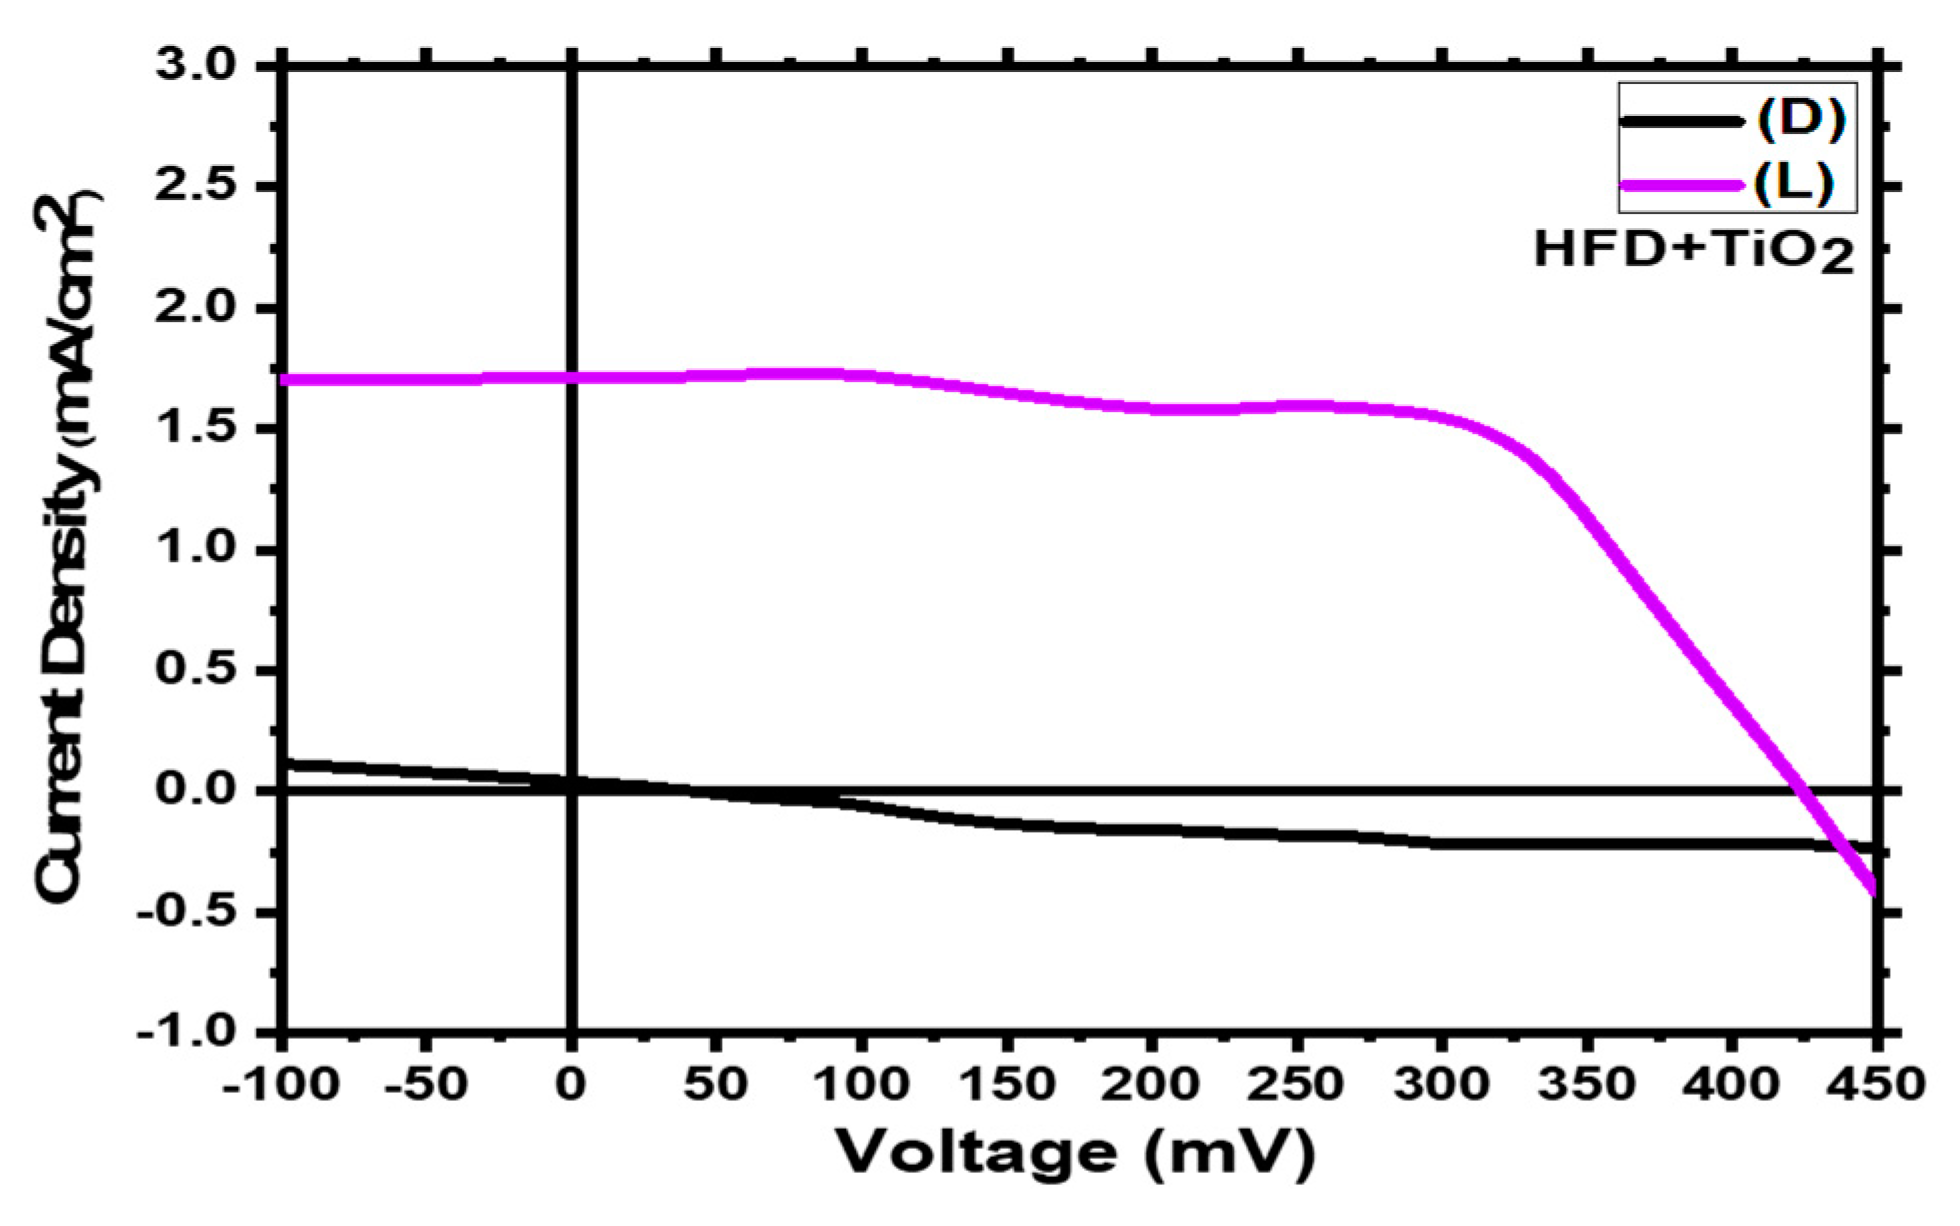
Table 2.
EDAX analysis of HFD+TiO2 thin film.
| Element | Mass% | Atom% |
|---|---|---|
| C | 4 | 7.31 |
| N | 0.28 | 0.44 |
| O | 52.68 | 72.3 |
| S | 0.94 | 0.64 |
| Ti | 42.11 | 19.3 |
| Total | 100 | 100 |
Table 3.
PEC property analysis for HFD + TiO2 films.
| Sample | Voc ( mV) | Vmax ( mV) | Jsc (mA/cm2) | Jmax (mA/cm2) | FF | η % |
|---|---|---|---|---|---|---|
| HFD + TiO2 | 421.78 | 187.03 | 1.7 | 1.56 | 0.40 | 2.91 |
Disclaimer/Publisher’s Note: The statements, opinions and data contained in all publications are solely those of the individual author(s) and contributor(s) and not of MDPI and/or the editor(s). MDPI and/or the editor(s) disclaim responsibility for any injury to people or property resulting from any ideas, methods, instructions or products referred to in the content. |
© 2025 by the authors. Licensee MDPI, Basel, Switzerland. This article is an open access article distributed under the terms and conditions of the Creative Commons Attribution (CC BY) license (http://creativecommons.org/licenses/by/4.0/).
Copyright: This open access article is published under a Creative Commons CC BY 4.0 license, which permit the free download, distribution, and reuse, provided that the author and preprint are cited in any reuse.


