Submitted:
02 April 2025
Posted:
03 April 2025
You are already at the latest version
Abstract
AI and ML systems are increasingly used in decision-making, but their deployment creates dynamic feedback loops where human decisions influenced by ML affect future model training. We introduce a theoretical framework to analyze convergence in such human-AI systems and identify conditions for stabilization at optimal or suboptimal levels relative to ground truth. A large-scale user study with 1,408 participants solving knapsack problems validates the model. Key findings show that humans often improve ML suggestions, monetary incentives have little impact, and system performance converges to 92% of optimal. Our results offer guidance for deploying ML in settings where human and machine decisions co-evolve.
Keywords:
Human-AI collaboration
; Performative feedback
; Collaborative characteristic function
; Knapsack problem
1. Introduction
Human-ML collaboration is increasingly applied in domains such as social media moderation (Lai et al., 2022), healthcare diagnosis (Jacobs et al., 2021; Dvijotham et al., 2023), and hiring decisions (Peng et al., 2022). However, deploying such systems introduces three key challenges: (1) ML models learn from human decisions, which may be noisy approximations of the ground truth; (2) deployed models influence future human decisions, altering the data used for subsequent training (Perdomo et al., 2020); and (3) collaborative performance depends on human incentives and behavior. These factors create a dynamic system where it’s unclear if learning will converge to an accurate representation of the truth or diverge. Consider a healthcare company deploying a diagnostic model trained on past doctor decisions—some of which may be incorrect. The model is then evaluated based on its agreement with those same decisions, potentially reinforcing errors. This feedback loop can lead to improvement or degradation over time, but without costly ground truth verification, it’s hard to tell which is occurring.
Contributions. In this paper, we present a novel framework for analyzing ML deployment in performative, human-AI collaborative systems. Central to our theory is the collaborative characteristic function, which maps ML performance to the resulting human+ML decision quality. We validate our framework with an empirical study involving 1,408 participants solving knapsack problems with ML assistance. Key results:
1) Humans often improve on ML suggestions.
2) Some human decisions are worse than the ML output, even when better options are apparent.
3) Financial incentives do not significantly influence decision quality.
These findings imply that ML models evaluated against human decisions may reinforce existing errors. Companies should invest in validating training labels and aim for deployment strategies that ensure convergence to higher-quality outcomes. A dynamic approach is essential when human decisions influenced by ML are used for future model updates.
2. Related Work
There is a growing literature on human-ML collaboration, from learning-to-defer systems (Cortes et al., 2016; Charusaie et al., 2022; Mozannar et al., 2023) to ML-assisted decision-making (Mozannar et al., 2024c; Dvijotham et al., 2023; Jacobs et al., 2021) and alternative mechanisms (Steyvers et al., 2022; Mozannar et al., 2024a). Applications span programming (Dakhel et al., 2023; Mozannar et al., 2024b), healthcare (Jacobs et al., 2021; Dvijotham et al., 2023), and business (Dell’Acqua et al., 2023). Related work explores explanations (Vasconcelos et al., 2023), incentives (Agarwal et al., 2023), fairness (Sühr et al., 2021), and adaptability (Bansal et al., 2019). We present the first theoretical study of dynamic human+ML systems where ML learns from prior collaborative decisions that may deviate from ground truth. Building on performative prediction (Perdomo et al., 2020; Mendler-Dünner et al., 2020; Hardt et al., 2022; Mendler-Dünner et al., 2022), we extend the framework by modeling proxy ground truth labels, introducing a utility-based view of stable points, and addressing unknown alignment to the true labels. Our empirical study provides a first step toward understanding these dynamics in practice.
3. Problem Statement
We consider a setting in which time is separable into discrete time epochs . At each t, a firm deploys a machine learning model of a model class , with . The model predicts a solution (e.g., a diagnosis) to a problem (e.g., the patient’s symptoms) as a function of past data.
The firm employs expert humans , with , who solve problems with the help of ML predictions. We will write and . We assume that for all , there exists an optimal solution , which is the indisputable ground truth.
3.1. The Firm’s Learning Objective
In many real-world settings, obtaining the ground truth is costly—e.g., accurate medical diagnoses may require input from multiple specialists and can still be prone to error. As a result, human label are often the only practical proxy for training ML models. We allow the quality of with respect to to change. This means that two iterations of the ML model, and , are trained on data from two different data-generating processes: and , respectively.
Without access to , the only feasible learning objective for a firm updating its model parameters at time t is to compare the latest human-ML collaborative labels with the new predictions. For a given loss function , we can write this as follows:
The firm aims to minimize the difference between the model predictions at time t and the human labels at time . We can formulate the firm’s objective as selecting a model to minimize the loss function in Equation (1):
For simplicity, we assume that at each time t, the firm collects enough data to perfectly learn the human-ML solution. In other words, with the optimal model, .
In our scenario, the firm cannot quantify the true quality of a solution Y with respect to . The loss in Equation (2) is a surrogate for the loss , which is impossible or too costly to obtain. The firm thus defines the human label as the “ground truth” and maximizes the similarity between model and human solutions, without knowing how close the human or ML solutions are to the indisputable ground truth. To evaluate the firm’s progress in approximating , it is useful to define a measure of utility.
Definition 1.
(Utility) Let be a distance measure on with respect to a given . The function is a utility function on if :
- such that (bounded),
- such that (ϵ-sensitive),
- (proximity measure).
The utility of a solution for the firm is maximal if Y is -close to with respect to the underlying problem X. The variable should be interpreted as the threshold below which the firm perceives no difference between two outcomes, i.e., it does not care about infinitesimal improvements.
Collaborative Characteristic Function As time t increases, the firm hopes that the distributions shift closer to the optimal distribution , where . In other words, for each model’s distance d, . For example, this could happen if humans were able to compare available solutions and select the one closest to the indisputable ground truth.
We translate this continuous improvement into properties of the human decision function H as follows: for all and ,
The firm’s hope is that for all . Effectively, characterizes the human-ML collaboration for all utility levels of a model. If is positive, humans improve on ML predictions, allowing future models to approximate the ground truth more accurately. Conversely, if is negative, humans perform worse than ML recommendations, causing future models to diverge from the ground truth.
Definition 2.
(Collaborative Characteristic Function) For a utility function U, humans , and model , the collaborative characteristic function is defined as:
The function can take any arbitrary form. Several factors, such as ML explanations and monetary incentives, can influence (as empirically explored in Section 4). Note that depends on the ML model M, not just its utility, because equal utility levels across different ML models do not guarantee equal collaborative reactions from humans. For brevity, we write .
4. Collaborative Learning Path and Stable Points
Although has infinite support, a firm will only encounter a discrete set of utility values achieved by humans with ML recommendations. This is referred to as the collaborative learning path.
Definition 3.
(Collaborative Learning Path) Let be a collaborative characteristic function, the number of deployment cycles, and the utility of the starting model. The collaborative learning path is defined as:
Definition 4.
(Stable Point) A stable point occurs at t if for all , .
5. Stable Points and Collaborative Learning
Stable points are states where the utility remains constant across all future model deployments. If is unique for all X, then this point also represents stability in terms of distribution shifts. The ability of a firm to achieve a stable point on its collaborative learning function depends on the shape of and the initial model utility s.
Figure 1 illustrates two examples of collaborative characteristic functions and collaborative learning paths. The 45-degree line represents the points where:
mapping the human performance at to the ML performance at t under the assumption of perfect learning. This assumption implies .
Figure 1.
Collaborative Improvement (left): The firm’s collaborative characteristic function and one collaborative learning path, if humans improve on the ML solution. The x-axis denotes the model expected utility, the y-axis denotes expected human+ML utility. The firm deploys a first model with utility (s). Then humans use the model and improve utility by 1, leading to expected human+ML utility (1). The firm learns a new model with utility (b) on the new data distribution. This is viable under the assumption that the new model has the same utility as the previous period’s human+ML labels, i.e., we can move horizontally from (1) to the 45-degree line at (b). Humans can further improve utility by 2, which leads to expected utility (2). The dynamic improvement process continues until it reaches stable point utility (6-d). Collaborative Harm (right): The firm deploys a model with expected utility (s) but the humans, when interacting with the model, decrease utility by 1, with expected utility (1). The firm will thus learn a model of utility (b) on the new distribution. The downward spiral continues until stable point (d).
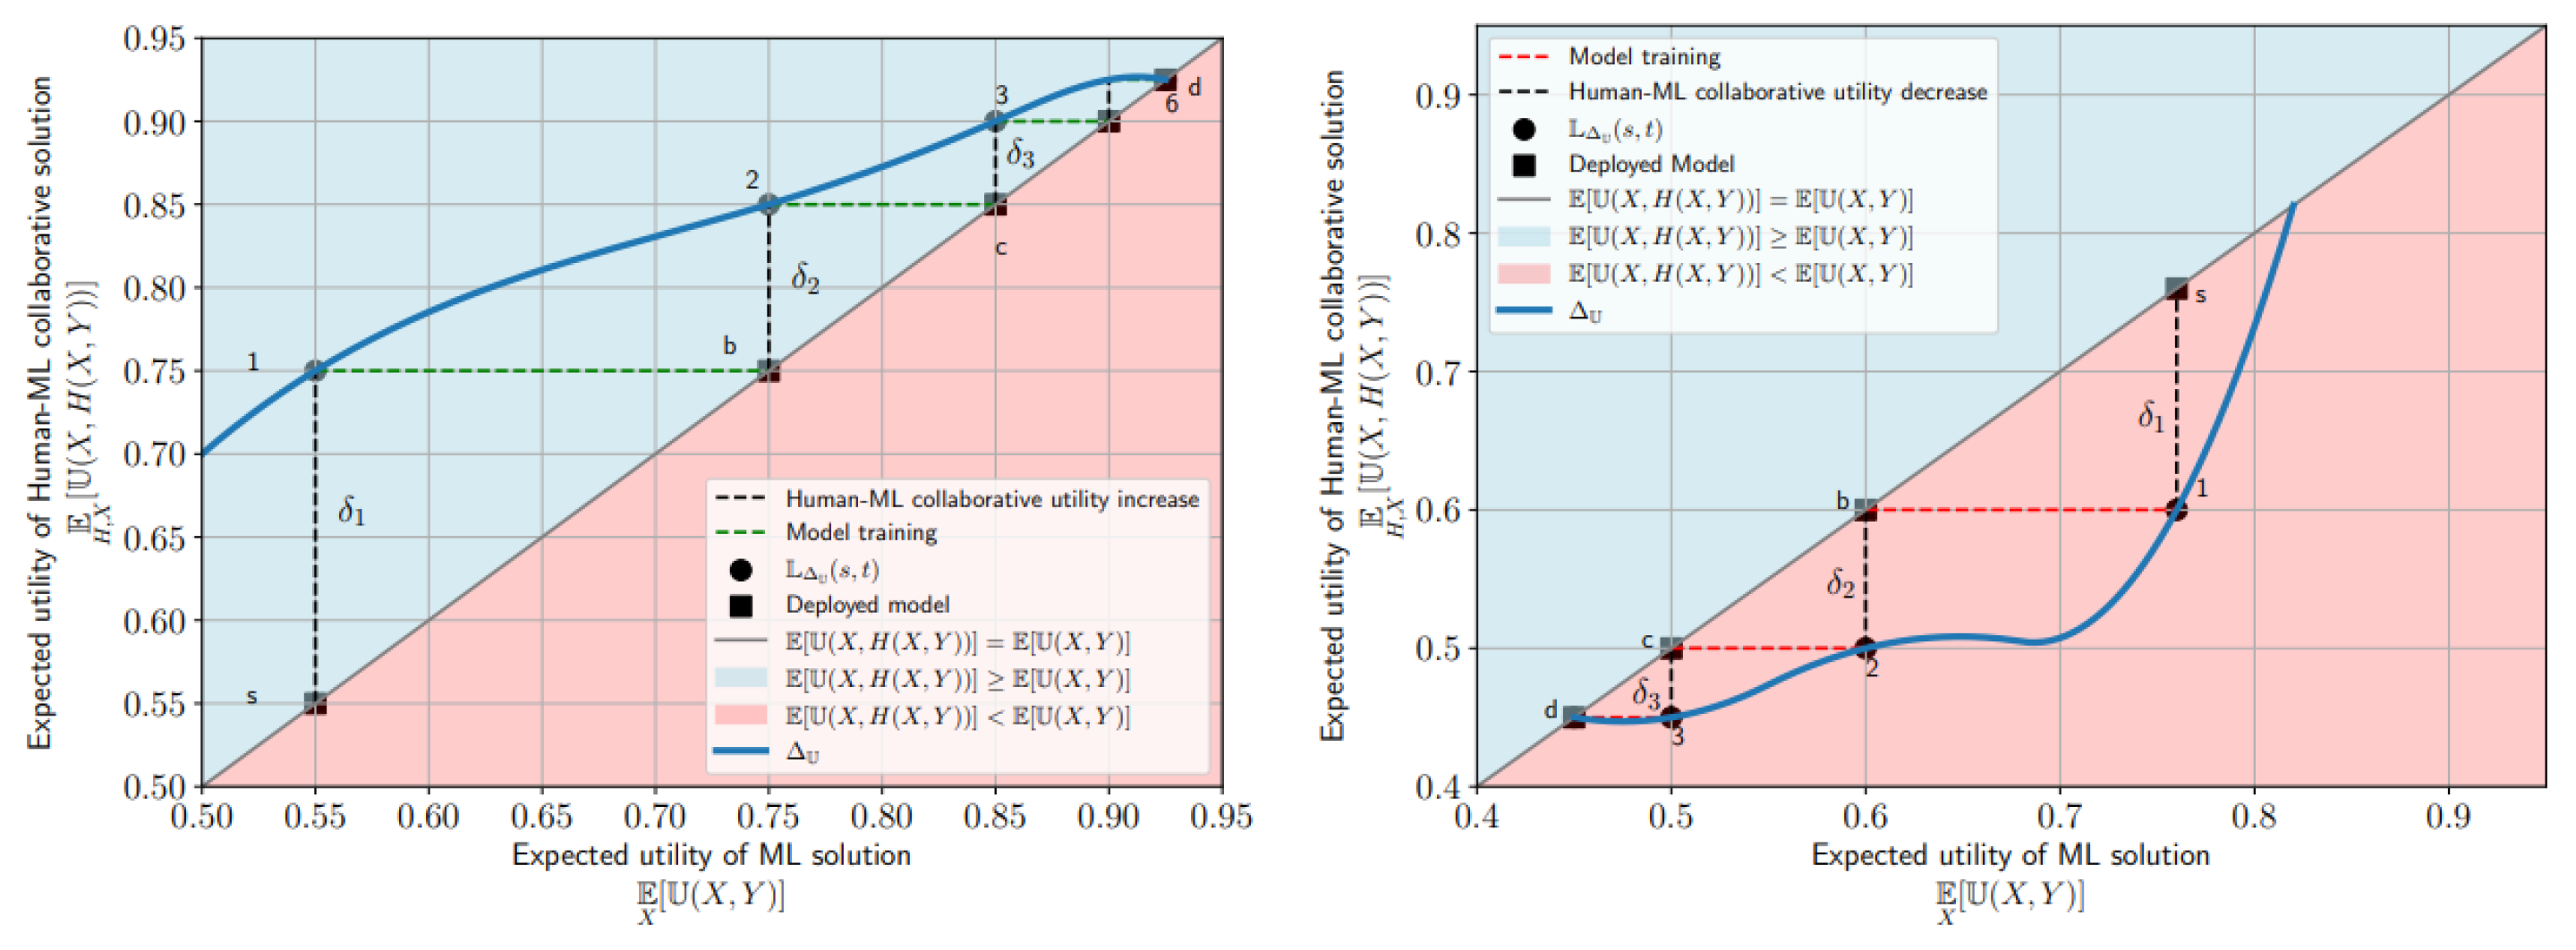
Stable points always lie on this line because such points require (i.e., ), where is the smallest detectable change in utility, as defined in Definition 1. If , this indicates that human intervention changes the labels Y relative to the most recent ML model, leading to a new data distribution. As a result, the subsequent model, , will differ from , thereby preventing stability. and maps the human performance at to the ML performance at t under the assumption of perfect learning, i.e., . Stable points will always lie on this line, as they require (i.e., ), where denotes the smallest detectable change in utility for a given from Definition 1.
If , it indicates that human intervention alters the labels Y relative to the most recent ML model, leading to a new data distribution. Consequently, the model at will differ from , preventing stability. When the model and human+ML labels diverge, two scenarios can arise:
- Case 1:—The collaborative characteristic function is above the 45-degree line on that portion of the domain (Figure ). In this case, human+ML labels are closer to the indisputable ground truth than the model alone, leading to improvements in subsequent model deployments.
- Case 2:—The collaborative characteristic function is below the 45-degree line (Figure ). Here, human+ML labels are farther from the indisputable ground truth than the model alone, causing a deterioration in subsequent model deployments.
We formalize the best-case and worst-case scenarios from Figures and as Propositions 1 and 2:
Proposition 1
(Collaborative Improvement). If for all , , then is non-decreasing with . Furthermore, for sufficiently large T, there exists a such that is a stable point.
Sketch.
Since U is bounded, must approach 0 at extreme points. Additionally, due to the -sensitivity of U, the number of steps t required to reach the maximum utility is also bounded. It follows that there exists a such that , which represents a stable point. See Appendix A.6 for the complete proof. □
Proposition 2
(Collaborative Harm). If for all , , then is non-increasing with . Furthermore, for sufficiently large T, there exists a such that is a stable point.
Proof.
Similar to the proof of Proposition 1. □
A firm’s collaborative characteristic function may lie above or below the 45-degree line and can have multiple stable points if continuous. Without ground truth, the firm cannot identify which point yields the highest utility. We present a proof of concept in a setting where the ground truth is known, allowing us to approximate the function and examine how human behavior—especially incentives and selection strategies—shapes it. Participants solve challenging knapsack problems to address two key questions:
- RQ1: How do performance bonuses affect human utility , without ML recommendations?
- RQ2: Can we approximate the collaborative characteristic function ? by testing human responses to ML of varying quality under fixed incentives?
6. Experimental Setup
6.1. The Knapsack Problem
We design a user study to simulate settings where ML supports users on difficult tasks, but the true solution , we use the 0-1 knapsack problem, which allows precise utility computation . articipants select from 18 items to maximize value under a weight limit, a task that is intuitive yet cognitively demanding as complexity grows [1]. Optimal solutions are computed via dynamic programming, while ML models are trained to imitate human choices. This setup lets us approximate the collaborative characteristic function using multiple utility definitions.
Definition 5
(Economic Performance). For a knapsack instance with optimal solution
and a valid solution Y, we call the function
the economic performance of Y given X.

Table 1.
Matrix of Treatment Conditions.
| Model | None | q1 | q2 | q3 | q4 | q5 | q6 |
|---|---|---|---|---|---|---|---|
| Mean | . | 0.717 | 0.800 | 0.844 | 0.884 | 0.899 | 0.920 |
| SD | . | 0.083 | 0.105 | 0.098 | 0.105 | 0.088 | 0.085 |
| No Bonus | N = 102 | ||||||
| 2-cent Bonus | N = 98 | ||||||
| 10-cent Bonus* | N=100+117 | N=64 | N=78 | N=194 | N=179 | N=70 | N=191 |
| 20-cent Bonus | N = 96 | ||||||
Study Design: We recruited 1,408 UK-based participants via Prolific to ensure familiarity with currency and weight units. After a tutorial and two practice tasks, participants completed 10 knapsack problems using a custom interface (Appendix A.11). We excluded 119 for browser violations, leaving 1,289 for analysis (Appendix A.9). Participants were randomly assigned to four monetary treatments and seven algorithmic recommendation levels (Table 1). Bonus conditions (No Bonus, 2¢, 10¢, 20¢ per point above 70% UEcon) were tested without ML to isolate incentive effects. The 10¢ Bonus condition was run twice, with the second including a comprehension quiz and randomization across models (q0–q6). ML models were trained on optimal solutions (Appendix A.8), and Appendix Figure 6 shows their utilities span the range of models trained on human data. These choices enable us to approximate collaborative characteristic functions, though they limit full theoretical replication.
7. Results
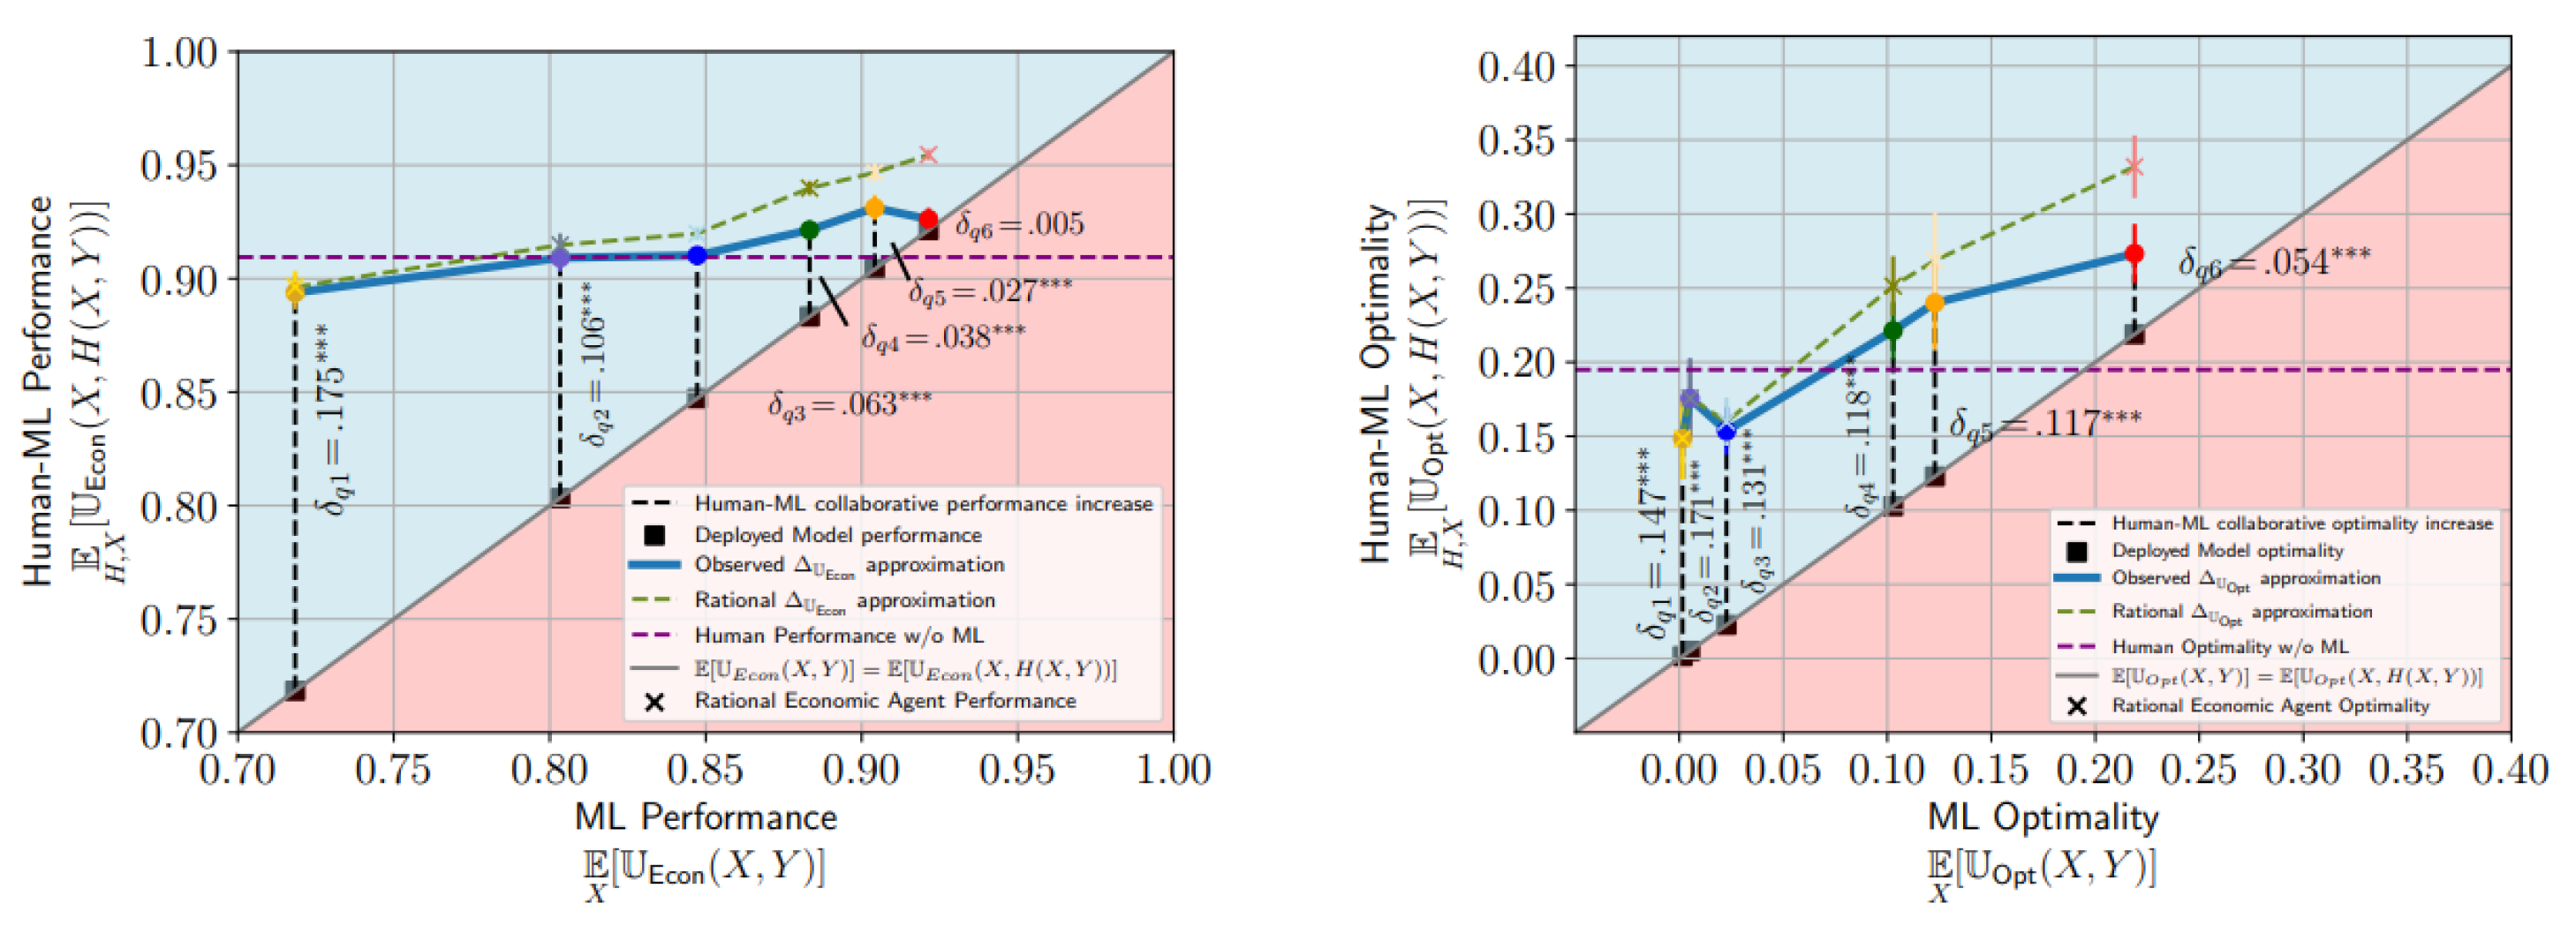
Monetary incentives had no significant effect on user performance (88.6%–90%), with all bonus treatments statistically indistinguishable from the control (Figure 2a). A comprehension quiz confirmed that users understood the incentive structure (). ML recommendations improved human performance modestly as model quality increased—from 89.4% at 72% ML utility to 92.6% at 92% (Figure 2b)—though gains were often statistically indistinguishable. Even low-quality models (e.g., ) led to large improvements over the ML baseline (89.4% vs. 71.8%, ). Effort and time remained consistent across conditions (Appendix Figure 10 and 21). Together, the empirical approximations of the collaborative characteristic function (Figure 3) suggest convergence to stable points above human-only performance.
8. Conclusion
We propose a theoretical framework for human-ML collaboration in dynamic settings where human labels may deviate from the ground truth. At its core is the collaborative characteristic function, mapping ML utility to human+ML utility and defining learning paths that may converge to stable points. A large-scale knapsack user study shows that for models with 72–92% performance, paths likely converge near 92% utility. Monetary incentives had no effect, but simple post-processing (choosing the better of human or ML output) significantly improved outcomes. Limitations include assuming perfect replication in retraining and reliance on synthetic data. Empirical variations were limited to linear bonuses and independently varied ML quality. Future work should explore conditions for unique stable points, real-world applications, and fairness in convergence.
References
- N. Agarwal, A. Moehring, P. Rajpurkar, and T. Salz, “Combining human expertise with artificial intelligence: Experimental evidence from radiology,” NBER Working Paper No. 31422, 2023.
- G. Bansal, B. Nushi, E. Kamar, D. S. Weld, W. S. Lasecki, and E. Horvitz, “Updates in human-ai teams: Understanding and addressing the performance/compatibility tradeoff,”. Proc. AAAI Conf. Artificial Intelligence 2019, 33, 2429–2437. [CrossRef]
- M.-A. Charusaie, H. Mozannar, D. Sontag, and S. Samadi, “Sample efficient learning of predictors that complement humans,” in Proc. Int. Conf. Machine Learning, pp. 2972–3005, 2022.
- C. Cortes, G. DeSalvo, and M. Mohri, “Learning with rejection,” in Algorithmic Learning Theory: 27th Int. Conf. ALT 2016, Bari, Italy, Oct. 19–21, 2016, vol. 27, pp. 67–82, Springer.
- A. M. Dakhel, V. Majdinasab, A. Nikanjam, F. Khomh, M. C. Desmarais, and Z. M. J. Jiang, “Github copilot ai pair programmer: Asset or liability?,” J. Systems Software, vol. 203, p. 111734, 2023.
- F. Dell’Acqua, E. McFowland, E. R. Mollick, H. Lifshitz-Assaf, K. Kellogg, S. Rajendran, L. Krayer, F. Candelon, and K. R. Lakhani, “Navigating the jagged technological frontier: Field experimental evidence of the effects of ai on knowledge worker productivity and quality,” Harvard Business School Technology & Operations Mgt. Unit Working Paper, 24(24-013), 2023.
- K. Dvijotham, J. Winkens, M. Barsbey, S. Ghaisas, R. Stanforth, N. Pawlowski, P. Strachan, Z. Ahmed, S. Azizi, Y. Bachrach, et al., “Enhancing the reliability and accuracy of ai-enabled diagnosis via complementarity-driven deferral to clinicians,”. 2023, 29, 1814–1820.
- M. Hardt, M. Jagadeesan, and C. Mendler-Dünner, “Performative power,”. Advances in Neural Information Processing Systems 2022, 35, 22969–22981.
- M. Jacobs, M. F. Pradier, T. H. McCoy Jr, R. H. Perlis, F. Doshi-Velez, and K. Z. Gajos, “How machine-learning recommendations influence clinician treatment selections: The example of antidepressant selection,”. Translational Psychiatry 2021, 11, 108. [CrossRef] [PubMed]
- V. Lai, S. Carton, R. Bhatnagar, Q. V. Liao, Y. Zhang, and C. Tan, “Human-ai collaboration via conditional delegation: A case study of content moderation,” in Proc. 2022 CHI Conf. Human Factors Computing Systems, pp. 1–18, 2022.
- C. Mendler-Dünner, J. Perdomo, T. Zrnic, and M. Hardt, “Stochastic optimization for performative prediction,” in Advances in Neural Information Processing Systems, vol. 33, pp. 4929–4939, 2020.
- C. Mendler-Dünner, F. Ding, and Y. Wang, “Anticipating performativity by predicting from predictions,”. Advances in Neural Information Processing Systems 2022, 35, 31171–31185.
- H. Mozannar, H. Lang, D. Wei, P. Sattigeri, S. Das, and D. Sontag, “Who should predict? Exact algorithms for learning to defer to humans,”. Proc. Int. Conf. Artificial Intelligence and Statistics 2023, 10520–10545.
- H. Mozannar, G. Bansal, A. Fourney, and E. Horvitz, “Reading between the lines: Modeling user behavior and costs in ai-assisted programming,” in Proc. CHI Conf. Human Factors Computing Systems, pp. 1–16, 2024.
- H. Mozannar, G. Bansal, A. Fourney, and E. Horvitz, “When to show a suggestion? Integrating human feedback in ai-assisted programming,”. Proc. AAAI Conf. Artificial Intelligence 2024, 38, 10137–10144. [CrossRef]
Figure 2.
Empirical approximations of collaborative characteristic functions for two utility functions: economic performance (left) and optimality (right). Error bars represent confidence intervals based on participant-level clustered standard errors. Significance levels for the estimates of are based on t-tests against the null . ***: .
Disclaimer/Publisher’s Note: The statements, opinions and data contained in all publications are solely those of the individual author(s) and contributor(s) and not of MDPI and/or the editor(s). MDPI and/or the editor(s) disclaim responsibility for any injury to people or property resulting from any ideas, methods, instructions or products referred to in the content. |
© 2025 by the authors. Licensee MDPI, Basel, Switzerland. This article is an open access article distributed under the terms and conditions of the Creative Commons Attribution (CC BY) license (http://creativecommons.org/licenses/by/4.0/).
Copyright: This open access article is published under a Creative Commons CC BY 4.0 license, which permit the free download, distribution, and reuse, provided that the author and preprint are cited in any reuse.


