Submitted:
02 April 2025
Posted:
03 April 2025
You are already at the latest version
Preprints on COVID-19 and SARS-CoV-2
Abstract
The COVID-19 pandemic has had a profound impact on healthcare systems world-wide, with severe consequences on the global economy and society. The clinical presentation of SARS-CoV-2 infection varies widely, ranging from asymptomatic cases to severe disease and death. Coinfection with other respiratory pathogens in SARS-CoV-2-positive individuals may exacerbate symptom severity and lead to poorer clinical outcomes. Background/Objectives: This study is the first to investigate the prevalence of viral and bacterial co-infections in SARS-CoV-2-positive individuals in Cyprus. Methods: A total of 1,111 SARS-CoV-2-positive nasopharyngeal swab samples were analysed for the presence of 18 viral and 3 bacterial respiratory pathogens. Re-sults: Of these, 51 samples (4.6%) were found to have at least one additional respira-tory pathogen. The most frequently detected viruses were Rhinovirus/Enterovirus (n = 28; 2.5%) and Adenovirus (n = 8; 0.7%), while the bacterial pathogens identified were Legionella pneumophila (n = 1; 0.1%) and Bordetella pertussis (n = 1; 0.1%). The highest proportion of co-infections was observed in the youngest age group (<10 years), where 52.9% of co-infections were identified, followed by the 30–39 age group, which ac-counted for 15.7% of cases. Among single respiratory virus co-infections, Rhinovi-rus/Enterovirus (27.5%) and Adenovirus (13.7%) were the most frequently detected in the <10 age group, followed by RSV (3.9%), Bocavirus, Influenza B, HMPV A+B, and Coronavirus NL63 (each at 2%). Conclusions: The current study underscores the im-portance of detecting co-infections in SARS-CoV-2-positive individuals, as this could have significant implications for therapeutic management. Early identification of coinfecting pathogens may guide targeted treatment strategies, reduce complications, and improve overall clinical outcomes.
Keywords:
COVID-19
; SARS-CoV-2
; Co-infections
; respiratory viruses
; bacteria
1. Introduction
Severe acute respiratory coronavirus 2 (SARS-CoV-2) is responsible for coronavirus disease 2019 (COVID-19), already causing a loss of 7 million lives globally (https://covid19.who.int/; 16th Feb 2025). SARS-CoV-2 is transmitted via aerosol droplets and it mainly infects the respiratory tract [1]. Infected patients experience symptoms ranging from mild illness up to a critical care condition, which requires hospitalization at intensive care units. The common symptoms of COVID-19 include fever, cough, dyspnea, fatigue, myalgia and diarrhea [2].
Clinical symptoms of COVID19 resemble those of other respiratory illnesses, caused by other viruses and bacteria [3,4]. Of equal importance, co-infections with other respiratory pathogens may lead to greater severity of illness, complicating treatments targeting SARS-CoV-2 or the co-pathogen. For instance, influenza infection in COVID-19 patients has been associated with increased hospitalisation, disease symptoms and mortality rate [5,6,7]. Similarly, bacterial co-infection in COVID-19 appears to be a major risk factor for mortality, ICU admission, and mechanical ventilation and could have result from both superinfections and co-infections with other microbial pathogens [8]. The most common bacterial co-infections in COVID-19 patients were Pseudmonas aeruginosa, Haemophilus influenzae, and Mycoplasma pneumonia [9].
As a result of viral and bacterial co-infections, COVID-19 may be overlooked and thereby diagnosed late, hindering the prompt administration of designated antiviral therapies. This in turn is expected to negatively impact clinical progression of the disease. Therefore, data on the prevalence and the most common co-infecting viral and bacterial pathogens will help clinicians and health agencies to treat patients and implement appropriate infection control measures, respectively [10].
SARS-CoV-2 was detected in Cyprus for the first time on March 9, 2020. The Republic of Cyprus is one of the countries in Europe least affected by the COVID-19 pandemic, presumably due to its rapid and effective response strategy that included high number of COVID-19 tests, effective tracing and isolation of cases and their contacts together with preventive measures (e.g. social distancing, wearing face masks and hand washing). In addition, being an island guaranteed high effectiveness of airport closure with regard to importing of new cases [11,12].
Up to date, data regarding co-infection with other respiratory microorganisms in SARS-CoV-2-positive patients in Cyprus is still lacking. Therefore, the present study was conducted in an attempt to determine the frequency of respiratory viral and bacterial co-infections among SARS-CoV-2-positive nasopharyngeal swab samples. The obtained data are expected to have a positive impact on therapeutic decision making for SARS-CoV-2 in the future.
2. Materials and Methods
2.1. Sample Selection
The Department of Molecular Virology at the Cyprus Institute of Neurology and Genetics serves as the reference laboratory for SARS-CoV-2, as designated by the Ministry of Health of the Republic of Cyprus. Nasopharengeal swab (NPS) samples were analysed for their SARS-CoV-2 status using a qRT-PCR assays, as previously described [11]. A detailed description of the sample selection algorithm is provided in Figure 1. In Figure 2 the monthly distribution of the number of samples analysed, as well as the number of positives identified is shown. For this retrospective observational study, 1,111 SARS-CoV-2-positive NPS were selected for further analysis. These samples were obtained from non-hospitalized individuals (518 males, 593 females; age range: new-born to 92 years). The number of samples selected for further analysis correspond to approximately 2% of SARS-CoV-2-positive cases identified each month during that period.
2.2. QIAstat-Dx® Respiratory SARS-CoV-2 Panel
QIAstat-Dx® Respiratory SARS-CoV-2 Panel was used according to the manufacturer’s instructions, as previously described [13]. Briefly, 300 µL of NPS sample was loaded manual into the single use QIAstat-Dx® Respiratory SARS-CoV-2 Panel cartridge (QIAGEN) and set on the QIAstat-Dx® Analyser (QIAGEN) for the detection of the following viral and bacterial microorganisms: Adenovirus, Bocavirus, Coronavirus 229E, Coronavirus HKU1, Coronavirus NL63, Coronavirus OC43, Human Metapneumovirus A/B, Influenza A, Influenza A H1, Influenza A H1N1/pdm09, Influenza A H3, Influenza B, Parainfluenza virus 1, Parainfluenza virus 2, Parainfluenza virus 3, Parainfluenza virus 4, Respiratory Syncytial Virus A/B, Rhinovirus/Enterovirus, SARS-CoV-2, Bordetella pertussis, Legionella pneumophilia, Mycoplasma pneumoniae. The presence of SARS-CoV-2 and 21 other respiratory pathogens were determined, and cycle threshold values were obtained if the SARS-CoV-2 and/or other respiratory pathogens were detected [13,14].
2.3. Statistical Analysis
Categorical values were expressed as number (%) and compared by Chi-square test or Fisher’s exact test among multiple groups. A value of p<0.05 was considered to be significant.
3. Results
3.1. Co-Infection of Respiratory Pathogens with SARS-CoV-2
A total of 1,111 SARS-CoV-2-positive nasopharyngeal swabs were included in the analysis. The demographic characteristics of the study participants are presented in Table 1. During the study period, several waves of SARS-CoV-2 each being associated with the emergence of a new variant of concern. Overall, it was observed that the incidence of co-infections was proportional to the number of samples analyzed (Figure 3).
The annual distribution of co-infections and respiratory pathogens detected during the study period is shown in Table 2 and Table 3. Among the 1,111 SARS-CoV-2-positive NPS samples, 51 samples (4.6%) were identified with at least one additional respiratory pathogen (Table 2). Briefly, 47 samples (4.1%) and 2 samples (0.2%) were identified with an additional one and two viruses other than SARS-CoV2, respectively. Two samples (0.2%) were identified to be co-infected with bacteria (Table 2).
The most frequently detected viruses were Rhinovirus/Enterovirus (n=28; 2.5%), and Adenovirus (n=8; 0.7%) (Table 3). Less frequently we observed co-infection with RSV (n=4; 0.4%), InfB (n=3; 0.3%), Human Metapneumovirus A/B (n=2; 0.2%), Coronavirus NL63 (n=2; 0.2%), Coronavirus OC43 (n=2; 0.2%) and Bocavirus (n=2; 0.2%) (Table 3). A co-infection with a bacterial pathogen was observed in two samples from year 2020 (L. pneumophila and B. pertussis), whereas co-infection with two additional viruses was observed in only two samples in year 2021 (Coronavirus NL63 and Rhinovirus/Enterovirus; Coronavirus OC43 and RSV) (Table 3). All samples were found to be negative for Coronavirus 229E, Coronavirus HKU1, Influenza A, Influenza A H1, Influenza A H1N1/pdm09, Influenza A H3, Parainfluenza virus 1, Parainfluenza virus 2, Parainfluenza virus 3, Parainfluenza virus 4 and Mycoplasma pneumoniae. The rate of males to females in the coinfection cases was 28:23, with males being 1.22 more likely to be infected with at least one additional respiratory pathogen (Odd ratio: 1.416; Lower 95% CI: 0.806; Higher 95% CI: 2.489). Nevertheless, this difference did not reach statistical significance (p>0.05), suggesting that both male and female are equally susceptible to co-infections with respiratory pathogens.
The age distribution of NPS analysed, as well as respiratory pathogens co-infection cases among the study subjects with coinfection can be seen in Figure 4. The highest proportion of co-infections was observed in the youngest age group <10 years, followed by the age group 30-39, with 52.9% and 15.7% of co-infections with a respiratory pathogen other than SARS-CoV-2, respectively, being detected in these age groups. The remaining co-infections detected in order of decreasing prevalence were age groups 10-19 (9.8%), 20-29 and 40-49 (both at 5.9%), >80 (3.9%), and 50-79 (2.0%).
3.2. Variation of Co-Infection with Age Group
Variation of co-infection with age group can be seen in Figure 5. Among the co-infections with single respiratory virus, Rhinovirus/Enterovirus (27.5%) and Adenovirus (13.7%) were mostly detected in the <10 age group, followed by RSV (3.9%), Bocavirus, InflB, HMPV A/B, and Coronavirus NL63 (all at 2%). Similarly, the rate of co-infection with Rhinovirus/Enterovirus was highest in age groups 10-19 (5.9%), 30-39 (7.8%), 40-49 (5.9%), 20-29 (2.0%), 50-59 (2.0%), 60-69 (2.0%), and >80 (2.0%). Co-infection with 2 respiratory viral pathogens other than SARS-CoV-2 was detected in one sample in the age group 30-39 (Coronavirus OC43 and RSV). Similarly, one sample in the age group 50-59 was found to be positive for Coronavirus NL63 and Rhinovirus/Enterovirus. B. pertussis was detected as the co-infected bacteria in one sample in those aged 20-29 (2.0%), whereas L. pneumophila was detected in one sample in the age group 70-79 (2.0%).
4. Discussion
The COVID-19 pandemic driven by SARS-CoV-2 has had a significant impact on global public health and economy. Undoubtably, this pandemic has tested the resilience of health services across the globe and further exposed the profound implications for health, economic progress, trust in governments, and social cohesions. The analysis presented here is a study of the rate of co-infections with respiratory pathogens in SARS-CoV-2-positive NPS samples in Cyprus. Successful completion of the project relied on the use of QIAstat-Dx® Respiratory SARS-CoV-2 Panel, reported for its robustness in detection of respiratory pathogens [15,16]. To the best of our knowledge, this work is the first of its kind in this population.
Based on systematic reviews and meta-analysis viral coinfection and bacterial coinfection in SARS-CoV-2 infected patients are reported at 3-10% and 7-8% worldwide, respectively [17,18,19]. In Cyprus, data on SARS-CoV-2 co-infections are currently unavailable. However, a limited number of studies from geographically proximate countries have reported SARS-CoV-2 co-infections. For example, a study by Garazzino et al. in Italy reported viral co-infections in 6% of SARS-CoV-2-positive patients [20], a rate comparable to that observed in our study (4.5%). Bacterial co-infections in our study were detected in 0.1% of cases, which falls within the range reported in similar studies. In Italy, for instance, bacterial co-infection rates have been reported to range from 0.5% to 3% [20,21,22], while in Turkey, no bacterial co-infections (0%) were observed [23], and in Egypt, the rate was reported at 14% [24].
Currently, it remains unclear whether co-infections with SARS-CoV-2 and other viruses are less common than bacterial co-infections, with some—but not all—studies supporting this trend. This discrepancy may be partly attributed to differences in experimental design and analytical approaches, particularly the inclusion criteria for ICU and non-ICU patients, as reported in most studies [17,18,19]. Furthermore, data on co-infections among outpatients remain scarce, highlighting a gap in our understanding of the full spectrum of SARS-CoV-2 co-infections [25,26].
Influenza viruses are well-documented respiratory pathogens frequently detected alongside SARS-CoV-2 in numerous studies globally, with similar symptoms shared between these viruses. Reported co-infection rates vary widely, ranging from 0.08% to 52% across different geographical locations for influenza A [27] [28] [29] [30], with influenza B co-infection rates ranging from 0% to 0.2% [31,32,33]. In our study, no samples were found to be positive for influenza A, whereas influenza B was detected in 0.3% of SARS-CoV-2 affected individuals. The reported incidence of co-infection with influenza A is slightly higher than influenza B among patients with positive diagnosis of SARS-CoV-2, possibly attributed to multiple factors including the intrinsic viral properties of influenza A, seasonal epidemiological patterns, and differences in immune responses due to prior exposures [34]. The absence of influenza A detection in our study remains unclear; however, it may be partially attributed to the low number of co-infected samples analyzed and the fact that the dataset was not exclusively composed of hospitalized patients, where co-infection rates are often higher [31,34].
Our study found that Rhinovirus/Enterovirus was the most prevalent virus, accounting for 2.5% of co-infections, followed by adenovirus (0.7%), and RSV (0.4%). Rhinoviruses and enteroviruses are significant pathogens humans and are the subject of intensive clinical and epidemiological research and public health measures [35]. Other similar studies have reported conflicting results with some but not all studies showing Rhinovirus/Enterovirus as the most prevalent virus in SARS-CoV-2 infected patients [27,36,37].
Previous studies have suggested that age is a key determinant in the likelihood of SARS-CoV-2 co-infections [38,39]. In line with these findings, our study observed the highest incidence of co-infections in the <10-year-old age group. Among these cases, Rhinovirus/Enterovirus was the most frequently detected co-infecting virus, accounting for 27.5% of cases, followed by adenovirus at 13.7% and RSV at 3.9%. Several factors may contribute to the increased incidence of co-infections in young children. Their distinct behavioural and social patterns, such as frequent close contact in day-care and kindergarten settings, create an environment conducive to viral transmission. Additionally, young children often have difficulty adhering to hygiene practices, such as wearing masks and regular handwashing, further increasing their risk of exposure to multiple pathogens. Moreover, their immature immune system compared to adults may render them more susceptible to simultaneous infections [40].
The prevalence of bacterial co-infections in SARS-CoV-2-positive individuals has been widely studied [9], with reported rates ranging from 0% to 100% across different studies [36,41]. In our study, bacterial co-infection was detected in 0.2% of SARS-CoV-2-positive samples, with Legionella pneumophila and Bordetella pertussis being the only identified bacterial pathogens. Currently, there is no consensus on the most commonly detected bacteria in SARS-CoV-2 co-infections. Reported bacterial co-pathogens vary across studies and include Mycoplasma species, Haemophilus influenzae, Pseudomonas aeruginosa, Bordetella spp, Staphylococcus aureus, and methicillin-resistant Staphylococcus aureus (MRSA) [9,42,43,44]. These discrepancies may be attributed to differences in study design, including variations in diagnostic methodologies, sample selection criteria, and patient populations analyzed [45]. Standardized approaches are needed to better characterize the prevalence and clinical significance of bacterial co-infections in SARS-CoV-2 cases.
The results presented in this study should be interpreted in light of its limitations. Firstly, sample collection was based on specimens submitted to the Molecular Virology Department for diagnostic purposes, without access to the medical history or clinical status of the participants. As a result, direct comparisons with other studies should be made with caution, as most investigations on viral and bacterial co-infections in SARS-CoV-2-positive individuals have been conducted in hospitalized patients [10]. Notably, only a limited number of studies have examined co-infections in outpatient settings [25,26]. Secondly, the number of SARS-CoV-2-positive samples analyzed for co-infections represented only 2% of the total available SARS-CoV-2-positive samples. This limitation was primarily due to financial constraints that could not be overcome. A larger sample size would have provided a more comprehensive understanding of co-infection patterns among SARS-CoV-2-infected individuals. Lastly, the absence of medical records for the referred patients restricted further analysis of potential associations between co-infections and clinical symptoms. Additionally, the lack of information regarding participants’ influenza vaccination status represents another limitation. Recent studies have shown that influenza vaccination can reduce the risk of influenza disease by 40–60% in the general population [46,47], highlighting its potential impact on co-infection rates. Such data could have been particularly valuable in interpreting the absence of influenza A detection in our cohort. A further possible explanation for the absence of influenza A detection could be the nature of the sampled population, which consisted of non-hospitalized individuals. Additionally, public health measures implemented to curb SARS-CoV-2 transmission—such as social distancing, mask mandates, and travel restrictions—may have significantly reduced influenza incidence and impact during the COVID-19 pandemic, as previously reported [48]. Indeed, Cyprus is one of the least impacted countries by the COVID-19 pandemic, as response measures were taken up early on during the pandemic.
5. Conclusions
This study provides previously unavailable data on viral and bacterial co-infections in SARS-CoV-2-infected individuals in Cyprus. Such studies are essential, as co-infections—particularly in outpatients—may facilitate the transmission of respiratory pathogens to various population groups, including vulnerable individuals such as children and the elderly. Continuous surveillance of respiratory pathogens is therefore critical, as co-infections pose a significant challenge to healthcare systems worldwide, impacting both disease management and public health strategies.
Author Contributions
CC and JR led the conceptualization of the study and the development of the research question, with support from GK. GK conducted the data analysis, performed the statistical assessments, and drafted the manuscript. CT was responsible for carrying out all laboratory experiments. SB contributed to data analysis, manuscript review, and editing. All authors participated in the interpretation and discussion of the results, critically revised the manuscript, and approved the final version for submission. The corresponding author had the final responsibility for the decision to submit the manuscript for publication.
Funding
This research was funded by internal grants provided by The Cyprus Institute of Neurology and Genetics for COVID-19 research.
Institutional Review Board Statement
This study was exempted from ethical approval by the Cyprus National Bioethics Committee (Reference no: ΕΕΒΚ/21.1.02.01.05).
Informed Consent Statement
Patient consent was waived by the Cyprus National Bioethics Committee (Reference no: ΕΕΒΚ/21.1.02.01.05). According to the approval, as samples were fully anonymized, the Bioethics committee waived the requirement of informed consent form. All the data utilized for the present study were generated following diagnostic SARS-CoV-2 tests using NPS that were referred to the Department of Molecular Virology of The Cyprus Institute of Neurology and Genetics.
Data Availability Statement
The original contributions presented in this study are included in the article. Further inquiries can be directed to the corresponding author.
Acknowledgments
We extend our sincere gratitude to the entire COVID-19 team for their tireless efforts in analysing referred samples for SARS-CoV-2 as part of the screening program conducted by the Ministry of Health in Cyprus.
Conflicts of Interest
The authors declare no conflicts of interest.
Abbreviations
The following abbreviations are used in this manuscript:
| NPS | Nasopharengeal swab |
| RhV | Rhinovirus |
| EnV | Enterovirus |
| HMPV A/B | Human metapneumovirus A/B |
| CoV | Coronavirus |
| BocV | Bocavirus |
| LP | Legionella pneumophilia |
| BP | Bordetella pertussis |
| ICU | Intensive care unit |
References
- Wang, Y.; Wang, Y.; Chen, Y.; Qin, Q. Unique Epidemiological and Clinical Features of the Emerging 2019 Novel Coronavirus Pneumonia (COVID-19) Implicate Special Control Measures. J Med Virol 2020, 92. [Google Scholar] [CrossRef]
- Çelik, I.; Öztürk, R. From Asymptomatic to Critical Illness: Decoding Various Clinical Stages of COVID-19. Turk J Med Sci 2021, 51. [Google Scholar] [CrossRef] [PubMed]
- Taheri, F.; Vesal, S.; Goudarzi, P.; Sahafnejad, Z.; Khoshbayan, A. The Co-Infection of SARS-CoV-2 with Atypical Bacterial Respiratory Infections: A Mini Review. Vacunas 2023. [Google Scholar]
- Havasi, A.; Visan, S.; Cainap, C.; Cainap, S.S.; Mihaila, A.A.; Pop, L.A. Influenza A, Influenza B, and SARS-CoV-2 Similarities and Differences – A Focus on Diagnosis. Front Microbiol 2022, 13. [Google Scholar] [CrossRef] [PubMed]
- Stowe, J.; Tessier, E.; Zhao, H.; Guy, R.; Muller-Pebody, B.; Zambon, M.; Andrews, N.; Ramsay, M.; Lopez Bernal, J. Interactions between SARS-CoV-2 and Influenza, and the Impact of Coinfection on Disease Severity: A Test-Negative Design. Int J Epidemiol 2021, 50. [Google Scholar] [CrossRef]
- Huang, B.R.; Lin, Y.L.; Wan, C.K.; Wu, J.T.; Hsu, C.Y.; Chiu, M.H.; Huang, C.H. Co-Infection of Influenza B Virus and SARS-CoV-2: A Case Report from Taiwan. Journal of Microbiology, Immunology and Infection 2021, 54. [Google Scholar] [CrossRef]
- Yue, H.; Zhang, M.; Xing, L.; Wang, K.; Rao, X.; Liu, H.; Tian, J.; Zhou, P.; Deng, Y.; Shang, J. The Epidemiology and Clinical Characteristics of Co-Infection of SARS-CoV-2 and Influenza Viruses in Patients during COVID-19 Outbreak. J Med Virol 2020, 92. [Google Scholar] [CrossRef]
- Patton, M.J.; Orihuela, C.J.; Harrod, K.S.; Bhuiyan, M.A.N.; Dominic, P.; Kevil, C.G.; Fort, D.; Liu, V.X.; Farhat, M.; Koff, J.L.; et al. COVID-19 Bacteremic Co-Infection Is a Major Risk Factor for Mortality, ICU Admission, and Mechanical Ventilation. Crit Care 2023, 27. [Google Scholar] [CrossRef]
- Soltani, S.; Faramarzi, S.; Zandi, M.; Shahbahrami, R.; Jafarpour, A.; Akhavan Rezayat, S.; Pakzad, I.; Abdi, F.; Malekifar, P.; Pakzad, R. Bacterial Coinfection among Coronavirus Disease 2019 Patient Groups: An Updated Systematic Review and Meta-Analysis. New Microbes New Infect 2021, 43. [Google Scholar] [CrossRef]
- Musuuza, J.S.; Watson, L.; Parmasad, V.; Putman-Buehler, N.; Christensen, L.; Safdar, N. Prevalence and Outcomes of Co-Infection and Superinfection with SARS-CoV-2 and Other Pathogens: A Systematic Review and Metaanalysis. PLoS One 2021, 16. [Google Scholar] [CrossRef]
- Richter, J.; Fanis, P.; Tryfonos, C.; Koptides, D.; Krashias, G.; Bashiardes, S.; Hadjisavvas, A.; Loizidou, M.; Oulas, A.; Alexandrou, D.; et al. Molecular Epidemiology of SARS-CoV-2 in Cyprus. PLoS One 2021, 16. [Google Scholar] [CrossRef] [PubMed]
- Richter, J.; Koptides, D.; Tryfonos, C.; Alexandrou, D.; Christodoulou, C. Introduction, Spread and Impact of the SARS-CoV-2 Omicron Variants BA.1 and BA.2 in Cyprus. Microorganisms 2022, 10. [Google Scholar] [CrossRef]
- Lebourgeois, S.; Storto, A.; Gout, B.; Le Hingrat, Q.; Ardila Tjader, G.; Cerdan, M. del C.; English, A.; Pareja, J.; Love, J.; Houhou-Fidouh, N.; et al. Performance Evaluation of the QIAstat-Dx® Respiratory SARS-CoV-2 Panel. International Journal of Infectious Diseases 2021, 107. [Google Scholar] [CrossRef] [PubMed]
- Ishikane, M.; Unoki-Kubota, H.; Moriya, A.; Kutsuna, S.; Ando, H.; Kaburagi, Y.; Suzuki, T.; Iwamoto, N.; Kimura, M.; Ohmagari, N. Evaluation of the QIAstat-Dx Respiratory SARS-CoV-2 Panel, a Rapid Multiplex PCR Method for the Diagnosis of COVID-19. Journal of Infection and Chemotherapy 2022, 28. [Google Scholar] [CrossRef] [PubMed]
- Caza, M.; Hayman, J.; Jassem, A.; Wilmer, A. Evaluation of the QIAstat-Dx Respiratory SARS-CoV-2 Panel for Detection of Pathogens in Nasopharyngeal and Lower Respiratory Tract Specimens. Diagn Microbiol Infect Dis 2024, 110, 116368. [Google Scholar] [CrossRef]
- Lebourgeois, S.; Storto, A.; Gout, B.; Le Hingrat, Q.; Ardila Tjader, G.; Cerdan, M.D.C.; English, A.; Pareja, J.; Love, J.; Houhou-Fidouh, N.; et al. Performance Evaluation of the QIAstat-Dx® Respiratory SARS-CoV-2 Panel. Int J Infect Dis 2021, 107, 179–181. [Google Scholar] [CrossRef]
- Lansbury, L.; Lim, B.; Baskaran, V.; Lim, W.S. Co-Infections in People with COVID-19: A Systematic Review and Meta-Analysis. Journal of Infection 2020, 81. [Google Scholar] [CrossRef]
- Musuuza, J.S.; Watson, L.; Parmasad, V.; Putman-Buehler, N.; Christensen, L.; Safdar, N. Prevalence and Outcomes of Co-Infection and Superinfection with SARS-CoV-2 and Other Pathogens: A Systematic Review and Meta-Analysis. PLoS One 2021, 16, e0251170. [Google Scholar] [CrossRef]
- Rawson, T.M.; Moore, L.S.P.; Zhu, N.; Ranganathan, N.; Skolimowska, K.; Gilchrist, M.; Satta, G.; Cooke, G.; Holmes, A. Bacterial and Fungal Coinfection in Individuals with Coronavirus: A Rapid Review to Support COVID-19 Antimicrobial Prescribing. Clinical Infectious Diseases 2020, 71. [Google Scholar] [CrossRef]
- Garazzino, S.; Montagnani, C.; Donà, D.; Meini, A.; Felici, E.; Vergine, G.; Bernardi, S.; Giacchero, R.; Lo Vecchio, A.; Marchisio, P.; et al. Multicentre Italian Study of SARS-CoV-2 Infection in Children and Adolescents, Preliminary Data as at 10 April 2020. Euro Surveill 2020, 25. [Google Scholar] [CrossRef]
- Ripa, M.; Galli, L.; Poli, A.; Oltolini, C.; Spagnuolo, V.; Mastrangelo, A.; Muccini, C.; Monti, G.; De Luca, G.; Landoni, G.; et al. Secondary Infections in Patients Hospitalized with COVID-19: Incidence and Predictive Factors. Clin Microbiol Infect 2021, 27, 451–457. [Google Scholar] [CrossRef] [PubMed]
- Falcone, M.; Tiseo, G.; Giordano, C.; Leonildi, A.; Menichini, M.; Vecchione, A.; Pistello, M.; Guarracino, F.; Ghiadoni, L.; Forfori, F.; et al. Predictors of Hospital-Acquired Bacterial and Fungal Superinfections in COVID-19: A Prospective Observational Study. Journal of Antimicrobial Chemotherapy 2020, 76. [Google Scholar] [CrossRef]
- Ozaras, R.; Cirpin, R.; Duran, A.; Duman, H.; Arslan, O.; Bakcan, Y.; Kaya, M.; Mutlu, H.; Isayeva, L.; Kebanlı, F.; et al. Influenza and COVID-19 Coinfection: Report of Six Cases and Review of the Literature. J Med Virol 2020, 92, 2657–2665. [Google Scholar] [CrossRef] [PubMed]
- Ramadan, H.K.-A.; Mahmoud, M.A.; Aburahma, M.Z.; Elkhawaga, A.A.; El-Mokhtar, M.A.; Sayed, I.M.; Hosni, A.; Hassany, S.M.; Medhat, M.A. Predictors of Severity and Co-Infection Resistance Profile in COVID-19 Patients: First Report from Upper Egypt. Infect Drug Resist 2020, 13, 3409–3422. [Google Scholar] [CrossRef] [PubMed]
- Morales-Jadán, D.; Muslin, C.; Viteri-Dávila, C.; Coronel, B.; Castro-Rodríguez, B.; Vallejo-Janeta, A.P.; Henríquez-Trujillo, A.R.; Garcia-Bereguiain, M.A.; Rivera-Olivero, I.A. Coinfection of SARS-CoV-2 with Other Respiratory Pathogens in Outpatients from Ecuador. Front Public Health 2023, 11, 1264632. [Google Scholar] [CrossRef]
- Wu, Z.; McGoogan, J.M. Characteristics of and Important Lessons From the Coronavirus Disease 2019 (COVID-19) Outbreak in China: Summary of a Report of 72 314 Cases From the Chinese Center for Disease Control and Prevention. JAMA 2020, 323, 1239–1242. [Google Scholar] [CrossRef]
- Kim, D.; Quinn, J.; Pinsky, B.; Shah, N.H.; Brown, I. Rates of Co-Infection between SARS-CoV-2 and Other Respiratory Pathogens. JAMA - Journal of the American Medical Association 2020, 323. [Google Scholar] [CrossRef]
- Swets, M.C.; Russell, C.D.; Harrison, E.M.; Docherty, A.B.; Lone, N.; Girvan, M.; Hardwick, H.E.; Visser, L.G.; Openshaw, P.J.M.; Groeneveld, G.H.; et al. SARS-CoV-2 Co-Infection with Influenza Viruses, Respiratory Syncytial Virus, or Adenoviruses. The Lancet 2022, 399. [Google Scholar] [CrossRef]
- Miatech, J.L.; Tarte, N.N.; Katragadda, S.; Polman, J.; Robichaux, S.B. A Case Series of Coinfection with SARS-CoV-2 and Influenza Virus in Louisiana. Respir Med Case Rep 2020, 31. [Google Scholar] [CrossRef]
- Zhou, X.; Ding, G.; Shu, T.; Fu, S.; Tong, W.; Tu, X.; Li, S.; Wu, D.; Qiu, Y.; Yu, J.; et al. The Outbreak of Coronavirus Disease 2019 Interfered with Influenza in Wuhan. SSRN Electronic Journal 2020. [Google Scholar] [CrossRef]
- Dadashi, M.; Khaleghnejad, S.; Abedi Elkhichi, P.; Goudarzi, M.; Goudarzi, H.; Taghavi, A.; Vaezjalali, M.; Hajikhani, B. COVID-19 and Influenza Co-Infection: A Systematic Review and Meta-Analysis. Front Med (Lausanne) 2021, 8. [Google Scholar] [CrossRef] [PubMed]
- Yan, X.; Li, K.; Lei, Z.; Luo, J.; Wang, Q.; Wei, S. Prevalence and Associated Outcomes of Coinfection between SARS-CoV-2 and Influenza: A Systematic Review and Meta-Analysis. International Journal of Infectious Diseases 2023, 136. [Google Scholar] [CrossRef] [PubMed]
- Dao, T.L.; Hoang, V.T.; Colson, P.; Million, M.; Gautret, P. Co-Infection of SARS-CoV-2 and Influenza Viruses: A Systematic Review and Meta-Analysis. Journal of Clinical Virology Plus 2021, 1. [Google Scholar] [CrossRef]
- Golpour, M.; Jalali, H.; Alizadeh-Navaei, R.; Talarposhti, M.R.; Mousavi, T.; Ghara, A.A.N. Co-Infection of SARS-CoV-2 and Influenza A/B among Patients with COVID-19: A Systematic Review and Meta-Analysis. BMC Infect Dis 2025, 25, 145. [Google Scholar] [CrossRef] [PubMed]
- Simmonds, P.; Gorbalenya, A.E.; Harvala, H.; Hovi, T.; Knowles, N.J.; Lindberg, A.M.; Oberste, M.S.; Palmenberg, A.C.; Reuter, G.; Skern, T.; et al. Recommendations for the Nomenclature of Enteroviruses and Rhinoviruses. Arch Virol 2020, 165. [Google Scholar] [CrossRef]
- Hazra, A.; Collison, M.; Pisano, J.; Kumar, M.; Oehler, C.; Ridgway, J.P. Coinfections with SARS-CoV-2 and Other Respiratory Pathogens. Infect Control Hosp Epidemiol 2020, 41. [Google Scholar] [CrossRef]
- Nowak, M.D.; Sordillo, E.M.; Gitman, M.R.; Paniz Mondolfi, A.E. Coinfection in SARS-CoV-2 Infected Patients: Where Are Influenza Virus and Rhinovirus/Enterovirus? J Med Virol 2020, 92. [Google Scholar] [CrossRef]
- Weidmann, M.D.; Green, D.A.; Berry, G.J.; Wu, F. Assessing Respiratory Viral Exclusion and Affinity Interactions through Co-Infection Incidence in a Pediatric Population during the 2022 Resurgence of Influenza and RSV. Front Cell Infect Microbiol 2023, 13. [Google Scholar] [CrossRef]
- Arimura, K.; Kikuchi, K.; Sato, Y.; Miura, H.; Sato, A.; Katsura, H.; Kondo, M.; Itabashi, M.; Tagaya, E. SARS-CoV-2 Co-Detection with Other Respiratory Pathogens-Descriptive Epidemiological Study. Respir Investig 2024, 62, 884–888. [Google Scholar] [CrossRef]
- Krumbein, H.; Kümmel, L.S.; Fragkou, P.C.; Thölken, C.; Hünerbein, B.L.; Reiter, R.; Papathanasiou, K.A.; Renz, H.; Skevaki, C. Respiratory Viral Co-Infections in Patients with COVID-19 and Associated Outcomes: A Systematic Review and Meta-Analysis. Rev Med Virol 2023, 33. [Google Scholar] [CrossRef]
- Sharifipour, E.; Shams, S.; Esmkhani, M.; Khodadadi, J.; Fotouhi-Ardakani, R.; Koohpaei, A.; Doosti, Z.; Ej Golzari, S. Evaluation of Bacterial Co-Infections of the Respiratory Tract in COVID-19 Patients Admitted to ICU. BMC Infect Dis 2020, 20. [Google Scholar] [CrossRef]
- Langford, B.J.; So, M.; Raybardhan, S.; Leung, V.; Westwood, D.; MacFadden, D.R.; Soucy, J.P.R.; Daneman, N. Bacterial Co-Infection and Secondary Infection in Patients with COVID-19: A Living Rapid Review and Meta-Analysis. Clinical Microbiology and Infection 2020, 26. [Google Scholar] [CrossRef] [PubMed]
- Adeiza, S.S.; Shuaibu Bello, A.; Shuaibu, M.G. Random Effects Meta-Analysis of COVID-19/S. Aureus Partnership in Co-Infection. SSRN Electronic Journal 2020. [Google Scholar] [CrossRef]
- Khasawneh, A.I.; Himsawi, N.M.; Abu-Raideh, J.A.; Sammour, A.; Safieh, H.A.; Obeidat, A.; Azab, M.; Tarifi, A.A.; Al Khawaldeh, A.; Al-Momani, H.; et al. Prevalence of SARS-COV-2 and Other Respiratory Pathogens among a Jordanian Subpopulation during Delta-to-Omicron Transition: Winter 2021/2022. PLoS One 2023, 18. [Google Scholar] [CrossRef] [PubMed]
- Karaba, S.M.; Jones, G.; Helsel, T.; Smith, L.L.; Avery, R.; Dzintars, K.; Salinas, A.B.; Keller, S.C.; Townsend, J.L.; Klein, E.; et al. Prevalence of Co-Infection at the Time of Hospital Admission in COVID-19 Patients, A Multicenter Study. Open Forum Infect Dis 2021, 8. [Google Scholar] [CrossRef] [PubMed]
- Ferdinands, J.M.; Olsho, L.E.W.; Agan, A.A.; Bhat, N.; Sullivan, R.M.; Hall, M.; Mourani, P.M.; Thompson, M.; Randolph, A.G. Effectiveness of Influenza Vaccine against Life-Threatening RT-PCR-Confirmed Influenza Illness in US Children, 2010-2012. Journal of Infectious Diseases 2014, 210. [Google Scholar] [CrossRef]
- Antonelli Incalzi, R.; Consoli, A.; Lopalco, P.; Maggi, S.; Sesti, G.; Veronese, N.; Volpe, M. Influenza Vaccination for Elderly, Vulnerable and High-Risk Subjects: A Narrative Review and Expert Opinion. Intern Emerg Med 2024, 19. [Google Scholar] [CrossRef]
- Olsen, S.J.; Azziz-Baumgartner, E.; Budd, A.P.; Brammer, L.; Sullivan, S.; Pineda, R.F.; Cohen, C.; Fry, A.M. Decreased Influenza Activity During the COVID-19 Pandemic — United States, Australia, Chile, and South Africa, 2020. MMWR Morb Mortal Wkly Rep 2020, 69. [Google Scholar] [CrossRef]
Figure 1.
Study flow chart.
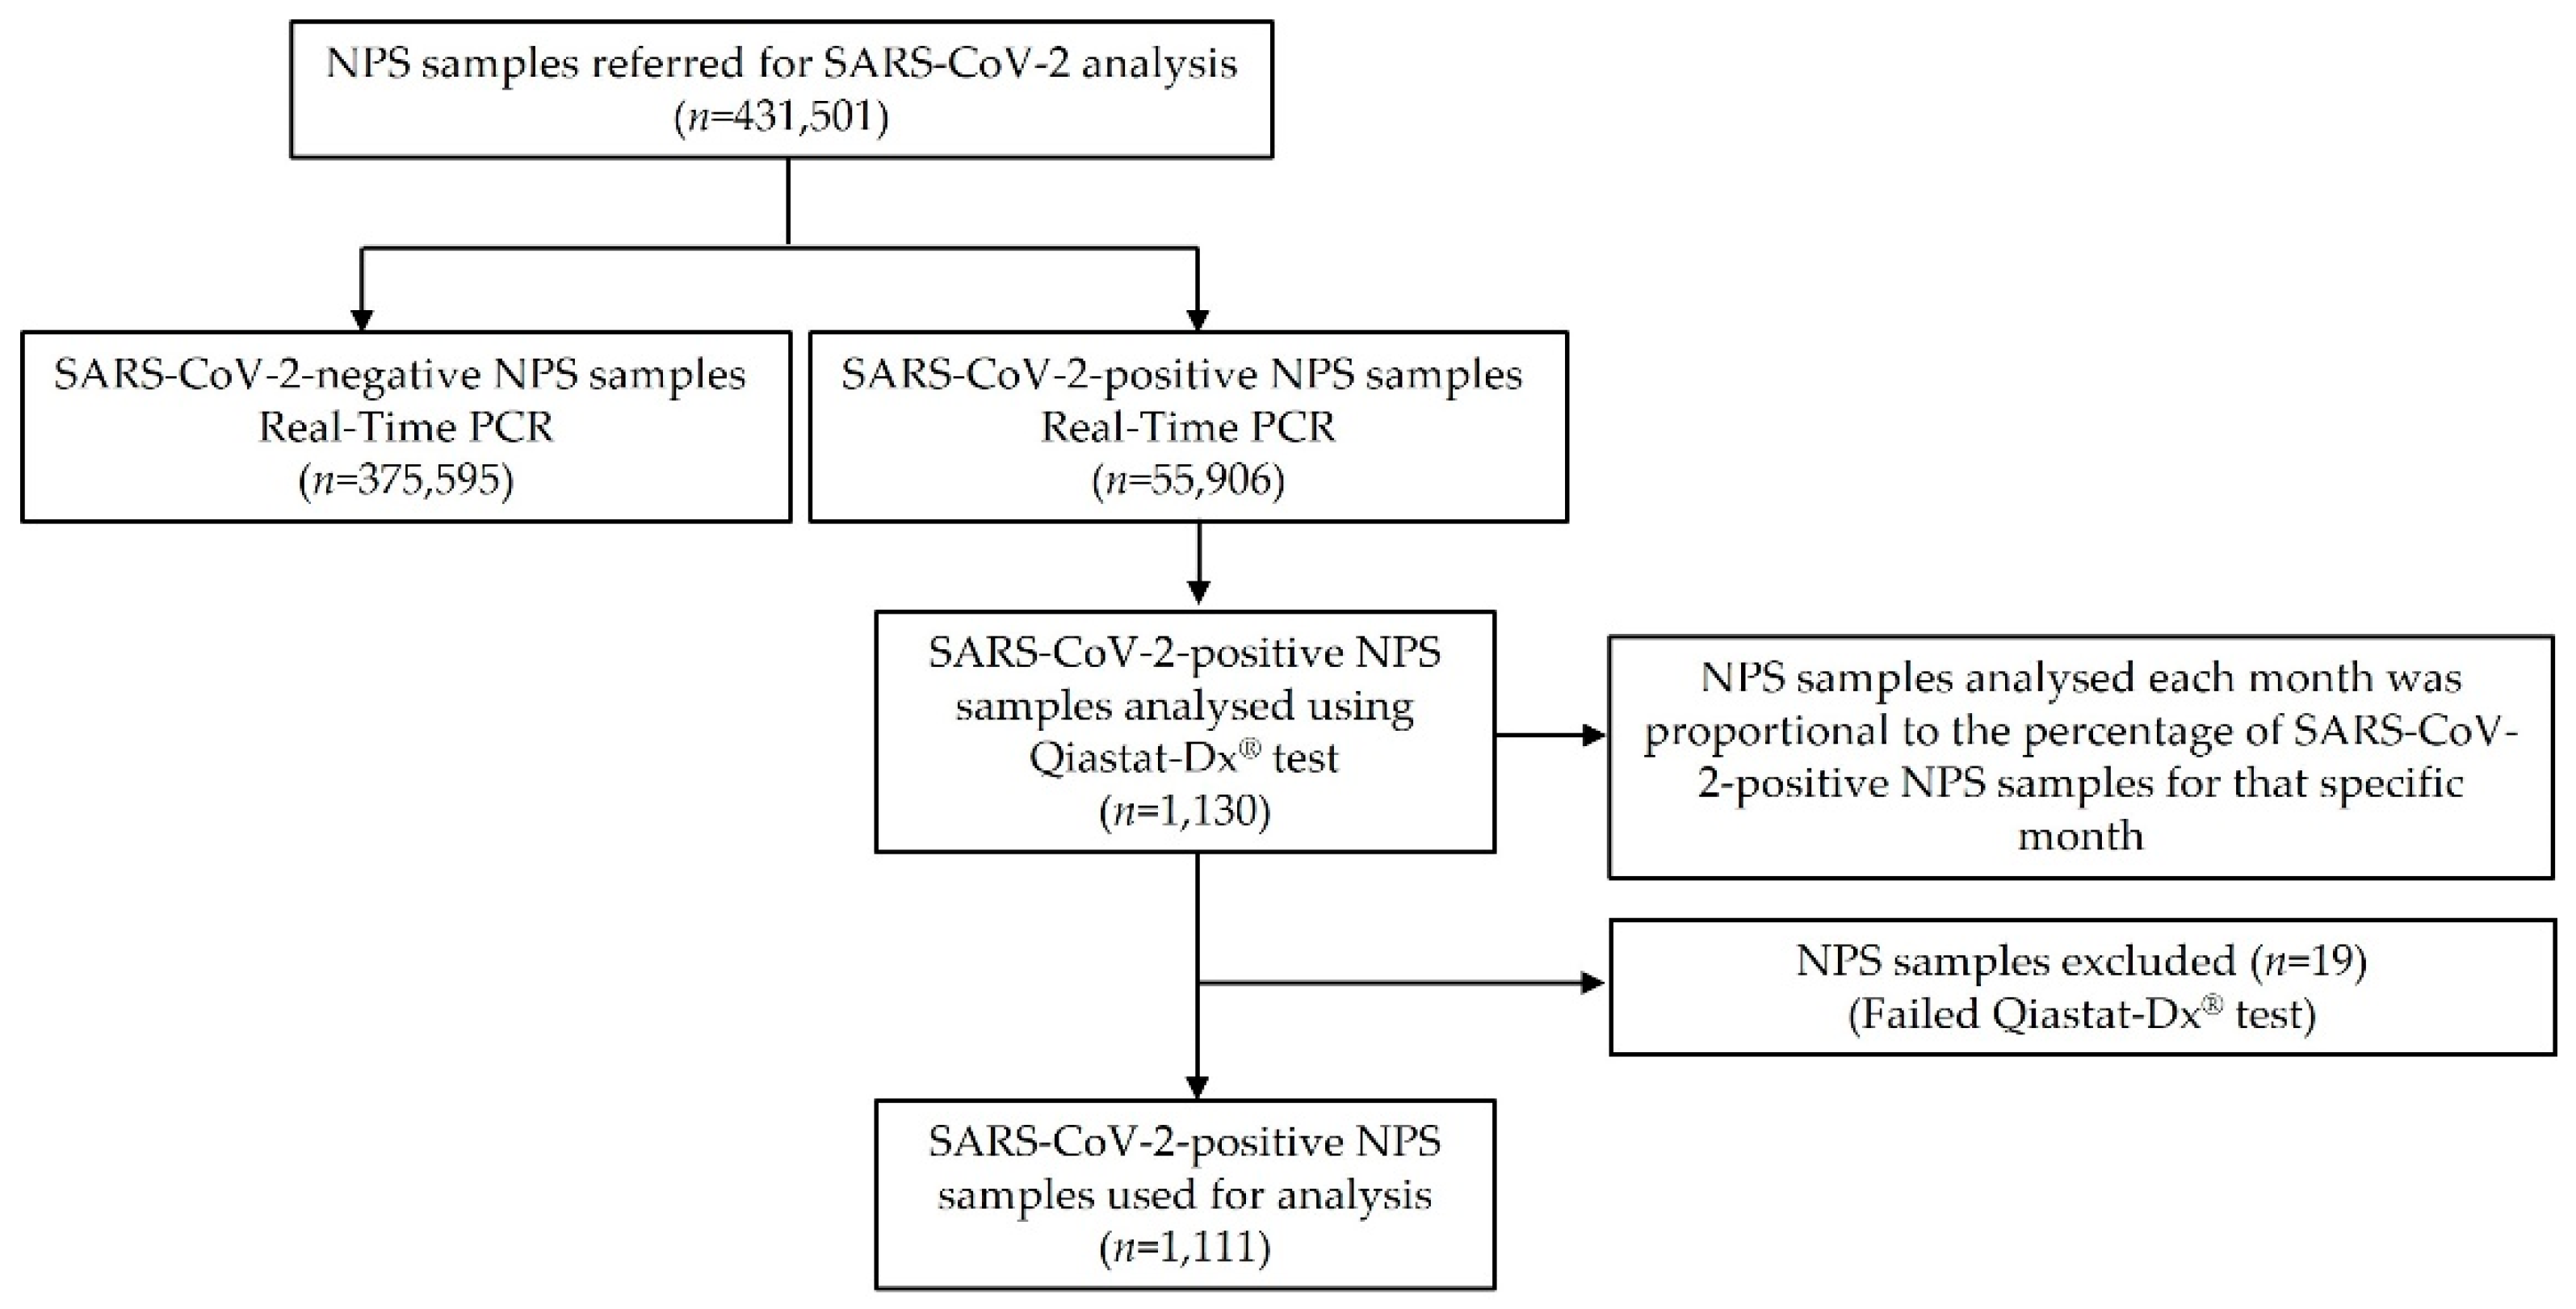
Figure 2.
Monthly number of NPS samples analysed for SARS-CoV-2 and number of SARS-CoV-2-positive NPS samples identified between March 2020 and May 2022.
Figure 2.
Monthly number of NPS samples analysed for SARS-CoV-2 and number of SARS-CoV-2-positive NPS samples identified between March 2020 and May 2022.
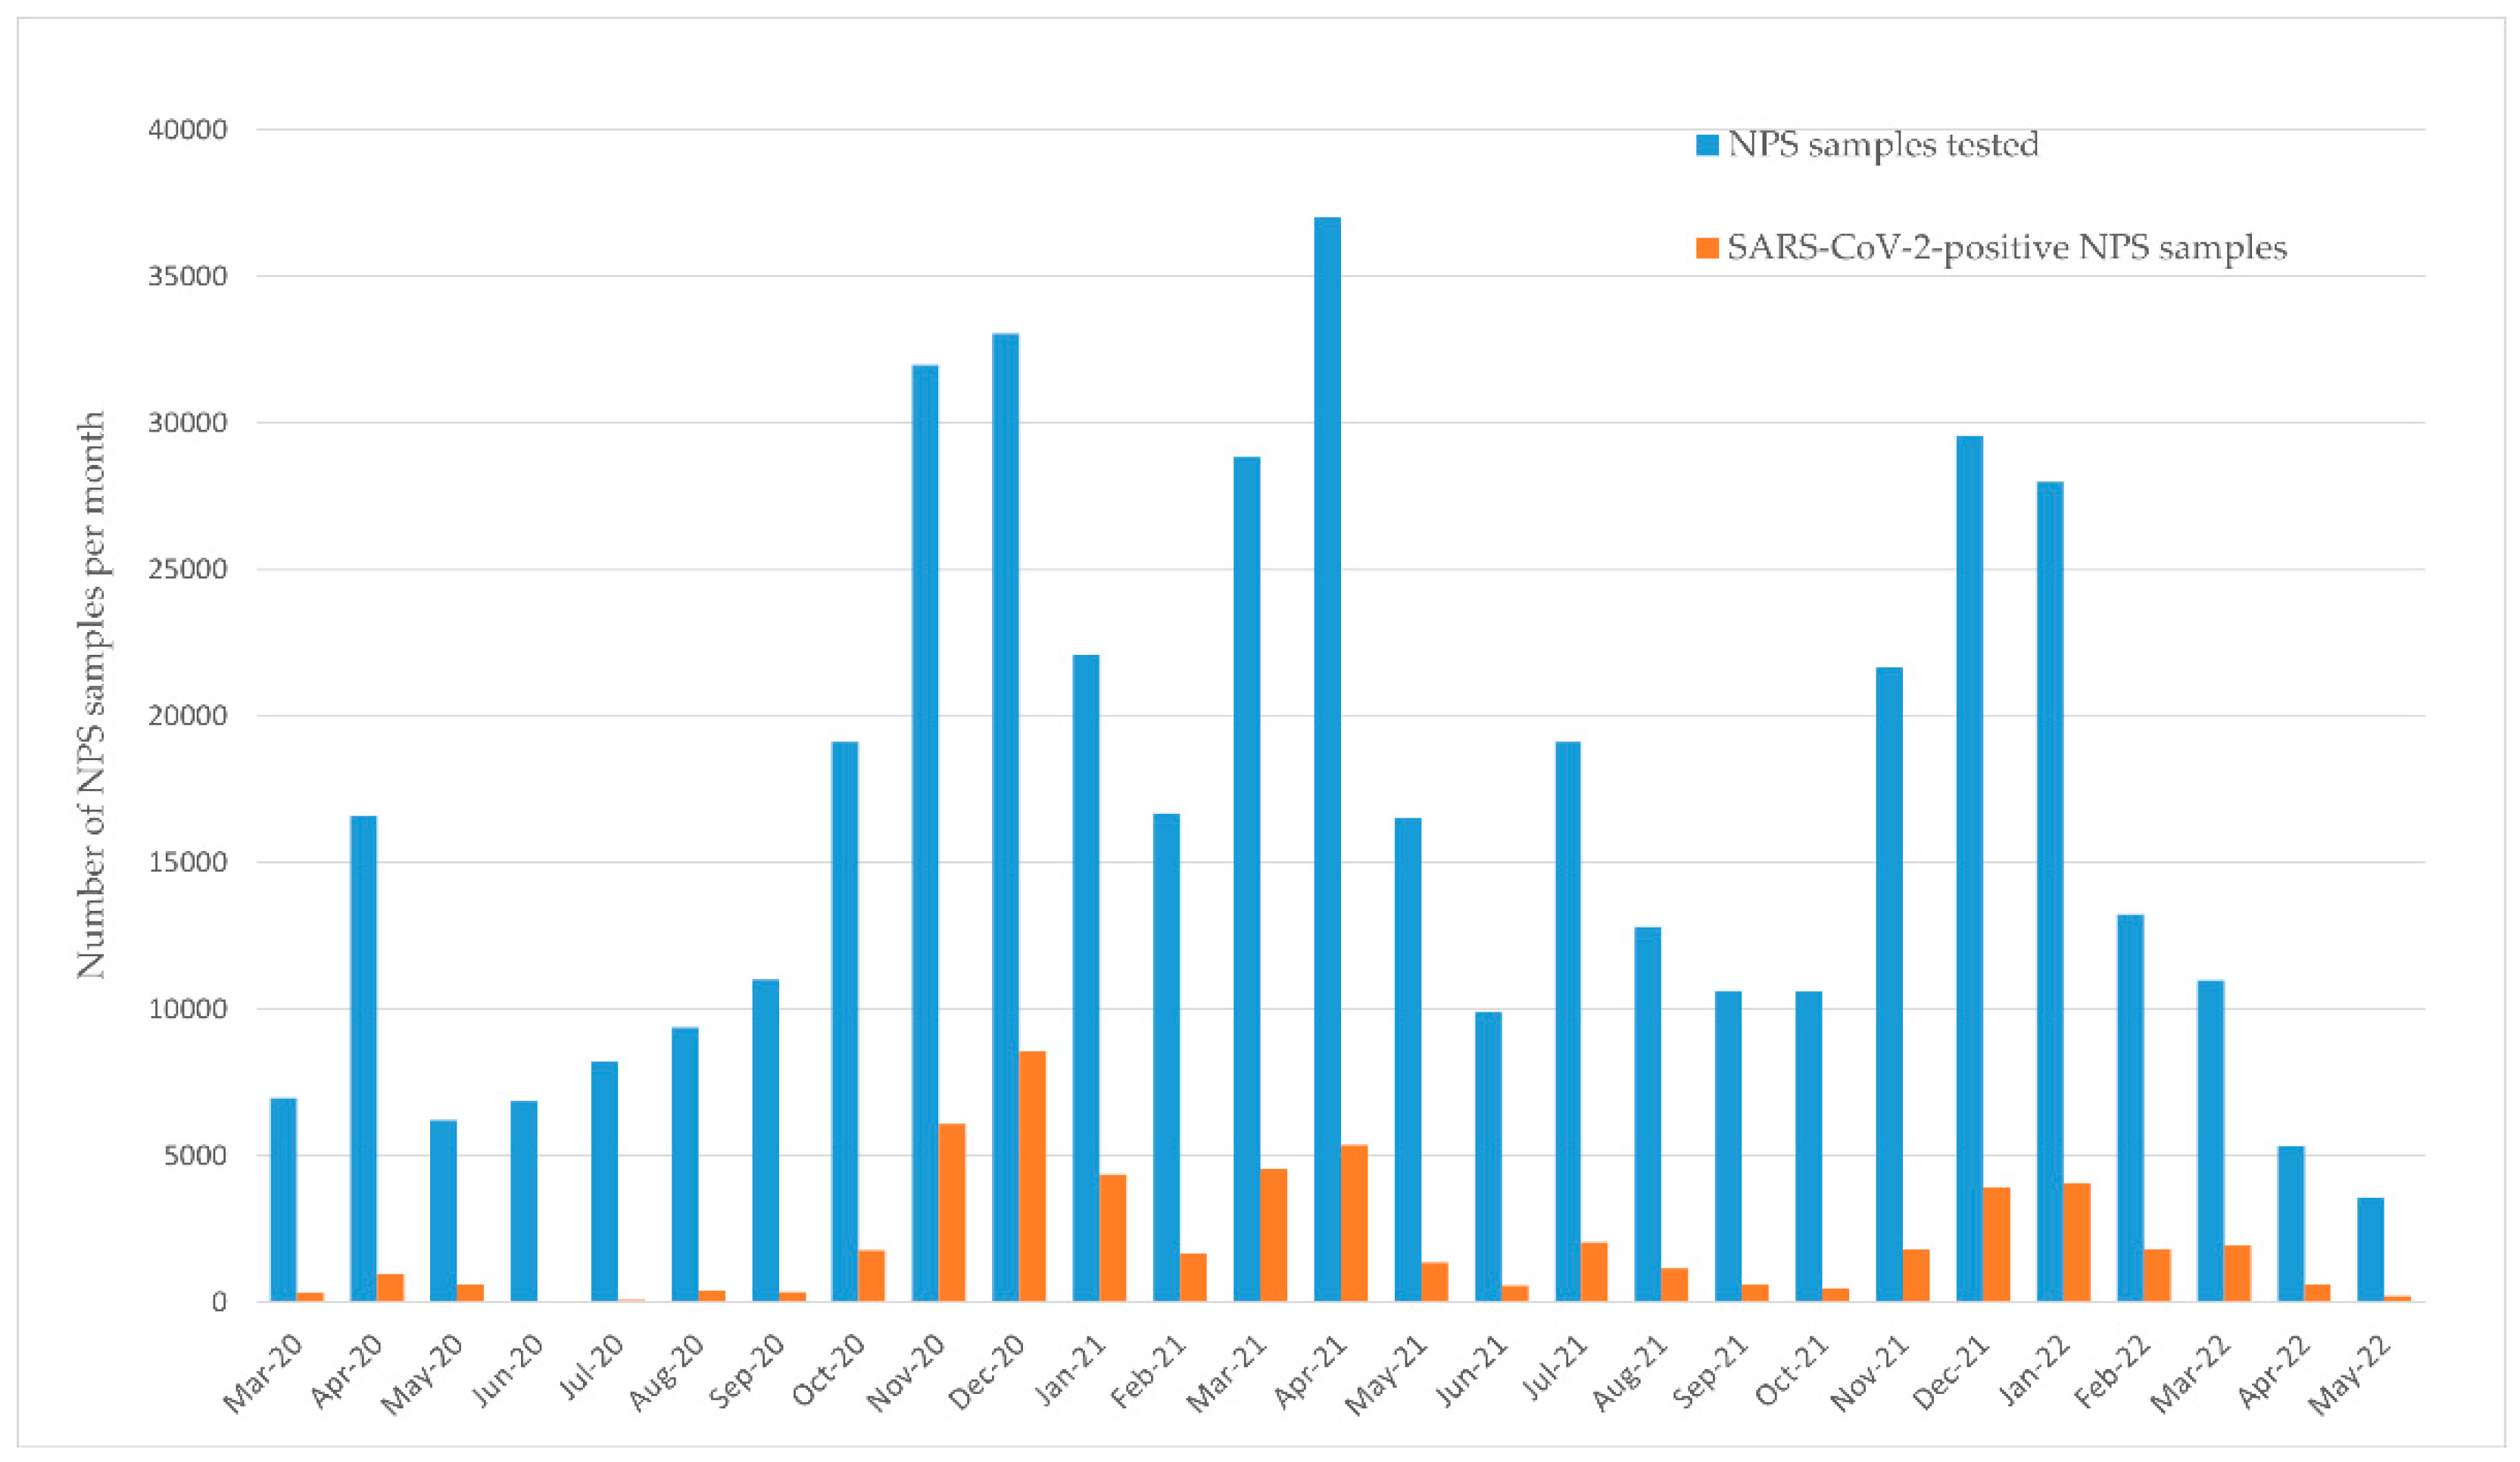
Figure 3.
Temporal distribution of NPS analyzed and co-infections with respiratory viruses and bacteria during the study period. NPS: nasopharengeal swab.
Figure 3.
Temporal distribution of NPS analyzed and co-infections with respiratory viruses and bacteria during the study period. NPS: nasopharengeal swab.
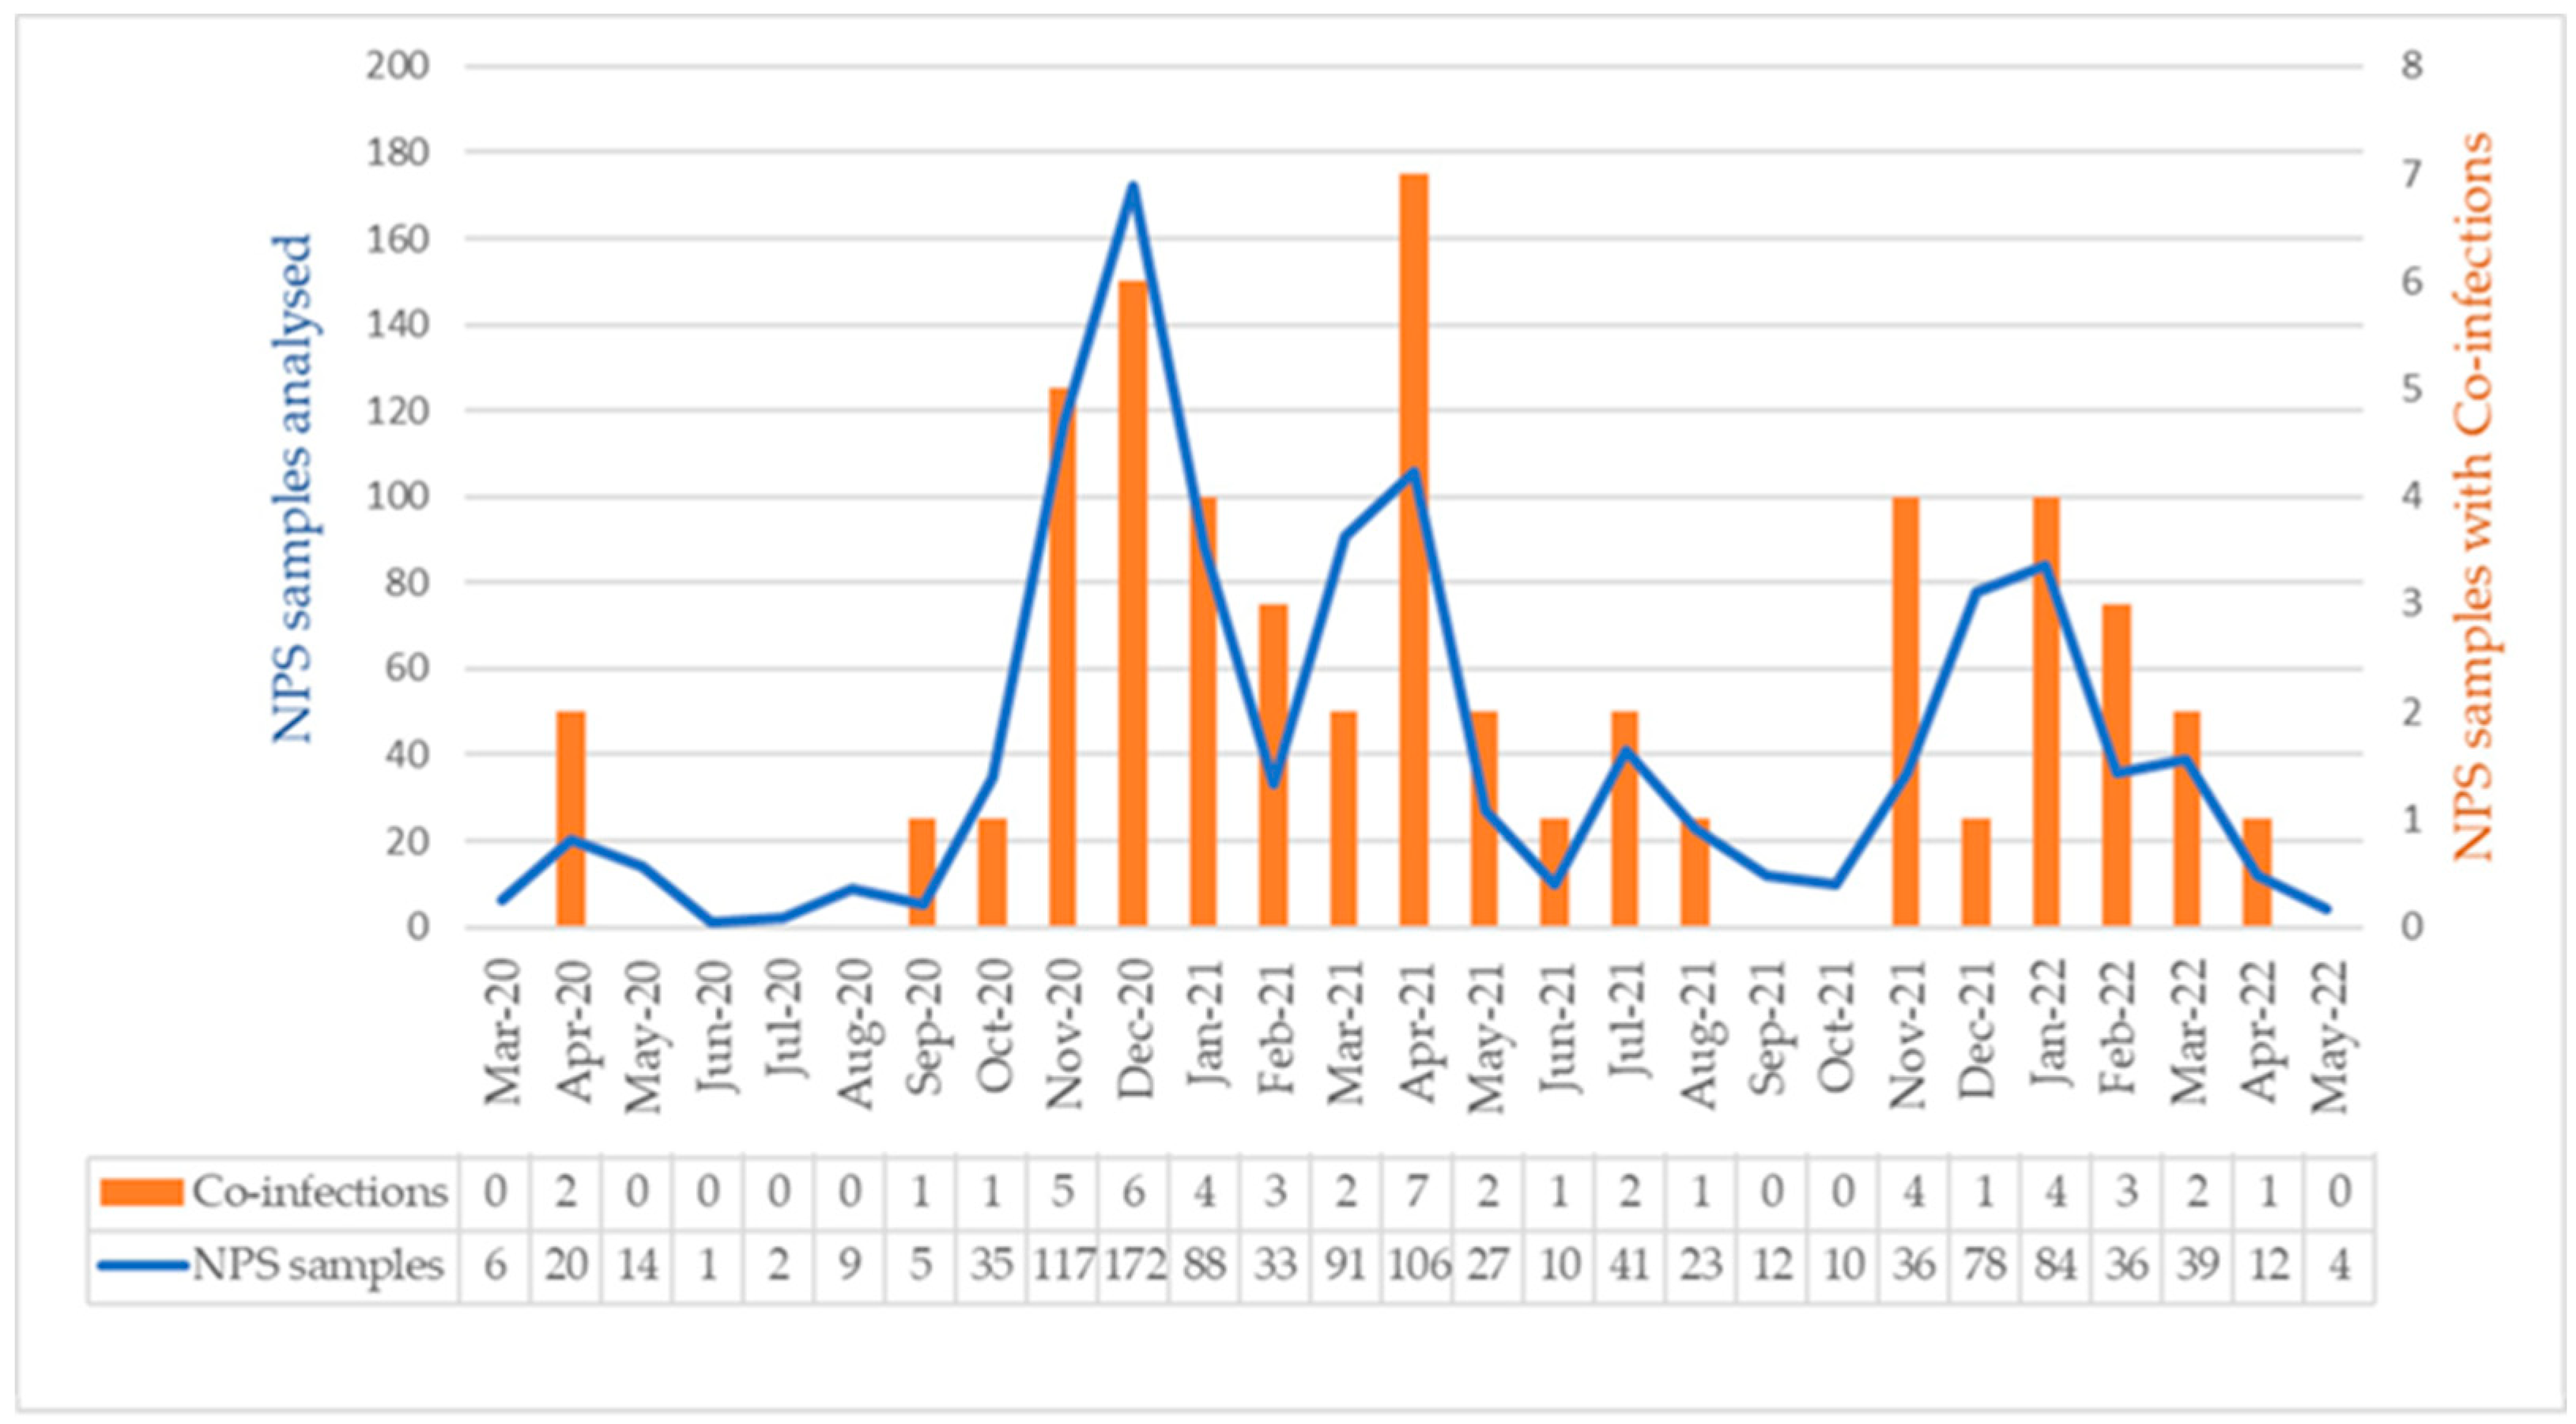
Figure 4.
The age distribution of NPS samples analysed (n=1,111) and rate of respiratory pathogens co-infection cases among the study subjects with co-infection (n=51).
Figure 4.
The age distribution of NPS samples analysed (n=1,111) and rate of respiratory pathogens co-infection cases among the study subjects with co-infection (n=51).
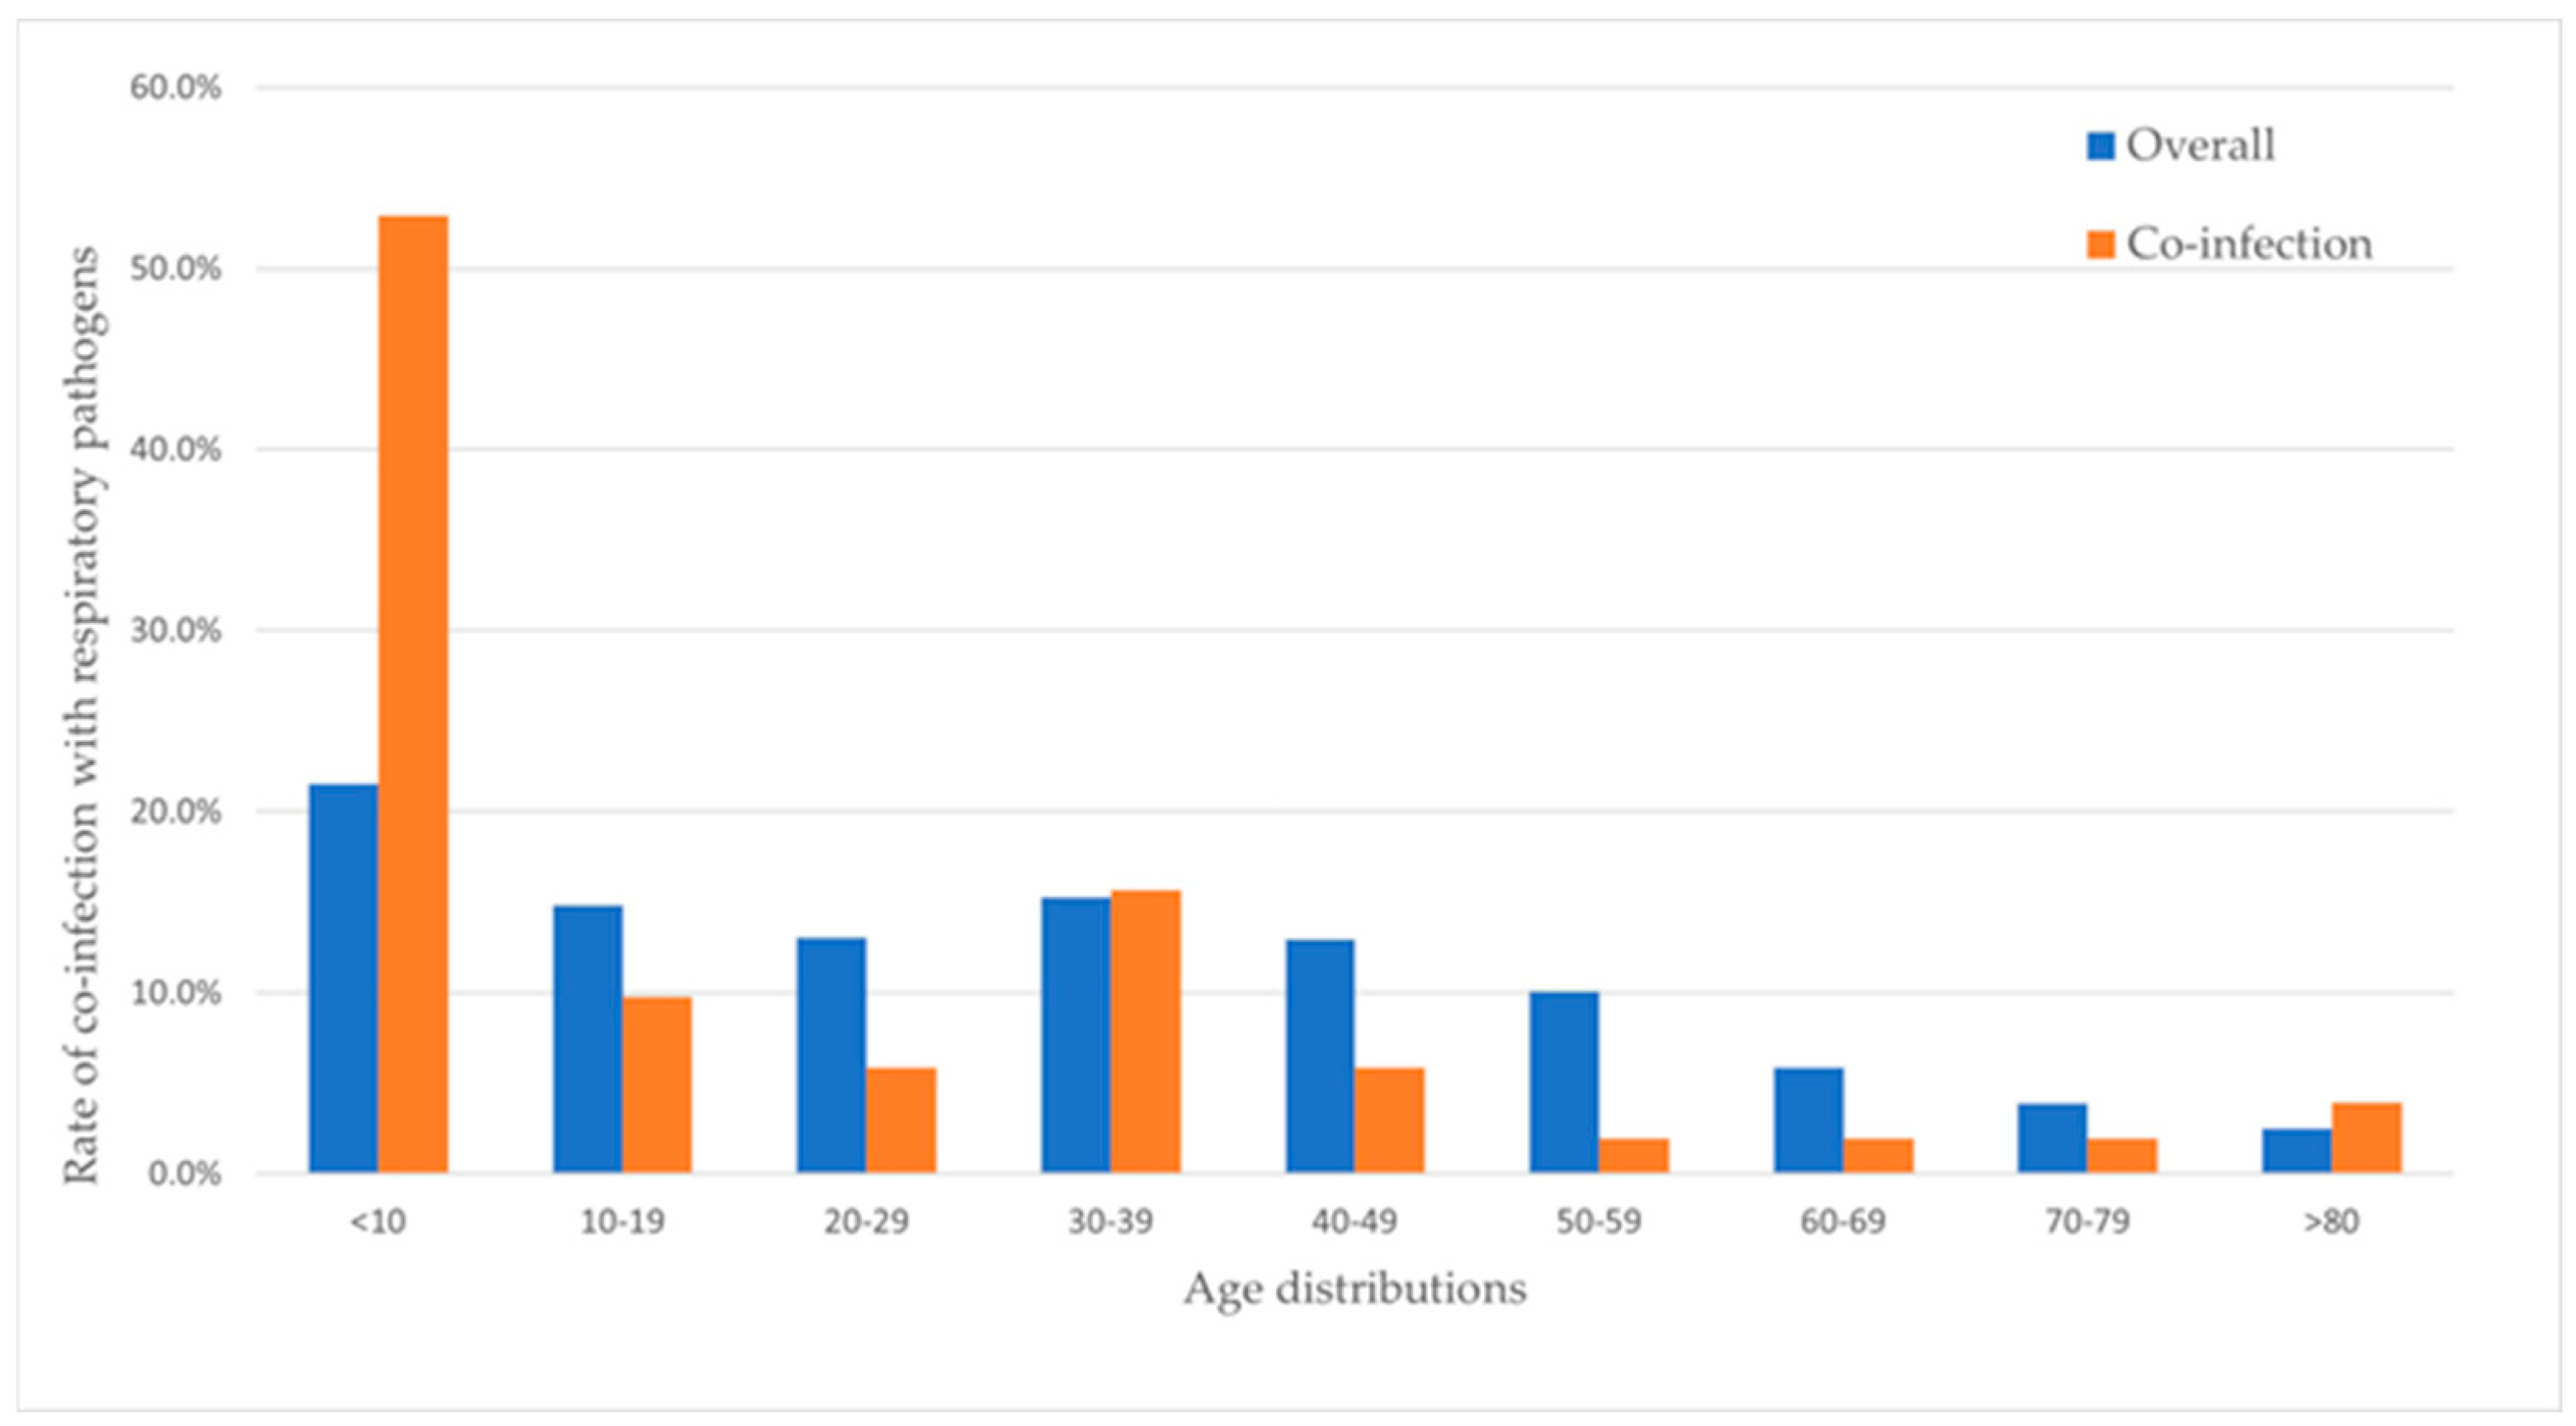
Figure 5.
The distribution of respiratory viruses and bacteria by age groups in NPS samples positive for SARS-CoV-2 and co-infections (n=51) among the study subjects.
Figure 5.
The distribution of respiratory viruses and bacteria by age groups in NPS samples positive for SARS-CoV-2 and co-infections (n=51) among the study subjects.
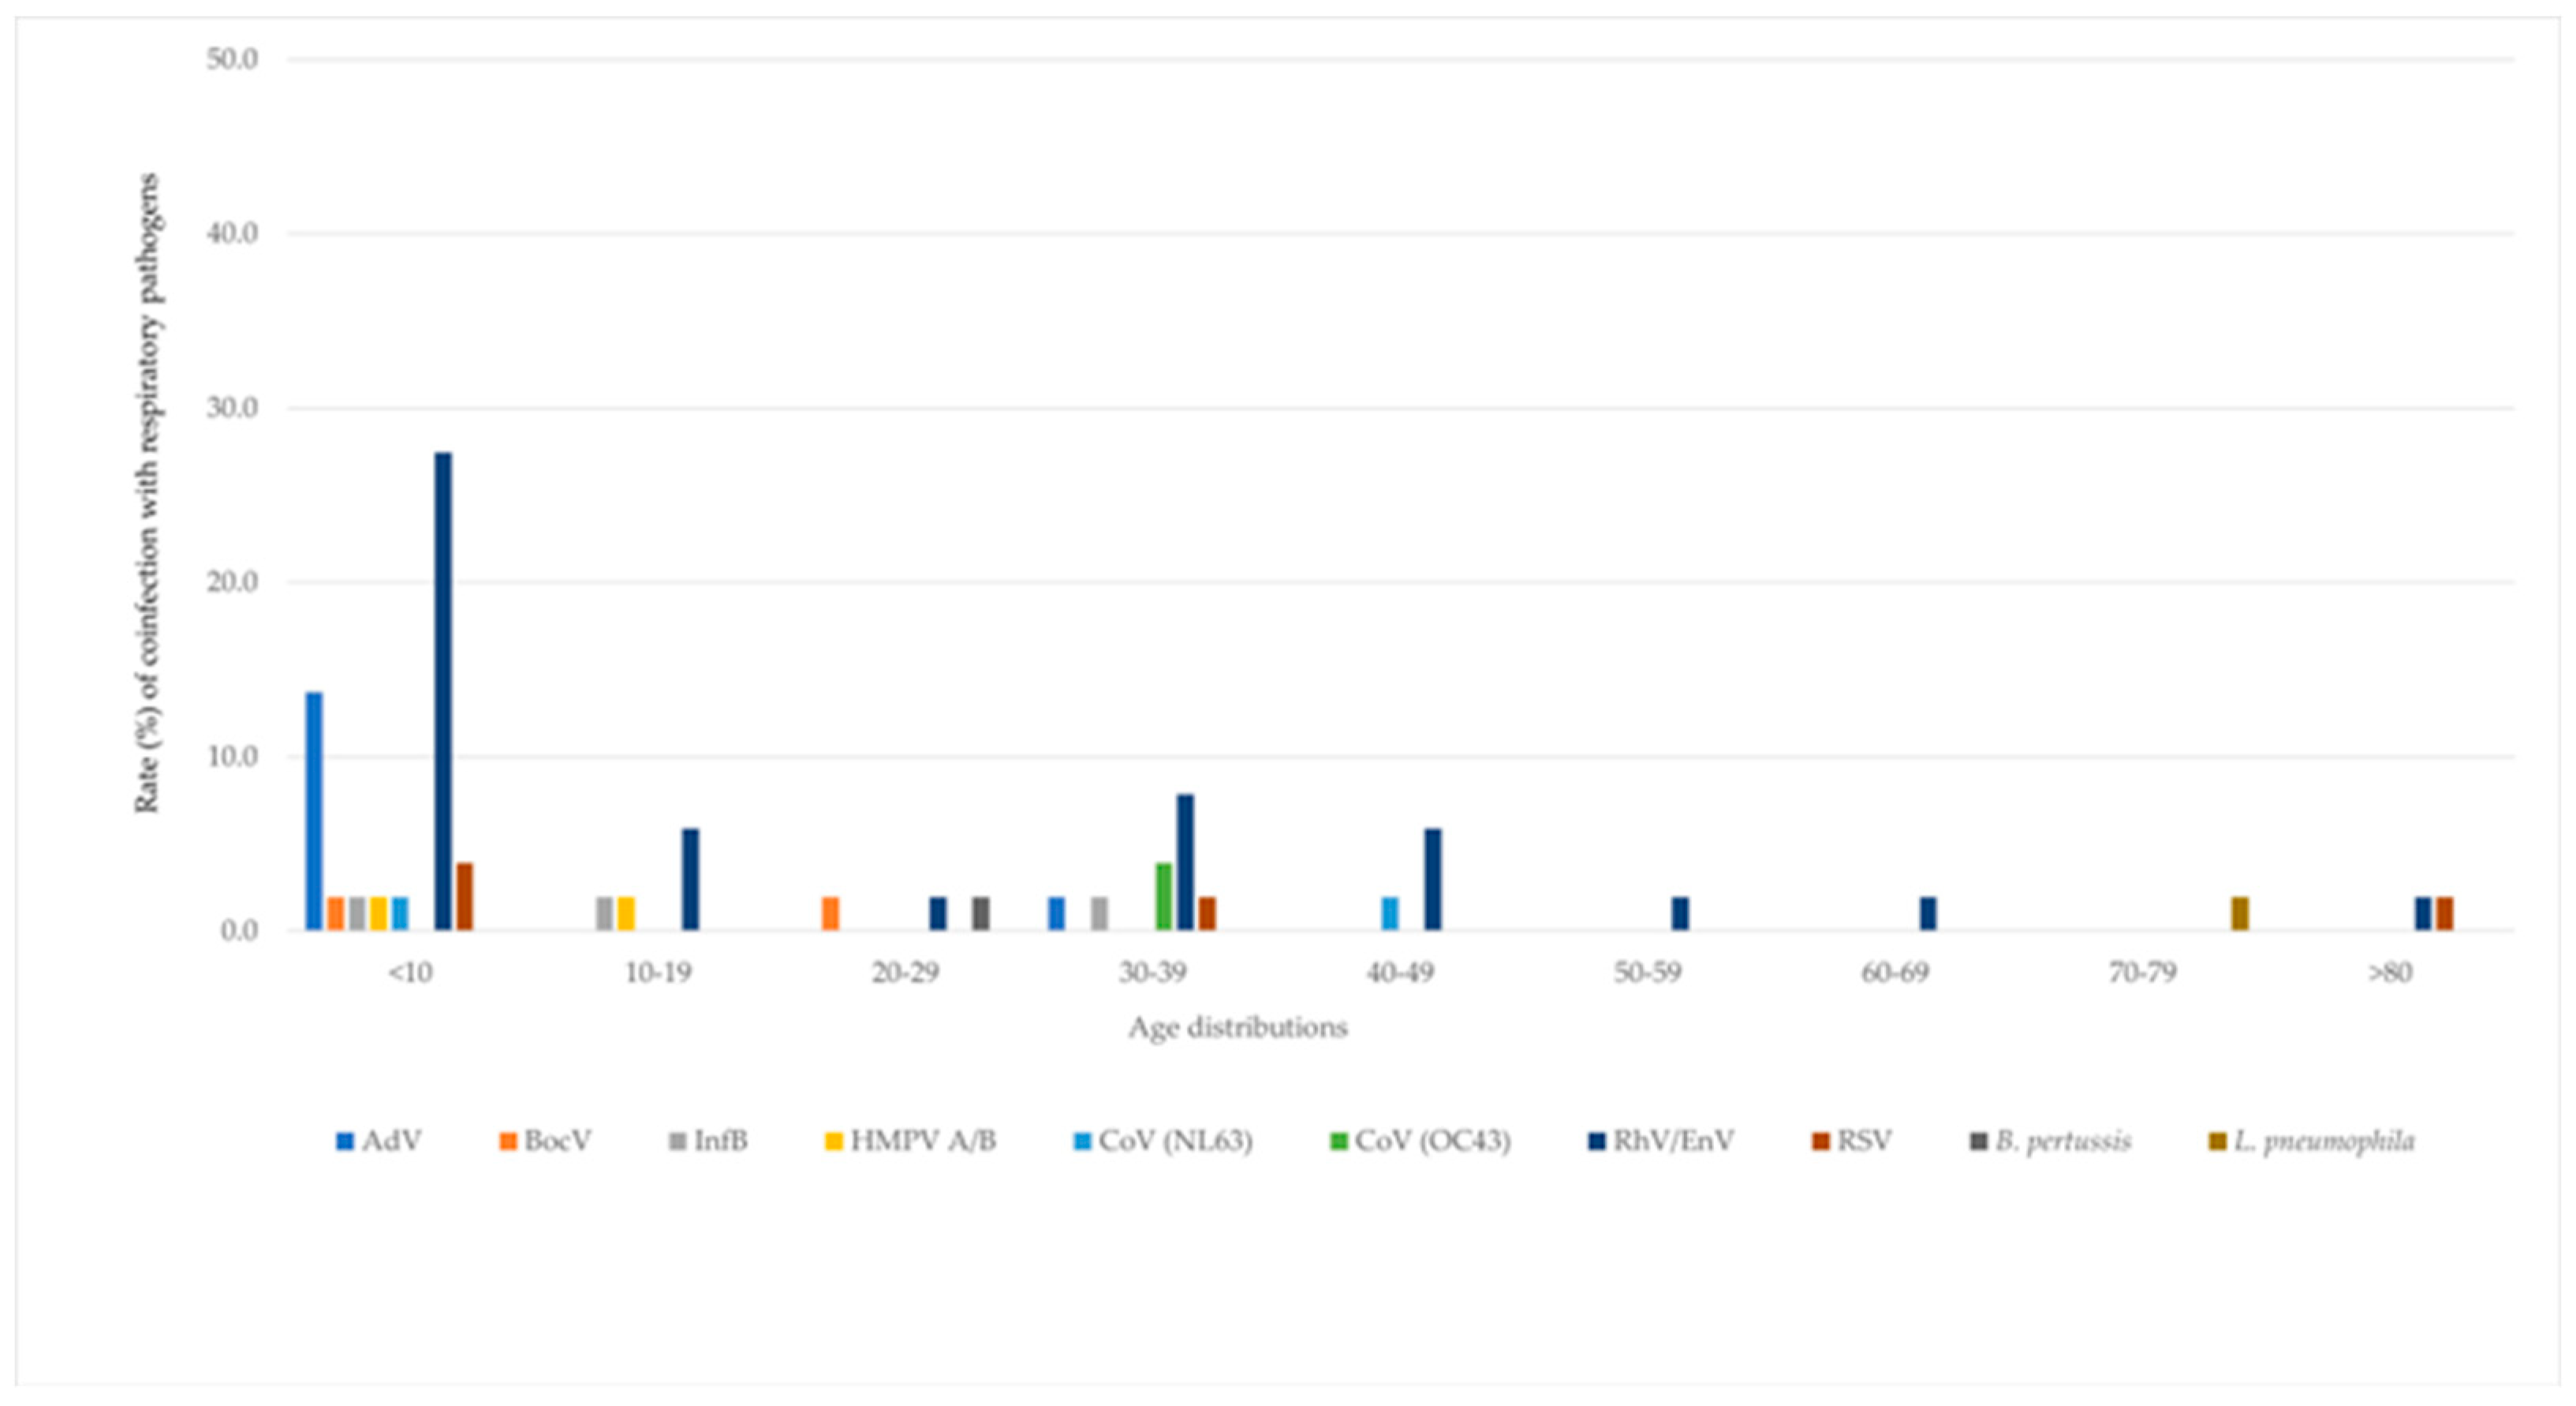

Table 1.
Demographic characteristics of study participants.
| Variable | n=1,111 | % |
|---|---|---|
| Gender | ||
| Male | 518 | 46.6 |
| Female | 593 | 53.4 |
| Age | ||
| <10 | 239 | 23.9 |
| 10-19 | 165 | 16.5 |
| 20-29 | 145 | 14.5 |
| 30-39 | 170 | 17.0 |
| 40-49 | 144 | 14.4 |
| 50-59 | 112 | 11.2 |
| 60-69 | 65 | 6.5 |
| 70-79 | 43 | 4.3 |
| >80 | 28 | 2.8 |
| Year | ||
| Mar 20-Dec 20 | 381 | 34.2 |
| Jan 21-Dec 21 | 555 | 50.0 |
| Jan 22-May 22 | 175 | 15.8 |
Table 2.
Frequency of co-infections with other respiratory pathogens in SARS-CoV-2-positive NPS samples during 2020-2022. NPS: nasopharengeal swabs.
Table 2.
Frequency of co-infections with other respiratory pathogens in SARS-CoV-2-positive NPS samples during 2020-2022. NPS: nasopharengeal swabs.
| Year | NPS n (%) |
NPS +ve for one other virus n (%) | NPS +ve for two other viruses n (%) | NPS +ve for bacteria n (%) |
|---|---|---|---|---|
| 2020 | 381 (34.3) | 12 (3.1) | 0 (0) | 2 (0.5) |
| 2021 | 555 (49.9) | 25 (4.5) | 2 (0.4) | 0 (0) |
| 2022 | 175 (15.8) | 10 (5.7) | 0 (0) | 0 (0) |
| Total | 1,111 | 47 (4.1) | 2 (0.2) | 2 (0.2) |
Table 3.
Frequency of co-infections with other viruses and bacteria in SARS-CoV-2-positive NPS samples during 2020-2022. RhV: rhinovirus; EnV: enterovirus; HMPV A/B: human metapneumovirus A/B; CoV: coronavirus; InfB:influenza B; BocV: bocavirus; LP: Legionella pneumophilia; BP: Bordetella pertussis.
| Year | RhV/EnV n (%) |
HMPV A/B n (%) |
AdV n %) |
CoV (NL63) n (%) |
CoV (OC43) n (%) |
InfB n (%) |
RSV n (%) |
BocV n (%) |
LP n (%) |
BP n (%) |
|---|---|---|---|---|---|---|---|---|---|---|
| 2020 | 9 (2.4) |
0 (0) |
2 (0.5) |
0 (0) |
0 (0) |
0 (0) |
1 (0.3) |
0 (0) |
1 (0.3) |
1 (0.3) |
| 2021 | 14 (2.5) |
0 (0) |
3 (0.5) |
2 (0.4) |
2 (0.4) |
3 (0.5) |
3 (0.5) |
2 (0.4) |
0 (0) |
0 (0) |
| 2022 | 5 (2.9) |
2 (1.1) |
3 (1.7) |
0 (0) |
0 (0) |
0 (0) |
0 (0) |
0 (0) |
0 (0) |
0 (0) |
| Total |
28 (2.5) |
2 (0.2) |
8 (0.7) |
2 (0.2) |
2 (0.2) |
3 (0.3) |
4 (0.4) |
2 (0.2) |
1 (0.1) |
1 (0.1) |
Disclaimer/Publisher’s Note: The statements, opinions and data contained in all publications are solely those of the individual author(s) and contributor(s) and not of MDPI and/or the editor(s). MDPI and/or the editor(s) disclaim responsibility for any injury to people or property resulting from any ideas, methods, instructions or products referred to in the content. |
© 2025 by the authors. Licensee MDPI, Basel, Switzerland. This article is an open access article distributed under the terms and conditions of the Creative Commons Attribution (CC BY) license (http://creativecommons.org/licenses/by/4.0/).
Copyright: This open access article is published under a Creative Commons CC BY 4.0 license, which permit the free download, distribution, and reuse, provided that the author and preprint are cited in any reuse.


